statistics south africa · statistics south africa ... there are factors that are cost drivers in...
TRANSCRIPT
Statistics South Africa Private Bag X44
Pretoria 0001 South Africa
ISIbalo House, 75 Koch street, Salvokop Pretoria 0002
User information services: (012) 310 8600 Fax: (012) 310 8500
Main switchboard: (012) 310 8911 Fax: (012) 321 7381
Website: www.statssa.gov.za Email: [email protected]
i
Editor’s comment
Temperatures across the country have begun to drop; this tells us that winter is here. As a result, many households and companies are starting to use electrical appliances to keep the cold away. This usually results in higher electricity bills. One of the ways in which consumers can cut high electricity costs is through house insulation. The process of house insulation involves sealing off areas where air leaks in such as ceilings, windows and doors (some place door tubes under the door). In winter, the outside temperature is often lower than the temperature inside the houses and since heat transfer takes place from inside to outside the house, the interior of the house ends up cold. Thus when windows and doors are completely shut, the warm air inside is prevented from leaking out and vice versa. Hopefully, this information will help you cut costs and keep warm this winter.
In this month’s issue of Mbalo Brief, our educational article is based on the Mining industry report, 2015 (Report No. 20-01-02). Some of the aspects that the article explores include income and expenditure in the mining sector as well as employment, salaries and wages.
Also included in this issue are our monthly articles such as Consumer price index (CPI), Retail trade sales, Mining: Production and sales and Food and beverages. There are no latest figures for Wholesale trade sales this month. Remember to try out our monthly crossword puzzle and have a look at the solutions for the April 2017 puzzle.
Articles published in this issue are based on results of industry surveys conducted for the months ranging from February to March 2017, which were published by Stats SA in April and May 2017.
For more details on any of the surveys, visit our website at: www.statssa.gov.za
iii
CONTENTS
Editor’s comment ........................................................................................... i Crossword puzzle ......................................................................................... iii Educational article on mining industry ………………………………………1 Primary industries ......................................................................................... 7
Mining: Production and sales ...................................................................... 7
Secondary industries .................................................................................... 8
Manufacturing: Production and sales .......................................................... 8
Selected building statistics of the private sector ......................................... 9
Electricity generated and available for distribution ...................................11
Tertiary industries .......................................................................................13
Retail trade sales ......................................................................................13
Motor trade sales ......................................................................................14
Food and beverages .................................................................................15
Tourist accommodation .............................................................................16
Tourism and migration ..............................................................................17
Statistics of civil cases for debt .................................................................21
Statistics of liquidations and insolvencies .................................................22
Land transport survey ...............................................................................24
Prices ............................................................................................................25
Producer price index (PPI) ........................................................................ 25
Consumer price index (CPI) ...................................................................... 27
Glossary… ................................................................................. 30
iv
Crossword puzzle
v
Across
3. According to the educationalarticle, which province recordedthe highest mining contribution in2015?
4. What is the name of the publicholiday occurring on the 1st of Mayin celebration of labourers and theworking class? ... Day. Fill in themissing word.
5. Who is the new Bafana Bafanacoach? Write surname only.
6. Which type of mining recorded thehighest income in 2015? Mining of... and lignite. Fill in the missingword.
7. Which article is based on the saleof goods directly to consumers fortheir own use rather than forresale?...trade sales. Fill in themissing word.
8. Which industry is this month'seducational article based on?
Down
1. What is the name of theinternational airport situated inKempton Park, Johannesburg?
2. Has the number of employees inthe mining sector increased ordecreased between 2012 and2015? Read the educationalarticle for clue.
Solutions for April 2017 Puzzle
Across Down
2. Shopping 1. Consumer price index6. Sifiso Buthelezi 3. Goals7. Sona 4. Sydney
5. April
1
Educational article on mining industry
1. Introduction
Since the discovery of Gold in 1886 on a Transvaal farm, Langlaagte, on the Witwatersrand, the South African economy took a turning point. A few years later diamond was discovered in the town of Kimberly and job seekers relocated nearer to the mines, businesses were established by entrepreneurs eager to capitalise on the opportunities presented to them. And in over 150 years, the mining industry has been the driving force behind the South African economy, contributing over 20% to the country’s Gross Domestic Product decades ago. Although the mining industry took a downward trend from its peak decades ago, from 21% contribution to GDP in 1970 to just 6% in 2011 it is currently contributing over 18% to the GDP. South Africa is one of the 10 gold producers in the world, sitting at number 7 and with China leading. Although gold, diamond, platinum and coal are the most well-known minerals amongst the minerals and metals mined, South Africa also produces chrome, vanadium, titanium and many other minerals.
This educational article will look into the findings of the Mining Industry report, 2015 (Report No. 20-01-02) published by Statistics South Africa (Stats SA) in March 2017. This report presents estimates in respect of the 2015 mining industry on areas such as income and expenditure, employment, salaries and wages and value added.
2. Mining income and expenditure
2.1 Mining income
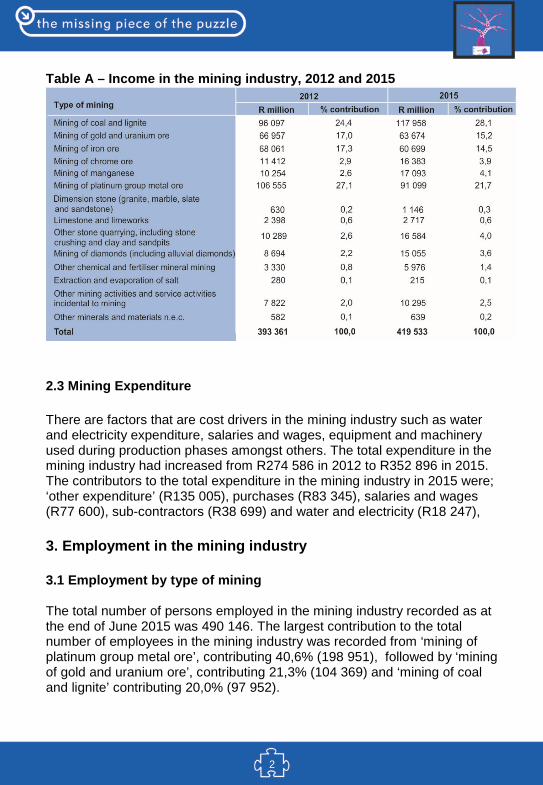
The total income for mining industry was R419,5 billion in 2015. This represents an increase of 2,2% per annum over the income of R393,4 billion reported in 2012. The exportation of minerals such as platinum, gold and coal amongst many others is one of the factors that contributed to the income generated in the mining industry and it contributed R272 030 to the total sales in 2015. Table A, indicates that in 2015 the largest contribution to the increase in mining industry was reported for ‘mining of coal and lignite’ contributing (28,1%), followed by ‘mining of platinum group metal ore’ (21,7%) and ‘mining of gold and uranium ore’ (15,2%).
2
Table A – Income in the mining industry, 2012 and 2015
2.3 Mining Expenditure
There are factors that are cost drivers in the mining industry such as water and electricity expenditure, salaries and wages, equipment and machinery used during production phases amongst others. The total expenditure in the mining industry had increased from R274 586 in 2012 to R352 896 in 2015. The contributors to the total expenditure in the mining industry in 2015 were; ‘other expenditure’ (R135 005), purchases (R83 345), salaries and wages (R77 600), sub-contractors (R38 699) and water and electricity (R18 247),
3. Employment in the mining industry
3.1 Employment by type of mining
The total number of persons employed in the mining industry recorded as at the end of June 2015 was 490 146. The largest contribution to the total number of employees in the mining industry was recorded from ‘mining of platinum group metal ore’, contributing 40,6% (198 951), followed by ‘mining of gold and uranium ore’, contributing 21,3% (104 369) and ‘mining of coal and lignite’ contributing 20,0% (97 952).
3
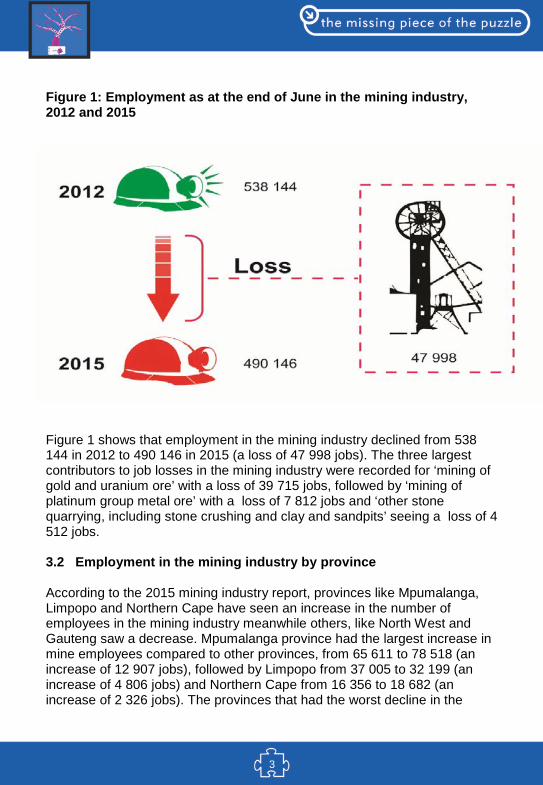
Figure 1: Employment as at the end of June in the mining industry, 2012 and 2015
Figure 1 shows that employment in the mining industry declined from 538 144 in 2012 to 490 146 in 2015 (a loss of 47 998 jobs). The three largest contributors to job losses in the mining industry were recorded for ‘mining of gold and uranium ore’ with a loss of 39 715 jobs, followed by ‘mining of platinum group metal ore’ with a loss of 7 812 jobs and ‘other stone quarrying, including stone crushing and clay and sandpits’ seeing a loss of 4 512 jobs.
3.2 Employment in the mining industry by province
According to the 2015 mining industry report, provinces like Mpumalanga, Limpopo and Northern Cape have seen an increase in the number of employees in the mining industry meanwhile others, like North West and Gauteng saw a decrease. Mpumalanga province had the largest increase in mine employees compared to other provinces, from 65 611 to 78 518 (an increase of 12 907 jobs), followed by Limpopo from 37 005 to 32 199 (an increase of 4 806 jobs) and Northern Cape from 16 356 to 18 682 (an increase of 2 326 jobs). The provinces that had the worst decline in the
4
number of mine employees were North West from 161 946 to 133 428 (a decrease of 28 518 jobs) and Gauteng from 69 735 to 53 764 (a decrease of 15 971 jobs).
4. Salaries and wages
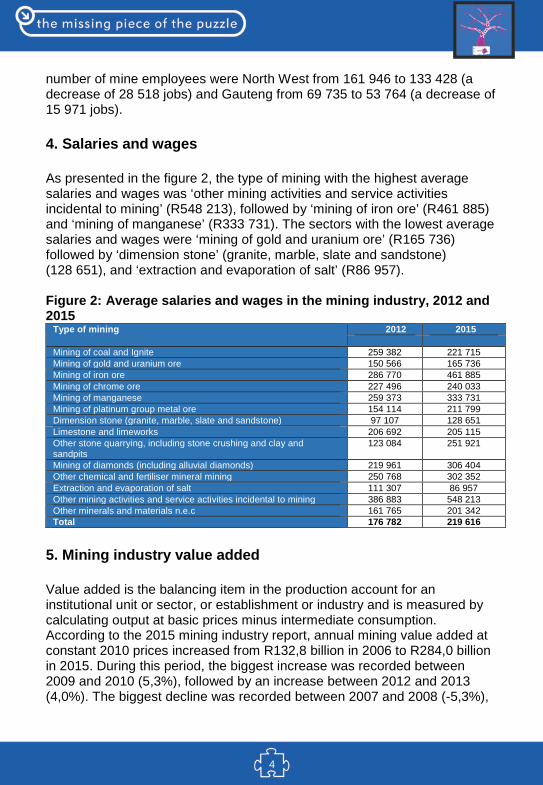
As presented in the figure 2, the type of mining with the highest average salaries and wages was ‘other mining activities and service activities incidental to mining’ (R548 213), followed by ‘mining of iron ore’ (R461 885) and ‘mining of manganese’ (R333 731). The sectors with the lowest average salaries and wages were ‘mining of gold and uranium ore’ (R165 736) followed by ‘dimension stone’ (granite, marble, slate and sandstone) (128 651), and ‘extraction and evaporation of salt’ (R86 957).
Figure 2: Average salaries and wages in the mining industry, 2012 and 2015
Type of mining 2012 2015
Mining of coal and Ignite 259 382 221 715 Mining of gold and uranium ore 150 566 165 736 Mining of iron ore 286 770 461 885 Mining of chrome ore 227 496 240 033 Mining of manganese 259 373 333 731 Mining of platinum group metal ore 154 114 211 799 Dimension stone (granite, marble, slate and sandstone) 97 107 128 651 Limestone and limeworks 206 692 205 115 Other stone quarrying, including stone crushing and clay and sandpits
123 084 251 921
Mining of diamonds (including alluvial diamonds) 219 961 306 404 Other chemical and fertiliser mineral mining 250 768 302 352 Extraction and evaporation of salt 111 307 86 957 Other mining activities and service activities incidental to mining 386 883 548 213 Other minerals and materials n.e.c 161 765 201 342 Total 176 782 219 616
5. Mining industry value added
Value added is the balancing item in the production account for an institutional unit or sector, or establishment or industry and is measured by calculating output at basic prices minus intermediate consumption. According to the 2015 mining industry report, annual mining value added at constant 2010 prices increased from R132,8 billion in 2006 to R284,0 billion in 2015. During this period, the biggest increase was recorded between 2009 and 2010 (5,3%), followed by an increase between 2012 and 2013 (4,0%). The biggest decline was recorded between 2007 and 2008 (-5,3%),
5
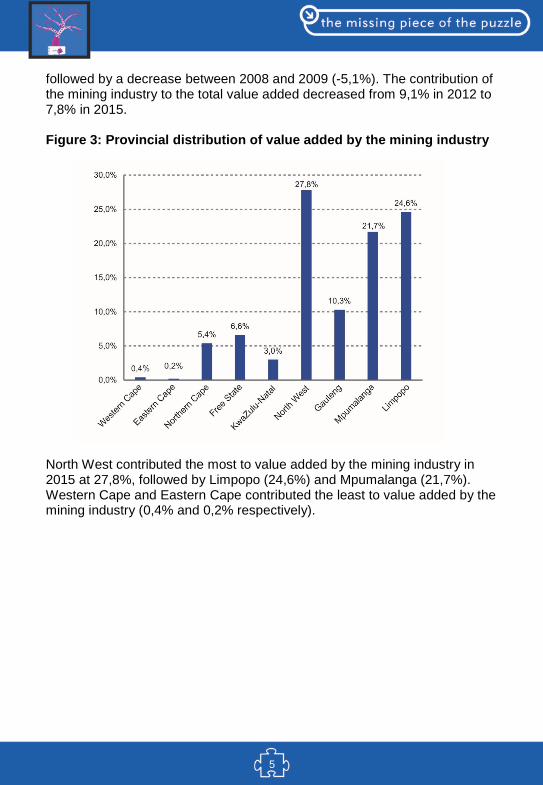
followed by a decrease between 2008 and 2009 (-5,1%). The contribution of the mining industry to the total value added decreased from 9,1% in 2012 to 7,8% in 2015. Figure 3: Provincial distribution of value added by the mining industry North West contributed the most to value added by the mining industry in 2015 at 27,8%, followed by Limpopo (24,6%) and Mpumalanga (21,7%). Western Cape and Eastern Cape contributed the least to value added by the mining industry (0,4% and 0,2% respectively).
6
5.2 Mining contribution to value added by province
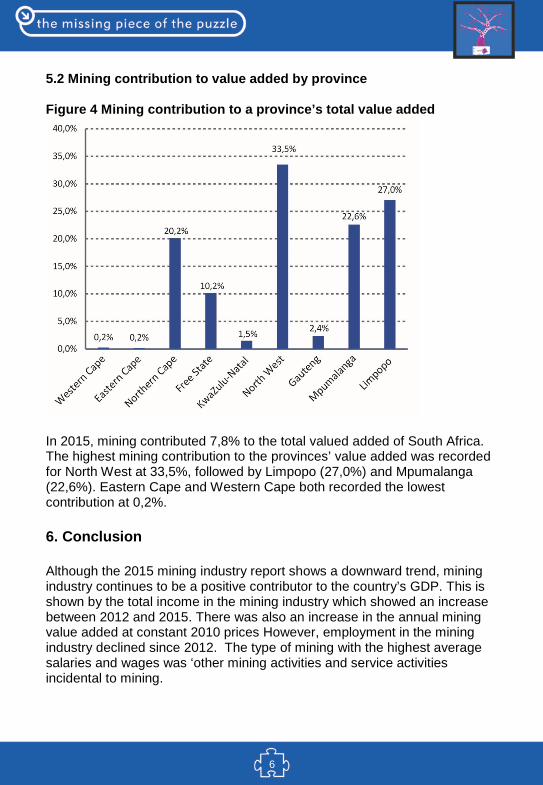
Figure 4 Mining contribution to a province’s total value added
In 2015, mining contributed 7,8% to the total valued added of South Africa. The highest mining contribution to the provinces’ value added was recorded for North West at 33,5%, followed by Limpopo (27,0%) and Mpumalanga (22,6%). Eastern Cape and Western Cape both recorded the lowest contribution at 0,2%.
6. Conclusion
Although the 2015 mining industry report shows a downward trend, mining industry continues to be a positive contributor to the country’s GDP. This is shown by the total income in the mining industry which showed an increase between 2012 and 2015. There was also an increase in the annual mining value added at constant 2010 prices However, employment in the mining industry declined since 2012. The type of mining with the highest average salaries and wages was ‘other mining activities and service activities incidental to mining.
7
Primary industries
Mining: Production and sales
Mining production and minerals sales increase
In his State of the Nation Address in Parliament on 9 February 2017, President Jacob Zuma acknowledged the mining industry’s role as the backbone of the South African economy and as an important foreign exchange earner. He further reiterated the importance of promoting the sustainability of mining sector. He encouraged government to continue to work with other stakeholders to combat illegal mining, to save lives and to prevent the trafficking of precious metals and diamonds. While great emphasis was also placed on the health and safety of mineworkers and wherein government is currently working with the mining companies to ensure that lives of the miners are protected at all times. Presented in this article is a summary of the mining: production and sales statistics for February 2017.
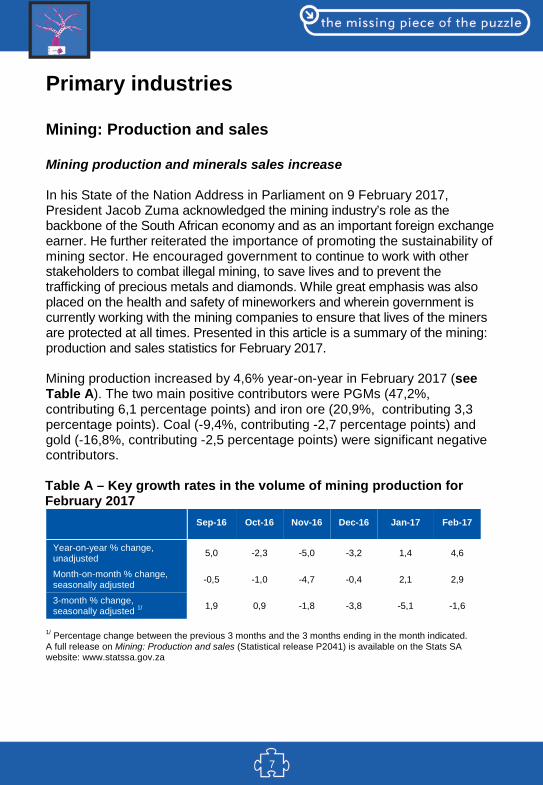
Mining production increased by 4,6% year-on-year in February 2017 (see Table A). The two main positive contributors were PGMs (47,2%, contributing 6,1 percentage points) and iron ore (20,9%, contributing 3,3 percentage points). Coal (-9,4%, contributing -2,7 percentage points) and gold (-16,8%, contributing -2,5 percentage points) were significant negative contributors.
Table A – Key growth rates in the volume of mining production for February 2017
Sep-16 Oct-16 Nov-16 Dec-16 Jan-17 Feb-17
Year-on-year % change, unadjusted 5,0 -2,3 -5,0 -3,2 1,4 4,6
Month-on-month % change, seasonally adjusted -0,5 -1,0 -4,7 -0,4 2,1 2,9
3-month % change, seasonally adjusted 1/ 1,9 0,9 -1,8 -3,8 -5,1 -1,6
1/ Percentage change between the previous 3 months and the 3 months ending in the month indicated. A full release on Mining: Production and sales (Statistical release P2041) is available on the Stats SA website: www.statssa.gov.za
8
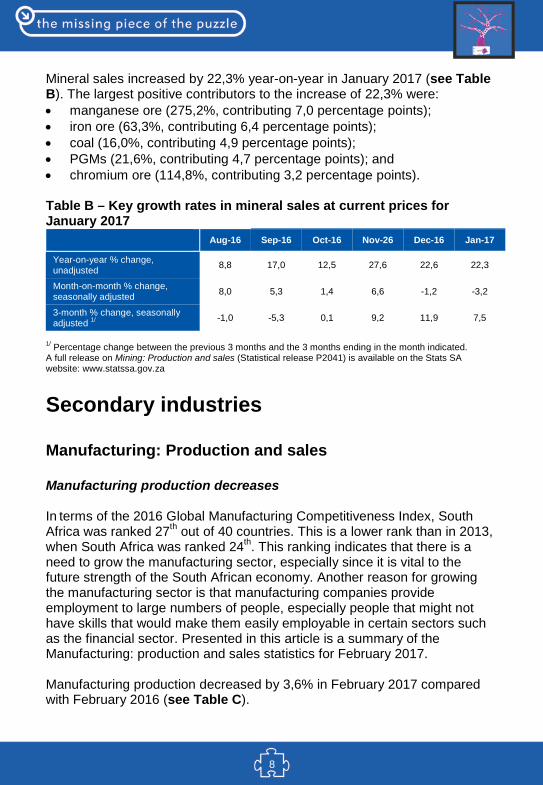
Mineral sales increased by 22,3% year-on-year in January 2017 (see Table B). The largest positive contributors to the increase of 22,3% were: • manganese ore (275,2%, contributing 7,0 percentage points); • iron ore (63,3%, contributing 6,4 percentage points); • coal (16,0%, contributing 4,9 percentage points); • PGMs (21,6%, contributing 4,7 percentage points); and • chromium ore (114,8%, contributing 3,2 percentage points). Table B – Key growth rates in mineral sales at current prices for January 2017
Aug-16 Sep-16 Oct-16 Nov-26 Dec-16 Jan-17
Year-on-year % change, unadjusted 8,8 17,0 12,5 27,6 22,6 22,3
Month-on-month % change, seasonally adjusted 8,0 5,3 1,4 6,6 -1,2 -3,2
3-month % change, seasonally adjusted 1/ -1,0 -5,3 0,1 9,2 11,9 7,5
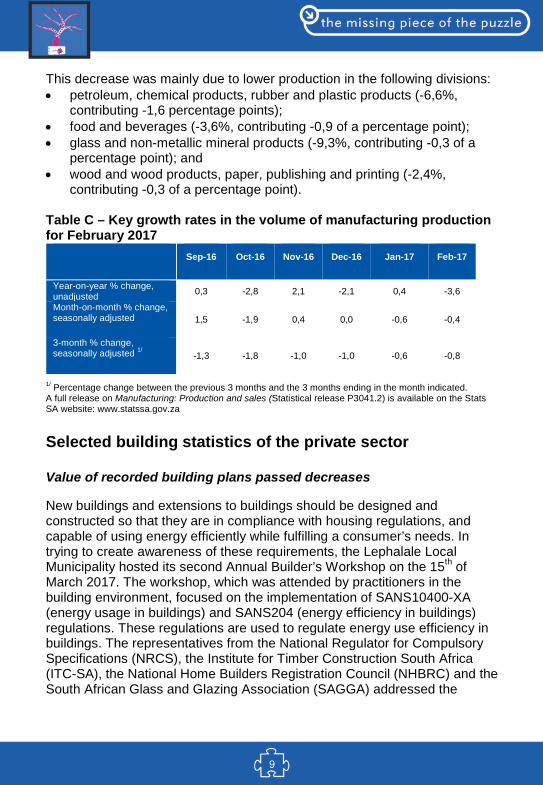
1/ Percentage change between the previous 3 months and the 3 months ending in the month indicated. A full release on Mining: Production and sales (Statistical release P2041) is available on the Stats SA website: www.statssa.gov.za Secondary industries Manufacturing: Production and sales Manufacturing production decreases In terms of the 2016 Global Manufacturing Competitiveness Index, South Africa was ranked 27th out of 40 countries. This is a lower rank than in 2013, when South Africa was ranked 24th. This ranking indicates that there is a need to grow the manufacturing sector, especially since it is vital to the future strength of the South African economy. Another reason for growing the manufacturing sector is that manufacturing companies provide employment to large numbers of people, especially people that might not have skills that would make them easily employable in certain sectors such as the financial sector. Presented in this article is a summary of the Manufacturing: production and sales statistics for February 2017. Manufacturing production decreased by 3,6% in February 2017 compared with February 2016 (see Table C).
9
This decrease was mainly due to lower production in the following divisions: • petroleum, chemical products, rubber and plastic products (-6,6%,
contributing -1,6 percentage points); • food and beverages (-3,6%, contributing -0,9 of a percentage point);• glass and non-metallic mineral products (-9,3%, contributing -0,3 of a
percentage point); and• wood and wood products, paper, publishing and printing (-2,4%,
contributing -0,3 of a percentage point).
Table C – Key growth rates in the volume of manufacturing production for February 2017
Sep-16 Oct-16 Nov-16 Dec-16 Jan-17 Feb-17
Year-on-year % change, unadjusted 0,3 -2,8 2,1 -2,1 0,4 -3,6
Month-on-month % change, seasonally adjusted 1,5 -1,9 0,4 0,0 -0,6 -0,4
3-month % change, seasonally adjusted 1/ -1,3 -1,8 -1,0 -1,0 -0,6 -0,8
1/ Percentage change between the previous 3 months and the 3 months ending in the month indicated. A full release on Manufacturing: Production and sales (Statistical release P3041.2) is available on the Stats SA website: www.statssa.gov.za
Selected building statistics of the private sector
Value of recorded building plans passed decreases
New buildings and extensions to buildings should be designed and constructed so that they are in compliance with housing regulations, and capable of using energy efficiently while fulfilling a consumer’s needs. In trying to create awareness of these requirements, the Lephalale Local Municipality hosted its second Annual Builder’s Workshop on the 15th of March 2017. The workshop, which was attended by practitioners in the building environment, focused on the implementation of SANS10400-XA (energy usage in buildings) and SANS204 (energy efficiency in buildings) regulations. These regulations are used to regulate energy use efficiency in buildings. The representatives from the National Regulator for Compulsory Specifications (NRCS), the Institute for Timber Construction South Africa (ITC-SA), the National Home Builders Registration Council (NHBRC) and the South African Glass and Glazing Association (SAGGA) addressed the
10
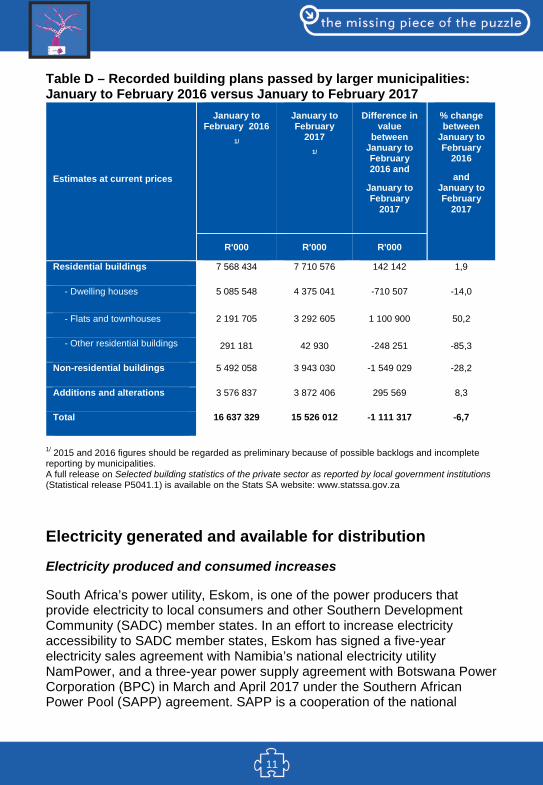
building practitioners at the workshop. Presented in this article is a summary of the selected building statistics in the private sector for February 2017. The value of recorded building plans passed (at current prices) decreased by 6,7% (-R1 111,3 million) during January to February 2017 compared with January to February 2016 (see Table D). Non-residential buildings fell by 28,2% (-R1 549,0 million). There were large year-on-year decreases in plans passed for shopping space in KwaZulu-Natal (-R1 573,9 million) and Gauteng (-R775,6 million). The largest negative contributions to the total decrease of 6,7% (-R1 111,3 million) were made by KwaZulu-Natal (contributing -8,3 percentage points or -R1 374,9 million) and Gauteng (contributing -5,6 percentage points or -R927,4 million). The largest positive contribution was made by Western Cape (5,5 percentage points or R916,1 million). The value of buildings reported as completed increased by 16,2% (R1 261,3 million) during January to February 2017 compared with January to February 2016. All three major building categories recorded increases. The largest percentage increase was recorded for: • non-residential buildings (31,7% or R509,5 million); • residential buildings (14,5% or R678,7 million); and • additions and alterations (4,8% or R73,0 million). Six provinces reported year-on-year increases in the value of buildings completed during January to February 2017. The largest contributions were recorded for Gauteng (contributing 12,6 percentage points or R980,0 million) and Western Cape (contributing 6,6 percentage points or R512,4 million).
11
Table D – Recorded building plans passed by larger municipalities: January to February 2016 versus January to February 2017
Estimates at current prices
January to February 2016
1/
January to February
2017 1/
Difference in value
between January to February 2016 and
January to February
2017
% change between
January to February
2016
and January to February
2017
R'000 R'000 R'000
Residential buildings 7 568 434 7 710 576 142 142 1,9
- Dwelling houses 5 085 548 4 375 041 -710 507 -14,0
- Flats and townhouses 2 191 705 3 292 605 1 100 900 50,2
- Other residential buildings 291 181 42 930 -248 251 -85,3
Non-residential buildings 5 492 058 3 943 030 -1 549 029 -28,2
Additions and alterations 3 576 837 3 872 406 295 569 8,3
Total 16 637 329 15 526 012 -1 111 317 -6,7
1/ 2015 and 2016 figures should be regarded as preliminary because of possible backlogs and incomplete reporting by municipalities. A full release on Selected building statistics of the private sector as reported by local government institutions (Statistical release P5041.1) is available on the Stats SA website: www.statssa.gov.za
Electricity generated and available for distribution
Electricity produced and consumed increases
South Africa’s power utility, Eskom, is one of the power producers that provide electricity to local consumers and other Southern Development Community (SADC) member states. In an effort to increase electricity accessibility to SADC member states, Eskom has signed a five-year electricity sales agreement with Namibia’s national electricity utility NamPower, and a three-year power supply agreement with Botswana Power Corporation (BPC) in March and April 2017 under the Southern African Power Pool (SAPP) agreement. SAPP is a cooperation of the national
12
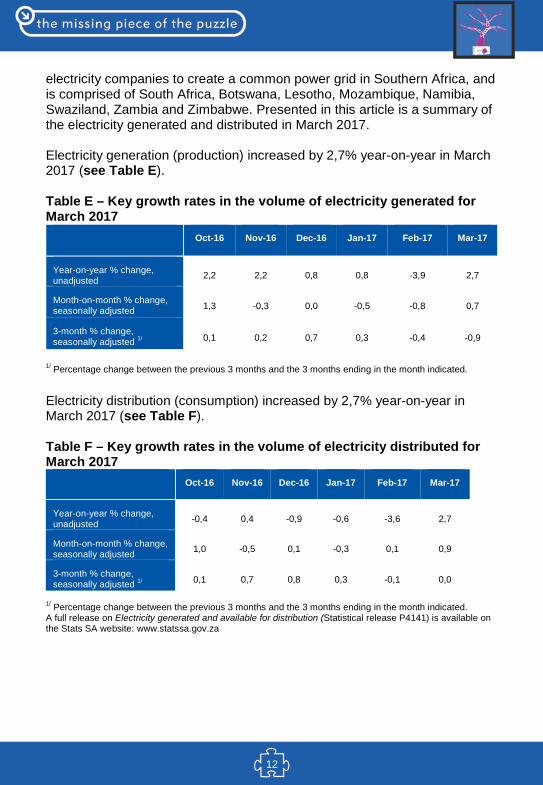
electricity companies to create a common power grid in Southern Africa, and is comprised of South Africa, Botswana, Lesotho, Mozambique, Namibia, Swaziland, Zambia and Zimbabwe. Presented in this article is a summary of the electricity generated and distributed in March 2017.
Electricity generation (production) increased by 2,7% year-on-year in March 2017 (see Table E).
Table E – Key growth rates in the volume of electricity generated for March 2017
Oct-16 Nov-16 Dec-16 Jan-17 Feb-17 Mar-17
Year-on-year % change, unadjusted 2,2 2,2 0,8 0,8 -3,9 2,7
Month-on-month % change, seasonally adjusted 1,3 -0,3 0,0 -0,5 -0,8 0,7
3-month % change, seasonally adjusted 1/ 0,1 0,2 0,7 0,3 -0,4 -0,9
1/ Percentage change between the previous 3 months and the 3 months ending in the month indicated.
Electricity distribution (consumption) increased by 2,7% year-on-year in March 2017 (see Table F).
Table F – Key growth rates in the volume of electricity distributed for March 2017
Oct-16 Nov-16 Dec-16 Jan-17 Feb-17 Mar-17
Year-on-year % change, unadjusted -0,4 0,4 -0,9 -0,6 -3,6 2,7
Month-on-month % change, seasonally adjusted 1,0 -0,5 0,1 -0,3 0,1 0,9
3-month % change, seasonally adjusted 1/ 0,1 0,7 0,8 0,3 -0,1 0,0
1/ Percentage change between the previous 3 months and the 3 months ending in the month indicated. A full release on Electricity generated and available for distribution (Statistical release P4141) is available on the Stats SA website: www.statssa.gov.za
13
Tertiary industries Retail trade sales Retail trade sales decrease
Retailers lose millions of rands due to card payment fraud. In order to minimise the impact of card payment fraud, MasterCard (the company that produces debit and credit cards to make purchases at retail shops) has launched a biometric card that uses fingerprints (instead of a Personal Identification Number [PIN]) to enable purchases. With the biometric system, consumers insert the card into a retailer's terminal and place their finger on the embedded sensor of the card, which verifies the fingerprint and authenticates the transaction. The biometric card has been trialled in South Africa by MasterCard in retail and banking industries, and a full rollout is expected at the end of 2017. Presented in this article is a summary of the retail trade sales statistics for February 2017.
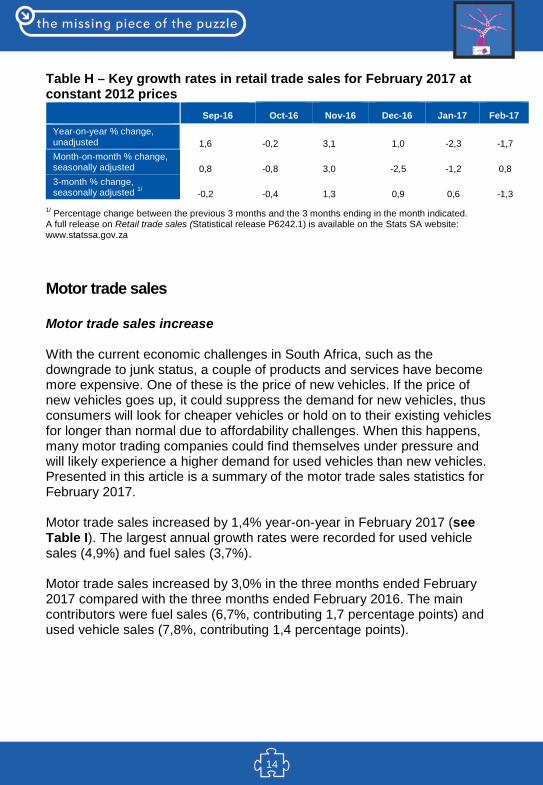
Retail trade sales decreased by 1,7% year-on-year in February 2017 (see Table H). Negative annual growth rates were recorded for: • retailers in textiles, clothing, footwear and leather goods (-7,6%);• retailers in household furniture, appliances and equipment (-6,5%);• retailers in hardware, paint and glass (-5,5%); and• all ‘other’ retailers (-5,5%).
The main contributor to the 1,7% decrease was retailers in textiles, clothing, footwear and leather goods (contributing -1,3 percentage points).
Retail trade sales decreased by 0,7% in the three months ended February 2017 compared with the three months ended February 2016. The main contributor to this decrease was general dealers (-2,0% and contributing -0,9 of a percentage point).
14
Table H – Key growth rates in retail trade sales for February 2017 at constant 2012 prices
Sep-16 Oct-16 Nov-16 Dec-16 Jan-17 Feb-17 Year-on-year % change, unadjusted 1,6 -0,2 3,1 1,0 -2,3 -1,7 Month-on-month % change, seasonally adjusted 0,8 -0,8 3,0 -2,5 -1,2 0,8 3-month % change, seasonally adjusted 1/ -0,2 -0,4 1,3 0,9 0,6 -1,3
1/ Percentage change between the previous 3 months and the 3 months ending in the month indicated. A full release on Retail trade sales (Statistical release P6242.1) is available on the Stats SA website: www.statssa.gov.za
Motor trade sales
Motor trade sales increase
With the current economic challenges in South Africa, such as the downgrade to junk status, a couple of products and services have become more expensive. One of these is the price of new vehicles. If the price of new vehicles goes up, it could suppress the demand for new vehicles, thus consumers will look for cheaper vehicles or hold on to their existing vehicles for longer than normal due to affordability challenges. When this happens, many motor trading companies could find themselves under pressure and will likely experience a higher demand for used vehicles than new vehicles. Presented in this article is a summary of the motor trade sales statistics for February 2017.
Motor trade sales increased by 1,4% year-on-year in February 2017 (see Table I). The largest annual growth rates were recorded for used vehicle sales (4,9%) and fuel sales (3,7%).
Motor trade sales increased by 3,0% in the three months ended February 2017 compared with the three months ended February 2016. The main contributors were fuel sales (6,7%, contributing 1,7 percentage points) and used vehicle sales (7,8%, contributing 1,4 percentage points).
15
Table I – Key growth rate figures in motor trade sales for February 2017
Sep-16 Oct-16 Nov-16 Dec-16 Jan-17 Feb-17
Year-on-year % change, unadjusted -0,1 -0,7 4,1 1,0 6,8 1,4
Month-on-month % change, seasonally adjusted
1,4 0,8 0,5 1,6 0,2 1,0
3-month % change, seasonally adjusted 1/ -1,5 -1,8 0,5 1,4 2,6 2,6
1/ Percentage change between the previous 3 months and the 3 months ending in the month indicated. A full release on Motor trade sales (Statistical release P6343.2) is available on the Stats SA website: www.statssa.gov.za
Food and beverages
Total income generated by the food and beverages industry increases
Did you know that a 330 ml can of Coca-Cola contains just over eight teaspoons of sugar? Many did not know this; what’s more, some of the drinks labelled 100 percent fruit juices may contain a similar volume or more sugar than that of a Coca-Cola can. This high sugar content in beverages has led to concerns about sugar consumption and the rise in lifestyle-related diseases, causing different countries to implement taxes on high-sugar foods and beverages. These taxes are intended to reduce the rates of overweight and obesity, and to encourage healthy diets. This will also encourage the demand for healthier alternatives while convincing the industry to reconsider the formulation and labelling of their products and marketing strategies. Presented in this article is a summary on food and beverage statistics for February 2017.
Total income generated by the food and beverages industry increased by 1,2% in February 2017 compared with February 2016 (see Table J). Food sales grew by 1,7%.
In February 2017, restaurants and coffee shops increased year-on-year by 6,4% (contributing 2,7 percentage points).
Total income generated by the food and beverages industry decreased by 0,3% in the three months ended February 2017 compared with the three
16
months ended February 2016. The main contributor to this decrease was catering services (-7,5%, contributing -1,2 percentage points).
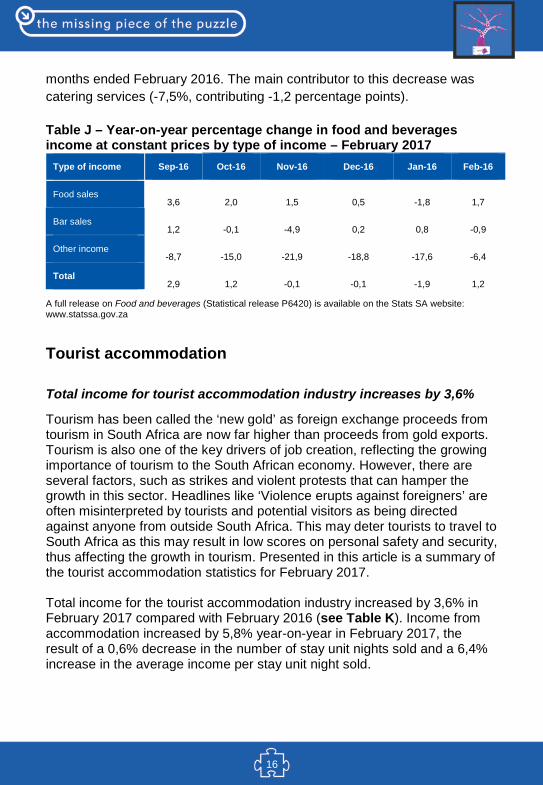
Table J – Year-on-year percentage change in food and beverages income at constant prices by type of income – February 2017
Type of income Sep-16 Oct-16 Nov-16 Dec-16 Jan-16 Feb-16
Food sales 3,6 2,0 1,5 0,5 -1,8 1,7
Bar sales 1,2 -0,1 -4,9 0,2 0,8 -0,9
Other income -8,7 -15,0 -21,9 -18,8 -17,6 -6,4
Total 2,9 1,2 -0,1 -0,1 -1,9 1,2
A full release on Food and beverages (Statistical release P6420) is available on the Stats SA website: www.statssa.gov.za
Tourist accommodation
Total income for tourist accommodation industry increases by 3,6%
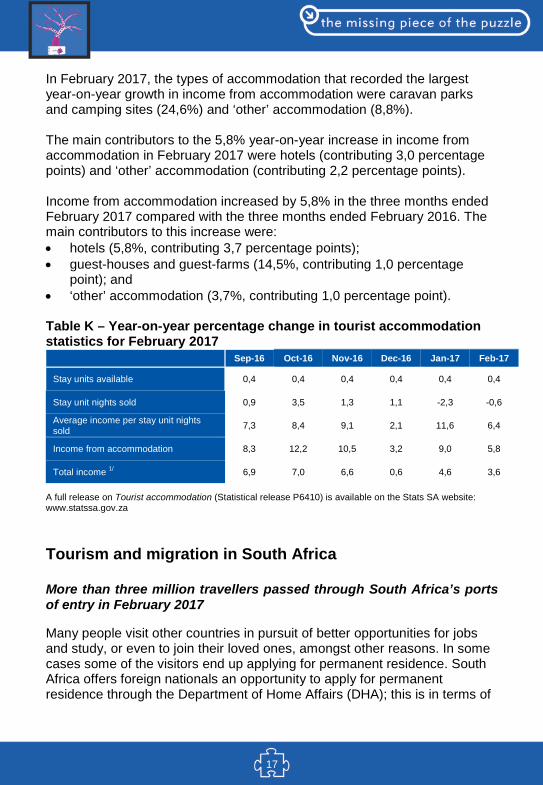
Tourism has been called the ‘new gold’ as foreign exchange proceeds from tourism in South Africa are now far higher than proceeds from gold exports. Tourism is also one of the key drivers of job creation, reflecting the growing importance of tourism to the South African economy. However, there are several factors, such as strikes and violent protests that can hamper the growth in this sector. Headlines like ‘Violence erupts against foreigners’ are often misinterpreted by tourists and potential visitors as being directed against anyone from outside South Africa. This may deter tourists to travel to South Africa as this may result in low scores on personal safety and security, thus affecting the growth in tourism. Presented in this article is a summary of the tourist accommodation statistics for February 2017. Total income for the tourist accommodation industry increased by 3,6% in February 2017 compared with February 2016 (see Table K). Income from accommodation increased by 5,8% year-on-year in February 2017, the result of a 0,6% decrease in the number of stay unit nights sold and a 6,4% increase in the average income per stay unit night sold.
17
In February 2017, the types of accommodation that recorded the largest year-on-year growth in income from accommodation were caravan parks and camping sites (24,6%) and ‘other’ accommodation (8,8%). The main contributors to the 5,8% year-on-year increase in income from accommodation in February 2017 were hotels (contributing 3,0 percentage points) and ‘other’ accommodation (contributing 2,2 percentage points). Income from accommodation increased by 5,8% in the three months ended February 2017 compared with the three months ended February 2016. The main contributors to this increase were: • hotels (5,8%, contributing 3,7 percentage points); • guest-houses and guest-farms (14,5%, contributing 1,0 percentage
point); and • ‘other’ accommodation (3,7%, contributing 1,0 percentage point).
Table K – Year-on-year percentage change in tourist accommodation statistics for February 2017
Sep-16 Oct-16 Nov-16 Dec-16 Jan-17 Feb-17
Stay units available 0,4 0,4 0,4 0,4 0,4 0,4
Stay unit nights sold 0,9 3,5 1,3 1,1 -2,3 -0,6
Average income per stay unit nights sold 7,3 8,4 9,1 2,1 11,6 6,4
Income from accommodation 8,3 12,2 10,5 3,2 9,0 5,8
Total income 1/ 6,9 7,0 6,6 0,6 4,6 3,6 A full release on Tourist accommodation (Statistical release P6410) is available on the Stats SA website: www.statssa.gov.za
Tourism and migration in South Africa More than three million travellers passed through South Africa’s ports of entry in February 2017
Many people visit other countries in pursuit of better opportunities for jobs and study, or even to join their loved ones, amongst other reasons. In some cases some of the visitors end up applying for permanent residence. South Africa offers foreign nationals an opportunity to apply for permanent residence through the Department of Home Affairs (DHA); this is in terms of
18
the Immigration Act, 2002 (Act No. 13 of 2002). The process to apply for a permanent residency permit requires applicants to first submit a formal request to the Minister of Home Affairs, attached with a motivation that states the reasons why they should be granted the permit. The approval in this regard is granted by the minister, taking into consideration the contribution that could be made to the economic growth of South Africa. However, people that were convicted of serious criminal offences such as murder, drug trafficking and kidnapping amongst other offences may be prohibited or declared undesirable persons. Presented in this article is a summary of the tourism and migration statistics for February 2017.
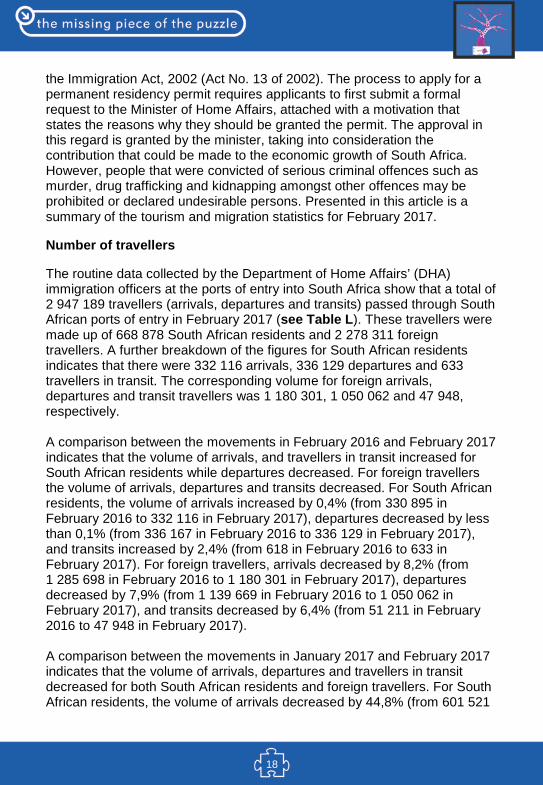
Number of travellers
The routine data collected by the Department of Home Affairs’ (DHA) immigration officers at the ports of entry into South Africa show that a total of 2 947 189 travellers (arrivals, departures and transits) passed through South African ports of entry in February 2017 (see Table L). These travellers were made up of 668 878 South African residents and 2 278 311 foreign travellers. A further breakdown of the figures for South African residents indicates that there were 332 116 arrivals, 336 129 departures and 633 travellers in transit. The corresponding volume for foreign arrivals, departures and transit travellers was 1 180 301, 1 050 062 and 47 948, respectively. A comparison between the movements in February 2016 and February 2017 indicates that the volume of arrivals, and travellers in transit increased for South African residents while departures decreased. For foreign travellers the volume of arrivals, departures and transits decreased. For South African residents, the volume of arrivals increased by 0,4% (from 330 895 in February 2016 to 332 116 in February 2017), departures decreased by less than 0,1% (from 336 167 in February 2016 to 336 129 in February 2017), and transits increased by 2,4% (from 618 in February 2016 to 633 in February 2017). For foreign travellers, arrivals decreased by 8,2% (from 1 285 698 in February 2016 to 1 180 301 in February 2017), departures decreased by 7,9% (from 1 139 669 in February 2016 to 1 050 062 in February 2017), and transits decreased by 6,4% (from 51 211 in February 2016 to 47 948 in February 2017). A comparison between the movements in January 2017 and February 2017 indicates that the volume of arrivals, departures and travellers in transit decreased for both South African residents and foreign travellers. For South African residents, the volume of arrivals decreased by 44,8% (from 601 521
19
in January 2017 to 332 116 in February 2017), departures decreased by 14,6% (from 393 508 in January 2017 to 336 129 in February 2017), and transits decreased by 9,3% (from 698 in January 2017 to 633 in February 2017). For foreign travellers, arrivals decreased by 24,3% (from 1 559 295 in January 2017 to 1 180 301 in February 2017), departures decreased by 12,8% (from 1 204 768 in January 2017 to 1 050 062 in February 2017), and transits decreased by 13,8% (from 55 612 in January 2017 to 47 948 in February 2017).
Mode of travel
In February 2017, road transport was the most common mode of travel used by 2 017 897 (68,5%) of the 2 947 189 travellers. The total number of travellers who used air transport was 920 547 (31,2%). A smaller number of travellers, 8 745 (0,3%), used sea transport. The arrivals data for South African residents show that 123 969 (37,3%) came by air, 207 764 (62,6%) came by road and 383 (0,1%) arrived by sea. For departures, 126 641 (37,7%) used air transport, 209 281 (62,3%) travelled by road and 207 (0,1%) left by sea. All travellers in transit (633) used air transport. In the case of foreign travellers, 316 715 (26,8%) arrived by air, 860 327 (72,9%) came by road and 3 259 (0,3%) arrived by sea. When departing South Africa, 304 641 (29,0%) foreign travellers left by air, 740 525 (70,5%) left by road and 4 896 (0,5%) left by sea. All travellers in transit (47 948) used air transport.
Purpose of visit
In February 2017, the majority of tourists, 745 066 (96,0%), were in South Africa for holiday compared to 22 776 (2,9%) and 7 982 (1,0%) who were in South Africa for business and for study purposes, respectively. A detailed analysis reveals that of all the tourists from each of the overseas regions, more than 90% came to South Africa for holiday. A total of 9 641 (98,7%) tourists from Central and South America, 175 027 (96,8%) from Europe, 7 404 (96,2%) from Australasia, 28 261 (95,3%) from North America, 21 889 (92,6%) from Asia and 3 943 (92,5%) from the Middle East were in South Africa for holiday. The Middle East and Asia had the highest proportions of tourists who came to South Africa for business [6,5% (278) and 6,2% (1 470), respectively]. The two regions also had the highest proportions of tourists who came for study purposes [1,2% (274) and 1,0% (44) for Asia and Middle East, respectively], compared to other overseas regions.
20
Sex and age distribution
There were 440 958 (56,8%) male and 334 866 (43,2%) female tourists. Overseas tourists were made up of 137 412 (53,7%) male tourists and 118 489 (46,3%) female tourists. There were 292 768 (58,2%) male and 210 493 (41,8%) female tourists from the SADC countries. Tourists from 'other' African countries were made up of 10 204 (65,1%) male and 5 472 (34,9%) female tourists.
Table L – Number of South African residents and foreign travellers by travel direction: February 2017
Travel direction February
2016 January
2017 February
2017
% change between January
and February
2017
% change between February 2016 and February
2017
Total 3 144 258 3 815 402 2 947 189 -22,8% -6,3% South African residents 667 680 995 727 668 878 -32,8% 0,2%
Arrivals 330 895 601 521 332 116 -44,8% 0,4%
Departures 336 167 393 508 336 129 -14,6% -0,01%
Transit 618 698 633 -9,3% 2,4%
Foreign travellers 2 476 578 2 819 675 2 278 311 -19,2% -8,0%
Arrivals 1 285 698 1 559 295 1 180 301 -24,3% -8,2%
Departures 1 139 669 1 204 768 1 050 062 -12,8% -7,9%
Transit 51 211 55 612 47 948 -13,8% -6,4%
Foreign arrivals 1 285 698 1 559 295 1 180 301 -24,3% -8,2% Non-visitors 78 123 120 373 73 911 -38,6% -5,4%
Visitors 1 207 575 1 438 922 1 106 390 -23,1% -8,4%
Visitors 1 207 575 1 438 922 1 106 390 -23,1% -8,4%
Arrivals only 313 823 531 481 313 632 41,0% -0,1%
Single trips 436 533 410 265 398 453 -2,9% -8,7%
Multiple trips 457 219 497 176 394 305 -20,7% -13,8%
Visitors 1 207 575 1 438 922 1 106 390 -23,1% -8,4%
Same-day 403 805 398 388 330 566 -17,0% -18,1%
Tourists 803 770 1 040 534 775 824 -25,4% -3,5%
A full release on Tourism and migration (Statistical release P0351) is available on the Stats SA website: www.statssa.gov.za
21
Statistics on civil cases for debt
Total number of civil summonses issued for debt decreased
To avoid entering into disputes with pawnbrokers that may lead to civil summonses being issued against the consumer, the National Credit Regulator cautions consumers to scrutinise the pawnbrokers’ credit agreement to avoid signing agreements that transfer ownership of their pawned assets (especially assets such as motor vehicle and a house) when they default. Pawnbrokers might charge high loan interest rates and it’s likely for consumers to fail to repay their loan and eventually lose their assets. Pawn transaction is when loan is lent and the borrower provides assets as security. When a loan has been repaid, the consumer gets the pawned assets back. Presented in this article is a summary of the statistics on civil cases for debt for February 2017.
The total number of civil summonses issued for debt decreased by 8,9% in the three months ended February 2017 compared with the three months ended February 2016 (see Table M). The largest negative contributors to the 8,9% decrease were civil summonses relating to: • services (contributing -4,7 percentage points);• goods sold (contributing -2,7 percentage points); and• promissory notes (contributing -1,4 percentage points).
The number of civil judgements recorded for debt
The total value of civil judgements recorded for debt decreased by 20,2% in the three months ended February 2017 compared with the three months ended February 2016. The largest negative contributors to the 20,2% decrease were the value of judgements relating to: • services (contributing -6,3 percentage points);• ‘other’ debts (contributing -5,7 percentage points); and• money lent (contributing -3,5 percentage points).
The value of civil judgements recorded for debt
The total value of civil judgements recorded for debt decreased by 17,4% in the three months ended February 2017 compared with the three months ended February 2016. The largest negative contributors to the 17,4%
22
decrease were the value of judgements relating to: • ‘other’ debts (contributing -9,7 percentage points);• services (contributing -3,5 percentage points); and• promissory notes (contributing -1,7 percentage points).
In February 2017, 18 297 civil judgements for debt amounting to R283,0 million were recorded. The largest contributors to the value of judgements were: • money lent (R83,9 million or 29,6%);• ‘other’ debts (R56,7 million or 20,0%); and• Services (R55,1 million or 19,5%).
Table M – Key figures for civil summonses and judgements for February 2017
Actual estimates February 2017
% change between
February 2016 and
February 2017
% change between December 2015 to
February 2016 and
December 2016 to February 2017
Number of civil summonses issued for debt 51 056 -7,0 -8,9 Number of civil judgements recorded for debt 18 297 -20,3 -20,2 Value of civil judgements recorded for debt (R million) 283,0 -21,6 -17,4
A full release on Statistics of civil cases for debt (Statistical release P0041) is available on the Stats SA website: www.statssa.gov.za
Statistics of liquidations and insolvencies
Number of liquidations decrease while insolvencies increase
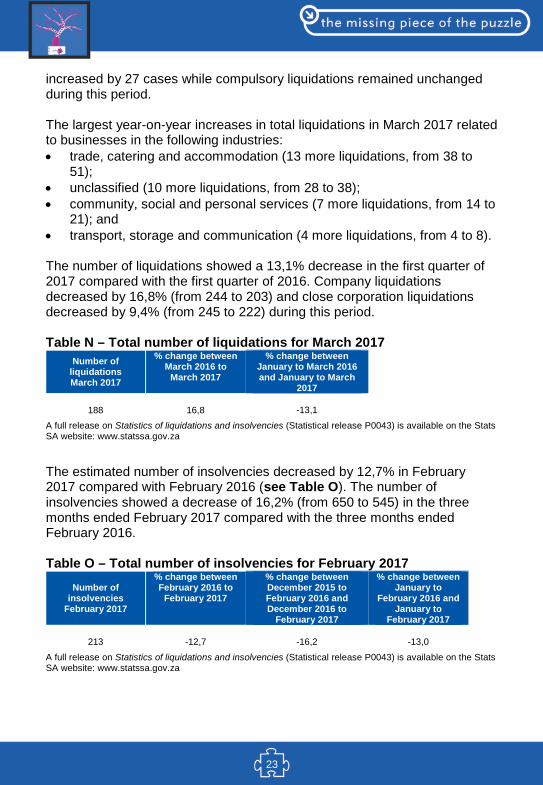
Businesses do not become insolvent overnight; it’s a process that happens over time. If a business does not have enough assets to cover its debts or is unable to pay its debt on time, it may become insolvent. As some would say, prevention is better than cure, so it’s always wise to keep a close eye on the business’ performance and cash flow. This will help business owners to detect impending problems early, thereby giving them enough time to take the necessary actions to avoid insolvency. Presented in this article is a summary of the statistics of liquidations and insolvencies for March 2016.
The total number of liquidations recorded increased by 16,8% (27 more cases) year-on-year in March 2017 (see Table N). Voluntary liquidations
23
increased by 27 cases while compulsory liquidations remained unchanged during this period.
The largest year-on-year increases in total liquidations in March 2017 related to businesses in the following industries: • trade, catering and accommodation (13 more liquidations, from 38 to
51); • unclassified (10 more liquidations, from 28 to 38);• community, social and personal services (7 more liquidations, from 14 to
21); and• transport, storage and communication (4 more liquidations, from 4 to 8).
The number of liquidations showed a 13,1% decrease in the first quarter of 2017 compared with the first quarter of 2016. Company liquidations decreased by 16,8% (from 244 to 203) and close corporation liquidations decreased by 9,4% (from 245 to 222) during this period.
Table N – Total number of liquidations for March 2017 Number of
liquidations March 2017
% change between March 2016 to
March 2017
% change between January to March 2016 and January to March
2017
188 16,8 -13,1
A full release on Statistics of liquidations and insolvencies (Statistical release P0043) is available on the Stats SA website: www.statssa.gov.za
The estimated number of insolvencies decreased by 12,7% in February 2017 compared with February 2016 (see Table O). The number of insolvencies showed a decrease of 16,2% (from 650 to 545) in the three months ended February 2017 compared with the three months ended February 2016.
Table O – Total number of insolvencies for February 2017 Number of
insolvencies February 2017
% change between February 2016 to
February 2017
% change between December 2015 to February 2016 and December 2016 to
February 2017
% change between January to
February 2016 and January to
February 2017
213 -12,7 -16,2 -13,0
A full release on Statistics of liquidations and insolvencies (Statistical release P0043) is available on the Stats SA website: www.statssa.gov.za
24
Land transport survey
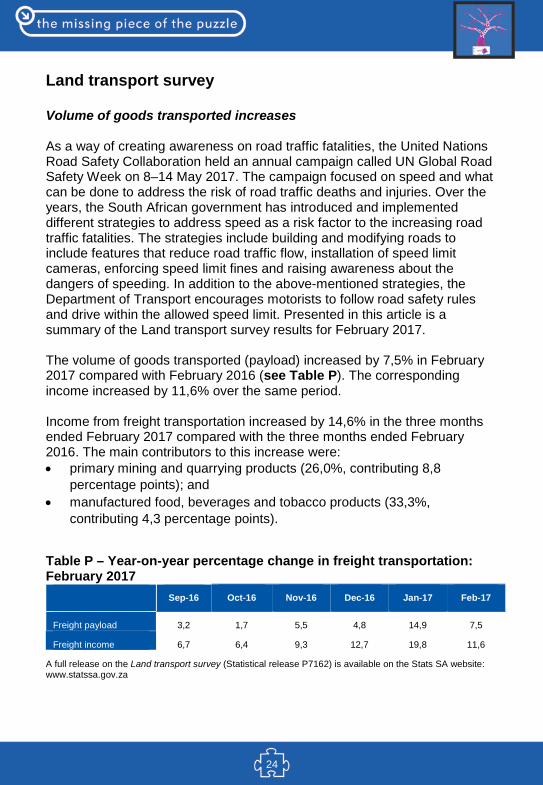
Volume of goods transported increases
As a way of creating awareness on road traffic fatalities, the United Nations Road Safety Collaboration held an annual campaign called UN Global Road Safety Week on 8–14 May 2017. The campaign focused on speed and what can be done to address the risk of road traffic deaths and injuries. Over the years, the South African government has introduced and implemented different strategies to address speed as a risk factor to the increasing road traffic fatalities. The strategies include building and modifying roads to include features that reduce road traffic flow, installation of speed limit cameras, enforcing speed limit fines and raising awareness about the dangers of speeding. In addition to the above-mentioned strategies, the Department of Transport encourages motorists to follow road safety rules and drive within the allowed speed limit. Presented in this article is a summary of the Land transport survey results for February 2017.
The volume of goods transported (payload) increased by 7,5% in February 2017 compared with February 2016 (see Table P). The corresponding income increased by 11,6% over the same period.
Income from freight transportation increased by 14,6% in the three months ended February 2017 compared with the three months ended February 2016. The main contributors to this increase were: • primary mining and quarrying products (26,0%, contributing 8,8
percentage points); and • manufactured food, beverages and tobacco products (33,3%,
contributing 4,3 percentage points).
Table P – Year-on-year percentage change in freight transportation: February 2017
Sep-16 Oct-16 Nov-16 Dec-16 Jan-17 Feb-17
Freight payload 3,2 1,7 5,5 4,8 14,9 7,5
Freight income 6,7 6,4 9,3 12,7 19,8 11,6
A full release on the Land transport survey (Statistical release P7162) is available on the Stats SA website: www.statssa.gov.za
25
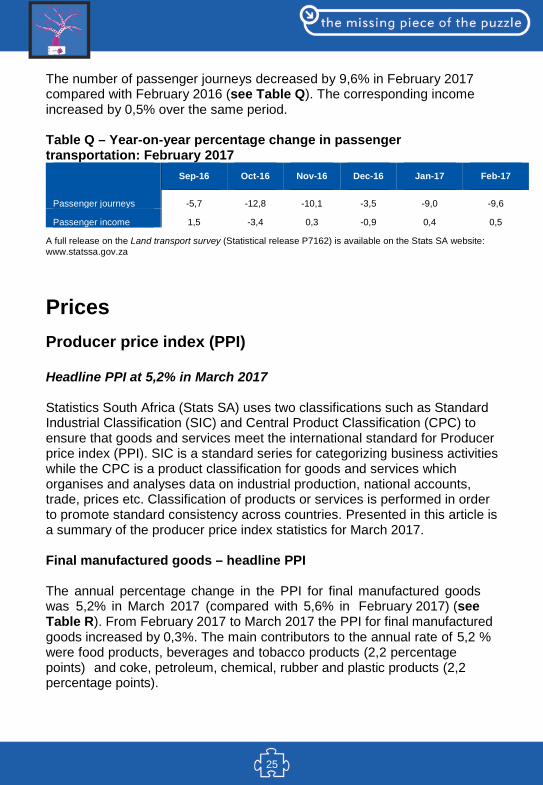
The number of passenger journeys decreased by 9,6% in February 2017 compared with February 2016 (see Table Q). The corresponding income increased by 0,5% over the same period. Table Q – Year-on-year percentage change in passenger transportation: February 2017
Sep-16 Oct-16 Nov-16 Dec-16 Jan-17 Feb-17
Passenger journeys -5,7 -12,8 -10,1 -3,5 -9,0 -9,6
Passenger income 1,5 -3,4 0,3 -0,9 0,4 0,5
A full release on the Land transport survey (Statistical release P7162) is available on the Stats SA website: www.statssa.gov.za
Prices Producer price index (PPI) Headline PPI at 5,2% in March 2017 Statistics South Africa (Stats SA) uses two classifications such as Standard Industrial Classification (SIC) and Central Product Classification (CPC) to ensure that goods and services meet the international standard for Producer price index (PPI). SIC is a standard series for categorizing business activities while the CPC is a product classification for goods and services which organises and analyses data on industrial production, national accounts, trade, prices etc. Classification of products or services is performed in order to promote standard consistency across countries. Presented in this article is a summary of the producer price index statistics for March 2017. Final manufactured goods – headline PPI The annual percentage change in the PPI for final manufactured goods was 5,2% in March 2017 (compared with 5,6% in February 2017) (see Table R). From February 2017 to March 2017 the PPI for final manufactured goods increased by 0,3%. The main contributors to the annual rate of 5,2 % were food products, beverages and tobacco products (2,2 percentage points) and coke, petroleum, chemical, rubber and plastic products (2,2 percentage points).
26
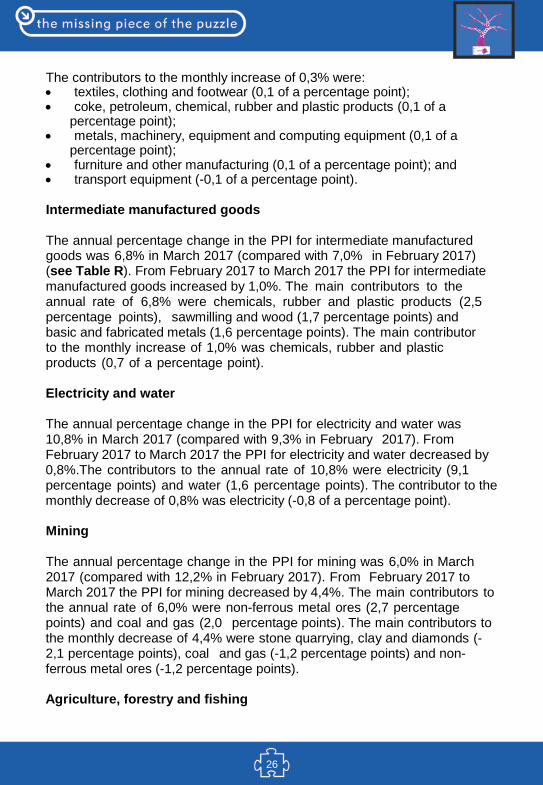
The contributors to the monthly increase of 0,3% were: • textiles, clothing and footwear (0,1 of a percentage point);• coke, petroleum, chemical, rubber and plastic products (0,1 of a
percentage point); • metals, machinery, equipment and computing equipment (0,1 of a
percentage point); • furniture and other manufacturing (0,1 of a percentage point); and• transport equipment (-0,1 of a percentage point).
Intermediate manufactured goods
The annual percentage change in the PPI for intermediate manufactured goods was 6,8% in March 2017 (compared with 7,0% in February 2017) (see Table R). From February 2017 to March 2017 the PPI for intermediate manufactured goods increased by 1,0%. The main contributors to the annual rate of 6,8% were chemicals, rubber and plastic products (2,5 percentage points), sawmilling and wood (1,7 percentage points) and basic and fabricated metals (1,6 percentage points). The main contributor to the monthly increase of 1,0% was chemicals, rubber and plastic products (0,7 of a percentage point).
Electricity and water
The annual percentage change in the PPI for electricity and water was 10,8% in March 2017 (compared with 9,3% in February 2017). From February 2017 to March 2017 the PPI for electricity and water decreased by 0,8%.The contributors to the annual rate of 10,8% were electricity (9,1 percentage points) and water (1,6 percentage points). The contributor to the monthly decrease of 0,8% was electricity (-0,8 of a percentage point).
Mining
The annual percentage change in the PPI for mining was 6,0% in March 2017 (compared with 12,2% in February 2017). From February 2017 to March 2017 the PPI for mining decreased by 4,4%. The main contributors to the annual rate of 6,0% were non-ferrous metal ores (2,7 percentage points) and coal and gas (2,0 percentage points). The main contributors to the monthly decrease of 4,4% were stone quarrying, clay and diamonds (-2,1 percentage points), coal and gas (-1,2 percentage points) and non-ferrous metal ores (-1,2 percentage points).
Agriculture, forestry and fishing
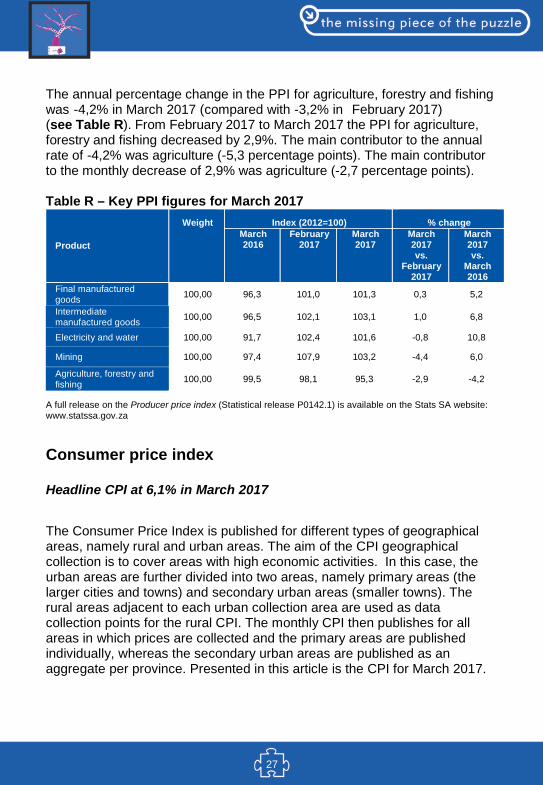
27
The annual percentage change in the PPI for agriculture, forestry and fishing was -4,2% in March 2017 (compared with -3,2% in February 2017) (see Table R). From February 2017 to March 2017 the PPI for agriculture, forestry and fishing decreased by 2,9%. The main contributor to the annual rate of -4,2% was agriculture (-5,3 percentage points). The main contributor to the monthly decrease of 2,9% was agriculture (-2,7 percentage points).
Table R – Key PPI figures for March 2017
Product
Weight Index (2012=100) % change March 2016
February 2017
March 2017
March 2017 vs.
February 2017
March 2017 vs.
March 2016
Final manufactured goods 100,00 96,3 101,0 101,3 0,3 5,2
Intermediate manufactured goods 100,00 96,5 102,1 103,1 1,0 6,8
Electricity and water 100,00 91,7 102,4 101,6 -0,8 10,8
Mining 100,00 97,4 107,9 103,2 -4,4 6,0
Agriculture, forestry and fishing 100,00 99,5 98,1 95,3 -2,9 -4,2
A full release on the Producer price index (Statistical release P0142.1) is available on the Stats SA website: www.statssa.gov.za
Consumer price index
Headline CPI at 6,1% in March 2017
The Consumer Price Index is published for different types of geographical areas, namely rural and urban areas. The aim of the CPI geographical collection is to cover areas with high economic activities. In this case, the urban areas are further divided into two areas, namely primary areas (the larger cities and towns) and secondary urban areas (smaller towns). The rural areas adjacent to each urban collection area are used as data collection points for the rural CPI. The monthly CPI then publishes for all areas in which prices are collected and the primary areas are published individually, whereas the secondary urban areas are published as an aggregate per province. Presented in this article is the CPI for March 2017.
28
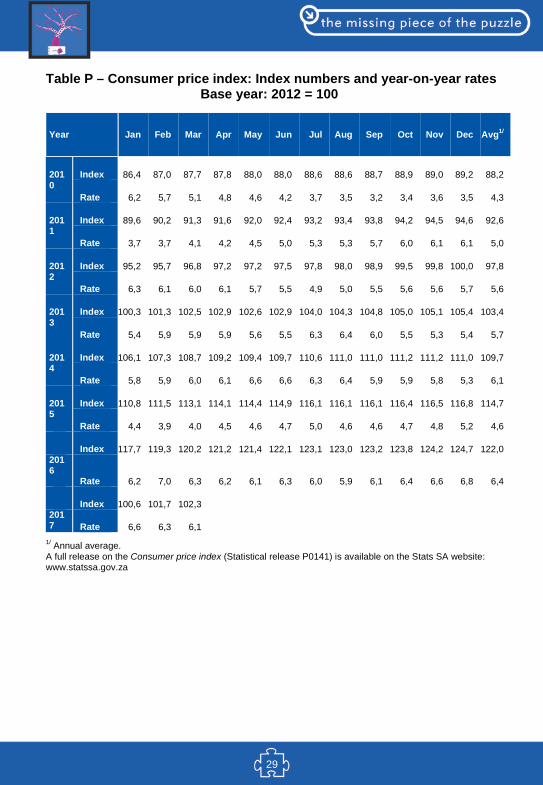
Annual consumer price inflation was 6,1% in March 2017, down from 6,3% in February 2017 (see Table S). The consumer price index increased by 0,6% month-on-month in March 2017.
The following contributed to the headline annual consumer price inflation: • Food and non-alcoholic beverages decreased from 1,7 percentage
points in February to 1,5 percentage points in March. The index increased by 8,7% year-on-year.
• Transport increased from 1,0 percentage point in February to 1,1 percentage points in March. The index increased by 7,7% year-on-year.
• Education increased from 0,1 of a percentage point in February to 0,2 of a percentage point in March. The index increased by 7,0% year-on-year.
• Miscellaneous goods and services increased from 1,1 percentage points in February to 1,2 percentage points in March. The index increased by 7,5% year-on-year.
The following contributed to monthly consumer price inflation: • Food and non-alcoholic beverages contributed 0,1 of a percentage point
in March. The index increased by 0,5% month-on-month. • Alcoholic beverages and tobacco contributed 0,1 of a percentage point in
March. The index increased by 1,7% month-on-month. • Housing and utilities contributed 0,2 of a percentage point in March. The
index increased by 0,9% month-on-month. • Education contributed 0,2 of a percentage point in March. The index
increased by 7,0% month-on-month. In March the CPI for goods increased by 7,0% year-on-year (down from 7,1% in February), and the CPI for services increased by 5,4% year-on-year (down from 5,6% in February). Provincial annual inflation rates ranged from 4,9% in Northern Cape to 7,0% in Western Cape.
29
Table P – Consumer price index: Index numbers and year-on-year rates Base year: 2012 = 100
Year Jan Feb Mar Apr May Jun Jul Aug Sep Oct Nov Dec Avg1/
2010
Index 86,4 87,0 87,7 87,8 88,0 88,0 88,6 88,6 88,7 88,9 89,0 89,2 88,2
Rate 6,2 5,7 5,1 4,8 4,6 4,2 3,7 3,5 3,2 3,4 3,6 3,5 4,3
2011
Index 89,6 90,2 91,3 91,6 92,0 92,4 93,2 93,4 93,8 94,2 94,5 94,6 92,6
Rate 3,7 3,7 4,1 4,2 4,5 5,0 5,3 5,3 5,7 6,0 6,1 6,1 5,0
2012
Index 95,2 95,7 96,8 97,2 97,2 97,5 97,8 98,0 98,9 99,5 99,8 100,0 97,8
Rate 6,3 6,1 6,0 6,1 5,7 5,5 4,9 5,0 5,5 5,6 5,6 5,7 5,6
2013
Index 100,3 101,3 102,5 102,9 102,6 102,9 104,0 104,3 104,8 105,0 105,1 105,4 103,4
Rate 5,4 5,9 5,9 5,9 5,6 5,5 6,3 6,4 6,0 5,5 5,3 5,4 5,7
2014
Index 106,1 107,3 108,7 109,2 109,4 109,7 110,6 111,0 111,0 111,2 111,2 111,0 109,7
Rate 5,8 5,9 6,0 6,1 6,6 6,6 6,3 6,4 5,9 5,9 5,8 5,3 6,1
2015
Index 110,8 111,5 113,1 114,1 114,4 114,9 116,1 116,1 116,1 116,4 116,5 116,8 114,7
Rate 4,4 3,9 4,0 4,5 4,6 4,7 5,0 4,6 4,6 4,7 4,8 5,2 4,6
Index 117,7 119,3 120,2 121,2 121,4 122,1 123,1 123,0 123,2 123,8 124,2 124,7 122,0 2016
Rate 6,2 7,0 6,3 6,2 6,1 6,3 6,0 5,9 6,1 6,4 6,6 6,8 6,4
Index 100,6 101,7 102,3 2017 Rate 6,6 6,3 6,1
1/ Annual average. A full release on the Consumer price index (Statistical release P0141) is available on the Stats SA website: www.statssa.gov.za
30
Glossary
Primary industries Gigawatt-hour (gWh): one gigawatt-hour of electricity is equal to one million kilowatt-hours. A kilowatt-hour is the basic unit of electrical energy equal to one kilowatt of power supplied to or taken from an electric circuit steadily for one hour. One kilowatt-hour equals one thousand watt-hours.
Index of physical volume of manufacturing production: also known as a production index, is a statistical measure of the change in the volume of production. The production index of a major group is the ratio between the volume of production of a major group in a given period and the volume of production of the same major group in the base period.
Index of physical volume of mining production: a statistical measure of the change in the volume of production. The production index of a mineral group is the ratio between the volume of production of a mineral group in a given period and the volume of production of the same mineral group in the base period.
Index of the physical volume of electricity production: a statistical measure of the change in the volume of production of electricity in a given period and the volume of production of electricity in the base period.
Industry: a group of establishments engaged in the same or similar kinds of economic activity.
PGMs – Platinum group metals: include platinum; iridium; osmiridium, palladium; rhodium; ruthenium and osmium.
Sales: total value of sales and transfers-out of goods mined by the mining establishments and the amounts received for installation, erection or assembly or other services.
31
Secondary industriesAdditions and alterations: extensions to existing buildings as well as internal and external alterations of existing buildings.
Blocks of flats: a structure, usually multi-storey, consisting of a number of dwellings sharing the same residential address, and usually sharing a common entrance, foyer or staircase.
Dwelling houses: a free-standing, complete structure on a separate stand or a self-contained dwelling-unit, e.g. granny flat, on the same premises as existing residence. Out-buildings and garages are included.
Other residential buildings: include institutions for the disabled, boarding houses, old age homes, hostels, hotel, motels, guest houses, holiday chalets, bed and breakfast accommodation, entertainment centres and casinos.
Residential buildings: dwelling houses, flats, townhouses and other residential buildings.
Tertiary industries Acknowledgements of debt: a statement by a person/debtor in which he admits that he owes money to an individual or a company or a bank.
Average income per stay unit night sold: average rate per stay unit (i.e. rate per room in a hotel or powered site in a caravan park) is calculated by dividing the total income from accommodation by the number of stay unit nights sold in the survey period.
Catering services: enterprises involved in the sale and supply of meals and drinks prepared on the premises on a contract basis and brought to other premises chosen by the person ordering them, to be served for immediate consumption to guests or customers. Include bars, taverns, other drinking places, ice-cream parlours, etc. Civil judgements: decisions taken in a civil matter or a dispute between two people or parties.
32
Civil summonses: notices to appear before the court of law where a dispute between two parties or people has to be heard, i.e. not for criminal offence.
Enterprise: a legal entity or a combination of legal units that includes and directly controls all functions necessary to carry out its sales activities.
Foreign traveller: a person who resides outside South Africa and visits the country temporarily.
Income from accommodation industry: income from amounts charged for rooms or equivalent. Other income is excluded (e.g. income from meals).
Income from bar sales: refers to income from liquor sales.
Income from food sales: refers to income from the sale of meals and non-alcoholic drinks.
Income from restaurant and bar sales: income from meals, banqueting and beverages and tobacco sales.
Insolvency: refers to an individual or partnership which is unable to pay its debt and is placed under final sequestration. The number of insolvencies does not refer to the number of persons involved, as a partnership which is unable to pay its debt is regarded as one insolvency, irrespective of the number of partners.
Liquidation: refers to the winding-up of the affairs of a company or close corporation when liabilities exceed assets and it can be resolved by voluntary action or by an order of the court.
Microdata: data gathered on a small scale, such as data on an individual.
‘Other’ African countries: refers to all non SADC African countries.
Other income: includes all income not earned from food sales or bar sales.
Other SADC: refers to the thirteen countries, excluding South Africa, that belong to the Southern African Development Community.
Professional services: refer to medical doctors, dentists, advocates, attorney, auditors, accountants, architects, engineers, hospital services etc.
33
Promissory notes: written undertaking, signed by a person or party, to pay money to another person or to be the bearer of such a note on a specific date or on demand.
Restaurants and coffee shops: enterprises involved in the sale and provision of meals and drinks, ordered from a menu, prepared on the premises for immediate consumption and with provided seating.
Retailer: a retailer is an enterprise deriving more than 50% of its turnover from sales of goods to the general public for household use.
Retail trade: includes the resale (sale without transformation) of new and used goods and products to the general public for household use.
Stay unit: unit accommodation available to be charged out to guests, for example, a powered site in a caravan park or a room in a hotel.
Stay unit night sold: total number of stay units occupied on each night during the survey period.
Takeaway and fast-food outlets: enterprises involved in the sale and provision of meals and drinks, ordered from a menu, prepared on the premises for takeaway purposes in a packaged format, at a stand or in a location, with or without provided seating.
Total income: includes income from food sales, income from bar sales and other income.
Tourism: comprises the activities of persons travelling to, and staying in places outside their usual environment, for not more than one consecutive year, for leisure, business and other purposes not related to the exercise of an activity remunerated from within the place visited. Tourist: a visitor who stays at least one night in the place visited.
Traveller: any person on a trip between two or more countries or between two or more localities within his/her country of residence.
Voluntary liquidation: takes place when a company or close corporation, by own choice, resolves to wind-up its affairs.
Wholesale trade: Includes the resale (sale without transformation) of new and used goods and products to other wholesalers, retailers, agricultural,
34
industrial, commercial, institutional and professional users either directly or through agents on a fee or contract basis.
Prices Annual percentage change: change in the index of the relevant month of the current year compared with the index of the same month in the previous year expressed as a percentage.
Consumer price index (CPI): an index that measures the price of a fixed basket of consumer goods and services.
Inflation rate: annual percentage change in the CPI for all items of the relevant month of the current year compared with the CPI for all items of the same month in the previous year expressed as a percentage.
Monthly percentage change: change in the index of the relevant month compared to the index of the previous month expressed as a percentage.
Year-on-year: A term used frequently in investment research and other reports to mean ‘compared with the same period in the previous fiscal year’.