statistics & spss review fall 2009. types of measures / variables nominal / categorical –...
TRANSCRIPT

Statistics & SPSS Review
Fall 2009
Types of Measures / Variables
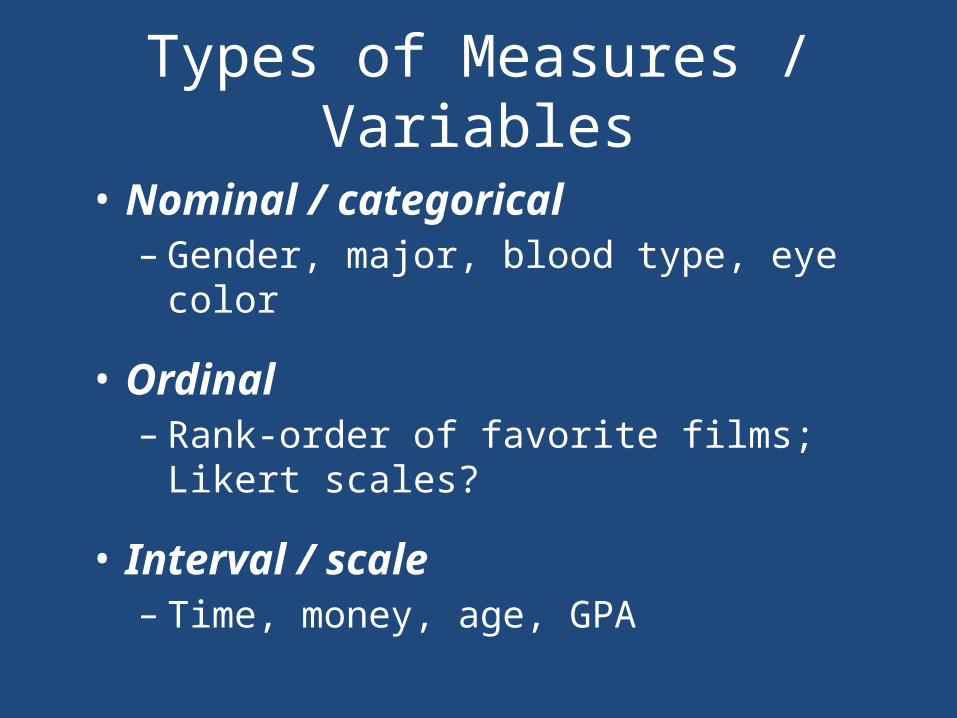
• Nominal / categorical– Gender, major, blood type, eye color
• Ordinal– Rank-order of favorite films; Likert scales?
• Interval / scale– Time, money, age, GPA

Variable Type Example Commonly-used Statistical
Method
Nominal by Nominal blood type by gender
Chi-square
Scale by Nominal GPA by gender
GPA by major
t-test
Analysis of Variance
Scale by Scale weight by heightGPA by SAT
RegressionCorrelation
Main Analysis Techniques

Variable Type Example Commonly-used Statistical
Method
Nominal by Nominal blood type by gender
Chi-square
Scale by Nominal GPA by gender
GPA by major
t-test
Analysis of Variance
Scale by Scale weight by heightGPA by SAT
RegressionCorrelation
Main Analysis Techniques

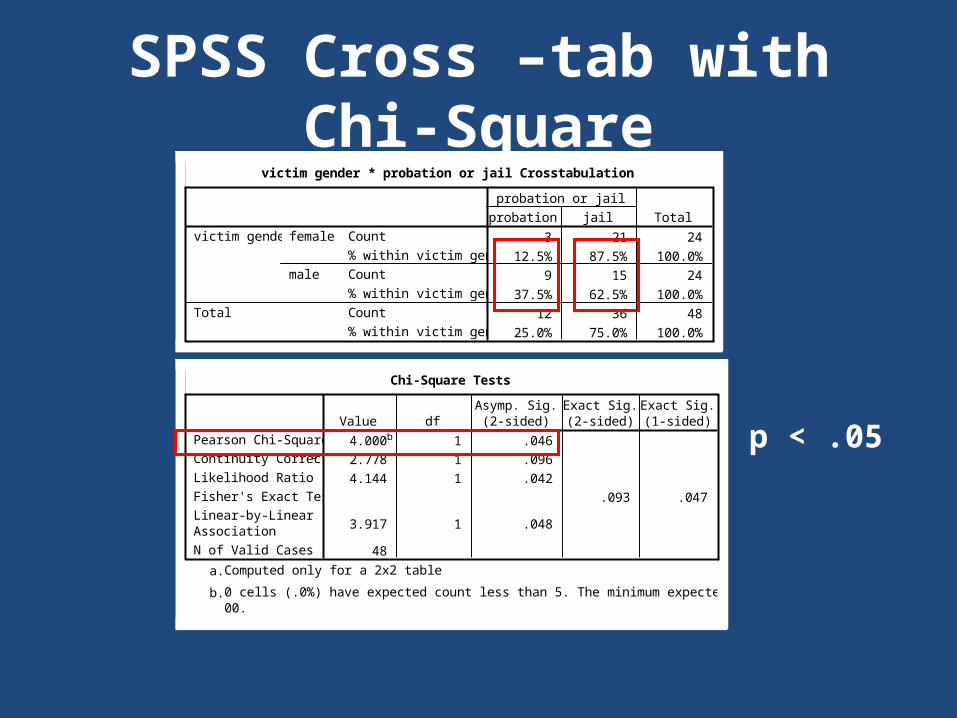
SPSS Cross –tab with Chi-Squarevictim gender * probation or jail Crosstabulation
3 21 24
12.5% 87.5% 100.0%
9 15 24
37.5% 62.5% 100.0%
12 36 48
25.0% 75.0% 100.0%
Count
% within victim gender
Count
% within victim gender
Count
% within victim gender
female
male
victim gender
Total
probation jail
probation or jail
Total
Chi-Square Tests
4.000b 1 .046
2.778 1 .096
4.144 1 .042
.093 .047
3.917 1 .048
48
Pearson Chi-Square
Continuity Correctiona
Likelihood Ratio
Fisher's Exact Test
Linear-by-LinearAssociation
N of Valid Cases
Value dfAsymp. Sig.
(2-sided)Exact Sig.(2-sided)
Exact Sig.(1-sided)
Computed only for a 2x2 tablea.
0 cells (.0%) have expected count less than 5. The minimum expected count is 6.00.
b.
p < .05

Variable Type Example Commonly-used Statistical
Method
Nominal by Nominal blood type by gender
Chi-square
Scale by Nominal GPA by gender
GPA by major
t-test
Analysis of Variance
Scale by Scale weight by heightGPA by SAT
RegressionCorrelation
Main Analysis Techniques
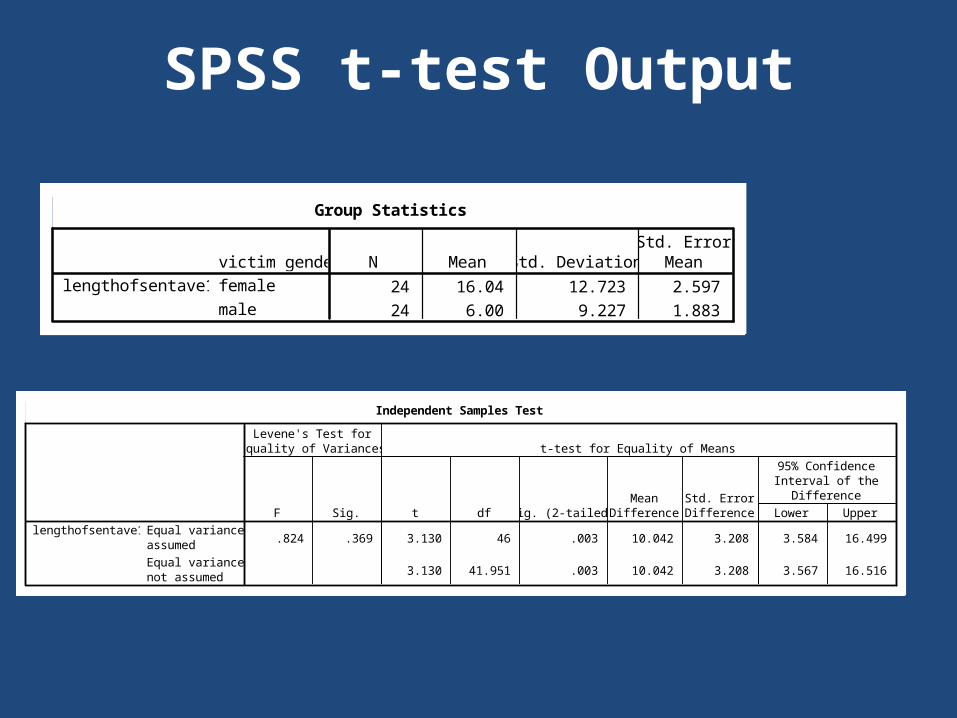
SPSS t-test Output
Group Statistics
24 16.04 12.723 2.597
24 6.00 9.227 1.883
victim genderfemale
male
lengthofsentave11N Mean Std. Deviation
Std. ErrorMean
Independent Samples Test
.824 .369 3.130 46 .003 10.042 3.208 3.584 16.499
3.130 41.951 .003 10.042 3.208 3.567 16.516
Equal variancesassumed
Equal variancesnot assumed
lengthofsentave11F Sig.
Levene's Test forEquality of Variances
t df Sig. (2-tailed)Mean
DifferenceStd. ErrorDifference Lower Upper
95% ConfidenceInterval of the
Difference
t-test for Equality of Means
1. Read means
2. Read Levene’s Test 3. Read p value

Variable Type Example Commonly-used Statistical Method
Nominal by Nominal blood type by gender
Chi-square
Scale by Nominal GPA by gender
GPA by major
t-test
Analysis of Variance
Scale by Scale weight by heightGPA by SAT
RegressionCorrelation
Analysis of Variance
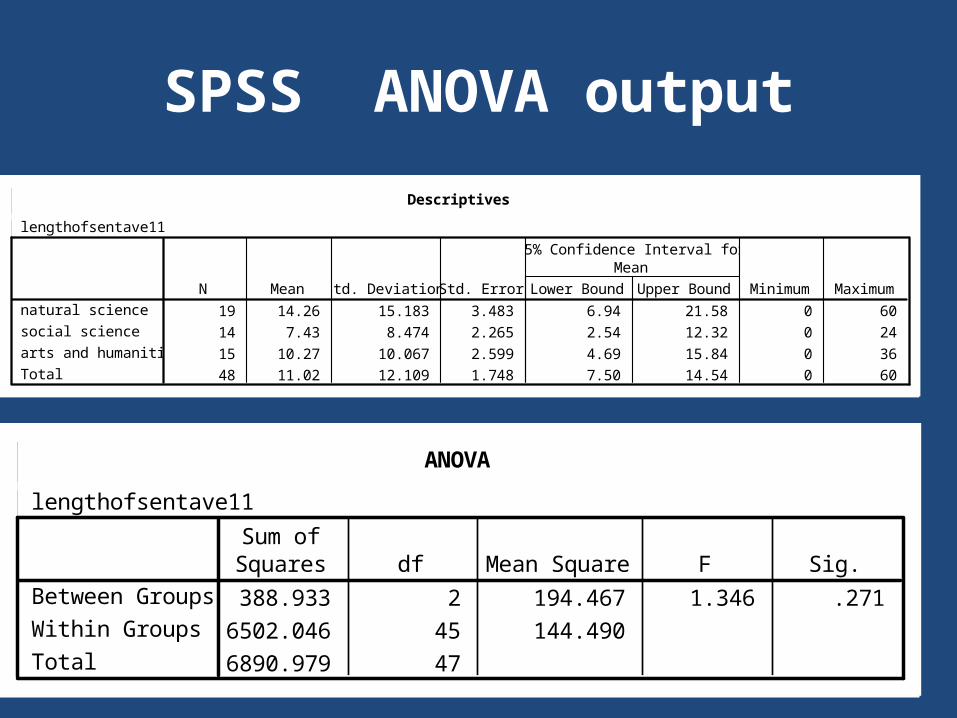
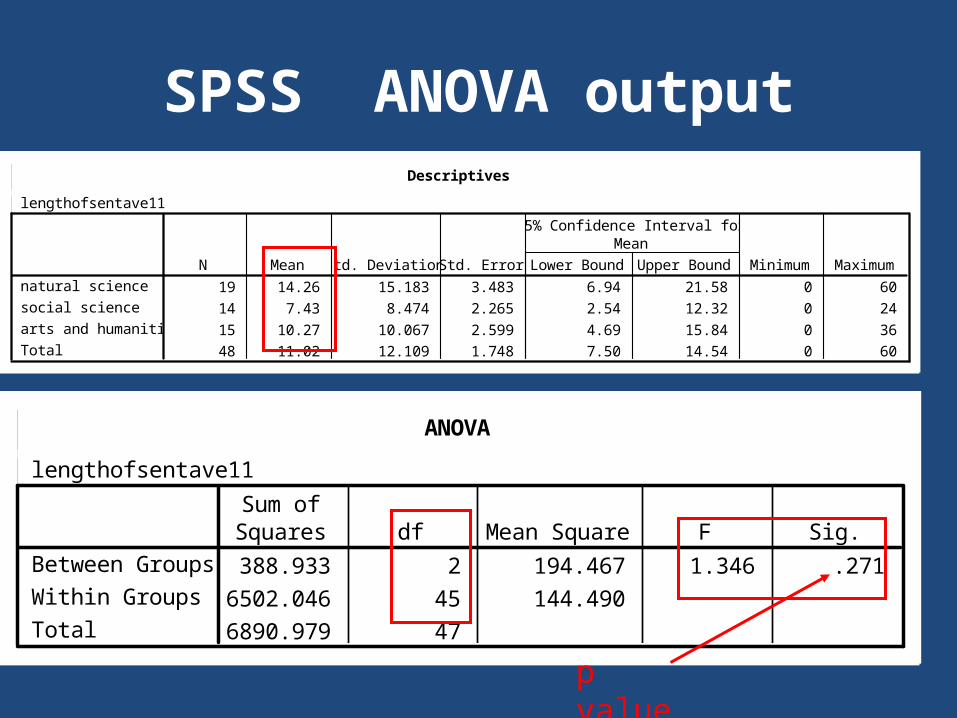
SPSS ANOVA output
Descriptives
lengthofsentave11
19 14.26 15.183 3.483 6.94 21.58 0 60
14 7.43 8.474 2.265 2.54 12.32 0 24
15 10.27 10.067 2.599 4.69 15.84 0 36
48 11.02 12.109 1.748 7.50 14.54 0 60
natural science
social science
arts and humanities
Total
N Mean Std. Deviation Std. Error Lower Bound Upper Bound
95% Confidence Interval forMean
Minimum Maximum
ANOVA
lengthofsentave11
388.933 2 194.467 1.346 .271
6502.046 45 144.490
6890.979 47
Between Groups
Within Groups
Total
Sum ofSquares df Mean Square F Sig.
SPSS ANOVA outputDescriptives
lengthofsentave11
19 14.26 15.183 3.483 6.94 21.58 0 60
14 7.43 8.474 2.265 2.54 12.32 0 24
15 10.27 10.067 2.599 4.69 15.84 0 36
48 11.02 12.109 1.748 7.50 14.54 0 60
natural science
social science
arts and humanities
Total
N Mean Std. Deviation Std. Error Lower Bound Upper Bound
95% Confidence Interval forMean
Minimum Maximum
ANOVA
lengthofsentave11
388.933 2 194.467 1.346 .271
6502.046 45 144.490
6890.979 47
Between Groups
Within Groups
Total
Sum ofSquares df Mean Square F Sig.
p value

Variables & Statistical TestsVariable Type Example Common Stat
Method
Nominal by nominal
Blood type by gender
Chi-square
Scale by nominal GPA by genderGPA by major
T-testAnalysis of Variance
Scale by scale Weight by heightGPA by SAT
RegressionCorrelation
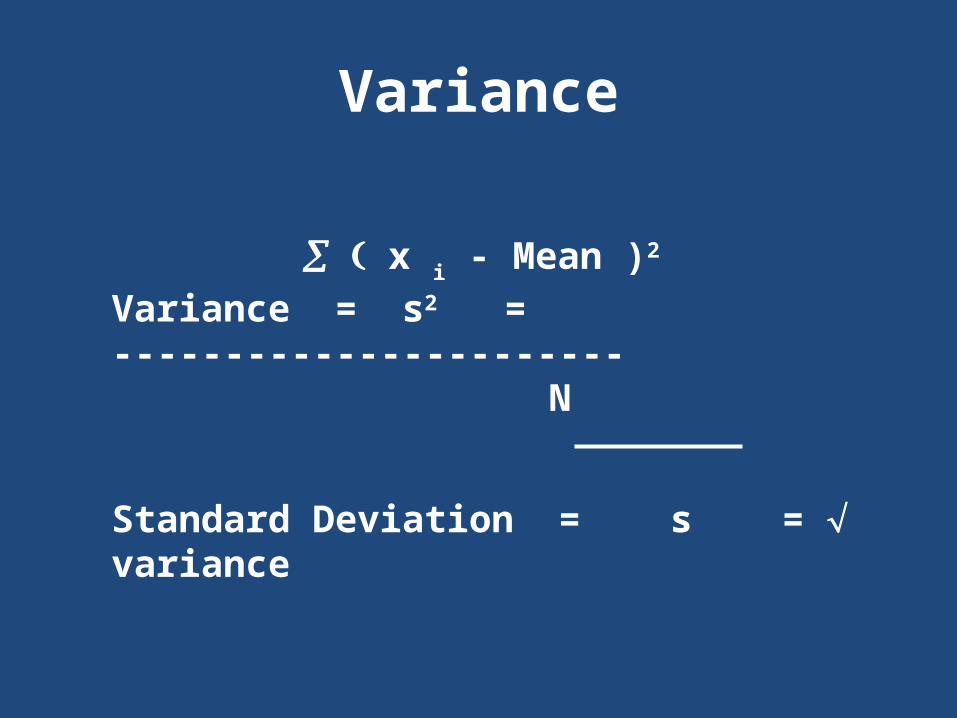
Variance
x i - Mean )2
Variance = s2 = ----------------------- N
Standard Deviation = s = variance

Regression line
W = 3.3 H - 73
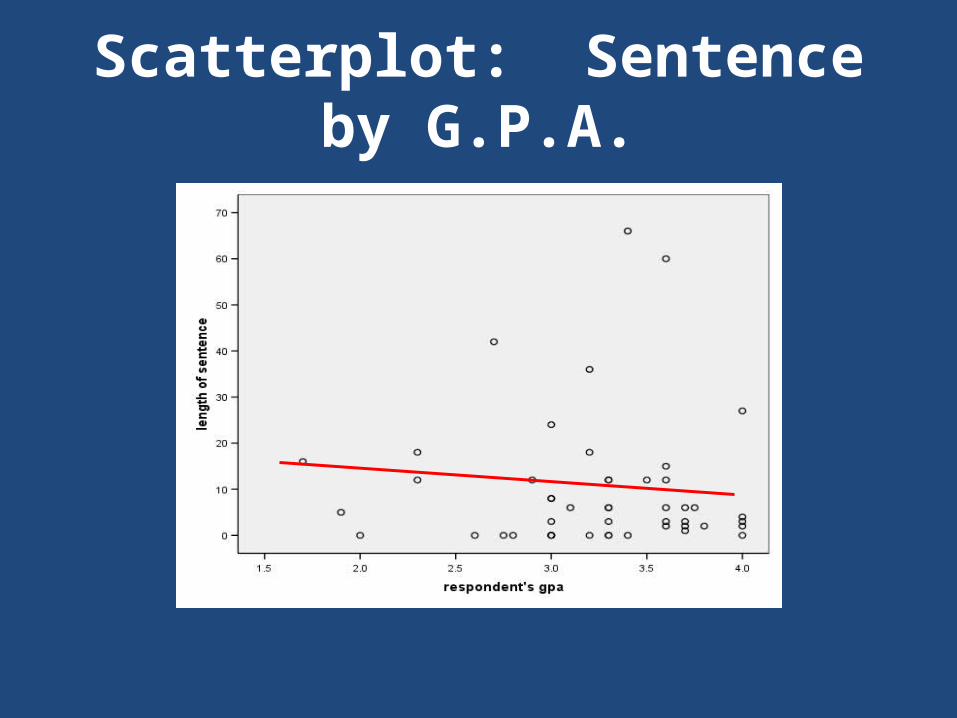
Scatterplot: Sentence by G.P.A.
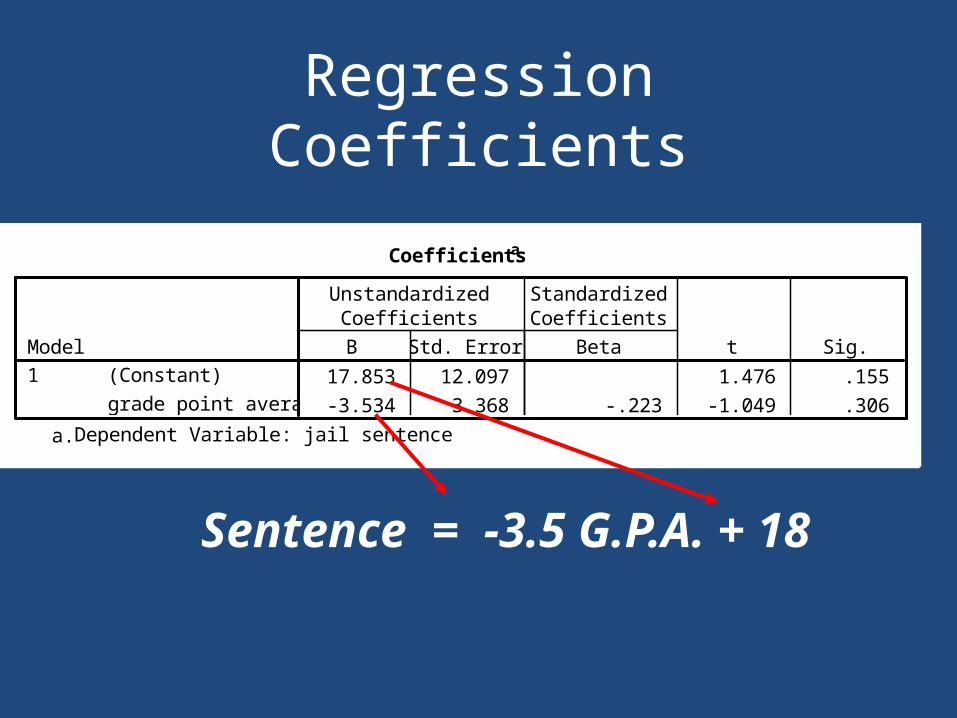
Regression Coefficients
Coefficientsa
17.853 12.097 1.476 .155
-3.534 3.368 -.223 -1.049 .306
(Constant)
grade point average
Model1
B Std. Error
UnstandardizedCoefficients
Beta
StandardizedCoefficients
t Sig.
Dependent Variable: jail sentencea.
Sentence = -3.5 G.P.A. + 18
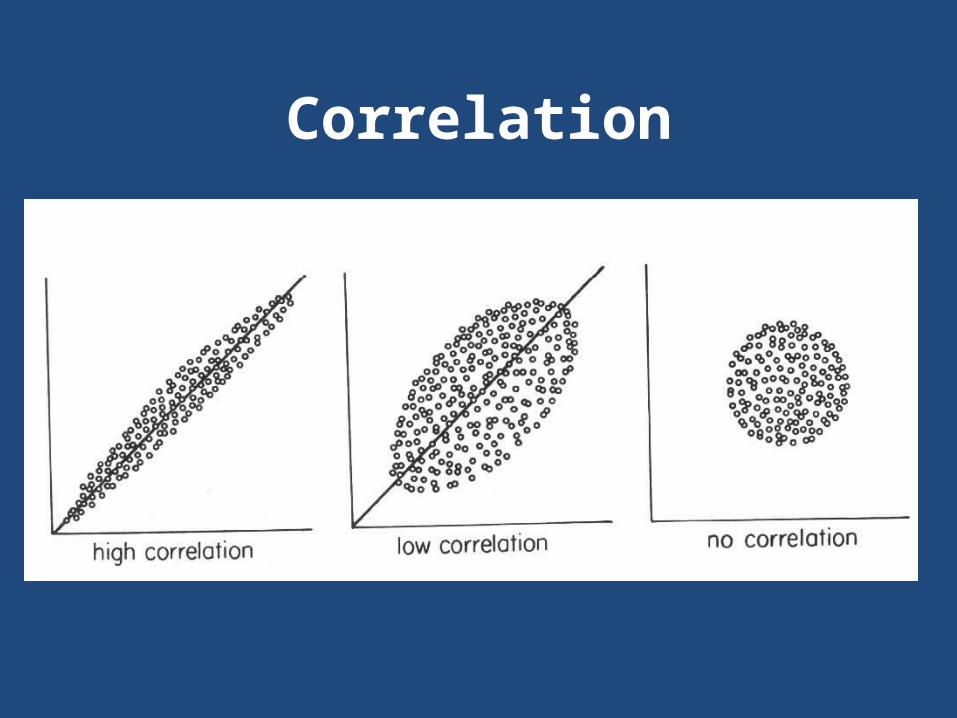
Correlation

Correlation: Sentence & G.P.A.
Correlations
1 -.223
. .306
23 23
-.223 1
.306 .
23 24
Pearson Correlation
Sig. (2-tailed)
N
Pearson Correlation
Sig. (2-tailed)
N
grade point average
jail sentence
grade pointaverage jail sentence

Correlation: Sentence & G.P.A.
Correlations
1 -.223
. .306
23 23
-.223 1
.306 .
23 24
Pearson Correlation
Sig. (2-tailed)
N
Pearson Correlation
Sig. (2-tailed)
N
grade point average
jail sentence
grade pointaverage jail sentence
p value

Interpreting r as r2
r = -.22 r2 = .05
G.P.A. “explains” 5% of variance in SENTENCE length
Correlation