statistika anglisht per shtyp - issh
TRANSCRIPT

The statistical book2016
INSTITUTI I SIGURIMEVE SHOQËRORE
SOCIAL INSURANCE INSTITUTE
Libri i statistikave
INSTITUTI I SIGURIMEVE SHOQËRORE
SOCIAL INSURANCE INSTITUTE2016

1
in million ALL
2013 2014 2015
Income from direct contributions 51,390 61,720 60,068
compulsory scheme 50,676 61,081 58,978
supplementary scheme 714 638 1,090
as percentage of GDP 3.80 4.41 4.16
Expenditure in total 95,597 101,498 107,309
benefit costs 79,632 85,296 88,904
special government programs 9,202 9,633 11,497
suppl scheme & special treatments 4,789 4,707 4,892
administrative costs 1,973 1,862 2,016
as percentage of GDP 7.08 7.25 7.43
-44,206 -39,778 -47,240
as percentage of GDP -3.27 -2.84 -3.27
GDP1)1,350,600 1,400,500 1,444,700
Financing of State Budget
(Income from contributions - Expenditure)
FINANCIAL SITUATION - TOTAL OF SCHEMES
Income - Income from direct contributions
Note:1) Source of information is the website of Ministry of Finance, CMD no. 80,
date 03.02.2016.
3.6 3.7 3.7 3.8
4.44.2
2010 2011 2012 2013 2014 2015
Income from direct contributions of SII as percentageof GDP

2
in million ALL
2013 2014 2015
Income from contributions in total 51,390 61,720 60,068compulsory scheme 50,676 61,081 58,978 collected from GTD1) 47,588 52,464 56,394 collected from SII 2) 3,088 8,617 2,585supplementary scheme 714 638 1,090
Contributions paid from State Budget (SB) 3) 9,552 6,751 5,794for special categories 4) 3,240 3,291 3,533for self-employed in agriculture 6,312 3,460 2,261
as percentage of GDP 0.60 0.71 0.48Financing of special programs from SB 14,945 13,509 15,661
special programs of government 9,507 9,519 11,561suppl scheme & special treatments 5,438 3,990 4,100
as percentage of GDP 1.11 0.96 1.08TOTAL OF INCOME 75,887 81,980 81,524as percentage of GDP 5.62 5.85 5.64
Expenditure in total 95,597 101,498 107,309benefit costs 79,632 85,296 88,904special government programs 9,202 9,633 11,497suppl scheme & special treatments 4,789 4,707 4,892administrative costs 1,973 1,862 2,016
TOTAL OF OUTCOME 95,597 101,498 107,309as percentage of GDP 7.08 7.25 7.43
-19,709 -19,518 -25,785
as percentage of GDP -1.46 -1.39 -1.78
Notes:1) GTD - General Tax Department2) SII - Social Insurance Institute3) Under article 9 of Law no 7703, date 11.05.1993, the state pays contributions for special groups determined by laws & CMDs, and this is considered insurance period.4) This group includes unemployed receiving unemployment benefit, persons receiving transitional payment, militaries under reform, underground workers, military industry workers, women retiring in relevant year.
FINANCIAL SITUATION - TOTAL OF SCHEMES
Income - Direct contributions, Contributions and Financings from State Budget
Subsidy to cover the difference (Income - Outcome)

3
in million ALL
2013 2014 2015
Income from contributions in total 51,390 61,720 60,068compulsory scheme 50,676 61,081 58,978 collected from GTD1) 47,588 52,464 56,394 collected from SII 2) 3,088 8,617 2,585supplementary scheme 714 638 1,090
Contributions paid from State Budget (SB) 3) 9,552 6,751 5,794for special categories 4) 3,240 3,291 3,533for self-employed in agriculture 6,312 3,460 2,261
as percentage of GDP 0.60 0.71 0.48Financing of special programs from SB 14,945 13,509 15,661
special programs of government 9,507 9,519 11,561suppl scheme & special treatments 5,438 3,990 4,100
as percentage of GDP 1.11 0.96 1.08TOTAL OF INCOME 75,887 81,980 81,524as percentage of GDP 5.62 5.85 5.64
Expenditure in total 95,597 101,498 107,309benefit costs 79,632 85,296 88,904special government programs 9,202 9,633 11,497suppl scheme & special treatments 4,789 4,707 4,892administrative costs 1,973 1,862 2,016
TOTAL OF OUTCOME 95,597 101,498 107,309as percentage of GDP 7.08 7.25 7.43
-19,709 -19,518 -25,785
as percentage of GDP -1.46 -1.39 -1.78
Notes:1) GTD - General Tax Department2) SII - Social Insurance Institute3) Under article 9 of Law no 7703, date 11.05.1993, the state pays contributions for special groups determined by laws & CMDs, and this is considered insurance period.4) This group includes unemployed receiving unemployment benefit, persons receiving transitional payment, militaries under reform, underground workers, military industry workers, women retiring in relevant year.
FINANCIAL SITUATION - TOTAL OF SCHEMES
Income - Direct contributions, Contributions and Financings from State Budget
Subsidy to cover the difference (Income - Outcome)
in million ALL
2013 2014 2015
Income from contributions in total 50,676 61,081 58,978
from of juridical & physical entities 47,588 52,464 56,394
from self-employed in agriculture 2,320 7,610 1,940
from voluntary scheme 342 425 435
other income 426 582 210
as percentage of GDP 3.75 4.36 4.08
Expenditure in total 90,807 96,791 102,417
benefit cost 79,632 85,296 88,904
sickness 410 393 331
maternity 2,334 2,536 2,490
pensions 76,877 82,357 86,071
employment injuries 11 10 12
as percentage of GDP 5.90 6.09 6.15
special government programs 9,202 9,633 11,497
as percentage of GDP 0.68 0.69 0.80
administrative cost 1,973 1,862 2,016
as percentage of GDP 0.15 0.13 0.14
as percentage of SII expenditure 2.1 1.8 1.9
Expenditure in total as percentage of GDP 6.72 6.91 7.09
-40,132 -35,709 -43,439
as percentage of GDP -2.97 -2.55 -3.01
FINANCIAL SITUATION - COMPULSORY SCHEME
Income - Income from direct contributions
Financing of State Budget
(Income from contributions - Expenditure)

4
in million ALL
2013 2014 2015
Income from contributions 714 638 1,090as percentage of GDP 0.05 0.05 0.05
Expenditure in total 4,789 4,707 4,892Supplementary schemes 3,954 3,802 3,887 state supplementary 718 891 1,001 military supplementary 2,986 2,678 2,695 police supplementary 251 232 191Special treatments 835 906 1,005 "national martyr" status 24 20 19 retired flying pilots 41 82 71 military enterprises workers 112 116 93 miners 435 441 522 retired submarine personnel 9 12 10
other supplementary insurance 143 149 180 "professor" status 71 86 109
as percentage of GDP 0.35 0.34 0.34
-4,075 -4,069 -3,802
as percentage of GDP -0.30 -0.29 -0.26
Income - Income from direct contributions
Financing of State Budget (Income from contributions - Expenditure)
FINANCIAL SITUATION - SUPPLEMENTARY SCHEME
state supplement.
20.5%
military supplement.
55.1%
police supplement.
3.9% special treatments
20.5%
Expenditure of supplementary scheme and special treatments in 2015
in million ALL
2013 2014 2015
9,202 9,633 11,497
Compensations 8,771 9,242 11,054 price compensations 3,830 3,918 4,336 urban 3,465 3,552 3,967 rural 365 367 369 compensations for minimum income 4,941 5,323 6,717 urban 4,233 4,637 6,084 rural 708 687 633Compensations as percentage of GDP 0.65 0.66 0.77
Social pension 99Special pensions 77 81 64Special categories1) 355 310 281
as percentage of GDP 0.68 0.69 0.80
Note:1) In "special categories" are included supplements for war invalids and veterans, the supplement due to work invalid status.
EXPENDITURE FOR SPECIAL GOVERNMENT PROGRAMS
Expenditure for special government programs
benefits 82.8%
special government
programs 10.7%
supplementary 4.6%
administra�ve 1.9%
Expenditure of SII in 2015

5
in million ALL
2013 2014 2015
Income from contributions 714 638 1,090as percentage of GDP 0.05 0.05 0.05
Expenditure in total 4,789 4,707 4,892Supplementary schemes 3,954 3,802 3,887 state supplementary 718 891 1,001 military supplementary 2,986 2,678 2,695 police supplementary 251 232 191Special treatments 835 906 1,005 "national martyr" status 24 20 19 retired flying pilots 41 82 71 military enterprises workers 112 116 93 miners 435 441 522 retired submarine personnel 9 12 10
other supplementary insurance 143 149 180 "professor" status 71 86 109
as percentage of GDP 0.35 0.34 0.34
-4,075 -4,069 -3,802
as percentage of GDP -0.30 -0.29 -0.26
Income - Income from direct contributions
Financing of State Budget (Income from contributions - Expenditure)
FINANCIAL SITUATION - SUPPLEMENTARY SCHEME
state supplement.
20.5%
military supplement.
55.1%
police supplement.
3.9% special treatments
20.5%
Expenditure of supplementary scheme and special treatments in 2015
in million ALL
2013 2014 2015
9,202 9,633 11,497
Compensations 8,771 9,242 11,054 price compensations 3,830 3,918 4,336 urban 3,465 3,552 3,967 rural 365 367 369 compensations for minimum income 4,941 5,323 6,717 urban 4,233 4,637 6,084 rural 708 687 633Compensations as percentage of GDP 0.65 0.66 0.77
Social pension 99Special pensions 77 81 64Special categories1) 355 310 281
as percentage of GDP 0.68 0.69 0.80
Note:1) In "special categories" are included supplements for war invalids and veterans, the supplement due to work invalid status.
EXPENDITURE FOR SPECIAL GOVERNMENT PROGRAMS
Expenditure for special government programs
benefits 82.8%
special government
programs 10.7%
supplementary 4.6%
administra�ve 1.9%
Expenditure of SII in 2015

6
number at the end of year
2013 2014 2015
Number of urban pensions 418,399 436,337 454,163
old-age 311,382 327,604 345,314
invalidity 59,241 61,200 62,101
survivors 47,776 47,533 46,748
Number of rural pensions 152,024 149,146 144,769
old-age 135,904 133,132 129,161
invalidity 7,229 7,579 7,763
survivors 8,891 8,435 7,845
Number of pensions in total 570,423 585,483 598,932
old-age 447,286 460,736 474,475
invalidity 66,470 68,779 69,864
survivors 56,667 55,968 54,593
NUMBER OF PENSIONS
Number of urban and rural pensions in yearsin percentage against total
70.7 71.3 72.2 73.3 74.5 75.8
29.3 28.7 27.8 26.7 25.5 24.2
2010 2011 2012 2013 2014 2015
rural
urban

7
female male total
213,196 240,967 454,163
old-age 167,734 177,580 345,314
invalidity 24,895 37,206 62,101
survivors 20,567 26,181 46,748
89,035 55,734 144,769
old-age 81,548 47,613 129,161
invalidity 3,400 4,363 7,763
survivors 4,087 3,758 7,845
302,231 296,701 598,932
old-age 249,282 225,193 474,475
invalidity 28,295 41,569 69,864
survivors 24,654 29,939 54,593
PENSIONERS BY GENDER IN 2015
number at the end of year
Urban pension
Rural pension
Pensioners in total
Pensioners by gender in 2015
46.961.5
50.5
53.138.5
49.5
urban pensions rural pensions pensions in total
male female

8
in persons
2013 2014 2015
Beneficiaries of special government programs
Compensations
price compensations 570,423 585,483 573,240
urban 418,399 436,337 428,471
rural 152,024 149,146 144,769
compensations for minimum income 405,915 419,560 414,657
urban 290,894 306,029 304,979
rural 115,021 113,531 109,678
Social pensions 1,775
Special pensions 258 244 286
Special categories1) 8,143 7,375 6,315
BENEFICIARIES OF
SPECIAL GOVERNMENT PROGRAMS
Pensioners benefitingcompensations for minimum income (in thousand)
Note:
1) In "special categories" are included persons benefiting supplements for war
invalids and veterans and supplements due to work invalid status.
270.2 274.6 279.9290.9 306.0
305.0
130.1 129.2 126.2 115.0 113.5 109.7
2010 2011 2012 2013 2014 2015
urban pensioners rural pensioners

9
in persons
.
2013 2014 2015
1,746 1,877 2,094
transitional payments 171 89 108
state supplementary pensions 1,575 1,788 1,986
23,839 24,116 24,833
early retirement pensions 12,155 10,849 10,532
military supplementary pensions 11,684 13,267 14,301
5,590 5,485 4,940
"national martyr" status 379 365 358
retired flying pilots 265 264 256
military enterprises workers 648 608 566
miners 3,620 3,535 2,989
retired submarine personnel 69 69 65
"professor" status 609 644 706
31,175 31,478 31,867
Note:
1) These treatments are transfers decided by special laws, and SII is charged to
calculate benefits and apply payment procedures. Direct payments are carried out by
Albanian Post.
Beneficiaries of supplementary scheme in
total
Beneficiaries of special treatment scheme1)
BENEFICIARIES OF SUPPLEMENTARY SCHEME
Beneficiaries of state supplementary
scheme
Beneficiaries of military supplementary
scheme
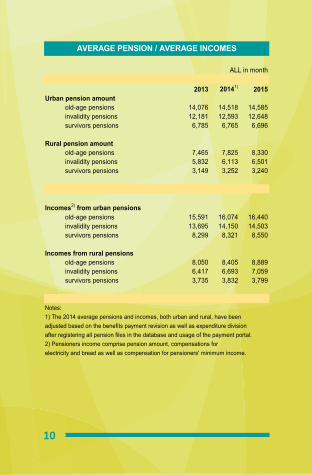
10
ALL in month
2013 20141)2015
Urban pension amount
old-age pensions 14,076 14,518 14,585
invalidity pensions 12,181 12,593 12,648
survivors pensions 6,785 6,765 6,696
Rural pension amount
old-age pensions 7,465 7,825 8,330
invalidity pensions 5,832 6,113 6,501
survivors pensions 3,149 3,252 3,240
Incomes2) from urban pensions
old-age pensions 15,591 16,074 16,440
invalidity pensions 13,695 14,150 14,503
survivors pensions 8,299 8,321 8,550
Incomes from rural pensions
old-age pensions 8,050 8,405 8,889
invalidity pensions 6,417 6,693 7,059
survivors pensions 3,735 3,832 3,799
Notes:
1) The 2014 average pensions and incomes, both urban and rural, have been
adjusted based on the benefits payment revision as well as expenditure division
after registering all pension files in the database and usage of the payment portal.
2) Pensioners income comprise pension amount, compensations for
electricity and bread as well as compensation for pensioners' minimum income.
AVERAGE PENSION / AVERAGE INCOMES

11
2013 20142)2015
For urban pensions
old-age pensions 37.9 38.9 37.5
invalidity pensions 32.8 33.7 32.6
survivors pensions 18.3 18.1 17.2
For rural pensions
old-age pensions 40.1 40.8 37.9
invalidity pensions 31.4 31.9 29.5
survivors pensions 16.9 17.0 14.7
For incomes from urban pensions
old-age pensions 42.0 43.1 42.3
invalidity pensions 36.9 37.9 37.3
survivors pensions 22.3 22.3 22.0
For incomes from rural pensions
old-age pensions 43.3 43.8 40.4
invalidity pensions 34.5 34.9 32.1
survivors pensions 20.1 20.0 17.3
REPLACEMENT RATE1)
39.5 39.9 40.7 42.0 43.1 42.3
Replacement rate for urbanold-age pensions in years
Note:
1) Pension (income) replacement rate is calculated as a ratio of average
pension (average income) to average wage.
2) Due to revising the urban and rural average old-age pension and income in 2014,
the replacement rate changes as well.
34.9 35.6 36.5 37.9 38.937.5
39.5 39.9 40.7 42.0 43.1 42.3
2010 2011 2012 2013 2014 2015
for pensions
for incomes from pensions

12
in persons
2013 2014 2015
By entities 510,747 608,519 668,614
public 158,039 159,203 145,746
private companies 201,270 226,886 321,023
self-employed 80,050 86,168 104,686
self-employed in agriculture 64,274 127,728 89,527
voluntarily insured 7,114 8,534 7,632
Insured by State 36,928 32,789 34,125
unemployed in unemploym. payment 13,003 11,304 8,016
women retiring in relevant year 7,156 5,331 11,506
other categories1)16,770 16,153 14,603
With short-term benefit 13,494 13,255 15,331
Contributors in total 561,169 654,563 718,070
CONTRIBUTORS OF COMPULSORY SCHEME
Number of contributors in years(in thousand)
Note:
1) Here are included persons receiving transitional payment, militaries under
reform, underground workers, military industry workers.
548.0 562.1 549.7 561.2654.6
718.1
2010 2011 2012 2013 2014 2015
(in thousand)

13
2013 2014 2015
System Dependency Rate 0.98
for pensioners in total 1.02 0.89 0.83 1.25
urban 0.84 0.83 0.72
rural 2.37 1.17 1.62
System Dependency Rate
for old-age pensioners 0.80 0.70 0.66
urban 0.63 0.62 0.55 2010
rural 2.11 1.04 1.44 NVS 0.99
Number of contributors per 1 pensioner
for pensioners in total 0.98 : 1 1.12 : 1 1.2 : 1
for old-age pensioners 1.25 : 1 1.42 : 1 1.51 : 1
SYSTEM DEPENDENCY RATE SDR1)
(Pensioners / Contributors)
Ratio Contributors / Pensioners
System Dependency Rate in years
Notes:
1) SDR is calculated as a ratio between number of pensioners to contributors
at the end of year.
0.99 0.98 1.01 1.020.89 0.83
2010 2011 2012 2013 2014 2015

14
in persons
2013 2014 2015
New urban pensions 32,570 35,148 35,591
old-age 23,702 27,206 28,987
old-age 23,162 26,667 28,616
reduced old-age 540 539 371
invalidity 6,373 5,650 4,580
survivors 2,495 2,292 2,024
New rural pensions 3,479 3,924 1,849
old-age 2,449 2,760 1,003
invalidity 703 841 685
survivors 327 323 161
Number of new pensions in total 36,049 39,072 37,440
NUMBER OF NEW PENSIONS
60.9 58.1 52.9 55.1 53.9 53.5
New old-age pensions by gender in percentageagainst total
39.1 41.9 47.1 44.9 46.1 46.5
60.9 58.1 52.9 55.1 53.9 53.5
2010 2011 2012 2013 2014 2015female male

15
2013 2014 2015
For old-age pensioners in total
total 62.1 62.3 62.4
male 65.0 65.0 65.0
female 59.8 59.9 60.2
For urban old-age pensioners
total 62.3 62.4 62.4
male 64.9 65.0 65.0
female 60.0 60.0 60.2
For rural old-age pensioners
total 60.3 60.6
male 65.3 65.3
female 58.0 58.5
Legal retirement age
category I
male 59 / 60 60 / 60.5 61.0
female 54 / 55 55 / 55.5 56.0
category II
male 64.5 / 65 65.0 65.0
female 59.5 / 60 60.0 60 V 2 M
category III
male 65.0 65.0 65.0
AVERAGE RETIREMENT AGE OF NEW OLD-AGE
PENSIONS OF CURRENT YEAR1)
male 65.0 65.0 65.0
female 60.0 60.0 60 V 2 M
Note:
1) New pensions, awarded and reported at current year, which have met eligibility
conditions the same current year are considered new pensions of current year.
With regard to 2015, based on the new social insurance law, urban and rural
pensions are unified. The new pensions assigned under the new law will all be
considered urban pensions.
61.461.8
62.4 62.3 62.4 62.4
58.8 58.7
59.4
60.3 60.6
2010 2011 2012 2013 2014 2015
Average retirement age of new old-age pensions ofcurrent year
urban pensioners
rural pensioners

16
in years
2013 2014 2015
For urban pensions
old-age pensions in total 33.3 33.3 32.3
male 35.8 35.7 35.0
female 31.2 31.0 29.9
invalidity pensions in total 20.2 18.7 23.5
male 21.3 19.3 24.7
female 18.4 17.6 21.6
For rural pensions
old-age pensions in total 26.7 25.6
male 27.9 27.8
female 26.1 24.7
invalidity pensions in total 11.5 11.1
male 13.2 12.9
female 9.9 8.9
CONTRIBUTORY PERIOD RELATED TO NEW PENSIONS
OF CURRENT YEAR
Contributory period related to new
33.7 34.1 33.9 33.3 33.3 32.3
29.8 29.5 28.226.7 25.6
2010 2011 2012 2013 2014 2015
Contributory period related to newold-age pensions of current year
urban pensioners
rural pensioners

17
ALL in month
2013 2014 2015
Urban pension amount
old-age pensions 13,000 13,611 14,639
invalidity pensions 11,995 11,756 14,193
survivors pensions 6,412 6,558 6,954
Rural pension amount
old-age pensions 7,561 7,551
invalidity pensions 5,700 5,642
survivors pensions 3,166 3,180
Incomes from urban pensions
old-age pensions 14,538 15,117 14,639
invalidity pensions 13,191 12,901 14,193
survivors pensions 7,535 7,669 6,954
Incomes from rural pensions
old-age pensions 8,020 8,024
invalidity pensions 6,336 6,281
survivors pensions 3,652 3,665
AVERAGE PENSION / AVERAGE INCOME FOR NEW
PENSIONS OF CURRENT YEAR

18
2013 2014 2015
For urban pensions
old-age pensions 35.0 36.5 37.7
invalidity pensions 32.3 31.5 36.5
survivors pensions 17.3 17.6 17.9
For rural pensions
old-age pensions 40.7 39.4
invalidity pensions 30.6 29.4
survivors pensions 17.0 16.6
For incomes from urban pensions
old-age pensions 39.1 40.5 37.7
invalidity pensions 35.5 34.6 36.5
survivors pensions 20.3 20.5 17.9
For incomes from rural pensions
old-age pensions 43.1 41.8
invalidity pensions 34.1 32.7
survivors pensions 19.6 19.1
REPLACEMENT RATE
FOR NEW PENSIONS OF CURRENT YEAR
Replacement rate for new old-age pensions ofcurrent year
35.035.9
34.9 35.0
36.5
37.7
39.3
40.1
39.1 39.1
40.5
2010 2011 2012 2013 2014 2015
current year
for pensions
for income from pensions

19
in days
2013 2014 2015
Average time term needed to process pension application
by pensions categories:
pensions in total
old-age 30.1 23.5 23.0
invalidity 48.2 42.0 38.7
survivors 32.5 22.4 23.5
urban pensions
old-age 29.9 23.5 23.0
invalidity 48.5 42.1 38.7
survivors 32.4 22.5 23.5
rural pensionsold-age 31.9 24.2
invalidity 45.1 41.4
survivors 33.6 21.5
Maximum deadline to process pension appl. 45 45 45
AVERAGE TIME TERM NEEDED TO PROCESS PENSION
APPLICATIONS OF CURRENT YEAR
Average time term needed to process old-age
38.6
22.428.6
29.923.5
23.033.922.6
31.231.9
24.2
2010 2011 2012 2013 2014 2015
Average time term needed to process old-agepension applications of current year
urban pensions
rural pensions
maximum deadline

20
2013 2014 2015Average period of benefiting pension
by gender:pensions in total
total 21.4 21.8 22.3male 19.2 19.5 19.8female 24.2 25.0 25.3
urban pensionstotal 21.1 21.5 21.7male 19.3 19.4 19.7female 24.3 24.9 25.0
rural pensionstotal 21.9 22.7 23.5male 19.0 19.7 20.3female 24.2 25.1 25.9
AVERAGE PERIOD OF BENEFITING PENSION
18.8 18.6 19.1 19.2 19.5 19.8
23.2 23.7 24.1 24.2 25.0 25.3
2010 2011 2012 2013 2014 2015
Average period of benefiting old-age pensions by gender in years
male female