status of agriculture in bihar - bameti status of agriculture in bihar 2.1 introduction bihar has a...
TRANSCRIPT

12
STATUS OF AGRICULTURE IN BIHAR
2.1 Introduction
Bihar has a total geographical area of 93.60 lakh hectares on which it houses a population of 82.9
million, thereby generating a population density of 880 persons per sq. km (Census 2001). Gross
sown area in theState is 79.46 lakh hectares, while net sown area is 56.03 lakh hectares. There are
around 1.04 crore landholdings in the State of which around 83 percent are marginal holdings of
size less than 1 hectare( Table 2.1). With around 90 percent of the total population living in rural
areas, agriculture as the primary feeder of rural economy continues to operate not only on margins
of land but also on the margins of human enterprise, its productivity being among the lowest in the
country. Without increasing returns to these margins, not much can be done realistically to
develop the agricultural sector. Thus, agriculture continues to define both the potentialities and
constraints to development in Bihar.
Table 2.1 : Distribution of Holdings by Size Class
Category of farmers No. of Holdings Operational holding (In Ha.)
Marginal (0-1Ha.) 86,45,932 (82.9%) 27,87,789 (40.8%)
Small (1-2 Ha.) 10,05,650 (9.6%) 13,00,667 (19.0%)
Semi medium (2-4 Ha.) 5,90,970 (5.7%) 15,82,279 (23.1%)
Medium (4-10 Ha.) 1,78,295 (1.7%) 9,75,355 (14.3%)
Large (10-above Ha.) 11,570 (0.1%) 1,93,760 (2.8%)
Total 1,04,32,417 (100%) 68,39,850 (100%)
Source : Agricultural Census Division, Ministry of Agriculture, New Delhi

13
Percentage Distribution of Landholdings by Size Class
82%
10%
6%
2%
0%
Marginal (0-1Ha.) Small (1-2 Ha.) Semi medium (2-4 Ha.)Medium (4-10 Ha.) Large (10-above Ha.)
Agriculture in Bihar is crucially dependent on monsoon. Although around 57 percent of its gross
cultivated area is irrigated, irrigation itself is crucially dependent on monsoon as it largely depends
on the use of surface water. According to the soil quality and climatic conditions of the relevant
areas, Bihar has been classified in 3 agro-climatic zones : North-West Alluvial Plane ( Zone1),
North-East Alluvial Plane ( Zone 2), and South Alluvial Plane (Zone 3), the last zone being
further classified in two sub-zones 3A and 3B ( Table 2.2). Monsoon arrives earliest in the north-
eastern Zone2, which also receives the highest rainfall among all three zones. Zone 3 receives
monsoon showers last of all three zones and also the least amount. Total irrigated area in the State
is 45.67 lakh hectares, of which nearly 30 percent is fed by canal water. This highlights the
monsoon dependence of even irrigated lands as catchment areas of nearly all the major rivers in
the State are outside the state.
2.2 Agricultural Production in 2006-07
Kharif 2006 started with a probability of a normal rainfall, but the deviation for the first showers
of the monsoon was (-)48 percent. Rainfall in the month of June and July was normal, but was
again below normal by 57 percent in August. It was again normal in the month of September.
Finally, rainfall was 19 per cent below normal for the entire monsoon. This seems to have
adversely affected area under cultivation. Area under paddy in the State according to the second
advance estimate for kharif 2006 was 31.30 lakh hectares (Table 2.3) against the target of 37.00

14
lakh hectares (Table 2.4). Similarly, area under wheat for rabi 2006 stood at 20.34 lakh hectares,
falling short of a target of 24.00 lakh hectares. Thus, there has been a fall in the area under
foodgrains from 65.48 lakh hectares in 2005-06 to 61.55 lakh hectares in 2006-07 (Table 2.5).
Under the conditions of deficient rainfall and a fall in acreage, foodgrain output is expected to
register a fall over the figures for 2005-06. The second advance estimate of foodgrains for 2006-
07 is 82.10 lakh MT. For kharif 2006-07 foodgrain production has been estimated at 40.04 lakh
MT over an area at 34.83 lakh hectares. For rabi 2006-07, the estimate of foodgrain production is
of 42.06 lakh MT over an area of 26.73 lakh hectares. This is a fall of around 4 lakh MT from
previous year’s production of around 86 lakh MT. Effect of falling acreage on production of
foodgrains has, however, been moderated by an increase in yield from 12.39 qnts/hectare in 2005-
06 to 13.34 qntls/hectare in 2006-07 (Table 2.6).
Cereal production is expected to fall by almost 3 lakh MT to 78 lakh MT as compared to previous
year’s production of 81 lakh MT(Table 2.7). This fall largely comes from a fall in acreage under
cereals by almost 9 lakh hectares. Within cereals, fall in production is largely caused by fall in
maize output by almost around 4 lakh MT. Other coarse cereals too are estimated to register a
marginal fall in, both, acreage and production. While both rice and wheat are estimated to suffer a
minor fall in acreage, their production is likely to improve over previous year due to increase in
productivity (Table 2.5).
Production of pulses too is expected to fall marginally by 0.75 lakh MT in 2006-07 despite an
increase in productivity. This is because of a substantive fall in the area under pulses by around 2
lakh hectares as compared to previous year. Oilseed production is expected to suffer a marginal
fall from 1.19 lakh MT in 2005-06 to 1.11 lakh MT in 2006-07 due to marginal fall in both
acreage and productivity. Sugarcane has been planted on an area of 1.43 lakh hectares and its
ouput is estimated to be 12.33 lakh MT.

15
Table 2.2 : Agro-Climatic Zones in Bihar
Agro climatic Zones Districts Soil Ph
Initiation/Cessation of rainfall
Total Rainfall
(mm)
Temperature ( dg. Celcius)
Important Cropping Sequence
Maximum
Minimum
Zone-1 (North west alluvial plane zone- Pusa)
Saran, Siwan, Gopalganj, E.Champaran, W.Champaran, Sheohar, Sitamarhi, Madhubani, Darbhanga, Muzzafarpur, Vaishali, Samastipur, Begusarai
Sandy loam, loam
6.5 – 8.4
12th June/ 30th Sep to 10th Oct
1040 – 1450 (1245.00)
36.6 7.7 Rice – Wheat, Rice-Rai, Rice-Sweet Poatato, Rice-Maize(Rabi), Maize-Wheat, Maize-Sweet Potato, Maize-Rai, Rice-lentil
Zone-2 (North-East Alluvial Plane zone- Purnea)
Supaul, Khagaria, Saharsa, Madhepura, Purnea, Katihar, Kishanganj, Araria, Naugachia.
Sandy loam, Clay loam
6.5 – 7.8
7th June/30th Sep to 10th Oct
1200 – 1700 ( 1450.00)
33.8 8.8 Jute-Rice, Jute-Wheat, Jute-Potato, Jute-Kalai, Jute-Mustard, Rice-Wheat-Moong, Rice-Toria
Zone 3 Sandy loam, Clay loam, loam, Clay
6.8 – 8.0
990 – 1240 (1115.00)
37.1 7.8 Rice-Wheat, Rice-Gram, Rice-Lentil, Rice-Rai
Zone-3A (South Alluvial Plane Zone- Sabour)
Sheikhpura, Lakhisarai, Jamui, Banka, Munger and Bhagalpur
15th June/30th Sep to 10th Oct
Zone-3B (South Alluvial Plane Zone – Sabour)
Bhabhua, Rohtas, Aurangabad, Buxar, Bhojpur, Jehanabad, Gaya, Nalanda, Patna, Nawada
10th June/ 30th Sep to 10th Oct

16
Table 2.3 : Second Advance Estimates of Area and Production of Crops for 2006-07
Source : Statistics and Evaluation Dept., GOB
Area ( 000, hectares) Production ( 000, tones ) Yield (kg/hectare) Kharif Rabi Total Kharif Rabi Total Kharif Rabi Total
1 2 3 4 5 6 7 8 9 10 Rice 3130.905 3130.905 3527.822 3527.822 1127 1127
Wheat - 2034.305 2034.305 - 3238.614 3238.614 - 1592 1592
Jawar 5,870 - 5,870 5,958 - 5,958 1015 - 1015
Bajra 4,039 - 4,039 4,310 - 4,310 1067 - 1067
Maize 268,015 200,124 468,139 411,913 580.76 992.673 1537 2902 2120
Ragi 16.011 - 16.011 11.560 - 11.560 722 - 722
Small Millets 4,246 - 4,246 3,172 - 3,172 747 - 747
Barley - 18,709 18,709 - 21,066 21,066 1126 - 1126
Coarse Cereals
298.181 218.138 517.014 436.913 601.826 1038.739 1465 2750 2009
Cereals 3429.086 2253.138 5682.204 3964.735 3840.440 7805.175 1156 1704 1374
Tur - 35.814 35.814 - 46.845 46.845 - 1308 1308
Urad 28.415 - 28.415 21.340 - 21.340 751 - 751
Moong 10.873 - 10.873 6.132 - 6.132 564 - 564
Other Kharif Pulses
14.900 - 14.900 11.86 - 11.860 796 - 796
Gram - 71.989 71.989 - 65.006 65.006 903 - 903
Other Rabi Pulses
- 311.704 311.704 - 253.834 253.834 - 815 815
Total Pulses 54.188 419.507 473.695 39.332 365.685 405.017 726 871 855
Total food Grains
3483.274 2672.645 6155.919 4004.067 4206.125 8210.192 11.50 15.74 13.34
Ground Nut 0.716 - 0.716 0.354 - 0.354 494 - 494
Castor Seed - 0.133 0.133 - 0.127 0.127 - 957 957
Sesamum 3.635 - 3.635 2.824 - 2.824 777 - 777
Niger Seed - - - - - - - - -
Sun Flower 2.604 6.047 8.651 3.573 8.871 12.444 1372 1467 1438
Soyabean - - - - - - - - -
Rapeseed and Mustard
- 83.021 83.021 - 68.658 68.658 - 827 827
Lin Seed - 30.665 30.665 - 25.973 25.973 - 847 847
Safflower 2.604 6.047 8.651 3.573 8.871 12.444 1372 1467 1438
Total oil seeds
6.955 120.073 127.028 6.751 103.795 110.546 971 864 870
Cotton* - - - - - - - - -
Jute* 127.847 - 127.847 1191.963 - 1191.963 1678 - 1678
Mesta 12.990 - 12.990 118.357 - 118.357 1640 - 1640
Jute and Mesta
- - - - - - - - -
Sugarcane 103.115 - 103.115 4131.509 - 4131.509 40067 - 40067
Onion 14.863 - 14.863 123.66 - 123.660 8.32 8.32
Potato 52.580 90.535 143.115 421.692 811.194 1232.886 8.02 8.96 8.61

17
Table 2.4 : Target area and Production of crops for 2006-07 (Area-lakh hectares/Production-lakh MT)
Kharif Rabi Total
Name of Crop Area Production Area Production Area Production
Rice 37.00 68.00 2.50 6.00 39.50 74.00
Wheat 00 00 24.00 58.00 24.00 58.00
Maize 4.00 6.95 6.00 19.00 10.00 25.95
Other Coarse Cereals 0.75 0.75 0.50 0.50 1.25 1.25
Pulses 2.50 2.30 8.50 9.00 11.00 11.30
Total Foodgrains 44.25 78.00 41.50 92.50 85.75 170.50
Oilseeds 0.25 0.18 3.56 2.90 3.81 3.08
Source : Agriculture Dept., GOB
2.3 Longterm Trend In Foodgrains Production
Foodgrain production in Bihar has shown high volatility, but there is a long-term trend of falling
production in the State. Cereal production has fallen sharply from 122.29 lakh MT in 2001-02 to
81.12 lakh MT in 2005-06( Table 2.7). This fall in production has been accompanied by an almost
secular decline in area under cereal production from 70.19 lakh hectares in 1990-91 to 65.87 lakh
hectares in 2006-07. Larger part of the fall in production and area is explained by the fall in
production of and area under rice (Table2.5). Though production of wheat too has fallen, but area
under it has largely been unchanged around 20 lakh hectares. Fall in production of wheat been due
to its falling yield. While it’s yield in the later half of nineties hovered around 22 qtls/hect, it has
steadily fallen thereafter, reaching 21.46 qtls/hect in 2000-01 and still lower at 13.94 qtls/hect in
2005-06 ( Table 2.5). Pulses too have seen a fall in production and acreage, but the fall has been
moderate. Their production has fallen from 5.47 lakh MT in 2001-02 to 4.83 lakh MT in 2005-06,
with acreage falling in the corresponding period from 6.94 lakh hectares to 6.55 lakh hectares.
While there has been a marginal fall in the productivity of pulses, but their yield rates have
remained significantly above the national average. Acreage and production of coarse cereals have
largely been unchanged over the last few years. For maize, there has been a rise in production
from around 12 lakh MT in late nineties to nearly 15 lakh MT in 2005-06, with almost unchanged
acreage and rising productivity, from around 20 qtls/hect to 23 qtls/hect over the same period.

18
Acreage and production of oilseeds has more or less hovered around 1.4 lakh hectares and 1.2 lakh
MT in recent years with moderate fluctuations.
The falling trend in production and acreage of cereals has been further aggravated by deficient
rainfall in 2006-07. Total cereal production is estimated to be 78.05 lakh MT, which is around 3
lakh MT less than the production figure for 2005-06 (Table 2.5). For kharif 2006-07, cereal
production has been estimated at 39.64 lakh MT over an area at 34.29 lakh hectares. For rabi
2006-07, the estimate of cereal production is of 38.40 lakh MT over an area of 22.53 lakh
hectares. The fall in production has been largely on account of fall in area from 65.87 lakh
hectares in 2005-06 to 56.82 lakh hectares in 2006-07. The second advance estimates for 2006-07
have put the production figures for coarse cereals at 10.38 lakh MT on an area of 5.17 lakh
hectares and an yield of 20.09 quintals/hectare. Production of pulses has been estimated at 4.05
lakh MT and that of oilseeds at 1.11 lakh MT. Estimates put the area under sugarcane cultivation
at 1.43 lakh hectares with an output of 12.33 lakh MT.
The observed trend of fall in acreage and production of cereals, it might be noted is not incidental.
There has been a deliberate effort by the State government during the last five years, to divert land
under rice and wheat cultivation towards horticulture. Plan of crop diversion has been given
priority in 12 districts of the state. About 30 percent of area under wheat in the districts of
Muzaffarpur, Darbhanga, Samastipur and Madhubani (Zone 1 districts) is being considered for
diversion towards mango, litchi and makhana. Similarly 20 percent of crop area in the districts of
East Champaran, Samastipur, Khagaria, Muzaffarpur and Vaishali is being considered for
diversion towards banana. Further, about 20 percent of rice-wheat area in the districts of Buxar,
Bhojpur, Sasaram etc. is likewise being considered for diversion towards vegetable production.
Finally, about 30 percent total area of the state is being considered for diversion from current
crops towards new crops.

19
Table 2.5 : Area, Production & Productivity of Foodgrains and Oilseed
Rice Wheat Maize Other coarse cereal Pulses Total
cereals Oilseeds Year 1996 – 1997
Area 36.44 20.33 6.80 0.85 7.60 71.92 1.62 Production 58.12 44.70 15.20 0.97 6.35 125.34 1.11 Yield 15.95 22.09 22.35 11.41 8.35 17.43 6.85 National Yield 18.82 26.79 17.20 10.72 6.35 16.14 9.26
Year 1997 – 1998 Area 36.21 20.09 6.09 0.78 7.52 70.69 1.65 Production 53.95 39.39 12.01 0.75 5.48 111.59 1.21 Yield 14.90 19.61 19.72 9.57 7.29 15.78 7.35 National Yield 19.00 24.85 17.11 9.86 5.67 15.52 8.16
Year 1998 – 1999 Area 36.39 20.53 6.19 0.68 7.35 71.14 1.77 Production 52.91 42.92 12.09 0.73 6.69 115.34 1.51 Yield 14.54 20.91 19.53 10.74 9.10 16.21 8.53 National Yield 19.21 25.90 17.57 10.68 6.34 16.27 9.44
Year 1999 – 2000 Area 35.96 20.81 6.38 0.64 7.22 71.01 1.57 Production 55.47 45.84 14.27 0.69 6.20 122.46 1.15 Yield 15.43 22.03 22.37 10.78 8.59 17.24 7.32 National Yield 19.86 27.78 17.92 10.34 6.35 17.04 8.53
Year 2000 – 2001 Area 36.56 20.68 6.21 0.56 7.17 71.18 1.54 Production 54.44 44.36 14.97 0.58 6.22 120.59 1.31 Yield 14.89 21.46 24.11 10.37 8.67 16.94 8.51 National Yield 19.01 27.08 18.22 10.27 5.44 16.26 8.10
Year 2001 – 2002 Area 35.52 21.23 5.94 0.53 6.94 70.19 1.39 Production 52.03 43.91 14.88 0.53 5.47 116.82 1.17 Yield 14.65 20.68 25.05 10.00 7.88 16.64 8.41 National Yield 20.79 27.62 20.00 11.31 6.07 17.34 9.13
Year 2002 – 2003 Area 35.85 21.31 6.04 0.53 6.98 70.69 1.37 Production 50.86 40.41 13.50 0.48 5.61 110.85 1.05 Yield 14.19 18.96 22.35 9.06 8.04 15.68 7.66 National Yield 18.04 26.19 16.42 9.62 5.56 15.62 7.10
Year 2003 – 2004 Area 35.78 20.77 6.16 0.47 6.80 69.98 1.41 Production 54.48 36.89 14.74 0.43 5.57 112.11 1.24 Yield 15.23 17.61 23.93 9.15 8.19 16.02 8.79 National Yield 20.50 27.07 19.83 12.28 6.23 17.07 10.72
Year 2004 – 2005 (last forecast) Area 31.23 20.28 6.14 0.44 6.58 64.67 1.32 Production 24.72 32.63 14.66 0.39 4.67 77.07 1.17 Yield 7.91 16.09 23.88 8.86 7.09 11.92 8.66
Year 2005 – 2006 (4th advance estimate) Area 32.22 20.38 6.22 0.51 6.55 65.87 1.36 Production 34.17 28.40 14.25 0.48 4.83 81.12 1.19 Yield 10.60 13.94 22.92 9.41 7.37 12.47 8.73 Year 2006-07 ( 2nd advance estimates) Area 31.31 20.34 4.68 0.49 4.73 56.82 1.27 Production 35.28 32.39 9.93 0.46 4.05 78.05 1.11 yield 11.27 15.92 21.20 9.38 8.55 13.74 8.70 Note : Area in lakh hectare, production in lakh MT and yield rates in qtls/hectare Source : Statistics and Evaluation Dept., GOB

20
Table 2.6 : Productivity of Different Crops ( Quintals / hectare)
Year Rice Wheat Maize Pulses Oilseeds
State National State Nation
al State National State Nation
al State National
1992-93 14.15 18.88 21.30 23.80 21.50 16.02 7.09 5.98 7.05 7.99 1993-94 13.52 19.11 21.08 25.59 20.61 15.70 7.38 6.10 7.07 8.43 1994-95 12.18 17.97 20.06 24.83 20.14 15.95 6.15 5.52 6.84 8.51 1995-96 15.95 18.82 22.09 26.79 22.35 17.20 8.35 6.35 6.35 9.26 1996-97 14.90 19.00 19.61 24.85 19.72 17.11 7.29 5.67 7.38 8.16 1997-98 14.54 19.21 20.91 25.90 19.54 17.97 9.10 6.34 8.55 9.44 1998-99 15.43 19.86 22.03 27.78 22.37 17.92 7.96 6.35 7.32 8.53 2000-2001 14.89 19.01 21.73 27.08 24.54 18.22 8.35 5.44 7.44 8.10 2001-02 14.65 20.79 20.65 27.62 25.04 20.10 7.88 6.07 8.41 9.13 2002-03 14.19 18.04 18.96 26.19 22.35 16.42 8.04 5.56 7.66 7.10 2003-04 15.23 20.51 17.61 27.07 23.93 19.83 8.19 6.23 8.79 10.72 2004-05 7.91 - 16.09 - 23.88 - 7.09 - 8.86 -
2005-06 10.6 - 13.94 - 22.92 - 7.37 - 8.7 -
2006-07 11.27 - 15.92 - 21.20 - 8.55 8.73
Source : Statistics and Evalutation Dept., GOB
Table 2.7 : Trends In Cereal Production
Sl. No.
Year Area
(in lakh hect.) Production (lakh MT)
Productivity (Qtls/Hect.)
1 1950 – 1951 96.71 44.42 4.53
2 1960 – 1961 93.66 74.19 7.92
3 1970 – 1971 99.08 78.81 7.95
4 1980 – 1981 100.25 99.11 9.89
5 1990 – 1991 94.31 124.00 13.02
6 2001 – 2002 70.19 116.82 16.64
7. 2002 – 2003 70.81 110.88 15.66
8. 2003 – 2004 69.98 112.10 16.02
9. 2004-05 (last estimate) 64.67 76.87 11.92
10. 2005-06 (last estimate) 65.87 81.12 12.47
11. 2006-07 (IInd estimate) 56.82 78.05 13.74
Source : Statistics and Evaluation Directorate, GOB
2.4 Flood Control and Drainage
Every year, Bihar faces the vagaries of flood and waterlogging. After bifurcation of the State,
Bihar has become the most flood prone area in the country. Total flood prone area of the State is

21
68.80 lakh hectares which is 73.06 percent of its total geographical area and 17.2 percent of the
total flood prone area in the country. Flood situation is most severe in northern plains of Bihar.
This is because almost all the major rivers in the State enter Bihar from Nepal in this region. Bed
slope of these rivers is very sharp in the Nepal and they usually enter the State on plain lands.
Because of a sudden drop in bed slope, silt brought by the flow of these rivers get deposited at
their base to cause recurring floods.
While a long term solution to this problem can be achieved by constructing dams at upper
catchment of Kosi, Gandak, Bagmati, Mahananda rivers in Nepal territory, in the short run, Bihar
has to depend on construction and maintenance of embankments along the rivers. Till March
2006, 3430.47 km length of embankments have been constructed in the State which protect 29.16
lakh hectares of area, out of a total of 68.80 lakh hectare flood prone area. Thus,l 39.64 lakh
hectares of land area still stands exposed to the perennial problem of floods. Despite such high
exposures to threat of flood, only 29 percent of the total 10th Plan allocation for flood control have
been utilized (Table 2.8). A more efficient utilization of the allocated funds would have lessened
the damage capacity of floods in the State.
Table 2.8 : 10th Plan Performance on the Outlays for Flood Control (Rs in crore)
Sl.No Source of Funding 10th Plan Outlay Flood Control Agreed Outlay Actual Outlay Anticipated
Performance 1 Establishment
(CSS+State Plan) 114.08 152.52 145.79
2 State Plan (Ongoing & New Schemes) 1576.00 332.92 329.81
3 NABARD 55.00 21.00 16.97 Sub Total (works) 1631.0 353.92 346.78 Total Flood
Control 1745.08 506.44 492.57
Beside the menace of flood, about 9.41 lakh hectare of land suffer from the problem of water
logging in Bihar. It has been found by various Expert Committees that it would not be
economically viable to free 2.5 lakh hectares of land from water logging due to excessive depth.
Thus, against 6.91 lakh hectares of water logged area from where water can be drained out, only
about 1.50 lakh hectare have been freed from water logging. The task ahead is to free the
remaining 5.41 lakh hectares of land area. Against a total agreed outlay of around Rs167 crore, on

22
drainage works in the 10th Plan, there has been an actual utilisation of around 74 percent (Table
2.9).
Table 2.9 : 10th plan performance and 11th plan requirement Rs in Crore
Sl. No. Source of Funding 10th Plan Outlay
Drainage Agreed Outlay Actual Utilisation
1 State Plan (Ongoing & New Schemes) 120.94 7.79
2 NABARD 166.77 122.79
Total Drainage 166.77 122.79
2.5 Irrigation Bihar is richly endowed with water resources and with a very healthy rainfall average of 1271.9
mms. Ultimate irrigation potential in the State is estimated to be around 102 lakh hectares which is
far above total cultivated area in the State (Table 2.10). However. However, neither rainfall nor the
distribution of the water resources is uniform across the State, causing uneven irrigatioin
potential/coverage across the State. While Zone-2 (Table 2) receives earliest showers and highest
rainfall (1450 mm) among all three agro-climatic zones in the State, Zone-3 recieves an average
rainfall of only 1115 mms.
Table 2.10 : Ultimate Irrigation Potential in Bihar ( In lakh hectares)
Source India Bihar % Share
of Bihar in India
1. Surface Water 737 63.58 8.63
(a) Major + Medium Schemes 585 53.53 9.15
(b) Minor Irrigation 174 10.05 5.78
2. Ground Water 641 39.06 6.09
Total ( 1 + 2) 1399 102.64 7.34
Source : Central Water Commission, Dept. of Water Resources, Bihar and Central Ground Water Board.
Bihar has 45.67 lakh hectares of irrigated area against its total geographical area of 93.6 lakh
hectares. While created irrigation capacity of 45.67 lakh hectare means that around 49 per cent of

23
total area is irrigated, distribution of irrigation capacity is not even across the State. The
percentage of irrigated area varies greatly across different regions/districts, from a low of 16
percent (in Jamui) to around 86 percent (in Sheikhpura). In fact, both irrigation capacity and its
source vary greatly across the 3 agro-climatic Zones of the state.
While Zone 1 accounts for nearly 37 per cent of total geographical area of the State, its share in
total created irrigation capacity of the State is about 31 per cent ( Table 2.11). On the other hand,
Zone 3B which also accounts for 31 per cent of geographical area has about 41 per cent of total
irrigated land in the State. Zone 3A having 13 per cent of geographical area of the State has only
around 8 per cent of total irrigated area of the. Finally, while around 64 per cent of Zone 3B area is
irrigated, Zone 3A has only around 32 per cent of its area irrigated.
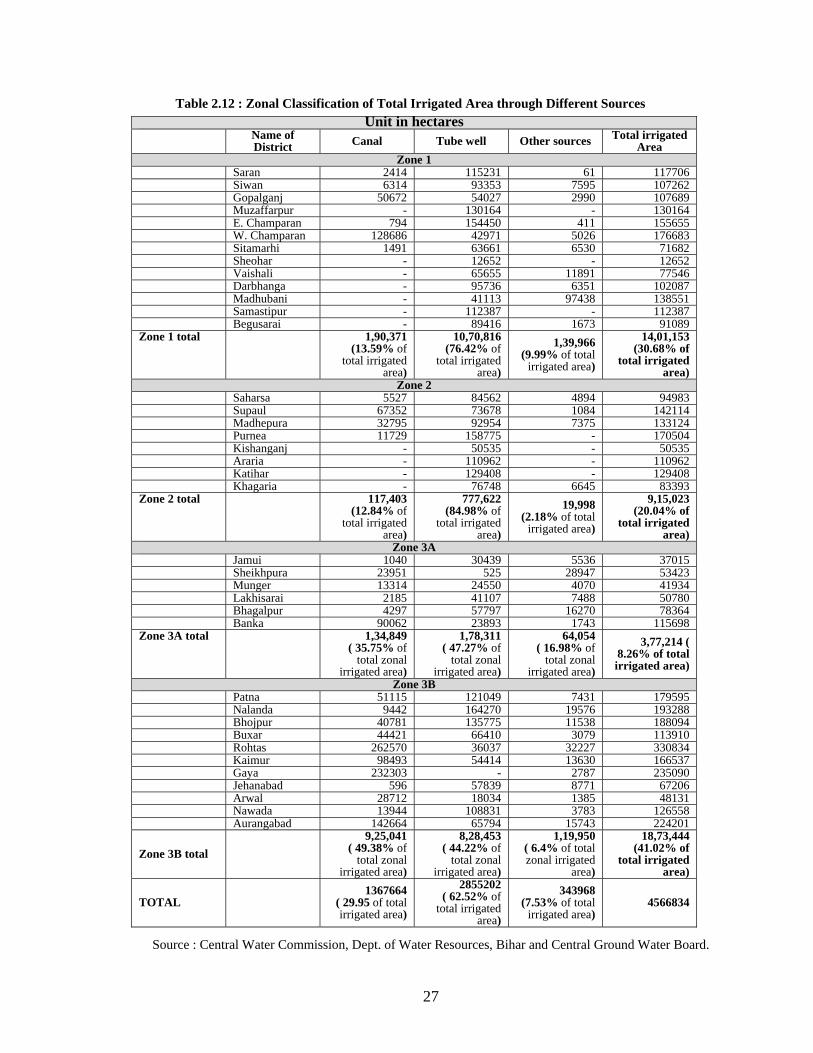
This variation in irrigation capacity across the regions also extends to the sources of irrigation.
Nearly 63 per cent of total created irrigation capacity in the State has tubewells as its source
(Table 2.12). Canal irrigation accounts for nearly 30 per cent of total irrigated area. Thus major
and medium sources of irrigation together account for 93 per cent of total created irrigation
capacity in the State, with other sources ( minor and micro irrigation) accounting for only about 7
percent of total irrigation. A very high dependence of irrigation on tubewells, and operation of
diesel tubewell due to lack of power infrastructure in the rural areas means a high cost and
inefficient irrigation.
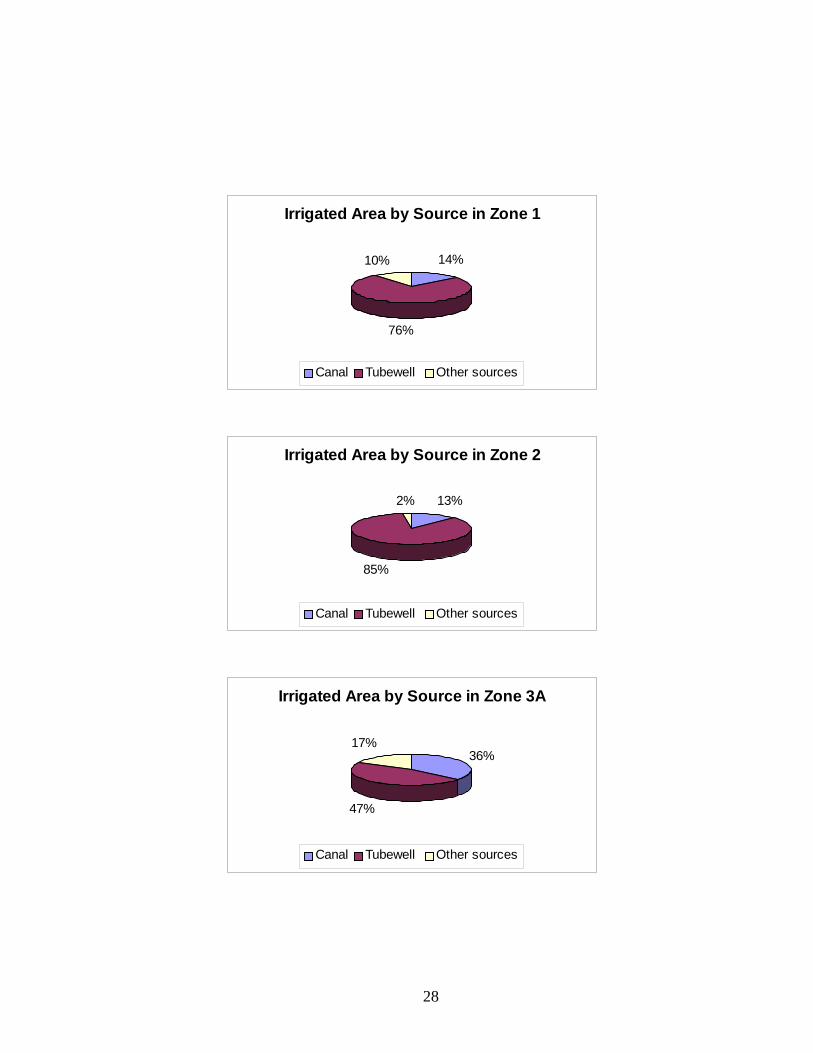
The variation in irrigation source has a very clear pattern across the agro-climatic zones of the
State. While nearly 50 per cent of irrigation in Zone 3B has canal as its source, only 13 per cent of
the irrigated area in Zone 2 receives canal irrigation. Reliance on tubewells is very high in Zones
1 and 2 ( source of 85 percent of Zone 1’s irrigated area). On the other hand, canals have a greater
role to play in Zones 3A and 3B and there is a greater balance between tubewell and canal
irrigation in these regions. Incidentally, the latter two zones are also the zones with lowest rainfall
among all the regions of the state. Thus, while importance of canal irrigation is much greater in
southern parts of Bihar (Zone 3), there is an almost exclusive reliance on tubewell irrigation in the
northern parts, especially in Zone 2. This is rather peculiar as most of the rivers in Bihar flow
through its northern plains, which therefore should have had a better canal irrigation capacity.

24
Minor and micro irrigation have only a limited coverage in the overall irrigation scenario of the
State, accounting for only 7.53 per cent of the irrigated area. Here too, there is a great deal of
variation in its use across the State. While only 2 per cent of irrigated area of Zone 2 has minor
irrigation as its source, its contribution to irrigated area in Zone 3 is around 17 per cent.
Ground water resources have remained largely unutilized in the State. To tap the huge potential of
ground water irrigation, Million Shallow Tubewell Programme has been prepared which would
imply additional irrigation capacity of 20 lakh hectares. About 6.97 lakh diesel tubewells and
pumpsets are to be distributed by March 2007 under this programme. Farmers are given a grant of
30 per cent and a loan of 50 per cent of total costs under this Programme and no discrimination is
made between different categories of beneficiary farmers. Against the distribution target of 5.37
lakh pumpsets by March 2006, 3.80 lakh pumpsets were distributed by November, 2005.
On-farm water management programme is being run in all the 38 districts of the State under which
shallow pumpsets, normal pumpsets, and other micro irrigation sources are being arranged.
Watershed development programme is being run under which water generating ponds, and other
devices of ground water regeneration are being constructed to develop and improve water
utilization capacity in the State. In this direction, 5 lakh trees have been planted in 8 districts of the
State under agro-forestry programme towards developing water utilization capacity. Sprinkler sets
and HDPIP pipes are being distributed in the State under the Centrally sponsored ISOPOM plan
for production of pulses, oilseeds and maize. By March 2006, additional irrigation capacity of
18000 hectares of land was created under this programme. Against the target to create additional
irrigation capacity of 2.39 lakh hectares in 2006-07, an additional irrigation capacity of 1.76 lakh
hectares was created by Septemeber 2006. In the 10th Plan, actual outlay on irrigation was Rs1980
crore which was only about 60 percent of total agreed outlay on irrigation (Table2.13). A
substantial portion of this outlay was on major and medium irrigation.

25
Table 2.11 : Zonal Land Usage, and Percentage ofIrrigated Land
Districts Land Area (in hectares)
Net Sown Area
( in hect.)
Total Crop Area
( in hect.)
Multi Cropped Area
( in hect.)
total irrigated area
% irrigated area
Zone 1 Saran 265,000 192938 233024 40086 117706 44.42 Siwan 224,000 162889 238635 75746 107262 47.88 Gopalganj 204,000 150524 232775 82251 107689 52.79 Muzafarpur 315,000 207145 339364 132219 130164 41.32 E Champaran 432,000 288804 323302 34498 155655 36.03 W Champaran 484,000 279758 366712 86954 176683 36.50 Sitamarhi 222,000 121048 188399 67351 71682 32.29 Sheohar 44,000 26483 43567 17084 12652 28.75 Vaishali 201,000 126660 190331 63671 77546 38.58 Darbhanga 254,000 172716 209949 37233 102087 40.19 Madhubani 354,000 225113 317083 91970 138551 39.14 Samastipur 262,000 184718 252196 67478 112387 42.90 Begusarai 188,000 117193 174313 57120 91089 48.45 total 3,449,000 2255989 3109650 853661 1401153 40.62 % of total land area 36.85 %of land area 65.41 90.16 24.75
Zone 2 Saharsa 165,000 109633 194022 84389 94983 57.57 supaul 239,000 155251 268820 113569 142114 59.46 madhepura 180,000 131531 205481 73950 133124 73.96 Purnia 314,000 221166 307003 85837 170504 54.30 Kishanganj 189,000 131105 195648 64543 50535 26.74 Araria 271,000 180983 282645 101662 110962 40.95 Katihar 291,000 167217 278835 111618 129408 44.47 Khagaria 149,000 84684 133902 49218 83393 55.97 1,798,000 1,181,570 1,866,356 684,786 915023 50.89 19 65.71579533 103.8017798
Zone 3A Munger 140,000 48029 69030 21001 37015 26.44 Sheikhpura 62,000 44217 62737 18520 53423 86.17 Lakhisarai 129,000 68044 78098 10054 41934 32.51 Jamui 305,000 81117 88723 7606 50780 16.65 Bhagalpur 254,000 145667 177576 31909 78364 30.85 Banka 306,000 153818 161325 7507 115698 37.81 1,196,000 540,892 637,489 96,597 377214 31.54 % of total land area 13 % of land area
45.23 53.30 8.08

26
Zone 3B Patna 317,000 206294 253848 47554 179595 56.65
Nalanda 232,000 180872 228353 47481 193288 83.31 Bhojpur 237,000 185364 227536 42172 188094 79.36
Buxar 167,000 138277 144944 6667 113910 68.21
Rohtas 391,000 254360 363159 108799 330834 84.61
Kaimur 342,000 154226 204719 50493 166537 48.70
Gaya 494,000 200333 277364 77031 235090 47.59
Jehanabad 94,000 63650 80024 16374 67206 71.50 Arwal 63,000 41784 58263 16479 48131 76.40
Nawada 249,000 110565 149046 38481 126558 50.83
Aurangabad 330,000 197912 281626 83714 224201 67.94
2,916,000 1,733,637 2,268,882 535,245 1873444 64.25
% of total land area
31
% of land area
59.45 77.81 18.36
Bihar 9,360,000 5712088 7882377 2170209 4566,834 48.79
Source : Central Water Commission Dept. of Water Resources, Bihar and Central Ground Water Board.
Irrigated Area in Different Zones
0100000020000003000000400000050000006000000700000080000009000000
10000000
Mar
gina
l (0-
1Ha.
)
Sem
i med
ium
(2-4
Ha.
)
No. of Holdings
27
Table 2.12 : Zonal Classification of Total Irrigated Area through Different Sources Unit in hectares
Name of District Canal Tube well Other sources Total irrigated
Area Zone 1
Saran 2414 115231 61 117706 Siwan 6314 93353 7595 107262 Gopalganj 50672 54027 2990 107689 Muzaffarpur - 130164 - 130164 E. Champaran 794 154450 411 155655 W. Champaran 128686 42971 5026 176683 Sitamarhi 1491 63661 6530 71682 Sheohar - 12652 - 12652 Vaishali - 65655 11891 77546 Darbhanga - 95736 6351 102087 Madhubani - 41113 97438 138551 Samastipur - 112387 - 112387 Begusarai - 89416 1673 91089 Zone 1 total 1,90,371
(13.59% of total irrigated
area)
10,70,816 (76.42% of
total irrigated area)
1,39,966 (9.99% of total
irrigated area)
14,01,153 (30.68% of
total irrigated area)
Zone 2 Saharsa 5527 84562 4894 94983 Supaul 67352 73678 1084 142114 Madhepura 32795 92954 7375 133124 Purnea 11729 158775 - 170504 Kishanganj - 50535 - 50535 Araria - 110962 - 110962 Katihar - 129408 - 129408 Khagaria - 76748 6645 83393 Zone 2 total
117,403 (12.84% of
total irrigated area)
777,622 (84.98% of
total irrigated area)
19,998 (2.18% of total
irrigated area)
9,15,023 (20.04% of
total irrigated area)
Zone 3A Jamui 1040 30439 5536 37015 Sheikhpura 23951 525 28947 53423 Munger 13314 24550 4070 41934 Lakhisarai 2185 41107 7488 50780 Bhagalpur 4297 57797 16270 78364 Banka 90062 23893 1743 115698 Zone 3A total
1,34,849 ( 35.75% of
total zonal irrigated area)
1,78,311 ( 47.27% of
total zonal irrigated area)
64,054 ( 16.98% of
total zonal irrigated area)
3,77,214 ( 8.26% of total irrigated area)
Zone 3B Patna 51115 121049 7431 179595 Nalanda 9442 164270 19576 193288 Bhojpur 40781 135775 11538 188094 Buxar 44421 66410 3079 113910 Rohtas 262570 36037 32227 330834 Kaimur 98493 54414 13630 166537 Gaya 232303 - 2787 235090 Jehanabad 596 57839 8771 67206 Arwal 28712 18034 1385 48131 Nawada 13944 108831 3783 126558 Aurangabad 142664 65794 15743 224201
Zone 3B total
9,25,041 ( 49.38% of
total zonal irrigated area)
8,28,453 ( 44.22% of
total zonal irrigated area)
1,19,950 ( 6.4% of total zonal irrigated
area)
18,73,444 (41.02% of
total irrigated area)
TOTAL
1367664 ( 29.95 of total irrigated area)
2855202 ( 62.52% of
total irrigated area)
343968 (7.53% of total
irrigated area) 4566834
Source : Central Water Commission, Dept. of Water Resources, Bihar and Central Ground Water Board.
28
Irrigated Area by Source in Zone 1
14%
76%
10%
Canal Tubewell Other sources
Irrigated Area by Source in Zone 2
13%
85%
2%
Canal Tubewell Other sources
Irrigated Area by Source in Zone 3A
36%
47%
17%
Canal Tubewell Other sources

29
Irrigated Area by Source in Zone 3B
50%
44%
6%
Canal Tubewell Other sources
Table 2.13 : The total outlay required including establishment as per source of funding is as follows :
(Rs in crore)
Sl. No.
Source of funding 10 th plan outlay Proposed outlay for 11th plan
Major & Medium Irrigation Agreed Outlay Actual Outlay Anticipated
Performance
1 Establishment (CSS + State Plan)
468.00 508.35 482.58 625.00
2 State Plan ( Ongoing & New Schemes)
1106.00 124.57 121.89 2006.90
3 RSVY 0.00 165.00 17.14 1500.00
4 AIBP 1257.63 995.00 980.85 2962.91
5 NABARD 441.56 188.0 144.87 1500.00
Sub Total (Works) 2805.19 1472.58 1264.75 7969.81
Total Irrigation 3273.19 1980.93 1747.33 8594.81
2.6 Agricultural Inputs
Seeds Agriculture in Bihar has been bedeviled by a trend of falling productivity over the last few years.
Major crops, particularly rice and wheat which together account for 77.26 percent of total copped
area have seen a substantive fall in their productivity in recent years.

30
Falling productivity of agricultural sector in Bihar , inspite of its rich soil endowment, can be
partly explained by the limited availability of good quality seed and a very poor seed replacement
rate. Seed replacement rate for cereals is about 10-12 pecent, for gram it is 7.5 percent and for
rapeseed and mustard, it is 30 percent( Table 2.14). The seed replacement ratio for paddy has
increased from 6.8 percent in 2003-04 to 10 percent in 2004-05 to 12 percent in 2005-06. This
ratio for wheat was 10 percent in 2004-05 and 11 percent in 2005-06. These rates are much below
the desirable 30-35 percent for self-pollinated crops and 50 percent for cross-pollinated crops. In
other states, the seed replacement for paddy is at 50 percent in Andhra Pradesh, the rate for wheat
is 41 percent in Maharastra, for gram it is 30 percent in Orissa and for rapeseed and mustard it is
100 percent in Gujarat. However, the seed replacement ratios for oilseeds and maize in the State
meet the desired norms, standing at 30 percent for rapeseeds and mustard, and 40 percent for rabi
maize which is reflected in their yield being above the national average.
Table 2.14 : Seed Replacement Rates of Different Crops
Sl. No
Name of the crops 2003-04 2004-05 2005-06 2006-07
Target achievement Target achievement Target achievement Target achievement Kharif crops
1 Paddy 8% 6.8% 10% 10% 11% 12% 15% 2 Maize 40% 30% 50% 40% 50% 50% 60% 3 Pulses 10% 6% 10% 7.5% 10% 8% 14% 4 Oilseeds 5% 2% 5% 3% 5% 5%
Rabi Crops 1 Wheat 10% 8.1% 10% 9% 15% 11% 15% 2 Maize - - - - 50% - 80% 3 pulses 5% 1.2% 10% 7.5% 15% - 10% 4 Oilseeds 25% 20% 30% 25% 30% - 30% 5 Vegetables 25% 20% 60% 50% 60% - 60%
Table 2.15 : Seed Consumption of Crops in Bihar ( in 000 quintals)
Paddy Wheat Maize Paddu 1997-98 34.77 26.43 1.67 1998-99 68.65 102.34 2.45
1999-2000 77.71 130.43 14.02 2000-01 82.23 128.36 41.40 2001-02 72.26 190.64 24.34 2002-03 90.02 164.09 26.65 2003-04 104.40 181.50 45.95 2004-05 144.99 242.52 36.80 2005-06 194.25 237.85 33.26 2006-07 222 300 35

31
Table 2.16: HYV Area as Percentage of Total Cropped Area in Bihar
Crop Year Bihar Rice TE 1982 24.7
TE 1990 38.3 TE 1999 67.9 TE 2005 73.9
Wheat TE 1982 70.4 TE 1990 76.9 TE 1999 90.6 TE 2005 92.0
Maize TE 1982 56.9 TE 1990 62.4 TE 1999 75.4
TE 2005 77.1
Source : Directorate of Statistics and Evaluation, Government of Bihar The target seed replacement rate for pulses in 2006 was 14 and 10 percent in kharif and rabi
seasons respectively. Seed replacement target for oilseeds and vegetables was 30 percent and 60
percent respectively. There has been an increase in seed consumption of paddy and wheat in the
State in the recent years; while seed consumption for paddy has increased sharply from 72.26
thousand quintals in 2001-02 to 194.25 thousand quintals in 2005-06, the same for wheat has
increased moderately form 190.64 thousand quintals to 237.85 thousand quintals over the same
period ( Table 2.15). This increase in seed consumption in the backdrop of their falling acreage is
explained by increase in seed replacement ratio and increasing use of HYVs for these crops. The
acreage of paddy under HYVs has increased by almost 4 percent over the period 1999-2005, and
that of wheat under HYV has increased by around 2 percent over the same period (Table 2.16).
Arrangements have been made to supply 48,000 quintals of maize seeds, 3500 quintals of arhar,
1400 quintals of urad, and 420 quintals of moong for kharif 2006. Seed requirement for rabi-2006
has been estimated at 300 thousand quintals. The estimate for maize seeds in rabi-2006 was of 60
thousand quintals ( Table 2.17).

32
Table 2.17 : Certified Seed Requirement of Different Crops in Bihar ( 2006-07)
Name of crop Certified seed requirement
(In Qtls.) Kharif
Paddy 2,22,000 Maize 48,000 Arhar 3500 Urad 1400 Moong 420
Rabi Wheat 3,00,000 Maize 60,000 Gram 11,600 Lentil 5300 Pea 2400 Rai /Tori 1440
For last several years, Bihar State Seed Corporation had become non-functional and agricultural
farms of the State government were lying barren. In the current financial year, the State
government has given approval for restarting seed production by Bihar State Seed Corporation for
the next five years at an outlay of Rs. 27.12 crore. Seed production for paddy has started on 45
agricultural farms in the last kharif season, and 10,000 quintals of HYV paddy seeds have been
produced. In the current rabi season, programme of production of wheat seeds is being carried out.
This would facilitate timely and economical availability of modern crop breeds to the farmers.
Fertilisers
Fertiliser consumption in the State has steadily increased over the years. The consumption of
fertilizers has increased from 85 kgs/hectare to 110 kgs/hectare in 2005-06 (Table 2.18). The
estimated consumption for 2006-07 is 125 kgs/hectare. For 2006, the State government has
estimated the fertilizer consumption to be 9 lakh MT of urea, 3 lakh MT of DAP, 90000 MT of
MOP, 1.5 lakh MT of NPK, and 60000 MT of SSP, 90 percent of which has been allocated by the
Central government. Despite an increase over the years, fertilizer consumption per hectare in the
State is lower than the national average. Besides the low level, an important problem is the
distorted consumption pattern of fertilizers in the State. While the ideal ratio of NPK consumption

33
should be 4:2:1, the consumption pattern in Bihar has become increasingly distorted over the years
(Table 2.19). The NPK ratio has worsened from around 12:3:1 in 2000-01 to 24:2:1 in 2003-04,
but fortunately improved to 7:1:1 in 2005-06. This problem, along with others, is being addressed
by the extension initiatives of the State government, such as establishment of soil testing
laboratories and Krishi Vikas Kendras (KVK) in each block.
Table 2.18 : NPK Consumption pattern from 1994 – 1995 onwards
Year N:P:K Ratio 1995 – 1996 8.4:2.7:1.8 1996 – 1997 12.4:1.7:2.1 1997 – 1998 11.5:2.8:1 1998 – 1999 13.5:3.3:1 1999 – 2000 11.1:3.2:1 2000 – 2001 12.1:2.9:1 2001 – 2002 12.1:2.3:1 2002 – 2003 23:4.2:1 2003 – 2004 24.3:1.7:1 2004 – 2005 14.7:1.7:1 2005 – 2006 6.8:1.3:1
2006-07 4.3:1.8:1 (tentative)
Table 2.19 : Consumption of nutrient per hectare
Year Nutrient consumption( in Kgs/hect.)
1993&1994 61−20
1994&1995 62−50
1995&1996 65−00
1996&1997 68−00
1997&1998 69−00
1998&1999 72−00
1999&2000 78−50
2000&2001 85−00
2001&2002 94−00
2002&2003 96−00
2003&2004 87−50
2004&2005 92−15
2005&2006 110−00

34
2005&2006 125−00
Credit From an already low level, agriculture’s share in total bank credit has fallen over the last 5 years.
While its share was at 24 percent in 2000-01, it fell to 20 percent in 2003-04. Though it has
registered an increase to 23 percent in 2004-05, it is still lower than the share in 2000-01. The
entire rural credit delivery system is not in a good shape in Bihar. In terms of access of cultivators
to the banking institutions, average population per bank branch in Bihar, as on end of June 2006,
was 25,000, as against the national average of 16,000 (RBI 2006). While the number of
commercial bank branches in the State is 2082, only 60.37 percent of these branches operate in
rural areas. There are 5 Regional Rural Banks in the State, with 1486 branches, of which around
86 percent are located in the rural areas. The credit-deposit ratio ( CDR ) of RRBs at 44.77
percent is much higher than those of commercial banks.
Taking the entire banking sector, a total of 4015 branches of 72 banks cater to the 82.9 million
strong population of the State ( Table 2.20). Even this sparse banking infrastructure is
disproportionately oriented towards the urban economy of the State, with only 72 per cent of total
branches catering to the rural areas which is home to nearly 90 percent of population . Total
allocation of credit to agriculture in Bihar has been increasing over the last few years, but has
remained way behind the target credit mark.
Table 2.20 : Institutional Arrangements (Branch Position)
Agency No. of Banks
No. of Branches
Rural Branches
Semi urban Urban
CBS 30 2082 1257(60.3%) 443 386
RRR’s 16 1486 1287(86.60%) 165 34
SCB 1 14 - - 14
DCCB’s 22 280 240(85.71%) 13 27
LDB 1 151 80(52.98%) 16 55
UCB 2 2 - - 2
Total 72 4015 2880(71.73%) 637 578
35
Table 2.21 : Target and Achievement of Agricultural Credit by Different Banks. (Rs. in crore)
Year Commercial Bank Regional Rural bank Cooperative Bank Total Target
Target Achievement % of total target credit for the year
% of total achievement in credit allocation for the year
Target Achievement % of total target credit for the year
% of total achievement in credit allocation for the year
Target Achievement % of total target credit for the year
% of total achievement in credit allocation for the year
2002-03 1050.33 604.73 57.20 70.30 391.62 153.84 21.33 17.88 394.14 101.6 21.47 11.81 1836.09
2003-2004 1220.15 792.44 64.21 50.85 376.98 204.87 19.84 13.15 303.21 561.11 15.96 36.01 1900.34
2004-2005 1386.29 1325.06 59.25 65.27 550.86 431.3 23.54 21.25 402.71 273.75 17.21 13.48 2339.86
2005-2006 1645.57 1489.33 61.00 68.51 644.26 450.09 23.88 20.70 407.65 234.61 15.11 10.79 2697.48
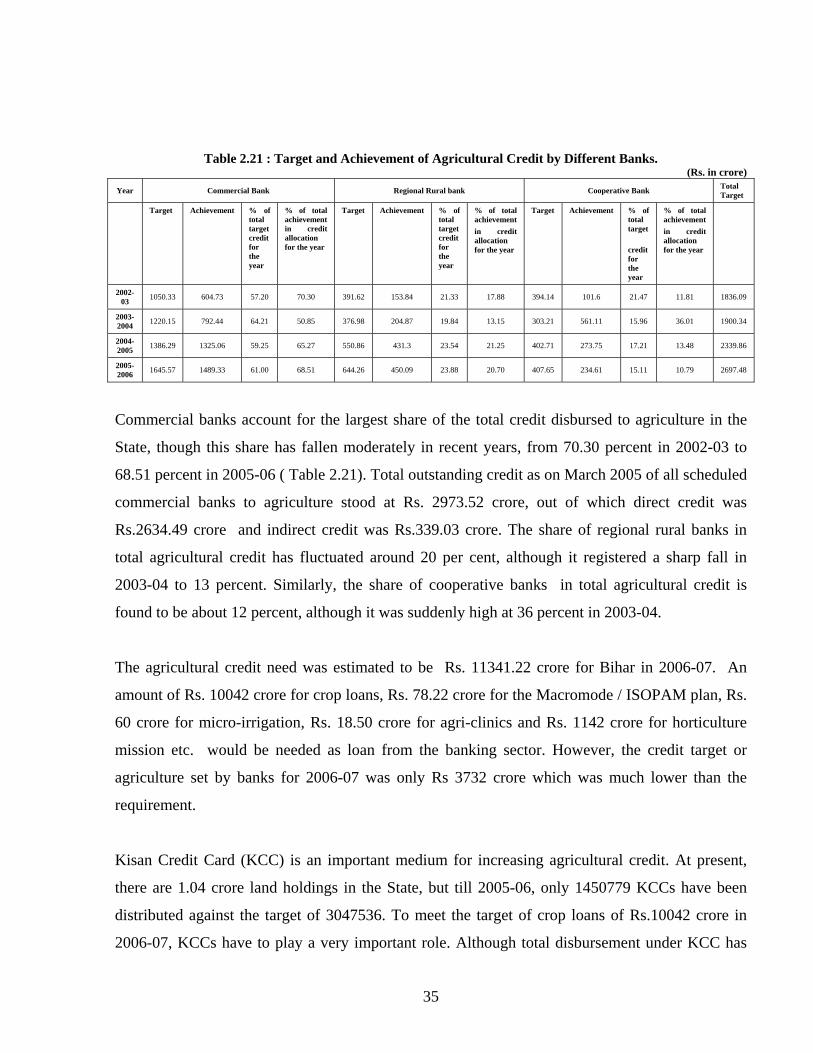
Commercial banks account for the largest share of the total credit disbursed to agriculture in the
State, though this share has fallen moderately in recent years, from 70.30 percent in 2002-03 to
68.51 percent in 2005-06 ( Table 2.21). Total outstanding credit as on March 2005 of all scheduled
commercial banks to agriculture stood at Rs. 2973.52 crore, out of which direct credit was
Rs.2634.49 crore and indirect credit was Rs.339.03 crore. The share of regional rural banks in
total agricultural credit has fluctuated around 20 per cent, although it registered a sharp fall in
2003-04 to 13 percent. Similarly, the share of cooperative banks in total agricultural credit is
found to be about 12 percent, although it was suddenly high at 36 percent in 2003-04.
The agricultural credit need was estimated to be Rs. 11341.22 crore for Bihar in 2006-07. An
amount of Rs. 10042 crore for crop loans, Rs. 78.22 crore for the Macromode / ISOPAM plan, Rs.
60 crore for micro-irrigation, Rs. 18.50 crore for agri-clinics and Rs. 1142 crore for horticulture
mission etc. would be needed as loan from the banking sector. However, the credit target or
agriculture set by banks for 2006-07 was only Rs 3732 crore which was much lower than the
requirement.
Kisan Credit Card (KCC) is an important medium for increasing agricultural credit. At present,
there are 1.04 crore land holdings in the State, but till 2005-06, only 1450779 KCCs have been
distributed against the target of 3047536. To meet the target of crop loans of Rs.10042 crore in
2006-07, KCCs have to play a very important role. Although total disbursement under KCC has

36
increased almost 2.5 times, from Rs. 342 crore in 2002- 03 to Rs. 815 crore in 2005-06 (Table
2.22), it still channels only a miniscule proportion of the total credit volume for crop loans. A
target of 6 lakh more KCCs has been fixed by the banks for 2006-07. But even this target is
grossly inadequate to measure up to the total credit demand in the current year. In the area of
micro-finance, more than 17,000 Self-Help Groups had been financed by banks upto 2005 through
their priority lending schemes in 38 districts. The target for 2006-07 is to raise the number to
24,000 SHGs and advance Rs. 48 crore through the scheme.
Table 2.22 : Details of KCC in Bihar
(Amount in Rs. Lakh)
Sanction Disbursement Year Physical Target No. of
application Amount No. of application Amount
2002-2003 759098 311731 91119 214564 34242
2003-2004 595904 594152 76302 355502 49636
2004-2005 795700 465744 87390 463519 86051
2005-2006 566751 318603 85963 317294 81495
Insurance Agricultural production in Bihar has shown great fluctuation over the years. At one hand, this
fluctuation can be devastating for a small-marginal farmer who operates on limits of subsistence,
and, on the other hand, it is a disincentive for enterprising farmers who have the potential for
investment. In this perspective, crops in the State are being insured since kharif 2000 to provide
economic help to the insured farmers whose crops are damaged by natural disaster. Kharif crops
such as paddy, maize, jute and chillies, and among rabi crops, wheat, gram, arhar, masoor, maize,
rapeseed and mustard, potato, sugarcane and onion are covered under National Agricultural
Insurance Plan. While participation of indebted farmers is compulsory in the plan, that of non-
indebted farmers is voluntary.
Under this plan, grants are given in the premium to be paid by the small and marginal farmers,
with equal shares of State and Central government. The number of beneficiary farmers for 2004-
05 was 411532, 293442 in kharif and 118090 in rabi season .There has been a drop in coverage of

37
farmers under crop insurance in 2005-06 as compared to 2004-05. Crop insurance policy was
taken by 409,946 farmers in 2005-06, out of which 221985 took cover for kharif season and
187961 took cover for rabi season. The spread of insurance cover, however, is grossly inadequate
keeping in mind that there are around 104 lakh landholdings in the State , nearly 93 percent of
which are small and marginal holdings which are specially required to be protected through the
agriculture insurance plan. Its coverage would have to be significantly expanded over the years in
order to stabilize income from agriculture and create conducive environment for productive
investment in agriculture.
Extension Services
In a sector which is based on enterprise of nearly 77 percent of total workforce on around 1.04
crore landholdings (92.5 percent of them being small and marginal holdings), importance of
agricultural research to create/upgrade agricultural technology and extension of this technology
and other support services to the farmers, cannot be overemphasized. In Bihar, there is a huge
breach between the technology available in the agricultural universities/institutions and those on
the field. Efforts have to be made to transfer the available technology to the farmers in the field.
The public sector agricultural research and extension system consists of the Rajendra Agricultural
University for agricultural research and education; seven research centers/ stations of the Indian
Council of Agricultural Research for commodity and location-specific research; and various
Departments of the State government that provide agricultural extension and regulatory services.
The agricultural research and extension system has not been fully effective in developing and
disseminating appropriate technologies to the farmers in the State. While 0.4 percent of
agricultural GDP is spent on agricultural research and education at the national level, the average
for Bihar is 0.2 percent. Further, 95 percent of this spending is used for salaries and 5 percent for
establishment expenses, thereby leaving no funds for operational expenses needed to carry out
relevant research. NSSO 2003 figures point out that the performance of the extension system in
the State has been such that a mere 0.5 percent of farmers access information on modern
technology from extension workers.
Steps to reform the above situation have been in the recent years and, in particular, in the current
year. The State government has universalized Agricultural Technology Management Agencies
(ATMAs) to cover all districts of the State. The ATMAs are designed to decentralize decision-

38
making through ‘bottom-up’ planning procedures that would directly involve farmers and the
private sector in planning and implementing extension programmes at the block and district levels.
Similarly, a decision has been taken in 2006 to universalize Krishi Vigyan Kendras to all districts
of the State. In addition, 31 new seed testing laboratories have been sanctioned in the current
financial year to give each district its own seed testing laboratory.
The State has a very distorted pattern of nutrient consumption regarding NPK ratio, which not
only leads to a waste of resources but also mars the soil quality of the fields. A major reason for
this imbalanced use of fertilizers is lack of knowledge among the farmers about the soil quality of
their fields. In the current year, 16 soil-testing laboratories have been sanctioned, adding to the
earlier strength of 23, thereby allowing for a complete coverage of all the districts. In fact, a mega-
project with an outlay of Rs 309 crore has been sanctioned in this year to establish soil testing
laboratories in all the 534 blocks of the state over next 4 years.
Management of seed supply is an important component of any programme of agricultural
development. In the current year, Bihar State Seed Corporation has been revived and production of
seeds is being undertaken by it on 45 state managed farm which remained inoperative for some
years. More than 1100 agriculture graduates have been trained as agriclinics in the State. The
utilization of technical expertise of these trained youths is necessary for agricultural development.
A decision was taken in the current year to use the seeds produced by agriclinic for public sector
programmes. In the current year, the Kisan Samman Yojna was also launched to identify and
acknowledge enterprising farmers in the State and using them as extension agents. This plan is
unique and innovative programme of extension reforms.
2.7 Horticulture
Bihar is one of the major producers of vegetables and fruits in India with 9.8 and 6.7 percent of
national production respectively. It ranks third and sixth among other States in the production of
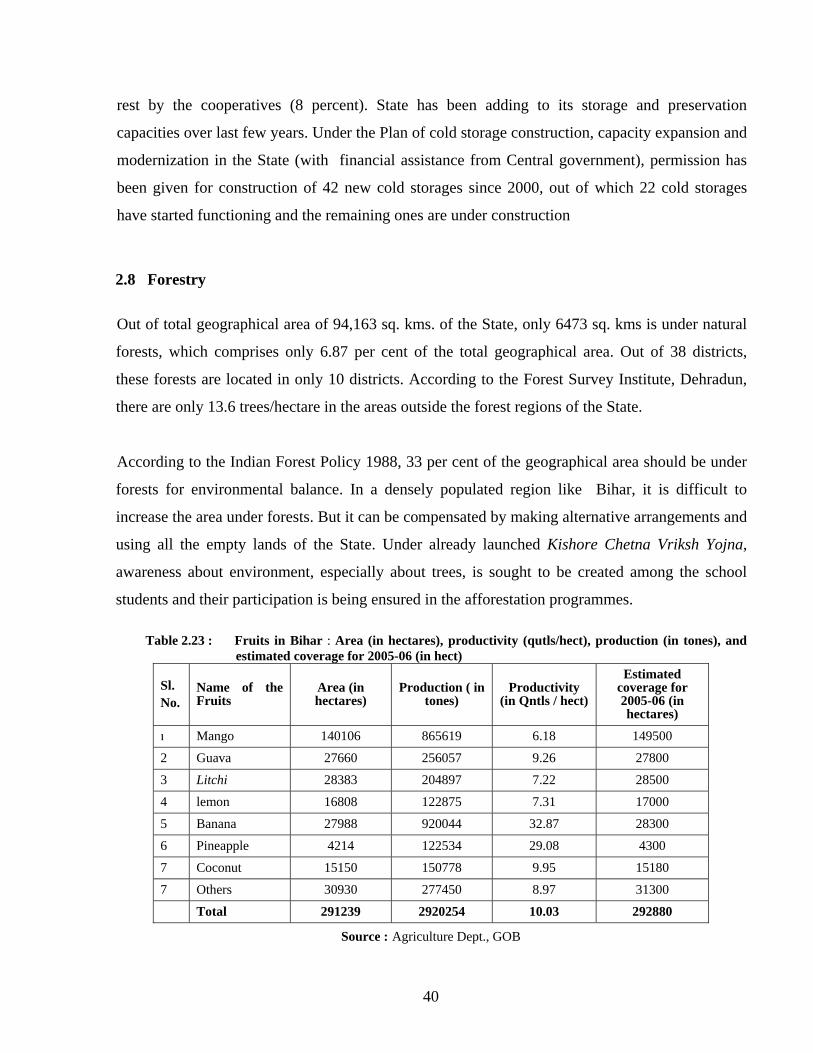
vegetables and fruits respectively. Fruit area in the State is 2.91 lakh hectares which is around 7.8
percent of the total fruit area in the country (Table 2.23). In general, yield rates of fruits and
vegetables are lower in Bihar than those of other States. However they are among the highest for
okra and litchis. The annual production of fresh fruits in Bihar is about 29.20 lakh MT. In

39
addition, vegetables are grown in an area of 4.87 lakh hectares from which around 72.58 lakh MT
of vegetables is produced (Table 2.24). Besides this, potato cultivation takes place in an area of
3.05 lakh hectares from which 53.07 lakh MT of potato are produced.
Makhana cultivation is done in about 5000 hectares in the entire country, 90 percent of which falls
in Bihar. Projects for production of makhana, litchi and magoes are currently being promoted by
NABARD under RSVY in the districts of Muzaffarpur, Darbhanga, Samastipur and Madhubani.
About 30 per cent of the total area in the State is planned to be diverted from other crops towards
horticulture. During last two years, 2005-06 and 2006-07, plans for horticulture development are
being run in the State with 100 percent grant from the Central government under National
Horticulture Mission (NHM). The districts left out by the NHM are being covered under the Chief
Minister’s Horticulture Mission. This plan consists of expansion of area under fruit orchards,
commercial flower cultivation, cultivation of medicinal plants, bee-keeping, integerated pest
management, training of cultivators and officers, post-harvest management etc. This plan is to be
implemented in the public as well as private areas.
Approximately, 25-40 percent of the vegetables and fruits are lost due to lack of proper transport
and storage facilities. Because of these handicaps, fruits and vegetables produced in the State are
mainly sold fresh in the market, often implying distress sale by the farmers. While mandi markets
are the mandated sales outlet for fruits and vegetable products, yet just 6 percent of vegetable
production and 4.2 percent of fruit production get shelf space in APMCs.
State has been plagued by substative losses of fruit and vegetable output effected by lack of
adequate cold storage and godown capacity. Bihar has only 160 rural godowns (0.12 percent of
the country’s godowns) with an approximate capacity of 17,000 tons, which compares very poorly
with the figure of 3,015 rural godowns for Punjab, which is around 24 percent of country’s
capacity. Similary, although Bihar produces about 10 percent of all vegetables and nearly 7
percent of all fruits, it has only 5 percent of the total storage capacity in India. Of the 238 cold
storage units available, 187 are used for potatoes. Thus 77 percent of the capacity of these cold
storage units are used to store potatoes alone, leaving only 23 percent for other purposes. The
majority ( 92 percent) of the State’s cold storage facilities is owned by the private sector and the
40
rest by the cooperatives (8 percent). State has been adding to its storage and preservation
capacities over last few years. Under the Plan of cold storage construction, capacity expansion and
modernization in the State (with financial assistance from Central government), permission has
been given for construction of 42 new cold storages since 2000, out of which 22 cold storages
have started functioning and the remaining ones are under construction
2.8 Forestry
Out of total geographical area of 94,163 sq. kms. of the State, only 6473 sq. kms is under natural
forests, which comprises only 6.87 per cent of the total geographical area. Out of 38 districts,
these forests are located in only 10 districts. According to the Forest Survey Institute, Dehradun,
there are only 13.6 trees/hectare in the areas outside the forest regions of the State.
According to the Indian Forest Policy 1988, 33 per cent of the geographical area should be under
forests for environmental balance. In a densely populated region like Bihar, it is difficult to
increase the area under forests. But it can be compensated by making alternative arrangements and
using all the empty lands of the State. Under already launched Kishore Chetna Vriksh Yojna,
awareness about environment, especially about trees, is sought to be created among the school
students and their participation is being ensured in the afforestation programmes. Table 2.23 : Fruits in Bihar : Area (in hectares), productivity (qutls/hect), production (in tones), and
estimated coverage for 2005-06 (in hect)
Sl. No.
Name of the Fruits
Area (in hectares)
Production ( in tones)
Productivity (in Qntls / hect)
Estimated coverage for 2005-06 (in hectares)
Mango 140106 865619 6.18 149500
2 Guava 27660 256057 9.26 27800
3 Litchi 28383 204897 7.22 28500
4 lemon 16808 122875 7.31 17000
5 Banana 27988 920044 32.87 28300
6 Pineapple 4214 122534 29.08 4300
7 Coconut 15150 150778 9.95 15180
7 Others 30930 277450 8.97 31300
Total 291239 2920254 10.03 292880
Source : Agriculture Dept., GOB

41
Table 2.24 : Area under vegetables - Area ( in hectares), production ( in tones), productivity (qutls/hect), and
estimated coverage for 2005-06 (in hect)
Sl. No.
Name of the vegetable Area (in hect) Production
( in tones) Productivity (quintals/hect)
Estimated area for 2005-06
1 Cauliflower 59701 955216 16.0 60000
2 Cabbage 36513 598813 16.4 36700
3 Onion 48759 975180 20.0 49000
4 Tomato 42987 601818 14.0 43100
5 Chilly 38070 456840 12.0 38300
6 Brinjal 53651 1073020 20.0 53800
7 Ladyfinger 56173 674076 12.0 56300
8 Kaddu 25143 402288 16.0 25300
9 Nenua 33606 470484 14.0 33800
10 Jhiguni 8078 48468 6.0 8300
11 Karela 8424 50544 6.0 8600
12 Parwal 4594 45940 10.0 4700
13 Wodi 11582 69492 6.0 11700
14 Others 99685 835590 14.0 59800
Total 486966 7257769 14.9 489400
Source : Agriculture Dept., GOB 2.9 Animal Husbandry
Bihar’s livestock sector is crucial not only in terms of its contribution to rural income, but also for
the section of the population to which this income goes. Bihar’s livestock sector accounted for
approximately one-quarter of the total value of agricultural output in TE 2002-03. Livestock
activity is concentrated among landless households and those with marginal holdings of less than 1
hectare of land. Approximately 35 percent of rural households in Bihar report owning cattle, 20
percent buffalo, and 15 percent sheep and goats (NSSO 2003). Of all rural households owning
cattle and/or buffalo in Bihar, more than three-quarters are either landless or have less than 1
hectare of land. Sheep and goats tend to be even more concentrated among landless and marginal
rural households
Milk is the most important livestock product, accounting for approximately 50 percent of the total
livestock output, followed by meat (24 percent) and other livestock products. Milk production in

42
Bihar has grown by around 92 percent over the period 2001-2006, while meat production has
grown by only 12 percent over the same period. Similarly, egg production has increased by 35
percent over this period, that of wool has fallen by almost 50 percent (Table 2.25). According to
the 2003 livestock census, there were approximately 10 million heads of cattle in Bihar, only 10
percent of which were cross-bred, which explains the low productivity and growth of livestock
output in the State. The fact that the number of institutions providing extension services to the
livestock sector have remained stagnant over the years has certainly not helped its productivity
scenario (Table 2.26).
Table 2.25 : Growth rates of Major Livestock Products in Bihar (2001-2006)
Sl.No Item Based on 1982
Livestock census Based on census
2003 Growth over the
period ( in %)
2001-02 2002-03 2003-04 2004-05 2005-06
1 Total milk ( in 000, litres) 2632 2869 3175 4743 5060 92.25
2 Eggs ( in crores) 74 74 78 79 100 35.14
3 Meat (in 000, tonnes) 156 173 173 176 175 12.18
4 Wool ( in lakh kg.) 4.24 3.62 3.94 3.78 2.2 -48.11
Source : Animal Husbandry and Fisheries Dept., GOB
Table 2.26 : Number of Institutions in Animal Husbandry Dept.
Sl. No Item
based on 1982 livestock census
based on 1982 livestock census
based on 1982 livestock census
based on
census 2003
based on
livestock census 2003
growth over the period ( in %)
1 2001-02 2002-03 2003-04 2004-05 2005-06
2
no. of Artificial Insemination Institutions
1401 1401 1401 1401 1401 0.00
3 No. of Veterinary hospitals
39 39 39 39 39 0.00
4 No. of Veterinary Dispensaries
814 814 814 814 814 0.00
Source : Animal Husbandry and Fisheries Dept., GOB

43
2.10 Fisheries and Poultry
There has been a steady increase in fish production in the State over the period 2001-02 to 2005-
06 and its share in total agricultural GDP has nearly doubled in last 10 years. However, its
production is estimated to fall to 160 thousand MT in 2006-07 ( Table 2.27) because seed has
substantially fallen this year. Fishermen in the State are being trained to increase productivity of
fisheries sector, loans are being granted for maintenance and renovation of privately owned ponds
in the State. Table 2.27 : Trends in fish production, income from Jalkars, and other initiatives of fisheries dept
2001-02 2002-03 2003-04 2004-05 2005-06 2006-07 Fish production from all sources ( ,000 MT)
240.00 261.00 266.49 267.51 279.00 160.50
Seed Production (in lakhs) 3299.57 3679.90 3471.14 3182.11 3449.49 2866.55 Income from Jalkar settlements ( in lakh Rs)
296.39 321.61 371.14 382.95 448.44 309.83
Number of Private fish farmers who have been given training in fisciculture
861 1192 5063 1475 134 400 (in
process) Loans accepted for mainetenance/renovation of privately owned ponds ( in lakhs)
4.00 14.70 35.08 32.84 73.98 14.55
Free housing plan for fishermen ( at the rate of 1 per family)
117 56 243 244 205 405
Source : Fisheries Directorate, Bihar
2.11 Agricultural Mechanisation Current level of mechanization of agriculture in the State is very low. While there are only 17
tractors per hectare in the State, the figure for Punjab is 68 tractors per hectare. At present, Bihar
has 111672 tractors, 4000 power tillers, 2.5 lakh stonery engines, 66128 mould bold ploughs,
50000 cultivators, 15000 seed drills, 290000 sprayers, and 300000 threshers. While recommended
electricity consumption for farming is 2 KW/hect, it is only 0.8 KW/ hect in Bihar due to limited
availability of electricity. The Government is accordingly promoting agricultural mechanization
on a large scale through provision of grants for small tractors, power tillers, threshers and GISE
tillage machines.

44
2.12 Land and Agricultural Reforms
The available data for landholdings demonstrate the extent of inequality in the agrarian structure.
For example, more than 80 percent of operational holdings in Bihar are marginal (below one
hectare), and they account for only 36 percent of total operational land area. At the other end,
medium and large operational holdings of more than four hectares comprise less than 2.5 percent
of all holdings, but constitute over 20 percent of operational land area. In Bihar, incidence of
landlessness has increased in the decade of nineties from 9 percent to 10 percent of the rural
households and the proportion of households in the marginal segment has also increased
significantly in the same time period(Table 2.28).
Apart from widening of disparity in land distribution, it can also be observed that while incidence
of poverty has declined for all landowning classes during the nineties it has actually increased for
the landless from 51 percent to 56 percent, strongly suggesting that land ownership is clearly
associated with poverty. At the end of the nineties, therefore, the share of land poor households in
the total poor population has increased – from 12 to 14 percent for landless households and from
55 to 61 percent for marginal landholding households.
It is in this backdrop that the State government has constituted the Land Reforms Commission in
June, 2006 to look into the issues of land ceiling, land consolidation and occupancy/tenancy rights.
It also has been mandated to analyse the rural turmoil in the backdrop of land related disputes and
recommend remedial measures accordingly. The Commission is to look into feasibility and impact
of co-operative farming, giving due importance to the rights and concerns of the small and
marginal farmers. Table 2.28 : Rural Poverty Incidence and Shares by Land Ownership
50th round 55th round
Land owned (ha)
%of rural population
Poverty incidence
% % Share
of the poor % of rural population
Poverty incidence
% share of the poor
No land 9 51 12 10 56 14 0<*<=o.4ha 43 51 55 53 46 61 0.4<*<=1ha 24 34 20 20 29 15 1<*<=2ha 15 28 10 10 30 7 2<*<=4ha 7 18 3 4 16 2 >4ha 3 6 0 2 18 1 Overall 100 40 100 100 40 100

45
Source : NSSO 50th and 55th Rounds
Policy Initiatives
New Agricultural Policy was made by the State government in 2006, to build upon the natural advantages that State has in agriculture. Its fertile land, huge water resources and conducive climatic conditions imply tremendous potential to the agricultural sector. Despite this, productivity of crops in Bihar compare poorly with other states. Thus, at the core of the new agricultural policy for Bihar is the focus on increasing productivity of crops, not merely in comparison with the national average but in comparison with the best productivity standards achieved in any State in India. Following major initiatives have been taken by the State government in last one year:
Food security, Increase in farmer’s income, Increase in crop productivity and Environmental conservation have been fixed as the four targets of new agricultural policy regime.
ATMAs have been constituted in 23 districts of the State which did not have its ATMA coverage under the centrally sponsored programme. Thus all the districts of the State now have ATMA coverage.
A megaproject for establishment of soil testing laboratories in all 534 blocks of the State has been sanctioned, to take soil testing facilities right to the door of the farmers.
31 new seed testing laboratories are to be established in the State to give each district its own seed testing laboratory.
Chief Minister Horticulture Mission has been started in 19 districts of the State which were not covered under National Horticulture Mission, thereby universalizing the programme in the State.
Micro-nutrient testing laboratories have been established in 3 districts of the State.
Research and Educational infrastructure of Rajendra Agricultural University, which happens to be the only agricultural university of the State, has been strengthened.
Agricultural Produce Marketing Board has been abolished
Bihar State Seed Corporation has been revived, and seed production has been started on 45 state agricultural farms which were lying inoperative.
Agricultural Produce Marketing Board has been abolished.
Farmers’ Commission has been established..
Land Reform Commission has been established

46