status of black and latino young males april 2014
TRANSCRIPT

Social, Demographic, and Economic Profile of
Young Black and Latino Males
Boston, Massachusetts 2010 – 2018
James Jennings, PhD
Tufts University
Medford, Massachusetts 02155
April 2014
2
Acknowledgement
I wish to acknowledge the leadership and support provided by Rahn Dorsey, Director of Evaluation at
The Barr Foundation, and Makeeba McCreary, Executive Director of AbekaM, in the initiation and
completion of this research report. Both Rahn and Makeeba continue to engage a range of community
and civic representatives regarding the importance and challenge of ensuring that all young people in the
City of Boston have access to opportunities for advancing their education and economic well-being. I
would also like to acknowledge several individuals who assisted in the preparation of this report; they
include Yvette Modestin; Jacqueline Calderon; Dr. Kimberly Moffitt; Lisa Roland Labiosa, and
especially Ashley E. Harding. These individuals assisted with collecting and preparing data, but also
provided invaluable insights regarding the meaning of some of the data collected.

3
Executive Summary
The purpose of this research report is to document a social and economic profile of Black and Latino
male youth in the City of Boston, Massachusetts. It presents and reviews data on poverty, education,
household characteristics, and other demographic factors pertaining to the experiences of young Back and
Latino males. The genesis of the report was spearheaded by Rahn Dorsey, Director of Evaluation at The
Barr Foundation, and Makeeba McCreary, Executive Director of AbekaM. It is based, in part, on their
numerous community meetings in 2011 and 2012 and which generated 3 key questions regarding the
status of young Black and Latino males in Boston:
What is happening with Black and Latino boys in Boston?
What kinds of opportunities are available for creating positive impacts, and what is working?
How can we work together to get vastly improved outcomes for this population?
There are several developments adding urgency regarding the needs and challenges facing young
Black and Latino males. An immediate reason is demographic in nature. When one examines the
demography of Black and Latino youth, including females, it is clear that they represent a key part of the
city’s future social and economic well-being. Yet the data also reveals that both these groups stand apart
from others in the City in terms of social and economic well-being, including extraordinarily high levels
of poverty. These kinds of living conditions, which also impact young women in these communities,
cannot be minimized or ignored. The current and future status of young Black and Latino males is critical
not only for this population, but the overall health and success of their communities, and the City of
Boston.
The data in this report is based on collection and analysis of a range of census data, including the
2010 Decennial Census; American Community Survey 2007-2011 5 Year Estimates; and American
Community Survey 2007-2011 Public Use Microdata Samples (PUMS).1 Additionally, census-based
population estimates and projections were utilized to show the future growth of these populations. The
ACS 2007-2011 5 Year Estimates is used as a major data base for this report since this was available at
the start of this research report. A few new items were added to this survey in 2008. These items are
captured in the ACS 2008-2012 5 Year Estimates, and are included in various places. The data includes
information for the following racial groups: Whites (and Whites who are not Latino), Blacks or African-
Americans, Asians, and Latinos. In a few instances, charts and graphs are utilized to accompany tables
and to emphasize some findings, visually.
Some key findings emerging from a review of these data bases include:
Black and Latino males comprise almost two thirds (61%) of all males 19 years and under; they
also make up 59.1% of all 5 year old males in Boston
Approximately one third (33%) of all Black males in Boston are 19 years of age or younger; a
slightly higher proportion (35%) of all Latino males are 19 years or younger. The comparable
figure for Whites is 16%; for all Asian males, one fifth (20.3%) are 19 years or younger.
1 It should be noted that while the decennial census is an actual count of the population, the American
Community Survey is a sample of the population and therefore the findings have margins of errors. These are
reported by the American Community Survey.

4
Place of birth and citizenship by specific ages shows that approximately one fifth (20.3%) of all
Black males 13 years of age were born outside the United States, including Puerto Rico, Guam,
the Virgin Islands or Northern Marianas; this figure increases to 27.9% for all 17 year olds, and
51.1% for all 20 years old.
Young Latinos, ages 13 to 21 years, have varying ability to speak English very well. As an age
group, 87.1% report speaking English well; only 17 year olds in this grouping reflect a lower
response (67.7%) to speaking English very well.
The projected growth (2018) of Black and Latino youth, 5 to 14 years of age shows a large
concentration in Mattapan, and parts of Roxbury, and South Dorchester.
Large concentrations of Latino youth (0 – 19 years of age) are projected (2018) in East Boston,
and Roxbury, and parts of Mattapan, South Dorchester, and North Dorchester.
Almost half of all Black grandparents (45.4%), and 42.9% of all Latino grandparents are
responsible for their own grandchildren under 18 years of age; the percentage of White
grandparents, who are not Latino, is 31.4%%, and of Asian grandparents, 14.6%.
Blacks and Latinos have a higher proportion of young Non Relatives in their households. One
tenth (10.1%) of all Black households include Non Relatives who are 1 to 17 years of age; the
figure for Latino households is higher at 12.3%. Compared to these rates, White households
have a relatively low rate of young Non Relatives living in households (8.9%), and the rate for
Asian households is 9.4%
Almost half (47.1%) of all Black persons, 3 years and over, were enrolled in nursery school,
preschool, kindergarten, or attending grades 1 to 8; the comparable figure for Latinos is more
than half, at 50%. This compares to slightly less than one fifth (19.5%) of all Asians enrolled in
the same schooling levels, and only 16.4% of all Whites.
Almost one third (31.8%) of all Black students in grades 11 and 12 worked at a job; for Latinas
in these same grades, more than one third (36%) worked at a job. The citywide figure for Blacks,
Latinos, Asians, and Whites are not Latino, was 19.5%.
The Black male unemployment rate (21.1%) was several points higher than that for Black females
(15.2%); this is reversed with Latino males who had an unemployment rate (13.7%) lower than
that for Latinas (15.2%). The unemployment rate for White males who are not Latino was 6.1%.
Almost half (49.8%) of all Latino children, 1 to 15 years of age receive public assistance; the
figure for Black children in the same age category is 44.6%; for Whites who are not Latino,
22.4%, and Asian children, 24.2%.
The overwhelming majority (85.3%) of all young people in Boston who are 17 years and under,
and impoverished, are Blacks and Latinos.
In terms of disability status (in any of 6 areas), Black males, ages 5 to 17 years registered the
highest percentage (19.3%) compared to Black females (8.9%); the figure for White males was
12.9%, and White females, 10%.

5
The percentage of disability status for Latino males and females, ages 5 to 17, showed a large
degree of variability by Latino ancestry; but overall Latino males were at 12.8%, and Latinas at
11.2%.
There are at least four themes emerging from the census findings reported here. One, the Black
and Latino youth of Boston reflect a demographic bubble. They represent a dominant group,
demographically speaking, that represents an important part of Boston’s future.
Second, these two groups have vastly different family and household experiences than their
fellow Whites, and to a certain extent, Asian persons. Black and Latino families tend to be larger; they
tend to be more extended in terms of non-relatives living in Black and Latino households; and, at the
same time, there are indications of greater levels of overcrowding compared to Whites.
Third, the school and educational experiences of Black and Latinos, and especially males in these
two groups, are very different than that of Whites, and in some cases Asians. And, a forth theme is the
continuing economic vulnerability for young Black and Latino persons in this city. The latter includes
extraordinarily high levels of poverty among Black and Latino youth.
Discussion and further investigations about these themes and other findings can help to expand
our collective knowledge about the social and economic experiences of young males in Black and Latino
communities. In turn this could lead to adoption and design of more effective policies and practices in the
areas of economic development; workforce strategies; human services; and public education.
Two observations about this report are in order. It should be noted that a report on Black and
Latino young men does not alleviate concerns about young women in these same groups. In fact, data
about young men of color is complimentary to efforts responding to the needs facing young girls of color
in Boston. This is a point emphasized by several advocates for Black and Latina girls in Boston. Further,
this report should be received only as a part of a growing call on the part of a range of professional and
community voices for information and analysis regarding the status and future of Black and Latino boys.
Hopefully, the report helps to build a foundation for continual exploration of data which amplifies our
understanding of the social, economic, and educational, and health challenges facing young men of color
in cities like Boston, and urban places.

6
List of Tables, Charts, and Maps Table 1: Total Population by Race
Table 2: Total Population by Latino Origin
Table 3: Latino Population by Race
Table 4: Median Age by Sex and Race
Table 5: Average Household Size
Table 6: Nativity and Citizenship for Males Under 18 Years of Age by Race and Latino Origin
Table 7: Nativity and Citizenship for Females Under 18 Years of Age by Race and Latino Origin
Table 8: Latino Males 13 years to 21 years by Ability to Speak English
Table 9: Latino Youth, 13 years to 21 years by Select National Origins and Ability to Speak English
Table 10: Geographical Mobility in the Past Year for Current Resident in the United States by Race
and Latino Origin
Table 11: Age Structure by Total Population, Race and Latinos, and Males
Table 12: Age Structure by Total Population, Race and Latinos, and Females
Table 13: Number of Youth Under 19 Years of Age by Race and Latino Origin
Table 14: Grandparents Responsible for own Grandchildren under 18 years, by Race and Latino Origin
Table 15: Family Household Type by Race and Latino Origin
Table 16: Household Size by Race and Latino Origin
Table 17: Presence of Non Relatives in Households Age Ranges
Table 18: Population Enrolled in School by Level, 3 Years and Over, Race and Ethnicity
Table 19: Presence of Students in Grades 11 and 12 Working at a Job
Table 20: Homeownership and Rental Rates by Race and Ethnicity
Table 21: Housing Occupancy
Table 22: Per Capita Income Past 12 Months, by Race and Ethnicity
Table 23: Persons in Poverty Past 12 Months by Age, Race, and Ethnicity
Table 24: Proportion of Black and Latino Persons Among All Impoverished
Persons, 17 Years and Under
Table 25: Poverty Status Past 12 Months by Male, Age, and Race and Latino Origin
Table 26: Poverty Status Past 12 Months by Female, Age, and Race and Latino Origin
Table 27: Impoverished Persons by Family Type and Age of Children, Race and Latino Origin
Table 28: Households in Receipt of SNAP (Food Stamps) by Race and Latino Origin
Table 29: Households Receiving Supplement Nutrition Assistance Program (Food Stamps)
Table 30: Persons on Public Assistance by Ages 1 to 15 Years, and Race and Latino Origin
Table 31: Percent With Disability by Race, Latino Origin, Sex, and Ages 5 to 17 Years
Table 32: Employment and Labor Force Characteristics by Race and Latino Origin
Table 33: Employment and Labor Force Characteristics for Males by Race and Latino Origin
Chart 1: Average Household Size
Chart 2: Percent Distribution of Males by Racial Groups and Latinos
Chart 3: Households by Proportion of Persons in Households Under 18 Years Old
Chart 4: Proportion of all Grandparents Responsible for Grandchildren under 18 Years of Age
Chart 5: Presence of Non-Relatives in Households by Age Ranges
Chart 6: Per Capita Income Levels for Blacks, Latinos, Asians, and Whites
Chart 7: Poverty Level by Race and Latino Origin
Chart 8: Children 17 Years and Younger Impoverished by Race and Ethnicity
Chart 9: Distribution of Children Under 18 Years in Poverty by Family Household Type,
Race and Latino Origin
Chart 10: Persons on Public Assistance by Ages 1 to 15 Years, and Race and Latino Origin
Chart 11: Percent of Disability for Puerto Ricans and Dominicans 5 to 17 Years Old
Chart 12: Persons Under 18 Years with Disability, by Race and Latino Origin
Chart 13: Male Employment and Unemployment by Race and Latino Origin
Chart 14: Unemployment Levels by Race and Latino Origin

7
Map 1: Projected Population (2018) and Distribution of Black and Latino Youth, 5 Years to 14 Years
Map 2: Projected Population (2018) of Latino Males, Under 1 Year to 19 Years
Map 3: Projected Population (2018) of Black Males, Under 1 Year to 19 Years
Map 4: Neighborhood Concentrations of Grandchildren Living with Grandparents
Map 5: Percentage of Males, Less than 9th Grade Education
Map 6: Number of Males with Incomes below Official U.S. Federal Poverty Level
Map 7: Unemployment Rate for Black Males, 16 Years+
Map 8: Unemployment Rate for Latino Males, 16 years +

8
Introduction
This report is primarily based on census data and aimed at providing contextual demographic,
social, and economic information about the experiences of Black and Latino boys in Boston,
Massachusetts. The report is framed by certain queries raised in a series of community meetings
in 2011 and 2012:
What are key population characteristics pertaining to Black and Latino boys in Boston? (Pages 9-11)
What ancestries are reported for these groups? What are nativity characteristics? What
are language characteristics? (Page 12)
Where do we find concentrations and projected concentrations of Black and Latino
youth? (Pages 15-17, 26 and 45)
How are Black and Latino boys similar or different in terms of age structure compared to
others? (Pages 19 and 22)
What is the ‘grand-parenting’ experiences for Black and Latino youth? (Pages 24-26)
What are the key family characteristics for Black and Latino youth? (Page 8)
What are the schooling characteristics, by age, for Black and Latinos?? (Pages 27 and 28)
What are the housing characteristics reported for Blacks and Latinos? How many live in
owned, or rental units? What is the degree of overcrowding? (Page 32)
What are income and poverty characteristics for these two groups? What proportions of
Black and Latino youth live in households receiving SNAP (food stamps), or Social
Security Income? (Pages 33-42)
What are employment and labor force characteristics for Black and Latino Youth? (Pages 46-49)
These queries have implications for assessing current public policies, government
practices and actions. There are also implications for how services can be conceptualized and
implemented, in ways that produce maximum benefits and lead to the closing of social and
economic gaps between Black and Latino males in Boston, and other groups.

9
Findings
The first query helps to present a general demographic context that leads to questions
drilling into the experiences of Black and Latino youth. Based on the actual count of the
population, the 2010 decennial census, the tables and charts under the first query touch upon
general population characteristics.
What are key population characteristics pertaining to Black and Latino boys in
Boston?
Table 1: Total Population by Race
Boston
Total Persons: 617,594
White alone 33,3033 53.9%
Black or African American alone 150,437 24.4%
American Indian and Alaska Native alone 2,399 0.4%
Asian alone 55,235 8.9%
Native Hawaiian and Other Pacific Islander alone 265 0.0%
Some Other Race alone 51,893 8.4%
Two or More Races 24,332 3.9%
Source: 2010 Census
The Black population of Boston represented almost one quarter of the total population officially
reported in the decennial census for 2010.
Table 2: Total Population by Latino Origin2 Boston
Total Persons: 617,594
Not Hispanic or Latino 509,677 82.5%
Hispanic or Latino 107,917 17.4
Source: 2010 Census
Latinos/a comprised slightly higher than one fifth (21.2%) of all persons in Boston.
2 The term ‘Latino’ and ‘Hispanic’ can be used interchangeably. Latino is not considered a racial classification,
currently; thus they can be included under racial categories.
10
Table 3: Latino Population by Race Boston
Total Persons 617,594
Not Latino 509,677
White alone 290,312 57.0%
Black or African American alone 138,073 27.1%
American Indian and Alaska Native alone 1,227 0.2%
Asian alone 54,846 10.8%
Native Hawaiian and Other Pacific Islander alone 182 0.0%
Some Other Race alone 10,078 2.0%
Two or More Races 14,959 2.9%
Hispanic or Latino: 107,917
White alone 42,721 39.6%
Black or African American alone 12,364 11.5%
American Indian and Alaska Native alone 1,172 1.1%
Asian alone 389 0.4%
Native Hawaiian and Other Pacific Islander alone 83 0.1%
Some Other Race alone 41,815 38.7%
Two or More Races 9,373 8.7%
Source: 2010 Census
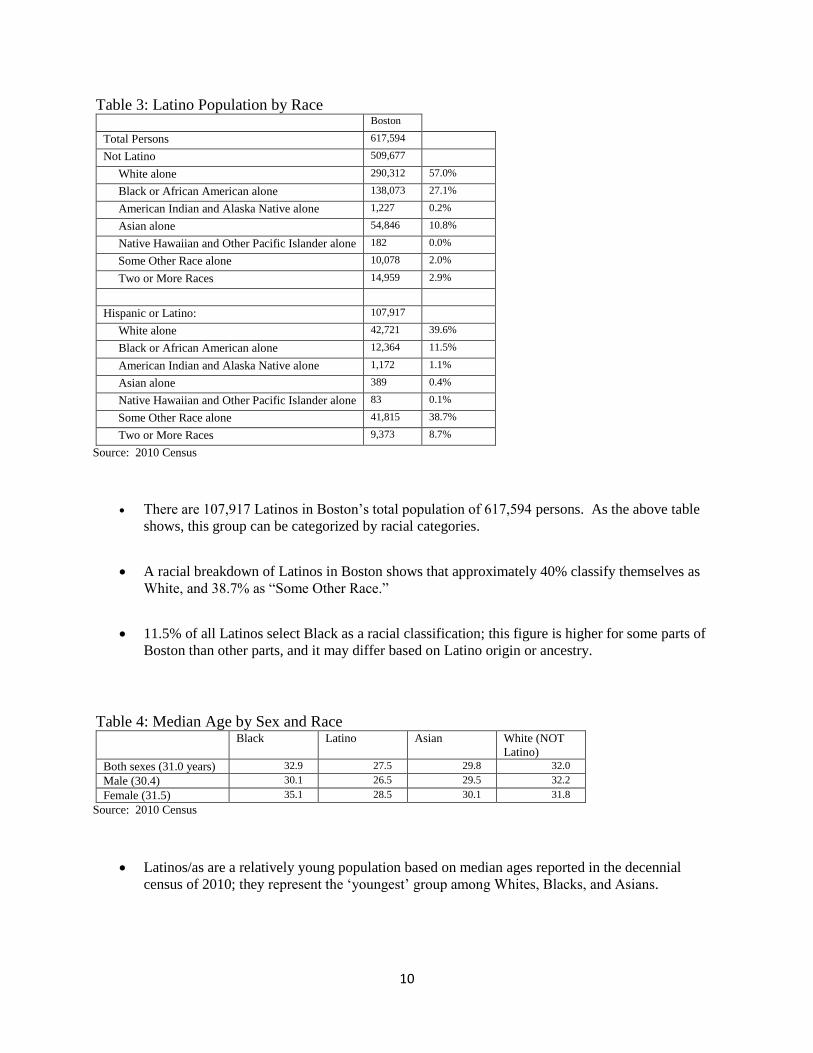
There are 107,917 Latinos in Boston’s total population of 617,594 persons. As the above table
shows, this group can be categorized by racial categories.
A racial breakdown of Latinos in Boston shows that approximately 40% classify themselves as
White, and 38.7% as “Some Other Race.”
11.5% of all Latinos select Black as a racial classification; this figure is higher for some parts of
Boston than other parts, and it may differ based on Latino origin or ancestry.
Table 4: Median Age by Sex and Race Black Latino Asian White (NOT
Latino)
Both sexes (31.0 years) 32.9 27.5 29.8 32.0
Male (30.4) 30.1 26.5 29.5 32.2
Female (31.5) 35.1 28.5 30.1 31.8
Source: 2010 Census
Latinos/as are a relatively young population based on median ages reported in the decennial
census of 2010; they represent the ‘youngest’ group among Whites, Blacks, and Asians.

11
Table 5: Average Household Size Average household size Black Latino Asian White
Total Person(s): 2.59 2.93 2.36 2.01
Source: 2010 Census
The average household size indicates that Latinos tend to live in larger families than other groups
(2.93), followed by Blacks (2.59), and Asians (2.36). Whites reflect a significantly smaller
average household size (2.01). This is also illustrated in the following chart.
Chart 1: Average Household Size
2.01
2.59
2.93
2.36
WHITE BLACK LATINO ASIAN
Average Household Size

12
What ancestries are reported for these groups? What are nativity characteristics?
What are language characteristics?
Table 6: Nativity and Citizenship for Males Under 18 Years of Age by Race and
Latino Origin Black Latinos Asian Whites, not
Latino
Males Under 18 Years 20,226 15,161 3,955 18,317
Native Born 18,798 86.8% 13,363 78.8% 3,363 74.0% 17,112 87.7%
Foreign Born 1,428 6.6% 1,798 10.6% 592 13.0% 1,205 6.2%
Naturalized Citizen 573 405 249 344
Not U.S. Citizen 855 6.7% 1,393 77.4% 343 57.9% 861 71.4%
Source: ACS 2007- 20011
Approximately 10.6% of all Latino males under 18 years of age are foreign-born; the figure for
Black youth in this same age category is 6.6%. Asians under 18 years, while relatively few in
number compared to the other groups, report a rate of 13% foreign born. White males under 18
years of age, and who are not Latino, have the lowest foreign born rate, at 6.2%.
Only including the foreign born population, a high proportion of young Latino males under 18
years (77.4%) followed by Whites in the same age category (71.4%) are not citizens.
In terms of all Latino males under 18 years, 9.1% are not citizens; for Blacks it is 4.2%; Asian
males under 18 years of age, 8.6%; and for Whites who are not Latino in the same age, it is 4.7%.

13
Table 7: Nativity and Citizenship for Females Under 18 Years of Age by Race and
Latino Origin Black Latina Asian Whites,
Not
Latina
Females Under 18 Years 20,076 15,324 3,405 17197
Native Born 18,581 92.6% 13,916 90.8% 2,818 82.8% 16299
94.7%
Foreign Born 1,495 7.4% 1,408 9.2% 587 17.2% 898
5.2%
Naturalized Citizen 463 210 158 279
Not U.S. Citizen 1,032 1,198 429 619
Source: ACS 2007 – 2011
The proportion of foreign born population for Black and Latina women under 18 years of age
look similar, more or less, with their male counterparts, except for the relatively high percentage
of Asian women who are 18 years or under, and foreign born.

14
Table 8: Latino Males 13 years to 21 years by Ability to Speak English Very well* Well Not well Not at all
Total Latino Persons 87.1% 3.6% 9.3% 0%
13 years 79% 0% 21% 0%
14 years 88.3% 6.3% 5.4% 0%
15 years 91.3% 0% 8.7% 0%
16 years 100% 0% 0% 0%
17 years 67.7% 17.7% 14.6% 0%
18 years 100% 0% 0% 0%
19 years 80% 11.4% 8.6% 0%
20 years 95.1% 0% 4.9% 0%
21 years 82.9% 0% 17.1% 0%
*“Very well,” and other categories are self-reported; see: American Community Survey and
Puerto Rico Community Survey 2012 Subject Definitions and, for earlier definitions, http://www.census.gov/acs
Source: ACS 2007- 2011 PUMS
Young Latinos, ages 13 to 21 years, have varying ability to speak English very well. As an age
group, 87.1% report speaking English well; only 17 year olds in this grouping reflect a lower
response (67.7%) to speaking English very well.
Table 9: Latino Youth, 13 years to 21 years by Select National Origins and
Ability to Speak English Latino Youth 13 - 21 Years Very well Well Not well Not at all
Puerto Rican 84.3% 4.6% 11.1% 0%
Dominican 92.9% 4.7% 2.4% 0%
Guatemalan 47.6% 0% 52.4% 0%
Honduran 67.4% 0% 32.6% 0%
Panamanian 100% 0% 0% 0%
Salvadoran 100% 0% 0% 0%
Source: PUMS 2007 - 2011
If country of origin is considered for the age group, 13 to 21 years, then some significant
differences in speaking English very well, emerge; Panamanian, Salvadoran, Dominican, and
Puerto Rican youth report high levels of being able to speak English well; Honduran and
Guatemalan youth in this age category, however, score much lower (67.4% and 47.6%
respectively).

15
Where do we find concentrations and projected concentrations of Black and Latino
youth?
The map below shows the 2018 projection of Black and Latino males, ages 5 to 14 years, as a
percentage of all persons (male and female) in the same age category by census tracts and Boston
Redevelopment Authority planning districts.
The projected growth (2018) of Black and Latino youth, 5 to 14 years of age, show
concentrations in Mattapan, and parts of Roxbury, and South Dorchester.
Map 1: Projected Population (2018) and Distribution of Black and Latino Youth, 5 Years to 14
Years3
3 Population estimates (2013) and projections (2018) were generated based on raw data provided by Synergos
Technologies, Inc.

16
Large concentrations of Latino youth (0 – 19 years of age) are projected (2018) in East Boston,
and Roxbury, and parts of Mattapan, South Dorchester, and North Dorchester.
Map 2: Projected Population (2018) of Latino Males, Under 1 year to 19 yearss

17
Concentrations of Black youth (0 to 19 years of age) are projected in Roxbury and Mattapan, and
parts of South Dorchester and North Dorchester.
Map 3: Projected Population (2018) of Black Males, Under 1 year to 19 years
18
Table 10: Geographical Mobility in the Past Year for Current Resident in the United States
by Race and Latino Origin Boston Blacks Asians Latinos Whites
Same house 1 year ago 82.6% 71.7% 76.9% 73.3%
Moved within same county 12.5% 11.2% 15.2% 12.6%
Moved from different county within
same state
2.6% 4.2% 3.0% 5.8%
Moved from different state 1.6% 6.5% 2.5% 6.4%
Moved from abroad 0.7% 6.4% 2.4% 1.9%
Source: ACS 2007-2011
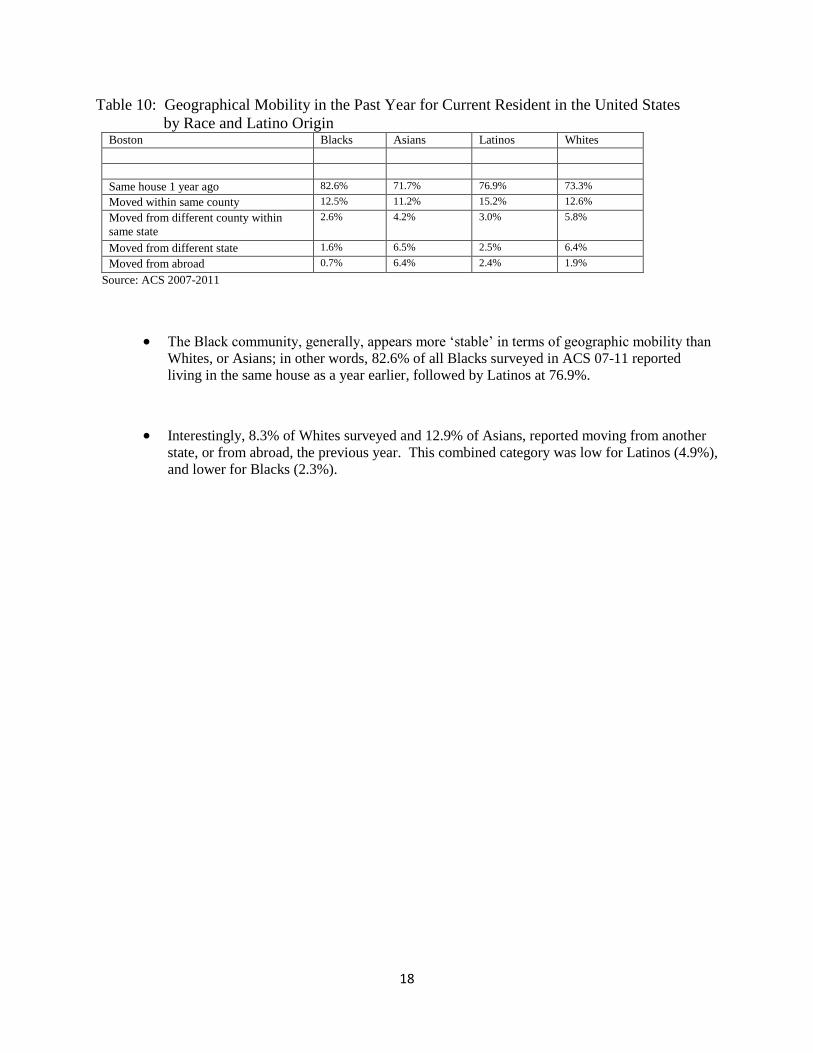
The Black community, generally, appears more ‘stable’ in terms of geographic mobility than
Whites, or Asians; in other words, 82.6% of all Blacks surveyed in ACS 07-11 reported
living in the same house as a year earlier, followed by Latinos at 76.9%.
Interestingly, 8.3% of Whites surveyed and 12.9% of Asians, reported moving from another
state, or from abroad, the previous year. This combined category was low for Latinos (4.9%),
and lower for Blacks (2.3%).

19
How are Black and Latino boys similar or different in terms of age structure,
compared to others?
Table 11: Age Structure by Total Population, Race and Latinos, and Males Total
Population
Blacks Latinos* Asian Whites
Total: 617,594 150,437 107,917 55,235 333,033
Male: 295,951 68,763 52,411 26,218 163,375
Under 5 years 16,442 4,999 7.3% 4,734 9.0% 1,064 4.1% 6,806 4.2%
5 to 9 years 13,640 5,253 7.6% 4,246 8.1% 967 3.7% 4,519 2.8%
10 to 14 years 13,542 5,580 8.1% 4,105 7.8% 986 3.8% 4,054 2.5%
15 to 17 years 9,078 3,797 5.5% 2,721 5.2% 685 2.6% 2,637 1.6%
18 and 19
years
14,760 3,078 4.5% 2,555 4.9% 1,642 6.3% 8,132 5.0%
20 years 9,343 1,509 2.2% 1,437 2.7% 988 3.8% 5,820 3.6%
21 years 8,583 1,359 2.0% 1,297 2.5% 928 3.5% 5,344 3.3%
22 to 24 years 24,362 3,733 5.4% 3,561 6.8% 2,466 9.4% 15,530 9.5%
25 to 29 years 36,214 5,025 7.3% 5,181 9.9% 3,734 14.2% 23,631 14.5%
30 to 34 years 26,351 4,251 6.2% 4,626 8.8% 2,391 9.1% 16,463 10.1%
35 to 39 years 19,936 4,035 5.9% 3,802 7.3% 1,880 7.2% 11,446 7.0%
40 to 44 years 18,163 4,388 6.4% 3,472 6.6% 1,386 5.3% 9,997 6.1%
45 to 49 years 17,865 4,905 7.1% 3,004 5.7% 1,336 5.1% 9,502 5.8%
50 to 54 years 16,444 4,415 6.4% 2,418 4.6% 1,249 4.8% 9,056 5.5%
55 to 59 years 14,258 3,705 5.4% 1,806 3.4% 1,106 4.2% 8,069 4.9%
60 and 61 years
5,181 1,288 1.9% 617 1.2% 432 1.6% 3,005 1.8%
62 to 64 years 6,639 1,730 2.5% 719 1.4% 477 1.8% 3,933 2.4%
65 and 66
years
3,703 934 1.4% 372 0.7% 311 1.2% 2,225 1.4%
67 to 69 years 4,773 1,230 1.8% 443 0.8% 426 1.6% 2,839 1.7%
70 to 74 years 6,125 1,526 2.2% 564 1.1% 654 2.5% 3,537 2.2%
75 to 79 years 4,512 947 1.4% 385 0.7% 545 2.1% 2,738 1.7%
80 to 84 years 3,309 614 0.9% 199 0.4% 313 1.2% 2,205 1.3%
85 years and
over
2,728 462 0.7% 147 0.3% 252 1.0% 1,887 1.2%
* In this table Latinos can be included under the racial categories
Source: 2010 Census
Young Black and Latino males comprise a signifificant proportion of all Black and Latino males.
Approximately one third (33%) of all Black males in Boston are 19 years of age or younger; a
slightly higher proportion (35%) of all Latino males are 19 years or younger. The comparable
figure for Whites is 16%; for all Asian males, one fifth (20.3%) are 19 years or younger.

20
Chart 2: Percent Distribution of Males by Racial Groups and Latinos
The chart above shows that very young Black and Latino males (Under 5 years; 5 to 9 years; 10
to 14 years) comprise significantly larger percentage of all males in their group than is the case
for Whites or Asians.
4.2% of all Whites are under 5 years of age, compared to 9% of all Latinos, and 7.3% of all
Blacks;
2.8% of all Whites are 5-9 years compared to 7.6% of all Blacks, and 8.11% of all Latinos; 2.5%
of all Whites are 10 – 14 years, compared to 8.1% of all Blacks, and 7.8% of all Latinos;
1.6% of all Whites are 15 to 17 years, compared to 5.5% of all Blacks, and 5.2% of all Latinos
4.2%
2.8%2.5%
1.6%
5.0%
7.3%7.6%
8.1%
5.5%
4.5%
9.0%
8.1% 7.8%
5.2%4.9%
4.1%3.7% 3.8%
2.6%
6.3%
Under 5 years 5 to 9 years 10 to 14 years 15 to 17 years 18 and 19 years
Percent Distribution of Males by Racial Groups and Latinos, Under 5 years and 5 years to 19 Years
Whites Blacks Latinos Asians

21
Table 12: Age Structure by Total Population, Race and Latinos, and Females Total
Population
Blacks Latinas* Asian Whites
Total: 617,594 150,437 107,917 55,235 333,033
Female: 321,643 81,674 55,506 29,017 169,658
Under 5 years 15,978 5,108 6.3% 4,682 8.4% 991 3.4% 6,359 3.7%
5 to 9 years 13,183 4,952 6.1% 4,119 7.4% 921 3.2% 4,312 2.5%
10 to 14 years 12,981 5,257 6.4% 4,005 7.2% 946 3.3% 3,804 2.2%
15 to 17 years 8,866 3,776 4.6% 2,597 4.7% 658 2.3% 2,492 1.5%
18 and 19
years
17,122 2,934 3.6% 2,597 4.7% 2,004 6.9% 10,091 5.9%
20 years 9,899 1,520 1.9% 1,357 2.4% 1,068 3.7% 6,295 3.7%
21 years 9,066 1,416 1.7% 1,223 2.2% 985 3.4% 5,671 3.3%
22 to 24 years 26,876 4,184 5.1% 3,466 6.2% 2,845 9.8% 17,125 10.1%
25 to 29 years 38,477 6,079 7.4% 5,291 9.5% 4,032 13.9% 24,404 14.4%
30 to 34 years 27,042 5,457 6.7% 4,746 8.6% 2,670 9.2% 15,563 9.2%
35 to 39 years 20,720 5,382 6.6% 4,070 7.3% 2,042 7.0% 10,322 6.1%
40 to 44 years 18,522 5,664 6.9% 3,698 6.7% 1,563 5.4% 8,592 5.1%
45 to 49 years 18,125 5,881 7.2% 3,447 6.2% 1,476 5.1% 8,246 4.9%
50 to 54 years 17,726 5,708 7.0% 2,919 5.3% 1,300 4.5% 8,485 5.0%
55 to 59 years 15,960 4,777 5.8% 2,245 4.0% 1,368 4.7% 8,164 4.8%
60 and 61
years
6,070 1,779 2.2% 782 1.4% 528 1.8% 3,206 1.9%
62 to 64 years 7,943 2,317 2.8% 977 1.8% 558 1.9% 4,410 2.6%
65 and 66
years
4,483 1,413 1.7% 491 0.9% 325 1.1% 2,391 1.4%
67 to 69 years 5,722 1,709 2.1% 643 1.2% 475 1.6% 3,086 1.8%
70 to 74 years 8,104 2,244 2.7% 862 1.6% 760 2.6% 4,470 2.6%
75 to 79 years 6,638 1,681 2.1% 604 1.1% 641 2.2% 3,878 2.3%
80 to 84 years 5,808 1,266 1.6% 394 0.7% 459 1.6% 3,780 2.2%
85 years and over
6,332 1,170 1.4% 291 0.5% 402 1.4% 4,512 2.7%
* In this table Latinas can be included under the racial categories
Source: 2010 Census
The table above indicates that young Black (27%) females who are 19 years or younger also
comprise greater proportions of all persons in their groups than is the case for Whites (16%) or
Asians (18.8%). Latinas in this age category, 19 years or younger, represent 37.6% of all Latina
females.
22
Table 13: Number of Youth Under 19 Years of Age by Race and
Latino Origin Blacks Latinos* Asian Whites All Persons
Male
Under 5 years 4,999 4,734 1,064 6,806 16,442
5 to 9 years 5,253 4,246 967 4,519 13,640
10 to 14 years 5,580 4,105 986 4,054 13,542
15 to 17 years 3,797 2,721 685 2,637 9,078
18 and 19 years 3,078 2,555 1,642 8,132 14,760
22,707 18,361 5,344 26,148 67,462
Female
Under 5 years 5,108 4,682 991 6,359 15,978
5 to 9 years 4,952 4,119 921 4,312 13,183
10 to 14 years 5,257 4,005 946 3,804 12,981
15 to 17 years 3,776 2,597 658 2,492 8,866
18 and 19 years 2,934 2,597 2,004 10,091 17,122
22,027 18,000 5,520 27,058 68,130
* Latinos/as can be included in other racial categories
Source: 2010 Census
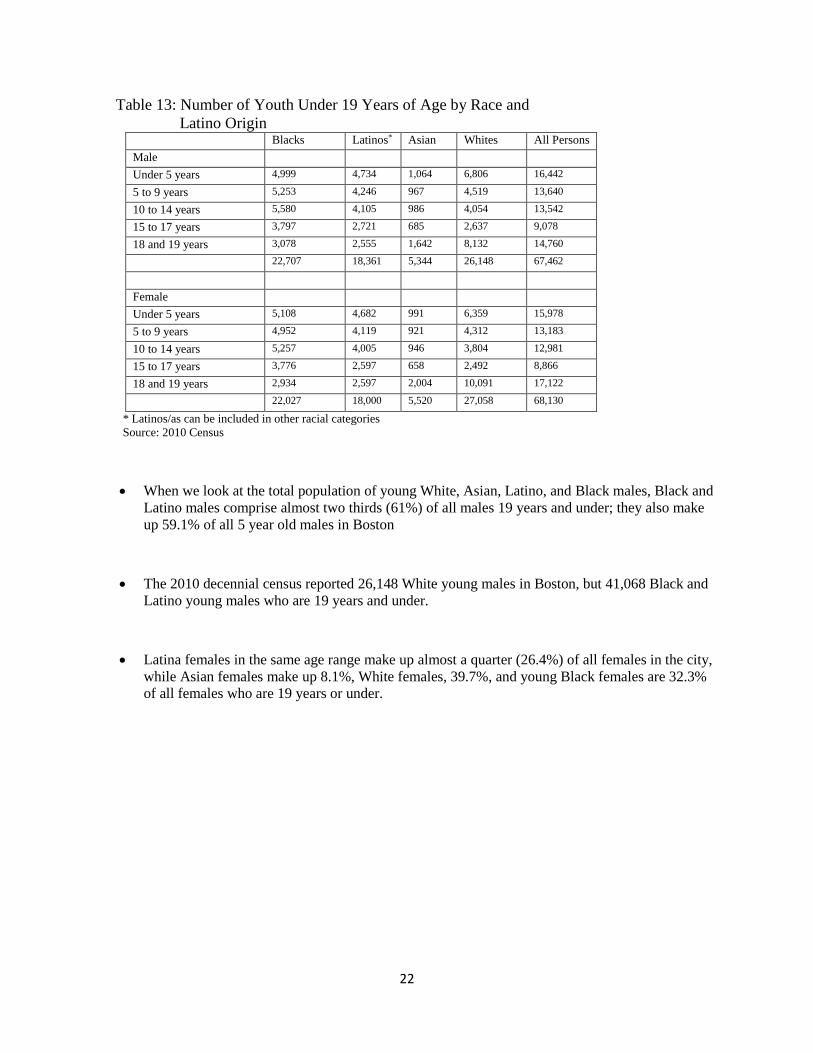
When we look at the total population of young White, Asian, Latino, and Black males, Black and
Latino males comprise almost two thirds (61%) of all males 19 years and under; they also make
up 59.1% of all 5 year old males in Boston
The 2010 decennial census reported 26,148 White young males in Boston, but 41,068 Black and
Latino young males who are 19 years and under.
Latina females in the same age range make up almost a quarter (26.4%) of all females in the city,
while Asian females make up 8.1%, White females, 39.7%, and young Black females are 32.3%
of all females who are 19 years or under.
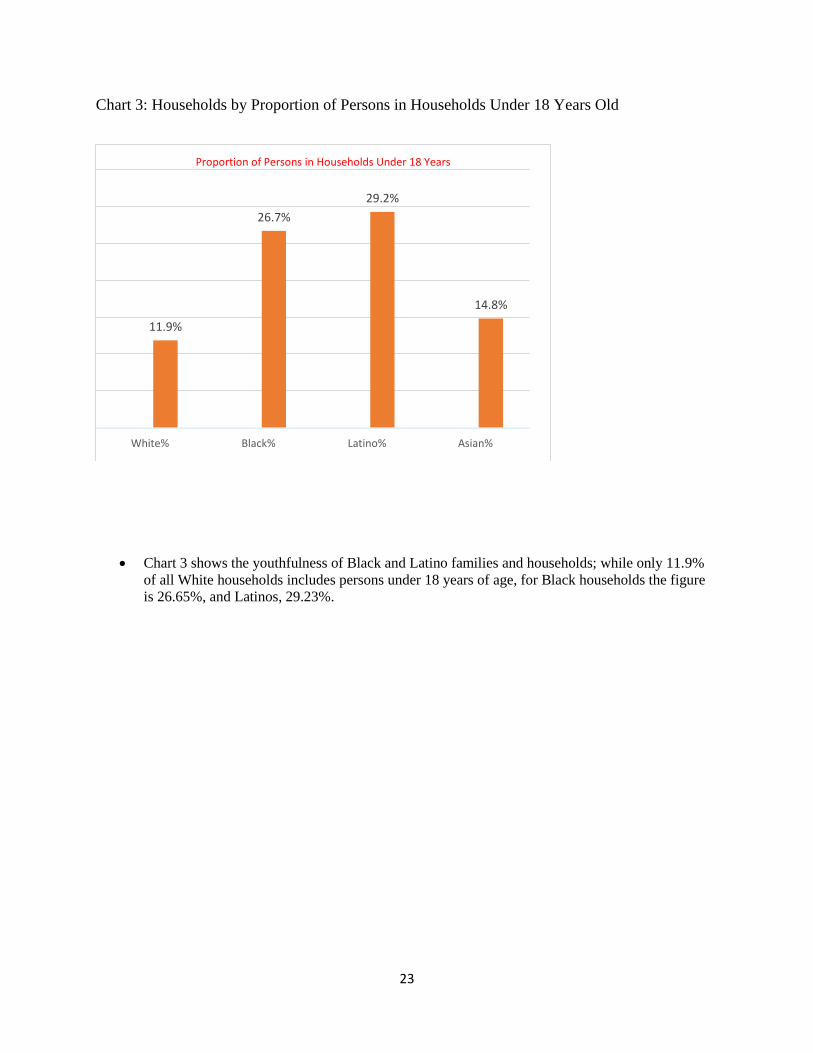
23
Chart 3: Households by Proportion of Persons in Households Under 18 Years Old
Chart 3 shows the youthfulness of Black and Latino families and households; while only 11.9%
of all White households includes persons under 18 years of age, for Black households the figure
is 26.65%, and Latinos, 29.23%.
11.9%
26.7%
29.2%
14.8%
White% Black% Latino% Asian%
Proportion of Persons in Households Under 18 Years
24
What is the ‘grand-parenting’ experiences for Black and Latino youth?
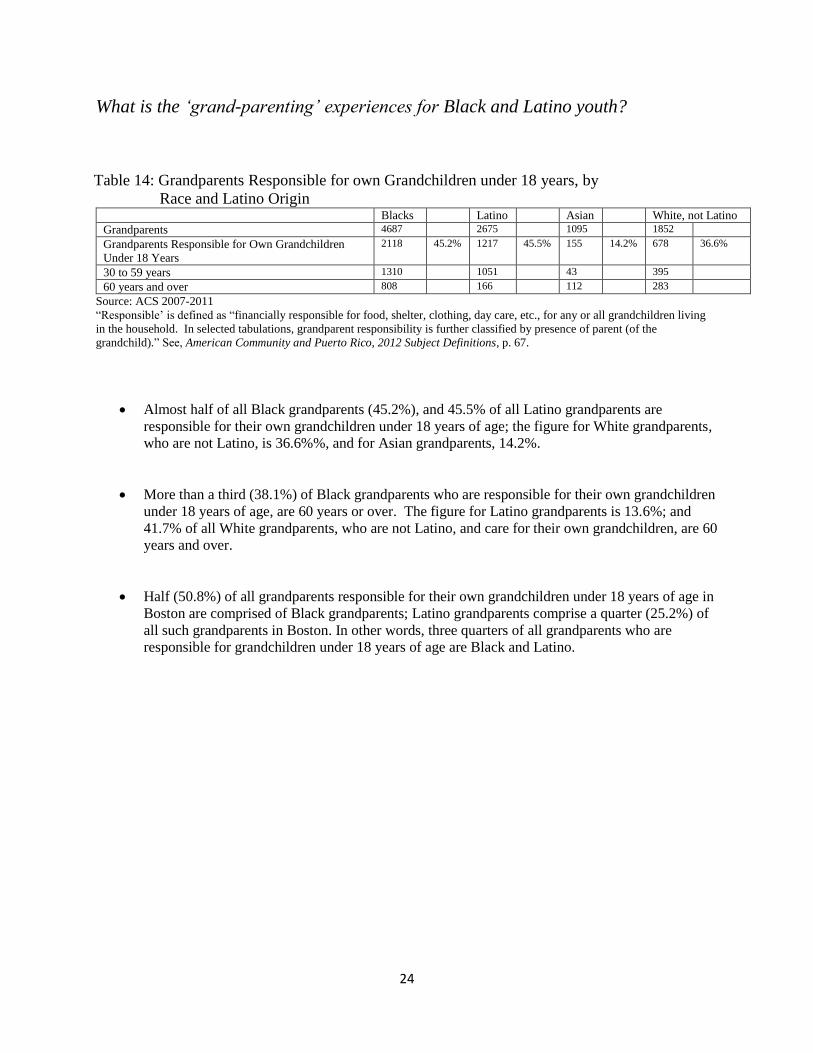
Table 14: Grandparents Responsible for own Grandchildren under 18 years, by
Race and Latino Origin Blacks Latino Asian White, not Latino
Grandparents 4687 2675 1095 1852
Grandparents Responsible for Own Grandchildren
Under 18 Years
2118 45.2% 1217 45.5% 155 14.2% 678 36.6%
30 to 59 years 1310 1051 43 395
60 years and over 808 166 112 283
Source: ACS 2007-2011
“Responsible’ is defined as “financially responsible for food, shelter, clothing, day care, etc., for any or all grandchildren living
in the household. In selected tabulations, grandparent responsibility is further classified by presence of parent (of the
grandchild).” See, American Community and Puerto Rico, 2012 Subject Definitions, p. 67.
Almost half of all Black grandparents (45.2%), and 45.5% of all Latino grandparents are
responsible for their own grandchildren under 18 years of age; the figure for White grandparents,
who are not Latino, is 36.6%%, and for Asian grandparents, 14.2%.
More than a third (38.1%) of Black grandparents who are responsible for their own grandchildren
under 18 years of age, are 60 years or over. The figure for Latino grandparents is 13.6%; and
41.7% of all White grandparents, who are not Latino, and care for their own grandchildren, are 60
years and over.
Half (50.8%) of all grandparents responsible for their own grandchildren under 18 years of age in
Boston are comprised of Black grandparents; Latino grandparents comprise a quarter (25.2%) of
all such grandparents in Boston. In other words, three quarters of all grandparents who are
responsible for grandchildren under 18 years of age are Black and Latino.

25
Chart 4: Proportion of all Grandparents Responsible for Grandchildren under 18 Years of Age
45.2% 45.5%
14.2%
36.6%
Blacks Latino Asian White, not Latino
Proportion of all Grandparents Responsible for Own Grandchildren Under 18 Years

26
In primarily Black and Latino areas throughout the city, relatively high numbers of grandchildren
under 18 years of age live with their grandparents as illustrated in the map below.
Map 4: Neighborhood Concentrations of Grandchildren Living with Grandparents

27
What are the key family characteristics for Black and Latino youth?
Table 15: Family Household Type by Race and Latino Origin Black Latino Asian White, not
Latino)
Total Households 55,547 34,510 20,696 137,489
Family households: 34,831 63% 23,077 67% 9,960 48% 46,237 34%
Husband-wife family 12,105 22% 8,715 25% 7,532 36% 34,755 25%
Male householder, no wife present 3,414 6% 2,753 8% 776 4% 3,219 2%
Female householder, no husband present 19,312 35% 11,609 34% 1,652 8% 8,263 6%
Nonfamily households: 20,716 37% 11,433 33% 10,736 52% 91,252 66%
Householder living alone 17,508 32% 8,138 24% 7,298 35% 59,435 65%
Householder not living alone 3,208 6% 3,295 10% 3,438 17% 31,817 23%
Source: 2010 Census
The Black and Latino population reflect a greater composition of family households than Whites
or Asians. More than two thirds (67%) of all Latino households are families and for Blacks the
figure is 63%. This compares to 48% for all Asian households, and 34% for White households.
The converse of the above finding is that two thirds (66%) of all White households are nonfamily
households; the comparable figure for Blacks is 37%, and for Latinos, 33%.

28
Table 16: Household Size by Race and Latino Origin Black Latino Asian White, not
Latino
Total: 55,547 34,510 20,696 137,489
Family households: 34,831 23,077 67.0% 9,960 48.0% 46,237 34.0%
2-person household 11,740 33.7% 5,874 25.5% 3,926 39.4% 25,458 55.1%
3-person household 9,617 27.6% 6,231 27.0% 2,361 23.7% 10,703 23.1%
4-person household 6,721 19.3% 5,356 23.2% 1,990 20.0% 6,540 14.1%
5-person household 3,854 11.1% 3,064 13.3% 899 9.0% 2,450 5.3%
6-person household 1,597 4.6% 1,424 6.2% 409 4.1% 728 1.6%
7-or-more-person household 1,302 3.7% 1,128 4.9% 375 3.8% 358 0.8%
Nonfamily households: 20,716 37.0% 11,433 33.0% 10,736 52.0% 91,252 66.0%
1-person household 17,508 84.5% 8,138 71.2% 7,298 68.0% 59,435 65.1%
2-person household 2,319 11.2% 2,167 19.0% 2,272 21.2% 22,959 25.2%
3-person household 532 2.6% 604 5.3% 696 6.5% 5,571 6.1%
4-person household 219 1.1% 306 2.7% 328 3.1% 2,326 2.5%
5-person household 88 0.4% 141 1.2% 92 0.9% 618 0.7%
6-person household 32 0.2% 51 0.4% 31 0.3% 201 0.2%
7-or-more-person household 18 0.1% 26 0.2% 19 0.2% 142 0.2%
Source: 2010 Census
Latino family households (47.6%) and Black households (38.7%), as do Asian family households
(37.8%), have a significantly greater proportion of large (4 persons or more) families, than White
households (21.8%)
Differences in the percent of households with 6 or more persons show an even greater difference
between Black, Latino, and White family households; the figure for Latino households is 11.1%;
for Black households, 8.3%; for Asian households 7.9%; and for White households, 2.4%.

29
Table 17: Presence of Non Relatives* in Households Age Ranges Blacks Asians Latinos** Whites
1 to 5 Years 4.0% 2.0% 5.1% 3.3%
6 to 13 Years 3.8% 5.2% 6.3% 4.4%
14 to 17 Years 2.3% 1.7% 0.9% 1.2%
Non-relatives are defined as including “any household member, including foster children, not related to the householder by birth,
marriage, or adoption.” See, American Community Survey and Puerto Rico Survey, 2012 Subject Definitions, p.74
** Latinos can be included in the three racial categories
Source: ACS 2007 – 2011 PUMS
Blacks and Latinos have a higher proportion of young Non Relatives in their households. One
tenth (10.1%) of all Black households include Non Relatives from 1 to 17 years of age; the figure
for Latino households is higher at 12.3%. Compared to these rates, White households have a
relatively low rate of young Non Relatives living in households (8.9%), and the rate for Asian
households is 9.4%
Chart 5: Presence of Non-Relatives in Households by Age Ranges
3.3% 4.0%2.0%
5.1%
4.4% 3.8%5.2%
6.3%1.2% 2.3%1.7%
0.9%
Whites Blacks Asians Latinos
Presence of Non-Relatives in Households by Age Ranges
1 to 5 Yrs 6 to 13 Yrs 14 to 17 Yrs

30
What are the schooling characteristics, by age, for Black and Latinos?
Table 18: Population Enrolled in School by Level, 3 Years and Over, Race and Ethnicity
Black Latino Asian White,
Not
Latino
Total: 147,381 100,421 53,817 280,803
Enrolled in school: 51,663 35.1% 35,255 35.1% 20,647 38.4% 79,173 28.2%
Enrolled in nursery school, preschool,
kindergarten
5,929 11.5% 4,025 11.4% 1,099 5.3% 4,209 5.3%
Enrolled in grade 1 to grade 8 18,404 35.6% 13,599 38.6% 2,941 14.2% 8,782 11.1%
Enrolled in grade 9 to grade 12 11,910 23.1% 7,336 20.8% 1,881 9.1% 4,303 5.4%
Enrolled in college or graduate school 15,420 29.8% 10,295 29.2% 14,726 71.3% 61,879 78.2%
Not enrolled in school 95,718 65,166 33,170 201,630
Source: ACS 2007 - 2011
Almost half (47.1%) of all Black persons, 3 years and over, were enrolled in nursery school,
preschool, kindergarten, or attending grades 1 to 8; the comparable figure for Latinos is more
than half, at 50%. This compares to slightly less than one fifth (19.5%) of all Asians enrolled in
the same schooling levels, and only 16.4% of all Whites.
29.9% of all Blacks over 3 years of age are enrolled in college or graduate school; the figure for
Latinos is essentially the same (29.2%); but the rates for Asians is 71.3%, and for Whites it is,
78.2%.
Table 19: Presence of Students in Grades 11 and 12 Working at a Job* Citywide Black Latino
Males 19.5% 31.8% 15.0%
Females 25.2% 21.5% 36.0%
* Jobs include employment for a wage or salary; stipends or honorariums, or payment for
work experiences are not included.
Source: ACS 2012 PUMS
Almost one third (31.8%) of all Black students in grades 11 and 12 worked at a job; for Latinas in
these same grades, more than one third (36%) worked at a job. The citywide figure for Blacks,
Latinos, Asians, and Whites are not Latino, was 19.5%.
The map below shows that in some parts of Boston, and particularly where young Black and
Latino males are concentrated, and projected to grow in numbers, there is a significant presence
of males with less than a 9th grade education.

31
Map 5: Percentage of Males, Less than 9th Grade Education

32
What are the housing characteristics reported for Blacks and Latinos? How many
live in owned, or rental units? What is the degree of overcrowding?
Table 20: Homeownership and Rental Rates by Race and Ethnicity Blacks Latinos Asian White, not
Latino
Total Occupied
Housing Units
56417 34265 20681 133752
Owner-Occupied 16351 29.0% 5487 16.0% 5484 25.4% 57844 43.2%
Renter-Occupied 40066 71.0% 28778 84.0% 16136 74.6% 75908 56.8%
Source: ACS 2007 - 2011
Latinos have low homeownership rates (16%) compared to other groups. About a quarter
(25.4%) of Asian occupied housing are owner-occupied, and for Blacks it is (29%). For Whites,
not Latino, the homeownership rate is reported at 43.2%.
The above homeownership rates mean that Blacks owned 19.1% of all occupied housing units in
Boston; Asians, 6.4%; Latinos also 6.4%; on the other hand, White homeowners who are not
Latino claim 67.9% of all owner-occupied housing units in Boston.
Table 21: Housing Occupancy*
Black Latino Asian White, not
Latino
Total Housing Units 56417 34265 20681 133752
1.00 or less occupants per room 54673 32023 19511 132427
1.01 or more occupants per room 1744 3.1% 2242 6.5% 1170 5.7% 1325 1.0%
* In this survey, and earlier decennial counts, overcrowding was described as more than 1.01 occupants per room
Source: ACS 2007 -2011
Latinos (6.5%) and Asians (5.7%) have the highest rates of living in units where more than 1
person share a room. Blacks have a rate of 3.1% and a relatively low proportion of Whites (1%)
live in overcrowded housing.

33
What are income and poverty characteristics for these two groups? What
proportions of Black and Latino youth live in households receiving SNAP (food
stamps), or Social Security Income?
Table 22: Per Capita Income* Past 12 Months,
by Race and Ethnicity Blacks $ 21,833
Latinos $ 20,959
Asians $ 30,957
Whites, Not Latinos $ 42,426
* In 2011 inflation-adjusted dollars
Source: ACS 2007 - 2011
Blacks and Latinos report considerably lower per capita income levels than Asians or Whites.
The PCI for Whites ($42,426) who are not Latino, is almost twice as high as that for Blacks
$21,833), and slightly more than twice as high as the Latino PCI ($20,959). This disparity is
illustrated in the following chart.
Chart 6: Per Capita Income Levels for Blacks, Latinos, Asians, and Whites
$21,833 $20,959
$30,957
$42,426
Blacks Latinos Asians Whites, Not Latinos

34
Table 23: Persons in Poverty Past 12 Months by Age, Race, and Ethnicity Blacks Latinos Asian Whites,
Not
Latino
149,652 102,370 51,091 260,983
Income past 12 months below
poverty level:
37,251 24.9% 32,431 31.7% 15,539 30.4% 37,355 14.3%
Under 5 years 3,626 9.7% 3,479 10.7% 448 2.9% 666 1.8%
5 years 788 2.1% 640 2.0% 93 0.6% 238 0.6%
6 to 11 years 4,542 12.2% 4,524 13.9% 655 4.2% 768 2.1%
12 to 17 years 3,898 10.5% 4,442 13.7% 994 6.4% 598 1.6%
18 to 64 years 20,847 56.0% 17,269 53.2% 11,013 70.9% 31,070 83.2%
65 to 74 years 1,997 5.4% 1,093 3.4% 1,049 6.8% 1,780 4.8%
75 years and over 1,553 4.2% 984 3.0% 1,287 8.3% 2,235 6.0%
Source: ACS 2007-2011
About one quarter (24.9%) of all Black persons are impoverished in Boston, compared to almost
one third (31.7%) of all Latinos. Approximately 14.3% of all White persons who are not Latino,
are impoverished. Asians report a poverty rate of 30.4% as illustrated in the following chart.
Chart 7: Poverty Level by Race and Latino Origin
24.9%
30.4%31.7%
14.3%
Blacks Asian Latinos Whites, Not Latino
Poverty Level by Race and Latino Origin
35
The poverty rate for Black children 5 years or under is 11.8%; for Latinos in same age category it
is 12.7%. The figure for very young White children is 2.7%, and for Asian very young children it
is 3.5%.
Young people in the Black community who are between the ages of 6 and 17 years reflect a
poverty rate of 22.7%; the figure for Latino youth in this age category is 27.1%. Approximately
10.6% of all Asian youth between the ages of 6 and 17 years are in poverty, and the figure is
3.7% of all White youth in this same age category.
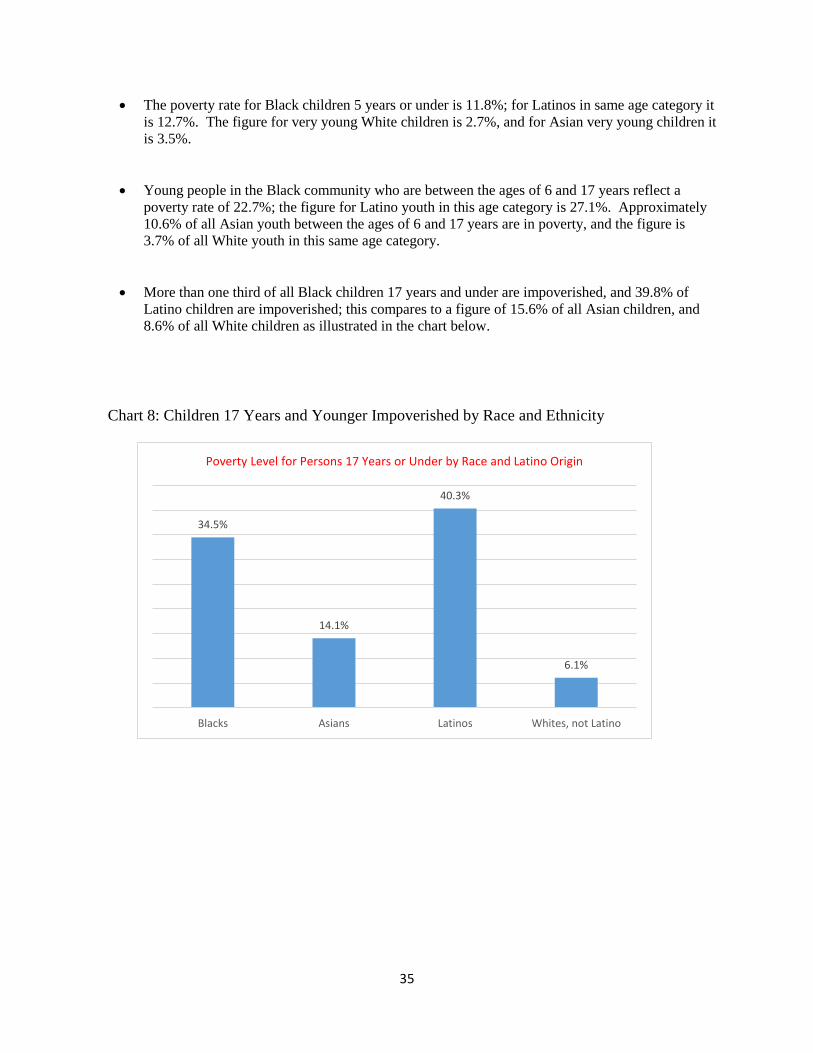
More than one third of all Black children 17 years and under are impoverished, and 39.8% of
Latino children are impoverished; this compares to a figure of 15.6% of all Asian children, and
8.6% of all White children as illustrated in the chart below.
Chart 8: Children 17 Years and Younger Impoverished by Race and Ethnicity
34.5%
14.1%
40.3%
6.1%
Blacks Asians Latinos Whites, not Latino
Poverty Level for Persons 17 Years or Under by Race and Latino Origin

36
Table 24: Proportion of Black and Latino Persons Among All Impoverished Persons,
17 Years, and Under All persons 17 Years and Under 30,399
Black and Latinos 17 Years and Under 25,939 85.3%
Source: ACS 2007-2011
The overwhelming majority (85.3%) of all young people in Boston who are 17 years and under,
and impoverished, are Blacks and Latinos.

37
Table 25: Poverty Status Past 12 Months by Male, Age, and Race and Latino Origin Black Latinos Asian White, not Latino
Total Persons 149652 102370 51091 260983
Income in the past 12 months below poverty level: 37251 32431 15539 37355
Male: 41.6% 40.5% 44.7% 46.5%
Under 5 years 12.8% 13.1% 4.0% 1.6%
5 years 3.1% 2.5% 1.0% 0.6%
6 to 11 years 13.1% 16.8% 5.0% 3.1%
12 to 14 years 5.5% 8.4% 3.2% 1.0%
15 years 2.8% 3.3% 2.4% 0.1%
16 and 17 years 4.1% 5.3% 2.8% 0.5%
18 to 24 years 12.5% 13.4% 32.2% 46.2%
25 to 34 years 7.9% 10.2% 12.4% 17.3%
35 to 44 years 9.6% 8.8% 9.2% 6.1%
45 to 54 years 12.3% 7.6% 5.8% 8.9%
55 to 64 years 8.6% 4.9% 7.6% 6.8%
65 to 74 years 5.1% 2.7% 6.4% 4.0%
75 years and over 2.5% 3.0% 7.9% 3.8%
Source: ACS 2007 - 2011
There are significant proportions of very young Blacks and Latino males who comprise the total
number of males in poverty in their group, compared to Whites and Asians. In terms of all Black
males who are impoverished, 15.6% are classified as male children 5 years or younger; and in
terms of all Latino males who are impoverished, 15.9% are male children in this same age
category. The comparable figures for Asians is 5%, and for Whites it is 2.2%.
While Black males who are 16 and 17 years of age comprise 4.1% of all impoverished males
among Blacks, and Latino males in the same age group comprise 5.3% of all impoverished Latino
males, the figure for Asians is 2.8%, and for Whites, who are not Latino it is less than less than
one percent (0.5%).

38
Table 26: Poverty Status in Past 12 Months by Female, Age, and Race and Latino Origin Black Latinas Asian White, not Latino
Total Persons 149,652 102,370 51,091 260,983
Income in the past 12 months below poverty
level
37,251 32,431 15,539 37,355
Female: 58.4% 59.5% 55.3% 53.5%
Under 5 years 7.6% 9.1% 1.9% 1.9%
5 years 1.4% 1.6% 0.3% 0.7%
6 to 11 years 11.5% 12.0% 3.6% 1.1%
12 to 14 years 3.6% 6.3% 1.7% 1.0%
15 years 2.4% 2.1% 1.1% 0.3%
16 and 17 years 3.0% 3.0% 2.0% 0.3%
18 to 24 years 14.9% 14.3% 32.9% 49.4%
25 to 34 years 14.4% 16.5% 16.5% 14.3%
35 to 44 years 12.6% 13.7% 9.2% 3.8%
45 to 54 years 8.6% 7.8% 8.0% 7.3%
55 to 64 years 9.0% 6.7% 7.3% 6.4%
65 to 74 years 5.6% 3.9% 7.0% 5.4%
75 years and over 5.3% 3.0% 8.6% 7.9%
Source: ACS 2007 - 2011
The female population that is impoverished across all groups is greater than the respective male
populations. As is the case with Black and Latino males, females in these groups who are very
young comprise a larger proportion of all impoverished females than is the case for Asians, or
Whites; Black females who are impoverished, and 5 years and under comprise 9% of all
impoverished females; the figure for very young Latinas is 10.7%, but for Asians it 2.2%, and for
White females in this age category and who are not Latina, it is 2.6%.

39
Table 27: Impoverished Persons by Family Type and Age of Children, Race and Latino Origin Black %Black Latino %Latino Asian %Asian White,
not
Latino
%White
Total Families 34,808 22,735 10,665 47,439
Income in the past 12 months
below poverty level:
7,438 21.4% 6,892 30.3% 2,309 21.7% 2,491 5.3%
Married-couple family: 857 11.5% 853 12.4% 1,292 56.0% 867 34.8%
With related children under 18
years:
547 533 564 331
Under 5 years only 198 57 123 56
Under 5 years and 5 to 17 years 121 212 110 160
5 to 17 years only 228 264 331 115
No related children under 18
years
310 320 728 536
Other family: 6,581 6,039 1,017 1,624
Male householder, no wife
present:
697 9.4% 501 7.3% 144 6.2% 229 9.2%
With related children under 18
years:
436 426 70 156
Under 5 years only 26 75 11 40
Under 5 years and 5 to 17 years 131 23 0 31
5 to 17 years only 279 328 59 85
No related children under 18
years
261 75 74 73
Female householder, no
husband present:
5,884 79.1% 5,538 80.4% 873 37.8% 1,395 56.0%
With related children under 18
years:
5,100 4,958 493 918
Under 5 years only 794 936 77 233
Under 5 years and 5 to 17 years 1,273 1,252 48 116
5 to 17 years only 3,033 2,770 368 569
No related children under 18
years
784 580 380 477
Source: ACS 2007 - 2011
Of all Latino families in Boston, 30.3% are impoverished; the figure for Black families is 21.4%,
and for Asians 21.7%; for White families who are not Latino, the family poverty rate is 6.6%.
Black families comprise approximately 38.8% of all impoverished families in this city; Latino
families comprise 36%, White families 13%, and Asian families 12.1% of all impoverished
families.
40
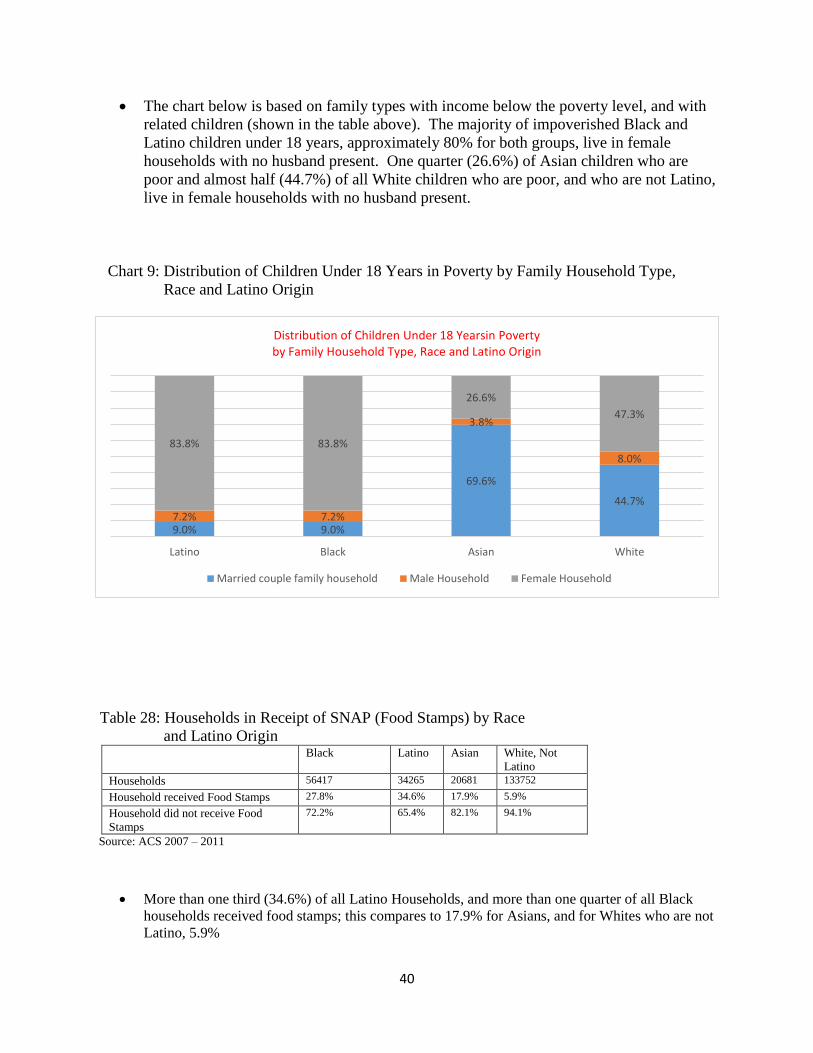
The chart below is based on family types with income below the poverty level, and with
related children (shown in the table above). The majority of impoverished Black and
Latino children under 18 years, approximately 80% for both groups, live in female
households with no husband present. One quarter (26.6%) of Asian children who are
poor and almost half (44.7%) of all White children who are poor, and who are not Latino,
live in female households with no husband present.
Chart 9: Distribution of Children Under 18 Years in Poverty by Family Household Type,
Race and Latino Origin
Table 28: Households in Receipt of SNAP (Food Stamps) by Race
and Latino Origin Black Latino Asian White, Not
Latino
Households 56417 34265 20681 133752
Household received Food Stamps 27.8% 34.6% 17.9% 5.9%
Household did not receive Food
Stamps
72.2% 65.4% 82.1% 94.1%
Source: ACS 2007 – 2011
More than one third (34.6%) of all Latino Households, and more than one quarter of all Black
households received food stamps; this compares to 17.9% for Asians, and for Whites who are not
Latino, 5.9%
9.0% 9.0%
69.6%
44.7%
7.2% 7.2%
3.8%
8.0%
83.8% 83.8%
26.6%
47.3%
Latino Black Asian White
Distribution of Children Under 18 Yearsin Poverty by Family Household Type, Race and Latino Origin
Married couple family household Male Household Female Household

41
Table 29: Households Receiving Supplement Nutrition Assistance Program (Food Stamps) Black Latino Asian White, Not Latino
Households 56,417 34,265 20,681 133,752
Household received Food Stamps 27.8% 34.6% 17.9% 5.9%
Household did not receive Food Stamps 72.2% 65.4% 82.1% 94.1%
Source: ACS 2007 - 2011
Over one third (34.6%) of all Latino households, and over one quarter (27.8%) of all Black
households rely on food stamps. This compares to a relatively low rate of 5.9% for all White
households.
Table 30: Persons on Public Assistance by Ages 1 to 15 Years, and
Race and Latino Origin Yes % No %
White 22.4 77.6
Black 44.6 55.4
Asian 24.2 75.8
Latino* 49.8 50.2
Source: ACS 2007 – 2011 PUMS
*Latinos can be included in any racial category
Almost half (49.8%) of all Latino children, 1 to 15 years of age receives public assistance; the
figure for Black children in the same age category is 44.6%; for Whites who are not Latino,
22.4%, and Asian children, 24.2%.

42
Chart 10: Persons on Public Assistance by Ages 1 to 15 Years, and Race and Latino Origin
22.4
44.6
24.2
49.8
White Black Asian Latino
Persons on Public Assistance by Ages 1 to 15 Years, and Race and Latino Origin
Yes % No %

43
Table 31: Percent With Disability* by Race, Latino Origin, Sex, and
Ages 5 to 17 Years** % With Disability
Black Male 19.3
Black Female 8.9
White Male 12.9
White Female 10.0
Latino Males 12.8
Latinas 11.2
*Disability status can include six categories of difficulty: hearing; vision; cognitive; ambulatory;
self-care; and independent living; see American Community Survey and
Puerto Rico Community Survey 2012 Definitions, and for earlier definitions, http://www.census.gov/acs
**Whites and Blacks can include Latinos in this table.
Source: ACS 2012 PUMS
In terms of disability status, Black males, ages 5 to 17 years registered the highest percentage
(19.3%) compared to Black females (8.9%), or White males (12.9%) and White females (10%),
and also Latino males (12.8%) and Latinas (11.2%), ages 5 to 17 years. The next
It should be emphasized that there is wide variation among Latinos based on origins, so the
figures for Latino males and females have to be analyzed with caution. Among Puerto Rican
males, ages 5 to 17 years, for example, the proportion reported as having a disability was almost
one quarter (23.1%) of this entire group, and Puerto Rican females, 15.8%. Compare this to the
percentage reporting a disability among Dominican males, ages 5 to 17 years (7.8%), and
Dominican females (6.3%). This is illustrated in the following chart.

44
Chart 11: Percent of Disability for Puerto Ricans and Dominicans 5 to 17 Years Old
The next chart shows the percentage of persons under 18 years of age who reported a disability in
the ACS 2008 – 2012 5 Year Estimates.
Chart 12: Persons Under 18 Years with Disability, by Race and Latino Origin
23.1
15.8
7.8
6.3
Puerto RicanMales Puerto Rican Females Dominican Males Dominican Females
% Disability Puerto Ricans and Dominicans 5 to 17 Years
4.4%
7.3%
3.4%
1.8%
Blacks Latinos Whites, Not Latino Asian
Persons Under 18 Years with Disability

45
There is a large presence of all males with incomes below the poverty level in Boston
neighborhood areas with the largest concentrations of Black and Latino persons
Map 6: Number of Males with Incomes below Official U.S. Federal Poverty Level

46
What are employment and labor force characteristics for Black and Latino Youth?
Table 32: Employment and Labor Force Characteristics by Race and Latino Origin Black Latino Asian White,
not
Latino
Males 16 to 64 years: 46,525 35,384 20,639 114,823
In labor force: 34,555 74.3% 27,727 78.4% 14,335 69.5% 92,795 80.8%
In Armed Forces 38 85 11 182
Civilian: 34,517 27,642 14,324 92,613
Employed 27,087 78.5% 23,863 86.3% 12,761 89.1% 86,950 93.9%
Unemployed 7,430 21.5% 3,779 13.7% 1,563 10.9% 5,663 6.1%
Not in labor force 11,970 7,657 6,304 22,028
Females 16 to 64 years: 57,035 37,945 22,523 115,279
In labor force: 42,778 75.0% 26,250 69.2% 14,202 63.1% 88,124 76.4%
In Armed Forces 1 0 0 75
Civilian: 42,777 26,250 14,202 88,049
Employed 36,266 84.8% 22,265 84.8% 12,767 89.9% 83,093 94.4%
Unemployed 6,511 15.2% 3,985 15.2% 1,435 10.1% 4,956 5.6%
Not in labor force 14,257 11,695 8,321 27,155
*“Not in labor force”: “[includes all people 16 years old and over who are not classified as members of the labor force. This
category consists mainly of students, housewives, retired workers, seasonal workers interviewed in an off season who were
not looking for work, institutionalized people, and people doing only incidental unpaid family work (less than 15 hours during
the reference week). **“Unemployed” includes all civilians 16 years old and over are classified as unemployed if they (1) were
neither "at work" nor "with a job but not at work" during the reference week, and (2) were actively looking for work during the
last 4 weeks, and (3) were available to accept a job. Also included as unemployed are civilians who did not work at all during
the reference week, were waiting to be called back to a job from which they had been laid off, and were available for work
except for temporary illness. ***“In labor force” includes all people classified in the civilian labor force, plus members of the
U.S. Armed Forces (people on active duty with the United States Army, Air Force, Navy, Marine Corps, or Coast Guard). The
Civilian Labor Force consists of people classified as employed or unemployed].” See, Census Fact Finder,
http://factfinder2.census.gov/help/en/glossary/l/labor_force.htm
Source: ACS 2007 -2011
Black males reported a significantly higher unemployment rate (21.1%) for the past 12 months in
the ACS 2007-2011 survey, than the other groups; the Latino male unemployment rate was
13.7%; Asian males 10.9% and Whites males a relatively low rate compared to the other groups,
at 6.1%. This is also illustrated in the following chart.

47
Chart 13: Male Employment and Unemployment by Race and Latino Origin
The Black male unemployment rate (21.1%) was several points higher than that for Black
females (15.2%); this is reversed with Latino males who had an unemployment rate (13.7%)
lower than that for Latinas (15.2%). The figure for White males who are not Latino was 6.1%,
and for White females,
78.5%
86.3% 89.1%93.9%
21.5%
13.7% 10.9%6.1%
Black Latino Asian White
Male Employment and Unemployment by Race and Latino Origin
Employed Unemployed

48
As the next two maps indicate, unemployment levels where Blacks and Latinos tend to live, show
very high rates for Black males (16 to 64 years), and then Latino males (16 to 64 years).
Map 7: Unemployment Rate for Black Males, 16 Years+

49
Map 8: Unemployment Rate for Latino Males, 16 years +

50
The snapshot provided by the ACS 2008 - 2012 is essentially the same as the earlier survey as
indicated in the following table. The Black unemployment rate for males was reported at 20.8%,
compared to 13.6% for Latino males in this age category, 8.9% for Asians, and 6.8% for White
males, not Latino.
Table 33: Employment and Labor Force Characteristics for Males by Race and Latino Origin Black Latino Asian White, not
Latino
Total Males 16-64 Years 47891 36352 20685 116028
In Labor Force 35593 28218 14337 93858
Employed 28141 79.1% 24323 86.4% 13047 91.1% 87297 93.2%
Not Employed 7418 20.8% 3841 13.6% 1277 8.9% 6359 6.8%
Not in Labor Force 12298 25.7% 8134 22.4% 6348 30.7% 22170 19.1%
Source: ACS 2008 – 2012
The chart below highlights differences in unemployment level for both males and females by race
and Latino origin.
Chart 14: Unemployment Levels by Race and Latino Origin, ACS 2008 – 2012
Black Latino Asian White, not Latino
Unemployed Males 26.4% 13.6% 8.9% 6.8%
Unemployed Females 18.1% 15.8% 10.0% 5.4%
Unemployment Level by Race and Latino Origin