status of iasi and cris processing
TRANSCRIPT

1
Status of IASI and CrIS processing
Chris Barnet, Atmospheric Sounding Science Team Meeting
Oct. 14, 2008

2
Initial Joint Polar System: An agreement between NOAA & EUMETSAT to exchange data and products.
NASA/Aqua 1:30 pm orbit (May 4, 2002)
NPP & NPOESS 1:30 pm orbit (≥6/2010, 2013, 2018)
20 years of hyperspectral sounders are already funded for weather applications
3
IASI
• Science code is the same for AIRS, IASI, and CrIS – File driven architecture (same code runs AIRS, IASI, and CrIS)
• All instrument specific information is read in from files. – Noise file specifies instrument noise characteristics. – RTA file specifies instrument specifications (channels, apodization, etc).
• Channel selection for retrieval steps is read in via namelist. – Code maintains backward and forward compatibility.
• Can run all previous versions of AIRS, IASI, and CrIS including simulated and real data modes.
• Object oriented design allows preparation for future upgrades. – Design is modular – retrieval modules are programmed via namelist
commands. – Full diagnostics. Each retrieval iteration and step is compared to a
“truth” state specified by the user (ECMWF, RAOBS, GFS, etc.). For operations the “truth” state is the GFS forecast.
• Operational system is a “filtered” version of the science code – Guarantees that off-line and on-line results are the same.
4
IASI Setup
• Baseline system was a mix of version 4.7 & 5.0 – Uses IASI, AMSU, and MHS observations. – Channel sets are similar to v4.7 (use SW/LW for cloud clearing, LW is
dominant for T(p). – Channel selection avoids adjacent pairs due to spectral correlation
induced by apodization – Employs both cloudy and cloud cleared regression, both regressions
use AMSU. – Microwave and infrared tuning is currently based on ECMWF – Error covariance matrices handle spectral correlation induced by
apodization of FTS radiances. • All trace gas retrievals are functional.
– Carbon dioxide, nitric acid, and nitrous oxide are turned on. • Diagnostic monitoring of principal components is done
operationally and also off-line at STAR. • IASI/ATMS/MHS field-of-regards for validation site’s are
captured and stored by operational system. – Ability to reprocess RAOB database with any version of the code.
5
IASI Products are Operational
• IASI level-1 system became operational at NOAA’s Environmental Satellite Processing Center (ESPC, a.k.a. OSDPD) on July 18, 2007
• IASI level-2 pre-operational system has been running continuously on our ESPC development machines since April 2008.
• IASI level-2 system became operational at ESPC on Aug. 14, 2008
• Murty Divakarla’s talk (2:30 pm Wednesday) will show IASI and AIRS temperature and moisture comparisons to RAOB’s.

6
IASI PPS Interfaces/Users
GFT IASI Product Processing
System (IBM P570)
DDS IASI L1C
IASI L1C, L2, CCR + metadata
AMSU-A, MHS L1B, GFS & GDAS GRIB
file forecasts IASI L1CT& L2
BUFR & NetCDF
Binaries, Grids, and Matchups
IASI PPS
Remote Servers
Providers
Customers
SPN
OSDPD Monitoring
EUMETSAT
NCEP
GMAO
NRL
FNMOC
CLASS
NCEP
IASI L1C
Monitoring Logs
GFS & GDAS GRIB file forecasts
IASI L1C, L2, CCR
+ metadata
IASI L1CT BUFR
IASI L1CT BUFR
IASI L1CT & CCR BUFR
IASI PPS External Interfaces
STAR IASI L1C, L2 & CCR
Binaries, Grids, and Matchups
IASI L1CT BUFR
OSDPD AMSU-A & MHS
L1B orbits

7
Trace Gas Products from AIRS & IASI
gas Range (cm-1) Precision d.o.f. Interfering Gases AIRS IASI
H2O 1200-1600 15% 4-6 CH4, HNO3 NASA DAAC CLASS O3 1025-1050 10% 1.25 H2O,emissivity NASA DAAC CLASS CO 2080-2200 15% ≈ 1 H2O,N2O NASA DAAC CLASS CH4 1250-1370 1.5% ≈ 1 H2O,HNO3,N2O NASA DAAC CLASS CO2 680-795
2375-2395 0.5% ≈ 1 H2O,O3
T(p) NOAA
NESDIS CLASS
Volcanic SO2
1340-1380 50% ?? < 1 H2O,HNO3 TBD TBD
HNO3 860-920 1320-1330
50% ?? < 1 emissivity H2O,CH4,N2O
NOAA NESDIS
CLASS
N2O 1250-1315 2180-2250 2520-2600
5% ?? < 1 H2O H2O,CO
NOAA NESDIS
CLASS
CFCl3 (F11) 830-860 20% - emissivity No plans No plans CF2Cl (F12) 900-940 20% - emissivity No plans No plans
CCl4 790-805 50% - emissivity No plans No plans
8
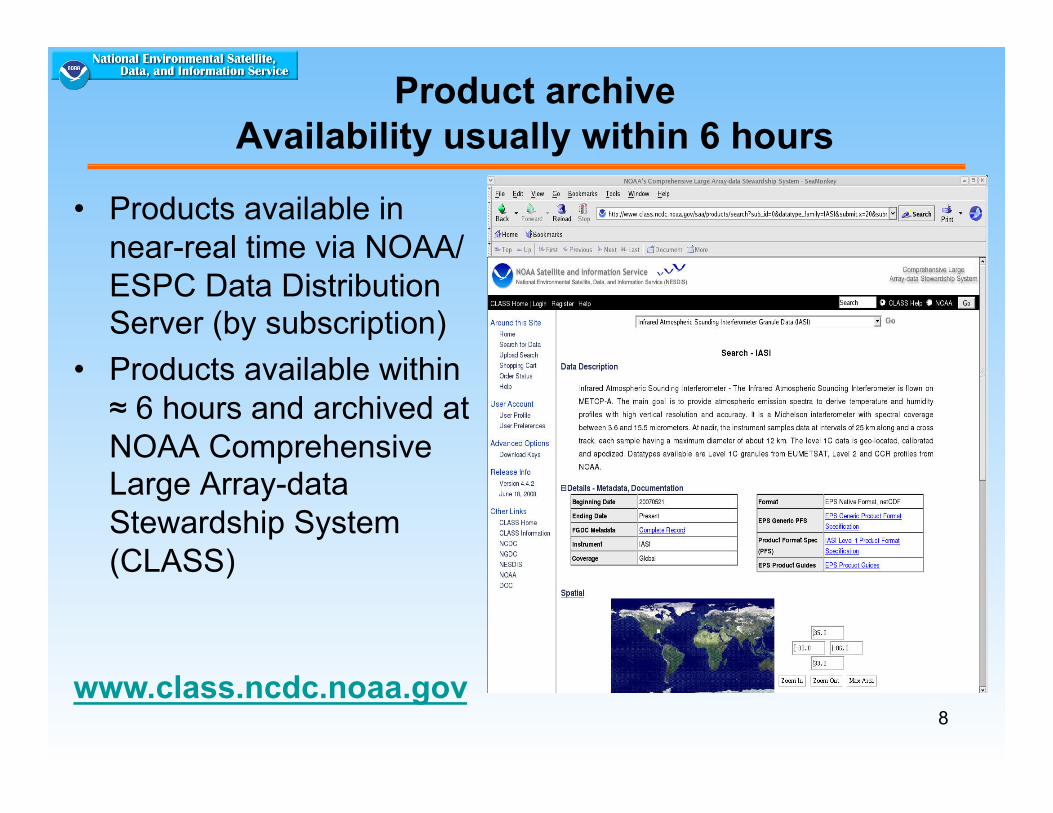
Product archive Availability usually within 6 hours
• Products available in near-real time via NOAA/ESPC Data Distribution Server (by subscription)
• Products available within ≈ 6 hours and archived at NOAA Comprehensive Large Array-data Stewardship System (CLASS)
www.class.ncdc.noaa.gov

9
IASI L1C NRT Granule Products Available via DDS in Near Real Time
Spectral Subset Data Type Spatial Subset Format 616 chls IASI Radiance Warmest FOV from every FOR BUFR
NetCDF
616 chls IASI Radiance First FOV from every FOR BUFR NetCDF
616 chls IASI Radiance All 4 FOVs from every FOR BUFR NetCDF
616 chls IASI Reconstructed Radiance (1 band)
1 FOV from every FOR BUFR NetCDF
616 chls IASI Reconstructed Radiance (3 bands)
1 FOV from every FOR BUFR NetCDF
616 chls IASI Reconstructed Radiance (1 band)
4 FOVs from every FOR BUFR NetCDF
616 chls IASI Reconstructed Radiance (3 bands)
4 FOVs from every FOR BUFR NetCDF
8461 chls IASI Radiance 4 FOVs from every FOR NetCDF
8461 chls IASI Radiance 4 FOVs from 2 scans/granule NetCDF
FOV = Field of View; FOR = Field of Regard. Orange refers to internal files.

10
IASI Archive Products (available via CLASS)
Instrument Processing Interval
Description Contents Format
IASI Granule Granule of IASI L1C IASI Radiance w/ metadata (FGDC-RSE)
EUMETSAT Binary Xml
IASI AMSU MHS
Daily 3x3 degree gridded spatial subset of IASI FOR’s
IASI, AMSU, MHS Radiances w/ metadata
GRADS Binary Xml
IASI Granule Granule of IASI cloud cleared radiances for each FOR
IASI CCR w/ metadata
NETCDF xml
IASI AMSU MHS
Granule Granule of IASI L2 Geophysical Products for each FOR
T(p), q(p), O3(p), CO(p), CH4(p), SST/LST, surface emissivity, cloud fraction, cloud top height, convective products.
NETCDF xml

11
IASI L2 NOAA Unique Products Granule Products (DDS)
Instrument Channel Data Type Description IASI FOV #
Format
IASI 616 CCR Cloud cleared radiance for each FOR
(uses all 4 FOV’s)
BUFR NetCDF
IASI n/a Geophysical T(p), q(p), O3(p), CO(p), CH4(p), SST/LST, surface emissivity, cloud fraction, cloud top height, convective products.
(uses all 4 FOV’s)
NetCDF
IASI (using AVHRR)
616 RAD Pick clearest IASI FOV for each FOR using AVHRR
1 (clearest)
BUFR NetCDF
AVHRR (on IASI FOVs)
5 RAD (clear and cloudy)
AVHRR channels spatially convolved to IASI FOV’s
1,2,3,4 BUFR NetCDF
IASI (using AVHRR)
616 CCR IASI CCR w/ AVHRR QA (uses all 4 FOV’s)
BUFR NetCDF
AVHRR Products will be available in FY09

12
Supported the Stratosphere-Troposphere Analyses of Regional Transport (START) & Preliminary HIAPER
Pole to Pole Observation (Pre-HiPPO)
● STAR participated in the START08/pre-HIPPO experiment from April to June, 2008 – See Jasna Pittman/Laura Pan’s talk at 3:30 today
● STAR provided near real time level-2 products derived from the Atmospheric Infrared Sounders (AIRS) and pre-operational Infrared Atmospheric Sounding (IASI).
● Satellite derived tropopause height, H2O, O3, and CO were used for daily “flight forecast”.
● Figure 1: IASI derived ozone (O3) at 200 mb shows the patterns similar to the upper tropospheric dynamics (stratospheric intrusions, red contours)
● Figure 2: IASI carbon monoxide (CO) at 500 mb shows high CO over Oregon/Idaho due to long range transport of recent Russian fire.
● Daily products and flight forecaster reports can be seen on http://catalog.eol.ucar.edu/start08/index.html
Figure 1
Figure 2

13
Comparison of IASI Ozone and NCEP PV/Wind
• Next slide will show retrieval cross section along 20-70 latitude and at longitude -145 and -150. – Shown at right as red vertical
line
• Lower panel shows potential vorticity/wind – Areas in blue are regions of
stratopheric intrusions into the troposphere.

14
Stratospheric Intrusion on Oct. 19, 2007 at longitude -145o and -150o
IASI 21:30 Ascending (night)
AIRS 13:30 Ascending (day)
Geo-potential Temperature 350, 380, 400
PV, 2, 4
Zonal Wind
Thermal Tropopause (derived from retrieval)
15
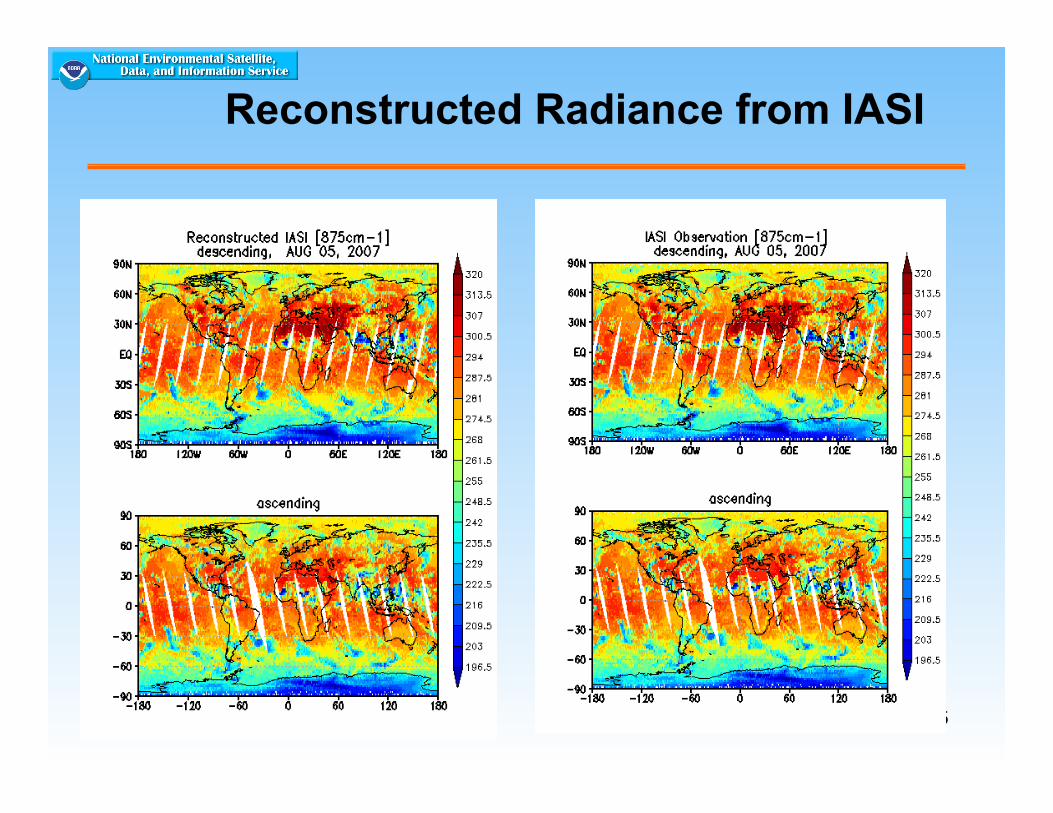
Reconstructed Radiance from IASI
16
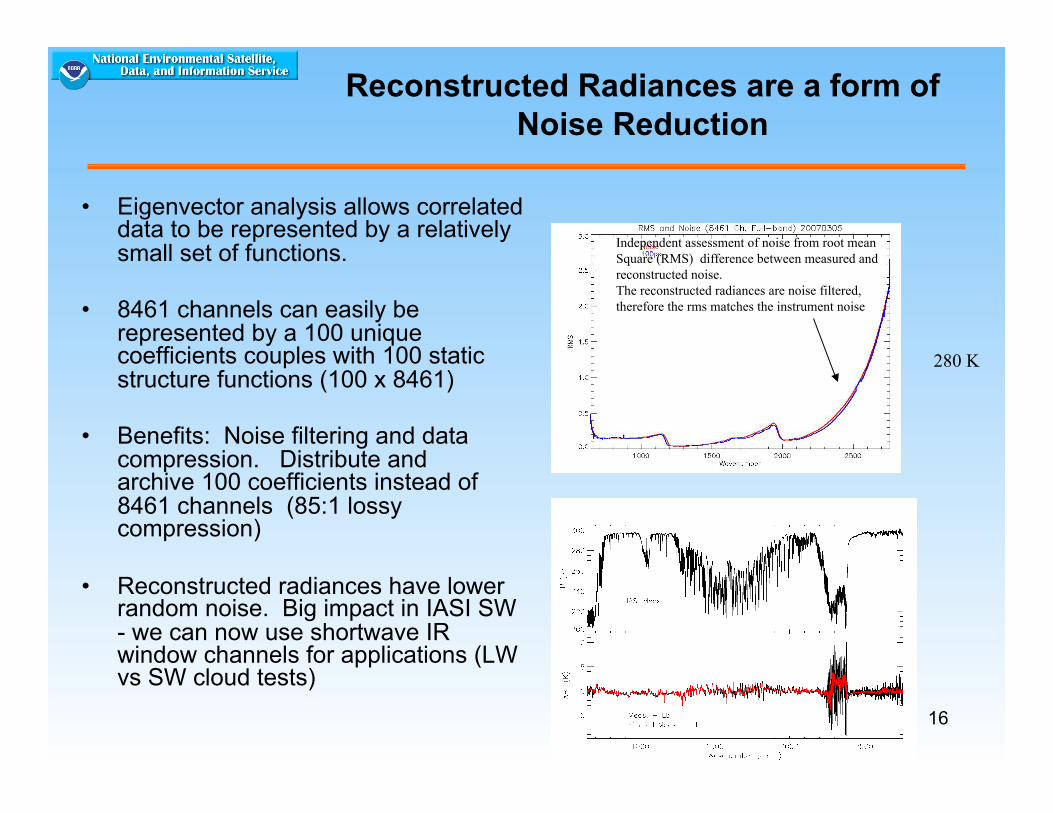
Reconstructed Radiances are a form of Noise Reduction
• Eigenvector analysis allows correlated data to be represented by a relatively small set of functions.
• 8461 channels can easily be represented by a 100 unique coefficients couples with 100 static structure functions (100 x 8461)
• Benefits: Noise filtering and data compression. Distribute and archive 100 coefficients instead of 8461 channels (85:1 lossy compression)
• Reconstructed radiances have lower random noise. Big impact in IASI SW - we can now use shortwave IR window channels for applications (LW vs SW cloud tests)
Independent assessment of noise from root mean Square (RMS) difference between measured and reconstructed noise. The reconstructed radiances are noise filtered, therefore the rms matches the instrument noise
280 K

17
PC Analysis can be used to characterize the instrument noise using Earth scenes.
• PC’s can be used to compute reduced noise radiance (reconstructed radiances).
• Subtracting observed radiance from reconstructed radiance gives an estimate of instrument noise derived from Earth scenes. – At upper right is IASI noise (red
curve) derived from blackbody measurements compared with noise derived from PC’s. PC’s generated from all 8461 channels shown in blue) and PC’s generated from the 3 individual bands (green) are very similar and very close to the black body derived noise.
– At lower right is the NEDT noise estimate for a single channel (2500 cm-1 on Sept. 10, 2007) shows the expected characteristics as a function of scene temperature (red lines are 1 sigma NEDT and green is 2 sigma NEDT).

18
NOAA Unique Cris/ATMS Processing System (NUCAPS)
• A copy of IASI system is being built for CrIS/ATMS – Same processing code will be used with new front-
end to read NGST SDR format’s. – Our code will run within the NPOESS Data
Exploitation (NDE) environment. – CrIS local angle correction is more complex than
AIRS and IASI due to rotation of field-of-regard. – ATMS re-sampling to CrIS FOV’s is required.
• CDR was held Sep. 29, 2008.
19
NUCAPS employ’s the STAR Enterprise Process Lifecycle (CMMI Level-3 process)
Project Requirements Review (PRR)
Preliminary Design Review (PDR 5/9/07)
Critical Design Review
(CDR 9/29/08)
Test Readiness Review (TRR)
Code Unit Test Review (CUTR)
System Readiness
Review (SRR)
PRR Check List Items (Requirements and
Allocation) Deferred to CDR Future
Reviews
PDR Check List Disposition
Risks and Actions
CDR Entry Criteria
CDR Exit Criteria
PDR Report and Appendix CDR Artifacts
CDR Check List
20
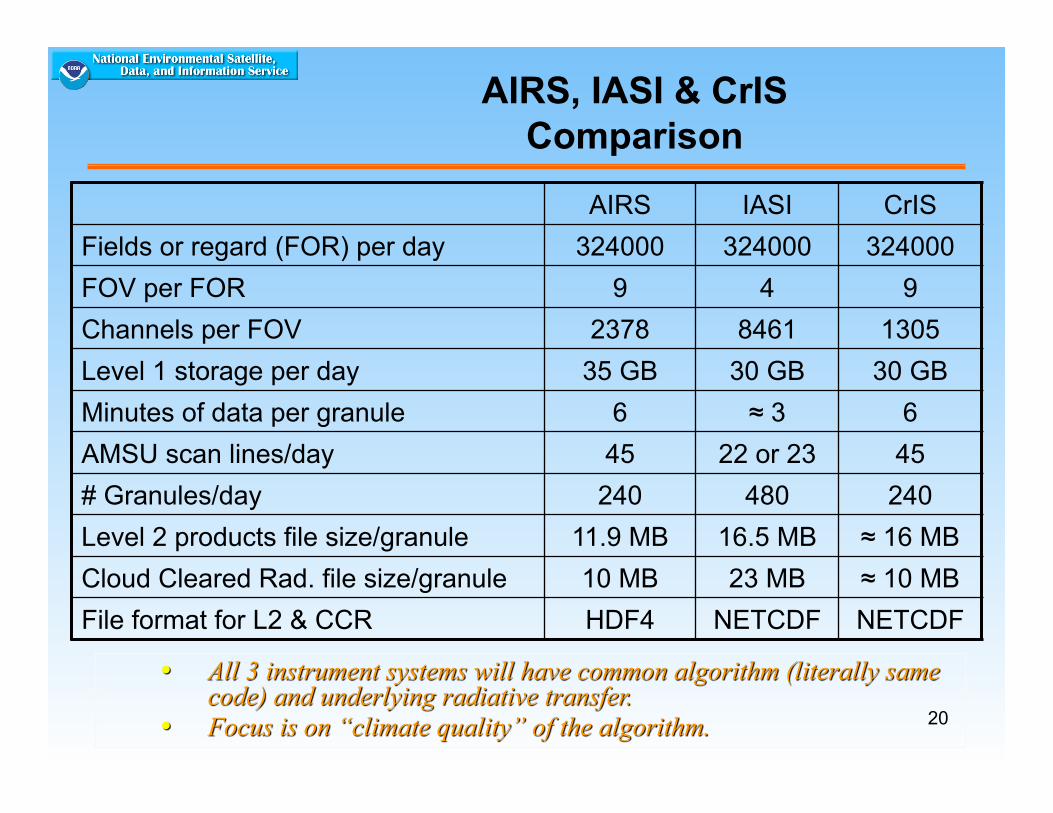
AIRS, IASI & CrIS Comparison
AIRS IASI CrIS Fields or regard (FOR) per day 324000 324000 324000 FOV per FOR 9 4 9 Channels per FOV 2378 8461 1305 Level 1 storage per day 35 GB 30 GB 30 GB Minutes of data per granule 6 ≈ 3 6 AMSU scan lines/day 45 22 or 23 45 # Granules/day 240 480 240 Level 2 products file size/granule 11.9 MB 16.5 MB ≈ 16 MB Cloud Cleared Rad. file size/granule 10 MB 23 MB ≈ 10 MB File format for L2 & CCR HDF4 NETCDF NETCDF
21
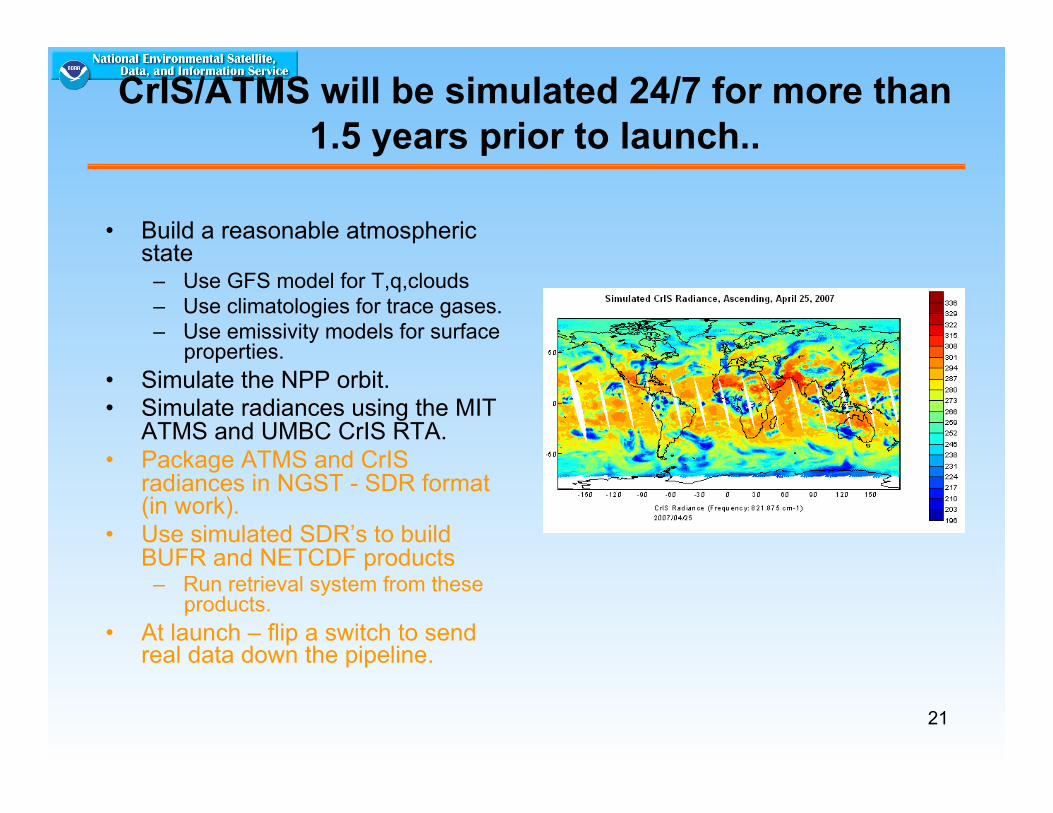
CrIS/ATMS will be simulated 24/7 for more than 1.5 years prior to launch..
• Build a reasonable atmospheric state
– Use GFS model for T,q,clouds – Use climatologies for trace gases. – Use emissivity models for surface
properties. • Simulate the NPP orbit. • Simulate radiances using the MIT
ATMS and UMBC CrIS RTA. • Package ATMS and CrIS
radiances in NGST - SDR format (in work).
• Use simulated SDR’s to build BUFR and NETCDF products
– Run retrieval system from these products.
• At launch – flip a switch to send real data down the pipeline.
22
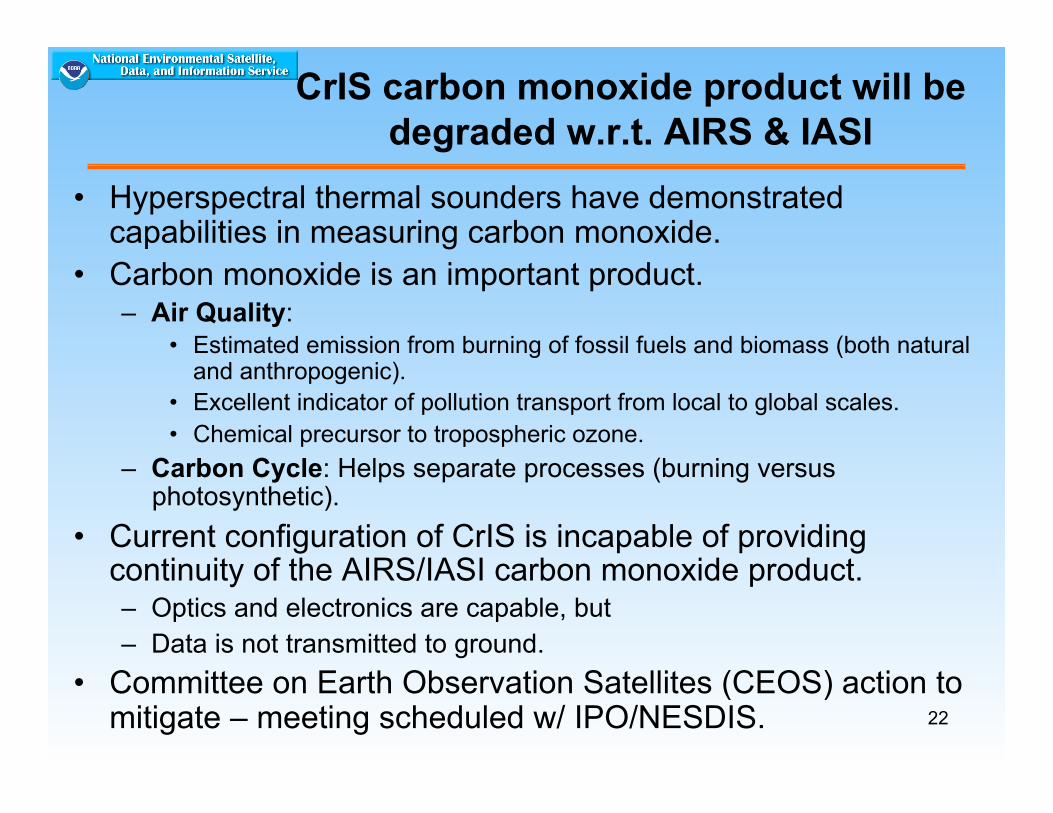
CrIS carbon monoxide product will be degraded w.r.t. AIRS & IASI
• Hyperspectral thermal sounders have demonstrated capabilities in measuring carbon monoxide.
• Carbon monoxide is an important product. – Air Quality:
• Estimated emission from burning of fossil fuels and biomass (both natural and anthropogenic).
• Excellent indicator of pollution transport from local to global scales. • Chemical precursor to tropospheric ozone.
– Carbon Cycle: Helps separate processes (burning versus photosynthetic).
• Current configuration of CrIS is incapable of providing continuity of the AIRS/IASI carbon monoxide product. – Optics and electronics are capable, but – Data is not transmitted to ground.
• Committee on Earth Observation Satellites (CEOS) action to mitigate – meeting scheduled w/ IPO/NESDIS.
23
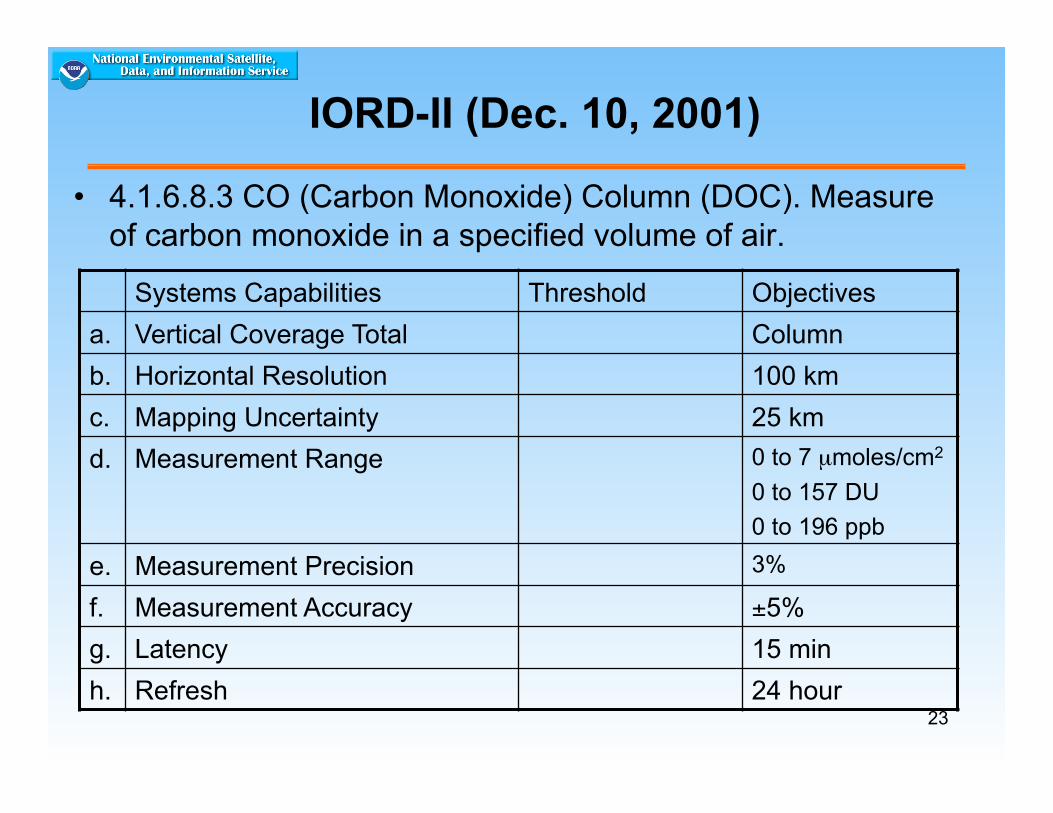
IORD-II (Dec. 10, 2001)
• 4.1.6.8.3 CO (Carbon Monoxide) Column (DOC). Measure of carbon monoxide in a specified volume of air.
Systems Capabilities Threshold Objectives a. Vertical Coverage Total Column b. Horizontal Resolution 100 km c. Mapping Uncertainty 25 km d. Measurement Range 0 to 7 µmoles/cm2
0 to 157 DU 0 to 196 ppb
e. Measurement Precision 3%
f. Measurement Accuracy ±5% g. Latency 15 min h. Refresh 24 hour
24
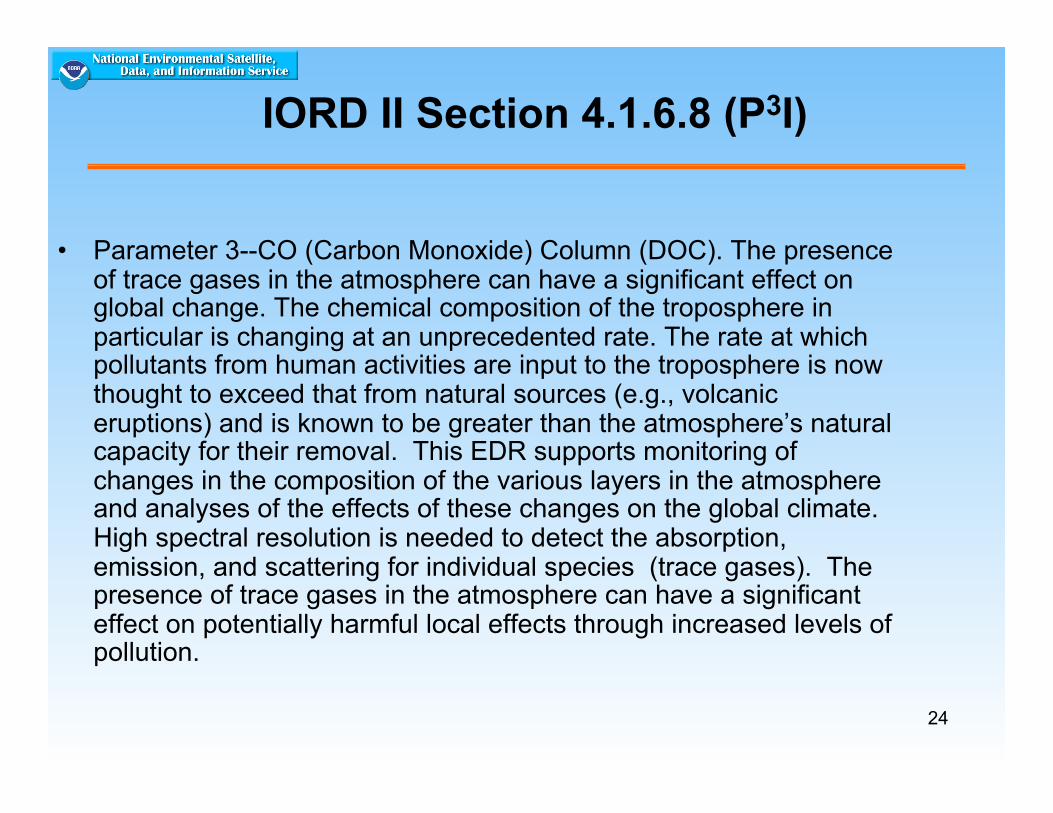
IORD II Section 4.1.6.8 (P3I)
• Parameter 3--CO (Carbon Monoxide) Column (DOC). The presence of trace gases in the atmosphere can have a significant effect on global change. The chemical composition of the troposphere in particular is changing at an unprecedented rate. The rate at which pollutants from human activities are input to the troposphere is now thought to exceed that from natural sources (e.g., volcanic eruptions) and is known to be greater than the atmosphere’s natural capacity for their removal. This EDR supports monitoring of changes in the composition of the various layers in the atmosphere and analyses of the effects of these changes on the global climate. High spectral resolution is needed to detect the absorption, emission, and scattering for individual species (trace gases). The presence of trace gases in the atmosphere can have a significant effect on potentially harmful local effects through increased levels of pollution.

25
Spectral resolution is a function of interferogram optical path difference (OPD)
Top panel shows interferogram with location of CO resonances (0.28, 0.56, 0.85 and 1.12 cm).
Middle panel shows radiance for various truncated interferograms (orange is current CrIS configuration).
Bottom panel shows blow-up of CO region of spectrum for OPD = 2.0, 0.8, 0.4, and 0.2 cm

26
Sampling & Resolution in the Carbon Monoxide band for AIRS, IASI, and CrIS
Polar
Mid-Latitude
Tropical
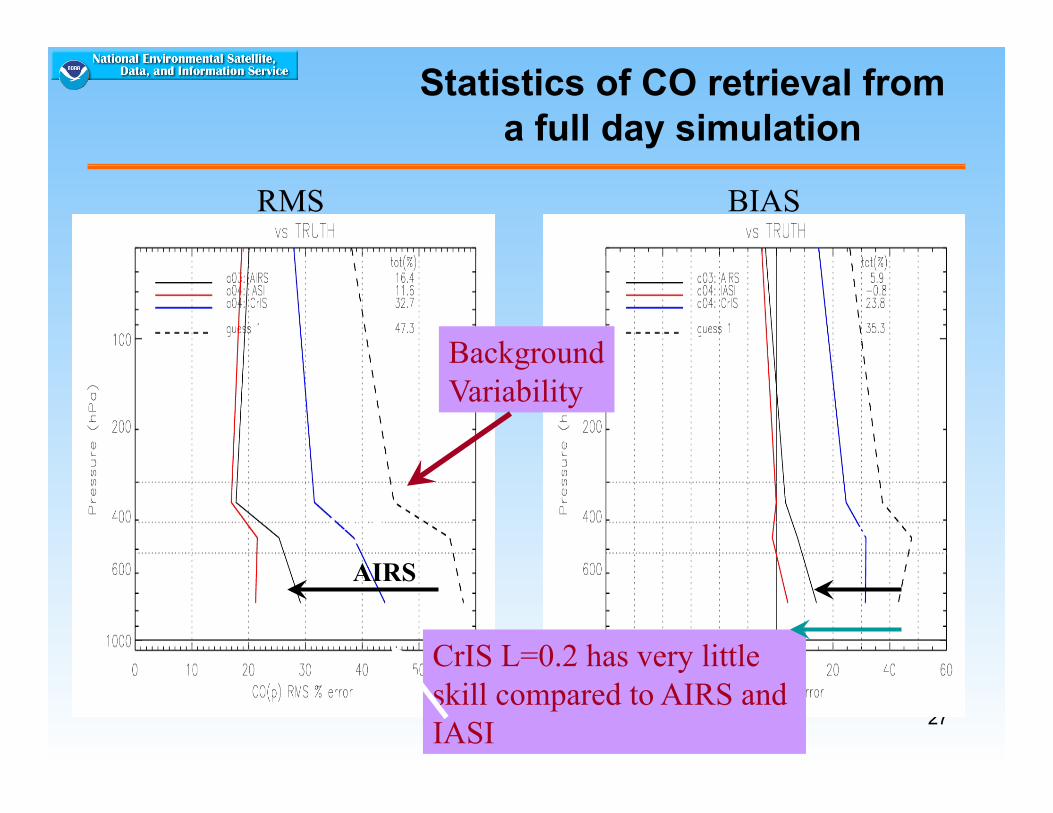
27
Statistics of CO retrieval from a full day simulation
CrIS L=0.2 has very little skill compared to AIRS and IASI
Background Variability
RMS BIAS
AIRS
CrIS
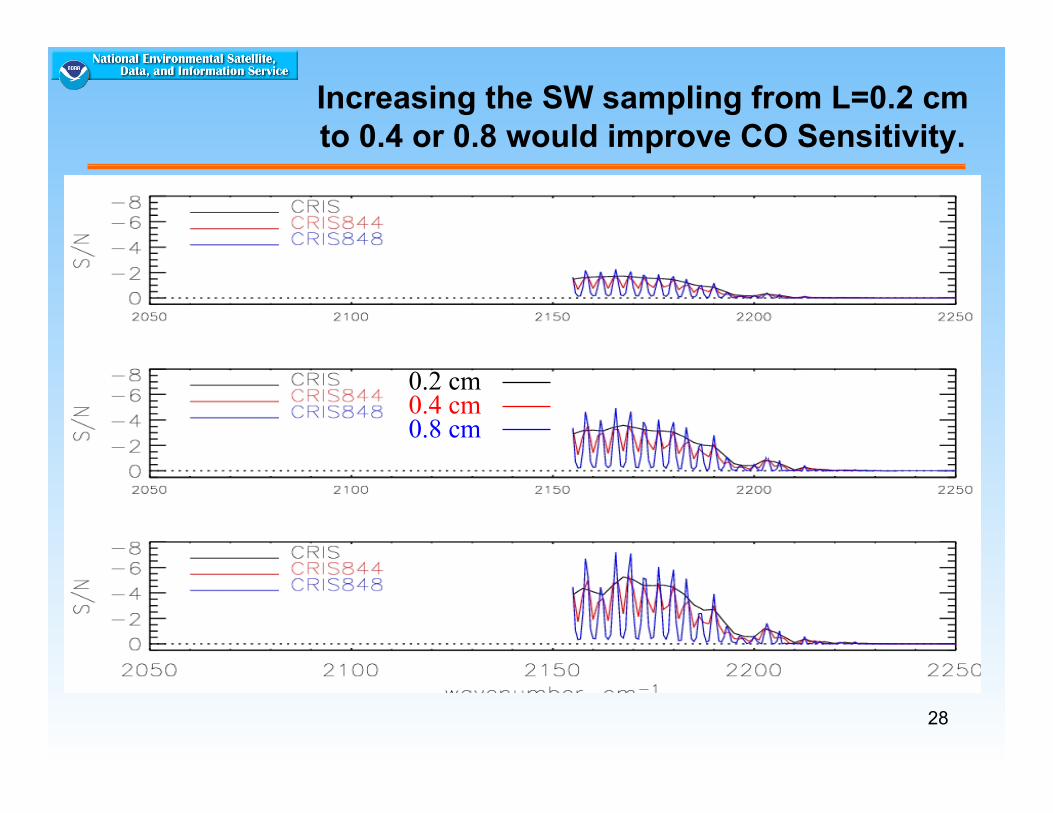
28
Increasing the SW sampling from L=0.2 cm to 0.4 or 0.8 would improve CO Sensitivity.
0.2 cm 0.4 cm 0.8 cm
Mid-Latitude
Polar
Tropical
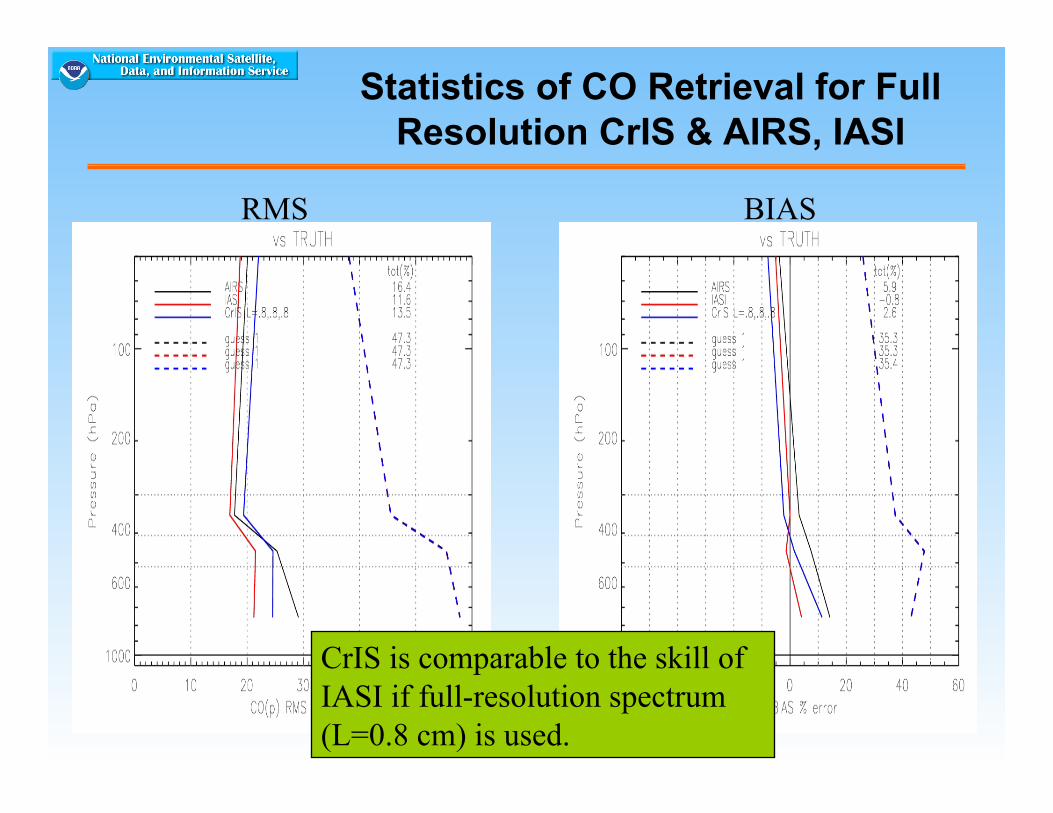
29
Statistics of CO Retrieval for Full Resolution CrIS & AIRS, IASI
RMS BIAS
CrIS is comparable to the skill of IASI if full-resolution spectrum (L=0.8 cm) is used.