status of populations of threatened stream frog species in ... · pdf filei status of...
TRANSCRIPT
i
Status of populations of threatened stream frog species in the upper catchment of the Styx River
on the New England Tablelands, near sites where trout releases occur.
Year 3: continuation of established transect monitoring for the study of trout impacts in endangered frog demographics.
Simon Clulow, John Clulow & Michael Mahony
School of Environmental and Life Sciences,
University of Newcastle
Prepared For
Recreational Freshwater Fishing Trust
New South Wales Department of Primary Industries
October 2009

ii
Executive Summary The authors of this report were engaged to assess the status of populations of threatened stream frogs in and around the upper catchment of the Styx River on the New England Tablelands in areas where trout releases occur over the spring/summer periods of 2007/2008 and 2008/2009. The brief for this study required an assessment of the impact of introduced trout on these threatened frog populations in streams where trout have been released. The rationale for this study was the implication of trout in the decline of several Australian specialist stream breeding amphibian species in 1999 (Gillespie & Hero, 1999).
Initial surveys of the region 2006 involved broad landscape scale surveys of the presence/absence of a number of threatened species that were known to be present in the New England Tablelands historically. In 2007 and 2008, the studies were focussed on a smaller number of permanent transects that were established at 11 sites in the Styx River area to investigate more intensely potential impacts of trout on two endangered frogs: the Glandular Frog, Litoria subglandulosa and the Stuttering Frog, Mixophyes balbus. Two years of demographic data from surveys in October to December 2007 and 2008 were used to assess effects of trout on population densities and demographics, and the condition of adult frogs of these species as a measure of environmental stress. Electro-fishing by DPI staff confirmed both rainbow and brown trout to be present in a proportion (but not all) of the trout release streams, but failed to locate any in the trout non-release sites.
Based on the demographic data from the surveys of 2007 and 2008 (and the presence/absence data of the original survey in 2006), no deleterious effects of the presence of trout were demonstrated on any of the parameters used as potential measures of impact. Indeed, based on the demographic survey for 2008, it was found that densities of the Glandular Frog were higher in the faster flowing streams where trout release occurred than in non-release streams. Nevertheless, it is recognised that the power of the analysis of the demographic surveys which to date have collected only two years of data is still limited, since they were based on surveys during just two seasons for the frogs involved. Consequently it is recommended that study sites continue to be surveyed during further years.
The study also identified various habitat characteristics of the streams and riparian zones that may help identify stream systems where these species are present, and stream systems that may offer favourable habitat to be managed in the long term for the conservation of these species.
iii
Table of Contents 1. Introduction ............................................................................................1
1.1. Scope ........................................................................................................1 1.2. Local Context...........................................................................................2 1.3. Background to the Problem and Proposed Study.............................3
1.3.1. The Recent Decline of Amphibians in Australia.........................3 1.3.2. The Implication of Introduced Trout in the Decline of Stream Frogs 3 1.3.3. 1.4.3 Addressing the Fisheries Management Strategy..............4
1.4. Project Objectives ...................................................................................4 1.5. Target Species Profiles ............................................................................5
1.5.1. Glandular frog (Litoria subglandulosa) .......................................5 1.5.2. Stuttering frog (Mixophyes balbus) ..............................................6
2. Methods ..................................................................................................8
2.1. Establishment of Study Sites ...................................................................8 2.2. Target Amphibian Surveys ...................................................................13 2.3. Electro-fishing Surveys ...........................................................................13 2.4. Statistical Analysis of the Data ............................................................14
3. Results ....................................................................................................15
3.1. Frog distributions and a comparison of frog population densities between trout and control transects (analysis of pooled data for 2007 and 2008 surveys). ..............................................................................................15 3.2. Effects of trout on various measures of body condition and environmental stress. ..........................................................................................18 3.3. The relationship between stream and riparian variables and frog distributions along stream transects. ...............................................................20 3.4. Results of electro-fishing surveys..........................................................24
4. Discussion ..............................................................................................26
5. Conclusions ..........................................................................................28
6. References............................................................................................29
List of Figures Figure 1: Regional context showing the location of the study area in the
Styx River catchment system on the New England Tablelands.................2
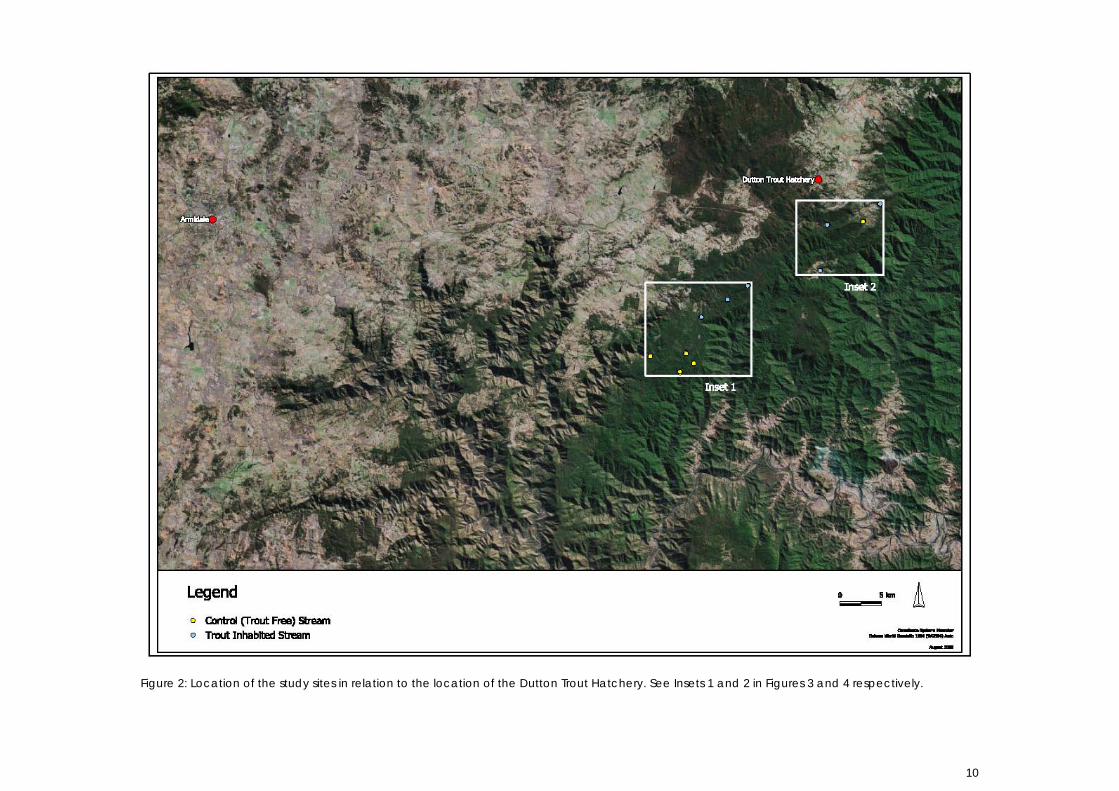
Figure 2: Location of the study sites in relation to the location of the Dutton Trout Hatchery. See Insets 1 and 2 in Figures 3 and 4 respectively. ........10
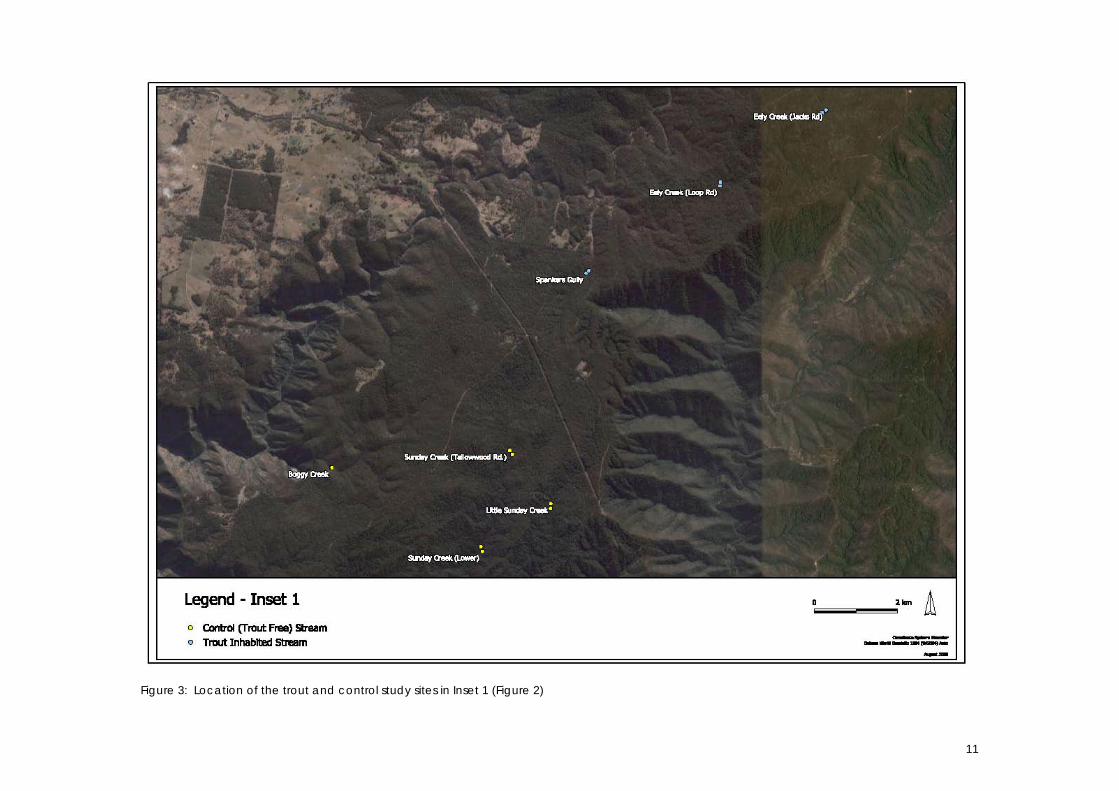
Figure 3: Location of the trout and control study sites in Inset 1 (Figure 2) ...11
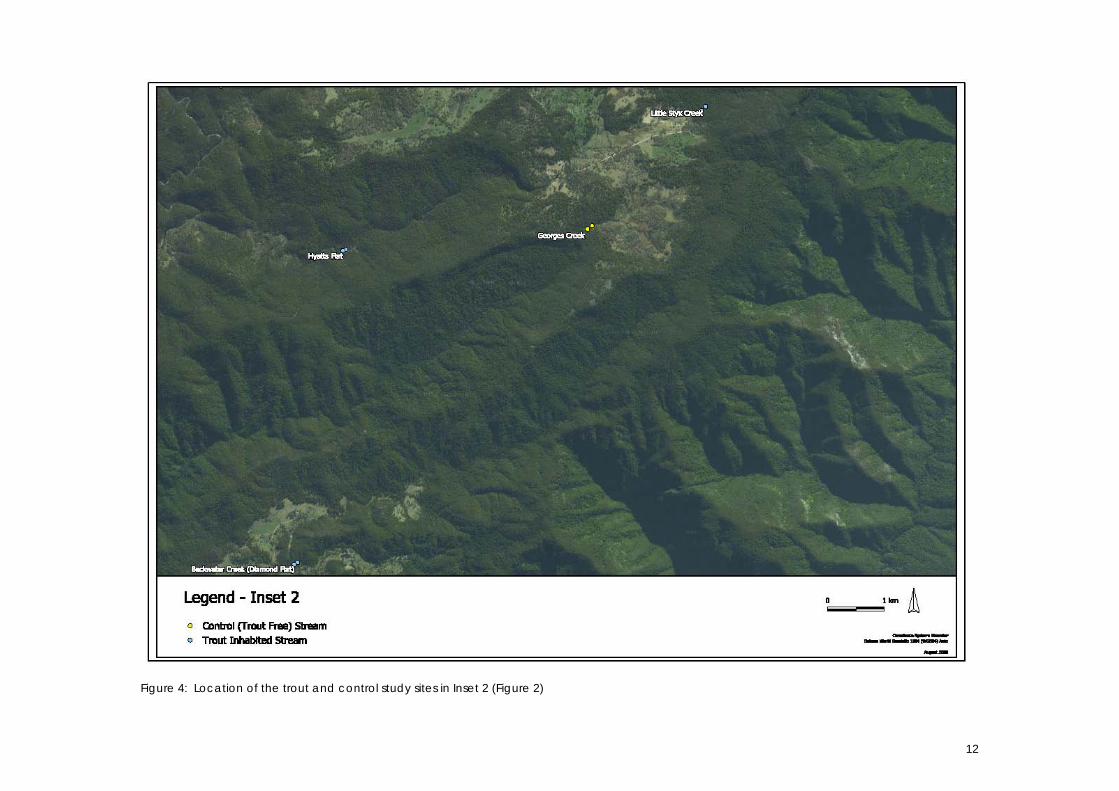
Figure 4: Location of the trout and control study sites in Inset 2 (Figure 2) ...12
iv
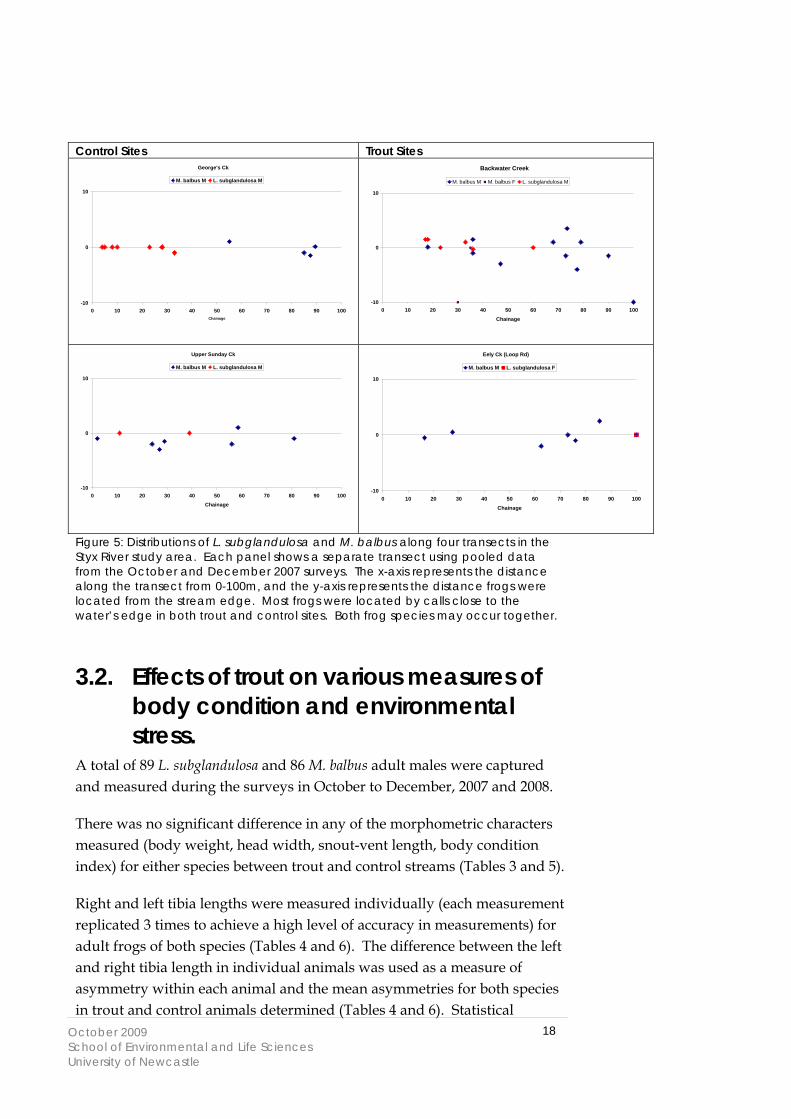
Figure 5: Distributions of L. subglandulosa and M. balbus along four transects in the Styx River study area. Each panel shows a separate transect using pooled data from the October and December 2007 surveys. The x-axis represents the distance along the transect from 0-100m, and the y-axis represents the distance frogs were located from the stream edge. Most frogs were located by calls close to the water’s edge in both trout and control sites. Both frog species may occur together. ...18
Figure 6: M. balbus counts along transects against average riffle length in transects; P <0.001, R = 0.848........................................................................21
Figure 7: M. balbus counts along transects against pool depth; P <0.05, R = 0.603 ..................................................................................................................22
Figure 8: Proportion of exposed substrate consisting of mud against mean riffle length; P <0.005, R = 0.781 .....................................................................22
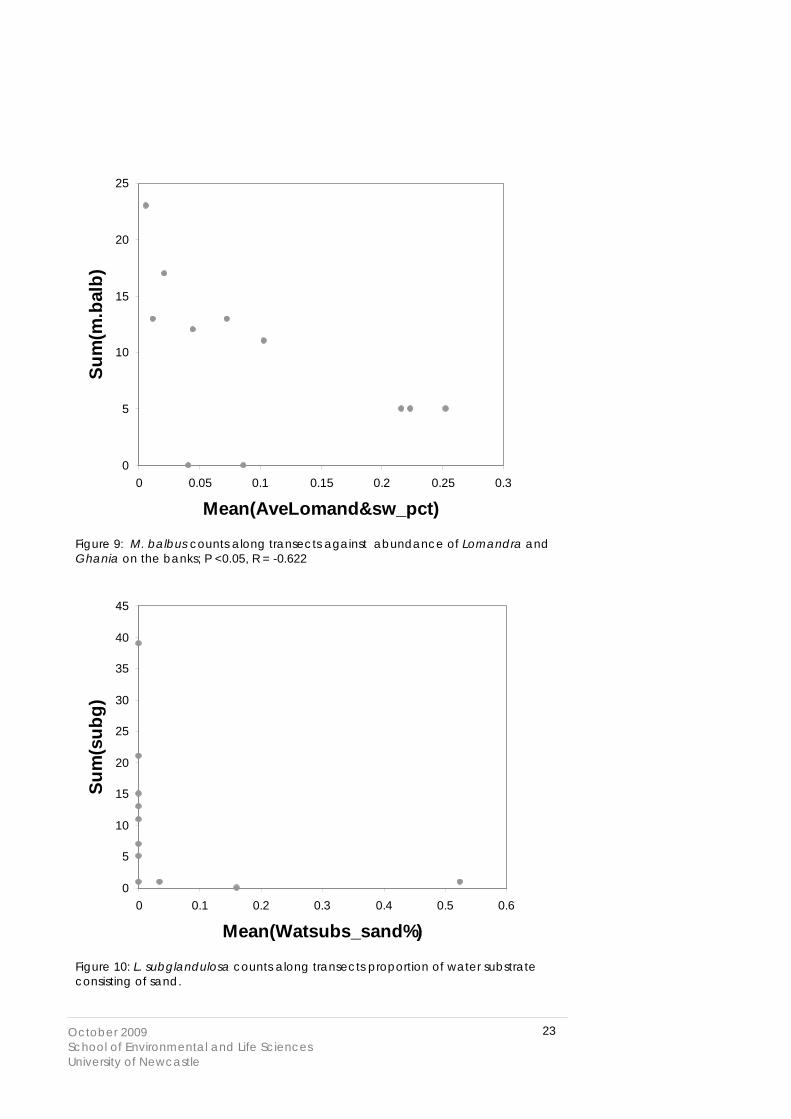
Figure 9: M. balbus counts along transects against abundance of Lomandra and Ghania on the banks; P <0.05, R = -0.622........................23
Figure 10: L. subglandulosa counts along transects proportion of water substrate consisting of sand. .........................................................................23
Figure 11: L. subglandulosa counts along transects proportion of logs and wood on the banks.........................................................................................24
List of Tables Table 1: Records of Mixophyes balbus along trout release and trout free
transects during surveys in 2007 and 2008. Right column shows the results of electrofishing along some transects with number and species of trout captured indicated, or absence of trout captures if site fished but no trout captured. There was no significant difference in the density of M. balbus along trout release and trout free sites based on the pooled data for 2007 and 2008 (chi-square = 2.657, df =1, p = 0.1030). M. balbus observed (mean records per transect per survey) in: Trout release sites 2007 = 2.3 , 2008 = 2.3 ; Trout-free (control sites) 2007 = 2.7, 2008 = 3.1. ..............................................................................................16
Table 2: Records of Litoria subglandulosa along trout release and trout free transects during surveys in 2007 and 2008. Right column shows the results of electrofishing along some transects with number and species of trout captured indicated, or absence of trout captures if site fished but no trout captured. Significantly more Litoria subglandulosa were recorded on trout release catchment transects (comparisons of recorded individuals per 100 metre transect) than along trout free transects (chi-square = 72.20, df =1, p < 0.0001). Litoria sublgandulosa
v
observed (mean records per transect per survey) in: Trout release sites 2007 = 1.9, 2008 = 4.9; Trout-free (control sites) 2007 =1.9, 2008 = 1.7 ....17
Table 3: Comparative morphometrics of adult male M. balbus from trout release and control streams during October and December 2007 and 2008 surveys. # Body Condition Index (BCI) = Body weight (g)/Snout-vent length (mm). p = level of significance of mean difference between trout release and control stream frogs; ns = no significant difference.........................................................................................................19
Table 4: Mean tibia length of adult male M. balbus from trout release and control streams during October and December 2007 and 2008 surveys, and levels of asymmetry between left and right tibias (as determined by difference in length between left and right tibias). * indicates significant asymmetry between left and right tibias; there was no significant difference (ns) between the level of asymmetry in trout and control stream frogs........................................................................................19
Table 5: Comparative morphometrics of adult male L. subglandulosa from trout release and control streams during October to December 2007 and 2008 surveys. # Body Condition Index (BCI) = Body weight (g)/Snout-vent length (mm). p = level of significance of mean difference between trout release and control stream frogs; ns = no significant difference......................................................................................19
Table 6: Mean tibia length of adult male Lit. subglandulosa from trout release and control streams during October to December 2007 and 2008 surveys, and levels of asymmetry between left and right tibias (as determined by difference in length between left and right tibias). * indicates significant asymmetry between left and right tibias; there was no significant difference (ns) between the level of asymmetry in trout and control stream frogs. ..............................................................................19
Table 7: Spearman’s non-parametric correlation co-efficients for correlation of M. balbus and L. subglandulosa numbers with various habitat variables. ..........................................................................................................21
List of Plates Plate 1 : The Glandular frog (Litoria subglandulosa) ...........................................6
Plate 2: The Stuttering frog (Mixophyes balbus) ...................................................7
1
1. Introduction
1.1. Scope The authors of this report were engaged by the New South Wales Department of Primary Industries (Recreational Freshwater Fishing Trust) to undertake an assessment of the status of populations of threatened stream frogs in and around the upper catchment of the Styx River on the New England Tablelands in areas where trout releases occur. The purpose of this assessment was to provide an insight into the impact of the release of introduced trout species on the distribution and abundance of threatened stream dependent frogs.
The first year of the study involved a wide ranging survey of streams in the Styx River Catchment area that were either trout release streams or streams in which trout were not released. Those surveys showed that two endangered species, the Glandular Frog (Litoria subglandulosa) and the Stuttering Frog (Mixophyes balbus) were distributed along streams where trout release occurs, as well as along streams where trout were not known to be released. Analysis of the data did not show a significant difference in the proportions of streams with populations of these frogs between trout release and non-trout release streams. Nevertheless, it was concluded in the report on the initial surveys (Clulow et al, August, 2006) that the presence of populations of these frog species in streams co-habited by trout did not necessarily indicate that trout had no negative impact on those threatened frog species. Rather, the study only indicated that trout were not associated with the elimination (local extinction) of the frogs from those streams. This was because the study was only able to determine the presence or absence of frog populations (due to the objective of surveying a large number of stream sites), but did not determine whether frog population size and density was reduced in the presence of trout. The report recommended that some longer term study sites be established to determine whether trout are associated with a decline in the population status of these frog species by comparing the population demographics of frog populations over time in streams with and without trout.
Support from the Recreational Freshwater Fishing Trust was provided to continue that work into a second year, with the establishment of 11 permanent transects along streams containing the two species of threatened stream frogs. These permanent transects were established to be able to gather medium-term data on the population demographics of the both the Glandular and Stuttering Frogs, in order to assess if there were any
2
population level impacts caused by releasing trout into the streams. The first year of surveys along these transects were conducted in the second year of this study, at the time when the transects were established (see Clulow et al, 2008). This report outlines the results of a second year of surveys carried out at the transects in the 2008/2009 season, which form a continuation of the project.
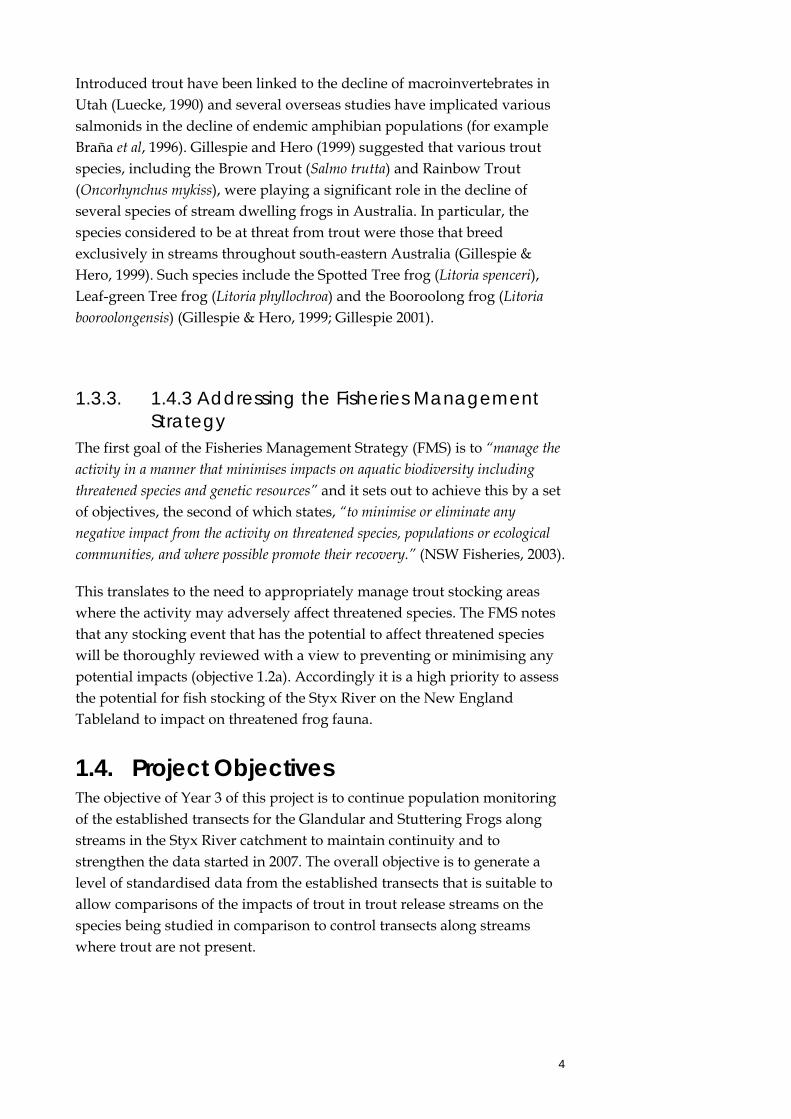
1.2. Local Context The study area is located in north-eastern NSW on the New England Tablelands and is situated between Coffs Harbour to the east, Armidale to the west, Grafton to the north and Kempsey to the south (see Figure 1). The region is associated with large areas of National Park, State Forest and freehold rural lands. The landscape is characterised by numerous creeks, streams and rivers, numbers of which are utilised for stocking with introduced trout. The vegetation and landscape throughout the study area varies greatly with rural townships, cleared land (generally utilised for farming), and natural forest areas.
Figure 1: Regional context showing the location of the study area in the Styx River catchment system on the New England Tablelands.
3
1.3. Background to the Problem and Proposed Study
1.3.1. The Recent Decline of Amphibians in Australia In the early 1980’s the decline of an Australian amphibian was observed for the first time with the disappearance of the Gastric Brooding (Rheobatrachus silus) frog in south-eastern Queensland. Since then, there has been a recorded decline in the distribution and abundance of numerous native frog species throughout Australia (see papers in Campbell, 1999). Stream dependent frogs (species that rely on streams for breeding and larval support) make up the majority of Australian amphibians undergoing decline (Morrison & Hero, 2004). The cause of this decline is a matter of considerable debate and current research among scientists today. Several hypotheses have been put forward to explain this decline including disease, habitat loss and degradation, climate change, pollution, increased levels of UV-B radiation, and predation by introduced species (Alford & Richards, 1999). Today it is estimated that a possible 32% of amphibian species are at risk of extinction globally (Stuart et al, 2004). These declines have resulted in numerous species being listed as threatened in Australia under both state and federal legislation. Accordingly, activities that may impact on populations of these frogs or their habitats are required to be subject to impact assessment.
Five stream dependent frogs that are listed as threatened occur in the New England region. Two that have population records near to the sites of fish releases on the Styx River on the New England Tablelands are the Stuttering frog (Mixophyes balbus) and Glandular frog (Litoria subglandulosa). Populations of three other threatened frog species are also likely to occur in the area, the Peppered frog (Litoria piperata), the Booroolong frog (Litoria booroolongensis) and the Tusked frog (Adelotus brevis). Clulow et al (2006) in the first year of this study confirmed the presence of significant populations of the first two of these endangered species throughout the study area.
1.3.2. The Implication of Introduced Trout in the Decline of Stream Frogs
Considerable research has gone into investigating the affect that both introduced fish, and native fish translocated into areas where they previously did not occur, have had on amphibian larvae. Studies of the effects of presence of species such as the introduced Mosquito Fish (Gambusia spp.) have suggested that they may play a role in the decline of several amphibian species through predation on tadpoles (for example Morgan & Buttemer, 1996; Pyke & White, 1996; Webb & Joss, 1997).
4
Introduced trout have been linked to the decline of macroinvertebrates in Utah (Luecke, 1990) and several overseas studies have implicated various salmonids in the decline of endemic amphibian populations (for example Braña et al, 1996). Gillespie and Hero (1999) suggested that various trout species, including the Brown Trout (Salmo trutta) and Rainbow Trout (Oncorhynchus mykiss), were playing a significant role in the decline of several species of stream dwelling frogs in Australia. In particular, the species considered to be at threat from trout were those that breed exclusively in streams throughout south-eastern Australia (Gillespie & Hero, 1999). Such species include the Spotted Tree frog (Litoria spenceri), Leaf-green Tree frog (Litoria phyllochroa) and the Booroolong frog (Litoria booroolongensis) (Gillespie & Hero, 1999; Gillespie 2001).
1.3.3. 1.4.3 Addressing the Fisheries Management Strategy
The first goal of the Fisheries Management Strategy (FMS) is to “manage the activity in a manner that minimises impacts on aquatic biodiversity including threatened species and genetic resources” and it sets out to achieve this by a set of objectives, the second of which states, “to minimise or eliminate any negative impact from the activity on threatened species, populations or ecological communities, and where possible promote their recovery.” (NSW Fisheries, 2003).
This translates to the need to appropriately manage trout stocking areas where the activity may adversely affect threatened species. The FMS notes that any stocking event that has the potential to affect threatened species will be thoroughly reviewed with a view to preventing or minimising any potential impacts (objective 1.2a). Accordingly it is a high priority to assess the potential for fish stocking of the Styx River on the New England Tableland to impact on threatened frog fauna.
1.4. Project Objectives The objective of Year 3 of this project is to continue population monitoring of the established transects for the Glandular and Stuttering Frogs along streams in the Styx River catchment to maintain continuity and to strengthen the data started in 2007. The overall objective is to generate a level of standardised data from the established transects that is suitable to allow comparisons of the impacts of trout in trout release streams on the species being studied in comparison to control transects along streams where trout are not present.
5
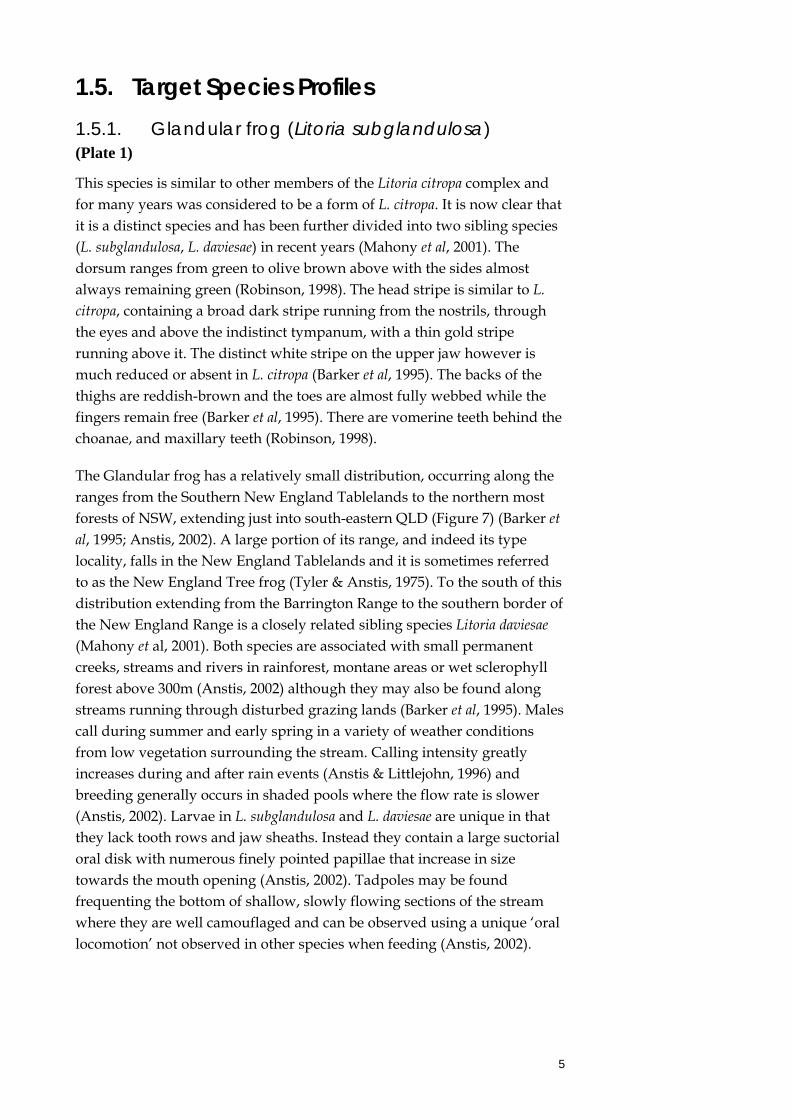
1.5. Target Species Profiles 1.5.1. Glandular frog (Litoria subglandulosa) (Plate 1)
This species is similar to other members of the Litoria citropa complex and for many years was considered to be a form of L. citropa. It is now clear that it is a distinct species and has been further divided into two sibling species (L. subglandulosa, L. daviesae) in recent years (Mahony et al, 2001). The dorsum ranges from green to olive brown above with the sides almost always remaining green (Robinson, 1998). The head stripe is similar to L. citropa, containing a broad dark stripe running from the nostrils, through the eyes and above the indistinct tympanum, with a thin gold stripe running above it. The distinct white stripe on the upper jaw however is much reduced or absent in L. citropa (Barker et al, 1995). The backs of the thighs are reddish-brown and the toes are almost fully webbed while the fingers remain free (Barker et al, 1995). There are vomerine teeth behind the choanae, and maxillary teeth (Robinson, 1998).
The Glandular frog has a relatively small distribution, occurring along the ranges from the Southern New England Tablelands to the northern most forests of NSW, extending just into south-eastern QLD (Figure 7) (Barker et al, 1995; Anstis, 2002). A large portion of its range, and indeed its type locality, falls in the New England Tablelands and it is sometimes referred to as the New England Tree frog (Tyler & Anstis, 1975). To the south of this distribution extending from the Barrington Range to the southern border of the New England Range is a closely related sibling species Litoria daviesae (Mahony et al, 2001). Both species are associated with small permanent creeks, streams and rivers in rainforest, montane areas or wet sclerophyll forest above 300m (Anstis, 2002) although they may also be found along streams running through disturbed grazing lands (Barker et al, 1995). Males call during summer and early spring in a variety of weather conditions from low vegetation surrounding the stream. Calling intensity greatly increases during and after rain events (Anstis & Littlejohn, 1996) and breeding generally occurs in shaded pools where the flow rate is slower (Anstis, 2002). Larvae in L. subglandulosa and L. daviesae are unique in that they lack tooth rows and jaw sheaths. Instead they contain a large suctorial oral disk with numerous finely pointed papillae that increase in size towards the mouth opening (Anstis, 2002). Tadpoles may be found frequenting the bottom of shallow, slowly flowing sections of the stream where they are well camouflaged and can be observed using a unique ‘oral locomotion’ not observed in other species when feeding (Anstis, 2002).
6
Plate 1 : The Glandular frog (Litoria subglandulosa)
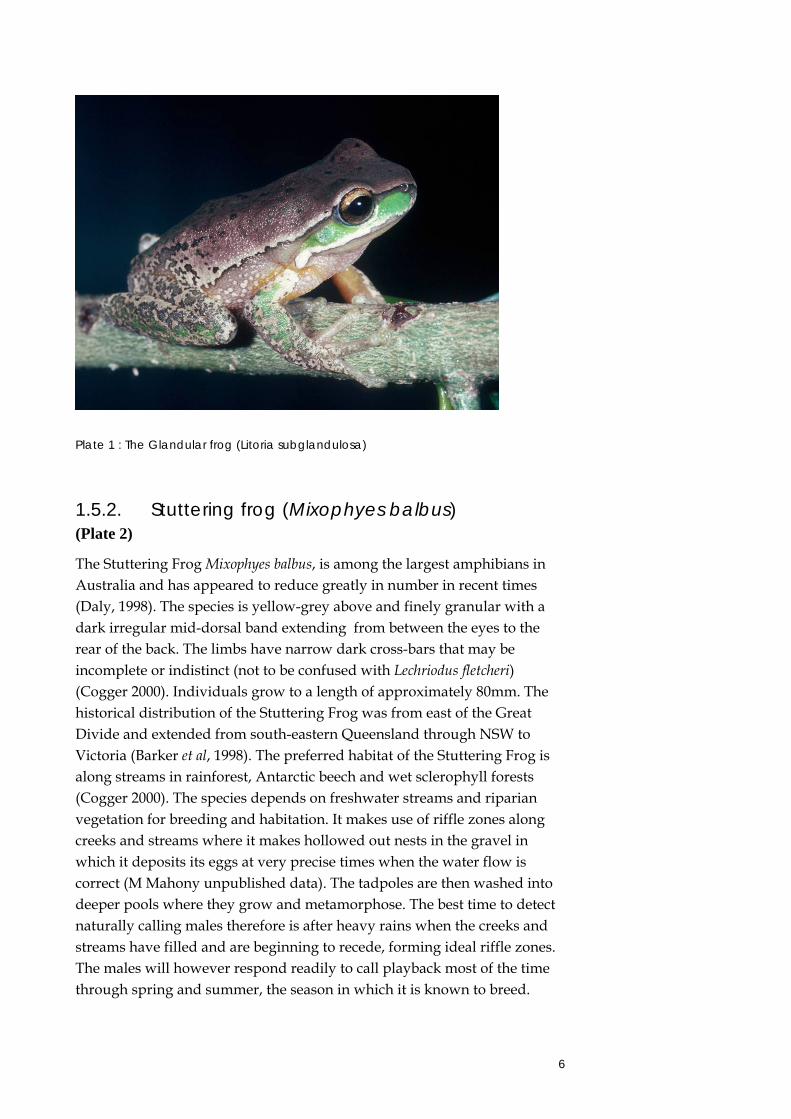
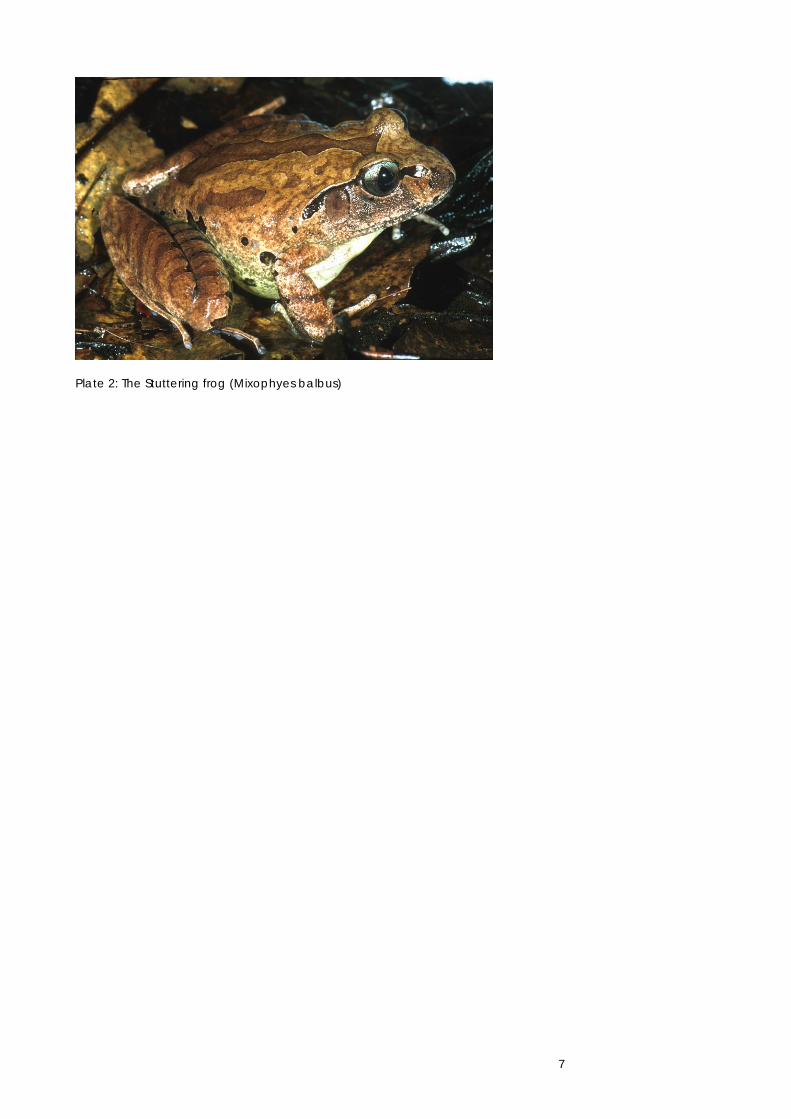
1.5.2. Stuttering frog (Mixophyes balbus) (Plate 2)
The Stuttering Frog Mixophyes balbus, is among the largest amphibians in Australia and has appeared to reduce greatly in number in recent times (Daly, 1998). The species is yellow-grey above and finely granular with a dark irregular mid-dorsal band extending from between the eyes to the rear of the back. The limbs have narrow dark cross-bars that may be incomplete or indistinct (not to be confused with Lechriodus fletcheri) (Cogger 2000). Individuals grow to a length of approximately 80mm. The historical distribution of the Stuttering Frog was from east of the Great Divide and extended from south-eastern Queensland through NSW to Victoria (Barker et al, 1998). The preferred habitat of the Stuttering Frog is along streams in rainforest, Antarctic beech and wet sclerophyll forests (Cogger 2000). The species depends on freshwater streams and riparian vegetation for breeding and habitation. It makes use of riffle zones along creeks and streams where it makes hollowed out nests in the gravel in which it deposits its eggs at very precise times when the water flow is correct (M Mahony unpublished data). The tadpoles are then washed into deeper pools where they grow and metamorphose. The best time to detect naturally calling males therefore is after heavy rains when the creeks and streams have filled and are beginning to recede, forming ideal riffle zones. The males will however respond readily to call playback most of the time through spring and summer, the season in which it is known to breed.
7
Plate 2: The Stuttering frog (Mixophyes balbus)
8
2. Methods
2.1. Establishment of Study Sites Permanent 100m transects were established along 11 streams in 2007 to allow monitoring and assessment of the status of the two threatened stream frogs, the Stuttering Frog (Mixophyes balbus) and the Glandular Frog (Litoria subglandulosa) in the presence and absence of trout. These streams provide 5 trout inhabited sites and 4 trout free control sites for the Glandular Frog and 4 trout inhabited sites and 5 trout free control sites for the Stuttering Frog (Mixophyes balbus). Some sites selected contain both target species and as such are used to assess both species at those sites. Trout inhabited sites have been defined as any site that is on a stream where trout have been released, or on a stream that is connected to a trout release stream and which contains no significant geological barriers that would prevent trout moving there. A trout-free stream is defined as a stream that has not had trout released at it, and is not suitably connected to any stream in which trout have been released.
Stream and riparian characteristics were mapped at all sites in 2007 and included features such as flow rate, stream width and depth, substrate under water, exposed substrate, pools and riffle zones, riparian vegetation cover, ground cover and amount of vegetation overhanging the banks. The location of each site established is shown below:
Litoria subglandulosa
Control Trout Inhabited
Sunday Ck Lower (420500E, 6608000N) Little Styx River [Thungutty] (441200E, 6625550N)
Little Sunday Ck (421900E, 6608750N) Styx River [Hyatt’s Flat] (435700E, 6623400N)
Sunday Ck Upper (421000E, 6610050N) Eely Ck [Loop Rd] (425350E, 6615500N)
George’s Ck (439500E, 6623750N) Eely Ck [Jack’s Rd] (427650E, 6616950)
Backwater Ck (435100E, 6618600N)

9
Mixophyes balbus
Control Trout Inhabited
George’s Ck (439500E, 6623750N) Eely Ck [Loop Rd] (425350E, 6615500N)
Sunday Ck Lower (420500E, 6608000N) Eely Ck [Jack’s Rd] (427650E, 6616950N)
Little Sunday Ck (421900E, 6608750N) Spankers Gully (422650E, 6613650N)
Sunday Ck Upper (421000E, 6610050N) Backwater Ck (435100E, 6618600N)
Boggy Ck (417450E, 6609600N)
The study sites and transect locations are shown in Figures 2-4.
10
Figure 2: Location of the study sites in relation to the location of the Dutton Trout Hatchery. See Insets 1 and 2 in Figures 3 and 4 respectively.
11
Figure 3: Location of the trout and control study sites in Inset 1 (Figure 2)
12
Figure 4: Location of the trout and control study sites in Inset 2 (Figure 2)
13October 2009 School of Environmental and Life Sciences University of Newcastle
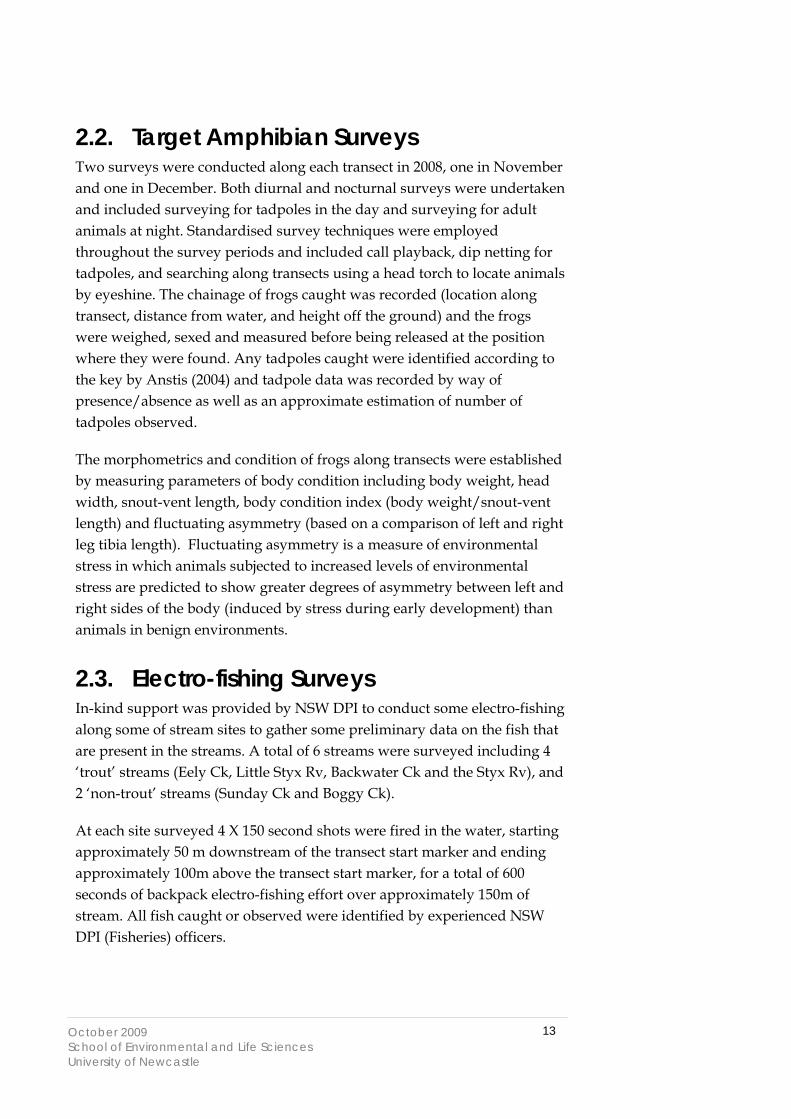
2.2. Target Amphibian Surveys Two surveys were conducted along each transect in 2008, one in November and one in December. Both diurnal and nocturnal surveys were undertaken and included surveying for tadpoles in the day and surveying for adult animals at night. Standardised survey techniques were employed throughout the survey periods and included call playback, dip netting for tadpoles, and searching along transects using a head torch to locate animals by eyeshine. The chainage of frogs caught was recorded (location along transect, distance from water, and height off the ground) and the frogs were weighed, sexed and measured before being released at the position where they were found. Any tadpoles caught were identified according to the key by Anstis (2004) and tadpole data was recorded by way of presence/absence as well as an approximate estimation of number of tadpoles observed.
The morphometrics and condition of frogs along transects were established by measuring parameters of body condition including body weight, head width, snout-vent length, body condition index (body weight/snout-vent length) and fluctuating asymmetry (based on a comparison of left and right leg tibia length). Fluctuating asymmetry is a measure of environmental stress in which animals subjected to increased levels of environmental stress are predicted to show greater degrees of asymmetry between left and right sides of the body (induced by stress during early development) than animals in benign environments.
2.3. Electro-fishing Surveys In-kind support was provided by NSW DPI to conduct some electro-fishing along some of stream sites to gather some preliminary data on the fish that are present in the streams. A total of 6 streams were surveyed including 4 ‘trout’ streams (Eely Ck, Little Styx Rv, Backwater Ck and the Styx Rv), and 2 ‘non-trout’ streams (Sunday Ck and Boggy Ck).
At each site surveyed 4 X 150 second shots were fired in the water, starting approximately 50 m downstream of the transect start marker and ending approximately 100m above the transect start marker, for a total of 600 seconds of backpack electro-fishing effort over approximately 150m of stream. All fish caught or observed were identified by experienced NSW DPI (Fisheries) officers.
14October 2009 School of Environmental and Life Sciences University of Newcastle
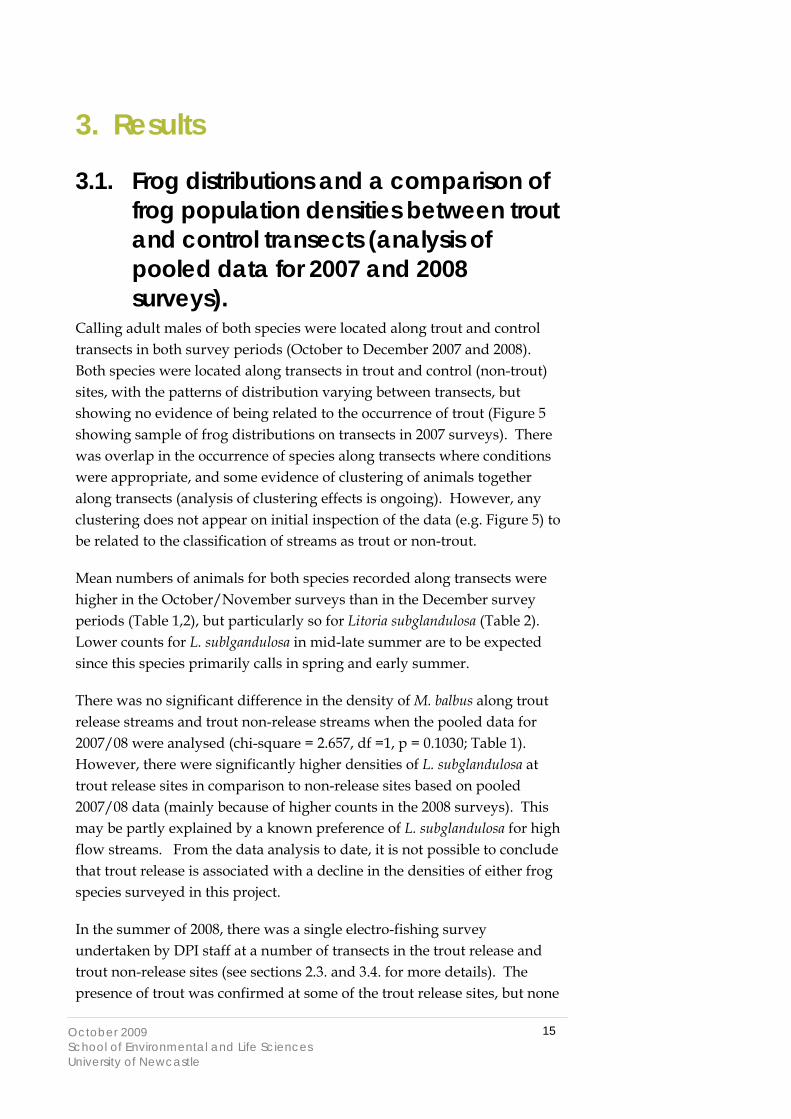
2.4. Statistical Analysis of the Data Analysis of the first year of transect monitoring data collected during the 2007 surveys has been completed using parametric and non-parametric approaches. Multi-variate regression analysis was used to determine correlations between stream and riparian variables and the distribution of frogs along transects.
Analysis of variance and t-tests were used compare the frog population densities on transects between trout and non-trout sites. Analysis of variance was also used to analyse body condition variables and fluctuating asymmetry between trout and control (non-trout) transects.
15October 2009 School of Environmental and Life Sciences University of Newcastle
3. Results
3.1. Frog distributions and a comparison of frog population densities between trout and control transects (analysis of pooled data for 2007 and 2008 surveys).
Calling adult males of both species were located along trout and control transects in both survey periods (October to December 2007 and 2008). Both species were located along transects in trout and control (non-trout) sites, with the patterns of distribution varying between transects, but showing no evidence of being related to the occurrence of trout (Figure 5 showing sample of frog distributions on transects in 2007 surveys). There was overlap in the occurrence of species along transects where conditions were appropriate, and some evidence of clustering of animals together along transects (analysis of clustering effects is ongoing). However, any clustering does not appear on initial inspection of the data (e.g. Figure 5) to be related to the classification of streams as trout or non-trout.
Mean numbers of animals for both species recorded along transects were higher in the October/November surveys than in the December survey periods (Table 1,2), but particularly so for Litoria subglandulosa (Table 2). Lower counts for L. sublgandulosa in mid-late summer are to be expected since this species primarily calls in spring and early summer.
There was no significant difference in the density of M. balbus along trout release streams and trout non-release streams when the pooled data for 2007/08 were analysed (chi-square = 2.657, df =1, p = 0.1030; Table 1). However, there were significantly higher densities of L. subglandulosa at trout release sites in comparison to non-release sites based on pooled 2007/08 data (mainly because of higher counts in the 2008 surveys). This may be partly explained by a known preference of L. subglandulosa for high flow streams. From the data analysis to date, it is not possible to conclude that trout release is associated with a decline in the densities of either frog species surveyed in this project.
In the summer of 2008, there was a single electro-fishing survey undertaken by DPI staff at a number of transects in the trout release and trout non-release sites (see sections 2.3. and 3.4. for more details). The presence of trout was confirmed at some of the trout release sites, but none
16October 2009 School of Environmental and Life Sciences University of Newcastle
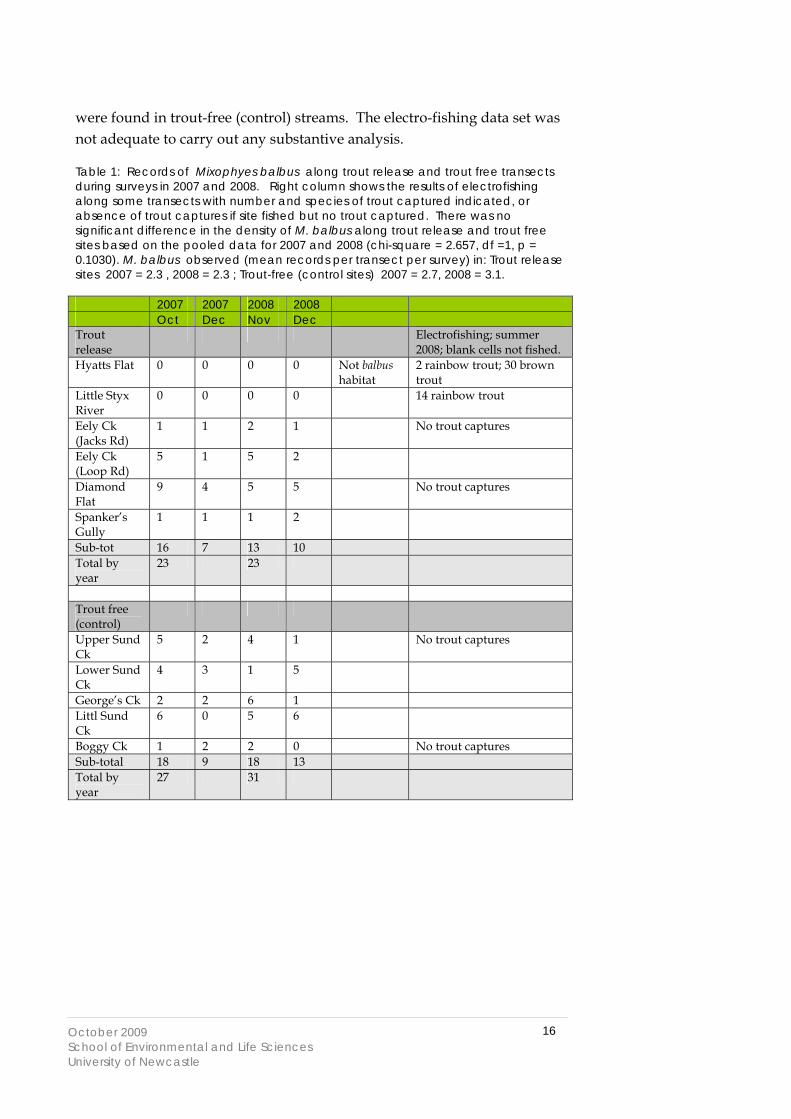
were found in trout-free (control) streams. The electro-fishing data set was not adequate to carry out any substantive analysis.
Table 1: Records of Mixophyes balbus along trout release and trout free transects during surveys in 2007 and 2008. Right column shows the results of electrofishing along some transects with number and species of trout captured indicated, or absence of trout captures if site fished but no trout captured. There was no significant difference in the density of M. balbus along trout release and trout free sites based on the pooled data for 2007 and 2008 (chi-square = 2.657, df =1, p = 0.1030). M. balbus observed (mean records per transect per survey) in: Trout release sites 2007 = 2.3 , 2008 = 2.3 ; Trout-free (control sites) 2007 = 2.7, 2008 = 3.1. 2007 2007 2008 2008 Oct Dec Nov Dec Trout release
Electrofishing; summer 2008; blank cells not fished.
Hyatts Flat 0 0 0 0 Not balbus habitat
2 rainbow trout; 30 brown trout
Little Styx River
0 0 0 0 14 rainbow trout
Eely Ck (Jacks Rd)
1 1 2 1 No trout captures
Eely Ck (Loop Rd)
5 1 5 2
Diamond Flat
9 4 5 5 No trout captures
Spanker’s Gully
1 1 1 2
Sub-tot 16 7 13 10 Total by year
23 23
Trout free (control)
Upper Sund Ck
5 2 4 1 No trout captures
Lower Sund Ck
4 3 1 5
George’s Ck 2 2 6 1 Littl Sund Ck
6 0 5 6
Boggy Ck 1 2 2 0 No trout captures Sub-total 18 9 18 13 Total by year
27 31
17October 2009 School of Environmental and Life Sciences University of Newcastle
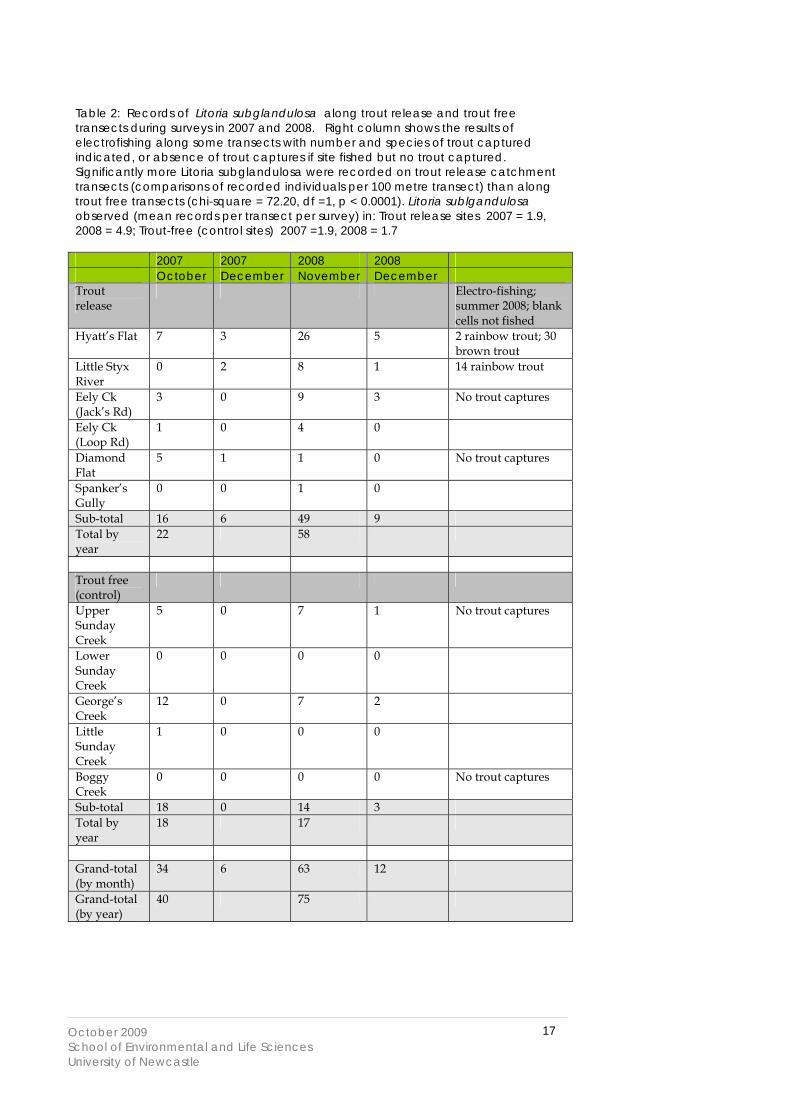
Table 2: Records of Litoria subglandulosa along trout release and trout free transects during surveys in 2007 and 2008. Right column shows the results of electrofishing along some transects with number and species of trout captured indicated, or absence of trout captures if site fished but no trout captured. Significantly more Litoria subglandulosa were recorded on trout release catchment transects (comparisons of recorded individuals per 100 metre transect) than along trout free transects (chi-square = 72.20, df =1, p < 0.0001). Litoria sublgandulosa observed (mean records per transect per survey) in: Trout release sites 2007 = 1.9, 2008 = 4.9; Trout-free (control sites) 2007 =1.9, 2008 = 1.7 2007 2007 2008 2008 October December November December Trout release
Electro-fishing; summer 2008; blank cells not fished
Hyatt’s Flat 7 3 26 5 2 rainbow trout; 30 brown trout
Little Styx River
0 2 8 1 14 rainbow trout
Eely Ck (Jack’s Rd)
3 0 9 3 No trout captures
Eely Ck (Loop Rd)
1 0 4 0
Diamond Flat
5 1 1 0 No trout captures
Spanker’s Gully
0 0 1 0
Sub-total 16 6 49 9 Total by year
22 58
Trout free (control)
Upper Sunday Creek
5 0 7 1 No trout captures
Lower Sunday Creek
0 0 0 0
George’s Creek
12 0 7 2
Little Sunday Creek
1 0 0 0
Boggy Creek
0 0 0 0 No trout captures
Sub-total 18 0 14 3 Total by year
18 17
Grand-total (by month)
34 6 63 12
Grand-total (by year)
40 75
18October 2009 School of Environmental and Life Sciences University of Newcastle
Control Sites Trout Sites George's Ck
-10
0
10
0 10 20 30 40 50 60 70 80 90 100Chainage
M. balbus M L. subglandulosa M
Backwater Creek
-10
0
10
0 10 20 30 40 50 60 70 80 90 100Chainage
M. balbus M M. balbus F L. subglandulosa M
Upper Sunday Ck
-10
0
10
0 10 20 30 40 50 60 70 80 90 100Chainage
M. balbus M L. subglandulosa M
Eely Ck (Loop Rd)
-10
0
10
0 10 20 30 40 50 60 70 80 90 100Chainage
M. balbus M L. subglandulosa F
Figure 5: Distributions of L. subglandulosa and M. balbus along four transects in the Styx River study area. Each panel shows a separate transect using pooled data from the October and December 2007 surveys. The x-axis represents the distance along the transect from 0-100m, and the y-axis represents the distance frogs were located from the stream edge. Most frogs were located by calls close to the water’s edge in both trout and control sites. Both frog species may occur together.
3.2. Effects of trout on various measures of body condition and environmental stress.
A total of 89 L. subglandulosa and 86 M. balbus adult males were captured and measured during the surveys in October to December, 2007 and 2008.
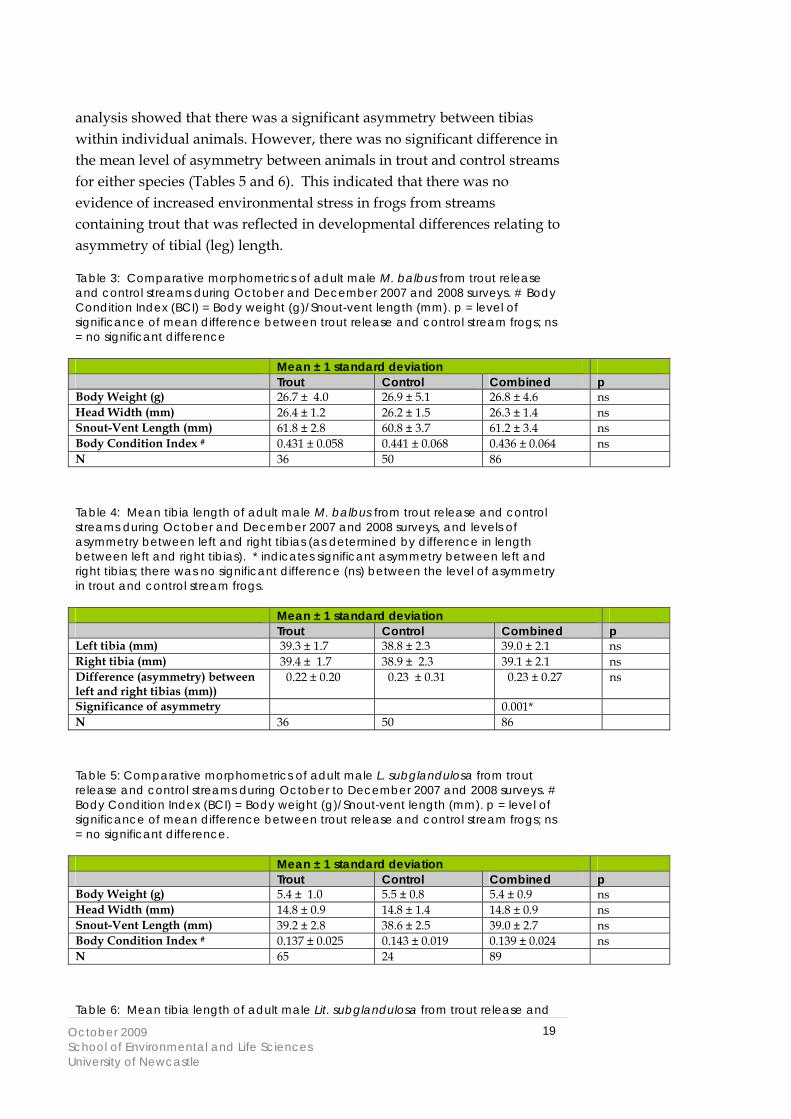
There was no significant difference in any of the morphometric characters measured (body weight, head width, snout-vent length, body condition index) for either species between trout and control streams (Tables 3 and 5).
Right and left tibia lengths were measured individually (each measurement replicated 3 times to achieve a high level of accuracy in measurements) for adult frogs of both species (Tables 4 and 6). The difference between the left and right tibia length in individual animals was used as a measure of asymmetry within each animal and the mean asymmetries for both species in trout and control animals determined (Tables 4 and 6). Statistical
19October 2009 School of Environmental and Life Sciences University of Newcastle
analysis showed that there was a significant asymmetry between tibias within individual animals. However, there was no significant difference in the mean level of asymmetry between animals in trout and control streams for either species (Tables 5 and 6). This indicated that there was no evidence of increased environmental stress in frogs from streams containing trout that was reflected in developmental differences relating to asymmetry of tibial (leg) length.
Table 3: Comparative morphometrics of adult male M. balbus from trout release and control streams during October and December 2007 and 2008 surveys. # Body Condition Index (BCI) = Body weight (g)/Snout-vent length (mm). p = level of significance of mean difference between trout release and control stream frogs; ns = no significant difference Mean ± 1 standard deviation Trout Control Combined p Body Weight (g) 26.7 ± 4.0 26.9 ± 5.1 26.8 ± 4.6 ns Head Width (mm) 26.4 ± 1.2 26.2 ± 1.5 26.3 ± 1.4 ns Snout-Vent Length (mm) 61.8 ± 2.8 60.8 ± 3.7 61.2 ± 3.4 ns Body Condition Index # 0.431 ± 0.058 0.441 ± 0.068 0.436 ± 0.064 ns N 36 50 86
Table 4: Mean tibia length of adult male M. balbus from trout release and control streams during October and December 2007 and 2008 surveys, and levels of asymmetry between left and right tibias (as determined by difference in length between left and right tibias). * indicates significant asymmetry between left and right tibias; there was no significant difference (ns) between the level of asymmetry in trout and control stream frogs. Mean ± 1 standard deviation Trout Control Combined p Left tibia (mm) 39.3 ± 1.7 38.8 ± 2.3 39.0 ± 2.1 ns Right tibia (mm) 39.4 ± 1.7 38.9 ± 2.3 39.1 ± 2.1 ns Difference (asymmetry) between left and right tibias (mm))
0.22 ± 0.20 0.23 ± 0.31 0.23 ± 0.27 ns
Significance of asymmetry 0.001* N 36 50 86
Table 5: Comparative morphometrics of adult male L. subglandulosa from trout release and control streams during October to December 2007 and 2008 surveys. # Body Condition Index (BCI) = Body weight (g)/Snout-vent length (mm). p = level of significance of mean difference between trout release and control stream frogs; ns = no significant difference. Mean ± 1 standard deviation Trout Control Combined p Body Weight (g) 5.4 ± 1.0 5.5 ± 0.8 5.4 ± 0.9 ns Head Width (mm) 14.8 ± 0.9 14.8 ± 1.4 14.8 ± 0.9 ns Snout-Vent Length (mm) 39.2 ± 2.8 38.6 ± 2.5 39.0 ± 2.7 ns Body Condition Index # 0.137 ± 0.025 0.143 ± 0.019 0.139 ± 0.024 ns N 65 24 89
Table 6: Mean tibia length of adult male Lit. subglandulosa from trout release and
20October 2009 School of Environmental and Life Sciences University of Newcastle
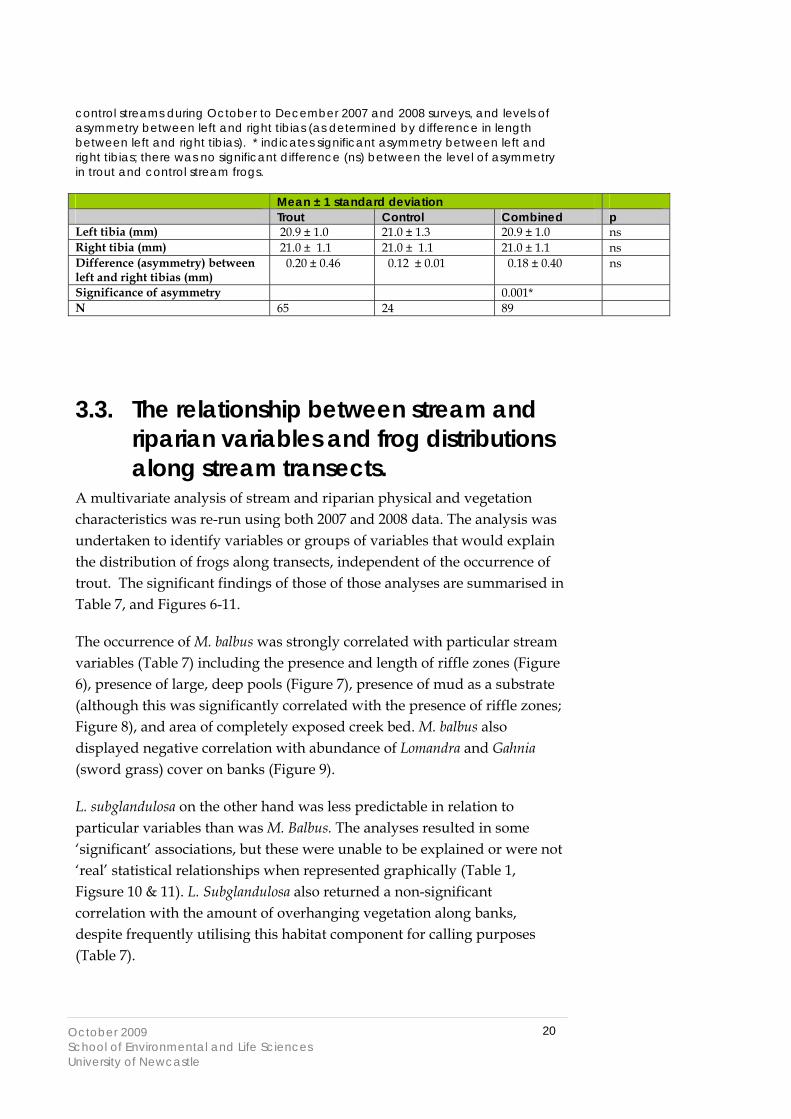
control streams during October to December 2007 and 2008 surveys, and levels of asymmetry between left and right tibias (as determined by difference in length between left and right tibias). * indicates significant asymmetry between left and right tibias; there was no significant difference (ns) between the level of asymmetry in trout and control stream frogs. Mean ± 1 standard deviation Trout Control Combined p Left tibia (mm) 20.9 ± 1.0 21.0 ± 1.3 20.9 ± 1.0 ns Right tibia (mm) 21.0 ± 1.1 21.0 ± 1.1 21.0 ± 1.1 ns Difference (asymmetry) between left and right tibias (mm)
0.20 ± 0.46 0.12 ± 0.01 0.18 ± 0.40 ns
Significance of asymmetry 0.001* N 65 24 89
3.3. The relationship between stream and riparian variables and frog distributions along stream transects.
A multivariate analysis of stream and riparian physical and vegetation characteristics was re-run using both 2007 and 2008 data. The analysis was undertaken to identify variables or groups of variables that would explain the distribution of frogs along transects, independent of the occurrence of trout. The significant findings of those of those analyses are summarised in Table 7, and Figures 6-11.
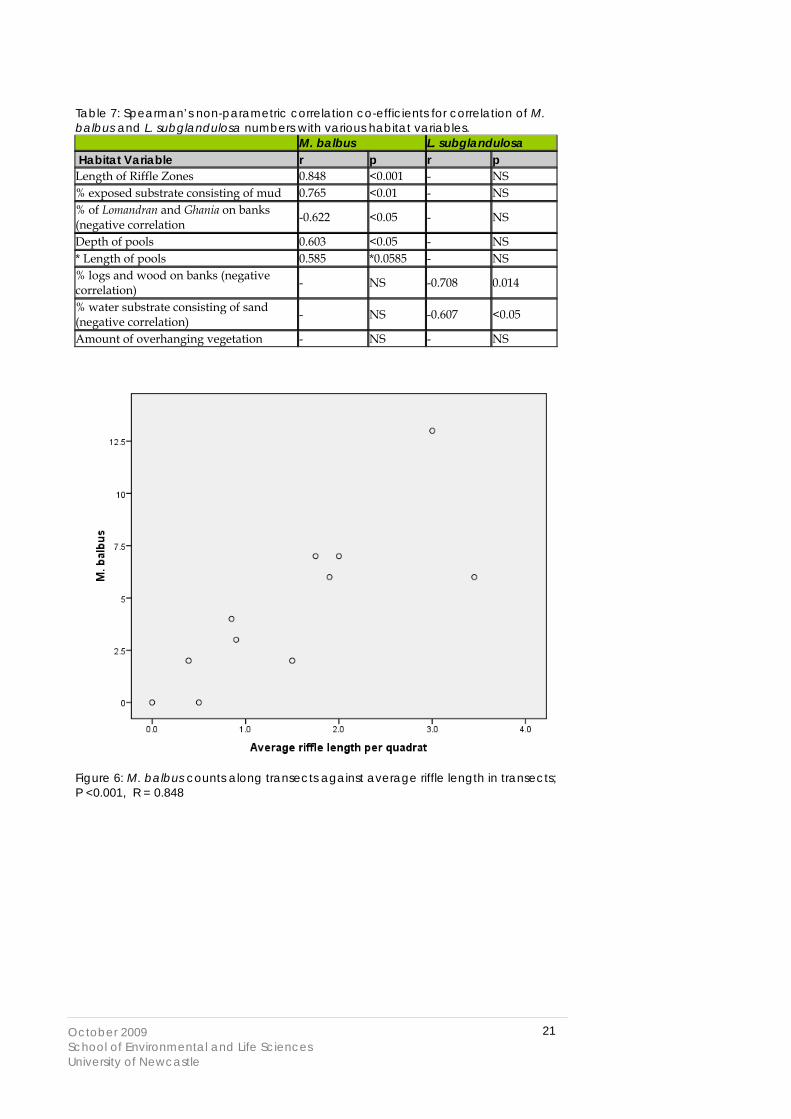
The occurrence of M. balbus was strongly correlated with particular stream variables (Table 7) including the presence and length of riffle zones (Figure 6), presence of large, deep pools (Figure 7), presence of mud as a substrate (although this was significantly correlated with the presence of riffle zones; Figure 8), and area of completely exposed creek bed. M. balbus also displayed negative correlation with abundance of Lomandra and Gahnia (sword grass) cover on banks (Figure 9).
L. subglandulosa on the other hand was less predictable in relation to particular variables than was M. Balbus. The analyses resulted in some ‘significant’ associations, but these were unable to be explained or were not ‘real’ statistical relationships when represented graphically (Table 1, Figsure 10 & 11). L. Subglandulosa also returned a non-significant correlation with the amount of overhanging vegetation along banks, despite frequently utilising this habitat component for calling purposes (Table 7).
21October 2009 School of Environmental and Life Sciences University of Newcastle
Table 7: Spearman’s non-parametric correlation co-efficients for correlation of M. balbus and L. subglandulosa numbers with various habitat variables. M. balbus L. subglandulosa Habitat Variable r p r p Length of Riffle Zones 0.848 <0.001 - NS % exposed substrate consisting of mud 0.765 <0.01 - NS % of Lomandran and Ghania on banks (negative correlation -0.622 <0.05 - NS
Depth of pools 0.603 <0.05 - NS * Length of pools 0.585 *0.0585 - NS % logs and wood on banks (negative correlation) - NS -0.708 0.014
% water substrate consisting of sand (negative correlation) - NS -0.607 <0.05
Amount of overhanging vegetation - NS - NS
Figure 6: M. balbus counts along transects against average riffle length in transects; P <0.001, R = 0.848

22October 2009 School of Environmental and Life Sciences University of Newcastle
Figure 7: M. balbus counts along transects against pool depth; P <0.05, R = 0.603
Figure 8: Proportion of exposed substrate consisting of mud against mean riffle length; P <0.005, R = 0.781
0
0.1
0.2
0.3
0.4
0.5
0.6
0.7
0.8
0 1 2 3 4
Mean(Riffles_lgthmtr)
Mea
n(m
ud_p
ct_E
)
23October 2009 School of Environmental and Life Sciences University of Newcastle
Figure 9: M. balbus counts along transects against abundance of Lomandra and Ghania on the banks; P <0.05, R = -0.622
Figure 10: L. subglandulosa counts along transects proportion of water substrate consisting of sand.
0
5
10
15
20
25
30
35
40
45
0 0.1 0.2 0.3 0.4 0.5 0.6
Mean(Watsubs_sand%)
Sum
(sub
g)
0
5
10
15
20
25
0 0.05 0.1 0.15 0.2 0.25 0.3
Mean(AveLomand&sw_pct)
Sum
(m.b
alb)

24October 2009 School of Environmental and Life Sciences University of Newcastle
Figure 11: L. subglandulosa counts along transects proportion of logs and wood on the banks
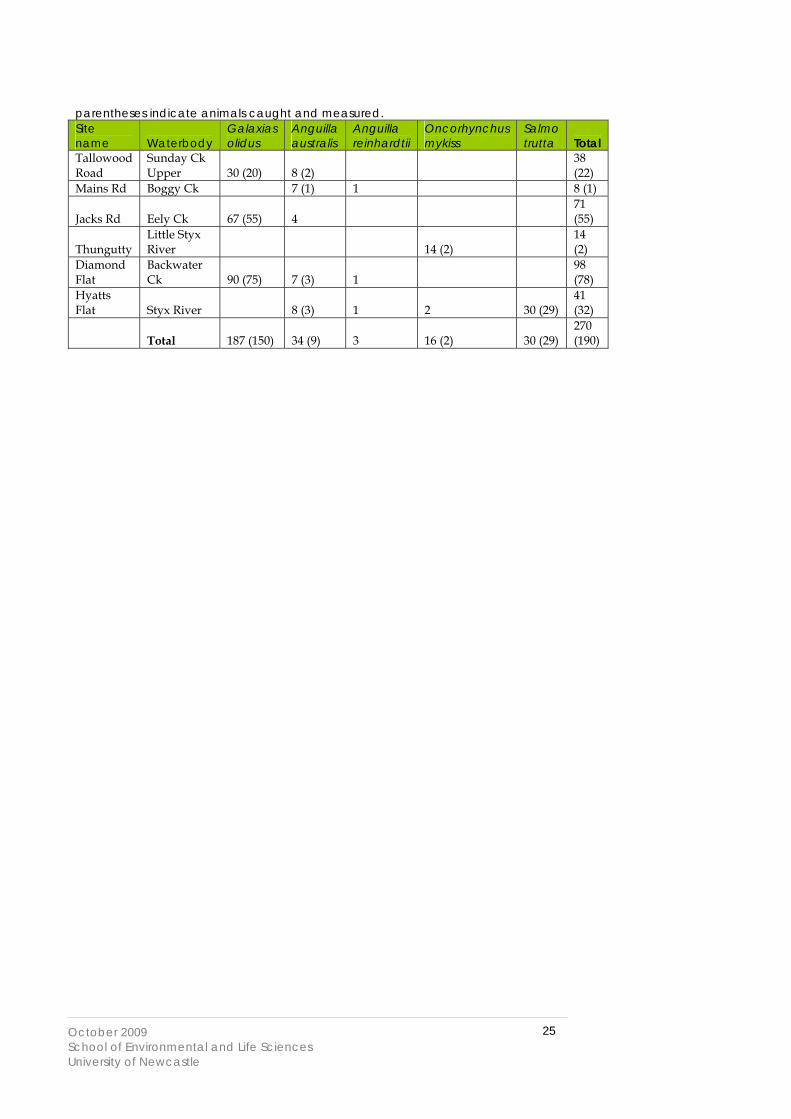
3.4. Results of electro-fishing surveys Six of the 11 sites were successfully surveyed. A total of 5 species of fish were detected, with 3 native species and two introduced trout (Brown Trout Salmo trutta and Rainbow Trout Oncorhynchus mykiss). No trout were found at any of the ‘trout-free’ control streams, while trout were only found at 2 of the 4 surveyed ‘trout’ streams. Rainbow Trout were observed at both the Styx and Little Styx Rivers, while Brown Trout were observed only at the Styx River.
Table 8: Results of the electro-fishing surveys conducted at 6 of the 11 sites. Numbers in parentheses indicate animals observed, whereas numbers that are not in
0
5
10
15
20
25
30
35
40
45
0 0.02 0.04 0.06 0.08 0.1 0.12 0.14
Mean(logwood_pct_E)
Sum
(sub
g)
25October 2009 School of Environmental and Life Sciences University of Newcastle
parentheses indicate animals caught and measured. Site name Waterbody
Galaxias olidus
Anguilla australis
Anguilla reinhardtii
Oncorhynchus mykiss
Salmo trutta Total
Tallowood Road
Sunday Ck Upper 30 (20) 8 (2)
38 (22)
Mains Rd Boggy Ck 7 (1) 1 8 (1)
Jacks Rd Eely Ck 67 (55) 4 71 (55)
Thungutty Little Styx River 14 (2)
14 (2)
Diamond Flat
Backwater Ck 90 (75) 7 (3) 1
98 (78)
Hyatts Flat Styx River 8 (3) 1 2 30 (29)
41 (32)
Total 187 (150) 34 (9) 3 16 (2) 30 (29) 270 (190)
26October 2009 School of Environmental and Life Sciences University of Newcastle
4. Discussion The results presented in this report cover the combined effort of two years of survey work aimed at building a sufficient data set to draw robust and confident conclusions on the population demographics of L. subglandulosa and M. balbus along transects of both trout and trout-free streams. The data to date have not produced any results that indicate a significant effect of the presence of trout in streams on the distribution and abundance (population densities along transects) of either frog species along streams in the Styx River study area, although the power of this data is still somewhat lacking due to only 2 years of survey data. Analysis of the data also failed to show any association of the presence of trout in streams on parameters of body condition (such as body weight, length, head size, body condition index or level of asymmetry in leg length).
The results of the electro-fishing failed to find any trout in 2 of the 4 streams considered to be ‘trout’ streams based upon their proximity and connectedness to streams in which trout are released or known to occur. The results from the electro-fishing are considered preliminary and unsubstantial to draw any concrete conclusions on the definite absence of trout at this stage (for example, trout have been observed on at least one occasion by the authors of this report in Eely Ck, which returned a result of no trout from the 2008 electro-fishing survey). However, it is considered that further work should be carried out to more confidently assess the presence/absence of trout in the study streams, as the results of this may change the meaning of the data gathered on the populations of the Stuttering and Glandular Frogs.
In broad terms, the authors of this study continue to be of the view that the main cause of the decline of New England Tablelands stream frog species has been due to the impacts of the introduced chytrid fungus that is now widely recognised as the primary cause of most amphibian species declines after a scientific debate that has continued over more than two decades (Pyke & White, 1996; Mahony, 1997, 1999; Alford & Richards, 1999; Hamer et al, 2002; Morrison et al, 2004; Stuart et al, 2004). Nevertheless, even though chytridiomycosis is likely to have been the primary and initial cause of the decline of endangered species in the New England Tablelands, other environmental factors (such as trout predation) may subsequently contribute as secondary causes of species decline. Under that scenario, it is important to study the broader ecology of
27October 2009 School of Environmental and Life Sciences University of Newcastle
the endangered frogs to understand factors that might further drive declines, and hence, understanding the impacts of trout is an important component of managing these stream frogs.
Besides investigating the effects of trout on the population demographics of the subject frog species, the study has also contributed some fundamental ecological knowledge relating to the ecology of these species that may be of assistance in their management in trout or trout free systems. The results suggest that the occurrence of L. subglandulosa is not related to clearly defined stream or riparian characteristics, but that the species may occur locally along any stream with appropriate flow rates and a range of riparian characteristics. On the other hand, the occurrence of M. balbus would appear to be strongly biased towards streams with distinct stream characteristics that are likely explained by aspects of its distinct ecology. These characteristics may be predictors of the presence of M balbus, and streams with these characteristics may be targeted to manage and conserve the species.
28October 2009 School of Environmental and Life Sciences University of Newcastle
5. Conclusions Notwithstanding the limited power of the analysis (lack of enough
replication across time), to date there is no evidence that the presence of trout in streams is suppressing population densities or having measurable effects on population age structure or individual fitness levels in either species.
Limited electro-fishing data of some of the sites suggests that some of the ‘trout’ sites have very low numbers, or no, trout. This data is considered preliminary and not necessarily representative of the true distribution of trout at this stage (for example, it disagrees with some personal observations; see section 4 above). However, if further work shows this to conclusively be the case, the interpretation of the frog population data might be altered.
Given the absence of evidence for a direct effect of trout on L. subglandulosa and M. balbus so far, more parsimonious explanations of the causes of their decline (such as the effects of chytridiomycosis) seem reasonable.
The occurrence of M. balbus along New England Tablelands streams
in the Styx River area is able to be predicted by association to stream and vegetation characteristics, but the of L. subglandulosa is less predictable.
There is still a need to continue the study over at least one more
season to gather the data necessary across time, as well as a need to conduct further work on the distribution and abundance of trout in the study streams.
29October 2009 School of Environmental and Life Sciences University of Newcastle
6. References Alford, R. A. & Richards, S. J. (1999). Global amphibian declines: a problem in
applied ecology. Annual Review of Ecology and Systematics. 30; 133-165. Anstis, M. (2002). Tadpoles of South-eastern Australia: A Guide With Keys. New Holland: Australia. Anstis, M. & Littlejohn, M. J. (1996). The breeding biology of Litoria subglandulosa and L. citropa (Anura: Hylidae), and a re-evaluation of their geographic distribution. Transactions of the Royal Society of South Australia 120(3): 83-99. Anstis, M., Alford, R. A. & Gillespie, G. R. (1998). Breeding biology of Litoria booroolongensis (Moore, 1961) and Litoria lesueuri (Dumeril and Bibron, 1841) (Anura: Hylidae) and comments on population declines of L. booroolongensis. Transactions of the Royal Society of South Australia 122(1): 33-43. Australian Museum. New England Frogs Database. Barker, J., Grigg, C. G. and Tyler, M. J. (1995). A Field Guide to Australian Frogs.
Surrey Beatty & Sons: Norton. Braña, F., Frechilla, L. and Orizaola, G. (1996). Effect of introduced fish on amphibian assemblages in mountain lakes of northern Spain.
Herpetological Journal, 6: 145-148. Campbell, A. (1999). Declines and Disappearances of Australian Frogs. Environment Australia: Canberra. Clulow, S, Price, L, Clulow J & Mahony, MJ (2006) Status of Populations of Threatened Stream Frog Species in the Upper Catchment of the Styx River
on the New England Tablelands Near Sites Where Trout Releases Occur. Report prepared for the Recreational Freshwater Fishing Trust, NSW Dept of Primary Industries.
Cogger, H. (2000) Reptiles and Amphibians of Australia - 6th edn. Reed New Holland. Daly, G. (1998). Review of the status and assessment of the habitat of the Stuttering frog, Mixophyes balbus, (Anura: Myobatrachidae) on the south coast of New South Wales. Herpetofauna. 28(1), 2-11. Daly, G. (1995). Observations on the Tusked Frog Adelotus brevis (Anura: Myobatrachidae). Herpetofauna 25(2): 32-35. Gillespie, G. R. (2001). The role of introduced trout in the decline of the spotted tree frog (Litoria spenceri) in south-eastern Australia. Biological Conservation. 100(2), pp. 187-198.
30October 2009 School of Environmental and Life Sciences University of Newcastle
Gillespie, G. R. & Hero, J. M. (1999). Potential impacts of introduced fish and fish translocations on Australian amphibians. In Declines and Disappearances of Australian Frogs, ed. A. Campbell. Environment Australia, Canberra, pp. 131-144. Gillespie, G. R. & Hines, H. B. (1999). Status of temperate riverine frogs in south- eastern Australia. In Declines and Disappearances of Australian Frogs, ed. A. Campbell. Environment Australia, Canberra, pp. 109-130. Hamer, A.J., Lane, S.J., Mahony, M.J. (2002). Management of freshwater wetlands
for the endangered green and golden bell frog (Litoria aurea): roles of habitat determinants and space. Biological Conservation 106(3): 413-424.
Luecke, C. (1990). Changes in abundance and distribution of benthic macroinvertebrates after introduction of cutthroat trout into a previously fishless lake. Transactions of the American Fisheries Society. 119(6), pp. 1010- 1021. Mahony, M.J. (1999). Review of the declines and disappearances within the bell frog species group (Litoria aurea species group) in Australia. In Declines and
Disappearances of Australian Frogs, ed. A. Campbell. Environment Australia, Canberra, pp. 81-93.
Mahony, M. (1997). Survey of the distribution and abundance of declining frog species in upper north east New South Wales. Prepared for the Threatened Frogs of Queensland and north east New South Wales Recovery Team. Mahony, M., Knowles, R., Foster, F. & Donnellan, S. (2001). Systematics of the Litoria citropa (Anura: Hylidae) complex in northern New South Wales and southern Queensland, Australia, with the description of a new species. Records of the Australian Museum 53(1): 37-48. Morgan, L. A. and Buttemer, W. A. (1996). Predation by the non-native fish
Gambusia holbrooki on small Litoria aurea and L. dentata tadpoles. In G. H. Pyke and W. S. Osborne (eds), The Green and Golden Bell Frog (Litoria aurea): Biology and Conservation. Royal Zoological Society of NSW, pp. 143-149.
Morrison, C., Hero, J. M. & Browning, J. (2004). Altitudinal variation at the age of maturity, longevity, and reproductive lifespan of anurans in subtropical Queensland. Herpetologica. 60(1), p.34-44. NSW Fisheries (2003). Freshwater Fish Stocking In NSW Environmental Impact Statement: Public Consultation Document. Volume 1. Published in November 2003 by NSW Fisheries, Cronulla, NSW. NSW Fisheries (2003). Freshwater Fish Stocking In NSW Environmental Impact Statement: Public Consultation Document. Volume 2. Published in November 2003 by NSW Fisheries, Cronulla, NSW. NSW Fisheries (2003). Freshwater Fish Stocking In NSW Environmental Impact Statement: Public Consultation Document. Volume 3. Published in November 2003 by NSW Fisheries, Cronulla, NSW.
31October 2009 School of Environmental and Life Sciences University of Newcastle
Pyke, G. H. and White, A. W. (1996). Habitat requirements of the green and golden bell frog Litoria aurea (Anura: Hylidae). In G. H. Pyke and W. S. Osborne (eds), The Green and Golden Bell Frog (Litoria aurea): Biology and Conservation. Royal Zoological Society of NSW, pp. 224-232. Reader’s Digest (2005). Encyclopedia of Australian Wildlife. Reader’s Digest: Australia. Robinson, M. (1998). A Field Guide to Frogs of Australia. Reed New Holland: Sydney. Stuart, S. N., Chanson, J. S., Cox, N. A., Young, B. E., Rodrigues, A. S. L., Fischman, D. L. and Walter, R. L. (2004). Status and trends of amphibian declines and extinctions worldwide. Science. 306(5702), pp. 1783-1786. Tyler, M. J. & Anstis, M. (1975). Taxonomy and biology of frogs of the Litoria citropa Complex (Anura: Hylidae). Records of the South Australia Museum 17: 41-50. Webb, C. and Joss, J. (1997). Does predation by the fish Gambusia holbrooki (Atheriniformes: Poeciliidaae) contribute to declining frog populations? Australian Zoologist, 30 (3): 316-324.