status of recent practical applications of pfm to the
TRANSCRIPT

Status of Recent Practical Applications of PFM to the Assessment of Structural Systems in
Nuclear Plants in the United States
Mark Kirk* Senior Materials Engineer United States Nuclear Regulatory Commission Office of Nuclear Regulatory Research Division of Engineering, Component Integrity Branch [email protected]
International Symposium on Improvement of Nuclear Safety Using Probabilistic Fracture Mechanics Organized by the PFM Subcommittee, Atomic Energy Research Committee
of the Japan Welding Engineering Society
24th October 2014 – Tokyo, Japan
* The views expressed herein are those of the author. They do not constitute an official position of the USNRC.

Slide 2
Outline
• Comparison of deterministic & probabilistic approaches to structural integrity assessment
• Example Application 1: pressurized thermal shock (PTS) of the reactor pressure vessel (RPV)
• Example Application 2: leak before break (LBB) of primary system piping
• Concluding remarks

Slide 3
• Easier … – than probabilistic analyses – to demonstrate their
conservatism than for a probabilistic analysis
• A simplified example – One variable (X1) controls
operating lifetime – A conservative upper
bound on X1 produces a safe (& reasonable) lower-bound estimate of operating life
Deterministic Analyses Why do we use them?
Ope
ratin
g Li
fetim
e
Single Controlling Variable, X1
Cons
erva
tive
uppe
r-bo
und
on X
1
Lower-bound estimate of operating life

Slide 4
Deterministic Analyses When do they break down?
Operating Lifetime
X1
X2
• A slightly less simplified example – Two variables (X1 & X2)
control operating lifetime – Conservative upper bounds
on X1 & X2 can produce a safe (but unreasonable) lower-bound estimate of operating life
• The unreasonableness becomes more extreme as the number of controlling variables increases (X1, X2, X3, … Xn)
Lower-bound estimate of operating life
Conservative upper-bound on X2

Slide 5
• To address deficiencies of the deterministic approach: – Conservatism quickly
multiplies • When every variable is
bounded • When inherently conservative
models are used – Does not scale well to multi-
variate problems • Quantifying the conservatism
of the answer becomes impossible
• Probabilistic approach – Conservatism & safety
ensured by controlling to the end result (failure probability)
Probabilistic Analyses Why might they be used?
An Incomplete List of Variables in a PTS Analysis

Slide 6
Deterministic vs. Probabilistic Reality
PFAILURE Distributions
Driving Force
Resistance Zero
DF R Small
DF R Large
Actual Situation (Reality)
The requirement imposed in a deterministic framework …
… is a comforting abstraction, but it obscures the fact that in the reality we seek to represent driving force and resistance are inherently distributed quantities.

Slide 7
Deterministic vs. Probabilistic Mathematical Models of Reality
PFAILURE Distributions Deterministic Models of Reality
Probabilistic
Driving Force
Resistance Zero
DF R DF R
DF R Small
DF R DF R
DF R Large
DF R DF R
Actual Situation (Reality)
Estimate: No “Failure” Estimate: PFAIL=0
Estimate: “Failure” Estimate: PFAIL= Very Small
Estimate: “Failure” Estimate: PFAIL= Large
Future events are correctly represented as probabilities, not absolutes.

Slide 8
Similarities • Both treat uncertainty
– Deterministic models bound uncertainty
– Probabilistic models quantify uncertainty
• Probabilistic models may contain deterministic aspects where full information is lacking, e.g.: – Conservative models – Bounding inputs – And so on …
Differences • How result is expressed
– Deterministic: “Failed” or “Not Failed”
– Probabilistic: A failure probability
• Who the decisionmaker is – Deterministic: Only the
engineering analyst (because “failure” is unacceptable)
– Probabilistic: Many people (because some failure probability can be accepted)
Deterministic vs. Probabilistic Similarities and Differences
Nothing changes by adopting a probabilistic analysis, other than acknowledging that which already exists.

Slide 9
PRESSURIZED THERMAL SHOCK First Example Application of PFM

Slide 10 TOPERATING = 290 oC
Secondary Break TMIN = 100 oC
Primary Break TMIN ~ 5 oC
Temperature
Frac
ture
Tou
ghne
ss
RTNDT@LIMIT
• 10 CFR 50.61 (PTS Rule) – Established 1985 – Conservatisms inherent to
basis for RTPTS can limit operable lifetime
• Considerations in development of 10 CFR 50.61a (Alternate Rule) – 10 CFR 50.61 conservatisms
will cause plant-specific submittals, all addressing the same issues
– Alternative approaches considered • Individual review of plant-
specific assessments • Comprehensive re-assessment
of PTS performed proactively & with thorough review by technical experts
Pressurized Thermal Shock
Initial RTNDT
Increasing Time in Operation
Slide 11
Key Aspects of 10 CFR 50.61a Development
• Policy Establishing a risk-informed limit consistent with Commission policy guidance
• Technical Translating this limit into screening tool expressed in terms of measurable variables (e.g., embrittlement, flaws)
• Communication and Education Obtaining input from and addressing the concerns of a diverse array of constituencies

Slide 12
10 CFR 50.61a Limits Follow from Policy Decisions
Mean ∆-Mean CDF 10-4/ry 10-5/ry LERF 10-5/ry 10-6/ry
Regulatory Guide 1.174
51 FR 28044, Safety Goal Policy Statement (1986)
SECY-00-0077, Modifications to Safety Goal Policy Statement CDF < 1x10⁻⁴/ry CDF & QHO limits for generic decisions
QHOs < 0.1% of the total public risk (prompt & latent)
10 CFR 50.61a Voluntary Alternative Pressurized Thermal Shock Rule
• Accident sequence progression study shows that through-wall cracking rarely leads to LERF
• Conservatively assumes equivalence of LERF and the yearly through-wall cracking frequency (TWCF) of the reactor pressure vessel
• Along with defense-in-depth considerations, a tolerable limit on TWCF established as 10-6/ry

Slide 13
Technical Approach
#1. Commission guidance drives performance metric, and limit value.

Slide 14
#2. Staff develops & links models to estimate this performance metric.
Technical Approach

Slide 15
#3. Metric estimated based on detailed analysis of 3 plants.
Beaver ValleyBeaver ValleyPalisadesPalisades
OconeeOconee
Technical Approach

Slide 16
#4. These results + other insights motivate generalization to all plants.
Technical Approach

Slide 17
Probabilistic Fracture Model
Flaw density, location,Length, & depth
FlawDistribution
Model
Pressure vs. time
Temperature vs. time
ThermalHydraulics
Model
EventSequence
EventFrequency
PRAModel
Fluence on Vessel IDNeutronics
Model
Material Property &Composition Data
CrackInitiation
Model
ConditionalProbability of
Crack Initiation
Through Wall Cracking
Model
ConditionalProbability of
Thru-Wall Cracking
MatrixMultiply
YearlyFrequency of
Thru-WallCracking
Fracture MechanicsModel
Next Slide

Slide 18
AppliedKI
Elastic Modulus
Vessel Diameter
Un-IrradiatedIndex
Temperature(RTNDT(u)*)
IrradiatedInitiation
ToughnessIndex
Temperature(RTTOUGH(I))
ResistanceKIc
ResistanceKIc
dKI/dt > 0AND
A-KI > R-KIc
InitiationToughnessTransition
Curve
CPI>0
StressIntensity
FactorModeldKI/dt
RTNDT(u)Method
RTNDT(u)(RVID)
YES
Generic?
YES
NOσ(u) = 0
σ(u) = S(µ,σ)+Conversion
to ToughnessTransition
TemperatureUn-Irradiated
Toughness IndexTemperature(RTTOUGH(U))
IrradiatedToughness Shift
(∆RTTOUGH)
1
+
CPI=0
NO
Vessel Thickness
Clad Thickness
CTEPLATE
Poisson’s Ratio
P&T vs. t
T vs. t
WeldFlaw?
NO
YES
RTTOUGH(I) =MAXIMUM OF RTTOUGH(I)
WELD, & RTTOUGH(I)
ADJACENT PLATE
Flaw Locationin Vessel Wall, x’
Flaw Depth, a
Flaw AspectRatio, 2c/a
Flaw Density, ρ
Weld σresidual
CTE Mismatchσresidual
CTEWELD
INDEX TEMPERATURE SHIFT MODEL
UNIRRADIATED INDEXTEMPERATURE MODEL
FRACTURE DRIVINGFORCE MODEL
SampledFluence At Flaw
CharpyIrradiation
ShiftModel
CharpyTemperatureShift (∆T30)
Oper.Temp.
Cu(RVID)
Thru-WallAttenuation
Model
Best-EstimateID Fluence
(Reg-Guide Calcs.)
Ni(RVID)
P(RVID)
Oper.Time
ProductForm
VesselMfg.
Conversionto Toughness
Shift
GlobalFluence
Uncertainty
SampledID Fluence
LocalFluence
Uncertainty
FluenceAt Flaw
CuUncertainty
SampledCu
NiUncertainty
SampledNi
PUncertainty
SampledP
Details of the Crack Initiation Model
Details of some models follow

Slide 19
KIc
Parameters of the Initiation Model
RTNDT 0
100
200
300
400
-150 -100 -50 0 50T-RT NDT [oC]
KJc
[M
Pa*m
0.5 ]
E1921 Valid E399 Valid
ASME KIC Curve
Parameters of Crack Initiation Model

Slide 20
0
100
200
300
400
-150 -100 -50 0 50T-RT NDT [oC]
KJc
[M
Pa*m
0.5 ]
E1921 Valid E399 Valid
ASME KIC Curve
Uncertainty Treatment in the Crack Initiation Model • Because of implicit conservative
bias, fracture toughness models based on the RTNDT index temperature contain a mix of
• Epistemic uncertainty in RTNDT, and
• Aleatory uncertainty in KIc
• Use of the best-estimate Master Curve index temperature (To) effectively removes epistemic uncertainty, leaving only the aleatory uncertainties produced by material variability
E1921 Valid
E399 Valid
1% LB
M edian
99% UB
T-To [oC]

Slide 21 PFM 21
Crack Initiation Toughness KJc
Crack Arrest Toughness
KIa
Upper Shelf Toughness
JIc

Slide 22 PFM 22
Crack Initiation Toughness KJc
Upper Shelf Toughness JIc
Upper Shelf Toughness: JIc Master Curve [EricksonKirk]
-200
0
200
400
600
800
1000
-150 -100 -50 0 50 100 150 200 250 300
Temperature [oC]
∆J I
c = J
Ic -
J Ic(
288)
[kJ
/m2 ]
RPV Weld (U)RPV Weld (I)RPV Plate (U)RPV Plate (I)RPV Forging (U)HSLA PlateMild Steel PlateZA Fit to Data, alpha=1.75mm2.5% Bound97.5% Bound
Crack Arrest Toughness KIa
Crack Arrest Toughness: KIa Master Curve [Wallin, Kirk]
-150 -100 -50 0 500
50
100
150
200
250
95 % 5 %
KIa [
MP
a√m
]
T-TKIa [°C]
σ = 18 %
Crack Initiation Toughness: KJc Master Curve [Wallin]
0
100
200
300
400
500
600
700
800
-300 -200 -100 0 100 200 300
T - T o [oF]
1T E
quiv
alen
t KJc
[ks
i*in0.
5 ]
PC-CVN 1/2T 1T 2T 3 & 4T 6T 8T 9T 10T 11T 95% LB 1T MC 5% UB

Slide 23 PFM 23
Crack Arrest Toughness
KIa
Upper Shelf Toughness
JIc
Crack Arrest Toughness: KIa Master Curve [Wallin, Kirk]
-150 -100 -50 0 500
50
100
150
200
250
95 % 5 %
KIa [
MP
a√m
]
T-TKIa [°C]
σ = 18 %
Upper Shelf Toughness: JIc Master Curve [EricksonKirk]
-200
0
200
400
600
800
1000
-150 -100 -50 0 50 100 150 200 250 300
Temperature [oC]
∆J I
c = J
Ic -
J Ic(
288)
[kJ
/m2 ]
RPV Weld (U)RPV Weld (I)RPV Plate (U)RPV Plate (I)RPV Forging (U)HSLA PlateMild Steel PlateZA Fit to Data, alpha=1.75mm2.5% Bound97.5% Bound
Crack Initiation Toughness: KJc Master Curve [Wallin]
0
100
200
300
400
500
600
700
800
-300 -200 -100 0 100 200 300
T - T o [oF]
1T E
quiv
alen
t KJc
[ks
i*in0.
5 ]
PC-CVN 1/2T 1T 2T 3 & 4T 6T 8T 9T 10T 11T 95% LB 1T MC 5% UB
Lognormal ModelTKIa - To = 44.1e(-0.006To)
σ ln(∆RTARREST) = 0.39
-200
-100
0
100
200
-200 -100 0 100 200T o [oC]
T KIa
[o C
]
Wallin ORNL Mean 5% 95% 1:1
TUS = 0.7985To + 48.843R2 = 0.9812
-150
-50
50
150
-200 -100 0 100 200T o [oC]
T US [o C
]
AllWeldPlateForgingHSLAMild SteelLinear (All)
MC
: KJc
0
100
200
300
400
500
600
700
800
-300 -200 -100 0 100 200 300
T - T o [oF]
1T E
quiv
alen
t KJc
[ks
i*in0.
5 ]
PC-CVN 1/2T 1T 2T 3 & 4T 6T 8T 9T 10T 11T 95% LB 1T MC 5% UB

Slide 24
Major Outcomes of PTS Re-Evaluation Analyses
• What operational transients most influence PTS
risk?
• What material features most influence PTS risk?
• Are these dominant material features / transients common across the fleet?
• New limits on embrittlement based on RI calculations

Slide 25
Important Transient Classes
1.E-14
1.E-13
1.E-12
1.E-11
1.E-10
1.E-09
1.E-08
1.E-07
1.E-06
1.E-05
1.E-04
550 650 750 850
Max RT [R]
August 2006FAVOR 06.1
Beaver
Oconee
Palisades
Fit4
3
2
0
9
8
7
6
5
4
550 650 750 850
Max RT [R]
August 2006FAVOR 06.1
Beaver
Oconee
Palisades
Fit4
3
2
1
0
9
8
7
6
5
4
550 650 750 850
Max RT [R]
August 2006FAVOR 06.1
Beaver
Oconee
Palisades
Fit
95th
Perc
entil
e TW
CF
Medium & Large ∅
Pipe Breaks
Main Steam
Line Breaks
Stuck-Open
Primary Valves
Slide 26
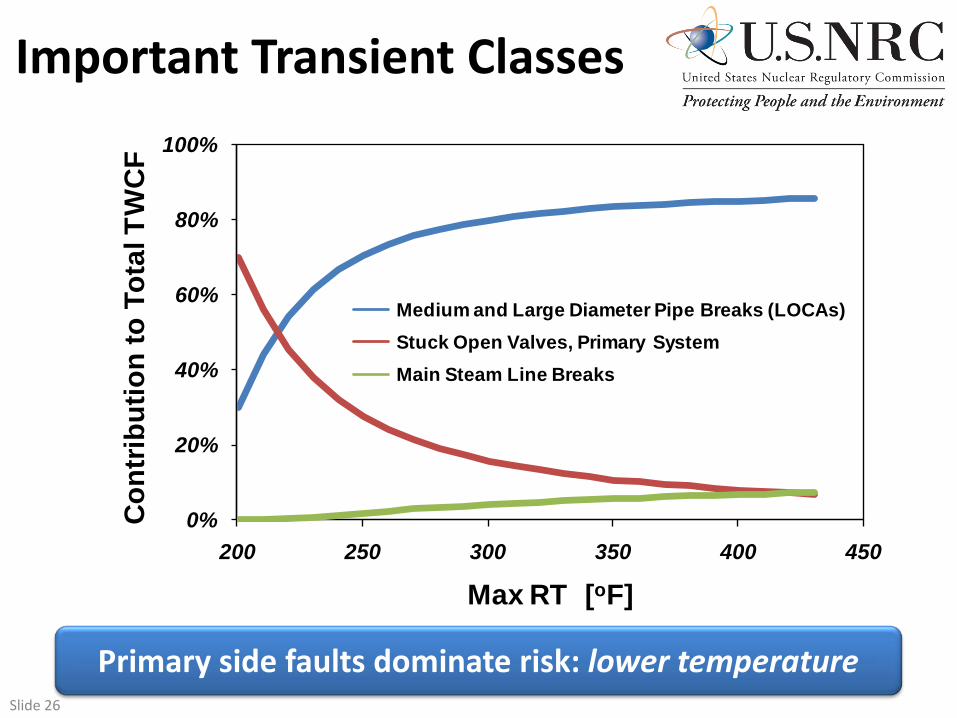
Important Transient Classes
0%
20%
40%
60%
80%
100%
200 250 300 350 400 450
Con
trib
utio
n to
Tot
al T
WC
F
Max RT [oF]
Medium and Large Diameter Pipe Breaks (LOCAs)Stuck Open Valves, Primary SystemMain Steam Line Breaks
Primary side faults dominate risk: lower temperature

Slide 27
Important Material Features 95
thPe
rcen
tile
TWC
F
1.E-14
1.E-13
1.E-12
1.E-11
1.E-10
1.E-09
1.E-08
1.E-07
1.E-06
1.E-05
1.E-04
1.E-03
550 650 750 850
Max. RTAW [R]
August 2006FAVOR 06.1
Beaver
Oconee
Palisades
Fit
2
0
8
7
6
5
550 650 750 850
Max. RTPL [R]
August 2006FAVOR 06.1
Beaver
Oconee
Palisades
Fit
2
0
8
7
6
5
550 650 750 850
Max RTCW [R]
August 2006FAVOR 06.1
Beaver
Oconee
Palisades
Fit
Axial Weld Flaws
Circumferential Weld Flaws
Plate Flaws

Slide 28
Important Material Features
0%
20%
40%
60%
80%
100%
200 250 300 350 400 450
Con
trib
utio
n to
Tot
al T
WC
F
Max RT [oF]
Axial Weld FlawsFlaws in Plates (remote from welds)Circumferential Weld Flaws
Axial weld flaws dominate risk: size & orientation

Slide 29
10 CFR 50.61 REQUIRED
10 CFR 50.61a VOLUNTARY
Reference Temperature Limits More restrictive Less restrictive
Plant-specific surveillance data check Required – 1 test Required – 3 tests
Plant specific inspection for flaws Not required Required
Less restrictive embrittlement limits are justified by new calculations, & enable longer operations, but
gating criteria must be satisfied to use 10 CFR 50.61a.
Outcome 50.61 vs. 50.61a Comparison

Slide 30
10 CFR 50.61a Limits for Plate Plants
1x10⁻⁶/ry TWCF limit
Simplified ImplementationRTMAX-AW ≤ 269°F, andRTMAX-PL ≤ 356°F, andRTMAX-AW + RTMAX-PL ≤ 538°F.
1x10⁻⁶/ry TWCF limit
Simplified ImplementationRTMAX-AW ≤ 222°F, andRTMAX-PL ≤ 293°F, andRTMAX-AW + RTMAX-PL ≤ 445°F.
tWALL < 9½-in.
tWALL = 10½- to 11½-in.
If plants can satisfy the gating criteria, most should be compliant with 10 CFR 50.61a.

Slide 31
• 50.61a opens the possibility for increased operational lifetime with no compromise to safety – New embrittlement limits
justified by more realistic analysis
• Making this change took considerable time & resources: – Complexity of the topic – “New” approach
(“probabilistic” instead of “deterministic”)
– Variety of stakeholders involved
• Unanticipated benefits – Comprehensive review of
all model components – Updated state of
knowledge influences regulations
10 CFR 50.61a Summary
1998
2000
2002
2010
2016
2014
2012
2008
2006
2004
Project Started
10 CFR 50.61a issued
1st consensus PFM code available
Technical reports approved by ACRS Rulemaking begins
DG-1299 released for public comment
Model Development
Building the technical
case
Deciding & Approving
Guidance
Com
mun
icat
ion
& co
nsen
sus b
uild
ing
Beaver Valley submits
Palisades submits

Slide 32
LEAK BEFORE BREAK Second Example Application of PFM

Slide 33
LBB Background Problem Being Addressed
• 10 CFR 50 Appendix A General Design Criteria 4: permits exclusion of local dynamic effects of pipe ruptures from design basis
• LBB-justified modifications to plant design (e.g. elimination of pipe whip restraints, jet impingement shields) have been approved … – Assuming that no active degradation mechanisms exist – But active degradation mechanisms (PWSCC) do exist
• Solutions – Short term: mitigations and inspections – Long term: probabilistic evaluation
LBB used in Oil and GasPraise first released
NUREG-1061SRP3.6.3 Rev 0
First LBB approval
First Alloy 600 cracking
LBB Reg Guide Draft
VC Summer crackPRO-LOCA first released
MPR-139
Wolf Creek
SRP3.6.3 Rev 1NUREG-1829RIS2008-25
xLPR initiatedxLPR pilot complete
xLPR V2 complete
LBB regulation-->
1975 1980 1985 1990 1995 2000 2005 2010 2015 2020

Slide 34
• Develop a probabilistic assessment tool that can be used to directly assess compliance with 10 CFR 50 App-A GDC-4
• Tool will be – Comprehensive with respect to
known challenges and loadings – Vetted with respect to scientific
adequacy of models and inputs – Flexible to permit analysis of a
variety of in service situations – Adaptable: able to accommodate
• evolving / improving knowledge • new damage mechanisms
xLPR Overview Goals & Timeline
2008
2010
2012
2018
2016
2014
Project Started
Pilot Study Complete
xLPR Version 2 Code Complete LBB Reg. Guide
2020
Criterion 4: Structures, systems, and components important to safety shall … shall be appropriately protected against dynamic effects. … However, dynamic effects associated with postulated pipe ruptures in nuclear power units may be excluded from the design basis when analyses … demonstrate that the probability of fluid system piping rupture is extremely low …

Slide 35
Technical Scope of xLPR Project xLPR = eXtremely Low Probability of Rupture
Prob
abili
ty D
ensi
ty (%
)
Failure Frequency / year
• Conduct analyses with baseline conditions (per SRP 3.6.3)
Change in risk acceptable?
• Conduct analyses with modified condition
Change in risk acceptable!
PWSCC
Weld Overlay
Baseline Results
Slide 35
Quantify effect of current mitigations & inspections to inform future decisions

Slide 36
xLPR Status & Team Members • Pilot study [Complete]
– To demonstrate feasibility – Determine appropriate
probabilistic framework – Develop plan for future
version
• V2.0 [Underway] – Develop tool for use in LBB
Reg. Guide development – Permit quantitative
assessment of compliance with GDC-4
– Prioritize future research efforts
• LBB Reg. Guide [Future] – Effort beginning in 2015 – Possible replacement or
augmentation to SRP 3.6.3
PEAI

Slide 37
xLPR Technical Flow
0
0.05
0.1
0.15
0.2
0.25
0.3
0.35
0.4
0.45
Crack Mechanism
Loads
Initiation
Crack Coalescence
t=ti
Material Properties
t=t+∆t
yes
Inspection/ Mitigation
Crack Growth
Stability Leakage
Rupture, tf
Slide 37

Slide 38
OBJECTIVES • Develop and assess xLPR
management structure • Determine appropriate
probabilistic framework • Assess the feasibility of
developing a modular PFM code
FEATURES • Focused on pressurizer surge
nozzle DM weld with PWSCC
• Used comprehensive configuration management
• Developed detailed program plan for future activities
RESULTS • Demonstrated it is feasible to
develop a modular-based probabilistic fracture mechanics code within a cooperative agreement while properly accounting for the problem uncertainties
• Identified potential efficiency gains in the program management structure
• Selected commercial software as the computational framework
xLPR Pilot Study

Slide 39
xLPR Pilot Study Example Results
0
10
20
30
40
50
60
70
80
4.6E-08 6.7E-07 1.3E-06 1.9E-06 2.6E-06 3.2E-06
Prob
abili
ty D
istr
ibut
ion
Func
tion
Mean Probability of Rupture
Pressurizer surge nozzle dissimilar metal weld – PWSCC only

Slide 40
xLPR Version 2.0 Goals
• Version 2.0 is expanded to handle welds within piping systems approved for LBB – Appropriate materials, loads, degradation
mechanisms, mitigation, inspection, leak detection
• Rigorous quality assurance including verification and validation (V&V) process
• Capabilities of Version 2.0 will meet requirements for LBB lines, but must stay within available cost and schedule limitations
• Model inclusion in xLPR Version 2.0 does not guarantee regulatory approval.

Slide 41
xLPR Version 2.0 High Level Flow Chart

Slide 42
xLPR Version 2.0 Framework
GUI/Input database
Landing platform
Physical models
This strategy allows for multi-entities to share and work on the framework development in an efficient and parallel manner.
GoldSim software
Slide 42

Slide 43
Closing Remarks
• PFM in General A logical process for realistic assessment of structural reliability.
• RPV Integrity Successfully applied to PTS. Work is in-progress in other areas (normal heatup & cooldown).
• Primary Piping Integrity Work underway to apply PFM insights to LBB regulations and requirements.