status of rural water supply and sanitation in andhra pradesh, india
TRANSCRIPT

Status of Rural Water Supply andSanitation in Andhra Pradesh, India
B. Rajeswara RaoH. Umakantha RaoV. Vidyanath Sastry
M.Rama Mohan RaoM. Venkataswamy
M. S. Rama Mohan Rao
WASHCost-CESS Working Paper No.2
WASHCost India ProjectCENTRE FOR ECONOMIC AND SOCIAL STUDIESN. O. Campus, Begumpet, Hyderabad - 500 016, A.P, India
Web: www.cess.ac.in, email: [email protected]


3
Introduction
Andhra Pradesh is geographically 4th largest state in India with an area of about 0.275million Sq.km and has a forest cover of 23% (of the geographical area). It lies betweenLatitudes 12º 37' N and 19º 54' N, and Longitudes 76º 46' E and 84º 46' E. It coverslarge part of the Deccan plateau and bounded on the North by the States of Maharashtra,Madhya Pradesh and Orissa, on the West by Karnataka and Maharashtra and on theSouth by TamilNadu and Karnataka. A.P has a long coastline of 972 km on the easternside. It has a population of 76.2 million (2001 census), of which about 59.02 millionconstitute (73%) rural population and the rest live in urban areas. The three broadsocio-economic and administrative regions of the State are: Coastal Andhra, Telangana,and Rayalaseema. It is divided into 23 districts (one urban), comprising of 1104 mandals,21856 Gram Panchayats, 30002 villages covering 72,147 habitations and 210 towns(Table 1).
Status of Rural Water Supply andSanitation in Andhra Pradesh, India
B. Rajeswara Rao1, H. Umakantha Rao2 V. Vidyanath Sastry3,M.Rama Mohan Rao4, M. Venkataswamy5, M.S. Rama Mohan Rao6
1 Engineer-in-Chief (Rural Water Supplyand Sanitation Department, GoAP)2 Chief - Engineer, Department of Rural Water Supply and Sanitation3 Project Director (Andhra Pradesh Rural Water Supply and Sanitation Programme & CCDU)4 Project Director (State Water Sanitaion Mission)5 WASH Specialist, WASHCost (India) Project6 WRM Specialist, WASHCost (India) Project
Physiographic Features:Andhra Pradesh is endowed with a variety of physiographic features ranging from hills,undulating terrain to coastal deltaic plains (Fig. 1). The State has three major riverbasins - Godavari, Krishna and Pennar. Geomorphologically, the state can be catego-rized in to Pedi-plains, Coastal alluvial plains and Hilly ranges.

4
Source: Water Conservation Mission, GoAP, 2003
Fig. 1. Physiographic features of Andhra Pradesh
Table. 1 Administrative divisions of the State
Sl.No Item No
1 Districts 232 Revenue divisions 793 Mandals 11044 Gram Panchayats 21,6345 Inhabited Villages 30,0026 No.of Habitations 72,1477 Towns 2108 Population 76.21 million9 Rural Population 59.02 million10 Urban population 17.19 million
source: Census: 2001, Directorate of Economics and Statistics, GoAP. & RWSS
5
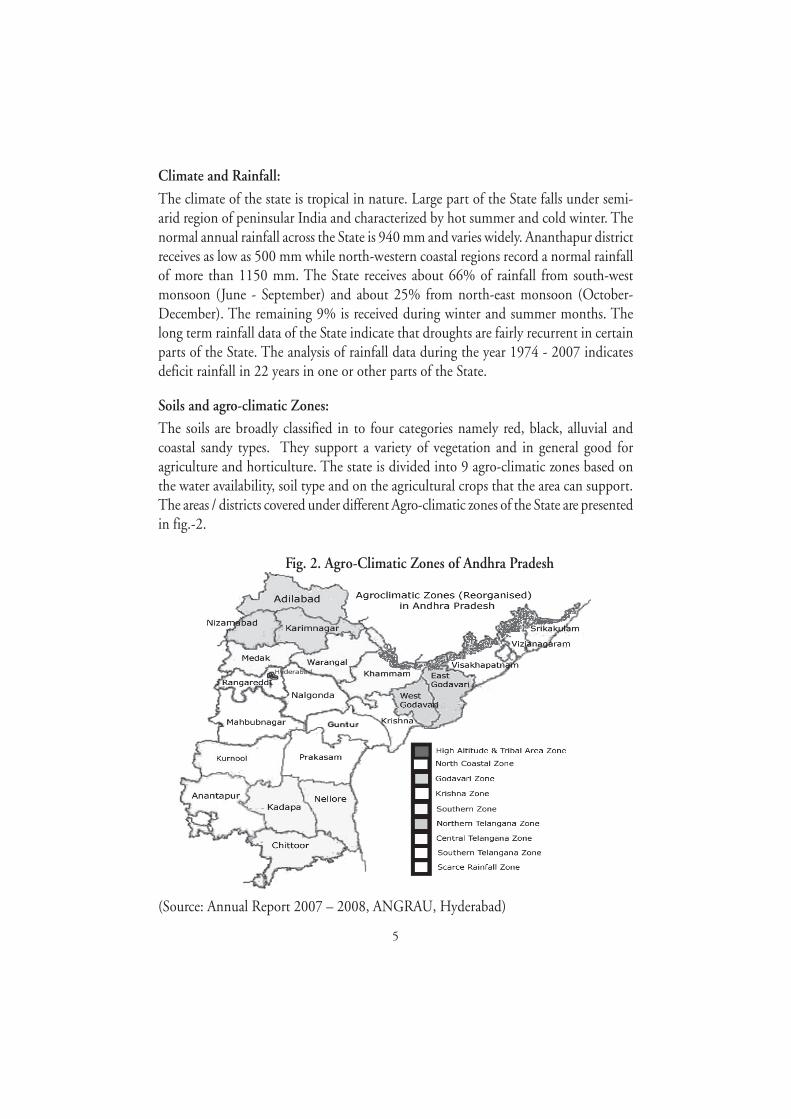
Fig. 2. Agro-Climatic Zones of Andhra Pradesh
(Source: Annual Report 2007 – 2008, ANGRAU, Hyderabad)
Climate and Rainfall:
The climate of the state is tropical in nature. Large part of the State falls under semi-arid region of peninsular India and characterized by hot summer and cold winter. Thenormal annual rainfall across the State is 940 mm and varies widely. Ananthapur districtreceives as low as 500 mm while north-western coastal regions record a normal rainfallof more than 1150 mm. The State receives about 66% of rainfall from south-westmonsoon (June - September) and about 25% from north-east monsoon (October-December). The remaining 9% is received during winter and summer months. Thelong term rainfall data of the State indicate that droughts are fairly recurrent in certainparts of the State. The analysis of rainfall data during the year 1974 - 2007 indicatesdeficit rainfall in 22 years in one or other parts of the State.
Soils and agro-climatic Zones:
The soils are broadly classified in to four categories namely red, black, alluvial andcoastal sandy types. They support a variety of vegetation and in general good foragriculture and horticulture. The state is divided into 9 agro-climatic zones based onthe water availability, soil type and on the agricultural crops that the area can support.The areas / districts covered under different Agro-climatic zones of the State are presentedin fig.-2.

6
Geological characteristics:
From groundwater point of view, the geological rock types of the state can broadly bedivided into hard rock's - Archaeans, Pre-Cambrian, Cuddapahs, Kurnools and Deccantraps and Soft and unconsolidated rocks - Gondwanas, Rajahmundry formations andRecent Alluvium. The hard rock's cover nearly 0.233 M.Sq.Km constituting about85% of geographical area of the state while the soft rocks cover about 41,160 Sq.Kmconstituting 15% . The occurrence of various geological formations is presented infig.3.
Fig.3. Geological Map of Andhra Pradesh
(Source: Groundwater Department, GoAP, 2008)
Surface Water Resources:
The state has three major rivers - Godavari, Krishna and Pennar -and 37 small rivers.Krishna and Godavari account for almost 90% of the state's surface water resources.
The total surface water resources estimated at 77.75 BCM, of which, 49.63 BCM isutilised. The river waters are extensively utilised for irrigation, industry, aquaculture

7
and drinking purposes. The water resources of Krishna and Pennar have been completelyutilised. Surface water is the main source of supply in around 90% of Multi-VillageSchemes (MVS) while Single Village Schemes (SVS) are mostly based on groundwater.
Consequent to the growth in population, industrialization, urbanization andintensification of agriculture, waste water generation has increased and discharged intosurface water bodies and rivers. As a result the surface water is being contaminated andthe problem is further compounded with sewerage and other solid wastes from urbanand rural draining into the riverine system.
Groundwater:
The annual groundwater availability in the state is estimated at 34700 MCM (2008)and utilization is 14112MCM, leaving a balance of 20588 MCM. The averagegroundwater development for the state as a whole is 41% of which 59% is in noncommand and 21% is in command area. The average well yields range from 75 to 150lpm in hard rock areas. However, the present mean yields for dug wells and bore wellsare around 0.50 hectare meters and 2.47 hectare meters per annum respectively (Source:Groundwater Estimation Committee Report, 2008. Ground Water Department, GoAP.Gondwana rocks form an extensive aquifer and sustain well yields beyond their annualreplenishment. The yield from tube wells constructed in these rocks ranges from 100lpm to 1000 lpm for drawdown ranging from 12 to 38 m. The open wells tapping theseformations yield from 10 to 20 cum/day. The Kamthi Sandstones beyond a depth of250 m are intercalated with Shales and Clays. Tube wells constructed within 200 m,yield between 100 lpm to 1000 lpm for drawdown ranging from 9 to 30 m. Rajamundrysandstones also form good aquifers and tube wells constructed up to a depth of 300 min these rocks, yield from 200 to 1500 lpm for a drawdown of 6 to 15 m. However, Itis reported that the present yields are reduced by 20% to 30% of the above.
The groundwater levels vary significantly from district to district. In many parts of thestate, in summer by May and June every year, most of the irrigation wells and drinkingwater wells go dry, due to significant depletion of groundwater levels. Groundwaterlevels measured during Post monsoon (January) and Pre monsoon (May) show depletionof groundwater. In case of Rayalseema the reduction in groundwater level was maximum(Fig. 4). Depletion of groundwater in these regions seriously affects sustainability ofdrinking water sources. As per the RWSS seasonal bore well status report, 9081(cumulative number) bore wells have dried up (April 2009) due to depletion ofgroundwater level. Hence, relying on Groundwater in the long run can be a challengefor the state, unless appropriate steps are taken to sustain the resource.

8
Fig. 4: Depletion of Groundwater level: pre-monsoon to post monsoon
Source: Groundwater Department, GoAP.
Quality of Groundwater:Groundwater quality is also a problem in many parts of the state. Groundwater in someparts is affected with excessive concentration of fluorides, Salinity, Iron, Arsenic, TotalDissolved Solids (TDS) and nitrates. In the past, some numbers of water supply schemeshave failed due to unsuitability for drinking, consequent to excess fluorides and salinityas a result of depletion of groundwater.
There are 1097 habitations affected by quality such as fluoride, salinity, iron and arsenicparameters as on 1.04.2009, as per the updated status of RWS&S Department. Someof the habitations are affected by multiple parameters (more than one parameter).
Abstract of Quality affected Districts, Mandals and Habitations
Districts Mandals Habitations
◆ Water Quality affected bymultiple parameters 21 259 1097
◆ Fluoride Affected 21 231 979◆ Salinity affected 19 168 713◆ Iron affected 19 127 580◆ Arsenic 16 91 481
The RWSS and State Ground Water Department have prepared district-wise waterquality and water table maps. Separate maps representing the water quality and scarcityareas are also prepared. State Ground Water Department monitors the groundwater

9
table and also groundwater quality using observation wells. The RWSS is alsocontemplating to set up facilities to develop an MIS - for maintaining a database onwater quality and scarcity.
Importance of safe drinking water for achieving Millennium Development Goals
Human Development Index is influenced by Life Expectancy at Birth, Infant MortalityRate (IMR), Adult Literacy Rate, Primary, Secondary and Tertiary Enrolment Rate andGDP per capita. The human development index in A.P as against India for differentitems is given in Table-2. It could be seen from the table that the Human DevelopmentIndex is 0.54 for Andhra Pradesh as against 0.61 for India. In order to improve theHDI, the Government of Andhra Pradesh has initiated programmes to eradicate poverty,establish gender equality, provide primary education, improve hygiene and environmentalsanitation, including drinking water for reducing Child Mortality and to build awarenessregarding HIV/AIDS.
Table.2. Human development indices in India and A.P
Development Indices India Andhra Pradesh
Life Expectancy at Birth 63.7 62
Adult Education at 15 years and above 61 58Combined Education 63.8 61Males 68 71Females 60 51Estimated earningsMales 5194 -Estimated earningsFemales 1520 -Human Development Index 0.61 0.54Education Index 0.62 0.66GDP per Capita 34520 34289I M R 64 66
(Source: Report of the Department of RWSS, GoAP 2008)
The importance of safe drinking water across the Globe on Child Mortality Rate isdepicted in Fig. 5.

10
In India, it is reported that about 73 million working days are lost on account of illhealth costing approximately Rs. 24000Millions annually due to consumption of poorquality drinking water. The cost of health care for the water related diseases is estimatedat about Rs. 67000 millions. The total economic loss on account of supply of poorquality water is Rs. 91000 million per annum in rural areas. Further it is estimated that66 million population are facing the risk of fluorosis. (Source: Ministry of water resourcesGoI, 2006)
Rural Water Supply and Sanitation in Andhra Pradesh:
Rural Water Supply and Sanitation Department is the nodal agency responsible forplanning, designing and implementation of Water Supply and Sanitation facilities inrural areas of Andhra Pradesh. The Rural Water Supply programmes are implementedthrough single village schemes (SVS), multi village schemes (MVS) and hand pumpswith groundwater and surface water as source.
Evolution of Department of Rural Water Supply and Sanitation:
Drinking Water Supply is a state subject and funds have been provided by the state forthe drinking water supply right from the commencement of first five year plan.
● The PR Engineering Department was created towards the end of 1960 withone S.E for the entire department and subsequently a separate and independent
0 50 100 150 200
USA
Swede n
N ew …
Iran
China
India
Indonesia
Pakistan
Nigeria
Sudan
Cam bodia
CM R
C
0 50 100 150
USA
Sweden
N ew …
Iran
China
India
Indonesia
Pakistan
Nigeria
Sudan
Cam bodia
% Supply Safe Drinking water
% safe water
(Source: Presentation of E-n-C in the WASHCost inception workshop at CESS, June
2008)
Fig.5. Child Mortality Rate as influenced by the level of safe drinking water supply

11
post of Head of the Department to look after rural water supply and sanitationwas created with effect from 1.4.1965.
● The GoAP has created separate division vide Go No.24 dated 11.10.96 forRural Water Supply with in the PR in order to have better focus.
● The PRED was looking after all works relating to rural development includingrural water supply.
● Though separate divisions were formed, the desired levels of service levelswere not achieved. Hence the GoAP has trifurcated PR and RD departmentinto Panchayati Raj, Rural Development and Rural Water Supply Departmentsvide Go.Ms No. 508, dated 18.07.2007.
● A separate post of Chief Engineer (RWS) was created in 1979. During 2007RWSS department was separated from PR department, creating a departmentexclusively to implement the RWSS development activities and technicalassistance in operation and maintenance.
The GoI has been provided funds from time to time by initiating new schemes asdetailed below.
● A National Water Supply and Sanitation programme was introduced in thesocial welfare sector during the year 1954.
● Financial assistance to the states to carryout special investigations in the fourthfive year plan to identify problem villages in the States is provided till 1973.
● Accelerated Rural Water Supply Programme was introduced (ARWSP) in theyear 1977-78 and followed. Subsequently, the entire programme was given aMission approach under the name National Drinking Water Mission (NDWM).Later NDWM was renamed as Rajiv Gandhi National Drinking Water Missionin 1986 along with ARWSP programme.
● In April 2009, the ARWSP has been modified as NRDWP i.e., National RuralDrinking Water Pogramme, for implementation of new guidelines duringeleventh plan 2009-12.
Evolution of Sanitation Programme:
Sanitation programme was introduced in the health sector by GoI in the year 1954.The International Water Supply and Sanitation Decade programme was launched during1981 with an objective to cover 25 % of rural population. Rural sanitation was transferredfrom Ministry of Urban Development to the Department of Rural Development in

12
1985. Department of Rural Development was made as nodal agency for coordinatingsanitary latrine programme in 1986. In the same year, a programme was launched toconstruct one million sanitary latrines for SC/ST population and to provide 2,50,000additional latrines to health sub-centres, schools, and anganwadis under NREGP. Duringthe year 1987, Rural Sanitation Programme was included in the State sector underMNP. Central Rural sanitation Programme (CRSP) was launched in 1986 to providelatrines to SC/ST families, BPL families with 100 % subsidy and general public withsubsidy per the existing rules. Under this programme, it was planned to construct pourflush water seal latrines at an estimated cost of about Rs.1200 per latrine. During theyear 1990-91, the norms under CRSP were modified with changed cost of individuallatrine at Rs.2500 and subsequently, the CRSP guidelines were revised in 1993. Laterin the year 1995, the programme envisaged an integrated approach to rural sanitation –construction of sanitary complexes for women, establishment of rural sanitary marts,total sanitation of villages and organisation of IEC/health education campaigns.
GoI had subsequently restructured the CRSP as Total Sanitation Campaign (TSC)programme in 1999 with the underlying principle of demand driven and people orientedapproach to raise the awareness among village communities and households to improvepersonal and household hygienic practices to sanitation facilities and to promoteconservation and recycling of household waste water. The scheme provided matchingcontributions from the State and GoI for individual latrines. Provision was also madefor beneficiary contribution to the extent of 20% with the balance 80% being equallymet by the state and the centre.
Status of Rural Water Supply and Sanitation in Andhra Pradesh:Coverage and access of water supply:
About 78 percent of rural population have access to piped water schemes to meetdrinking and domestic water needs. Others use water from hand pumps, (fitted withtube wells or open wells) while a small section use village tanks and springs. There is ahigh dependence on groundwater for drinking and other domestic purposes. In mostof the villages, water is distributed through Public Stand Posts (PSPs). At present, about60 % of water supply schemes are based on Groundwater as source, 38% are coveredwith surface sources and 2% are with other sources like rainwater storages, etc., Further,as on 1.04.2009, about 1,097 habitations are not having any safe source, out of which979 are fluoride affected habitations and 118 are salinity affected habitations. Apartfrom providing treated surface water to fluoride/salinity affected habitations, RWSS isalso implementing latest technologies for de-fluoridation/de-salination of ground water/excess TDS surface water by using treatment plants such as Reverse Osmosis, techenequeetc., for supplying safe drinking water to the rural people.

13
Water Supply- Coverage of Habitations:
Out of the 72,147 habitations in the state, 51,222 are Fully Covered (FC); 16,257 arePartially Covered (PC); 3,571 habitations are Not Covered (NC) and 1097 habitationshave No Safe Source (NSS) of water supply for drinking purpose as on 1.04.2009. Thecurrent status of habitation coverage is presented in fig.6.
Fig. 6 Habitation coverage through rural water supply (2008)
(Source: Department of RWSS 2008, GoAP)
Water Supply- Scheme coverage:In Andhra Pradesh, almost 80% of the habitations are served through Single VillageScheme (SVS) and Mini Piped Water Supply Schemes. SVS is the most preferred optionfor the RWSS department provided the source is sustainable in terms of implementationand management. Multi Village Schemes (MVS) are predominantly dependent on surfacewater source. In terms of habitations coverage, out of total 72,147 habitations, 80%(57,718 habitations) are covered through SVS and 7,936 habitations (11%) throughMVS. Scheme-wise coverage of habitations is presented in fig.7.

14
(Source: Department of RWSS 2008, GoAP)
Infrastructure (Assets) created:
In all Rs. 658.30 millions were spent since 1969 up to 2007 for creation of drinkingwater assets in the state. The infrastructure created by the department as on 1.04.2008is as follows.
Hand pumps 3,26,506
SVS schemes 47,836
MVS schemes 476
MVS schemes (in execution) 233
Of the above schemes, surface water schemes constitute about 23% while GroundwaterSchemes form about 72%. The approximate amount spent in creating rural water supplyand sanitation infrastructure including rehabilitation and extension during the last fiveyears (2004 to 2009) is over Rs 30,000 millions. The year wise expenditure is given intable.3
Fig. 7: Scheme – wise coverage
Others

15
Table.3 Year wise expenditure (Rs. In Millions)
Sl. No Year No. of Works/ Est. Cost Expenditure Habs CoveredProject
1 2004-05 4244 7832.00 5566.20 41292 2005-06 2382 6026.50 5036.30 32943 2006-07 12310 1756.10 5441.00 51984 2007-08 13931 20834.20 7998.50 70705 2008-09 9076 12552.70 9512.00 17983
Total 35714 63761.50 33554.00 37674
(Source: Department of RWSS 2008, GoAP)
The habitations (72,147) in terms of water supply coverage are categorized in to fourcategories namely Fully Covered (40 lpcd), Partially Covered (10 – 39 lpcd), Not Covered(less than 10 lpcd), and No Safe Source habitation means water quality affected. Thecoverage of habitations is given in table.4 below.
Table.4 Coverage of Population as on 1.04.2008
Category Habitations Population % populationin million
Quality affected (NSS) 1097 1.05 1.9
Not Covered (NC) getting <10 lpcd 3571 4.3 7.7
Partially covered (10-40lpcd) 16257 194.8 33.1
Fully covered ( 40 lpcd ) 51,222 31.9 57.3
(Source: Department of RWSS 2008, GoAP)
However, the categorization is mostly based on designed engineering parameters anddoes not consider equity, supply tree and duration, distance from the source, seasonalvariation in water quantity, quality, floating population, etc. Percentage of populationdependent on various types of drinking water sources namely major reservoirs andcanals, infiltration wells, groundwater in various categories and unorganized and unsafeis presented in graphical form in fig.8
Ongoing Programmes (2009 - 2010):
About 13375 works costing Rs.30197.50 millions are on hand to cover about 9513habitations. About 3943 habitations are covered till January 2010 incurring an expen-diture of Rs. 3058.10 millions. The balance works are in progress. The programme wisedetails are as follows:

16
(Cost;Rs.in millions)SL.No Program Works Est.cost Habitations
1 ARWSP-Normal 10203 4468.30 4070
2 ARWSP-Projects 83 3797.60 1191
3 SMP 35 2315.50 436
4 DDP 4 367.00 170
5 HUDCO 14 6497.80 1714
6 NABARD 55 3078.90 1048
7 TFC 40 2685.90 581
8 Others 26 3826.70 303
9 Sustainability 3035 92.50
Total 13375 30197.50 9513
Fig.8 Types of Sources
(Source: Department of RWSS, GoAP)
Physical and Financial achievements under Bharat Nirman (2005 -2008):
An amount of Rs.33554.00 millions were spent for providing drinking water to 37674habitations during the last five years ie 2004-05 to 2008-09, of which 1707 are qualityaffected habitations under Bharat Nirman programme. The financial and physicalachievements are furnished in tables 5 and 6.

17
Table.5 Financial Achievement (Rs in Million)
Sl. Year Number of Estimated Cost ExpenditureNo works/Projects (Rs.in millions)
1 2004-05 4244 7832.00
2 2005-06 2382 6026.50 1304.8
3 2006-07 12310 17516.10 2271.0
4 2007-08 7702 20834.20 3523
5 2008-09 9076 12552.70 9512.00
Total 35714 64761.50 33554.00
(Source: Department of RWSS, GoAP)
Table.6 Physical (Habitations)Achievement
Sl. Year No of Projects/ HabsNo. Works Covered
1 2004-05 4244 4129
2 2005-06 2382 3294
3 2006-07 12310 5198
4 2007-08 7702 7070
5 2008-09 9076 17983
Total 35714 64761.50
(Source: Department of RWSS, GoAP)
Out of 15,523 quality affected habitations identified during the year 1991, 13492Quality affected habitations were brought to Fully Covered status under AcceleratedRural Water Supply programme.
The Government of India has launched Swajaldhara programme during December2002 for taking water supply schemes under reforms initiatives with a communitycontribution of 10% of the estimated cost of the schemes. About 4107 schemes weretaken up costing Rs.2022 millions (GoI share Rs.1811.5 millions and community con-tribution Rs.210.5 million). Out of which 3597 schemes were completed incurring anexpenditure of Rs.1662.2 millions up to April 2008.

18
Action Plan for Coverage of all Habitations:
The Action plan for the year 2009-2010 is prepared to cover 8500 Habitations asdetailed below.
Sl.No Year Quality affected Not Covered Partially Covered Totalhabitations habitations Habitations Habitations
1 2009-10 197 2670 5633 8500
Sanctions and Coverage of Habitations Up to Date:
Sl.No Item Total Habitations
1 Balance Habitations to be covered (as on 1.04.09) 20925
2 Habitations covered by sanctions 9513
3 Habitations sanctioned during 2009-10 Nil
4 Target for 2009-10 8500
5 Habitations yet to be sanctioned 11412
SPECIAL works with Latest Technologies:
Ooranies (Traditional Village Ponds)
35 Nos Oorany works are sanctioned at an estimated cost of Rs.21.00 millions in 35fluoride affected habitations . It is a latest technology implemented successfully inTamilnadu. The works are in progress.
Reverse Osmosis Technology
About 150 Reverse Osmosis Plants are proposed to be installed in fluoride problemhabitations at an estimated cost of Rs.155.00 millions .
Roof Top Rain Water Harvesting Structures
All Schools in over-exploited and critical villages are being proposed with Roof TopRain Water Harvesting Structures. About 3000 structures are sanctioned with a cost ofRs.90.00 millions and works are in progress.
Coverage of Scheduled Caste and Scheduled Tribe Areas:
The allocation for the year 2008-09 under SC and AP is Rs.1205.90 millions andexpenditure incurred is Rs.1272.88 millions. The allocation for the year 2008-09 underTSP is Rs.491.29 millions and the expenditure is Rs.504.80 millions.

19
Critical gap Works:
Certain works sanctioned under various grants could not be completed for want ofadditional sanction of funds due to escalation of price in steel & cement, amountrequired for electricity connections and additional amount due to extension of schemesto new locations. The Government has permitted to spend Rs. 40 millions per eachdistrict under TFC for completion of such works
Drinking Water to Rural Schools:
Potable Drinking Water is provided to 20863 schools against the target of 32838 schoolsincurring an expenditure of Rs.717.8 millions up to March 2008. Sanitation facilitiesare provided in 65916 schools.
Construction and O&M cost of water Supply Schemes:
● The per capita cost of Single Village Scheme (SVS) is about Rs. 945 as per theprovisions and norms of RWSS Department while the O&M cost worked outto Rs.30 per household per month and the responsibility vested with the GramPanchayats
● The per capita cost of Multi Village Scheme (MVS) with common facilities forentry to villages is about Rs. 2451. The constructing agency is liable for O&Mof the scheme for the first two years with their own expenditure. After thedefects liability period, the scheme is transferred to the Zilla Parishad (ZPs) forfurther maintenance. The ZPs outsource the responsibility of O&M to thecontractors on yearly basis following the tendering process.
● The GoAP is releasing Rs.600 per hand pump to Gram Panchayat for mainte-nance of hand pumps.
The average Economic and Capital costs of various types of water supply schemes arepresented in table.7
Table.7 Average economic cost of various types of water supply schemes
Sl.No Types of Schemes Per capita cost (Rs) Per capita Maintenance cost (Rs)
1 MVS 2500 – 2800 58 – 62
2 SVS 900 – 1200 32 – 34
3 Hand Pumps 200 5 – 6
(Source: Department of RWSS, GoAP)

20
The Major Issues Concerning to O & M are:
● Inadequate Operation and Maintenance (O & M) due to shortage of Funds.
● About 20 % of the schemes, including schemes transferred to Gram Panchayats(GPs) are not fully operational and require rehabilitation and augmentation.
● Communities lack sense of ownership of drinking water assets created by theRWSS.
● Lack of awareness among the rural people regarding the quality of water andits health Hazards.
Rural Sanitation:
The present level of sanitation coverage in the state is around 50 %, while the ruralhousehold coverage is about 30 % (and only half of the rural households with latrinesare using them regularly). This implies that still more than 80% of rural populationresort to open defecation with its associated risks relating to public health and alsopollution of water supply sources. This problem is more acute in densely populatedsettlements.In addition to the in-sanitary disposal of human waste, the sanitation situation in ruralareas becomes more acute as:
● Wastewater generated by households including cattle sheds flows into opensurface drains that often get choked, leading to stagnation of wastewater in thelanes and by-lanes.
● Facilities for safe disposal of enormous amounts of animal, agriculture andHousehold solid waste are absent.
● Construction of dry pits to discharge sullage is done without any considerationto sanitary aspects
● Discharge of septic tank effluents into open drains creates in-sanitary conditions
Coverage of environmental sanitation:Wastewater generated by households including cattle sheds flows into open surfacedrains. Currently, only 6.3% of rural household are connected to the closed drainagesystem. The connectivity for waste water disposal for rural households has been pre-sented in the graph below.

21
(Source: Department of RWSS, GoAP)
In view of the above, the RWSS department has established as per the guidelines ofGoI, a State Water and Sanitation Mission to look after water supply and sanitationprogrammes under reforms mode in the State.
Fig.9 Coverage of drainage
Water Quality Monitoring and Surveillance:
Water quality is as important as its quantity. Water quality problems are emerging dueto over exploitation of groundwater, especially high concentrations of fluorides, salinity,nitrate, Iron, etc and vary to a great extent both in space and time. Therefore, it ishighly essential to monitor regularly the water quality of drinking water sources. TheRural Water Supply wing of PRED has established 51 water quality-testing laboratoriesspread over all the districts of Andhra Pradesh for testing drinking water samples. 14 ofthese laboratories are established with Government of India (GOI) funding, while theremaining 37 labs are established with State’s funds.
The Department of Drinking Water Supply, Ministry of Rural Development, GOIlaunched the National Rural Drinking Water Quality Monitoring and Surveillanceprogram (NRDWQM & SP) during the year 2005-06 to build capacities of GramPanchayats and to involve in water quality testing and monitoring. The State Waterand Sanitation Mission has been identified as a nodal agency for implementation ofNRDWQM & SP in the state under the supervision of State Referral Institute. The

22
key elements of a surveillance programme include monitoring, sanitary survey, dataprocessing, evaluation, remedial and preventive actions and institutional analysis
Water Quality Monitoring:
The 51 water quality-testing laboratories established across the state are equipped totest physical and chemical parameters – Turbidity, Colour, Taste and Odour, ElectricalConductivity, Total Alkalinity, Total Hardness, Calcium, Chloride, Fluoride, Nitrate,Sulphate, Nitrite, Iron and Bacteriological Parameter - M.P.N. Coliform Bacteria per100 ml., E. Coli per 100 ml. The H2S strip test is used to know the bacteriologicalquality.
Analysis of drinking water sources:
All drinking water sources are tested for bacteriological contamination using H2S vialsonce during Pre monsoon and once during Post monsoon. If any positive results areobserved by using H2S vials during the bacteriological quality test, the water samplesare sent to state level laboratory for further analysis.
Bacteriological and Physico – chemical analysis of MPWS/PWS/CPWS schemes areanalyzed once in a quarter. Chemical analysis of all Hand pump sources is done once ina year.
State Level Laboratory:
State Level Laboratory has been established in the O/o the Project Director, State Waterand Sanitation Mission, Hyderabad to supervise and monitor and guide the work of allthe laboratories.
● Under the NRDWQM & SP, 10 % of the total samples, tested at the district/Division level laboratories in all the districts, are being tested at the State levellaboratory for cross verification and analysis of some toxic trace elements Viz.,Arsenic, Strontium, Chromium, Lead, Mercury and pesticides and insecticidesin the water samples.
● In association with the Doctors from Nizam’s Institute of Medical Sciences,Hyderabad, Scientists from National Institution of Nutrition, (ICMR),Hyderabad and Geological Survey of India, Hyderabad, State Level Laboratoryhas been conducting study of the high prevalence of kidney diseases and it’spossible association with the chemical quality of the drinking water, in somerural areas of Prakasham, Nellore, Srikakulam and Ananthapur districts, wheregroundwater has been used for drinking purpose.

23
Data Processing and Online Monitoring System:
● The water quality data (both chemical and bacteriological), from all the GramPanchayats in the district, are being sent to the district level surveillancecoordinators in the District Head Quarters.
● The details of the Training programs at all levels under the HRD activities,distribution of water testing field kits (both chemical and bacteriological) toPRIs’ and IEC activities are being put in the online monitoring system ofDWSM.
● The source wise details of all the drinking water sources in the state are beingfinalized as base line data and it is expected to be completed by 30/09/2008.Based on this base line data of all the drinking water sources, water quality andsanitary survey data of all the drinking water sources from the field level andwater quality data from the district level water testing laboratories will beobtained, processed and hosted in the online monitoring system of theDepartment of Drinking Water Supply, by the district level coordinator.
Current M & E System:● Network connectivity is established up to Divisional level for communication
of data.
● Video Conference facility is available to conduct meetings with all DistrictHead Quarters simultaneously.
● Regular Monthly Reporting System is established in obtaining information.
● Habitations status, functioning of PWSS, CPWSS and Hand pumps.
Database and MIS:● Development of different modules of WATERSOFT with NIC is under
Progress “Water Soft” Web Application - “WaterSoft” (http://jwst.ap.nic.in/pred). GOI have approved NIC Project proposal (Rs.69.90 millions) for Designand Development of Web Application for Complete automation of RWS Sectorwork flow process from GOI to sub-division level for planning and executionof works under various grants and maintaining up to date Habitation DirectoryStatus
● Monitoring with respect to progress of works and fund management● Automatic generation of reports at all levels.

24
Status of Water Soft Web application:Modules completed and deployed
▲ Habitation Status
▲ Works/Projects Monitoring
Modules under testing and to be deployed
▲ Asset Management
▲ Water Quality Management
▲ Employee Database
Proposed Automation: Automation for MVS Monitoring
● On line observation and monitoring of source levels
● Observation of levels at Summer Storage Tank
● Observation of levels at Booster Stations
● Discharge at outlet chamber of filters
● Discharge at the taps through meters to know about leakages
The monthly progress reports both physical and financial achievements are collectedand updated online at the Sub-division, Division and District level. The informationflow for the reporting requirements of the project is summarized in fig. 10
Fig.10 Flow of Information
(Source: Department of RWSS 2008, GoAP)

25
New Initiatives in RWSS sector:
Rural Water Supply is an important development programme of the Government andcovers whole state of Andhra Pradesh. Over a period of time, the need for giving abetter focus to rural water supply is felt by the Government as still sizable number ofvillages need to be provided with quality drinking water. Realising this, Governmenthave issued G.O No. 428, PR and RD Dept dated 11.10.1996 creating separate divisionof Rural Water Supply from PR Division.
Though separate RWS division was created in 1996, the division of PR and RDEngineering Service did not take place to provide required focus and attention to drinkingWater Supply and Sanitation. Hence, Government have decided to trifurcate PR andRD Department into Panchayat Raj, Rural Development and Rural Water SupplyDepartments. Accordingly Panchayat Raj and Rural Development Engineering Servicegets bifurcated into Panchayat raj Engineering Service and Rural Water SupplyEngineering Service as per the G.O Ms. No. 508 dated 18th July 2007.
New Vision and Strategy of the RWSS Department:
The Government of Andhra Pradesh (GoAP) envisioned a decentralized and demand-driven approach for the RWSS sector and related policy notes were issued in October2006. The Key elements of the Vision are:
(i) To significantly improve the service levels and coverage
(ii) Devolution of powers to Panchayat Raj Institutions (PRIs)
(iii) To recover full O & M cost and sharing of capital cost (taking into considerationaffordability, particularly of disadvantaged groups); and
(iv) To improve the "accountability framework" by clarifying roles andresponsibilities of various actors of the RWSS sector at the state, district andvillage levels.
The two significant changes introduced are:
i) Transfer of RWSS infrastructure to PRIs and communities and withcomplete O & M responsibility.
ii) Shifting the role of RWSS Department from provider to a facilitator (extendingtechnical assistance to PRIs).
Institutional and implementation arrangements
The institutional arrangement centers around PRIs taking on the key roles of servicedelivery (GPWSC at the village level and MVWSC for common facilities in MVS,

26
both being sub-committees of PRIs). However in the case of large and complex MVS,RWSS Department has direct responsibility to create the assets. There also the communitywill play a significant role in the asset creation process. Over a period of time, RWSSDepartment will assist PRIs to substantially improve their capacity to, manage theirresponsibility.
State level and district level Water and Sanitation Missions (WSMs) will be the keygovernance institutions. PRIs with RWSS Department assistance will be the key entitiesfor operations.
RWSS Department would function on a regional structure basis, enhancingaccountability and clarifying roles and responsibilities of the staff at all levels. Enhancedpowers of technical sanction and tender committees would increase the efficiencies ofoperations. The proposed institutional setup under the above is given in Fig. 11
The arrangements proposed in the above figure have been evolved after substantialinternal stakeholder's discussions, who considered different institutional options. Theinstitutional arrangement centres around PRIs taking on the key roles of service delivery(VPWSC at the village level and MWSC for common facilities in multi-village schemes).RWSS department's role is expected to be transformed substantially from a creator ofassets and provider of services to a facilitator in both asset creation and service provision.Only in the case of large and complex MVS, the RWSS will have direct responsibility tocreate the assets in partnership with the community. Over a period of time, RWSSDepartment will assist PRIs substantially to improve their capacity to manage theirresponsibility.
Institutional Setup:
The roles and responsibilities of key officials involved in the rural water supply at variouslevels are given below.
State level: At the Government level, Secretary, RWSS department is the head of theinstitution. Apart from policy making function, he has the overall responsibility for theperformance of the sector. The Engineer-in-Chief (E-in-C), RWSS department and theChief Engineers (CE) are the key personnel at the state level responsible for overallprogram management and implementation.
District level: The Superintending Engineers (SEs) and Executive Engineers (EEs) - inhierarchical order - are responsible for implementation of the sector programs at thedistrict level. The officials at the district level play an important role in monitoring andevaluation, besides executing the projects.

27
(Source: Department of RWSS, GoAP)
Fig.: 11 Institutional arrangement

28
Mandal and GP level: The Deputy Executive Engineers (DEEs) are in charge of allRWSS activities in about 2-3 Mandals in each district. The DEEs report to the EEs andSEs at the sub-divisional and district levels. The DEEs are assisted in their activities byAssistant Executive Engineers (AEEs) / Assistant Engineers (AEs) who are in charge ofRWSS works in a few selected GPs allocated to them.
For Swajaldhara and Total Sanitation Campaign (TSC), the Institutional arrangementis as per Government of India guidelines with a state level water and sanitation mission(SWSM) for overall governance and policy supported by district level DWSMs andDWSCs. Under these reform oriented programs, the operations are carried out by thePRIs with technical assistance from RWSS Department.
I. The Medium Term Sector Program (MTSP):
The current system of financing through a number of different RWSS programs hasresulted in parallel implementation with varying and conflicting procedures and results.This has lead to different programs undermining each other and adversely affectingdemand-driven and cost sharing approaches under Swajaldhara and TSC schemes. Basedon the lessons learnt from new approaches, the GoAP is keen to adopt a uniformdelivery structure across the state. In the past few years, the Government of AndhraPradesh (GoAP) has taken a number of steps to significantly improve the rural waterand sanitation situation, including the important policy decisions for greater devolutionof powers to the Panchayat Raj Institutions (PRIs). GoAP also plans to enhanceinvestments to achieve increased coverage and access to both water supply and sanitationservices in rural areas. In this context, GoAP has envisioned a Medium Term SectorProgram (MTSP) for the RWSS sector involving further reforms and also investments.GoAP proposes to adopt a sector wide approach wherein all funding for the sector willsupport a single sector policy and rules of engagement in creation and maintenance ofRWSS assets and operations and management of RWSS services in the state for theprogram period (2009 - 2014). The expected outputs from the programme are presentedin table 8
Funding arrangements:
The total estimated cost towards all the components under MTSP project works out toRs 43360 millions. An amount of Rs.32750 millions, will be mobilised by dovetailingfunds from the existing programmes of GoAP and GoI such as, ARWS, TSC, TFC, etc.leaving a funding gap of Rs.10610 millions proposed for World Bank Assistance.
The year wise requirements and availability of funds for the three major componentsare detailed in table.9 and 10.

29
Table:8 The year wise anticipated acievements
Sl.No Financial Year Outputs
1 2009 to 2011 ● Completion of identified ongoing projects by 31st march 2011.
2 2009 to 2011 ● 7,519 (NC/NSS/PC) habitations will be provided with waterfacilities through SVS (70%) and MVS (30%).
● All NSS, NC and PC1 habitations will be fully covered (4,617 )
● 12% of remaining PC habitations will be upgraded to FC category.
● 14,000 schools will be provided with drinking water facilities.
● Rehabilitation / rejuvenation /repair of 4,629 SVS and 2,514MVS.
● Taking up of 4,410 groundwater recharge structures to augmentGroundwater sources.
● Protective use of 50 catchment areas.
● Installation of 1,000 bulk meters.
3 2009 to 2011 ● Construction of Individual Sanitary Latrines (ISL) in 701,602BPL households
● Providing sanitation facilities in all schools (49,570) andAnganwadis (11,939).
● 55 selected major GPs will be provided with pavements,drains, solid and liquid waste management (SLWM)
● Construction of soak pits in households in 12,137 habitations.
● Laying of underground drainage in 55 mandal head quarters.
(Source: Department of RWSS, GoAP)

30
Table.9 Total fund required (Rs. millions)
2009-10 2010-11 2011-12 2012-13 2013-14 Total
Sectordevelopment 180 180 190 180 180 910
Investments forInfrastructure(Ongoingprogram projects +New projects+Augmentation andrehabilitation andsanitation andhygiene. 8710 8710 7760 7830 8410 41420
ProjectManagement 220 220 200 190 200 1030
TOTAL 9110 9110 8150 8200 8790 43360
( Source: Department of RWSS, GoAP)
Table.10 Total availability of funds and Gap (Rs. millions)
Available Funds 2009-10 2010-11 2011-12 2012-13 2013-14 Total
ARWS 3000 3000 3000 3000 3000 15000
AUWSP, RIDF,and HUDCO 3000 3000 3000 3000 3000 15000
TSC (GOI) 150 150 300
TFC 880 880 1760
Community
contribution 80 80 150 200 180 690
Total availability 7110 7110 6150 6200 6180 3,2750
Total Requirement 9110 9110 8150 8200 8790 4,3360
Gap 2000 2000 2000 2000 2610 1,0610
(Source: Department of RWSS, GoAP)

31
Initiatives for Sustainability:
The various measures initiated by RWSS Department for sustainability of water supplyschemes are stated in table.11
Table.11 Measures initiated for sustainability of Water Supply Schemes
Initiatives Challenges
1. Introduction of demand responsiveapproaches. ● To prepare the community towards
ownership
● To involve and build awareness amongthe communities on various processes anddecision making at different stages ofproject cycle
● To create an enabling environment amongthe communities.
2. Changing roles of RWSS fromprovider to facilitator. ● Gradual withdrawal from using standard
estimations and to develop projects basedon sites specific conditions consideringfuture settlements.
● In-depth analysis of local conditions andlisting of alternative options with details.
● Forecasting risks on account of climatechange / load shedding / technical failuresand developing mitigation strategies.
● Gradual withdrawal from execution andtaking advisory role in protection andO & M activities.
3. Developing a strong social audit team(Transparency and Accountability) ● Display the disaggregated costs of the
project.● Develop appropriate O and M plan.● Mobilization of financial resources.● Allocation of funds on priority basis.● Preparation of people's estimation.● Display balance sheet.● Establishing complaint redressal
mechanism

32
4. 100% for O & M cost ● To build capacities of the communities tocome out of dependency syndrome
● To educate communities on health andother related impacts of proper watersupply and hygiene through IEC activities
● To generate funds for O&M● To build community capacities on water
quality aspects and quality control.
5. Devolution of O & M to PRI. ● Building technical skills of PRI's for effectiveO&M and Preparation of Plans.
● Creation of appropriate corpusfund for O&M.
6. Promotion of Rain water harvesting ● Identifying location specific rain waterstructures such has percolation tanks, harvesting structures in relation to geomorsubsurface dykes, check dams, roof phology.top water harvesting, oranies in ● Regular maintenance of the structures forquality affected villages, etc, their effectiveness.
● Roof water harvesting leading to commonpool resources.
● Developing network of village drainage andits maintenance.
7. Introduction of Water Land and ● Training of Gram Panchayats and VWSCTree Act (WALTA) for safeguarding on WALTA and awareness for effectivedrinking water sources. implementation.
8. IEC activities on large scale. ● Development of appropriate trainingmanuals on different aspects and promotinghands on training to school children at highschool level.
9. Encouraging the Grampanchayats ● Provision of quality testing kits to GP andfor taking up drinking water quality provide training on how to use.monitoring in rural areas. ● Training on drinking water quality standards
and water quality monitoring and surveillanceprogramme
10. MIS and Online monitoring ● Development of MIS at division level andvillage level for problem identification andsuggesting remedial measures.
(Source: Department of RWSS, GoAP)

33
IV Major issues of RWSS Sector:
The water supply coverage of habitations and sanitation is dynamic and changes withtime. In spite of best efforts by the Government, quality affected habitations andpartially covered habitations are re-emerging due to man’s intervention with the natureand improper management of WASH service delivery systems. As a result, about 24654habitations slipped into either to PC or NSS or NC from FC category during the spanof last 10 years. The reasons for such slippage are due to unsustainability of source,falling quality of groundwater, increases in population and maintenance failures.
a. Source sustainability:● Well density increased from <5 wells/Sq Km to >20 wells/Sq Km in last 2
decades.
● The dug wells yield reduced from 60 -150 cu.m/day to 20-40 cu.m/day andthat of bore wells from 2.5 lps –10 lps to 0.8 lps-2.5 lps.
b. Slippage:
● Most of the rural water supply schemes are formulated and built usinggroundwater (nearly 75 % as on 2003) as source. Nearly half of the groundwaterbased schemes are falling in “over-exploited, critical and semi-critical” areasidentified by the CGWB and SGWD.
c. Water quality:
● Competing demands of groundwater for various purposes resulting in reducedwell yields and deterioration of water quality especially fluoride and salinityproblems. Nearly 3 percent of the habitations rely on water sources with excessfluoride and/or salinity.
● Deterioration of water quality in industrial areas and ingression of saline watersinto fresh waters along the coastal belt.
● Pollution of drinking water sources
d. Operation and Maintenance (O&M):
● Inadequate operation and maintenance (O&M) mainly due to shortage offunds. The other general problems include such as shortage of staff and lack ofdedicated staff, and insufficient capacities of communities.
AP Rural Water Supply and Sanitation project with World Bank Assistance:
The total project outlay is Rs. 10610 million with a project priod of 5 years, Commencingfrom 2008-09. The three major components of the project are;

34
● Infrastructre Development 250 millions
● Sector development 9750 millions
● Program management 610 millions
Total 10610 millions
Infrastructure Development:
● Building or rehabilitating water supply systems.
● Source strengthening measures.
● Health and hygiene awareness promotion.
● Incentive for construction and use of household latrines.
● Solid and liquid waste management.
Sector Development:
● Training and Capacity Building programs
● IEC activities
● Sector Information Systems
● Water quality and water source Monitoring system
● Sector studies.
Program management:
● Support to Project Support Unit for implementing the project.
● Support to DPSUs at district level.
● Operational and Administrative costs.
● Development and Operation of financial management system and
● M&E and Impact analysis system.
Unit Costs:
The unit costs adapted for working out cost estimate for various components underAPRWSS are given in table.14

35
Table.14 unit cost
Description Unit Amount
SVS (PC to FC) Rs. lakh per habitation 8.80
SVS (NC to FC) Rs. lakh per habitation 9.90
SVS (NSS to FC) Rs. lakh per habitation 14.30
MVS common facilities Rs. lakh per habitation 22.00
MVS IVF Rs. lakh per habitation 6.60
Innovative technology Rs. lakh per habitation 20.00
Schools Rs. lakh per Schools 0.35
Augmentation SVS Rs. lakh per habitation 5.00
Augmentation MVS Rs. lakh per habitation 5.00
MVS (Bulk Meters) Rs. lakh per bulk meter 0.15
Improving Groundwater source Rs. lakh per source 0.50
Catchment area protection for surface source Rs. lakh per catchment area 10.00
Roof top rain water harvesting structures Rs. lakh per structure 0.15
Incentives / Awards to improve OandM Rs. lakh per GP 0.35
Disinfection facilities Rs. lakh per facility 0.50
Individual Sanitary latrines (ISL) Rs. lakh per ISL 0.03
School Sanitation Rs. lakh per school 0.20
Balwadis Sanitation Rs. lakh per Balwadi 0.10
Pavements, drains and SLWM Rs. lakh per GP 30.00
UGD and SLWM Rs. lakh per mandal headquarters 250.00
(Source: Department of RWSS 2008, GoAP)
State Water and Sanitation Mission (SWSM):Sanitation is vital for human health. The health of the communities depends on the goodsanitary conditions that exist in the village and its environment. Hence sanitation encompassessafe disposal of solid and liquid waste and maintaining clean environment,which promotehealth and hygiene of the community. Sanitation is one of the basic determinants of quality oflife and human development index.
Sanitation coverage:
The all India water supply and sanitation coverage in India is about 88% and 33%respectively. About 36% of population have latrines within/attached to house. Only21.9 % of rural population is covered with sanitation. In Andhra Pradesh, 57% ofIHHLs of BPL are provided with sanitation while 44% of ABPL are covered. 66%
36
covered with ISLs, of which only 48% of ISLs are under usage and balance 18% arebeing used for other purposes. About 36 % of habitations have drainage facilities.However the drains are constructed in an haphazard way without following levels resultingin water stagnation in many habitations causing ill effects. 45 of habitations are coveredwith solid waste management facilities in unscientific way. 32% of people are dumpingin front of houses and 44% are dumping at road side.
Although the concept of sanitation has undergone qualitative changes over the years,there has been slow progress in the sanitary conditions compared to rural water supply,as such State Water and Sanitation Missions were established as per GoI guidelines tohave Mission approach with an objective to cover problem villages, improve performanceand cost effectiveness of ongoing programme, promote conservation measures forsustained water supply of water duly involving PanchayatRaj Institutions where as earlierthe department is focusing on coverage with least importance to sustainability.
State Water and Sanitation Mission (SWSM) is an apex body, functions under Chairmancum Mission Director and supported by Project Management / Monitoring Unit (PMU).The PMU is a compact unit consisting of multidisciplinary professionals hired ondeputation or consultancy basis. The SWSM which will be initially responsible formanaging the sector reforms, Swajaldhara and TSC projects in the pilot districts andWater Quality and Surveillance and later expanded its scope of work to the whole state.
Objectives of SWSM:
The primary objectives are:● To promote institutionalization of community participation in Rural Water
Supply and Rural Sanitation
● To assist the Sector Reforms and TSC districts of Andhra Pradesh in improvingthe quality of Rural Water Supply and Environmental sanitation service delivery
● To promote the long-term sustainability of the rural water supply and sanitationsector by providing assistance to sector reform and TSC districts.
● To build the capacity of the Gram Panchayats, to own the water quality testingfield kits and to take up the full operation and maintenance responsibility ofthe water quality monitoring of all the drinking water sources in their respectiverural areas.
The secondary objectives are:
● To build capacity of primary stakeholders, to plan, implement, monitor andmaintain their own schemes

37
● To implement the appropriate policy and institutional reforms in phased manner
● To promote learning lessons in Pilot project districts throughout the State ofAndhra Pradesh and delivery of demand responsive and sustainable service toproject communities in Pilot districts.
The major functional responsibilities of SWSM are:● To oversee and monitor the implementation of sector reforms, TSC and
swjaldhara Projects and Water quality monitoring,
● To assist the Govt. of A.P in improving the quality of water Supply andenvironmental sanitation service delivery in rural areas,
● To provide over all policy guidance in sector reforms and TSC and assisting theGovt.of A.P. in identifying and implementing appropriate sector strategies,
● To Liaise and interact with the Govt. of India
● To Liaise and co-ordinate with various departments of the state Governmentand other sector partners,
● To formulate general rules and guidelines from time to time;
● To develop monitoring indicators including monitoring and evaluation plan,
● To co-ordinate among pilot projects and overall state level management of pilotprojects, to ensure audit by competent authority,
● To build a management Information System (MIS) for sector and to analyze anddisseminate sector information,
● To forge effective collaboration with the State / National level ResearchInstitutions/agencies and encourage innovation / R & D studies,
● To harness resources internally and externally to support the financing needs ofthe sector.
Total Sanitation Campaign (TSC):
Total Sanitation Campaign programme is being implemented in all 22 districts withsupport from Govt. of India and State Govt as a comprehensive programme to ensuresanitation facilities in rural areas with broader goal to eradicate the practice of opendefecation. It is opined that the programme is focused on construction of ISLs, howeverits usage is low due to lack of space and converted into storage rooms, bath rooms, etc.,behavioral change, non availability of a adequate water, poor maintenance, etc.
The main objectives of TSC programme are;
● Bring about an improvement in the general quality of life in the rural areas.
● Accelerate sanitation coverage in rural areas to achieve the goals within a time frame

38
● Generate felt demand for sanitation facilities through awareness creation and healtheducation.
● Cover schools / Anganwadis in rural areas with sanitation facilities and promotehygiene education and sanitary habits among students.
● Provide separate toilets for boys and girls
● Eliminate open defecation to minimize risk of contamination of drinking watersources and food
● Convert dry latrines to pour flush latrines, and eliminate manual scavenging practice,wherever in existence in rural areas.
Physical achievements
The cumulative achievement under Total Sanitation campaign are as follows.
Sl.No Item Acievement
1 ISLs (APL) 208697
2 ISLs (BPL) 405893
3 School Toilets 98711
4 Balwadi Toilets 5427
5 Sanitary Complexes 908
Efforts made for reaching the unreached:
To give benefit to the poorest of the poor, BPL (Below Poverty line) and APL (AbovePoverty Line) families are identified based on the income and expenditure indicators.As per the Participatory Identification of Poor PIP report, 77, 53,714 are BPL familiesand 64, 26,989 are APL families
The total project outlay is Rs 12580.4 millions in which the GOI share is Rs. 7834.2millions with matching State share of Rs 2826.1 millions and beneficiary share Rs1920.1 millions. In addition to this matching state share, the State Government isextending back ended support as total subsidy at the rate of Rs 1550/- per ISL forconstruction of superstructure promoting bathroom also. The addl. State share amountis Rs 12073.8 millions. As on July-2008 Rs 2871.5 millions of central share, Rs 2940.2millions of state share and Rs 1324.6 millions of beneficiary share was received. Theexpenditure incurred up to July-2008 is Rs 2353.6 millions, Rs 2227.1 millions and Rs963.8 millions under central, State and beneficiary respectively.

39
About 3821216 BPL individual Households Latrines (IHHL) constituting 62% and1635741 of ABPL- IHHL constituting 58% are provided with ISLs respectively. About72959 schools and 3796 Balwadis are provided with sanitation facilities under TSCprogramme. The cumulative achievements under TSC program are summarized intable.15
Table.15: The achievements under TSC program
Sl.No Description TSC Provided with % achieved targets sanitation
1 Below Poverty Line (BPL) IndividualHouseholds (IHHL) 6,521,091 4,057893 62%
2 Above Poverty Line ABPL) IndividualHouseholds (IHHL) 3,629,688 2086917 58%
3 Latrines for Schools 114861 98711 86%
4 Latrines for Balwadis 15,040 5427 36%
5 Sanitary complex 575 908 157%
6 RSM/PCs 220 441 199%
(Source: Department of RWSS, GoAP)
TSC components:
The envisaged components and activities under TSC implementation are;
(a) Start-Up ActivitiesThe start-up activities include conducting of preliminary survey to assess the status ofsanitation and hygiene practices, people’s attitude and demand for improved sanitation,etc
(b) Information, Education and Communication
Information, Education and Communication (IEC) are important components of theProgramme. These intend to create demand for sanitary facilities in the rural areas forHouseholds, Schools, Anganwadis, Balwadies and Community Sanitary Complexes
( c ) Rural Sanitary Marts and Production CentersThe Rural Sanitary Mart is an outlet dealing with the materials, hardware and designsrequired for the construction of not only sanitary latrines but also other sanitary facilities,such as soakage and compost pits, vermi-composting, washing platforms, certifieddomestic water filters and other sanitation and hygiene accessories required forindividuals, families and the environment in the rural areas. RSM should necessarilyhave those items, which are required as a part of the sanitation package.

40
(d) Construction of Individual Household Latrines
The programme is aimed to cover all the rural families. The construction of householdtoilets should be undertaken by the BPL household itself and on completion and use ofthe toilet by the BPL household, the cash incentive can be given to the BPL householdin recognition of its achievement.
It is assumed that APL families, through motivation, will take up construction of thehousehold latrines on their own. The IEC activities, will, however, cover all the familiesin the district, without exceptions. The funding pattern is presented in Table 16.
Table 16: Incentive Pattern for IHHL
Basic Low Cost Unit Cost Contribution Percentage
GOI State Household
BPL APL BPL APL BPL APL
Model 1: Up to Rs. 1500(including superstructure) 60 Nil 20 Nil 20 100
Model 2: Between Rs. 1500/-and Rs. 2000/- 30 Nil 30 Nil 40 100
Above Rs.2000/- Nil Nil Nil Nil 100 100
(Source: Department of RWSS, GoAP)
(e). Community Sanitary Complex: Community Sanitary Complex is an important component of the TSC. TheseComplexes, comprising an appropriate number of toilet seats, bathing cubicles, washingplatforms, wash basins, etc, can be set up in a place in the village acceptable to women/men/ landless families and accessible to them. The maintenance of such complexes isvery essential for which Gram Panchayat should own the ultimate responsibility ormake alternative arrangements at the village level. User families may be asked to contributea reasonable monthly user charge for cleaning and maintenance
(f ). Institutional Toilets:
School sanitation is an integral part of TSC project. Toilets in all types of GovernmentSchools and Anganwadi centres will be provided.
(g). Solid and Liquid Waste Management:
One of the objectives of TSC is bringing about an improvement in the general quality

41
of life in rural areas. This objective cannot be met if the general cleanliness of villages isnot maintained properly. Panchayati Raj Institutions (PRIs) are required to put in placemechanisms for garbage collection and disposal and for preventing water logging. Thecomponent wise funding pattern is presented in table.17
Table.17: TSC Component-Wise earmarking and funding pattern
S.No. Component Amount earmarked Contribution percentas percent of theTSC project outlay
GOI State BeneficiaryHousehold/Community
a. IEC and Start Up Activity,Including MotivationalAwareness and EducativeCampaigns, Advocacy etc. Upto 15% 80 20 0
b. Alternate Delivery Up to 5% (Subject toMechanism (PCs/RSMs) a maximum of Rs. 35
Lakh per districtfor PC/RSMs andadditional Rs.50 Lakhsas revolving fund forgroup lending activity) 80 20 0
c. (i) Individual Latrines for BPL/ disabled households
(ii) Community Sanitary Actual amount required Complexes for full coverage 60 20 20
d. Individual householdlatrines for APL Nil 0 0 100
e. Institutional Toilets including Actual amount requiredSchool and Anganwadi for full coverage 70 30 0Sanitation (Hardware andSupport Services)
f. Administrative charges,including training, staff,support services, Monitoringand Evaluation etc. Less than 5% 80 20 0
g. Solid/Liquid WasteManagement (Capital Cost) Up to 10% 60 20 20
(Source: Department of RWSS, GoAP)

42
Nirmal Gram Puraskar Awards:
To add vigor to the TSC, in June 2003, GoI initiated an incentive scheme for fullysanitized and open defecation free Gram Panchayats, Blocks, and Districts called the ‘Nirmal Gram Puraskar’. The incentive pattern is based on population criteria and givenbelow. The incentive provision is for PRIs as well as individuals and organizations thatare the driving force for full sanitation coverage is presented in table.18
Table.18:Incentive pattern under Nirmal Gram Puraskar (Rs. In Millions)
Particulars Gram Panchayat Block District
Population Less 1000 2000 5000 10000 Up to 50001 Up to AboveCriteria than to to to and and 1.0 1.0
1000 1999 4999 9999 above 50000 above million million
PRI 0.05 0.01 0.02 0.04 0.05 1.00 2.00 3.00 5.00
Individuals 0.01 0.02 0.03
Organizat-ionsother thanPRIs 0.20 0.35 0.50
(Source: Department of RWSS, GoAP)
● Andhra Pradesh state has received 10 Nirmal Gram Puraskars from the Govt.ofIndia for the year 2005 – 06 and 143 NGPs for the year 2006 – 07, for achieving100% sanitation in their respective Gram Panchyats.
● For the year 2007 - 08 , 1447 Gram Panchyats and one Mandal have filedapplications.
Shubhram – State Awards:
● Shubhram is an annual competition hosted by the Government of AndhraPradesh to select the Cleanest Gram Panchayat, cleanest Mandal Parishads andZilla Parishads in the state.
● The Shubhram awards will provide financial awards to Panchayat bodies atdifferent levels (mandal, district, and state) for achieving safe and hygienicdisposal of excreta, and solid and liquid waste. The awards will also recognizethe participation of the community in the entire process.

43
Eligibility for the award and categories of awards:
● Any GP, which is free from open defecation, would be eligible to participate inthe competition.
● Districts with the highest number of such Mandals can participate and Mandalswith highest number of ODF villages can participate. The following are theawards:
Table.19: Number of Awards
Particulars Number of awards Prize amount
(in Millions)
Cleanest GP at mandal level 1150 0.03
Three best GPs in each district 66 0.125/0.1 /0.075
Three best GPs in the state 3 0.25/0.2/0.15
One best mandal in a district 22 0.25
Three best mandal in the state 3 0.5/0.4/0.3
Three best districts/ ZP in the state 3 1/0.8/0.6
Reward for 5 individuals (officials and nonofficials) from each district 110 0.005
(Source: Department of RWSS, GoAP)
● The Government has placed utmost importance to sanitation, and thus is willingto allocate more than Rs. 60 Millions for its promotion.
Evaluation process:
● The evaluation will be done very stringently so that only the deserving GPs,Mandals, etc will bag the awards, and all measures will be taken to make theevaluation as objective as possible.
● The award money would be utilized to take up various development activitieslike improved waste management, recycling, water quality monitoring, etc.
● An additional incentive is that the Shubhram GPs will be recommended forthe Nirmal Gram Puraskar awards.