status of wilmington education for the 2018–2020 school years
TRANSCRIPT

Redding Consortium for Educational
Equity
StatuS of Wilmington
Education for thE 2018–2020
School YEarS
Prepared byInstitute for Public Administration
University of Delaware

Redding Consortium for Educational Equity, June 2021
Redding Consortium for Educational Equity
Status of Wilmington Education for the 2018–2020 School Years
June 2021
Prepared by the Institute for Public Administration
Joseph R. Biden, Jr. School of Public Policy & Administration University of Delaware

Redding Consortium for Educational Equity, June 2021
ii
Table of Contents
Introduction .............................................................................................................. 1
Authors and Report Preparation ........................................................................... 1
Executive Summary ................................................................................................... 2
Key Findings .......................................................................................................... 2
Section I: Wilmington Student Demographics and Public Schools ....................... 2
Section II: Student Proficiency .............................................................................. 3 Wilmington and Non-Wilmington Students ......................................................................................... 3 Low-Income Students ........................................................................................................................... 3 English Learners ................................................................................................................................... 3 Students with Special Needs ................................................................................................................. 3 Data and Definitions ............................................................................................................................. 3 Student Performance ............................................................................................................................ 4
Section I: Wilmington Student Demographics and Public Schools .......................... 5
Wilmington Student Enrollment ........................................................................... 7
Section II: Student Proficiency................................................................................. 11
Student Proficiency in English Language Arts..................................................... 12
Student Proficiency in Math ................................................................................ 16
Students from Low-Income Families ...................................................................20
Students with Special Needs ................................................................................ 26
English Learners ..................................................................................................30
Section III: Conclusion and Key Findings ............................................................... 34

Redding Consortium for Educational Equity, June 2021
iii
Preface and Acknowledgements
The Redding Consortium for Educational Equity (the Consortium) was created in 2019 to recommend policies and practices to the Governor and General Assembly that will achieve educational equity and improve educational outcomes for all Pre-K–12 students in the City of Wilmington and northern New Castle County, Delaware. The Redding Consortium for Educational Equity is the sixth group, since 2001, charged with addressing equity and governance issues for Wilmington and northern New Castle County, Delaware school systems through state-level policymaking. While there are numerous valued contributors, a special thanks goes to:
• Governor John Carney for his willingness to continue the fight for all students in Delaware.
• Secretary of Education Susan Bunting for her lifetime commitment to student success.
• The Delaware General Assembly for its leadership and support of the pursuit for educational equity.
• All members of the Consortium and its Work Groups for their commitment and dedication to improving the Delaware education system so that it benefits all students.
• The staff and students of the Institute for Public Administration at the University of Delaware and Delaware State University for providing outstanding support to the operations and research of the Consortium.
Without you all this work would not be possible.
Senator Elizabeth ‘Tizzy’ Lockman & Matthew Denn Co-Chairs, Redding Consortium for Educational Equity

Redding Consortium for Educational Equity, June 2021
1
Introduction Prepared by the University of Delaware’s Institute for Public Administration (IPA), in partnership with Delaware State University, for the Redding Consortium for Educational Equity, this report provides an updated analysis of enrollment, student proficiency, graduation rates, and dropout rates for Pre-K–12 (P–12) students residing within the limits of the City of Wilmington. This analysis includes students attending traditional, vocational-technical (vo-tech), and charter schools across the state during the 2018–2020 school years. The report provides a snapshot of public education for students living in the City of Wilmington. The Redding Consortium for Educational Equity (the Consortium) was created through legislation to recommend policies and practices to the Governor, General Assembly, and the Secretary of Education to achieve educational equity and improve educational outcomes of all Pre-K to grade 12 students in the City of Wilmington and northern New Castle County. The Consortium also monitors the educational progress and outcomes of all low-income, English learners, and other student at risk in the City of Wilmington and across northern New Castle County. The Consortium’s predecessor was the Wilmington Education Improvement Commission, which built upon the Wilmington Education Advisory Committee’s recommendations and advised the Governor and General Assembly on how to improve the quality and availability of education for children in grades P–12 within the City of Wilmington; recommend actions to address the needs of all schools statewide that have high concentrations of students in poverty, English Learners (ELs), and other students at risk; and carry out the action agenda developed by the Wilmington Education Advisory Committee as described in Strengthening Wilmington Education: An Action Agenda. This report is the only report in Delaware monitoring the educational progress of Wilmington students as a whole and evaluating the needs and performance of low-income students across the state. Annual evaluations on indicators of student success include disaggregation by geographic locations, with a specific focus on heavily concentrated areas of poverty across the state. Disaggregating data in this way more clearly identifies trends in achievement and opportunity gaps that disproportionately affect low-income students, ELs, and other students at risk in Wilmington and across Delaware.
Authors and Report Preparation
This report was written and prepared by IPA at the University of Delaware. The authors include:
• Kelly Sherretz, Project Manager and IPA Policy Scientist
• Haley Qaissaunee, IPA Policy Specialist
• Abigail Armstrong, Graduate IPA Public Administration Fellow
• Brendan Laux, Graduate IPA Public Administration Fellow This report was edited and formatted by Communications Advisor and IPA Assistant Policy Scientist Sarah Pragg. IPA is led by Director Jerome Lewis, Ph.D., and addresses the policy, planning, and management needs of its partners through the integration of applied research, professional development, and the education of tomorrow’s leaders. Learn more at www.ipa.udel.edu.

Redding Consortium for Educational Equity, June 2021
2
Executive Summary All Delaware students have the right to an adequate education and should have equitable access to high-quality education. The Consortium seeks to remove the achievement and opportunity gaps for students in poverty, English Learners (ELs), and students with disabilities throughout the state, with an initial focus on the City of Wilmington. This report is the continuation of the Consortium’s annual report on Wilmington student outcomes. This report analyzes data on enrollment, student proficiency, graduation rates, and dropout rates from the 2018–19 school year as well as the enrollment and graduation and dropout rates from the 2019–2020 school year. The report provides a snapshot of education in Delaware, particularly as it pertains to children in the City of Wilmington. In reporting these findings, the Consortium in no way means to criticize the city’s students, nor the local education agencies that serve them, but rather to highlight the urgent realities of education in the City of Wilmington.
Key Findings
Despite statewide improvements in some areas of student performance, the overall trends remain the same as previously reported: Wilmington students are behind their peers on virtually every indicator of student success. The Consortium believes that these trends, for the most part, are the result of systemic problems within the public education system and its inability to effectively address the educational needs of Wilmington students, many of whom live in severe poverty. The delivery of public education in Wilmington lacks coherent governance, struggles with inadequate school resources to meet student needs, and fails to provide and coordinate in- and out-of-school services and community resources needed to address the needs of students in poverty.
Section I: Wilmington Student Demographics and Public Schools
During the 2018–19 school year, there were 10,852 City of Wilmington students enrolled in public education. Of those students,
• 63 percent were from low-income families
• 9 percent were English Learners
• 21 percent were students with disabilities
• 71 percent identified as Black or African American
• 19 percent identified as Hispanic/Latino
• 8 percent identified as White
During the 2019–20 school year, there were 11,078 City of Wilmington students enrolled in public
education with almost identical demographics as 2018–19.

Redding Consortium for Educational Equity, June 2021
3
Section II: Student Proficiency
Wilmington and Non-Wilmington Students
Previous reports indicated a performance gap between Wilmington students and non-Wilmington students. This performance gap continues to hold.
• Approximately 25 percent of Wilmington students compared to 55 percent of non-
Wilmington students met or exceeded state standards on the 2019 English Language Arts
(ELA) Smarter Balanced Assessment.
• Approximately 15 percent of Wilmington students compared to 47 percent of Non-
Wilmington students met or exceeded state standards on the 2019 Math Smarter Balanced
Assessment.
Low-Income Students
Smarter Balanced Assessment Consortium (SBAC) and SAT test results for the past four years confirm that the majority of low-income students living in the City of Wilmington are not proficient in ELA or math. The performance of students from low-income families living in the City of Wilmington is significantly lower than the performance of students from low-income families in each county and statewide.
English Learners
SBAC and SAT test results for the past four years indicate that English Learners (EL) students from Wilmington are performing at significantly lower rates than EL students outside of Wilmington. Approximately 89 percent of English Learners in Wilmington performed well below or below expectations on the state ELA SBAC tests in 2019. Similarly, 90 percent of this population did not meet the state’s standards in math.
Students with Special Needs
SBAC and SAT test results for the past four years indicate that students with special needs from Wilmington are performing at significantly lower rates than students with special needs outside of Wilmington. Approximately 93 percent of students with special needs in Wilmington performed well below or below expectations on the state ELA SBAC tests in 2019. Similarly, 97 percent of this population did not meet the state’s standards in math.
Data and Definitions
All data are from the Delaware Department of Education (DDOE). The main source of data is the DDOE Data Set that includes data collected from school year 2011–12 through 2019–20. This report only includes analyses from the past four school years. A secondary source of data are the School Report Cards published on the DDOE’s website. Each graphic in this report indicates the appropriate data source. The term “Wilmington students” is defined as Pre-K–12 students residing within the limits of the City of Wilmington who attend traditional, vocational-technical (vo-tech), and charter schools across the state. For the purposes of this report, the terms “City of Wilmington” and “Wilmington” are interchangeable.

Redding Consortium for Educational Equity, June 2021
4
The term “Non-Wilmington students” is defined as Pre-K–12 students not residing within the limits of the City of Wilmington who attend traditional, vo-tech, and charter schools across the state.
The term “English Learners” (ELs) is defined as students who are identified as part of an English Learners Education Program at their school under Title III of the Every Student Succeeds Act (ESSA) at the time data were recorded. Students who have fully transitioned out of their program do not carry an EL designation and therefore are not included in EL data. Data points are rounded and therefore may not equate to 100 percent when added.
Student Performance
In the following analysis, proficiency categorization is determined by four achievement levels: one being “Well Below Expectations,” two being “Below Expectations,” three being “Meets Expectations,” and four being “Exceeds Expectations.” A student is classified as meeting state standards if they receive a three (meets expectations) or a four (exceeds expectations) on the state assessment. During the 2014–15 school year, the SBAC tests were administered to students in grades 3–8 and 11 in ELA and math. Starting in 2016, SBAC tests assess students in grades 3–8, and the SAT assesses high school student achievement.
The SAT is available to high school students (grades 9–12) and is administered to all Delaware high school students in grade 11. The test consists of two major sections, evidence-based reading and writing (ERW) and math, which are scored on a scale of 200–800. In spring 2016, the SAT replaced the SBAC as
Delaware’s state test for grade 11. DDOE established achievement Levels 1 to 4, with one being the lowest score, to report student performance on the ERW and math sections of the SAT in conjunction with the assessment scores. To stay consistent with DDOE reporting, the authors of this report followed the data privacy and redaction rules used by DDOE.1 In some cases, the authors erred on the side of caution to protect student privacy.
1 https://www.doe.k12.de.us/Page/3024

Redding Consortium for Educational Equity, June 2021
5
Section I: Wilmington Student Demographics and Public Schools This section provides a demographic summary for Wilmington students, each county, and the State of Delaware. There were 11,078 City of Wilmington students enrolled in public education during the 2019–20 school year. Of these students, 61 percent were from low-income families, 9 percent were English Learners, and 22 percent were students with disabilities. Statewide, 29 percent of students were from low-income families, 10 percent were ELs, and 17 percent were students with disabilities. The following tables detail and compare student demographics in Wilmington, statewide, and in each county.
Table 1. Profile of City of Wilmington Students, 2016–2020
2016–17 2017–18 2018–19 2019–20
Gender
Female 49.7% 50.0% 49.1% 49.2%
Male 50.4% 50.0% 50.9% 50.8%
Race and Ethnicity
American Indian or Alaskan Native 0.2% 0.4% 0.4% 0.4%
Asian 0.5% 0.5% 2.0% 0.5%
Black or African American 72.2% 71.5% 70.5% 70.7%
Hispanic/Latino 18.2% 18.3% 18.7% 17.9%
Two or more races 1.5% 1.7% 0.5% 2.1%
Native Hawaiian or Other Pacific Islander 0.1% 0.1% 0.1% 0.1%
White 7.3% 7.5% 8.0% 8.2%
Low-Income Population 70.7% 67.8% 63.2% 61.0%
English Learners (EL) Population 7.4% 8.4% 9.0% 8.6%
Students with Disabilities Population 19.4% 18.8% 20.6% 22.0%
Source: Delaware Department of Education Data Sets 2020 and 2021.
Table 2. City of Wilmington Student Enrollment, 2014–20202
School Year Enrollment
2016–17 11,460 2017–18 11,188 2018–19 10,853 2019–20 11,078
Source: Delaware Department of Education Data Sets 2020 and 2021.
2 Enrollment numbers are determined by the September 30 count, according to the Delaware Department of Education.

Redding Consortium for Educational Equity, June 2021
6
Table 3. Profile of City of Wilmington, Delaware, and County Students 2018–19
Wilmington Delaware
New Castle
County Kent
County Sussex County
Gender
Female 49.1% 48.7% 48.8% 48.6% 48.4%
Male 50.9% 51.3% 51.2% 51.4% 51.6%
Race and Ethnicity
American Indian or Alaskan Native 0.4% 0.4% 0.4% 0.5% 0.6%
Asian 2.0% 4.0% 5.8% 1.9% 1.4%
Black or African American 70.5% 30.2% 33.9% 32.2% 14.9%
Hispanic/Latino 18.7% 17.7% 18.3% 12.1% 24.2%
Two or more races 0.5% 4.0% 3.5% 5.2% 4.1%
Native Hawaiian or Other Pacific Islander
0.1% 0.1% 0.1% 0.2% 0.1%
White 8% 43.5% 38.1% 47.8% 54.8%
Low-Income Population 63.2% 31.5% 30.2% 34.5% 31.0%
English Learners (EL) Population 9.0% 9.6% 9.6% 6.54% 14.1%
Students with Disabilities Population 20.6% 16.1% 16.1% 16.5% 16.0%
Source: Delaware Department of Education Data Set 2020.
Table 4. Profile of City of Wilmington, Delaware, and County Students 2019–20
Wilmington Delaware
New Castle
County Kent
County Sussex County
Gender
Female 49.2% 48.7% 48.7% 48.6% 48.5%
Male 50.8% 51.3% 51.3% 51.4% 51.5%
Race and Ethnicity
American Indian or Alaskan Native 0.4% 0.4% 0.4% 0.5% 0.5%
Asian 0.5% 4.1% 6.0% 1.9% 1.4%
Black or African American 70.7% 30.1% 34.0% 32.6% 16.6%
Hispanic/Latino 17.9% 18.1% 18.3% 11.3% 25.2%
Two or more races 2.1% 4.5% 3.8% 5.5% 5.1%
Native Hawaiian or Other Pacific Islander
0.1% 0.1% 0.1% 0.1% 0.1%
White 8.2% 42.7% 37.4% 48.1% 51.2%
Low-Income Population 61.0% 29.3% 28.1% 32.0% 29.6%
English Learners (EL) Population 8.6% 9.8% 9.4% 6.0% 15.2%
Students with Disabilities Population 22.0% 16.7% 16.8% 17.2% 15.9%
Source: Delaware Department of Education Data Sets 2020 and 2021.

Redding Consortium for Educational Equity, June 2021
7
Wilmington Student Enrollment
This section addresses Wilmington student enrollment in Delaware schools. Figure 1 demonstrates the enrollment of Wilmington students in Delaware public schools over time, by school type. Table 5 details the enrollment of Wilmington students in these public schools for the 2018–19 and 2019–20 school years.
Figure 1. Wilmington Student Enrollment by Public School Type, 2015–2020 School Years
Source: Delaware Department of Education Data Sets 2020 and 2021.
2016–17 2017–18 2018–19 2019–20
Charter Schools 2,757 2,821 2,821 2,943
New Castle County VoTech 690 691 628 690
Traditional Public Schools 8,103 7,676 7,408 7,445
0
1,000
2,000
3,000
4,000
5,000
6,000
7,000
8,000
9,000

Redding Consortium for Educational Equity, June 2021
8
Table 5. Wilmington Student Enrollment in Public Schools, 2018–19 and 2019–20 School Years
2018–19 2019–20
Red Clay Consolidated School District 3,267 3,443
Christina School District 1,846 1,790
Brandywine School District 1,842 1,936
NCC Vo-Tech School District 628 690
Edison (Thomas A.) Charter School 556 564
Kuumba Academy Charter School 458 480
East Side Charter School 338 351
Colonial School District 294 264
Great Oaks Charters School 240 311
Academia Antonia Alonso 235 223
Odyssey Charter School 223 236
Charter School of New Castle 184 212
Freire Charter School 169 161
First State Montessori Academy 122 154
Charter School of Wilmington 100 99
Gateway Lab School 44 50
Las Americas ASPIRA Academy 38 37
Appoquinimink School District 23 <15
Delaware Military Academy 20 22
MOT Charter School <15 <15
Newark Charter School <15 <15
Source: Delaware Department of Education Data Sets 2020 and 2021.
Redding Consortium for Educational Equity, June 2021
9
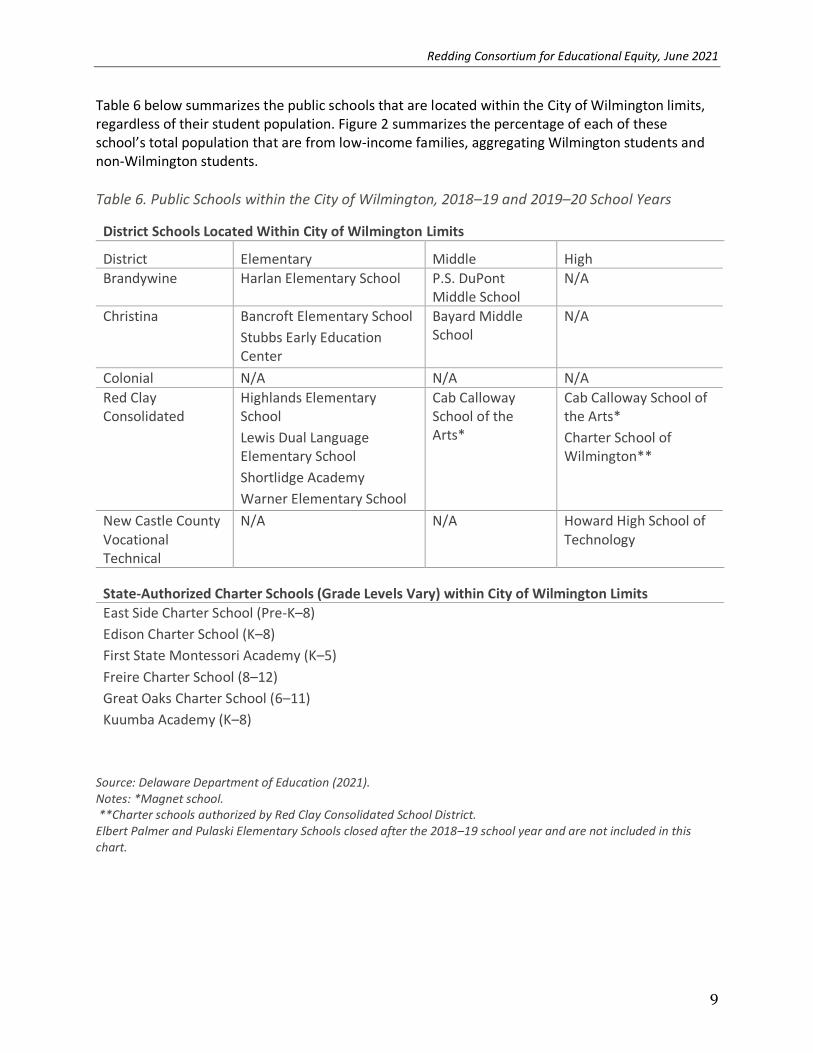
Table 6 below summarizes the public schools that are located within the City of Wilmington limits, regardless of their student population. Figure 2 summarizes the percentage of each of these school’s total population that are from low-income families, aggregating Wilmington students and non-Wilmington students.
Table 6. Public Schools within the City of Wilmington, 2018–19 and 2019–20 School Years
District Schools Located Within City of Wilmington Limits
District Elementary Middle High
Brandywine Harlan Elementary School P.S. DuPont Middle School
N/A
Christina Bancroft Elementary School
Stubbs Early Education Center
Bayard Middle School
N/A
Colonial N/A N/A N/A
Red Clay Consolidated
Highlands Elementary School
Lewis Dual Language Elementary School
Shortlidge Academy
Warner Elementary School
Cab Calloway School of the Arts*
Cab Calloway School of the Arts*
Charter School of Wilmington**
New Castle County Vocational Technical
N/A N/A Howard High School of Technology
State-Authorized Charter Schools (Grade Levels Vary) within City of Wilmington Limits
East Side Charter School (Pre-K–8)
Edison Charter School (K–8)
First State Montessori Academy (K–5)
Freire Charter School (8–12)
Great Oaks Charter School (6–11)
Kuumba Academy (K–8)
Source: Delaware Department of Education (2021). Notes: *Magnet school. **Charter schools authorized by Red Clay Consolidated School District. Elbert Palmer and Pulaski Elementary Schools closed after the 2018–19 school year and are not included in this chart.

Redding Consortium for Educational Equity, June 2021
10
Figure 2. Percentage of Low-Income Student Enrollment in Schools Located in the City of Wilmington, 2018–19 and 2019–2020
School Name 2018–2019 2019–2020
Stubbs Early Education Center 82% 84% Bancroft School 75% 79% Warner Elementary School 78% 76% Edison Charter School 75% 75% East Side Charter School 79% 75% Bayard School 73% 73% Shortlidge Academy 77% 72% Lewis Dual Language Elementary 67% 65% Highlands Elementary School 64% 63% Harlan Elementary School 57% 62% Kuumba Academy 62% 61% Great Oaks Charter School 60% 59% Howard High School of Technology 46% 43% Freire Charter School 43% 39% P.S. duPont Middle School 34% 35% First State Montessori Academy 10% 10% Cab Calloway School of the Arts 9% 9% Charter School of Wilmington 4% 4% Elbert-Palmer Elementary 84% Closed Pulaski Elementary 69% Closed
Source: Delaware Report Card, 2021

Redding Consortium for Educational Equity, June 2021
11
Section II: Student Proficiency The most widely used measure of academic, teaching, and learning success is student performance on state standardized tests. Delaware changed its standardized testing protocol in 2015 from the Delaware Comprehensive Assessment System (DCAS) for all subjects to the Smarter Balanced Assessment Consortium (SBAC, or Smarter Balanced Assessment) for ELA and math tests. The 2018–19 school year was the fifth year for the use of the Smarter Balanced Assessment. The 2015 SBAC assessed students in grades 3–8 and 11. The 2016 SBAC assessed students in grades 3–8 and the SAT replaced SBAC in order to alleviate over-testing. The SAT measures the skills and knowledge important for success in college and career. It includes Evidence-Based Reading and Writing (ERW) and math sections. The ERW section is composed of a reading test and a writing and language test. The math section assesses skills in algebra, problem solving and data analysis, manipulation of complex equations, geometry, and trigonometry. On the SAT, students receive a total score that is the sum of their scores on the two sections (math and ERW). The optional SAT essay is scored separately. Each section receives a scaled score of 200 to 800, to adjust for slight differences in difficulty among versions of the test, which is consistent across different versions. Using the College Board’s benchmarks for the ERW and math section, DDOE established achievement Levels 1 to 4, with one being the lowest score, to report student performance on the ERW and math sections of the SAT in conjunction with the assessment scores. The following sections use the college and career benchmarks and achievement levels established by DDOE to examine student performance on the SAT. The following subsections seek to provide comparative analysis of student performance data between students living in the City of Wilmington and those not living in Wilmington. It includes performance data by the following sub-groups: City of Wilmington students, non-Wilmington students, by county, English Learners, students with special needs, and students from low-income families. To stay consistent with DDOE reporting, the authors of this report followed the data privacy and redaction rules used by DDOE.3 In some cases, the authors erred on the side of caution to protect student privacy. In these cases, “Well Below” and “Below” were merged to “Below the Standard” and “At” and “Above” were merged to “Meets the Standard.” When it was not possible to merge the data, the subgroup was redacted for student privacy.
3 https://www.doe.k12.de.us/Page/3024

Redding Consortium for Educational Equity, June 2021
12
Student Proficiency in English Language Arts
This section examines student proficiency in ELA for both SBAC and SAT by state, county, Wilmington students, and non-Wilmington Students. Figures 3 and 4 below compare proficiency of Wilmington students and non-Wilmington students on the SBAC in ELA across a four-year period, and in 2019 by county.
Figure 3. ELA Proficiency for Wilmington and Non-Wilmington Students on the SBAC, 2015–19 School Years (Grade Levels Combined)
Source: Delaware Department of Education Data Sets 2020 and 2021.
19%
20%
20%
22%
47%
49%
48%
51%
23%
23%
23%
23%
26%
26%
26%
24%
33%
33%
33%
32%
20%
19%
19%
19%
24%
23%
24%
24%
7%
7%
6%
6%
2015–16
2016–17
2017–18
2018–19
2015–16
2016–17
2017–18
2018–19
Well Below Below At AboveWilmington
Non-Wilmington
Well Below Below At AboveWilmington
Non-Wilmington

Redding Consortium for Educational Equity, June 2021
13
Figure 4. ELA Proficiency for All Students by State, County, and Wilmington on the SBAC, 2018–19 School Year (Grade Levels Combined)
Source: Delaware Department of Education Data Sets 2020 and 2021.
Overall, on the SBAC ELA, Wilmington students continue to perform at achievement rates lower than their non-Wilmington and county peers.
• Statewide, 53 percent of students met or exceeded state standards on the SBAC.
• 56 percent of non-Wilmington students met or exceeded state standards in 2019.
• 25 percent of Wilmington students met or exceeded state standards in 2019.
• The percentage of students meeting or exceeding state standards in each county is within
11 points of the state average on the SBAC.
• There has been a persistent gap of at least 29 percentage points since 2016 between
Wilmington students and their non-Wilmington and county peers.
• Performance has been effectively stagnant for all students since 2016.
19%
20%
27%
51%
22%
24%
22%
23%
23%
24%
23%
23%
35%
33%
29%
19%
32%
31%
24%
24%
21%
6%
24%
22%
SussexCounty
Kent County
New CastleCounty
Wilmington
State Non-Wilmington
State
Well Below Below At AboveWell Below Below At Above

Redding Consortium for Educational Equity, June 2021
14
Figure 5 describes proficiency of Wilmington students and non-Wilmington students on the ERW section of the SAT across a four-year period. Figure 6 displays student EWR proficiency by state, county, and Wilmington on the SAT in the 2018–19 school year.
Figure 5. ERW Proficiency for Wilmington and Non-Wilmington Students on the SAT, 2015–19 School Years
Source: Delaware Department of Education Data Sets 2020 and 2021.
26%
22%
27%
28%
52%
40%
47%
50%
21%
22%
22%
22%
20%
23%
23%
26%
42%
42%
40%
41%
24%
21%
25%
19%
11%
10%
11%
9%
4%
4%
5%
5%
2015–16
2016–17
2017–18
2018–19
2015–16
2016–17
2017–18
2018–19
Well Below Below At AboveWilmington
Non-Wilmington
Well Below Below At AboveWilmington
Non-Wilmington

Redding Consortium for Educational Equity, June 2021
15
Figure 6. EWR Proficiency for All Students by State, County, and Wilmington on the SAT, 2018–19 School Year
Source: Delaware Department of Education Data Sets 2020 and 2021.
On the SAT, Wilmington students continue to perform at rates lower than their non-Wilmington and county peers.
• Statewide, 48 percent of students met or exceeded state standards on the SAT.
• 50 percent of non-Wilmington students met or exceeded state standards in 2019.
• 24 percent of Wilmington students met or exceeded state standards in 2019
• The percentage of students meeting or exceeding state standards in each county is within 2
points of the state average on the SAT.
• The percentage of Wilmington students meeting or exceeding the state standards was 23 to
26 percentage points lower on the SAT than their countywide and non-Wilmington peers.
• While performance improved for Wilmington students in 2018, it was lower in 2019.
• As a trend, performance has been effectively stagnant for all students since 2016.
30%
29%
29%
50%
28%
29%
23%
23%
22%
26%
22%
23%
40%
41%
39%
19%
41%
39%
8%
7%
11%
5%
9%
9%
SussexCounty
Kent County
New CastleCounty
Wilmington
State Non-Wilmington
State
Well Below Below At AboveWell Below Below At Above

Redding Consortium for Educational Equity, June 2021
16
Student Proficiency in Math
This section examines student proficiency in math for both SBAC and SAT by state, county, Wilmington students, and non-Wilmington Students.
Figure 7. Math Proficiency for Wilmington and Non-Wilmington Students on the SBAC, 2015–19 School Years (Grade Level Combined)
Source: Delaware Department of Education Data Sets 2020 and 2021.
24%
24%
25%
26%
54%
55%
56%
58%
30%
29%
28%
27%
28%
28%
27%
27%
25%
25%
25%
24%
12%
12%
12%
10%
21%
23%
22%
23%
5%
5%
5%
5%
2015–16
2016–17
2017–18
2018–19
2015–16
2016–17
2017–18
2018–19
Well Below Below At AboveWilmington
Non-Wilmington
Well Below Below At AboveWilmington
Non-Wilmington

Redding Consortium for Educational Equity, June 2021
17
Figure 8. Math Proficiency for All Students by State, County, and Wilmington on the SBAC, 2018–2019 School Year
Source: Delaware Department of Education Data Sets 2020 and 2021.
On SBAC Math, Wilmington students continue to perform at rates lower than their non-Wilmington and county peers.
• Statewide, 52 percent of students met or exceeded state standards on the SBAC.
• 47 percent of non-Wilmington Students met or exceeded state standards in 2019
• 15 percent of Wilmington Students met or exceeded state standards in 2019
• The percentage of students meeting or exceeding state standards in each county is within
+/- 8 percentage points of the state average on the SBAC.
• The percentage of Wilmington students meeting the standard was 25–39 percentage points
lower than their countywide peers.
• Performance has been effectively stagnant for all students since 2016.
22%
25%
33%
58%
26%
29%
26%
29%
27%
27%
27%
27%
26%
25%
21%
10%
24%
23%
26%
21%
20%
5%
23%
21%
SussexCounty
Kent County
New CastleCounty
Wilmington
State Non-Wilmington
State
Well Below Below At AboveWell Below Below At Above

Redding Consortium for Educational Equity, June 2021
18
Figure 9. Math Proficiency for Wilmington and Non-Wilmington Students on the SAT, 2015–19 School Years
Source: Delaware Department of Education Data Sets 2020 and 2021.
Figure 10. Math Proficiency for All Students by State, Country, and Wilmington on the SAT, 2018–19 School Year
27%
24%
33%
32%
47%
39%
54%
56%
41%
43%
37%
39%
40%
40%
32%
33%
25%
23%
23%
24%
10%
7%
12%
9%
7%
6%
6%
5%
3%
2%
2%
3%
2015–16
2016–17
2017–18
2018–19
2015–16
2016–17
2017–18
2018–19
Well Below Below At AboveWilmington
Non-Wilmington
Well Below Below At AboveWilmington
Non-Wilmington
31%
33%
34%
56%
32%
33%
39%
44%
37%
33%
39%
39%
26%
21%
23%
10%
24%
23%
4%
3%
7%
3%
5%
5%
SussexCounty
Kent County
New CastleCounty
Wilmington
State Non-Wilmington
State
Well Below Below At AboveWell Below Below At Above

Redding Consortium for Educational Equity, June 2021
19
On the math SAT, Wilmington students continue to perform at a lower proficiency rate than their non-Wilmington and county peers.
• Statewide, 28 percent of students met or exceeded state standards on the math SAT.
• 29 percent of non-Wilmington students met or exceeded state standard on the math SAT in
2019.
• 13 percent of Wilmington students met or exceeded state standards on the math SAT in
2019.
• The percentage of students meeting or exceeding state standards in each county is within
+/- 5 points of the state average on the math SAT.
• The percentage of Wilmington students meeting or exceeding the state standards was 12 to
19 percentage points lower than their countywide peers.
• Performance has been effectively stagnant for all students since 2016.

Redding Consortium for Educational Equity, June 2021
20
Students from Low-Income Families
The following figures and tables compare the proficiency of all students from low-income families and City of Wilmington students from low-income families on both the SBAC and SAT. Figures 11 and 12 discuss performance of students from low-income families on the SBAC in ELA. Figure 11. ELA Proficiency for Students from Low-Income Families on the SBAC, 2015–2019 School Years, Grade Levels Combined
Source: Delaware Department of Education Data Sets 2020 and 2021.
30%
30%
31%
33%
52%
54%
53%
56%
29%
29%
29%
28%
26%
26%
26%
24%
29%
29%
29%
27%
17%
16%
17%
16%
12%
12%
12%
12%
4%
4%
4%
3%
2015–16
2016–17
2017–18
2018–19
2015–16
2016–17
2017–18
2018–19
Well Below Below At AboveWilmington
Non-Wilmington
Well Below Below At AboveWilmington
Non-Wilmington

Redding Consortium for Educational Equity, June 2021
21
Figure 12. ELA Proficiency for Students from Low-Income Families on the SBAC, by State, County, and Wilmington, 2018–19 School Year
Source: Delaware Department of Education Data Sets 2020 and 2021.
Wilmington students from low-Income families continue to perform at lower proficiency rates on the SBAC than non-Wilmington and county students from low-income families.
• Statewide, 37 percent of students from low-income families met or exceeded state standards on the SBAC.
• 39 percent of non-Wilmington students from low-income families met or exceeded state standards in 2019, compared to 56 percent of the general non-Wilmington student population.
• 19 percent of Wilmington students from low-income families met or exceeded state standards in 2019, compared to 25 percent of the general Wilmington student population.
• The percentage of students meeting or exceeding state standards in each county is within +/- 16 percentage points of the state average.
• Wilmington students from low-income families performed at 10 to 26 percentage points lower than their non-Wilmington and countywide peers from low-income families.
• Proficiency among all students from low-income families has been decreasing gradually since 2017.
27%
29%
43%
56%
33%
36%
27%
29%
26%
24%
28%
27%
32%
29%
22%
16%
27%
26%
14%
13%
8%
3%
12%
11%
Sussex County
Kent County
New Castle County
Wilmington
State Non-Wilmington
State
Well Below Below AboveWell Below Below At Above

Redding Consortium for Educational Equity, June 2021
22
Figures 13 and 14 discuss performance of students from low-income families on the ERW section of the SAT. For student privacy, categories have been aggregated.
Figure 13. EWR Proficiency for Students from Low-Income Families on the SAT, 2015–19 School Years
Source: Delaware Department of Education Data Sets 2020 and 2021.
Figure 14. EWR Proficiency for Students from Low-Income Families on the SAT, by State, County, and Wilmington, 2018–19 School Year
Source: Delaware Department of Education Data Sets 2020 and 2021.
66%
63%
68%
70%
0
84%
80%
79%
87%
34%
37%
32%
30%
0
16%
20%
21%
13%
2015–16
2016–17
2017–18
2018–19
2015–16
2016–17
2017–18
2018–19
Wilmington
Non-Wilmington
Below Standard Meets or Exceeds StandardWilmington
Non-Wilmington
68%
69%
75%
87%
70%
71%
32%
31%
25%
13%
30%
29%
Sussex County
Kent County
New Castle County
Wilmington
State Non-Wilmington
State
Below Standard Meets or Exceeds Standard

Redding Consortium for Educational Equity, June 2021
23
Wilmington students from low-income families continue to perform at proficiency rates lower than non-Wilmington and county students from low-income families.
• Statewide, 29 percent of these students met or exceeded state standards on the SAT.
• 31 percent of non-Wilmington students from low-income families met or exceeded state standards in 2019, compared to 50 percent of the general non-Wilmington student population.
• 13 percent of Wilmington students from low-income families met or exceeded state standards in 2019, compared to 24 percent of the overall Wilmington student population.
• The percentage of students meeting or exceeding state standards in each county is within +/- 4 points of the state average on the SAT.
• Wilmington students performed 13 to 20 percentage points lower on the SAT than their non-Wilmington and countywide peers from low-income families.
The following figures discuss achievement in math for Wilmington and non-Wilmington students
from low-income families on the SBAC.
Figure 15. Math Proficiency for Students from Low-Income Families on the SBAC, Wilmington and Non-Wilmington Students, 2015–19 Year (Grade Level Combined)
Source: Delaware Department of Education Data Sets 2020 and 2021.
35%
34%
37%
39%
59%
60%
61%
63%
34%
34%
32%
31%
27%
28%
26%
26%
21%
22%
21%
20%
11%
10%
10%
8%
9%
10%
10%
11%
2%
3%
3%
3%
2015–16
2016–17
2017–18
2018–19
2015–16
2016–17
2017–18
2018–19
Well Below Below At AboveWilmington
Non-Wilmington
Well Below Below At AboveWilmington
Non-Wilmington

Redding Consortium for Educational Equity, June 2021
24
Figure 16. Math Proficiency for Students from Low-Income Families on the SBAC, State, County, and Wilmington, 2018–19 School Year (Grade Level Combined)
Source: Delaware Department of Education Data Sets 2020 and 2021.
Wilmington students from low-income families continue to perform at lower proficiency rates on the math SBAC than non-Wilmington and county peers from low-income families.
• Statewide, 27 percent of students from low-income families met or exceeded state standards on the SBAC.
• 31 percent of non-Wilmington students from low-income families met or exceeded state standards in 2019.
• 11 percent of Wilmington students from low-income families met or exceeded state standards in 2019, compared to 15 percent of the general Wilmington student population.
• The percentage of students meeting or exceeding state standards in each county is within +/- 9 percentage points of the state average.
• Wilmington students performed 10 to 27 percentage points lower than their non-Wilmington and countywide peers from low-income families.
• Proficiency among all students from low-income families has been decreasing gradually since 2016.
31%
36%
50%
63%
39%
42%
31%
33%
29%
26%
31%
30%
23%
21%
14%
8%
20%
18%
15%
11%
7%
3%
11%
9%
SussexCounty
Kent County
New CastleCounty
Wilmington
State Non-Wilmington
State
Well Below Below At AboveWell Below Below At Above

Redding Consortium for Educational Equity, June 2021
25
The following figure shows the state, county, and non-Wilmington achievement on the math SAT. Wilmington numbers have been redacted for student privacy.
Figure 17. Math Proficiency for Low-Income Students by State, County, and Non-Wilmington on the SAT, 2018–19 School Year
Source: Delaware Department of Education Data Sets 2020 and 2021.
On the math SAT, Wilmington students from low-income families perform at proficiency rates lower than their non-Wilmington or county peers.
• Statewide, 12 percent of these students met or exceeded state standards on the SAT.
• The percentage of students meeting or exceeding state standards in each county is within +/- 5 points of the state average on the SAT.
• 13 percent of non-Wilmington students from low-income families met or exceeded state standards in 2019, compared to 29 percent of the overall non-Wilmington student population.
• As a trend, proficiency in math for all students from low-income families has not significantly changed for non-Wilmington students from low-income families.
83%
87%
91%
87%
88%
17%
13%
10%
13%
12%
SussexCounty
Kent County
New CastleCounty
State Non-Wilmington
State
Meets or Exceeds StandardBelow Standard

Redding Consortium for Educational Equity, June 2021
26
Students with Special Needs
The following figures discuss the proficiency of students with special needs, encompassing students categorized as receiving special education services. The data compare proficiency of students with special needs statewide and in each county with students with special needs living in the City of Wilmington on both the SBAC and SAT. For this subgroup, student achievement is aggregated to Meets the Standard and Does Not Meet the Standard for SBAC. SAT results for Wilmington students have been redacted. Figures 18 and 19 discuss the performance of students with special needs on the SBAC ELA.
Figure 18. ELA Proficiency for Students with Special Needs on the SBAC, Wilmington and Non-Wilmington Students, 2015–19 School Years (Grade Level Combined)
Source: Delaware Department of Education Data Sets 2020 and 2021.
82%
83%
87%
81%
95%
96%
97%
93%
18%
17%
13%
19%
5%
4%
3%
7%
2015–16
2016–17
2017–18
2018–19
2015–16
2016–17
2017–18
2018–19
Wilmington
Non-Wilmington
Does Not Meet the Standard Meets the Standard
Wilmington
Non-Wilmington

Redding Consortium for Educational Equity, June 2021
27
Figure 19. ELA Proficiency for Students with Special Needs on the SBAC, by State, County, and Wilmington, 2018–19 School Year (Grade Level Combined)
Source: Delaware Department of Education Data Sets 2020 and 2021.
On SBAC ELA, Wilmington students with special needs continue to perform at rates lower than their non-Wilmington and county peers.
• Statewide, 18 percent of students with special needs met or exceeded state standards on the SBAC in 2019.
• 19 percent of non-Wilmington students with special needs met or exceeded state standards in 2019.
• 7 percent of Wilmington students with special needs met or exceeded state standards in 2019.
• The percentage of students with special needs meeting or exceeding state standards in each county is within +/- 5 percentage points of the state average.
• The percentage of Wilmington students with special needs meeting or exceeding state standards is 8 to 16 percentage points lower than their countywide peers.
76%
80%
85%
93%
81%
82%
24%
20%
15%
7%
19%
18%
SussexCounty
Kent County
New CastleCounty
Wilmington
State Non-Wilmington
State
Does Not Meet the Standard Meets the Standard

Redding Consortium for Educational Equity, June 2021
28
The following figure shows the state, county, and non-Wilmington achievement for students with special needs on the EWR SAT. Wilmington numbers have been redacted for student privacy.
Figure 20. ERW Proficiency for Students with Special Needs on the SAT, by State and County, 2018–19 School Year
Source: Delaware Department of Education Data Sets 2020 and 2021.
On the SAT, Wilmington students with special needs continue to perform at rates lower than their non-Wilmington and county peers.
• Statewide, 10 percent of students with special needs met or exceeded state standards on the SAT in 2019.
• 11 percent of non-Wilmington students with special needs met or exceeded state standards in 2019.
• The percentage of students with special needs meeting or exceeding state standards in each county is within +/- 4 percentage points of the state average.
87%
89%
91%
89%
90%
13%
11%
9%
11%
10%
SussexCounty
Kent County
New CastleCounty
State Non-Wilmington
State
Does Not Meet the Standard Meets the Standard
Redding Consortium for Educational Equity, June 2021
29
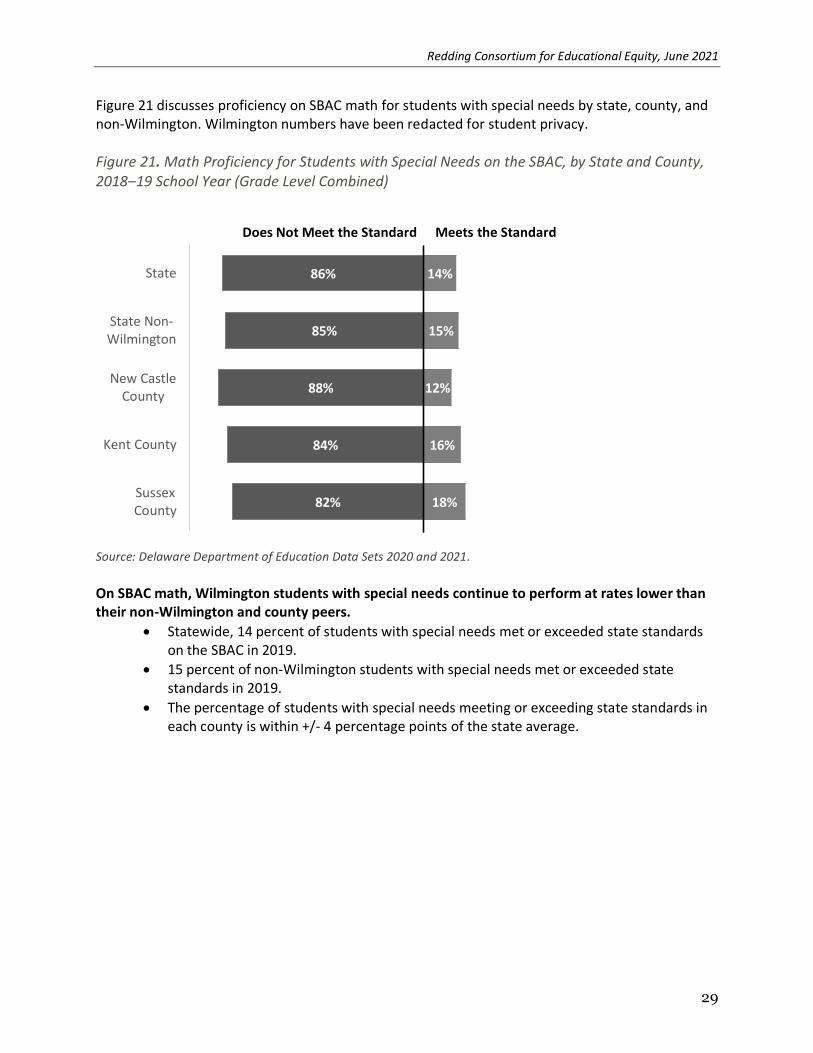
Figure 21 discusses proficiency on SBAC math for students with special needs by state, county, and non-Wilmington. Wilmington numbers have been redacted for student privacy.
Figure 21. Math Proficiency for Students with Special Needs on the SBAC, by State and County, 2018–19 School Year (Grade Level Combined)
Source: Delaware Department of Education Data Sets 2020 and 2021.
On SBAC math, Wilmington students with special needs continue to perform at rates lower than their non-Wilmington and county peers.
• Statewide, 14 percent of students with special needs met or exceeded state standards on the SBAC in 2019.
• 15 percent of non-Wilmington students with special needs met or exceeded state standards in 2019.
• The percentage of students with special needs meeting or exceeding state standards in each county is within +/- 4 percentage points of the state average.
82%
84%
88%
85%
86%
18%
16%
12%
15%
14%
SussexCounty
Kent County
New CastleCounty
State Non-Wilmington
State
Does Not Meet the Standard Meets the Standard

Redding Consortium for Educational Equity, June 2021
30
English Learners
The following figures compare the proficiency of students categorized as English Learners statewide and the proficiency of ELs who live in the City of Wilmington on both the SBAC and SAT. The data include all students classified as ELs by the reporting schools in each academic year and does not include former EL students who have exited the program. The first three figures discuss the performance of EL students in English Language Arts. In this section, many of the subgroups are aggregated and SAT was redacted.
Figure 22. ELA Proficiency for English Learners, Wilmington and Non-Wilmington Students on the SBAC, 2015–19 School Years (Grade Level Combined)
Source: Delaware Department of Education Data Sets 2020 and 2021.
82%
78%
71%
71%
84%
90%
87%
89%
18%
22%
28%
29%
16%
10%
13%
11%
2015–16
2016–17
2017–18
2018–19
2015–16
2016–17
2017–18
2018–19
Meets the Standard
Wilmington
Non-Wilmington
Does Not Meet the Standard
Wilmington
Non-Wilmington

Redding Consortium for Educational Equity, June 2021
31
Figure 23. ELA Proficiency for English Learners by State, County, and Wilmington on the SBAC, 2018–19 School Year (Grade Levels Combined)
Source: Delaware Department of Education Data Sets 2020 and 2021.
On SBAC ELA, Wilmington ELs continue to perform at rates lower than their non-Wilmington and county EL peers.
• Statewide, 28 percent of ELs met or exceeded state standards on the SBAC in 2019.
• 29 percent of non-Wilmington ELs met or exceeded state standards in 2019, compared to 56 percent of the general non-Wilmington student population.
• 11 percent of Wilmington ELs met or exceeded state standards in 2019, compared to 25 percent of the general Wilmington student population.
• The percentage of ELs meeting or exceeding state standards in each county is within +/- 5 percentage points of the state average.
• The percentage of Wilmington ELs meeting or exceeding state standards is 14 to 22 percentage points lower than their county-wide EL peers.
• Proficiency among Wilmington ELs has been stagnant since 2016, while proficiency among non-Wilmington ELs has been gradually increasing since 2016.
67%
70%
75%
89%
71%
72%
33%
30%
25%
11%
29%
28%
SussexCounty
Kent County
New CastleCounty
Wilmington
State Non-Wilmington
State
Does Not Meet the Standard Meets the Standard

Redding Consortium for Educational Equity, June 2021
32
Figure 24 below discusses the performance of English Learners on the SBAC in math.
Figure 24. Math Proficiency for English Learners on the SBAC, Wilmington and Non-Wilmington Students, 2015–19 School Years (Grade Level Combined)
Source: Delaware Department of Education Data Sets 2020 and 2021.
80%
76%
71%
71%
0
84%
92%
88%
90%
20%
24%
29%
29%
0
16%
8%
12%
10%
2015–16
2016–17
2017–18
2018–19
2015–16
2016–17
2017–18
2018–19
Does Not Meet the Standard Meets the Standard Wilmington
Non-Wilmington
Wilmington
Non-Wilmington

Redding Consortium for Educational Equity, June 2021
33
Figure 25. Math Proficiency for English Learners on the SBAC by State, County, and Wilmington, 2018–19 School Year (Grade Level Combined)
Source: Delaware Department of Education Data Sets 2020 and 2021.
On SBAC math, Wilmington ELs continue to perform at rates lower than their non-Wilmington and county EL peers.
• Statewide, 27 percent of ELs met or exceeded state standards on the SBAC in 2019.
• 29 percent of non-Wilmington ELs met or exceeded state standards in 2019.
• 10 percent of Wilmington ELs met or exceeded state standards in 2019.
• The percentage of ELs meeting or exceeding state standards in each county is within +/- 7 percentage points of the state average.
• The percentage of Wilmington ELs meeting or exceeding state standards is 13 to 24 percentage points lower than their countywide EL peers.
• Proficiency among Wilmington ELs has been stagnant since 2017.
65%
72%
77%
90%
71%
73%
35%
28%
24%
9%
29%
27%
SussexCounty
Kent County
New CastleCounty
Wilmington
State Non-Wilmington
State
Does Not Meet the Standard Meets the Standard

Redding Consortium for Educational Equity, June 2021
34
Section III: Conclusion and Key Findings Despite statewide improvements in some areas, the overall trends remain the same as previously
reported: Wilmington students are behind their peers on virtually every indicator of student
success, including academic performance. While some schools may serve most students well,
students from the city as a whole continue to lag behind their peers.
• Approximately 25 percent of Wilmington students compared to 53 percent of non-
Wilmington students met or exceeded state standards on the 2019 English Language
Arts Smarter Balanced Assessment. There was no change in performance for both
Wilmington and non-Wilmington students from the previous years.
• Approximately 15 percent of Wilmington students compared to 47 percent of non-
Wilmington students met or exceeded state standards on the 2019 math Smarter
Balanced Assessment. There was no change in performance for both Wilmington and
non-Wilmington students from the previous years.
• Approximately 24 percent of Wilmington students, compared to 50 percent of non-
Wilmington students met or exceeded college and career readiness benchmarks in
Evidence-Based Reading and Writing on the SAT in 2019.
• Approximately 13 percent of Wilmington students, compared to 29 percent of non-
Wilmington students met or exceeded college and career readiness benchmarks in math
on the SAT in 2019. These figures represent a decrease from the previous years.
The Consortium believes that these trends, for the most part, are not the result of the performance
of any school, but a result of the overall public education system’s inability to effectively address
the educational needs of Wilmington students, students from low-income families, English
Learners, and students with disabilities. The delivery of public education in Wilmington lacks
coherent governance, struggles with inadequate school resources to meet student needs, and fails
to provide and coordinate the in- and out-of-school services and community resources needed to
address the needs of students in poverty.

Institute for Public AdministrationBiden School of Public Policy & Administration
University of Delaware
180 Graham Hall University of Delaware Newark, DE 19716-7380
phone: 302-831-8971 email: [email protected] fax: 302-831-3488
www.ipa.udel.edu
The University of Delaware’s Institute for Public Administration (IPA)
addresses the policy, planning, and management needs of its partners
through the integration of applied research, professional development,
and the education of tomorrow’s leaders.
The University of Delaware is an equal opportunity/affirmative action employer and Title IX institution. For the University’s complete non-discrimination statement, please visit http://www.udel.edu/home/legal-notices/
Institute forPublic AdministrationSCHOOL OF PUBLIC POLICY & ADMINISTRATION