status of women in india
DESCRIPTION
report on status of womenTRANSCRIPT

National Institute of Public Cooperation and Child Development5, Siri Institutional Area, Hauz Khas, New Delhi - 110016
Statistics on
WOMEN IN INDIA

Statistics on Women in India
2007
National Institute of Public Cooperation and Child Development
5, Siri Institutional Area, Hauz Khas, New Delhi - 110016

Number of Copies : 1000
Copyright:
National Institute of Public Cooperation and Child Development, 2007
Published by:
National Institute of Public Cooperation and Child Development
5, Siri Institutional Area, Hauz Khas,
New Delhi - 110016
Printed at:
Power Printers
2/8-A, Ansari Road, Darya Ganj,
New Delhi-110 002
Phone : 23272445, 23283911

Project Team
Guidance and Support : Dr. A.K. Gopal
Encouragement and Support : Dr. Dinesh Paul
Dr. Sulochana Vasudevan
Text : Meenakshi Sood
S.K. Sobti
Meenu Kapur
Punita Mathur
Dr. Anindita Shukla
Computer Assistance : Sandeepa Jain
Pawan Kumar
Ashok Mahato
Subha Laxmi Behera
Support Services : H.K. Barthwal, Editing
A.J. Kaul, Publishing
Institutional Cooperation : Government Ministries and Departments
Autonomous Organizations
United Nations Organizations
International Organizations
Research Institutions
Voluntary Organizations


Foreword
The progress of a country is best adjudged by the positive changes that are reflected in
its human development indices. This is particularly true when the growth indices represent
changes brought about among the vulnerable sections of its society, particularly women.
Successive Governments have addressed women’s issues through legislative and
administrative interventions and by strengthening various institutions delivering health care,
education and justice. India has in fact been in the forefront of various initiatives for
betterment of the status of women and is a signatory to many international conventions on
this subject. On the domestic front, the Five-Year Plans so far have paid special attention
to the vulnerable groups for their economic development. With these interventions it was
hoped that the social discrimination faced by women and gender-related oppression would
subside.
How far have these efforts fructified? Are we heading in the right direction to achieve
various goals that we have set for ourselves? To get answers to these questions we need
to look at available statistics. These are not mere numbers but indicators of the achievements
of five decades and highlight gaps where further efforts are required. Thus statistical
information is an important tool to assess the present status and chalk out the future
growth path. All statistical information that is gathered by various Governmental and
autonomous institutions at periodic intervals such as the General Census, demography,
employment status in rural and urban areas, literacy, education, poverty level, and gender
related data have an important place in planning. To get all the data in one single document
would be of immense use to those working in the area of women’s development and
gender planning.
Viewed in this context, the present compilation by NIPCCD, which encompasses different
aspects of the status of women and girls in India, is indeed an important and welcome
effort. I understand that in these commendable efforts, the National Institute of Public
Cooperation and Child Development (NIPCCD) had the support and cooperation of officials
of various ministries and departments, international organisations and autonomous
institutions. I am confident that planners, administrators, research scholars and other
stakeholders working in the area of women’s empowerment would find this document a
useful tool for improving the status of women in the country.
(Deepa Jain Singh)
Secretary
Ministry of Women and Child Development
New Delhi


Preface
Women constitute half the human resources and thus the economic wealth of the country
and if about half the nation’s human resource is neglected, the overall progress of the
country would obviously be hampered. Recognizing the need for involving women in various
development activities, the Government of India has initiated several affirmative measures
by way of programmes and schemes to bring them into the mainstream of development.
These affirmative actions have brought about perceptible changes in the socio-economic
conditions of women. The literacy rate of females, which was 8.86% in 1951 rose to 54.16%
in 2001. Women’s work participation rate, which was 19.7% in 1981, rose to 25.7% in
2001. The data base also brings out the areas where the progress has been slow if not
retrograde. The sex ratio in the 0-6 years age group dropped from 945 in 1991 to 927 in
2001, which indicates that society still does not welcome a girl child and the preference
rests with sons. Nearly 50% women get married before they attain 18 years of age, and
57.9% pregnant women and 56.2% married women suffer from anaemia. Maternal Mortality
Rate (MMR) is quite high, at. 301 maternal deaths per 100,000 live births in 2006. Thus,
there is room for much more to be done to ameliorate the plight of women at the grass root
level.
Since the Eleventh Five-Year Plan has just taken off, a comprehensive picture of the
‘Situation of Women and Girls in India’ would be a useful reference base. This document is
an effort to capture statistically the situation of women and girls in India, as revealed on
many social indicators which are available in widely scattered sources. Various indicators
covered in this document are: demography and vital statistics; health and nutritional status;
education; girl child; work participation of women and children; support measures for women,
including women in distress; political participation of women and women in decision making;
prevalence of disability; crime against women and children; food security; household
expenditure; budget outlays for women in the Union Budget and Budget of the Ministry of
Women and Child Development; and voluntary organisations involved in the social
development activities.
The document has taken shape and come out due to the efforts of a team of officers
and staff of the Institute. Dr. Dinesh Paul, Additional Director and Dr. Sulochana Vasudevan,
Joint Director, Women’s Development Division, provided support and guidance to a team
headed by Ms. Meenakshi Sood, and comprising Ms. S.K. Sobti, Ms. Meenu Kapur,
Ms. Punita Mathur, and Dr. Anindita Shukla, who all have painstakingly compiled and
updated the information and statistics several times over. While Ms. Sandeepa Jain, Shri
Pawan Kumar, Ms. Subha Laxmi Behera and Shri Ashok Mahato provided computer

assistance, Shri A.J. Kaul, Publications Officer and other officials of the Common Services
Division were instrumental in ensuring the timely publication of the document. It would be
remiss on my part if I do not acknowledge the contribution of various Government
Departments, autonomous organisations, UN agencies, international organisations,
research institutes and voluntary organisations, who extended full cooperation and shared
their documents with us.
The document shows at a glance statistics on indicators which are available in various
published sources. We have put in the effort with the hope that this document would be a
useful asset to researchers, planners, academicians, media persons, and others concerned
with issues related to women’s empowerment.
(A. K. Gopal)
Director

Contents
Subject Page No.
List of Tables and Figures
1. Measures for Women’s Empowerment 1
- Introduction 1
- Perspectives on Advancement of Women through Five Year Plans 1
- International Policies and India’s Constitutional Provisions,
Policies and Programmes for Women 3
- Schemes for Assistance 4
- Policy Documents 9
2. Demography and Vital Statistics 15
3. Girl Child 109
4. Early Marriage 112
5. Child Labour 115
6. Health and Nutrition 118
7. Education 156
8. Women and Economy 168
9. Support Services to Women 238
10. Crime against Women and Children 266
11. Gender Development Index 290
12. Political Participation of Women and Women in Decision Making 294
13. Women and Disability 306
14 Household Consumer Expenditure 317
15. Budget Outlays 326
16. Annexures
- Goals to be Achieved by 2010 A.D. set by the 336
National Population Policy 2000
- The United Nations Millennium Declaration 337
Goals for Development and Poverty Eradication till 2015 A.D.
- Definitions 338
ix

x
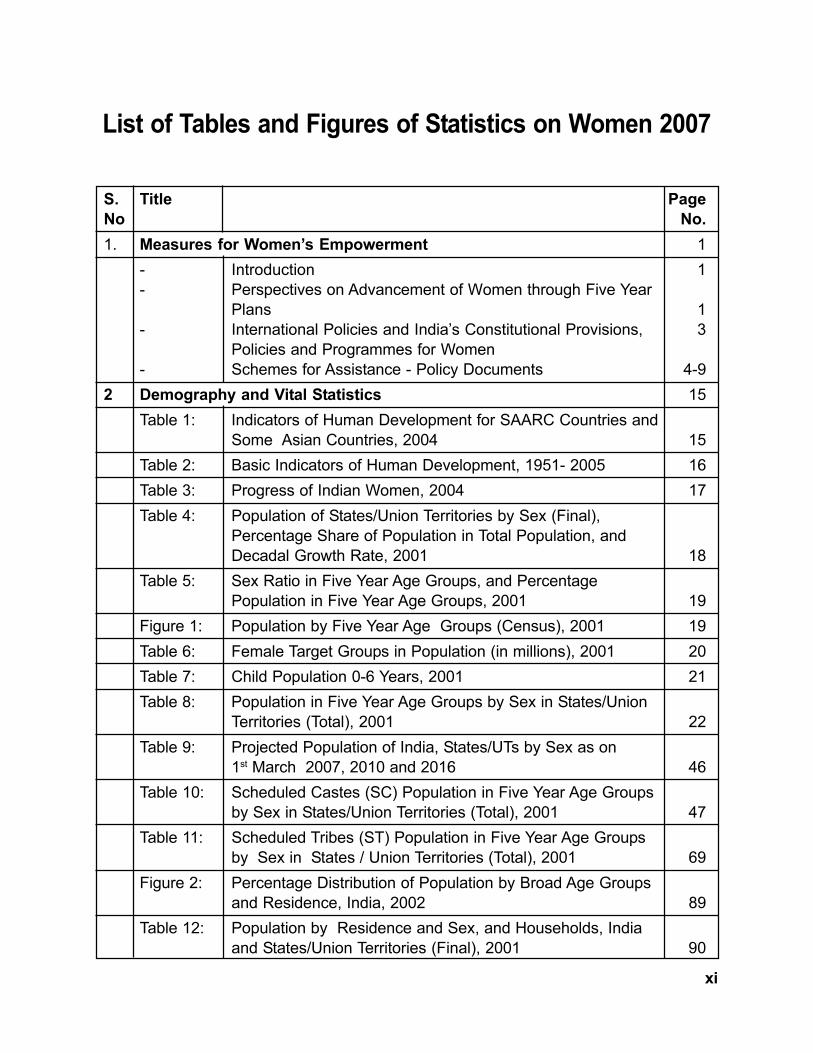
List of Tables and Figures of Statistics on Women 2007
S. Title Page
No No.
1. Measures for Women’s Empowerment 1
- Introduction 1
- Perspectives on Advancement of Women through Five Year
Plans 1
- International Policies and India’s Constitutional Provisions, 3
Policies and Programmes for Women
- Schemes for Assistance - Policy Documents 4-9
2 Demography and Vital Statistics 15
Table 1: Indicators of Human Development for SAARC Countries and
Some Asian Countries, 2004 15
Table 2: Basic Indicators of Human Development, 1951- 2005 16
Table 3: Progress of Indian Women, 2004 17
Table 4: Population of States/Union Territories by Sex (Final),
Percentage Share of Population in Total Population, and
Decadal Growth Rate, 2001 18
Table 5: Sex Ratio in Five Year Age Groups, and Percentage
Population in Five Year Age Groups, 2001 19
Figure 1: Population by Five Year Age Groups (Census), 2001 19
Table 6: Female Target Groups in Population (in millions), 2001 20
Table 7: Child Population 0-6 Years, 2001 21
Table 8: Population in Five Year Age Groups by Sex in States/Union
Territories (Total), 2001 22
Table 9: Projected Population of India, States/UTs by Sex as on
1st March 2007, 2010 and 2016 46
Table 10: Scheduled Castes (SC) Population in Five Year Age Groups
by Sex in States/Union Territories (Total), 2001 47
Table 11: Scheduled Tribes (ST) Population in Five Year Age Groups
by Sex in States / Union Territories (Total), 2001 69
Figure 2: Percentage Distribution of Population by Broad Age Groups
and Residence, India, 2002 89
Table 12: Population by Residence and Sex, and Households, India
and States/Union Territories (Final), 2001 90
xi

S. Title Page
No No.
Table 13: Population by Rural Urban Residence and Urban
Population (%), 2001 93
Table 14: Birth Rate, Death Rate and Natural Growth Rate, 2005 94
Table 15: Infant Mortality Rate (IMR) 2005 and Child Mortality
Rate, 2000 95
Table 16: Infant Mortality Rate, Sex-wise and Rural Urban
Distribution, 2005 97
Table 17 : Sex Ratio, Expectation of Life at Birth, Maternal Mortality
Rate, 2001-2006 98
Table 18 : Sex Ratio of Select Countries, 1998 and 2007 100
Table 19: Sex Ratio, India, 1901-2001 100
Table 20: Sex Ratio of Total Population and Child Population in the
Age Group 0-6 Years, 1991 and 2001 101
Table 21: Sex Ratio (Females per 1000 Males) and Sex Ratio
Children Aged 0-4 Years, 2002-2004 103
Table 22: Percentage Distribution of Adolescent Population and
Projected Adolescent Population by Sex and Age Group,
1981-2016 103
Table 23 : Age-specific Fertility Rates (ASFRs) in India and Bigger
States, 2004 104
Table 24 : Total Marital Fertility Rate (TMFR) by Residence India and
Bigger States, 1999 and 2004 105
Table 25 : Under Five Death Rates by Sex and Residence India and
Bigger States, 2004 106
Table 26: Distribution of Deaths to Total Deaths in India by Residence,
Sex and Age Group (Percentage), 2004 107
Table 27: Percentage Distribution of Deaths Due to Causes Related to
Child Birth and Pregnancy, 2003 108
3 Girl Child 109
Table 28: Discrimination against the Girl Child, 2003-2004 110
Table 29: Sex Preference of Women with Two Children Living,
Wanting No More Children, (%), 2006 111
4 Early Marriage 112
Table 30: Incidence of Early Marriage in India, 2006 & Early
Motherhood in India, 2001 113
xii

S. Title Page
No No.
Table 31: Distribution of Population Age 10+ by Marital Status and
Sex in India and Bigger States, (Percentage), 2004 114
5 Child Labour 115
Table 32: Child Labour in India, 1991 and 2000 116
Table 33: Child Labour Census, 1971-2001 117
6 Health and Nutrition 118
Table 34 : Commitment to Health : Access, Services and Resources,
2005 118
Table 35 : Urban Health Infrastructure, 2005-06 119
Table 36: Rural Habitations Having Safe Drinking Water, 2004 120
Table 37: Number of Primary Health Centres (PHC),Community
Health Centres (CHC), Doctors, Lady Health Visitors (LHVs),
and Multi-Purpose Workers(Female)/ Auxiliary Nurse
Midwives (ANM) in Rural Areas, 2005 121
Table 38 : Safe Delivery and Assisted Delivery among Women, 2006 122
Table 39 : Mothers Receiving Antenatal and Post Natal Care, 2006 123
Table 40: Decision Making by Ever Married Women Aged 15-49
Years on Own Health Care (Percentage), 1998-99. 124
Table 41: Child Immunization and Vitamin A Supplementation, 2006 125
Table 42: Major Causes of Infant Mortality in India, 2003 126
Table 43: Burden of Neonatal Deaths in India State-wise, 2002 126
Table 44: Percentage Distribution of Deaths for Selected Major Cause
Groups by Age and Sex, 2000 127
Table 45: Age-wise Total Deaths in India by Major Cause Group
(Percentage), 2000. 128
Table 46: Age and Sex-Wise Total Deaths in India by Major Cause
Group (Percentage), 2000. 129
Table 47: Percentage Distribution of Ten Top Killer Diseases of
Infants (Below One year) in Rural India, 1998 130
Table 48: Child Deaths in 1-4 Years Age Group by Major Cause
Groups Sex-wise, 2000 131
Table 49: Ten Top Killer Diseases of Children 1-4 Years by Specific
Causes, 1998 132
Table 50: Child Deaths in 5-14 Years Age Group by Major Cause
Groups Sex-wise, 2000 133
xiii
S. Title Page
No No.
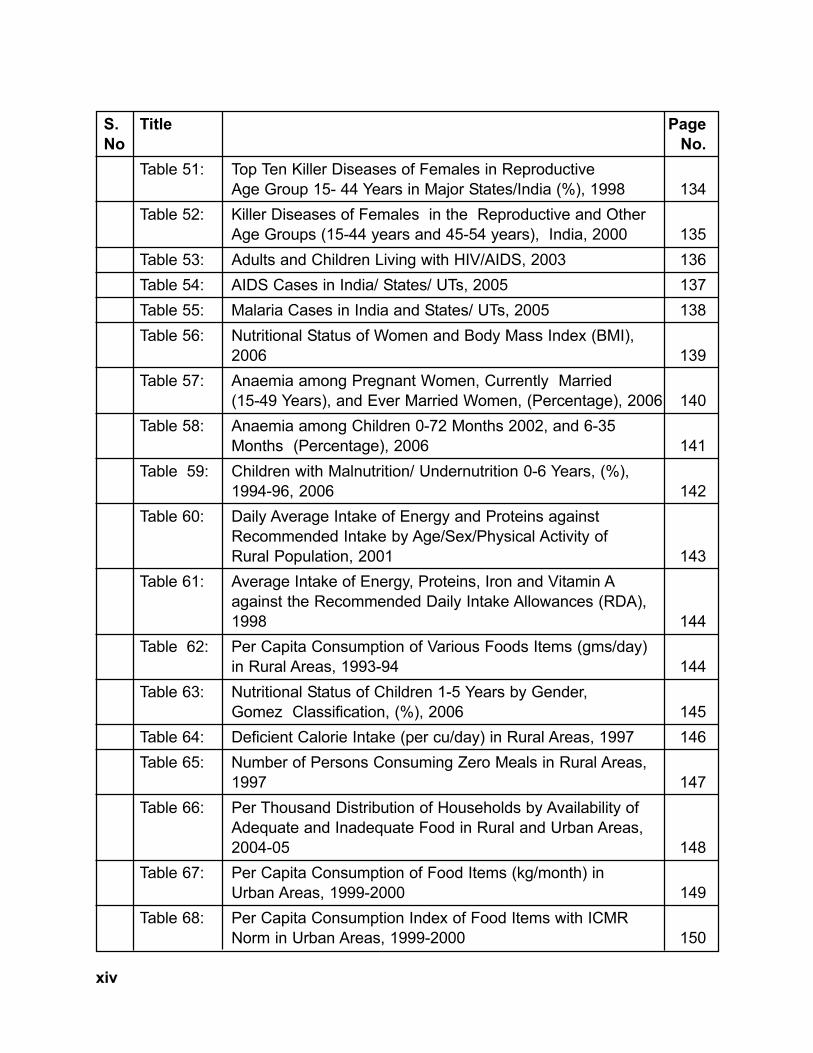
Table 51: Top Ten Killer Diseases of Females in Reproductive
Age Group 15- 44 Years in Major States/India (%), 1998 134
Table 52: Killer Diseases of Females in the Reproductive and Other
Age Groups (15-44 years and 45-54 years), India, 2000 135
Table 53: Adults and Children Living with HIV/AIDS, 2003 136
Table 54: AIDS Cases in India/ States/ UTs, 2005 137
Table 55: Malaria Cases in India and States/ UTs, 2005 138
Table 56: Nutritional Status of Women and Body Mass Index (BMI),
2006 139
Table 57: Anaemia among Pregnant Women, Currently Married
(15-49 Years), and Ever Married Women, (Percentage), 2006 140
Table 58: Anaemia among Children 0-72 Months 2002, and 6-35
Months (Percentage), 2006 141
Table 59: Children with Malnutrition/ Undernutrition 0-6 Years, (%),
1994-96, 2006 142
Table 60: Daily Average Intake of Energy and Proteins against
Recommended Intake by Age/Sex/Physical Activity of
Rural Population, 2001 143
Table 61: Average Intake of Energy, Proteins, Iron and Vitamin A
against the Recommended Daily Intake Allowances (RDA),
1998 144
Table 62: Per Capita Consumption of Various Foods Items (gms/day)
in Rural Areas, 1993-94 144
Table 63: Nutritional Status of Children 1-5 Years by Gender,
Gomez Classification, (%), 2006 145
Table 64: Deficient Calorie Intake (per cu/day) in Rural Areas, 1997 146
Table 65: Number of Persons Consuming Zero Meals in Rural Areas,
1997 147
Table 66: Per Thousand Distribution of Households by Availability of
Adequate and Inadequate Food in Rural and Urban Areas,
2004-05 148
Table 67: Per Capita Consumption of Food Items (kg/month) in
Urban Areas, 1999-2000 149
Table 68: Per Capita Consumption Index of Food Items with ICMR
Norm in Urban Areas, 1999-2000 150
xiv

S. Title Page
No No.
Table 69: Cereal Consumption and Calorie Intake in Urban Areas,
1999-2000 151
Table 70: Foodgrains Allotted and Funds Released under Nutrition
Programme for Adolescent Girls (NPAG), 2006-07 152
Table 71: Kishori Shakti Yojana (KSY) Blocks Sanctioned, 2006-07 154
7 Education 156
Table 72: Literacy Rate of Population Aged 7 Years and Above in 2001,
and Children Aged 11-14 Years in School (%), 1998-99. 157
Table 73: Gross Enrolment Ratio in Schools for General Education
(All Students) as on 30.9.2004, 2004-2005 159
Table 74: Girls Enrolled per 100 Boys Enrolled, 2004-05 160
Table 75: Gross Enrolment Ratio for Scheduled Castes (SC) Students
(as on 30.9.2004), (Percentage), 2004-2005 161
Table 76: Gross Enrolment Ratio of Scheduled Tribes (ST) Students
(as on 30.9.2004), 2004-2005 162
Table 77: School Dropout Rate Classes I-X, (%), 2004-2005 163
Table 78: School Dropout Rates of Scheduled Castes (SC) Students
Classes I-X, (%), 2004-2005 164
Table 79: School Dropout Rates of Scheduled Tribes (ST) Students
Classes I-X, (%), 2004-2005 165
Table 80: Reasons for Children Not Attending School in India, 1999 166
Table 81: Preschool Education Gender-wise, 2004-05 167
8 Women and Economy 168
Table 82: Workforce Participation Rate by Sex and Residence in India,
States and Union Territories, (Percentage), 2001 169
Figure 3: Workforce Participation Rate in India, (%), 2001 170
Table 83: Total Workers, Main Workers, Marginal Workers,
(Cultivators, Agricultural Labourers, Household Industry
Workers, Other Workers), Non-Workers by Residence and
Sex, India, 2001 171
Table 84: Women in Public and Private Sectors by Industrial
Activity, 2004 172
Table 85: Work Participation Rate, Main and Marginal Workers by Sex
(Percentage), 1991 and 2001 173
xv

S. Title Page
No No.
Table 86: Total Workforce Population, Main and Marginal Workers,
by Residence and Sex, India and States/Union Territories,
2001 174
Table 87: Child Labour, Women Labour, and Labour, 2001 177
Table 88 : Proportion of Main Workers to Total Population, (%), 2001 218
Table 89: Employment of Women in the Organised Sector State-wise,
2005 222
Table 90: Women’s Employment in the Organised Sector by Major
Industry Divisions, as on 31.03.2004 and 31.03.2005 223
Table 91: Women’s Employment in the Organised Sector
(Public and Private) as on 31.03.2004 223
Table 92: Work Participation Rates by Sex and Residence,
(Percentage), 1981 to 2001 224
Table 93: Job Seekers Registered with Employment Exchanges in
India, 2005 224
Table 94: Unemployment Rates for States and Union Territories by
Sex and Rural Urban Status, (Percentage), 2004-2005 226
Table 95: Population below Poverty Line in India, and State Specific
Poverty Line, 1999-2000. 228
Table 96: Number of Homeless Households and Homeless Persons
by Sex and Rural Urban Residence, 2001 230
Table 97: Per Capita Net State Domestic Product at Current Prices,
2003-05 232
Table 98: Projects Sanctioned under Swawlamban and STEP
(Support to Training and Employment Programme) for
Women, 2006-07 234
Table 99: Beneficiaries under Swarnjayanti Gram Swarozgar Yojana
(SGSY) (as on 9.2.2007), 2006-07 235
Table 100: Loans Disbursed under Rashtriya Mahila Kosh and
Beneficiaries, 2006 237
9 Support Services to Women 238
Table 101: Working Women’s Hostels Sanctioned, Women Benefited,
Hostels with Day Care Centres and Children Benefited,
(as on 31.3.2004), 2004 241
Table 102: Self Help Groups Formed under Swayamsidha, 2006-07 242
xvi

S. Title Page
No No.
Table 103: Short Stay Homes (SSH), Funds Released, and SSH
Beneficiaries as on 31.03.2006 244
Table 104: Projects Sanctioned under ICDS Scheme (Integrated Child
Development Services Scheme) as on 30.09.2006 246
Table 105: Creches Sanctioned and Beneficiaries, 2006 247
Table 106: Condensed Courses of Education (CCE) for Women,
2005-06 249
Table 107: Family Counselling Centres (FCC), 2006 250
Table 108: Projects Sanctioned under Swadhar Scheme as on
20.12.2005, and Funds Released, 2006-07 251
Table 109: Women’s Helplines, 2005 258
Table 110: Mahila Mandal Programme Beneficiaries, 2004-05. 260
Table 111: Awareness Generation Camps, 2005 262
Table 112. Female Headed Households (FHH) per 1000 Households
in India/States and UTs, 2005 264
10 Crime against Women and Children 266
Table 113: Victims of Rape by Age Group, 1991-2005 268
Table 114: Incidence and Rate of Crime against Children, 2005 269
Table 115: Crime against Children – Murder and Infanticide, 2005 270
Table 116: Crime against Children – Rape, Kidnapping and Abduction,
Foeticide, 2005 271
Table 117: Crime against Children – Abetment of Suicide, Exposure and
Abandonment, Child Marriage Restraint Act, 2005 272
Table 118: Crime against Children – Procuration of Minor Girls, Buying
of Girls for Prostitution, Selling of Girls for Prostitution, 2005 273
Table 119: Crime against Children – Other Miscellaneous Crime against
Children, 2005 274
Table 120: Crime against Women, 2005 275
Figure 4: Crime against Women (%) Distribution, 2005 276
Table 121: Incidence and Rate of Crime Committed against Women,
2005 277
Table 122: Age Group-wise Victims of Rape Cases (Total), 2005 278
Table 123: Crime against Women – Dowry Deaths, Cruelty by Husband
and Relatives, and Dowry Prohibition Act, 2005 279
xvii

S. Title Page
No No.
Table 124: Crime against Women – Kidnapping and Abduction,
Molestation, Eve-Teasing, Sexual Harassment and Indecent
Representation of Women (P) Act, 2005 281
Table 125 : Crime against Women – Immoral Traffic (P) Act, and
Importation of Girls, 2005 282
Table 126 : Ever Married Women Who Have Experienced Spousal
Violence, 2006 283
Table 127: Persons Arrested under IPC Crimes (Crime Head-wise
and Gender-wise), 2005 284
Table 128: Persons Arrested for Total Cognizable Crimes under IPC
State-wise, 2005 285
Table 129: Persons Arrested under SLL Crimes by Crime Head and
Sex-wise, 2005 286
Table 130: Persons Arrested under Different SLL Crimes State-wise,
2005 287
Table 131: Women Prisoners in Jails, 2005 288
Table 132: Number of Women Prisoners in Jails, and Women Prisoners
with Children, 2005 289
11 Gender Development Index 290
Table 133: Gender Development Index, 2002-06 291
12 Political Participation of Women and Women in Decision Making 294
Table 134: Representation of Women in the Central Council of
Ministers, 2006 294
Table 135: Number of Judges by Sex in Supreme Court/ High Courtsas on 23.12.2005 295
Table 136: Women in Bureaucracy, Indian Administrative Service (IAS)and Police, 2000 296
Table 137: Personnel by Sex in All India and Central Services, andOther Positions, 2005-06 297
Table 138: Seats in the Lok Sabha, Number and Type of Constituencies 299
Table 139: Political Participation and Decision-making by Women,2000-2006 300
Figure 5: Elected Women Members of Parliament, 2004 301
Table 140: Number of Elected Total and Women PanchayatRepresentatives in the Three Tiers of Panchayati Raj
State-wise as on 01.04.2006 302
xviii

S. Title Page
No No.
Table 141: Percentage of Women Representatives in Panchayati Raj
Institutions (PRI), 2006 303
Table 142: Women’s Representation in Parliament, 1952-2004 304
Table 143: Women MPs in Thirteenth and Fourteenth Lok Sabha
Party-wise, 2004 305
13 Women and Disability 306
Table 144: Disabled Persons in India, 2001 306
Table 145: Disabled Population by Type of Disability in India State-wise,
2001 307
Table 146: Disabled Population in Seeing, Speech, Hearing, Movement
and Mental Handicap, Rural, Urban India, 2001 308
14 Household Consumer Expenditure 317
Table 147: Average Monthly Expenditure ( Rs.) Per Person on
Groups of Items of Consumption for Selected States/UTs in
Rural and Urban Areas, 2004-05 318
Table 148: Average Monthly Per Capita Consumption Expenditure (Rs.)
in Rural and Urban Areas of Selected States/UTs, 2004-05 325
15 Budget Outlay 326
Table 149: Union Budget Plan Outlay for Major Schemes in Social
Sectors, 2006-07 (RE) and 2007-08 (BE) 326
Table 150: Budget, Revised Estimates and Resource Allocation for
the Plans and Programmes of the Ministry of Women and
Child Development, 2007-2008 334
Table 151: Voluntary Organizations Assisted by Various Government
Ministries, 2005 335
Annexure 1 Goals to be Achieved by 2010 A.D. set by the National
Population Policy 2000 336
Annexure 2 The United Nations Millennium Declaration’s Goals for
Development and Poverty Eradication till 2015 A.D. 337
Annexure 3 Definitions 338
xix

Statistics on Women in India 2007
1
1. Measures for Women’s Empowerment
Introduction
India attained freedom from British rule on 15th August 1947. India was declared a
sovereign Democratic Republic on 26th January 1950. On that date the Constitution of
India came into force.
All citizens of India are guaranteed social, economic and political justice, equality of
status and opportunities before law by the Constitution. Fundamental freedom of expression,
belief, faith, worship, vocation, association and action are guaranteed by the Indian
Constitution to all citizens- subject to law and public morality.
The Constitution of India - Provisions Relating to Women
The Constitution of India not only grants equality to women, but also empowers the
State to adopt measures of positive discrimination in favour of women for removing the
cumulative socio-economic, educational and political disadvantages faced by them.
Advancement of Women through Five Year Plans
There has been a progressive increase in the plan outlays over the last six decades of
planned development to meet the needs of women and children. The outlay of Rs. 4
crores in the First Plan (1951-56) has increased to Rs. 7,810.42 crores in the Ninth Five
Year Plan, and Rs. 13,780 crores in the Tenth Five Year Plan. There has been a shift from
“welfare” oriented approach in the First Five Year Plan to “development” and “empowerment”
of women in the consecutive Five Year Plans.
Perspectives on Advancement of Women through Five Year Plans
First Five Year Plan It was mainly welfare oriented as far as women’s issues were
(1951-56) concerned.The Central Social Welfare Board (CSWB) undertook
a number of welfare measures through the voluntary sector. The
programmes for women were implemented through the National
Extension Service Programmes through Community Development
Blocks.
Second Five Year Efforts were geared to organise “Mahila Mandals” (women’s
Plan (1956-61) groups) at grass-roots levels to ensure better implementation of
welfare schemes.
Third, Fourth, Fifth They accorded high priority to women’s education. Measures to
and other Interim improve maternal and child health services, and supplementary
Plans (1961-74) feeding for children, nursing and expectant mothers were also
introduced.

Statistics on Women in India 2007
2
Sixth Five Year This is regarded as a landmark in women’s development. The Plan
Plan (1980-85) adopted a multidisciplinary approach with a three-pronged thrust
on health, education and employment of women.
Seventh Five Year Development programmes for women were continued, with the
Plan (1985-90) objective of raising their economic and social status and bring them
into the mainstream of national development. A very significant
step therein was to identify and promote “beneficiary-oriented
programmes” which extended direct benefits to women.
Eighth Five Year It attempted to ensure that the benefits of development from
Plan (1992-97) different sectors did not bypass women. Special programmes were
implemented to complement the general development
programmes. The flow of benefits to women in the three core
sectors of education, health and employment were monitored
vigilantly. Women were enabled to function as equal partners and
participants in the developmental process with reservation in the
membership of local bodies. This approach of the Eighth Plan
marks a definite shift from ‘development’ to empowerment’ of
women.
Ninth Five Year The Ninth Five Year Plan envisaged : a) Empowerment of women
Plan (1997-2002) and socially disadvantaged groups such as Scheduled Castes,
Scheduled Tribes and Other Backward Classes and Minorities as
agents of socio-economic change and development. b) Promoting
and developing people’s participatory institutions like Panchayati
Raj institutions, cooperatives and self-help groups.c) Strengthening
efforts to build self-reliance.d) The convergence of services from
different sectors.e) A women’s component plan at the Central and
State levels.
Tenth Five Year The Tenth Five Year Plan was formulated to ensure requisite access
Plan (2002-2007) of women to information, resources and services, and advance
gender equality goals.
Eleventh Five Year The Eleventh Five Year Plan proposes to undertake special
Plan(2007-2012) measures for gender empowerment and equity. The Ministry of
Women and Child Development would make synergistic use of
gender budget and gender mainstreaming process.
Source: India, Planning Commission. (2007). Five Year Plans. New Delhi.

Statistics on Women in India 2007
3
International Policies and India’s Constitutional Provisions, Policies and
Programmes for Women
UN Human Rights Instruments
♦ Universal Declaration of Human Rights - adopted in 1948
♦ International Covenant on Economic, Social and Cultural Rights – adopted in 1966 /
entered into force in 1976, monitored by the Committee on Economic, Social and Cultural
Rights (CESCR)
♦ International Convention on the Elimination of All Forms of Racial Discrimination -
adopted in 1965 / entered into force in 1969, monitored by the Committee on the
Elimination of Racial Discrimination (CERD)
♦ Convention on the Elimination of All Forms of Discrimination Against Women - adopted
in 1979 / entered into force in 1981, monitored by the Committee on CEDAW
♦ Convention Against Torture and Other Cruel Inhuman or Degrading Treatment or
Punishment - adopted in 1984 / entered into force in 1987, monitored by Committee
Against Torture (CAT)
♦ Convention on the Rights of the Child - adopted in 1989 / entered into force in 1990,
monitored by the Committee on the Rights of the Child (CRC)
Commitments at UN Conferences
♦ World Conference on Education for All (1990) Jomtien
♦ UN Conference on Environment and Development (1992) Rio de Janiero
♦ Second UN World Conference on Human Rights (1993) Vienna
♦ International Conference on Population and Development (1994) Cairo
♦ World Summit on Social Development (1995) Copenhagen
♦ Fourth World Conference on Women (1995) Beijing
♦ Second UN Conference on Human Settlements (1996) Istanbul
♦ World Food Summit (1997) Rome
♦ Education for All Dakar Framework (2000) Dakar
Constitution of India Guarantees
♦ Equality Before Law for Women (Article 14)
♦ The State not to discriminate against any citizen on grounds only of religion, race,
caste, sex, place of birth or any of them [Article 15 (I)]
♦ The State to make any special provision in favour of women and children [Article 15
(3)]

Statistics on Women in India 2007
4
♦ Equality of opportunity for all citizens in matters relating to employment or appointment
to any office under the State (Article 16)
♦ The State to direct its policy towards securing for men and women equally the right to
an adequate means of livelihood [Article 39 (a)]; and equal pay for equal work for both
men and women [Article 39 (d)]
♦ To promote justice, on a basis of equal opportunity and to provide free legal aid by
suitable legislation or scheme or in any other way to ensure that opportunities for securing
justice are not denied to any citizen by reason of economic or other disabilities [Article
39A)
♦ The State to make provision for securing just and humane conditions of work and for
maternity relief (Article 42)
♦ The State to promote with special care the educational and economic interests of the
weaker sections of the people and to protect them from social injustice and all forms of
exploitation (Article 46)
♦ The State to raise the level of nutrition and the standard of living of its people and the
improvement of Public Health (Article 47)
♦ To promote harmony and the spirit of common brotherhood amongst all the people of
India and to renounce practices derogatory to the dignity of women [Article 51(A) (e)]
♦ Not less than one-third (including the number of seats reserved for women belonging
to the scheduled castes and the scheduled tribes) of the total number of seats to be
filled by direct election in every panchayat to be reserved for women and such seats to
be allotted by rotation to different constituencies in a panchayat [Article 243 D (3)]
♦ Not less than one-third of the total number of offices of chairpersons in the panchayats
at each level to be reserved for women [Article 243 D (4)]
♦ Not less than one-third (including the number of seats reserved for women belonging
to the scheduled castes and the scheduled tribes) of the total number of seats to be
filled by direct election in every municipality to be reserved for women and such seats
to be allotted by rotation to different constituencies in a municipality [Article 243 T (3)]
♦ Reservation of offices of chairpersons in municipalities for the scheduled castes, the
scheduled tribes and women in such manner as the legislature of a State may by law
provide [Article 243 T (4)]
Source: India, Ministry of Statistics and Programme Implementation, Central Statistical Organisation. (2002).
Women and Men in India 2001. New Delhi. P. v-vi.
Schemes for Assistance
Ministry of Women and Child Development
� Support to Training and Employment Programme (STEP)
� Swawlamban, erstwhile Setting up of Employment and Income Generating Training-
cum-Production Units for Women (NORAD)

Statistics on Women in India 2007
5
� Construction/Expansion of Hostel Building for Working Women with a Day Care Centre
� Balika Samriddhi Yojana (BSY)
� National Programme for Adolescent Girls (Kishori Shakti Yojana)
� Homes for Infants and Young Children for Promotion of In-Country Adoption
� Scheme for Street Children
� Scheme for Welfare of Working Children and Children in Need of Care and Protection
� Prevention and Control of Juvenile Maladjustment
� Integrated Child Protection Scheme (ICPS)
� Conditional Cash Transfer Scheme for the Girl Child with Insurance Cover
� General Grant-in-Aid for Voluntary Organisations in the Field of Women and Child
Development
Central Social Welfare Board (CSWB)
� General Grant-in-Aid for Voluntary Organisations in the field of Women and Child
Development
� Awareness Generation Programme (AGP)
� Condensed Courses of Education for Women and Vocational Training (CCE & VT)
� Rajiv Gandhi National Creche Scheme for the Children of Working Mothers 1994
� Family Counselling Centres (FCC)
� Mahila Mandal Programme (MMP)
� Short Stay Homes for Women and Girls (SSH)
� Socio-Economic Programme (SEP)
� Working Women’s Hostels (WWH)
Other Schemes
� Integrated Child Development Services (ICDS)
� The Swa-Shakti Project, a scheme for Rural Women’s Development and Empowerment
� Swayamsidha, an Integrated Scheme for Women’s Empowerment
� Swadhar, Scheme for Women in Difficult Circumstances
� Rashtriya Mahila Kosh (Credit for Women)
� Scheme for Rescue of Victims of Trafficking
� Priyadarshini

Statistics on Women in India 2007
6
Department of Education, Ministry of Human Resource Development
� Sarva Shiksha Abhiyan (SSA)
� Prarambhik Shiksha Kosh (PSK)
� District Primary Education Programme (DPEP)
� National Programme for Education of Girls at Elementary Level (NPEGEL)
� Kasturba Gandhi Balika Vidayalaya (KGBV)
� Kendriya Vidyalayas (KV)
� Navodaya Vidayalayas (NV)
� Mid-Day Meal Scheme (MDM)
� National Institute of Open Schooling
� Integrated Education for the Disabled Children (IEDC)
� Focus on Minority Areas
� National Literacy Mission (NLM)
� Jan Shikhan Sansthan (JSS)
� Mahila Samakhya : Education for Women’s Equality
Ministry of Rural Development
� Swarnjayanti Gram Swarozgar Yojana (SGSY)
� Sampoorna Grameen Rozgar Yojana (SGRY)
� National Social Assistance Programme (NSAP) and Annapurna
� National Rural Employment Guarantee Act (NREGA)
� National Food for Work Programme (NFWP)
� Cash Component for Food for Work Programme
� Foodgrains Component
� Indira Awaas Yojana (IAY)
� Accelerated Rural Water Supply Programme (ARWSP)
� Rural Sanitation
� Pradhan Mantri Gram Sadak Yojana (PMGSY)
� Provision of Urban Amenities in Rural Areas (PURA)

Statistics on Women in India 2007
7
Ministry of Housing and Urban Poverty Alleviation
� The Swarna Jayanti Shahari Rozgar Yojana (SJSRY)
� Jawahar Lal Nehru National Urban Renewal Mission
� Low Cost Sanitation Programme
� Valmiki Ambedkar Awas Yojana (VAMBAY)
Ministry of Social Justice and Empowerment
� Book Banks for Scheduled Caste Students
� Hostels for OBC Boys and Girls
� Hostels for Scheduled Caste Girls and Boys
� Scheme of Pre-Matric Scholarship to the Children of Scheduled Castes and OBCs
� Post Matric Scholarship to Students belonging to Scheduled Castes and OBCs
� Scheme of Assistance to Voluntary Organisations to provide Social Defence Services
� Scheme of Pre-examination Coaching for Weaker Sections based on Economic Criteria
� Aids and Appliances for the Handicapped
� Schemes for Implementation of Persons with Disability Act
� Education Work for Prohibition and Drug Abuse Prevention
Ministry of Tribal Affairs
� Book Bank Scheme for Scheduled Tribe Students
� Coaching and Allied Scheme for Scheduled Tribes
� Construction of Hostels for Scheduled Tribe Girls and Boys
� Educational Complex in Low Literacy Pockets for Development of Women’s Literacy in
Tribal Areas
� Post Matric Scholarship for Scheduled Tribes Students
� Scheme for the Development of Primitive Tribal Groups
� Scheme of Ashram Schools
� Scheme of Assistance to State Scheduled Tribes Finance and Development Corporation
(STFDCs)
� Scheme of Grant–In–Aid to Voluntary Organisations Working for Welfare of the
Scheduled Tribes
� Village Grain Banks Scheme, Protection of Tribals from Starvation

Statistics on Women in India 2007
8
� Vocational Training in Tribal Areas
Ministry of Small Scale Industry
� Trade Related Entrepreneurship Assistance and Development for Women Scheme
(TREAD)
Ministry of Science and Technology
� Science and Technology Programmes for Socio Economic Development
Ministry of Health and Family Welfare
� Reproductive and Child Health Programme (Maternal Health and Child Health)
� National Rural Health Mission
� Pradhan Mantri Gramodaya Yojana for Primary Health Sector
� Universal Immunization Programme
� Pulse Polio Immunization Programme
� Prophylaxis Programme to Prevent Blindness due to Vitamin A Deficiency
� Prophylaxis Programme to Prevent Anaemia due to Iron Deficiency
� Prophylaxis Programme to Prevent Iodine Deficiency Disorders (Goitre)
� Janani Suraksha Yojana (National Maternity Benefit Scheme)
� National Mental Health Programme
� Rashtriya Arogya Nidhi (Financial Assistance to BPL Patients)
� National AIDS Control Programme
� National Diseases Control Programmes (TB, Leprosy, Malaria, etc.)
Ministry of Agriculture and Cooperation
� Assistance to NCDC for Co-operatives Development
Ministry of Labour
� Improvement in Working Conditions of Child and Women Labour
� Vocational Training for Women
� Diversification and Extension of Vocational Training Programmes for Women
� Establishment of Regional Vocational Training Institutes (RVTI)
� Establishment of Placement Cells and Conducting Training Needs Assessment
� Grants-in-Aid for State Governments for Establishing Women Industrial Training Institutes
(ITI)

Statistics on Women in India 2007
9
� Social Security for Unorganised Sector Workers
� Rehabilitation of Bonded Labour
Ministry of Minority Affairs
� Grants-in-Aid to Maulana Azad Education Foundation
� Coaching and Allied Scheme for Minorities
� Pre-Matric Scholarship for Minorities
� Post -Matric Scholarship for Minorities
� Multi Sectoral Development Programme for Minorities in Selected Minority Concentration
Districts
� National Minorities Development Financial Corporation
Ministry of Consumer Affairs, Food and Public Distribution, Department
of Food and Public Distribution
� Village Grain Banks
� Strengthening of Public Distribution System
� Targeted Public Distribution System (TPDS)
� Antyodaya Anna Yojana (Foodgrains for Poor)
� Mid-Day Meal Scheme (Implemented by Department of Education)
� Wheat Based Nutrition Programme (WBNP) (Implemented by Ministry of Women and
Child Development under ICDS Scheme)
� Supply of Foodgrains to Hostels/Welfare Institutions (5% of BPL Allocation)
� Supply of Foodgrains for SC/ST/OBC Hostels
� Nutritional Programme for Adolescent Girls (NPAG) (Implemented by Ministry of Women
and Child Development)
Ministry of Environment and Forests
� Tree Pattas
� Joint Forest Management
Policy Documents
� National Commission for Self Employed Women and Women in the Informal Sector:
Shram Shakti Report 1988
� Committee on Status of Women in India – CSWI – Towards Equality 1975
� National Child Labour Policy 1987

Statistics on Women in India 2007
10
� National AIDS Control Policy 2002
� National Commission on Women Act 1990
� National Health Policy 2002
� National Nutrition Policy 1993
� National Perspective Plan 1988
� National Plan for Action 1976
� National Plan of Action for the Girl Child (1992-2000) – 1992
� National Policy for the Empowerment of Women 2001
� National Policy on Education 1986
� National Population Policy 2000
� Report of National Expert Committee on Women Prisoners 1987
� National Charter for Children 2004
� National Plan of Action for Children 2005
� Protocol for Pre-Rescue, Rescue and Post-Rescue Operations of Child Victims of
Trafficking
International Documents
� Beijing Declaration - Platform for Action
� Declaration of Mexico Plan
� Narobi Forward Looking Strategies
� United Nations Convention on the Elimination of All Forms of Discrimination Against
Women (UN CEDAW)
The Objectives of the National Policy for Empowerment of Women include
(i) Creating an environment through positive economic and social policies for full
development of women to enable them to realize their full potential
(ii) The de-jure and de-facto enjoyment of all human rights and fundamental freedom by
women on equal basis with men in all spheres - political, economic, social, cultural
and civil
(iii) Equal access to participation and decision making of women in social, political and
economic life of the nation
(iv) Equal access to women to health care, quality education at all levels, career and
vocational guidance, employment, equal remuneration, occupational health and safety,
social security and public office, etc.

Statistics on Women in India 2007
11
(v) Strengthening legal systems aimed at elimination of all forms of discrimination against
women
(vi) Changing societal attitudes and community practices by active participation and
involvement of both men and women
(vii) Mainstreaming a gender perspective in the development process
(viii) Elimination of discrimination and all forms of violence against women and the girl
child; and
(ix) Building and strengthening partnerships with civil society, particularly women’s
organizations
Critical Areas of Concern
A. Women and Poverty
� Strategic Objective: Review, adopt and maintain macroeconomic policies and
development strategies that address the needs and efforts of women in poverty
� Revise laws and administrative practices to ensure women’s equal rights and access
to economic resources.
� Provide women with access to savings and credit mechanisms and institutions.
B. Education and Training of Women
� Ensure equal access to education
� Eradicate illiteracy among women
� Improve women’s access to vocational training, science and technology, and
continuing education
� Develop non-discriminatory education and training
� Allocate sufficient resources for and monitor the implementation of educational
reforms
� Promote lifelong education and training for girls and women
C. Women and Health
� Increase women’s access throughout the life cycle to appropriate, affordable and
quality health care, information and related services
� Strengthen preventive programmes that promote women’s health
� Undertake gender-sensitive initiatives that address sexually transmitted diseases,
HIV/AIDS, and sexual and reproductive health issues
� Increase resources and monitor follow-up for women’s health
D. Violence against Women
� Take integrated measures to prevent and eliminate violence against women
� Study the causes and consequences of violence against women and the
effectiveness of preventive measures

Statistics on Women in India 2007
12
� Eliminate trafficking in women and assist victims of prostitution and trafficking
E. Women and Armed Conflict
� Increase the participation of women in conflict resolution at decision-making levels
and protect women living in situations of armed and other conflicts or under foreign
occupation
� Reduce excessive military expenditures and control the availability of armaments
� Promote nonviolent forms of conflict resolution and reduce the incidence of human
rights abuse in conflict situations
� Promote women’s contribution to fostering a culture of peace
� Provide protection, assistance and training to refugee women, other displaced
women in need of international protection and internally displaced women
� Provide assistance to women of the colonies and non-self governing territories
F. Women and Economy
� Promote women’s economic rights and independence, including access to
employment, appropriate working conditions and control over economic resources
� Facilitate women’s equal access to resources, employment, markets and trade
� Provide business services, training and access to markets, information and
technology, particularly to low income women
� Strengthen women’s economic capacity and commercial networks
� Eliminate occupational segregation and all forms of employment discrimination
� Promote harmonization of work and family responsibilities for women
G. Women in Power and Decision-making
� Take measures to ensure women’s equal access to and full participation in power
structures and decision-making
� Increase women’s capacity to participate in decision-making and leadership
H. Institutional Mechanisms for the Advancement of Women
� Create or strengthen national machineries and other government bodies
� Integrate gender perspectives in legislation, public policies, programmes and projects
� Generate and disseminate gender-disaggregated data and information for planning
and evaluation
I. Human Rights of Women
� Promote and protect the human rights of women, through the full implementation of
all human rights instruments, especially the Convention on the Elimination of All
Forms of Discrimination Against Women
� Ensure equality and non-discrimination under the law and in practice
� Achieve legal literacy

Statistics on Women in India 2007
13
J. Women and the Media
� Increase the participation and access of women to expression and decision-making
in and through the media and new technologies of communication
� Promote a balanced and non-stereotyped portrayal of women in the media
K. Women and the Environment
� Involve women actively in environmental decision-making at all levels
� Integrate gender concerns and perspective in policies and programmes for
sustainable development
� Strengthen or establish mechanism at the national, regional and international levels
to assess the impact of development and environmental policies on women
Women’s Empowerment
� The National Policy for the Empowerment of Women with the objective of bringing
about advancement, development and empowerment of women in all walks of life has
been formulated
� Stree Shakti Puraskars to honour and recognize the achievement and contribution of
individual women and institutions who have done outstanding work in the social sector
have been instituted
� Guidelines for operationalisation of District Level Committees on Violence against
Women and Helplines for women in distress have been issued
� A National level Committee to monitor Supreme Court’s Guidelines on prevention of
sexual harassment of women at workplace has been set up.
� A National Resource Centre for Women (NRCW) Portal has been set up to inform and
empower women, and lodge complaints of women’s rights violations on-line.
� Gender Budget analysis of various Ministries spending was undertaken to assess the
utilization of funds for women.
Programmes for Women
� Swawlamban, the erstwhile Training-cum-Employment Programme for Women provides
skill training to women to facilitate their employment or self- employment on a sustained
basis in traditional and non- traditional trades. Till December 2002, 902 projects including
262 continuing projects benefiting 58,458 women were sanctioned. With effect from
1.4.2006, Swawlamban is being transferred to the States. During 2005-06, 7660
beneficiaries availed benefits under the scheme.
� The Department has initiated the gender budgeting exercise to assess the impact and
outcome of Government spending on Women. Gender Budget Cells have been set up
in 9 Departments/Ministries namely, Health, Family Welfare, Elementary Education
and Literacy, Labour and Employment, Rural Development, Social Justice and
Empowerment, Tribal Affairs, Urban Employment and Poverty Alleviation and Small
Scale Industries.
� Measures have been initiated for preparing Gender Development Index for the States
and Districts.

Statistics on Women in India 2007
14
� Swayamsiddha, an integrated scheme for women’s empowerment, is based on the
formation of women into Self Help Groups (SHGs) and aims at the holistic empowerment
of women through awareness generation, economic empowerment and convergence
of various schemes. Against the target of 65,000 SHGs, 67,971 Women’s Self Help
Groups have been formed, covering a total of 989,485 beneficiaries.
� Swa-Shakti Project, a World Bank and International Fund for Agricultural Development
(IFAD) supported Project, was implemented in 57 districts of 9 States namely Haryana,
Bihar, Chhattisgarh, Gujarat, Jharkhand, Madhya Pradesh, Karnataka, Uttat Pradesh
and Uttarakhand. With partnership of 218 NGOs, 17,647 women’s Self Help Groups
have been formed benefiting 244,000 women.
� Support and Training for Employment Programme (STEP) provides updated skills and
new knowledge to poor and asset-less women in traditional occupations for enhancing
their productivity and income generation. A package of services such as training,
extension, infrastructure, market linkages, etc. is provided besides linkage with credit
for transfer of assets. Since its inception in 1987, about 655,222 women have been
covered under 138 projects till 2003. In 2004-05, 15,900 women and in 2005-06 19,200
women benefited under the programme. So far women in dairying sector have received
maximum support keeping in view the nature of demands. This is followed by handlooms,
handicrafts, sericulture, piggery and poultry.
Working Women’s Hostels
� 914 Working Women’s Hostels have been sanctioned benefiting 56,214 women, with
329 having Day Care Centres, benefiting 8681 children in 2004.
Legislative Reforms
� Comprehensive review of legislation affecting women has been undertaken by Sub-
Groups formed under the Task Force on Women and Children.
Status of Major International Human Rights Instruments
� International Convention on the Elimination of All Forms of Racial Discrimination 1965
� International Covenant on Civil and Political Rights 1966
� International Covenant on Economic, Social and Cultural Rights 1966
� Convention on the Elimination of All Forms of Discrimination Against Women 1979
� Convention on the Rights of the Child 1989
� Convention Against Torture and Other Cruel, Inhuman or Degrading Treatment or
Punishment 1984
� Ratification, accession or succession
� Signature not yet followed by ratification
Source: United Nations Development Programme. (2001). Human Development Report 2001. New York:
Oxford University Press. P. 232.

Statistics on Women in India 2007
15
2. Demography and Vital Statistics
The population of the world crossed 6 billion in 1999, and India’s population crossed 1
billion in 2000. Some indicators on the quality of life in Asian countries, including India
have improved over the years such as life expectancy, literacy and infant mortality, while
others have remained static or deteriorated such as environmental sanitation and
environmental degradation. International comparisons on a few of the indicators of human
development for Asian countries and indicators for different states in India are given in the
tables below.
Table 1: Indicators of Human Development for SAARC Countries and
Some Asian Countries, 2004
Country Life Expectancy at Infant Mortality Adult Literacy
Birth (Years) Rate (per thousand Rate (%) (age 15
live births) years & above) b
India 63.6 62 61.0
Kerala State (India) 10* 90.92$
Bangladesh 63.3 56 41.1
Bhutan 62.8 67 47.0
China 71.9 26 90.9
Indonesia 67.2 30 90.4
Korea, Republic 77.3 5 98.0e
Malaysia 73.4 10 88.7
Maldives 67.0 35 96.3
Nepal 62.1 59 48.6
Pakistan 63.4 80 49.9
Philippines 70.7 26 92.6
Srilanka 74.3 12 90.7
Thailand 70.3 18 92.6
Notes: Literacy Rate for Kerala is for 7 years and above
b: Data refer to estimates for the period.
e: Data refer to the average for the years specified.
Source: United Nations Development Programme. (2006). Human Development Report 2006: Beyond
Scarcity: Power, Poverty and the Global Water Crisis. New Delhi: Oxford University Press.
P. 283-287, 315-317.
* India, Registrar General, Vital Statistics Division. (2003). Sample Registration System Bulletin
April 2003. New Delhi. P. 5
$ India, Registrar General and Census Commissioner. (2001). Provisional Population Totals:
Paper 1 of 2001: Census of India 2001. New Delhi. P. 143.

Statistics on Women in India 2007
16
Variations in Human Development Indicators over time such as birth rates, death rates,
infant mortality rates, expectation of life at birth and literacy in India are given in Table 2.
Table 2: Basic Indicators of Human Development, 1951- 2005
Year Life Literacy Birth Death Infant
Expectancy Rate Rate Rate Mortality
at Birth (percent) (per (per Rate
(years)@ thousand) thousand) (per 1000
live births)
1951 32.1 18.3 39.9 27.4 146
1961 41.3 28.3 41.7 22.8 146
1971 45.6 34.5 36.9 14.9 129
1981 50.4 43.6 33.9 12.5 110
1991 59.4 52.2 29.5 9.8 80
1996 62.4 NA 27.5 9.0 72
1997 NA 62.0* 27.2 8.9 71
1998$ NA NA 26.4 9.0 72
1999$ NA NA 26.1 8.7 70
2000 NA NA $ 25.8 $ 8.5 $ 68
2001 # 65.38 $ 25.4 $ 8.4 $ 66
2001-06 Male 63.87
Female 66.91
2002 $ 25.0 $ 8.1 $ 63
2005 23.8 7.6 58
NA: Not Available * Provisional
Notes: Office of the Registrar General of India (SRS)NSSO Surveys Census 2001
Source: India, Ministry of Finance, Economic Division. (2000) Economic Survey 1999-2000. New Delhi.
P.167.
$ India, Registrar General, Vital Statistics Division. (2006). Sample Registration System Bulletin
October 2006. New Delhi. P. 1.
# India, Registrar General and Census Commissioner. (2001). Provisional Population Totals:
Paper 1 of 2001: Census of India 2001. New Delhi. P. 143.
@ National Commission for Women. (2004). A Study of the Implementation of Current Policies,
Programmes and Schemes for Women and Girls in India: A Comparative Study: Volume 1. New
Delhi. P.49.

Statistics on Women in India 2007
17
Some indicators depicting the progress in the situation of Indian women are given in
Table 3.
Table 3: Progress of Indian Women, 2004
Development Indicators Women Men Total Women Men Total
* Demography
- Population (in million in 1971 & 2001) 264.1 284.0 548.1 495.7 531.2 1027.1
- Decenneial Growth (1971 & 2001) 24.9 24.4 24.6 21.7 20.9 21.34
* Vital Statistics
- Sex Ratio (1971 & 2001) 930 - - 933 - -
- Expectation of Life at Birth (1971 & 2001-06) 50.2 50.5 50.9 66.91 63.87 -
- Mean Age at Marriage (1971 & 1991) 17.2 22.4 - 19.3 23.9 -
* Health and Family Welfare
- Birth Rate (1971 & 2005) - - 36.9 - - 23.8
- Death Rate (1970 & 2005) 15.6 15.8 15.7 7.1 8.0 7.6
- Infant Mortality Rate (1978 & 1998) 131 123 127 73.5 69.8 72
- Child Mortality Rate (1970 & 1997) 55.1 51.7 - 24.5 21.8 23.1
- Maternal Mortality Rate (1980 & 2003) 468 - - 301 - -
* Literacy and Education
- Literacy Rates (1971 & 2001) 7.9 24.9 16.7 54.28 75.96 65.38
- Gross Enrolment Ratio (1990-91 & 2003-04)
Classes I-V 85.5 113.9 100.1 95.58 100.63 98.20
Classes VI-VIII 47.8 76.6 62.1 57.62 66.76 62.40
- Drop-out Rate
Classes I-V (1990-91 & 2003-04) 46 40.1 42.6 28.57 33.74 31.47
Classes VI-VIII (1990-91 & 1998-99) 65.1 59.1 60.9 60.1 54.4 56.8
* Work and Employment
- Work Participation Rate (1971 & 2001) 14.2 52.8 34.3 25.68 51.93 39.26
- Organised Sector (No. in lakhs in 1971 & 1997) 19.3 155.6 174.9 43.9 231.8 275.7
(11%) (15.9%)
- Public Sector (No. in lakhs in 1971 & 1997) 8.6 98.7 107.3 26.1 162.6 188.7
(8%) (13.8%)
- Government (No. in lakhs in 1981 & 1996) 11.9 97.1 109.0 15.0 92.7 107.7
(11%) (13.9%)
* Decision Making
- Administrative
IAS (1987 & 2002) 339 3865 4204 535 4624 5159
(8.1%) (10.4%)
IPS (1987 & 2005) 21 2397 2418 142 3056 3198
(0.9%) (4.4%)
- Political
PRIs (No. in lakhs in 1995 & 1997) 3.18 6.30 9.48@ 8.14 17.84 25.98
(33.5%) (31.3%)
Legislative Assemblies (No. in 1985 & 2000) 141 2632 2773 229 3838 4067
(5.1%) (5.6%)
Parliament (No. in 1989 & 2004) 47 721 768 73 717 790
(61%) (9.24%)
Central Council of Ministers (1985-2004) 4 36 40 7 61 68
(10%) (10.29%)
Notes: @ Refers to 1995 in respect of only 9 States viz. Gujarat, Haryana, Kerala, Madhya Pradesh, Punjab, Rajasthan,
Tripura and West Bengal.
Figure in parentheses indicate the percentage in the total and year of the data in respective columns.
Data from Planning Commission.
Source: India, Ministry of Human Resource Development, Department of Women and Child Development. (2001).
Working Group on Empowerment of Women: Tenth Plan (2002-07): Report. New Delhi. P.43.

Statistics on Women in India 2007
18
The population of India by sex, share of various States and Union Territories, and
decadal growth rate is given in Table 4.
Table 4: Population of States/Union Territories by Sex (Final), Percentage
Share of Population in Total Population, and Decadal Growth
Rate, 2001
S. India/State/UTs Total Population Percentage DecadalNo Share of Natural
Population Growth Rateto Total 1991-2001
Population (%)$(Provisional)**
Persons Males FemalesIndia* 1028610328 532156772 496453556 100.00 21.54
1. Andhra Pradesh 76210007 38527413 37682594 7.37 14.592. Arunachal Pradesh 1097968 579941 518027 0.11 27.003. Assam 26655528 13777037 12878491 2.59 18.924. Bihar 82998509 43243795 39754714 8.07 28.625. Chhattisgarh 20833803 10474218 10359585 2.03 18.276. Delhi 13850507 7607234 6243273 1.34 47.027. Goa 1347668 687248 660420 0.13 15.218. Gujarat 50671017 26385577 24285440 4.93 22.669. Haryana 21144564 11363953 9780611 2.05 28.4310. Himachal Pradesh 6077900 3087940 2989960 0.59 17.5411. Jammu & Kashmir 10143700 5360926 4782774 0.98 29.4312. Jharkhand 26945829 13885037 13060792 2.62 23.3613. Karnataka 52850562 26898918 25951644 5.14 17.5114. Kerala 31841374 15468614 16372760 3.10 9.4315. Madhya Pradesh 60348023 31443652 28904371 5.88 24.2616. Maharashtra 96878627 50400596 46478031 9.42 22.7317. Manipur* 2166788* 1095634* 1071154* 0.23 24.8618. Meghalaya 2318822 1176087 1142735 0.22 30.6519. Mizoram 888573 459109 429464 0.09 28.8220. Nagaland 1990036 1047141 942895 0.19 64.5321. Orissa 36804660 18660570 18144090 3.57 16.2522. Punjab 24358999 12985045 11373954 2.37 20.1023. Rajasthan 56507188 29420011 27087177 5.50 28.4124. Sikkim 540851 288484 252367 0.05 33.0625. Tamil Nadu 62405679 31400909 31004770 6.05 11.7226. Tripura 3199203 1642225 1556978 0.31 16.0327. Uttar Pradesh 166197921 87565369 78632552 16.17 25.8528. Uttarakhand 8489349 4325924 4163425 0.83 20.4129. West Bengal 80176197 41465985 38710212 7.81 17.77
Union Territories30. Andaman & Nicobar Islands 356152 192972 163180 0.03 26.9031. Chandigarh 900635 506938 393697 0.09 40.2832. Dadra & Nagar Haveli 220490 121666 98824 0.02 59.2233. Daman & Diu 158204 92512 65692 0.02 55.7334. Lakshadweep 60650 31131 29519 0.01 17.3035. Pondicherry 974345 486961 487384 0.09 20.62
Notes: * Excluding the population of Mao Maram, Paomata & Purul Sub-divisions of Senapati District of
Manipur
Source: India, Registrar General and Census Commissioner. (2004). Final Population Totals: Census of
India 2001. New Delhi. P. 1-9.
$India, Registrar General and Census Commissioner. (2004). Primary Census Abstract: Total
Population: Table A-5: Census of India 2001. New Delhi. P. L (50)
** India, Registrar General and Census Commissioner. (2001). Provisional Population Totals:
Census of India 2001. New Delhi. P. XII

Statistics on Women in India 2007
19
The sex ratio in five year age groups and the percentage of population in five year age
groups gender-wise in India is given in Table 5.
Table 5: Sex Ratio in Five Year Age Groups, and Percentage Population
in Five Year Age Groups, 2001
S. Age Sex India Total Percentage Males Percentage Females PercentageNo. Group Ratio Persons to Total Males to Females
Population Total Males to TotalFemales
1. All ages 933 1028610328 100.00 532156772 100.00 496453556 100.002. 0-4 934 110447164 10.74 57119612 10.73 53327552 10.74
3. 5-9 923 128316790 12.47 66734833 12.54 61581957 12.40
4. 10-14 902 124846858 12.14 65632877 12.33 59213981 11.93
5. 15-19 858 100215890 9.74 53939991 10.14 46275899 9.32
6. 20-24 938 89764132 8.73 46321150 8.70 43442982 8.75
7. 25-29 1007 83422393 8.11 41557546 7.81 41864847 8.43
8. 30-34 988 74274044 7.22 37361916 7.02 36912128 7.44
9. 35-39 958 70574085 6.86 36038727 6.77 34535358 6.96
10. 40-44 865 55738297 5.42 29878715 5.61 25859582 5.21
11. 45-49 906 47408976 4.61 24867886 4.67 22541090 4.54
12. 50-54 843 36587559 3.56 19851608 3.73 16735951 3.37
13. 55-59 1036 27653347 2.69 13583022 2.55 14070325 2.83
14. 60-64 1025 27516779 2.68 13586347 2.55 13930432 2.81
15. 65-69 1091 19806955 1.93 9472103 1.78 10334852 2.08
16. 70-74 954 14708644 1.43 7527688 1.41 7180956 1.45
17. 75-79 1008 6551225 0.64 3263209 0.61 3288016 0.66
18. 80+ 1051 8038718 0.78 3918980 0.74 4119738 0.83
19. Age not 825 2738472 0.27 1500562 0.28 1237910 0.25
stated
Source: India, Registrar General and Census Commissioner. (2004). Age Data: Census of India 2001:
Compact Disc. New Delhi.
Figure 1: Population by Five Year Age Groups (Census), 2001
Source : India, Registrar General and Census Commissioner. (2005). Census of India 2001: Compact disc. New Delhi.

Statistics on Women in India 2007
20
For planning programmes and services, it is essential that the population in the relevant
target group is accurately known. The number of girls and women in millions in the various
groups namely early childhood, girl child, adolescent girl, reproductive age group,
economically active women and aged women in the various states and union territories is
given in Table 6.
Table 6: Female Target Groups in Population (in millions), 2001
S. India/ State/UT Population of Women/Girls in Millions
No. Early Girl Adolescent Reproductive Economically Old Age
Childhood Child Girl Age Active 60+ Years
0-6 Years 0-19 Years 11-18 Years 15-44 Years 15-59 Years
India 78.82 220.40 83.19 228.89 282.24 38.85
1. Andhra Pradesh 4.98 15.54 6.26 18.25 22.68 3.03
2. Arunachal Pradesh 0.10 0.27 0.10 0.23 0.28 0.02
3. Assam 2.21 6.12 2.28 6.07 7.23 0.76
4. Bihar 8.15 19.74 6.16 16.60 20.53 2.58
5. Chhattisgarh 1.75 4.71 1.75 4.60 5.75 0.81
6. Delhi 0.94 2.70 1.07 3.18 3.79 0.35
7. Goa 0.07 0.22 0.09 0.34 0.43 0.06
8. Gujarat 3.53 10.24 4.07 11.89 14.58 1.87
9. Haryana 1.50 4.45 1.80 4.61 5.49 0.79
10. Himachal Pradesh 0.37 1.21 0.52 1.44 1.80 0.28
11. Jammu & Kashmir 0.72 2.31 0.98 2.22 2.70 0.31
12. Jharkhand 2.43 6.35 2.19 5.71 7.06 0.79
13. Karnataka 3.49 10.77 4.49 12.56 15.56 2.14
14. Kerala 1.86 5.57 2.38 8.17 10.44 1.85
15. Madhya Pradesh 5.20 13.66 4.85 12.71 15.51 2.19
16. Maharashtra 6.52 19.18 7.75 21.96 27.04 4.52
17. Manipur 0.15 0.47 0.20 0.54 0.65 0.07
18. Meghalaya 0.23 0.61 0.22 0.51 0.61 0.05
19. Mizoram 0.07 0.20 0.08 0.21 0.25 0.02
20. Nagaland 0.14 0.48 0.21 0.47 0.55 0.04
21. Orissa 2.61 7.74 3.09 8.59 10.61 1.54
22. Punjab 1.41 4.61 1.99 5.56 6.80 1.08
23. Rajasthan 5.07 13.17 4.65 11.70 14.29 1.98
24. Sikkim 0.04 0.12 0.05 0.12 0.15 0.01
25. Tamil Nadu 3.51 11.18 4.73 15.64 19.90 2.77
26. Tripura 0.21 0.69 0.30 0.76 0.91 0.12
27. Uttar Pradesh 15.12 39.12 13.47 33.16 40.78 5.47
28. Uttarakhand 0.65 1.92 0.78 1.90 2.35 0.33
29. West Bengal 5.59 16.57 6.48 18.56 22.74 2.92
Union Territories
30. Andaman & 0.02 0.07 0.03 0.09 0.10 0.01
Nicobar Islands
31. Chandigarh 0.05 0.16 0.06 0.21 0.25 0.02
32. Dadra & Nagar
Haveli 0.02 0.05 0.02 0.05 0.06 0.00
33. Daman & Diu 0.01 0.03 0.01 0.03 0.04 0.00
34. Lakshadweep 0.00 0.01 0.01 0.01 0.02 0.00
35. Pondicherry 0.06 0.18 0.08 0.25 0.31 0.04
Notes: India and Manipur exclude 3 sub-divisions viz. Mao Maram, Paomata and Purul of Senapati
District of Manipur as Census 2001 could not be held there.
Source: India, Ministry of Statistics and Programme Implementation, Central Statistical Organisation. (2007).
Women and Men in India 2006. New Delhi. P.7.

Statistics on Women in India 2007
21
The child population in India in the 0-6 years age group is given in Table 7.
Table 7: Child Population 0-6 Years, 2001
S. India/State/UT Child Population 0-6 Years, 2001
No.Total Male Female
India 163819614 84999203 78820411
1. Andhra Pradesh 10171857 5187321 4984536
2. Arunachal Pradesh 205871 104833 101038
3. Assam 4498075 2289116 2208959
4. Bihar 16806063 8652705 8153358
5. Chhattisgarh 3554916 1800413 1754503
6. Delhi 2016849 1079618 937231
7. Goa 145968 75338 70630
8. Gujarat 7532404 4000148 3532256
9. Haryana 3335537 1833655 1501882
10. Himachal Pradesh 793137 418426 374711
11. Jammu & Kashmir 1485803 765394 720409
12. Jharkhand 4956827 2522036 2434791
13. Karnataka 7182100 3690958 3491142
14. Kerala 3793146 1935027 1858119
15. Madhya Pradesh 10782214 5579847 5202367
16. Maharashtra 13671126 7146432 6524694
17. Manipur 308585 157682 150903
18. Meghalaya 467979 237215 230764
19. Mizoram 143734 73176 70558
20. Nagaland 289678 147524 142154
21. Orissa 5358810 2744552 2614258
22. Punjab 3171829 1763801 1408028
23. Rajasthan 10651002 5579616 5071386
24. Sikkim 78195 39842 38353
25. Tamil Nadu 7235160 3725616 3509544
26. Tripura 436446 222002 214444
27. Uttar Pradesh 31624628 16509033 15115595
28. Uttarakhand 1360032 712949 647083
29. West Bengal 11414222 5824180 5590042
Union Territories
30. Andaman & Nicobar Islands 44781 22885 21896
31. Chandigarh 115613 62664 52949
32. Dadra & Nagar Haveli 40199 20308 19891
33. Daman & Diu 20578 10685 9893
34. Lakshadweep 9091 4641 4450
35. Pondicherry 117159 59565 57594
Source: India, Registrar General and Census Commissioner. (2004). Primary Census Abstract: Total
Population: Table A-5: Census of India 2001. New Delhi. P. 1-18.

Statistics on Women in India 2007
22
The population in five year age groups of children, adolescents, youth, adults and aged
persons is given in Table 8.
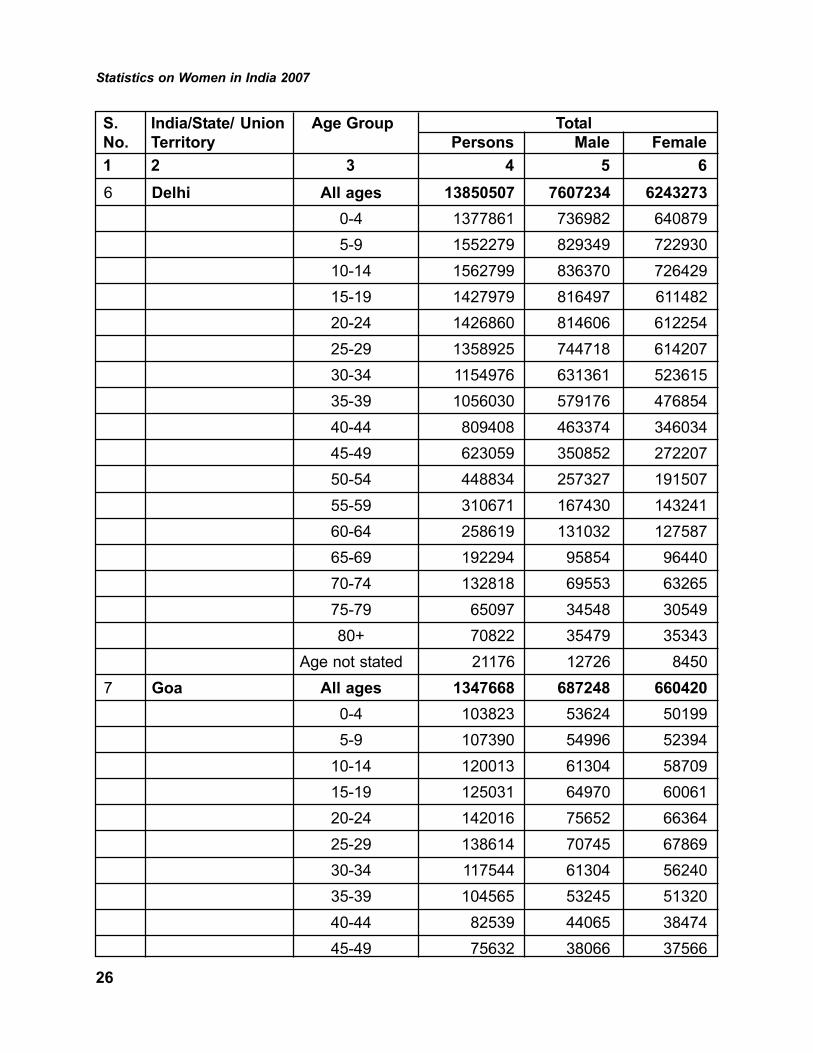
Table 8: Population in Five Year Age Groups by Sex in States/ Union
Territories (Total), 2001
S. India/State/ Union Age Group Total
No. Territory Persons Male Female
1 2 3 4 5 6
India All ages 1028610328 532156772 496453556
0-4 110447164 57119612 53327552
5-9 128316790 66734833 61581957
10-14 124846858 65632877 59213981
15-19 100215890 53939991 46275899
20-24 89764132 46321150 43442982
25-29 83422393 41557546 41864847
30-34 74274044 37361916 36912128
35-39 70574085 36038727 34535358
40-44 55738297 29878715 25859582
45-49 47408976 24867886 22541090
50-54 36587559 19851608 16735951
55-59 27653347 13583022 14070325
60-64 27516779 13586347 13930432
65-69 19806955 9472103 10334852
70-74 14708644 7527688 7180956
75-79 6551225 3263209 3288016
80+ 8038718 3918980 4119738
Age not stated 2738472 1500562 1237910
1 Andhra Pradesh All ages 76210007 38527413 37682594
0-4 6684361 3402214 3282147
5-9 8980791 4571152 4409639
10-14 8732973 4507721 4225252
15-19 7579964 3954124 3625840
20-24 6936897 3478288 3458609
25-29 6762271 3229258 3533013

Statistics on Women in India 2007
23
S. India/State/ Union Age Group Total
No. Territory Persons Male Female
1 2 3 4 5 6
30-34 5625505 2857197 2768308
35-39 5652711 2800929 2851782
40-44 4353961 2344256 2009705
45-49 3804932 1961920 1843012
50-54 3064827 1607693 1457134
55-59 2109286 980830 1128456
60-64 2337506 1122341 1215165
65-69 1371770 621812 749958
70-74 1160623 580811 579812
75-79 413869 204959 208910
80+ 504310 227665 276645
Age not stated 133450 74243 59207
2 Arunachal All ages 1097968 579941 518027
Pradesh 0-4 137843 69791 68052
5-9 162176 83243 78933
10-14 142806 72764 70042
15-19 110561 57558 53003
20-24 86033 44512 41521
25-29 92902 46972 45930
30-34 77342 41772 35570
35-39 77268 42957 34311
40-44 54374 31603 22771
45-49 46844 26700 20144
50-54 35083 21181 13902
55-59 23710 13762 9948
60-64 20000 10707 9293
65-69 11871 6173 5698
70-74 8295 4404 3891
75-79 4101 2160 1941

Statistics on Women in India 2007
24
S. India/State/ Union Age Group Total
No. Territory Persons Male Female
1 2 3 4 5 6
80+ 5649 2973 2676
Age not stated 1110 709 401
3 Assam All ages 26655528 13777037 12878491
0-4 3033998 1539293 1494705
5-9 3603701 1838233 1765468
10-14 3332643 1717969 1614674
15-19 2610793 1368367 1242426
20-24 2315138 1157866 1157272
25-29 2315931 1125381 1190550
30-34 1978201 1006114 972087
35-39 1921570 1020991 900579
40-44 1369116 765738 603378
45-49 1142350 633848 508502
50-54 843595 467765 375830
55-59 599152 317679 281473
60-64 577084 288977 288107
65-69 382083 191204 190879
70-74 296029 157066 138963
75-79 135531 75158 60373
80+ 169639 88180 81459
Age not stated 28974 17208 11766
4 Bihar All ages 82998509 43243795 39754714
0-4 11006072 5623280 5382792
5-9 12804302 6705263 6099039
10-14 11063777 5970201 5093576
15-19 7190188 4028643 3161545
20-24 6323193 3180063 3143130
25-29 5908308 2894706 3013602
30-34 5549787 2713871 2835916
35-39 5077935 2576089 2501846

Statistics on Women in India 2007
25
S. India/State/ Union Age Group Total
No. Territory Persons Male Female
1 2 3 4 5 6
40-44 4153203 2213770 1939433
45-49 3461664 1778368 1683296
50-54 2711041 1543620 1167421
55-59 2069940 990011 1079929
60-64 2103909 1120743 983166
65-69 1354937 683656 671281
70-74 1029921 571438 458483
75-79 446860 233961 212899
80+ 565647 312207 253440
Age not stated 177825 103905 73920
5 Chhattisgarh All ages 20833803 10474218 10359585
0-4 2452954 1241636 1211318
5-9 2634363 1331008 1303355
10-14 2605337 1332937 1272400
15-19 1931724 1008441 923283
20-24 1671488 827776 843712
25-29 1636950 814809 822141
30-34 1542280 755721 786559
35-39 1424842 729700 695142
40-44 1096145 565191 530954
45-49 946009 482637 463372
50-54 748558 384446 364112
55-59 610688 294489 316199
60-64 568926 263949 304977
65-69 402092 181311 220781
70-74 275341 127203 148138
75-79 122719 55014 67705
80+ 135305 62208 73097
Age not stated 28082 15742 12340
Statistics on Women in India 2007
26
S. India/State/ Union Age Group Total
No. Territory Persons Male Female
1 2 3 4 5 6
6 Delhi All ages 13850507 7607234 6243273
0-4 1377861 736982 640879
5-9 1552279 829349 722930
10-14 1562799 836370 726429
15-19 1427979 816497 611482
20-24 1426860 814606 612254
25-29 1358925 744718 614207
30-34 1154976 631361 523615
35-39 1056030 579176 476854
40-44 809408 463374 346034
45-49 623059 350852 272207
50-54 448834 257327 191507
55-59 310671 167430 143241
60-64 258619 131032 127587
65-69 192294 95854 96440
70-74 132818 69553 63265
75-79 65097 34548 30549
80+ 70822 35479 35343
Age not stated 21176 12726 8450
7 Goa All ages 1347668 687248 660420
0-4 103823 53624 50199
5-9 107390 54996 52394
10-14 120013 61304 58709
15-19 125031 64970 60061
20-24 142016 75652 66364
25-29 138614 70745 67869
30-34 117544 61304 56240
35-39 104565 53245 51320
40-44 82539 44065 38474
45-49 75632 38066 37566

Statistics on Women in India 2007
27
S. India/State/ Union Age Group Total
No. Territory Persons Male Female
1 2 3 4 5 6
50-54 64311 32882 31429
55-59 46905 23063 23842
60-64 42394 19972 22422
65-69 28168 12501 15667
70-74 20484 8650 11834
75-79 10315 4279 6036
80+ 10912 4274 6638
Age not stated 7012 3656 3356
8 Gujarat All ages 50671017 26385577 24285440
0-4 5268670 2789888 2478782
5-9 5682022 3010278 2671744
10-14 5673476 3014422 2659054
15-19 5183754 2756478 2427276
20-24 4839265 2538544 2300721
25-29 4224871 2182059 2042812
30-34 3985565 2027533 1958032
35-39 3630780 1901397 1729383
40-44 3013173 1585745 1427428
45-49 2421061 1277531 1143530
50-54 1851667 988925 862742
55-59 1350413 657563 692850
60-64 1297301 625662 671639
65-69 892465 418028 474437
70-74 650698 303145 347553
75-79 284362 126396 157966
80+ 374237 155243 218994
Age not stated 47237 26740 20497
9 Haryana All ages 21144564 11363953 9780611
0-4 2273739 1251155 1022584
5-9 2622965 1429636 1193329

Statistics on Women in India 2007
28
S. India/State/ Union Age Group Total
No. Territory Persons Male Female
1 2 3 4 5 6
10-14 2683276 1436447 1246829
15-19 2256559 1271643 984916
20-24 1957303 1075114 882189
25-29 1733146 911893 821253
30-34 1511037 771117 739920
35-39 1401762 730882 670880
40-44 1107196 600693 506503
45-49 864937 469917 395020
50-54 631108 351341 279767
55-59 436948 223135 213813
60-64 489742 229532 260210
65-69 440663 214964 225699
70-74 321755 173911 147844
75-79 148044 79391 68653
80+ 183885 97585 86300
Age not stated 80499 45597 34902
10 Himachal Pradesh All ages 6077900 3087940 2989960
0-4 560187 296555 263632
5-9 619164 323058 296106
10-14 705039 361257 343782
15-19 626624 324318 302306
20-24 583029 295703 287326
25-29 517507 256532 260975
30-34 432675 215401 217274
35-39 411062 199846 211216
40-44 330669 167405 163264
45-49 302882 151023 151859
50-54 238245 123075 115170
55-59 188537 94721 93816
60-64 174130 86950 87180

Statistics on Women in India 2007
29
S. India/State/ Union Age Group Total
No. Territory Persons Male Female
1 2 3 4 5 6
65-69 128906 61456 67450
70-74 106707 53486 53221
75-79 56865 29021 27844
80+ 80956 39933 41023
Age not stated 14716 8200 6516
11 Jammu & Kashmir All ages 10143700 5360926 4782774
0-4 963603 497184 466419
5-9 1292763 664480 628283
10-14 1360659 702837 657822
15-19 1147081 592332 554749
20-24 889969 476469 413500
25-29 789383 422668 366715
30-34 697138 378777 318361
35-39 690105 362578 327527
40-44 538689 302759 235930
45-49 458315 245036 213279
50-54 340304 199297 141007
55-59 254652 125846 128806
60-64 243842 137398 106444
65-69 158118 78254 79864
70-74 132824 75284 57540
75-79 58497 30246 28251
80+ 82043 44645 37398
Age not stated 45715 24836 20879
12 Jharkhand All ages 26945829 13885037 13060792
0-4 3269645 1655097 1614548
5-9 3904096 2001345 1902751
10-14 3534953 1852228 1682725
15-19 2499650 1351313 1148337
20-24 2149707 1086951 1062756

Statistics on Women in India 2007
30
S. India/State/ Union Age Group Total
No. Territory Persons Male Female
1 2 3 4 5 6
25-29 2031648 1011956 1019692
30-34 1882378 930481 951897
35-39 1770077 912149 857928
40-44 1416919 746852 670067
45-49 1232946 653169 579777
50-54 929297 511522 417775
55-59 712543 363852 348691
60-64 626146 311884 314262
65-69 399356 191041 208315
70-74 283615 145095 138520
75-79 121585 61011 60574
80+ 147960 78203 69757
Age not stated 33308 20888 12420
13 Karnataka All ages 52850562 26898918 25951644
0-4 4942594 2537476 2405118
5-9 5681431 2893477 2787954
10-14 6221576 3189233 3032343
15-19 5381672 2840330 2541342
20-24 4886225 2541933 2344292
25-29 4578219 2216303 2361916
30-34 3821205 1917602 1903603
35-39 3918079 1926776 1991303
40-44 3058456 1636842 1421614
45-49 2713842 1434271 1279571
50-54 2109655 1117489 992166
55-59 1423742 694759 728983
60-64 1498909 728997 769912
65-69 953187 441373 511814
70-74 799497 382616 416881
75-79 353230 168279 184951

Statistics on Women in India 2007
31
S. India/State/ Union Age Group Total
No. Territory Persons Male Female
1 2 3 4 5 6
80+ 457199 202465 254734
Age not stated 51844 28697 23147
14 Kerala All ages 31841374 15468614 16372760
0-4 2765164 1409487 1355677
5-9 2544181 1295679 1248502
10-14 2987200 1523842 1463358
15-19 2984506 1484586 1499920
20-24 2983990 1440467 1543523
25-29 2786195 1296905 1489290
30-34 2516463 1185807 1330656
35-39 2466354 1154778 1311576
40-44 1951284 960397 990887
45-49 1926144 952021 974123
50-54 1437520 724701 712819
55-59 1130244 541668 588576
60-64 1032136 480345 551791
65-69 902015 399671 502344
70-74 613422 273293 340129
75-79 399089 173558 225531
80+ 389013 157345 231668
Age not stated 26454 14064 12390
15 Madhya Pradesh All ages 60348023 31443652 28904371
0-4 7368736 3801712 3567024
5-9 8114671 4198430 3916241
10-14 7769009 4123794 3645215
15-19 5690617 3155715 2534902
20-24 5168016 2693698 2474318
25-29 4664502 2364315 2300187
30-34 4348461 2189149 2159312
35-39 3927208 2062808 1864400

Statistics on Women in India 2007
32
S. India/State/ Union Age Group Total
No. Territory Persons Male Female
1 2 3 4 5 6
40-44 3016434 1635980 1380454
45-49 2437191 1281601 1155590
50-54 1890978 1035226 855752
55-59 1511753 723319 788434
60-64 1572796 778022 794774
65-69 1102622 523430 579192
70-74 816977 414281 402696
75-79 352761 168501 184260
80+ 435768 207559 228209
Age not stated 159523 86112 73411
16 Maharashtra All ages 96878627 50400596 46478031
0-4 9532843 4983885 4548958
5-9 10230090 5302533 4927557
10-14 11337442 5945917 5391525
15-19 9570648 5262931 4307717
20-24 8856660 4781322 4075338
25-29 8218364 4187247 4031117
30-34 7392720 3800551 3592169
35-39 6958360 3540148 3418212
40-44 5546231 3010446 2535785
45-49 4543209 2404222 2138987
50-54 3446336 1863428 1582908
55-59 2672981 1320060 1352921
60-64 2730791 1204117 1526674
65-69 2632665 1229605 1403060
70-74 1629333 813846 815487
75-79 682773 333393 349380
80+ 779098 351240 427858
Age not stated 118083 65705 52378

Statistics on Women in India 2007
33
S. India/State/ Union Age Group Total
No. Territory Persons Male Female
1 2 3 4 5 6
17 Manipur All ages 2166788 1095634 1071154
0-4 205280 104863 100417
5-9 242917 124006 118911
10-14 258508 131998 126510
15-19 237976 118535 119441
20-24 222484 110393 112091
25-29 193882 95097 98785
30-34 159016 80757 78259
35-39 147041 74098 72943
40-44 116885 59858 57027
45-49 98549 50241 48308
50-54 78474 41206 37268
55-59 55773 28929 26844
60-64 48133 24343 23790
65-69 35897 17990 17907
70-74 28806 14561 14245
75-79 15459 7894 7565
80+ 17175 8445 8730
Age not stated 4533 2420 2113
18 Meghalaya All ages 2318822 1176087 1142735
0-4 324566 164343 160223
5-9 337157 170722 166435
10-14 319154 161632 157522
15-19 249780 126857 122923
20-24 195187 94446 100741
25-29 184137 87233 96904
30-34 147732 74672 73060
35-39 151079 78859 72220
40-44 103535 55573 47962
45-49 90705 48622 42083

Statistics on Women in India 2007
34
S. India/State/ Union Age Group Total
No. Territory Persons Male Female
1 2 3 4 5 6
50-54 63787 34715 29072
55-59 43117 22596 20521
60-64 39326 20448 18878
65-69 26664 13611 13053
70-74 18797 9525 9272
75-79 9696 4948 4748
80+ 11243 5484 5759
Age not stated 3160 1801 1359
19 Mizoram All ages 888573 459109 429464
0-4 100812 51097 49715
5-9 104232 53201 51031
10-14 108692 55242 53450
15-19 98632 49922 48710
20-24 93686 48172 45514
25-29 79266 41468 37798
30-34 60182 31930 28252
35-39 58829 31376 27453
40-44 47026 24723 22303
45-49 36304 19297 17007
50-54 30956 16609 14347
55-59 20157 10829 9328
60-64 16561 8507 8054
65-69 12371 6344 6027
70-74 9381 4832 4549
75-79 5402 2687 2715
80+ 5308 2430 2878
Age not stated 776 443 333
20 Nagaland All ages 1990036 1047141 942895
0-4 187660 94857 92803
5-9 257530 133580 123950

Statistics on Women in India 2007
35
S. India/State/ Union Age Group Total
No. Territory Persons Male Female
1 2 3 4 5 6
10-14 283219 147721 135498
15-19 266104 139923 126181
20-24 209930 110221 99709
25-29 163442 83129 80313
30-34 122907 64536 58371
35-39 122224 63725 58499
40-44 94984 50914 44070
45-49 87263 47494 39769
50-54 59972 35162 24810
55-59 39734 22543 17191
60-64 31747 18067 13680
65-69 20957 11610 9347
70-74 14881 8348 6533
75-79 9127 5001 4126
80+ 13611 7710 5901
Age not stated 4744 2600 2144
21 Orissa All ages 36804660 18660570 18144090
0-4 3573657 1823878 1749779
5-9 4377605 2240896 2136709
10-14 4256610 2171099 2085511
15-19 3531384 1760391 1770993
20-24 3190193 1600793 1589400
25-29 3108955 1518820 1590135
30-34 2761000 1376140 1384860
35-39 2663984 1368317 1295667
40-44 2062636 1104313 958323
45-49 1755849 926189 829660
50-54 1344141 708873 635268
55-59 1077484 523752 553732
60-64 1104140 543006 561134

Statistics on Women in India 2007
36
S. India/State/ Union Age Group Total
No. Territory Persons Male Female
1 2 3 4 5 6
65-69 768141 363846 404295
70-74 615357 309442 305915
75-79 258189 131458 126731
80+ 293273 154978 138295
Age not stated 62062 34379 27683
22 Punjab All ages 24358999 12985045 11373954
0-4 2128738 1186499 942239
5-9 2657368 1458964 1198404
10-14 2831770 1522899 1308871
15-19 2555933 1393473 1162460
20-24 2339151 1255974 1083177
25-29 1945622 1012264 933358
30-34 1769154 889759 879395
35-39 1725411 892126 833285
40-44 1433430 765875 667555
45-49 1174037 628232 545805
50-54 895611 503353 392258
55-59 617179 311595 305584
60-64 669648 323616 346032
65-69 585810 286101 299709
70-74 438386 243010 195376
75-79 199895 103950 95945
80+ 297954 155014 142940
Age not stated 93902 52341 41561
23 Rajasthan All ages 56507188 29420011 27087177
0-4 7233220 3781055 3452165
5-9 8068070 4242507 3825563
10-14 7241941 3847418 3394523
15-19 5490214 2987604 2502610
20-24 4749366 2470943 2278423

Statistics on Women in India 2007
37
S. India/State/ Union Age Group Total
No. Territory Persons Male Female
1 2 3 4 5 6
25-29 4197223 2127889 2069334
30-34 3821151 1917187 1903964
35-39 3453860 1788941 1664919
40-44 2760275 1476036 1284239
45-49 2269651 1183740 1085911
50-54 1775046 974037 801009
55-59 1349315 646505 702810
60-64 1361274 676223 685051
65-69 982874 457287 525587
70-74 757998 376076 381922
75-79 315930 145849 170081
80+ 392196 173490 218706
Age not stated 287584 147224 140360
24 Sikkim All ages 540851 288484 252367
0-4 52269 26789 25480
5-9 64970 32655 32315
10-14 71668 36516 35152
15-19 63444 32639 30805
20-24 55171 29567 25604
25-29 47552 24964 22588
30-34 39153 21650 17503
35-39 36384 20383 16001
40-44 28129 16214 11915
45-49 22177 12832 9345
50-54 16919 9771 7148
55-59 12037 7071 4966
60-64 10469 5812 4657
65-69 7593 4250 3343
70-74 5523 3233 2290
75-79 2749 1552 1197

Statistics on Women in India 2007
38
S. India/State/ Union Age Group Total
No. Territory Persons Male Female
1 2 3 4 5 6
80+ 2706 1544 1162
Age not stated 1938 1042 896
25 Tamil Nadu All ages 62405679 31400909 31004770
0-4 5098462 2619883 2478579
5-9 5600086 2875394 2724692
10-14 6012326 3086803 2925523
15-19 6183767 3135595 3048172
20-24 5801384 2872914 2928470
25-29 5719070 2732907 2986163
30-34 4687799 2344412 2343387
35-39 4919080 2396927 2522153
40-44 3786341 1978669 1807672
45-49 3610873 1842970 1767903
50-54 2817473 1452890 1364583
55-59 2232676 1101957 1130719
60-64 2049791 1019088 1030703
65-69 1374926 663631 711295
70-74 1030919 520254 510665
75-79 498560 261694 236866
80+ 553204 271133 282071
Age not stated 428942 223788 205154
26 Tripura All ages 3199203 1642225 1556978
0-4 294460 149741 144719
5-9 362924 185024 177900
10-14 418168 214033 204135
15-19 339439 174314 165125
20-24 274087 135058 139029
25-29 278984 136617 142367
30-34 243142 126049 117093
35-39 245388 129677 115711
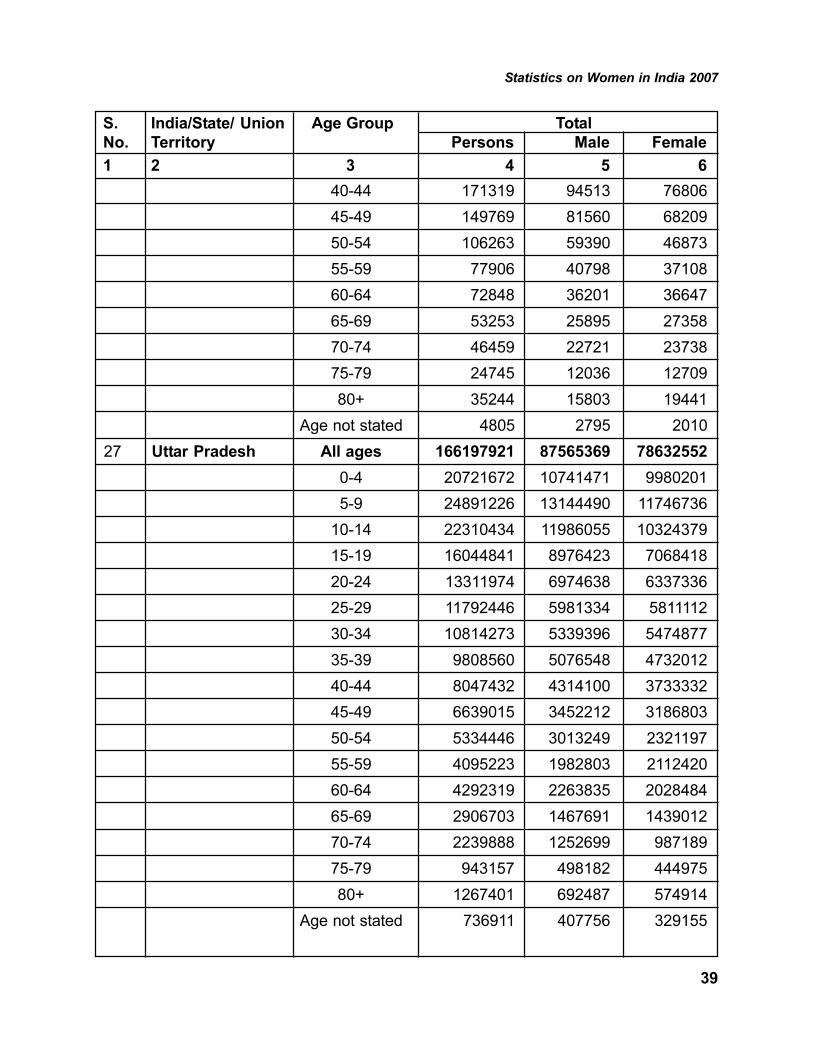
Statistics on Women in India 2007
39
S. India/State/ Union Age Group Total
No. Territory Persons Male Female
1 2 3 4 5 6
40-44 171319 94513 76806
45-49 149769 81560 68209
50-54 106263 59390 46873
55-59 77906 40798 37108
60-64 72848 36201 36647
65-69 53253 25895 27358
70-74 46459 22721 23738
75-79 24745 12036 12709
80+ 35244 15803 19441
Age not stated 4805 2795 2010
27 Uttar Pradesh All ages 166197921 87565369 78632552
0-4 20721672 10741471 9980201
5-9 24891226 13144490 11746736
10-14 22310434 11986055 10324379
15-19 16044841 8976423 7068418
20-24 13311974 6974638 6337336
25-29 11792446 5981334 5811112
30-34 10814273 5339396 5474877
35-39 9808560 5076548 4732012
40-44 8047432 4314100 3733332
45-49 6639015 3452212 3186803
50-54 5334446 3013249 2321197
55-59 4095223 1982803 2112420
60-64 4292319 2263835 2028484
65-69 2906703 1467691 1439012
70-74 2239888 1252699 987189
75-79 943157 498182 444975
80+ 1267401 692487 574914
Age not stated 736911 407756 329155

Statistics on Women in India 2007
40
S. India/State/ Union Age Group Total
No. Territory Persons Male Female
1 2 3 4 5 6
28 Uttarakhand All ages 8489349 4325924 4163425
0-4 922085 483708 438377
5-9 1071361 557449 513912
10-14 1093530 566264 527266
15-19 929859 485918 443941
20-24 742540 371700 370840
25-29 625834 302807 323027
30-34 547173 267320 279853
35-39 527314 260250 267064
40-44 434970 224267 210703
45-49 375690 189277 186413
50-54 309198 162143 147055
55-59 237669 118279 119390
60-64 229519 113902 115617
65-69 166863 80695 86168
70-74 127320 65530 61790
75-79 60470 31216 29254
80+ 70184 35372 34812
Age not stated 17770 9827 7943
29 West Bengal All ages 80176197 41465985 38710212
0-4 7616261 3874439 3741822
5-9 9490608 4851125 4639483
10-14 9538536 4914752 4623784
15-19 7633878 4069305 3564573
20-24 7066173 3570800 3495373
25-29 7051603 3487173 3564430
30-34 6247678 3224082 3023596
35-39 6020467 3153170 2867297
40-44 4598048 2552521 2045527
45-49 3964137 2171113 1793024

Statistics on Women in India 2007
41
S. India/State/ Union Age Group Total
No. Territory Persons Male Female
1 2 3 4 5 6
50-54 2865721 1555475 1310246
55-59 2271271 1194984 1076287
60-64 1957889 963542 994347
65-69 1469768 702927 766841
70-74 1066622 529068 537554
75-79 535936 268959 266977
80+ 669884 319995 349889
Age not stated 111717 62555 49162
Union Territories
30 Andaman & All ages 356152 192972 163180
Nicobar Islands
0-4 31241 15956 15285
5-9 34049 17310 16739
10-14 38754 19924 18830
15-19 38448 20801 17647
20-24 38290 20956 17334
25-29 36751 19383 17368
30-34 28599 15911 12688
35-39 28531 15191 13340
40-44 20609 11720 8889
45-49 19077 11067 8010
50-54 12649 7786 4863
55-59 9509 5921 3588
60-64 6496 3790 2706
65-69 4688 2659 2029
70-74 2983 1654 1329
75-79 1534 869 665
80+ 1665 862 803
Age not stated 2279 1212 1067
31 Chandigarh All ages 900635 506938 393697

Statistics on Women in India 2007
42
S. India/State/ Union Age Group Total
No. Territory Persons Male Female
1 2 3 4 5 6
0-4 79225 42917 36308
5-9 90190 48915 41275
10-14 91773 49928 41845
15-19 93276 55014 38262
20-24 103533 60442 43091
25-29 93095 52897 40198
30-34 74786 42125 32661
35-39 69529 38557 30972
40-44 55340 31339 24001
45-49 47079 26644 20435
50-54 34370 20475 13895
55-59 22227 13201 9026
60-64 15542 8459 7083
65-69 11226 5671 5555
70-74 8277 4440 3837
75-79 4659 2507 2152
80+ 5208 2667 2541
Age not stated 1300 740 560
32 Dadra & Nagar All ages 220490 121666 98824
Haveli
0-4 29421 14861 14560
5-9 25573 12904 12669
10-14 22764 11935 10829
15-19 19967 11313 8654
20-24 27032 16762 10270
25-29 25146 15557 9589
30-34 18006 10441 7565
35-39 14739 8418 6321
40-44 10351 5702 4649
45-49 8327 4534 3793

Statistics on Women in India 2007
43
S. India/State/ Union Age Group Total
No. Territory Persons Male Female
1 2 3 4 5 6
50-54 5682 3034 2648
55-59 4564 2270 2294
60-64 3702 1623 2079
65-69 2495 1160 1335
70-74 1427 590 837
75-79 579 255 324
80+ 611 254 357
Age not stated 104 53 51
33 Daman & Diu All ages 158204 92512 65692
0-4 14957 7777 7180
5-9 14261 7376 6885
10-14 13976 7341 6635
15-19 17679 11117 6562
20-24 24834 17610 7224
25-29 19974 12969 7005
30-34 13437 8288 5149
35-39 10433 6034 4399
40-44 7105 4022 3083
45-49 5722 2910 2812
50-54 4363 2182 2181
55-59 3350 1519 1831
60-64 3033 1326 1707
65-69 2080 876 1204
70-74 1379 552 827
75-79 739 287 452
80+ 811 281 530
Age not stated 71 45 26
34 Lakshadweep All ages 60650 31131 29519
0-4 6468 3289 3179
5-9 6625 3415 3210

Statistics on Women in India 2007
44
S. India/State/ Union Age Group Total
No. Territory Persons Male Female
1 2 3 4 5 6
10-14 7641 3983 3658
15-19 6230 3203 3027
20-24 5634 2769 2865
25-29 5160 2597 2563
30-34 4358 2245 2113
35-39 4105 2040 2065
40-44 3003 1603 1400
45-49 3253 1669 1584
50-54 2287 1263 1024
55-59 2104 1140 964
60-64 1487 761 726
65-69 955 487 468
70-74 639 309 330
75-79 267 152 115
80+ 381 175 206
Age not stated 53 31 22
35 Pondicherry All ages 974345 486961 487384
0-4 84617 42930 41687
5-9 83653 42740 40913
10-14 94416 48091 46325
15-19 97688 49398 48290
20-24 97694 48028 49666
25-29 96515 45974 50541
30-34 81221 41258 39963
35-39 78419 39641 38778
40-44 59082 31637 27445
45-49 50482 26101 24381
50-54 38842 20077 18765
55-59 29887 14143 15744
60-64 28624 13170 15454

Statistics on Women in India 2007
45
S. India/State/ Union Age Group Total
No. Territory Persons Male Female
1 2 3 4 5 6
65-69 20479 9039 11440
70-74 15263 6762 8501
75-79 8434 3838 4596
80+ 8216 3652 4564
Age not stated 813 482 331
Source: India, Registrar General and Census Commissioner. (2004). Census of India 2001: Population
in Five Year Age Groups: Compact Disc. New Delhi.

Statistics on Women in India 2007
46
Population projections for India for the years 2007 to 2016 are given in Table 9.
Table 9: Projected Population of India, States/UTs by Sex as on 1st March
2007, 2010 and 2016
S. India/State/ Union Projected Population ( In Thousands, 000)
No. Territories 2007 2010 2016
Persons Males Females Persons Males Females Persons Males Females
India 1131043 583859 547184 1180409 608706 571703 1274939 655824 619115
1. Andhra Pradesh 81315 41025 40290 83858 42268 41590 88513 44519 43994
2. Arunachal Pradesh 1185 624 561 1049 467 582 1315 692 623
3. Assam 29471 15193 14278 30831 15868 14963 33414 17138 16276
4. Bihar 92340 47929 44411 96715 50135 46580 104869 54218 50651
5. Chhattisgarh 23256 11732 11523 24412 12334 12078 26617 13475 13142
6. Delhi 16564 9079 7484 18147 9937 8210 21790 11903 9887
7. Goa 1581 803 778 1726 869 857 2072 1018 1054
8. Gujarat 55617 28946 26671 57946 30160 27786 62171 32346 29825
9. Haryana 23410 12570 10840 24476 13138 11338 26431 14172 12259
10. Himachal Pradesh 6488 3296 3192 6668 3389 3279 6985 3552 3433
11. Jammu & Kashmir 11974 6249 5725 13214 6783 6431 16264 7985 8279
12. Jharkhand 29597 15227 14370 30809 15840 14969 33031 16955 16076
13. Karnataka 56775 28840 27935 58606 29735 28871 61883 31324 30559
14. Kerala 33902 16476 17426 34872 16951 17921 36533 17756 18777
15. Madhya Pradesh 68047 35419 32627 71709 37314 34395 78773 40952 37821
16. Maharashtra 105511 54788 50723 109246 56872 52374 117391 60810 56581
17. Manipur 2594 1312 1282 2692 1362 1330 2879 1456 1423
18. Meghalaya 2504 1269 1235 2599 1317 1282 2779 1408 1371
19. Mizoram 968 500 468 1005 519 486 1074 554 520
20. Nagaland 2160 1132 1028 2241 1175 1066 2398 1257 1141
21. Orissa 39483 20006 19477 40699 20613 20086 42924 21711 21213
22. Punjab 26288 14004 12284 27175 14465 12710 28762 15283 13479
23. Rajasthan 63549 33027 30522 66762 34677 32085 72775 37734 35041
24. Sikkim 587 313 274 608 324 284 652 347 305
25. Tamil Nadu 65837 33036 32802 67462 33797 33665 70306 35127 35179
26. Tripura 3466 1778 1688 3596 1845 1751 3846 1972 1874
27. Uttar Pradesh 187379 98134 89246 197878 103395 94483 218551 113724 104827
28. Uttarakhand 9358 4765 4593 9772 4977 4795 10550 5371 5179
29. West Bengal 86835 44766 42069 89892 46276 43616 95708 49112 46596
Union Territories
30. Andaman & 402 215 188 429 226 203 495 251 244
Nicobar Islands
31. Chandigarh 1037 584 453 1116 626 490 1306 720 586
32. Dadra & Nagar Haveli 255 146 109 280 160 120 334 191 143
33. Daman & Diu 183 112 71 198 123 75 235 149 86
34. Lakshadweep 68 34 33 71 36 35 81 40 41
35. Pondicherry 1058 530 528 1110 553 557 1232 602 630
Notes: India, Registrar General and Census Commissioner
Source: India, Ministry of Health and Family Welfare, Central Bureau of Health Intelligence. (2006). Health
Information of India 2005. New Delhi. P 27- 29.

Statistics on Women in India 2007
47
The Scheduled Castes (SC) population in India in five year age groups of children,
adolescents, youth, adults and aged is given in Table 10.
Table 10: Scheduled Castes (SC) Population in Five Year Age Groups
by Sex in States/ Union Territories (Total), 2001
S. India/State/Union Age SC Persons SC Males SC Females
No. Territory Group
1 2 3 4 5 6
India All ages 166635700 86088760 80546940
0-4 19446272 9977298 9468974
5-9 22662508 11778026 10884482
10-14 21332322 11314211 10018111
15-19 16120667 8851508 7269159
20-24 13957965 7109731 6848234
25-29 13140261 6502353 6637908
30-34 11537943 5742649 5795294
35-39 11065850 5629795 5436055
40-44 8519706 4560214 3959492
45-49 7271189 3783144 3488045
50-54 5531990 2990927 2541063
55-59 4177831 1994748 2183083
60-64 4350089 2128695 2221394
65-69 2947771 1389824 1557947
70-74 2179293 1129098 1050195
75-79 861740 429920 431820
80+ 1101864 543453 558411
Age not stated 430439 233166 197273
1 Andhra Pradesh All ages 12339496 6228011 6111485
0-4 1135888 574578 561310
5-9 1575547 799730 775817
10-14 1547308 807529 739779
15-19 1220693 645332 575361
20-24 1078406 528945 549461
25-29 1074200 512024 562176

Statistics on Women in India 2007
48
S. India/State/Union Age SC Persons SC Males SC Females
No. Territory Group
1 2 3 4 5 6
30-34 868661 437320 431341
35-39 878606 429256 449350
40-44 673660 359114 314546
45-49 593986 303257 290729
50-54 481576 251026 230550
55-59 325016 148720 176296
60-64 374561 181262 193299
65-69 206386 94127 112259
70-74 171991 89218 82773
75-79 52201 26763 25438
80+ 61062 29002 32060
Age not stated 19748 10808 8940
2 Arunachal Pradesh All ages 6188 3590 2598
0-4 706 360 346
5-9 853 441 412
10-14 777 396 381
15-19 614 357 257
20-24 525 309 216
25-29 642 363 279
30-34 533 319 214
35-39 531 337 194
40-44 324 222 102
45-49 253 170 83
50-54 177 134 43
55-59 112 92 20
60-64 56 38 18
65-69 32 20 12
70-74 23 15 8
75-79 12 5 7
80+ 10 6 4

Statistics on Women in India 2007
49
Age not stated 8 6 2
3 Assam All ages 1825949 943674 882275
0-4 196350 99896 96454
5-9 242415 123976 118439
10-14 238870 122021 116849
15-19 185052 98402 86650
20-24 156922 81493 75429
25-29 154094 75292 78802
30-34 130406 65417 64989
35-39 130162 67909 62253
40-44 92962 51817 41145
45-49 78879 43594 35285
50-54 58431 31888 26543
55-59 42350 22408 19942
60-64 42056 20235 21821
65-69 28725 14214 14511
70-74 23223 12063 11160
75-79 10216 5639 4577
80+ 13232 6521 6711
Age not stated 1604 889 715
4 Bihar All ages 13048608 6784676 6263932
0-4 1916076 965284 950792
5-9 2176556 1141615 1034941
10-14 1707444 943846 763598
15-19 1012008 569078 442930
20-24 955125 456141 498984
25-29 924376 448801 475575
30-34 884706 432567 452139
35-39 803527 411153 392374
S. India/State/Union Age SC Persons SC Males SC Females
No. Territory Group
1 2 3 4 5 6

Statistics on Women in India 2007
50
40-44 648339 351053 297286
45-49 528253 271580 256673
50-54 405999 235807 170192
55-59 299883 138255 161628
60-64 315307 170519 144788
65-69 185327 91594 93733
70-74 137807 77435 60372
75-79 52821 26815 26006
80+ 65886 36381 29505
Age not stated 29168 16752 12416
5 Chhattisgarh All ages 2418722 1213194 1205528
0-4 302808 153441 149367
5-9 324351 165029 159322
10-14 324563 167208 157355
15-19 225776 121794 103982
20-24 190756 94764 95992
25-29 179820 89256 90564
30-34 164044 79458 84586
35-39 149178 74321 74857
40-44 115628 58032 57596
45-49 102929 50675 52254
50-54 84502 42328 42174
55-59 69340 32631 36709
60-64 68585 31326 37259
65-69 48208 21299 26909
70-74 34117 15802 18315
75-79 14402 6362 8040
80+ 16289 7539 8750
Age not stated 3426 1929 1497
S. India/State/Union Age SC Persons SC Males SC Females
No. Territory Group
1 2 3 4 5 6

Statistics on Women in India 2007
51
6 Delhi All ages 2343255 1265182 1078073
0-4 258981 135968 123013
5-9 297143 156243 140900
10-14 308431 162829 145602
15-19 276634 153865 122769
20-24 239076 132692 106384
25-29 210684 114019 96665
30-34 175096 93295 81801
35-39 164824 89135 75689
40-44 122381 69861 52520
45-49 93471 52875 40596
50-54 62923 36373 26550
55-59 43747 23173 20574
60-64 35824 17586 18238
65-69 21929 10750 11179
70-74 15107 7837 7270
75-79 5830 3021 2809
80+ 8180 3938 4242
Age not stated 2994 1722 1272
7 Goa All ages 23791 12047 11744
0-4 2017 1033 984
5-9 2206 1105 1101
10-14 2626 1332 1294
15-19 2498 1324 1174
20-24 2572 1297 1275
25-29 2414 1183 1231
30-34 1961 1031 930
35-39 1765 868 897
40-44 1385 707 678
S. India/State/Union Age SC Persons SC Males SC Females
No. Territory Group
1 2 3 4 5 6

Statistics on Women in India 2007
52
45-49 1307 690 617
50-54 978 513 465
55-59 687 345 342
60-64 537 260 277
65-69 359 142 217
70-74 236 105 131
75-79 108 45 63
80+ 108 49 59
Age not stated 27 18 9
8 Gujarat All ages 3592715 1866283 1726432
0-4 381929 201766 180163
5-9 407827 215922 191905
10-14 426725 226854 199871
15-19 401984 215901 186083
20-24 345205 184279 160926
25-29 290288 148103 142185
30-34 268478 135627 132851
35-39 247698 127328 120370
40-44 203339 106098 97241
45-49 166387 85491 80896
50-54 129266 68452 60814
55-59 95664 45272 50392
60-64 91418 43912 47506
65-69 55869 25620 30249
70-74 40954 18519 22435
75-79 15403 6753 8650
80+ 21226 8667 12559
Age not stated 3055 1719 1336
9 Haryana All ages 4091110 2188585 1902525
S. India/State/Union Age SC Persons SC Males SC Females
No. Territory Group
1 2 3 4 5 6

Statistics on Women in India 2007
53
0-4 490452 262594 227858
5-9 567022 304226 262796
10-14 566767 302544 264223
15-19 453011 257313 195698
20-24 364269 201445 162824
25-29 318317 168468 149849
30-34 274213 138844 135369
35-39 251929 131814 120115
40-44 192299 104072 88227
45-49 149022 80864 68158
50-54 106714 59507 47207
55-59 73402 36826 36576
60-64 85026 38400 46626
65-69 76796 36334 40462
70-74 54904 29615 25289
75-79 22774 12162 10612
80+ 28258 14827 13431
Age not stated 15935 8730 7205
10 Himachal Pradesh All ages 1502170 763333 738837
0-4 151904 78596 73308
5-9 166282 85219 81063
10-14 185335 94172 91163
15-19 154829 80630 74199
20-24 140632 71076 69556
25-29 125133 62291 62842
30-34 102855 51432 51423
35-39 99296 48391 50905
40-44 77401 39099 38302
45-49 72323 36310 36013
S. India/State/Union Age SC Persons SC Males SC Females
No. Territory Group
1 2 3 4 5 6

Statistics on Women in India 2007
54
50-54 55355 28988 26367
55-59 43675 21933 21742
60-64 41271 21083 20188
65-69 28719 14022 14697
70-74 23918 12611 11307
75-79 11713 6191 5522
80+ 17853 9293 8560
Age not stated 3676 1996 1680
11 Jammu & Kashmir All ages 770155 403256 366899
0-4 79537 41916 37621
5-9 93596 48894 44702
10-14 101371 52406 48965
15-19 90280 46722 43558
20-24 70512 37780 32732
25-29 62404 32552 29852
30-34 52008 26806 25202
35-39 50761 26112 24649
40-44 37092 20291 16801
45-49 31784 16545 15239
50-54 24314 13481 10833
55-59 18065 9119 8946
60-64 17606 9164 8442
65-69 13292 6664 6628
70-74 11308 6172 5136
75-79 5570 2946 2624
80+ 7930 4182 3748
Age not stated 2725 1504 1221
12 Jharkhand All ages 3189320 1640583 1548737
0-4 426825 213835 212990
S. India/State/Union Age SC Persons SC Males SC Females
No. Territory Group
1 2 3 4 5 6

Statistics on Women in India 2007
55
5-9 505408 258226 247182
10-14 436784 232447 204337
15-19 282137 156570 125567
20-24 243380 120542 122838
25-29 228233 112922 115311
30-34 215341 104826 110515
35-39 203124 103639 99485
40-44 163262 86067 77195
45-49 138559 72824 65735
50-54 101666 56384 45282
55-59 76188 37566 38622
60-64 69361 34730 34631
65-69 41189 19410 21779
70-74 29028 15108 13920
75-79 11144 5498 5646
80+ 13679 7281 6398
Age not stated 4012 2708 1304
13 Karnataka All ages 8563930 4339745 4224185
0-4 896315 456465 439850
5-9 1046013 529613 516400
10-14 1130638 584988 545650
15-19 881836 480516 401320
20-24 724298 369143 355155
25-29 698189 330387 367802
30-34 575116 282820 292296
35-39 606280 292621 313659
40-44 462324 245006 217318
45-49 410904 215648 195256
50-54 317766 167104 150662
S. India/State/Union Age SC Persons SC Males SC Females
No. Territory Group
1 2 3 4 5 6

Statistics on Women in India 2007
56
55-59 205269 97571 107698
60-64 233776 112075 121701
65-69 134903 61246 73657
70-74 119149 57406 61743
75-79 46560 22344 24216
80+ 66436 30273 36163
Age not stated 8158 4519 3639
14 Kerala All ages 3123941 1525114 1598827
0-4 268058 136908 131150
5-9 230469 117097 113372
10-14 279559 142369 137190
15-19 298655 147770 150885
20-24 311857 148414 163443
25-29 304133 144741 159392
30-34 257788 126420 131368
35-39 256474 123711 132763
40-44 186274 92568 93706
45-49 197957 98447 99510
50-54 130134 65971 64163
55-59 108179 51071 57108
60-64 99455 44450 55005
65-69 80629 34665 45964
70-74 49304 21729 27575
75-79 31277 14173 17104
80+ 31294 13297 17997
Age not stated 2445 1313 1132
15 Madhya Pradesh All ages 9155177 4804881 4350296
0-4 1195674 616728 578946
5-9 1304937 681252 623685
S. India/State/Union Age SC Persons SC Males SC Females
No. Territory Group
1 2 3 4 5 6
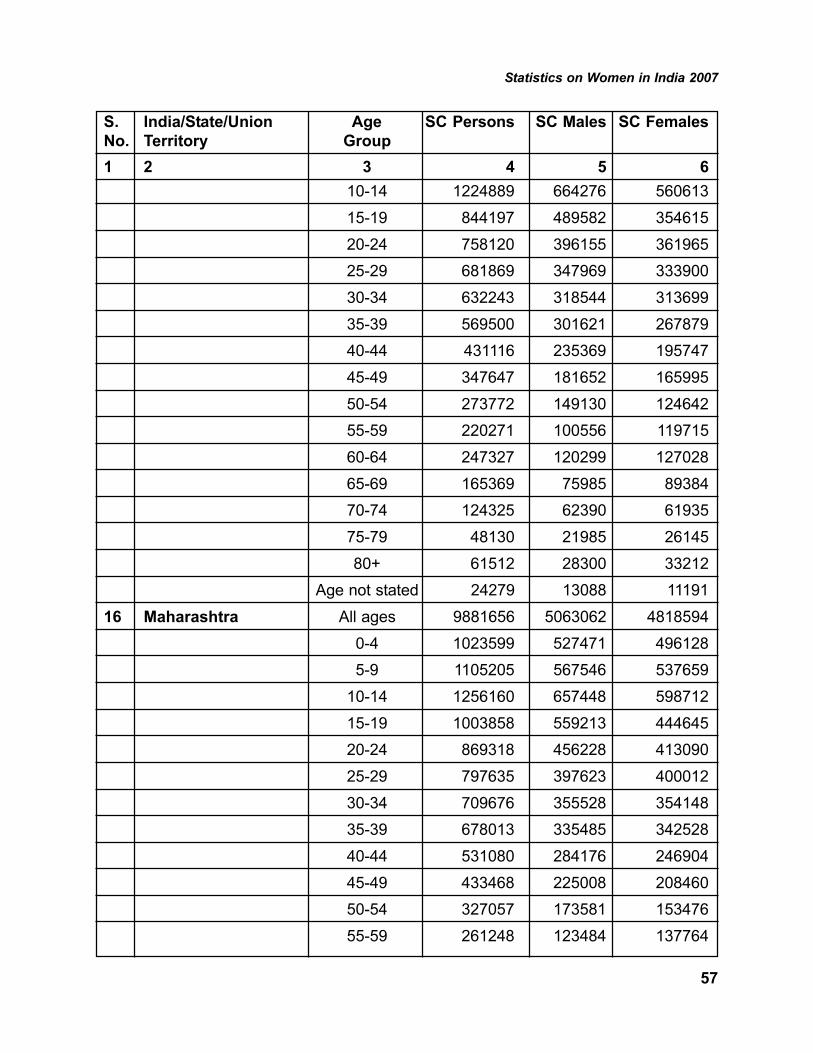
Statistics on Women in India 2007
57
10-14 1224889 664276 560613
15-19 844197 489582 354615
20-24 758120 396155 361965
25-29 681869 347969 333900
30-34 632243 318544 313699
35-39 569500 301621 267879
40-44 431116 235369 195747
45-49 347647 181652 165995
50-54 273772 149130 124642
55-59 220271 100556 119715
60-64 247327 120299 127028
65-69 165369 75985 89384
70-74 124325 62390 61935
75-79 48130 21985 26145
80+ 61512 28300 33212
Age not stated 24279 13088 11191
16 Maharashtra All ages 9881656 5063062 4818594
0-4 1023599 527471 496128
5-9 1105205 567546 537659
10-14 1256160 657448 598712
15-19 1003858 559213 444645
20-24 869318 456228 413090
25-29 797635 397623 400012
30-34 709676 355528 354148
35-39 678013 335485 342528
40-44 531080 284176 246904
45-49 433468 225008 208460
50-54 327057 173581 153476
55-59 261248 123484 137764
S. India/State/Union Age SC Persons SC Males SC Females
No. Territory Group
1 2 3 4 5 6

Statistics on Women in India 2007
58
60-64 292549 121813 170736
65-69 280724 127302 153422
70-74 168701 84287 84414
75-79 60452 29315 31137
80+ 72208 31634 40574
Age not stated 10705 5920 4785
17 Manipur All ages 60037 29934 30103
0-4 5833 2940 2893
5-9 6512 3321 3191
10-14 6533 3330 3203
15-19 5809 2881 2928
20-24 5971 2878 3093
25-29 5573 2618 2955
30-34 4773 2366 2407
35-39 4198 2132 2066
40-44 3347 1709 1638
45-49 2938 1507 1431
50-54 2372 1167 1205
55-59 1779 919 860
60-64 1461 734 727
65-69 1111 546 565
70-74 815 384 431
75-79 484 244 240
80+ 488 232 256
Age not stated 40 26 14
18 Meghalaya All ages 11139 5920 5219
0-4 1223 637 586
5-9 1532 779 753
10-14 1490 765 725
S. India/State/Union Age SC Persons SC Males SC Females
No. Territory Group
1 2 3 4 5 6

Statistics on Women in India 2007
59
15-19 1159 655 504
20-24 917 483 434
25-29 918 462 456
30-34 867 449 418
35-39 841 449 392
40-44 565 325 240
45-49 474 278 196
50-54 340 188 152
55-59 254 157 97
60-64 229 121 108
65-69 128 63 65
70-74 80 44 36
75-79 49 27 22
80+ 54 26 28
Age not stated 19 12 7
19 Mizoram All ages 272 212 60
0-4 16 9 7
5-9 18 6 12
10-14 16 7 9
15-19 12 8 4
20-24 34 28 6
25-29 53 45 8
30-34 51 44 7
35-39 31 28 3
40-44 14 12 2
45-49 12 11 1
50-54 9 9 0
55-59 5 5 0
60-64 0 0 0
S. India/State/Union Age SC Persons SC Males SC Females
No. Territory Group
1 2 3 4 5 6

Statistics on Women in India 2007
60
65-69 0 0 0
70-74 1 0 1
75-79 0 0 0
80+ 0 0 0
Age not stated 0 0 0
20 Nagaland There is no SC population in Nagaland
21 Orissa All ages 6082063 3073278 3008785
0-4 631123 321034 310089
5-9 762410 388563 373847
10-14 730178 371543 358635
15-19 579410 291291 288119
20-24 492233 248876 243357
25-29 493087 237026 256061
30-34 439652 214294 225358
35-39 442473 225510 216963
40-44 330870 177360 153510
45-49 280663 148468 132195
50-54 211698 110459 101239
55-59 174044 82795 91249
60-64 186606 91211 95395
65-69 130616 62089 68527
70-74 103967 53731 50236
75-79 39462 20419 19043
80+ 44030 23391 20639
Age not stated 9541 5218 4323
22 Punjab All ages 7028723 3714350 3314373
0-4 727171 390467 336704
5-9 897944 480284 417660
10-14 902411 478272 424139
S. India/State/Union Age SC Persons SC Males SC Females
No. Territory Group
1 2 3 4 5 6

Statistics on Women in India 2007
61
15-19 774178 422635 351543
20-24 639697 345881 293816
25-29 527998 270564 257434
30-34 481499 237630 243869
35-39 463371 238479 224892
40-44 368841 197528 171313
45-49 300220 160543 139677
50-54 219511 125133 94378
55-59 149378 72525 76853
60-64 172808 82377 90431
65-69 148423 71795 76628
70-74 112147 64117 48030
75-79 45984 24086 21898
80+ 69064 36977 32087
Age not stated 28078 15057 13021
23 Rajasthan All ages 9694462 5067679 4626783
0-4 1348680 699028 649652
5-9 1497671 790411 707260
10-14 1292557 696981 595576
15-19 941271 530437 410834
20-24 792081 415293 376788
25-29 697148 356814 340334
30-34 626892 314588 312304
35-39 564365 292126 272239
40-44 444200 237061 207139
45-49 363793 187303 176490
50-54 285630 155311 130319
55-59 212707 98238 114469
60-64 224211 106954 117257
S. India/State/Union Age SC Persons SC Males SC Females
No. Territory Group
1 2 3 4 5 6

Statistics on Women in India 2007
62
65-69 156379 70061 86318
70-74 118362 57831 60531
75-79 43122 19343 23779
80+ 53768 23469 30299
Age not stated 31625 16430 15195
24 Sikkim All ages 27165 13807 13358
0-4 2931 1499 1432
5-9 3558 1810 1748
10-14 3847 1927 1920
15-19 3382 1631 1751
20-24 2790 1353 1437
25-29 2254 1061 1193
30-34 1739 916 823
35-39 1698 828 870
40-44 1240 692 548
45-49 1019 543 476
50-54 797 453 344
55-59 621 348 273
60-64 471 275 196
65-69 333 183 150
70-74 226 140 86
75-79 97 49 48
80+ 104 62 42
Age not stated 58 37 21
25 Tamil Nadu All ages 11857504 5932925 5924579
0-4 1106599 563223 543376
5-9 1193026 608302 584724
10-14 1286520 656115 630405
15-19 1250092 634939 615153
S. India/State/Union Age SC Persons SC Males SC Females
No. Territory Group
1 2 3 4 5 6

Statistics on Women in India 2007
63
20-24 1076442 524223 552219
25-29 1076826 509347 567479
30-34 824525 403911 420614
35-39 934250 447440 486810
40-44 673514 350478 323036
45-49 664138 338401 325737
50-54 492583 252592 239991
55-59 383958 192695 191263
60-64 348781 174827 173954
65-69 204782 99507 105275
70-74 149047 77396 71651
75-79 60218 32672 27546
80+ 71615 36172 35443
Age not stated 60588 30685 29903
26 Tripura All ages 555724 283186 272538
0-4 50532 25778 24754
5-9 61204 31149 30055
10-14 77182 39236 37946
15-19 63073 32597 30476
20-24 49549 24767 24782
25-29 48269 23303 24966
30-34 40757 20800 19957
35-39 40919 21087 19832
40-44 28512 15694 12818
45-49 24843 13277 11566
50-54 17828 9661 8167
55-59 13002 6797 6205
60-64 12825 6091 6734
65-69 8820 4357 4463
S. India/State/Union Age SC Persons SC Males SC Females
No. Territory Group
1 2 3 4 5 6

Statistics on Women in India 2007
64
70-74 7902 3742 4160
75-79 3928 1892 2036
80+ 5731 2470 3261
Age not stated 848 488 360
27 Uttar Pradesh All ages 35148377 18502838 16645539
0-4 4763113 2444736 2318377
5-9 5609988 2958149 2651839
10-14 4728933 2575211 2153722
15-19 3172725 1829540 1343185
20-24 2660273 1376585 1283688
25-29 2460362 1246998 1213364
30-34 2279178 1120773 1158405
35-39 2048825 1069956 978869
40-44 1650895 884239 766656
45-49 1353845 696183 657662
50-54 1083445 609627 473818
55-59 836291 385690 450601
60-64 927842 482371 445471
65-69 596830 294614 302216
70-74 442877 245613 197264
75-79 166464 85267 81197
80+ 223853 119633 104220
Age not stated 142638 77653 64985
28 Uttarakhand All ages 1517186 780772 736414
0-4 190846 98523 92323
5-9 217549 112355 105194
10-14 206273 107046 99227
15-19 163259 86672 76587
20-24 124173 63258 60915
S. India/State/Union Age SC Persons SC Males SC Females
No. Territory Group
1 2 3 4 5 6

Statistics on Women in India 2007
65
25-29 108798 53184 55614
30-34 94343 46156 48187
35-39 92181 46003 46178
40-44 72255 37864 34391
45-49 62839 32241 30598
50-54 49392 26633 22759
55-59 38066 19223 18843
60-64 37303 19420 17883
65-69 24499 12429 12070
70-74 17657 9862 7795
75-79 7296 4036 3260
80+ 8603 4765 3838
Age not stated 1854 1102 752
29 West Bengal All ages 18452555 9469659 8982896
0-4 1857046 945007 912039
5-9 2329374 1188175 1141199
10-14 2320071 1201244 1118827
15-19 1795650 974372 821278
20-24 1629455 808042 821413
25-29 1636237 799559 836678
30-34 1405893 717656 688237
35-39 1356287 709344 646943
40-44 989065 544019 445046
45-49 854420 460665 393755
50-54 597457 313382 284075
55-59 476942 242393 234549
60-64 416377 194052 222325
65-69 303352 138919 164433
70-74 219277 104553 114724
S. India/State/Union Age SC Persons SC Males SC Females
No. Territory Group
1 2 3 4 5 6

Statistics on Women in India 2007
66
75-79 104741 51226 53515
80+ 137980 64359 73621
Age not stated 22931 12692 10239
Union Territories
30 Andaman & There is no SC population in Andaman & Nicobar Islands
Nicobar Islands
31 Chandigarh All ages 157597 86187 71410
0-4 17127 9004 8123
5-9 19809 10522 9287
10-14 19413 10379 9034
15-19 17510 9863 7647
20-24 16872 9226 7646
25-29 14923 8174 6749
30-34 12048 6486 5562
35-39 11562 6292 5270
40-44 8360 4773 3587
45-49 6929 3968 2961
50-54 4672 2775 1897
55-59 3098 1868 1230
60-64 2047 1120 927
65-69 1226 632 594
70-74 914 518 396
75-79 405 229 176
80+ 537 283 254
Age not stated 145 75 70
32 Dadra & Nagar Haveli All ages 4104 2159 1945
0-4 476 251 225
5-9 437 219 218
10-14 366 200 166
S. India/State/Union Age SC Persons SC Males SC Females
No. Territory Group
1 2 3 4 5 6

Statistics on Women in India 2007
67
15-19 413 229 184
20-24 504 259 245
25-29 473 255 218
30-34 337 194 143
35-39 278 137 141
40-44 186 108 78
45-49 178 83 95
50-54 123 70 53
55-59 96 43 53
60-64 76 42 34
65-69 65 33 32
70-74 46 17 29
75-79 20 8 12
80+ 28 10 18
Age not stated 2 1 1
33 Daman & Diu All ages 4838 2498 2340
0-4 484 255 229
5-9 493 269 224
10-14 574 298 276
15-19 556 287 269
20-24 527 285 242
25-29 463 254 209
30-34 363 207 156
35-39 320 155 165
40-44 243 126 117
45-49 200 101 99
50-54 159 72 87
55-59 140 61 79
60-64 109 48 61
S. India/State/Union Age SC Persons SC Males SC Females
No. Territory Group
1 2 3 4 5 6

Statistics on Women in India 2007
68
65-69 98 40 58
70-74 51 16 35
75-79 23 11 12
80+ 34 12 22
Age not stated 1 1 0
34 Lakshadweep There is no SC population in Lakshadweep
35 Pondicherry All ages 157771 78140 79631
0-4 15953 8068 7885
5-9 15153 7578 7575
10-14 17711 8992 8719
15-19 18106 9102 9004
20-24 15474 7591 7883
25-29 14448 6695 7753
30-34 11901 5925 5976
35-39 12583 6128 6455
40-44 8733 4674 4059
45-49 7549 3942 3607
50-54 5344 2728 2616
55-59 4354 1969 2385
60-64 4228 1900 2328
65-69 2653 1162 1491
70-74 1829 822 1007
75-79 834 394 440
80+ 812 402 410
Age not stated 106 68 38
Source: India, Registrar General and Census Commissioner. (2004). Census of India 2001: Population in
Five Year Age Groups. Compact Disc. New Delhi.
S. India/State/Union Age SC Persons SC Males SC Females
No. Territory Group
1 2 3 4 5 6

Statistics on Women in India 2007
69
The Scheduled Tribes (ST) population in India in five year age groups of children,
adolescents, youth, adults and aged persons is given in Table 11.
Table 11: Scheduled Tribes (ST) Population in Five Year Age Groups by
Sex in States/ Union Territories (Total), 2001
S.No. India/States/Union Age Group Total
Territories ST Persons ST Males ST Females
1 2 3 4 5 6
India All ages 84326240 42640829 41685411
0-4 10535556 5324400 5211156
5-9 11990558 6128221 5862337
10-14 10721378 5587180 5134198
15-19 7857411 4073351 3784060
20-24 6745721 3260929 3484792
25-29 6641651 3235544 3406107
30-34 5986735 2936777 3049958
35-39 5696039 2920762 2775277
40-44 4330501 2271096 2059405
45-49 3685371 1926499 1758872
50-54 2734626 1446186 1288440
55-59 2072535 991116 1081419
60-64 2036863 972771 1064092
65-69 1334211 613245 720966
70-74 929890 452967 476923
75-79 370754 173635 197119
80+ 456782 220550 236232
Age not stated 199658 105600 94058
1 Andhra Pradesh All ages 5024104 2548295 2475809
0-4 560639 283787 276852
5-9 778149 400303 377846
10-14 634396 342685 291711
15-19 447380 231229 216151
20-24 410952 189770 221182
25-29 435164 208119 227045
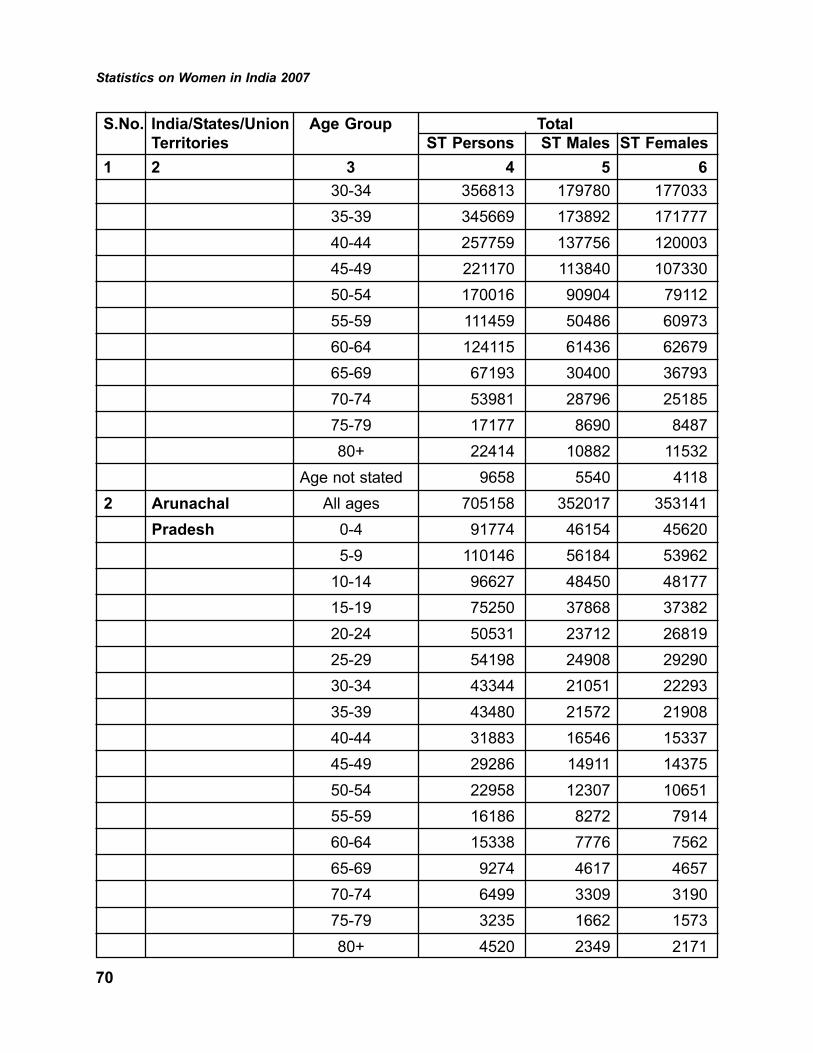
Statistics on Women in India 2007
70
30-34 356813 179780 177033
35-39 345669 173892 171777
40-44 257759 137756 120003
45-49 221170 113840 107330
50-54 170016 90904 79112
55-59 111459 50486 60973
60-64 124115 61436 62679
65-69 67193 30400 36793
70-74 53981 28796 25185
75-79 17177 8690 8487
80+ 22414 10882 11532
Age not stated 9658 5540 4118
2 Arunachal All ages 705158 352017 353141
Pradesh 0-4 91774 46154 45620
5-9 110146 56184 53962
10-14 96627 48450 48177
15-19 75250 37868 37382
20-24 50531 23712 26819
25-29 54198 24908 29290
30-34 43344 21051 22293
35-39 43480 21572 21908
40-44 31883 16546 15337
45-49 29286 14911 14375
50-54 22958 12307 10651
55-59 16186 8272 7914
60-64 15338 7776 7562
65-69 9274 4617 4657
70-74 6499 3309 3190
75-79 3235 1662 1573
80+ 4520 2349 2171
S.No. India/States/Union Age Group Total
Territories ST Persons ST Males ST Females
1 2 3 4 5 6

Statistics on Women in India 2007
71
Age not stated 629 369 260
3 Assam All ages 3308570 1678117 1630453
0-4 363706 185103 178603
5-9 452313 230771 221542
10-14 433374 221286 212088
15-19 361231 181030 180201
20-24 294227 139926 154301
25-29 292989 137615 155374
30-34 240692 118619 122073
35-39 234350 124787 109563
40-44 157357 85118 72239
45-49 135910 74043 61867
50-54 95490 51762 43728
55-59 70133 35887 34246
60-64 65226 33126 32100
65-69 42058 20870 21188
70-74 31743 17236 14507
75-79 15489 8751 6738
80+ 19242 10464 8778
Age not stated 3040 1723 1317
4 Bihar All ages 758351 393114 365237
0-4 100086 50286 49800
5-9 120979 62834 58145
10-14 98366 52979 45387
15-19 62987 35233 27754
20-24 55140 26797 28343
25-29 56543 27790 28753
30-34 54627 26794 27833
35-39 51473 26833 24640
40-44 40635 22112 18523
S.No. India/States/Union Age Group Total
Territories ST Persons ST Males ST Females
1 2 3 4 5 6

Statistics on Women in India 2007
72
45-49 33162 17680 15482
50-54 24519 14032 10487
55-59 17525 8312 9213
60-64 17582 8993 8589
65-69 9975 4637 5338
70-74 7221 3843 3378
75-79 2741 1373 1368
80+ 3498 1848 1650
Age not stated 1292 738 554
5 Chhattisgarh All ages 6616596 3287334 3329262
0-4 810092 405021 405071
5-9 879088 441292 437796
10-14 816115 417668 398447
15-19 590211 301906 288305
20-24 485868 230868 255000
25-29 503538 247962 255576
30-34 487872 233800 254072
35-39 467244 239983 227261
40-44 355229 181013 174216
45-49 310972 159300 151672
50-54 239794 121524 118270
55-59 198001 93942 104059
60-64 181331 82943 98388
65-69 121580 53233 68347
70-74 82740 37022 45718
75-79 36380 15595 20785
80+ 41376 19084 22292
Age not stated 9165 5178 3987
6 Delhi Delhi does not have any tribal population
7 Goa All ages 566 299 267
S.No. India/States/Union Age Group Total
Territories ST Persons ST Males ST Females
1 2 3 4 5 6

Statistics on Women in India 2007
73
0-4 67 34 33
5-9 56 28 28
10-14 71 32 39
15-19 65 38 27
20-24 62 33 29
25-29 64 39 25
30-34 42 16 26
35-39 49 31 18
40-44 26 13 13
45-49 21 12 9
50-54 16 9 7
55-59 10 8 2
60-64 10 2 8
65-69 4 2 2
70-74 2 1 1
75-79 0 0 0
80+ 0 0 0
Age not stated 1 1 0
8 Gujarat All ages 7481160 3790117 3691043
0-4 925972 469431 456541
5-9 976072 500560 475512
10-14 882375 459797 422578
15-19 687951 357522 330429
20-24 638830 311811 327019
25-29 611188 303129 308059
30-34 583916 287929 295987
35-39 521940 271936 250004
40-44 419345 212764 206581
45-49 348385 183199 165186
50-54 254066 131695 122371
S.No. India/States/Union Age Group Total
Territories ST Persons ST Males ST Females
1 2 3 4 5 6

Statistics on Women in India 2007
74
55-59 195085 94712 100373
60-64 175856 83817 92039
65-69 113584 53621 59963
70-74 75751 35401 40350
75-79 29319 13062 16257
80+ 35535 16311 19224
Age not stated 5990 3420 2570
9 Haryana Haryana does not have any tribal population
10 Himachal Pradesh All ages 244587 122549 122038
0-4 23544 12162 11382
5-9 26636 13445 13191
10-14 30458 15363 15095
15-19 25916 12868 13048
20-24 22011 11013 10998
25-29 19489 9675 9814
30-34 16685 8269 8416
35-39 16346 8049 8297
40-44 12587 6302 6285
45-49 11723 5809 5914
50-54 9326 4845 4481
55-59 7485 3767 3718
60-64 7230 3568 3662
65-69 4929 2351 2578
70-74 4039 2039 2000
75-79 2218 1070 1148
80+ 3178 1537 1641
Age not stated 787 417 370
11 Jammu & Kashmir All ages 1105979 578949 527030
0-4 134821 68043 66778
5-9 166714 85135 81579
S.No. India/States/Union Age Group Total
Territories ST Persons ST Males ST Females
1 2 3 4 5 6

Statistics on Women in India 2007
75
10-14 155801 81799 74002
15-19 116681 61928 54753
20-24 86260 44780 41480
25-29 78394 39455 38939
30-34 68290 35260 33030
35-39 68387 34829 33558
40-44 52548 29356 23192
45-49 45021 23555 21466
50-54 33835 20207 13628
55-59 23502 11390 12112
60-64 26134 15385 10749
65-69 15256 7905 7351
70-74 14754 8848 5906
75-79 6016 3170 2846
80+ 9690 5789 3901
Age not stated 3875 2115 1760
12 Jharkhand All ages 7087068 3565960 3521108
0-4 872440 438025 434415
5-9 1064835 544310 520525
10-14 918344 476232 442112
15-19 621855 323183 298672
20-24 521630 248546 273084
25-29 528328 257918 270410
30-34 503673 240779 262894
35-39 484148 247548 236600
40-44 386019 198878 187141
45-49 334134 174838 159296
50-54 248722 130553 118169
55-59 190149 91317 98832
60-64 173860 80805 93055
S.No. India/States/Union Age Group Total
Territories ST Persons ST Males ST Females
1 2 3 4 5 6

Statistics on Women in India 2007
76
65-69 102854 46402 56452
70-74 68438 32244 36194
75-79 26934 12706 14228
80+ 31336 15937 15399
Age not stated 9369 5739 3630
13 Karnataka All ages 3463986 1756238 1707748
0-4 367127 187095 180032
5-9 435859 219876 215983
10-14 453709 233167 220542
15-19 344831 189575 155256
20-24 287508 147762 139746
25-29 279596 131589 148007
30-34 237919 116845 121074
35-39 248684 121124 127560
40-44 192321 103637 88684
45-49 164842 87122 77720
50-54 128694 67549 61145
55-59 82638 39203 43435
60-64 93912 44848 49064
65-69 53910 24012 29898
70-74 46941 22216 24725
75-79 17948 8251 9697
80+ 24432 10637 13795
Age not stated 3115 1730 1385
14 Kerala All ages 364189 180169 184020
0-4 37016 18775 18241
5-9 31389 15869 15520
10-14 35239 18213 17026
15-19 36891 18259 18632
20-24 39406 17804 21602
S.No. India/States/Union Age Group Total
Territories ST Persons ST Males ST Females
1 2 3 4 5 6

Statistics on Women in India 2007
77
25-29 37380 18286 19094
30-34 27162 13514 13648
35-39 28078 13771 14307
40-44 19836 9949 9887
45-49 20537 10270 10267
50-54 13366 6942 6424
55-59 10353 5088 5265
60-64 9452 4642 4810
65-69 7424 3488 3936
70-74 4719 2297 2422
75-79 2590 1332 1258
80+ 3006 1482 1524
Age not stated 345 188 157
15 Madhya Pradesh All ages 12233474 6195240 6038234
0-4 1802892 909258 893634
5-9 1891572 960813 930759
10-14 1615656 846089 769567
15-19 1032986 539011 493975
20-24 916153 440896 475257
25-29 896036 441490 454546
30-34 860878 423545 437333
35-39 770926 403482 367444
40-44 572930 303343 269587
45-49 470707 243493 227214
50-54 356103 191174 164929
55-59 284842 130968 153874
60-64 298218 144017 154201
65-69 190000 86885 103115
70-74 129335 62961 66374
75-79 49612 21934 27678
S.No. India/States/Union Age Group Total
Territories ST Persons ST Males ST Females
1 2 3 4 5 6

Statistics on Women in India 2007
78
80+ 60865 28209 32656
Age not stated 33763 17672 16091
16 Maharashtra All ages 8577276 4347754 4229522
0-4 1080075 548146 531929
5-9 1124181 577521 546660
10-14 1097116 577393 519723
15-19 816252 431060 385192
20-24 698207 347260 350947
25-29 655744 322156 333588
30-34 603125 296065 307060
35-39 580585 292498 288087
40-44 451103 236805 214298
45-49 369129 194100 175029
50-54 269149 140526 128623
55-59 218003 104225 113778
60-64 223925 96971 126954
65-69 188900 87512 101388
70-74 109978 52904 57074
75-79 39744 18444 21300
80+ 42785 19101 23684
Age not stated 9275 5067 4208
17 Manipur All ages 741141 374319 366822
0-4 67549 34511 33038
5-9 87694 44923 42771
10-14 95372 49100 46272
15-19 90127 45350 44777
20-24 77341 38046 39295
25-29 64245 30784 33461
30-34 49844 24484 25360
35-39 47463 23446 24017
S.No. India/States/Union Age Group Total
Territories ST Persons ST Males ST Females
1 2 3 4 5 6

Statistics on Women in India 2007
79
40-44 37529 19088 18441
45-49 33629 16959 16670
50-54 25723 13703 12020
55-59 18069 9418 8651
60-64 15618 8164 7454
65-69 11174 5593 5581
70-74 8523 4644 3879
75-79 4386 2388 1998
80+ 5028 2750 2278
Age not stated 1827 968 859
18 Meghalaya All ages 1992862 996567 996295
0-4 290156 146769 143387
5-9 297471 150453 147018
10-14 279904 141185 138719
15-19 216392 108093 108299
20-24 164599 77585 87014
25-29 153629 70993 82636
30-34 120970 59379 61591
35-39 125471 63886 61585
40-44 85788 44803 40985
45-49 76055 39887 36168
50-54 53090 27981 25109
55-59 35913 18091 17822
60-64 33858 17396 16462
65-69 22915 11620 11295
70-74 16102 8139 7963
75-79 8285 4195 4090
80+ 9552 4618 4934
Age not stated 2712 1494 1218
19 Mizoram All ages 839310 422963 416347
S.No. India/States/Union Age Group Total
Territories ST Persons ST Males ST Females
1 2 3 4 5 6

Statistics on Women in India 2007
80
0-4 97234 49265 47969
5-9 100419 51133 49286
10-14 105189 53396 51793
15-19 94972 47579 47393
20-24 86235 42111 44124
25-29 71561 35174 36387
30-34 54193 27063 27130
35-39 54003 27457 26546
40-44 44076 22406 21670
45-49 34337 17735 16602
50-54 29201 15120 14081
55-59 19185 9992 9193
60-64 16187 8253 7934
65-69 12140 6186 5954
70-74 9217 4735 4482
75-79 5302 2629 2673
80+ 5189 2361 2828
Age not stated 670 368 302
20 Nagaland All ages 1774026 913203 860823
0-4 167203 84304 82899
5-9 233464 120895 112569
10-14 259820 135052 124768
15-19 245399 127741 117658
20-24 187692 96191 91501
25-29 139665 68195 71470
30-34 101090 49494 51596
35-39 101668 49327 52341
40-44 81918 41639 40279
45-49 77636 40729 36907
50-54 53460 30327 23133
S.No. India/States/Union Age Group Total
Territories ST Persons ST Males ST Females
1 2 3 4 5 6

Statistics on Women in India 2007
81
55-59 36276 20024 16252
60-64 29573 16607 12966
65-69 19605 10773 8832
70-74 13980 7780 6200
75-79 8681 4744 3937
80+ 12813 7214 5599
Age not stated 4083 2167 1916
21 Orissa All ages 8145081 4066783 4078298
0-4 944381 473842 470539
5-9 1170182 600090 570092
10-14 967850 499137 468713
15-19 699896 348262 351634
20-24 608192 286895 321297
25-29 666906 319202 347704
30-34 608229 293459 314770
35-39 595825 307431 288394
40-44 447179 237242 209937
45-49 382354 200000 182354
50-54 285535 149251 136284
55-59 214333 99222 115111
60-64 224891 104042 120849
65-69 138398 59346 79052
70-74 100302 45780 54522
75-79 34451 15136 19315
80+ 41575 20648 20927
Age not stated 14602 7798 6804
22 Punjab Punjab does not have any tribal population
23 Rajasthan All ages 7097706 3650982 3446724
0-4 1057311 540686 516625
5-9 1117452 579897 537555
10-14 887662 470493 417169
S.No. India/States/Union Age Group Total
Territories ST Persons ST Males ST Females
1 2 3 4 5 6

Statistics on Women in India 2007
82
15-19 633930 334752 299178
20-24 551472 275554 275918
25-29 518727 261531 257196
30-34 477999 238931 239068
35-39 421983 219957 202026
40-44 324722 172358 152364
45-49 269520 140358 129162
50-54 201773 110781 90992
55-59 155343 72903 82440
60-64 156067 78415 77652
65-69 105540 48358 57182
70-74 76763 38707 38056
75-79 28969 12826 16143
80+ 38660 17974 20686
Age not stated 73813 36501 37312
24 Sikkim All ages 111405 56940 54465
0-4 10459 5332 5127
5-9 13600 6798 6802
10-14 15295 7655 7640
15-19 13472 6742 6730
20-24 10648 5286 5362
25-29 9571 4756 4815
30-34 7482 3789 3693
35-39 7047 3649 3398
40-44 5411 2873 2538
45-49 4593 2499 2094
50-54 3506 1860 1646
55-59 2549 1429 1120
60-64 2519 1374 1145
65-69 1729 951 778
70-74 1344 772 572
S.No. India/States/Union Age Group Total
Territories ST Persons ST Males ST Females
1 2 3 4 5 6

Statistics on Women in India 2007
83
75-79 661 358 303
80+ 662 340 322
Age not stated 857 477 380
25 Tamil Nadu All ages 651321 328917 322404
0-4 66229 33853 32376
5-9 75877 39365 36512
10-14 68790 35985 32805
15-19 60595 31068 29527
20-24 56623 25929 30694
25-29 59703 28500 31203
30-34 46699 22674 24025
35-39 52409 25159 27250
40-44 39128 20824 18304
45-49 36052 19267 16785
50-54 25415 13619 11796
55-59 18583 9316 9267
60-64 17759 9118 8641
65-69 10030 4858 5172
70-74 7620 4128 3492
75-79 2959 1586 1373
80+ 3680 2024 1656
Age not stated 3170 1644 1526
26 Tripura All ages 993426 504320 489106
0-4 107301 54115 53186
5-9 141125 71886 69239
10-14 142800 73796 69004
15-19 104141 52864 51277
20-24 78218 36395 41823
25-29 80312 38535 41777
30-34 66483 32410 34073
S.No. India/States/Union Age Group Total
Territories ST Persons ST Males ST Females
1 2 3 4 5 6

Statistics on Women in India 2007
84
35-39 70167 36790 33377
40-44 47917 25296 22621
45-49 42019 22619 19400
50-54 27982 15616 12366
55-59 20779 10635 10144
60-64 19659 10366 9293
65-69 13731 6766 6965
70-74 12124 6481 5643
75-79 6908 3597 3311
80+ 10159 5195 4964
Age not stated 1601 958 643
27 Uttar Pradesh All ages 107963 55834 52129
0-4 15647 7946 7701
5-9 17891 9127 8764
10-14 14103 7402 6701
15-19 9649 5047 4602
20-24 8626 4184 4442
25-29 8237 4251 3986
30-34 7222 3578 3644
35-39 6554 3400 3154
40-44 5008 2788 2220
45-49 3863 2114 1749
50-54 2885 1678 1207
55-59 2112 1037 1075
60-64 2201 1190 1011
65-69 1462 731 731
70-74 1090 597 493
75-79 471 249 222
80+ 661 367 294
Age not stated 281 148 133
S.No. India/States/Union Age Group Total
Territories ST Persons ST Males ST Females
1 2 3 4 5 6
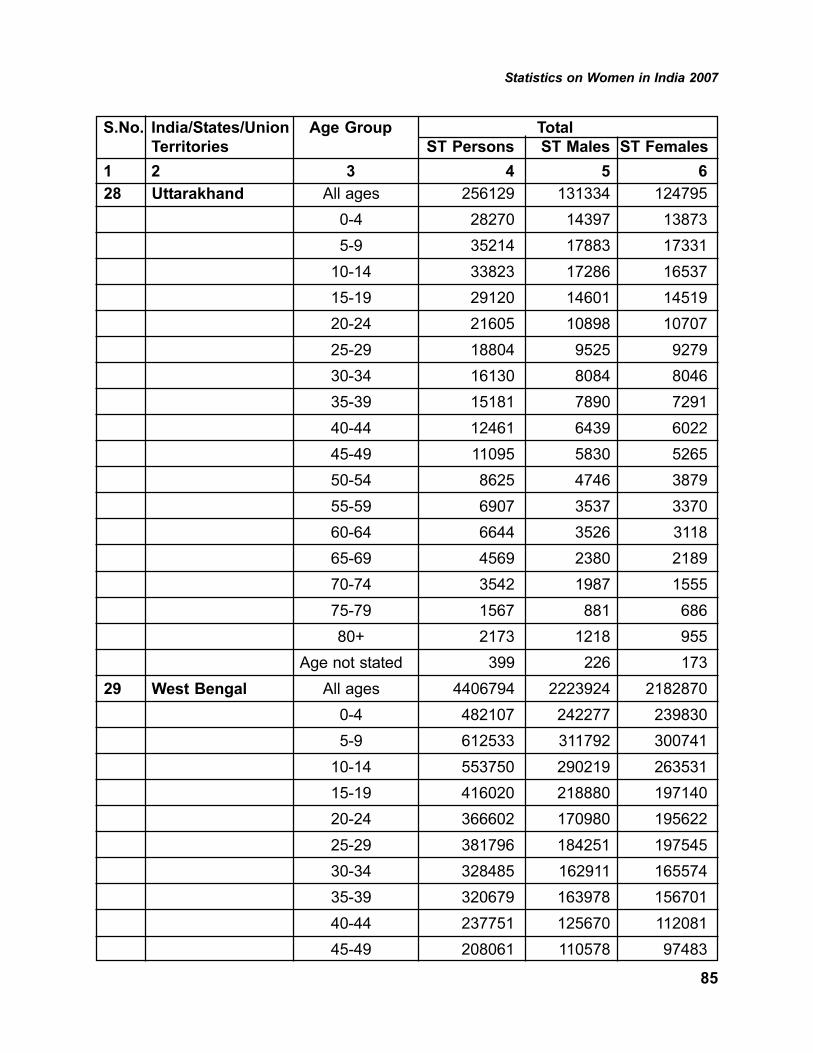
Statistics on Women in India 2007
85
28 Uttarakhand All ages 256129 131334 124795
0-4 28270 14397 13873
5-9 35214 17883 17331
10-14 33823 17286 16537
15-19 29120 14601 14519
20-24 21605 10898 10707
25-29 18804 9525 9279
30-34 16130 8084 8046
35-39 15181 7890 7291
40-44 12461 6439 6022
45-49 11095 5830 5265
50-54 8625 4746 3879
55-59 6907 3537 3370
60-64 6644 3526 3118
65-69 4569 2380 2189
70-74 3542 1987 1555
75-79 1567 881 686
80+ 2173 1218 955
Age not stated 399 226 173
29 West Bengal All ages 4406794 2223924 2182870
0-4 482107 242277 239830
5-9 612533 311792 300741
10-14 553750 290219 263531
15-19 416020 218880 197140
20-24 366602 170980 195622
25-29 381796 184251 197545
30-34 328485 162911 165574
35-39 320679 163978 156701
40-44 237751 125670 112081
45-49 208061 110578 97483
S.No. India/States/Union Age Group Total
Territories ST Persons ST Males ST Females
1 2 3 4 5 6

Statistics on Women in India 2007
86
50-54 143943 73707 70236
55-59 110577 54715 55862
60-64 94270 43530 50740
65-69 62333 28017 34316
70-74 41019 19170 21849
75-79 17832 8560 9272
80+ 23850 11816 12034
Age not stated 5186 2873 2313
Union Territories
30 Andaman & All ages 29469 15127 14342
Nicobar Islands 0-4 2567 1311 1256
5-9 2842 1499 1343
10-14 3190 1661 1529
15-19 2995 1528 1467
20-24 2689 1341 1348
25-29 2774 1322 1452
30-34 2297 1155 1142
35-39 2524 1262 1262
40-44 1826 943 883
45-49 1787 1020 767
50-54 980 519 461
55-59 861 469 392
60-64 792 392 400
65-69 639 327 312
70-74 335 171 164
75-79 199 116 83
80+ 125 61 64
Age not stated 47 30 17
31 Chandigarh Chandigarh does not have any tribal population
S.No. India/States/Union Age Group Total
Territories ST Persons ST Males ST Females
1 2 3 4 5 6

Statistics on Women in India 2007
87
32 Dadra & Nagar All ages 137225 67663 69562
Haveli
0-4 21125 10523 10602
5-9 18668 9342 9326
10-14 17071 8896 8175
15-19 12624 6210 6414
20-24 11739 5387 6352
25-29 10991 5496 5495
30-34 9473 4561 4912
35-39 8998 4527 4471
40-44 6797 3369 3428
45-49 5817 3010 2807
50-54 3941 1965 1976
55-59 3397 1599 1798
60-64 2844 1182 1662
65-69 1881 836 1045
70-74 1057 419 638
75-79 377 166 211
80+ 358 146 212
Age not stated 67 29 38
33 Daman & Diu All ages 13997 7190 6807
0-4 1433 722 711
5-9 1634 840 794
10-14 1667 892 775
15-19 1597 876 721
20-24 1449 775 674
25-29 1360 675 685
30-34 1083 568 515
35-39 974 503 471
40-44 721 386 335
45-49 600 294 306
S.No. India/States/Union Age Group Total
Territories ST Persons ST Males ST Females
1 2 3 4 5 6

Statistics on Women in India 2007
88
50-54 432 205 227
55-59 348 160 188
60-64 324 139 185
65-69 177 85 92
70-74 104 38 66
75-79 41 15 26
80+ 44 14 30
Age not stated 9 3 6
34 Lakshadweep All ages 57321 28611 28710
0-4 6333 3227 3106
5-9 6503 3357 3146
10-14 7445 3872 3573
15-19 5995 3048 2947
20-24 5206 2394 2812
25-29 4719 2223 2496
30-34 4018 1971 2047
35-39 3734 1765 1969
40-44 2691 1380 1311
45-49 2954 1428 1526
50-54 2081 1079 1002
55-59 1932 992 940
60-64 1468 748 720
65-69 947 483 464
70-74 627 302 325
75-79 262 149 113
80+ 376 174 202
Age not stated 30 19 11
35 Pondicherry Pondichery does not have any tribal population
Source: India, Registrar General and Census Commissioner. (2004).Census of India 2001: Scheduled
Tribes (ST) Population in Five Year Age Groups. Compact Disc. New Delhi.
S.No. India/States/Union Age Group Total
Territories ST Persons ST Males ST Females
1 2 3 4 5 6

Statistics on Women in India 2007
89
The distribution of population by broad age groups by residence in rural and urban
areas is given in Figure 2.
Figure 2. Percentage Distribution of Population by
Broad Age Groups and Residence, India, 2002
Source: India, Registrar General, Vital Statistic Division. (2004). Sample Registration System: Statistical
Report 2002. New Delhi. P.11.

Statistics on Women in India 2007
90
The number of households in India, population by rural urban distribution, and child
population aged 0-6 years is given in Table 12.
Table 12: Population by Residence and Sex, and Households, India and
States/Union Territories (Final), 2001
S. India/ State/ Union Total/ Number Total Population Child Population 0-6 Years $No. Territory Rural/ of
Urban Households* Person Male Female Person Male Female
1 2 3 4 5 6 7 8 9 10
India *(excluding Total 191963935 1028610328 532156772 496453556 163819614 84999203 78820411the population ofMao Maram, Rural 138271559 742490639 381602674 360887965 126470497 65407648 61062849Paomata & PurulSub-divs. of Senapati Urban 53692376 286119689 150554098 135565591 37349117 19591555 17757562dist. of Manipur)
1 Andhra Pradesh Total 16849857 76210007 38527413 37682594 10171857 5187321 4984536
Rural 12676218 55401067 27937204 27463863 7621799 3883008 3738791
Urban 4173639 20808940 10590209 10218731 2550058 1304313 1245745
2 Arunachal Pradesh Total 212615 1097968 579941 518027 205871 104833 101038
Rural 164501 870087 454680 415407 169029 86230 82799
Urban 48114 227881 125261 102620 36842 18603 18239
3 Assam Total 4935358 26655528 13777037 12878491 4498075 2289116 2208959
Rural 4220173 23216288 11939945 11276343 4104407 2086499 2017908
Urban 715185 3439240 1837092 1602148 393668 202617 191051
4 Bihar Total 13982590 82998509 43243795 39754714 16806063 8652705 8153358
Rural 12660007 74316709 38594996 35721713 15398489 7921089 7477400
Urban 1322583 8681800 4648799 4033001 1407574 731616 675958
5 Chhattisgarh Total 4148518 20833803 10474218 10359585 3554916 1800413 1754503
Rural 3359078 16648056 8307443 8340613 2963980 1495500 1468480
Urban 789440 4185747 2166775 2018972 590936 304913 286023
6 Delhi Total 2554149 13850507 7607234 6243273 2016849 1079618 937231
Rural 169528 944727 522087 422640 158160 85484 72676
Urban 2384621 12905780 7085147 5820633 1858689 994134 864555
7 Goa Total 279216 1347668 687248 660420 145968 75338 70630
Rural 140755 677091 340545 336546 71338 36547 34791
Urban 138461 670577 346703 323874 74630 38791 35839
8 Gujarat Total 9643989 50671017 26385577 24285440 7532404 4000148 3532256
Rural 5885961 31740767 16317771 15422996 5085941 2668527 2417414
Urban 3758028 18930250 10067806 8862444 2446463 1331621 1114842
9 Haryana Total 3529642 21144564 11363953 9780611 3335537 1833655 1501882
Rural 2454463 15029260 8052988 6976272 2482148 1361694 1120454
Urban 1075179 6115304 3310965 2804339 853389 471961 381428
10 Himachal Pradesh Total 1240633 6077900 3087940 2989960 793137 418426 374711
Rural 1097520 5482319 2756073 2726246 730628 384534 346094
Urban 143113 595581 331867 263714 62509 33892 28617
11 Jammu & Kashmir Total 1551768 10143700 5360926 4782774 1485803 765394 720409
Rural 1161357 7627062 3977652 3649410 1214965 620809 594156
Urban 390411 2516638 1383274 1133364 270838 144585 126253

Statistics on Women in India 2007
91
S. India/ State/ Union Total/ Number Total Population Child Population 0-6 Years $No. Territory Rural/ of
Urban Households* Person Male Female Person Male Female
1 2 3 4 5 6 7 8 9 10
12 Jharkhand Total 4862590 26945829 13885037 13060792 4956827 2522036 2434791
Rural 3802412 20952088 10679596 10272492 4110326 2083426 2026900
Urban 1060178 5993741 3205441 2788300 846501 438610 407891
13 Karnataka Total 10232133 52850562 26898918 25951644 7182100 3690958 3491142
Rural 6675173 34889033 17648958 17240075 4935380 2532557 2402823
Urban 3556960 17961529 9249960 8711569 2246720 1158401 1088319
14 Kerala Total 6595206 31841374 15468614 16372760 3793146 1935027 1858119
Rural 4942550 23574449 11451282 12123167 2857686 1457233 1400453
Urban 1652656 8266925 4017332 4249593 935460 477794 457666
15 Madhya Pradesh Total 10919653 60348023 31443652 28904371 10782214 5579847 5202367
Rural 8124795 44380878 23031093 21349785 8443744 4353726 4090018
Urban 2794858 15967145 8412559 7554586 2338470 1226121 1112349
16 Maharashtra Total 19063149 96878627 50400596 46478031 13671126 7146432 6524694
Rural 10993623 55777647 28458677 27318970 8428828 4399083 4029745
Urban 8069526 41100980 21941919 19159061 5242298 2747349 2494949
17 Manipur (excluding the Total 397656 2166788 1095634 1071154 308585 157682 150903
Population of Mao
Maram,Paomata & Purul Rural 296354 1590820 808953 781867 233675 119486 114189
Sub-divs.of Senapati
district) Urban 101302 575968 286681 289287 74910 38196 36714
18 Meghalaya Total 420246 2318822 1176087 1142735 467979 237215 230764
Rural 329678 1864711 946999 917712 400563 202981 197582
Urban 90568 454111 229088 225023 67416 34234 33182
19 Mizoram Total 160966 888573 459109 429464 143734 73176 70558
Rural 79362 447567 232726 214841 80466 40947 39519
Urban 81604 441006 226383 214623 63268 32229 31039
20 Nagaland Total 332050 1990036 1047141 942895 289678 147524 142154
Rural 265334 1647249 859716 787533 241197 122519 118678
Urban 66716 342787 187425 155362 48481 25005 23476
21 Orissa Total 7870127 36804660 18660570 18144090 5358810 2744552 2614258
Rural 6782879 31287422 15748970 15538452 4696358 2401932 2294426
Urban 1087248 5517238 2911600 2605638 662452 342620 319832
22 Punjab Total 4265156 24358999 12985045 11373954 3171829 1763801 1408028
Rural 2775462 16096488 8516596 7579892 2176726 1209856 966870
Urban 1489694 8262511 4468449 3794062 995103 553945 441158
23 Rajasthan Total 9342294 56507188 29420011 27087177 10651002 5579616 5071386
Rural 7156703 43292813 22426640 20866173 8587389 4486277 4101112
Urban 2185591 13214375 6993371 6221004 2063613 1093339 970274
24 Sikkim Total 104738 540851 288484 252367 78195 39842 38353
Rural 91723 480981 255774 225207 72017 36627 35390
Urban 13015 59870 32710 27160 6178 3215 2963
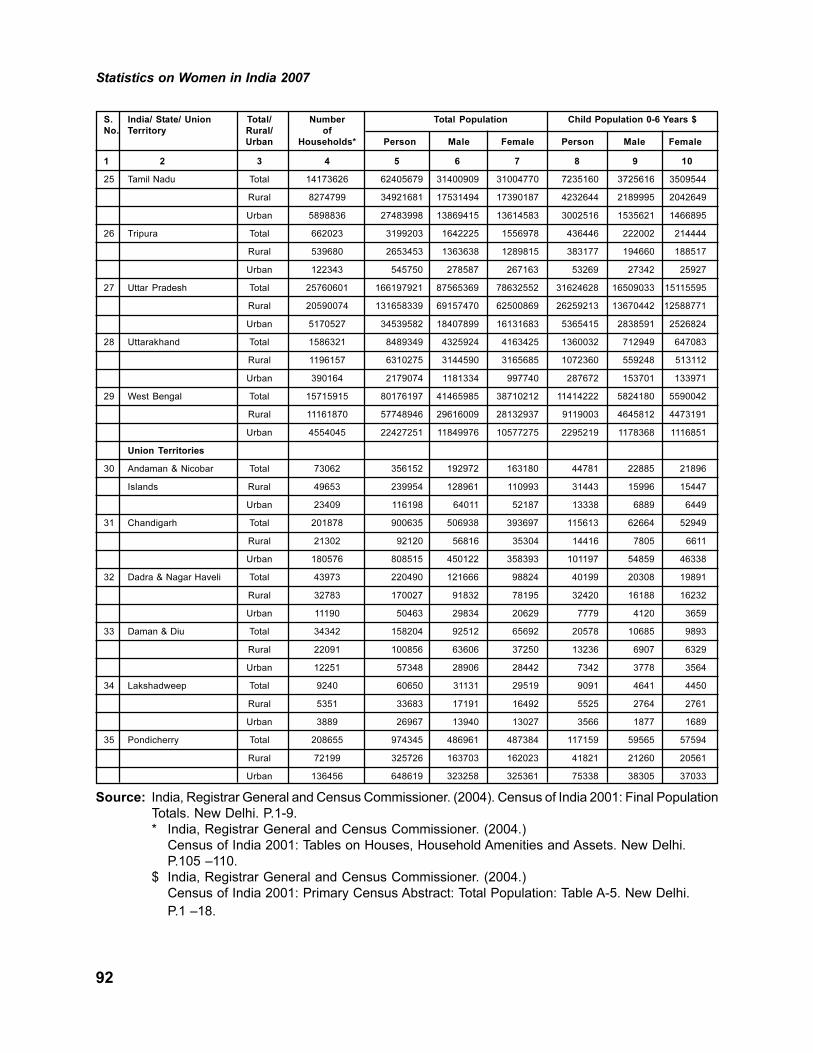
Statistics on Women in India 2007
92
S. India/ State/ Union Total/ Number Total Population Child Population 0-6 Years $No. Territory Rural/ of
Urban Households* Person Male Female Person Male Female
1 2 3 4 5 6 7 8 9 10
25 Tamil Nadu Total 14173626 62405679 31400909 31004770 7235160 3725616 3509544
Rural 8274799 34921681 17531494 17390187 4232644 2189995 2042649
Urban 5898836 27483998 13869415 13614583 3002516 1535621 1466895
26 Tripura Total 662023 3199203 1642225 1556978 436446 222002 214444
Rural 539680 2653453 1363638 1289815 383177 194660 188517
Urban 122343 545750 278587 267163 53269 27342 25927
27 Uttar Pradesh Total 25760601 166197921 87565369 78632552 31624628 16509033 15115595
Rural 20590074 131658339 69157470 62500869 26259213 13670442 12588771
Urban 5170527 34539582 18407899 16131683 5365415 2838591 2526824
28 Uttarakhand Total 1586321 8489349 4325924 4163425 1360032 712949 647083
Rural 1196157 6310275 3144590 3165685 1072360 559248 513112
Urban 390164 2179074 1181334 997740 287672 153701 133971
29 West Bengal Total 15715915 80176197 41465985 38710212 11414222 5824180 5590042
Rural 11161870 57748946 29616009 28132937 9119003 4645812 4473191
Urban 4554045 22427251 11849976 10577275 2295219 1178368 1116851
Union Territories
30 Andaman & Nicobar Total 73062 356152 192972 163180 44781 22885 21896
Islands Rural 49653 239954 128961 110993 31443 15996 15447
Urban 23409 116198 64011 52187 13338 6889 6449
31 Chandigarh Total 201878 900635 506938 393697 115613 62664 52949
Rural 21302 92120 56816 35304 14416 7805 6611
Urban 180576 808515 450122 358393 101197 54859 46338
32 Dadra & Nagar Haveli Total 43973 220490 121666 98824 40199 20308 19891
Rural 32783 170027 91832 78195 32420 16188 16232
Urban 11190 50463 29834 20629 7779 4120 3659
33 Daman & Diu Total 34342 158204 92512 65692 20578 10685 9893
Rural 22091 100856 63606 37250 13236 6907 6329
Urban 12251 57348 28906 28442 7342 3778 3564
34 Lakshadweep Total 9240 60650 31131 29519 9091 4641 4450
Rural 5351 33683 17191 16492 5525 2764 2761
Urban 3889 26967 13940 13027 3566 1877 1689
35 Pondicherry Total 208655 974345 486961 487384 117159 59565 57594
Rural 72199 325726 163703 162023 41821 21260 20561
Urban 136456 648619 323258 325361 75338 38305 37033
Source: India, Registrar General and Census Commissioner. (2004). Census of India 2001: Final Population
Totals. New Delhi. P.1-9.
* India, Registrar General and Census Commissioner. (2004.)
Census of India 2001: Tables on Houses, Household Amenities and Assets. New Delhi.
P.105 –110.
$ India, Registrar General and Census Commissioner. (2004.)
Census of India 2001: Primary Census Abstract: Total Population: Table A-5. New Delhi.
P.1 –18.

Statistics on Women in India 2007
93
The population of India by rural urban residence and percentage of urban population is
given in Table 13.
Table 13: Population by Rural Urban Residence and Urban Population
(%), 2001
S. India/State/UT Rural Urban Total UrbanNo. Population Population Population Population (%)
India 742490639 286119689 1028610328 27.82
1 Andhra Pradesh 55401067 20808940 76210007 27.30
2 Arunachal Pradesh 870087 227881 1097968 20.75
3 Assam 23216288 3439240 26655528 12.90
4 Bihar 74316709 8681800 82998509 10.46
5 Chhattisgarh 16648056 4185747 20833803 20.09
6 Delhi 944727 12905780 13850507 93.18
7 Goa 677091 670577 1347668 49.76
8 Gujarat 31740767 18930250 50671017 37.36
9 Haryana 15029260 6115304 21144564 28.92
10 Himachal Pradesh 5482319 595581 6077900 9.80
11 Jammu & Kashmir 7627062 2516638 10143700 24.81
12 Jharkhand 20952088 5993741 26945829 22.24
13 Karnataka 34889033 17961529 52850562 33.99
14 Kerala 23574449 8266925 31841374 25.96
15 Madhya Pradesh 44380878 15967145 60348023 26.46
16 Maharashtra 55777647 41100980 96878627 42.43
17 Manipur 1590820 575968 2166788 26.58
18 Meghalaya 1864711 454111 2318822 19.58
19 Mizoram 447567 441006 888573 49.63
20 Nagaland 1647249 342787 1990036 17.23
21 Orissa 31287422 5517238 36804660 14.99
22 Punjab 16096488 8262511 24358999 33.92
23 Rajasthan 43292813 13214375 56507188 23.39
24 Sikkim 480981 59870 540851 11.07
25 Tamil Nadu 34921681 27483998 62405679 44.04
26 Tripura 2653453 545750 3199203 17.06
27 Uttar Pradesh 131658339 34539582 166197921 20.78
28 Uttarakhand 6310275 2179074 8489349 25.67
29 West Bengal 57748946 22427251 80176197 27.97
Union Territories
30 Andaman & Nicobar Islands 239954 116198 356152 32.63
31 Chandigarh 92120 808515 900635 89.77
32 Dadra & Nagar Haveli 170027 50463 220490 22.89
33 Daman & Diu 100856 57348 158204 36.25
34 Lakshadweep 33683 26967 60650 44.46
35 Pondicherry 325726 648619 974345 66.57
Source: India, Ministry of Health and Family Welfare, Central Bureau of Health Inteligence. (2006). Health
Information of India 2005. New Delhi. P.11.

Statistics on Women in India 2007
94
The birth rate, death rate and natural growth rate is given in Table 14.
Table 14: Birth Rate, Death Rate and Natural Growth Rate, 2005
S. India/State/UTs Birth Rate Death Rate Natural Growth Rate
No. Total Rural Urban Total Rural Urban Total Rural Urban
India* 23.8 25.6 19.1 7.6 8.1 6.0 16.3 17.5 13.1
1. Andhra Pradesh 19.1 20.1 16.7 7.3 7.9 5.9 11.8 12.2 10.8
2. Arunachal Pradesh 23.3 24.4 18.7 5.0 5.5 2.8 18.3 18.9 15.9
3. Assam 25.0 26.6 15.3 8.7 9.2 5.6 16.3 17.4 9.6
4. Bihar 30.4 31.2 23.8 8.1 8.3 6.6 22.3 22.9 17.2
5. Chhattisgarh 27.2 29.0 20.0 8.1 8.4 6.9 19.1 20.6 13.1
6. Delhi 18.6 19.0 18.5 4.6 5.5 4.5 13.9 13.5 14.0
7. Goa 14.8 13.9 15.4 7.1 8.9 5.8 7.7 5.0 9.5
8. Gujarat 23.7 25.5 21.0 7.1 8.0 5.8 16.6 17.5 15.2
9. Haryana 24.3 25.7 21.0 6.7 7.0 5.8 17.6 18.7 15.1
10. Himachal Pradesh 20.0 20.7 13.3 6.9 7.1 4.7 13.1 13.6 8.6
11. Jammu & Kashmir 18.9 20.2 14.3 5.5 5.7 5.0 13.4 14.6 9.3
12. Jharkhand 26.8 28.8 18.7 7.9 8.4 5.7 18.9 20.4 13.0
13. Karnataka 20.6 22.1 17.9 7.1 7.9 5.6 13.5 14.2 12.3
14. Kerala 15.0 15.1 14.8 6.4 6.3 6.5 8.7 8.8 8.2
15. Madhya Pradesh 29.4 31.6 22.0 9.0 9.8 6.1 20.5 21.8 16.0
16. Maharashtra 19.0 19.6 18.2 6.7 7.4 5.7 12.3 12.2 12.5
17. Manipur 14.7 14.5 15.5 4.1 4.0 4.4 10.7 10.5 11.1
18. Meghalaya 25.1 27.3 15.1 7.5 7.9 6.0 17.5 19.4 9.1
19. Mizoram 18.8 23.2 14.4 5.1 6.2 4.1 13.7 17.1 10.3
20. Nagaland 16.4 16.5 16.1 3.8 4.0 3.1 12.6 12.5 13.1
21. Orissa 22.3 23.2 16.3 9.5 9.9 7.0 12.8 13.4 9.3
22. Punjab 18.1 18.8 17.0 6.7 7.2 5.8 11.4 11.6 11.2
23. Rajasthan 28.6 30.2 23.8 7.0 7.2 6.2 21.6 22.9 17.6
24. Sikkim 19.9 20.2 18.0 5.1 5.2 4.8 14.8 15.0 13.2
25. Tamil Nadu 16.5 16.9 16.0 7.4 8.2 6.2 9.2 8.7 9.8
26. Tripura 16.0 16.5 13.8 5.7 5.7 5.8 10.3 10.7 8.0
27. Uttar Pradesh 30.4 31.3 26.5 8.7 9.1 6.8 21.7 22.2 19.7
28. Uttarakhand 20.9 22.1 16.6 7.4 7.9 5.3 13.6 14.2 11.2
29. West Bengal 18.8 21.2 12.6 6.4 6.3 6.6 12.4 14.9 6.0
Union Territories
30. Andaman & Nicobar 15.7 17.5 12.6 4.7 5.3 3.6 11.1 12.2 9.0
Islands
31. Chandigarh 17.3 23.3 16.7 4.5 2.7 4.7 12.7 20.6 12.0
32. Dadra & Nagar Haveli 29.4 29.2 30.0 5.1 5.6 3.1 24.3 23.6 26.8
33. Daman & Diu 19.1 20.6 16.8 5.6 5.3 6.1 13.5 15.3 10.6
34. Lakshadweep 19.1 19.0 19.2 6.3 7.5 5.2 12.7 11.4 14.0
35. Pondicherry 16.2 16.9 15.8 7.1 8.0 6.7 9.0 9.0 9.1
Notes: * Excludes Nagaland (Rural) due to part-receipt of returns.
Source: India, Registrar General, Vital Statistics Division. (2006). Sample Registration System Bulletin
October 2006. New Delhi. P. 1.

Statistics on Women in India 2007
95
The infant mortality rate (IMR) and child mortality rate (CMR) is given in Table 15.
Table 15: Infant Mortality Rate (IMR) 2005 and Child Mortality Rate, 2000
S. India/State/UTs Infant Mortality Rate Infant Mortality Rate Child Mortality 2000
No. (IMR) 2002* (IMR) 2005 $ (per 1000 live births)#
(per 1000 live births) (per 1000 live births)
Total Male Female Total Rural Urban Child Under Five
Mortality** Mortality***
India 63 62 65 58 64 40 29.3 94.9
India (1990) 801 109.32
1. Andhra Pradesh 62 64 60 57 63 39 21.0 85.5
2. Arunachal Pradesh 38 36 40 37 39 17 37.4 98.1
3. Assam 70 70 71 68 71 39 21.4 89.5
4. Bihar 61 56 66 61 62 47 34.7 105.1
5. Chhattisgarh 64 61 66 63 65 52 - -
6. Delhi 33 29 38 35 44 33 9.0 55.4
7. Goa 16 17 16 16 16 15 10.5 46.8
8. Gujarat 60 55 66 54 63 37 24.0 85.1
9. Haryana 62 54 73 60 64 45 21.2 76.8
10. Himachal Pradesh 61 66 55 49 50 20 8.3 42.4
11. Jammu & Kashmir 43 45 40 50 53 39 16.1 80.1
12. Jharkhand 41 44 37 50 53 33 - -
13. Karnataka 55 56 53 50 54 39 19.3 69.8
14. Kerala 10 9 12 14 15 12 2.6 18.8
15. Madhya Pradesh 85 81 88 76 80 54 56.4 137.6
16. Maharashtra 45 48 42 36 41 27 15.0 58.1
17. Manipur 10 13 7 13 12 14 19.9 56.1
18. Meghalaya 66 64 69 49 50 42 36.2 122.0
19. Mizoram 5 9 2 20 26 10 18.4 54.7
20. Nagaland - - - 18 17 22 22.7 63.8
21. Orissa 87 95 79 75 78 55 25.5 104.4
22. Punjab 51 38 66 44 49 37 15.9 72.1
23. Rajasthan 78 75 80 68 75 43 37.6 114.9
24. Sikkim 25 23 27 30 31 15 28.4 71.0
25. Tamil Nadu 44 46 43 37 39 34 15.9 63.3
26. Tripura 33 35 31 31 31 29 - -
27. Uttar Pradesh 80 76 84 73 77 54 39.2 122.5
28. Uttarakhand 34 16 55 42 56 19 - -
29. West Bengal 49 53 45 38 40 31 19.9 67.6
Union Territories
30. Andaman & 23 17 29 27 30 18 - -
Nicobar Islands
31. Chandigarh 22 15 30 19 25 18 - -
32. Dadra & Nagar 51 51 52 42 45 29 - -
Haveli
33. Daman & Diu 30 46 12 28 32 21 - -
34. Lakshadweep 15 6 26 22 17 27 - -
35. Pondicherry 25 24 25 28 38 22 - -

Statistics on Women in India 2007
96
Notes: ** Child Mortality: The probability of dying between the first and fifth birthdays.
*** Under Five Mortality: The probability of dying before the fifth birthday.
1. Sample Registration System.
2. National Family Health Survey I, 1992-93.
Source: * India, Registrar General and Census Commissioner, Vital Statistics Division. (2004). Sample
Registration System: SRS Bulletin April 2004. New Delhi. P. 5
$ India, Registrar General and Census Commissioner, Vital Statistics Division. (2006). Sample
Registration System: SRS Bulletin October 2006. New Delhi. P. 1
# International Institute of Population Sciences. (2000). National Family Health Survey (NFHS-
2). Mumbai. P.194.
Infant Mortality Rate (death of children from 0-12 months per 1000 live births)
National Average : 58 ( Sample Registration System, SRS 2005)
States with IMR Below 30
Pondicherry (28), Daman & Diu (28), Andaman & Nicobar Islands (27), Lakshadweep
(22), Mizoram (20), Chandigarh (19), Nagaland (18), Goa (16), Kerala (14), Manipur
(13)
States with IMR Between 30 and 58
Andhra Pradesh (57), Gujarat (54), Jammu & Kashmir (50), Jharkhand (50), Karnataka
(50), Himachal Pradesh (49), Meghalaya (49), Punjab (44), Dadra & Nagar Haveli
(42), Uttarakhand (42), West Bengal (38), Arunachal Pradesh (37), Tamil Nadu (37),
Maharashtra (36), Delhi (35), Tripura (31), Sikkim (30)
States with IMR Above 59 per 1000 live births
Madhya Pradesh (76), Orissa (75), Uttar Pradesh (73), Assam (68), Rajasthan (68),
Chhattisgarh (63), Bihar (61), Haryana (60)
India has a high infant mortality rate (IMR) of 58 per 1,000 live births as indicated by the
Vital Statistics Division of the Office of the Registrar General and Census Commissioner of
India (2005). The IMR in rural and urban areas was 64 and 40 per 1,000 live births
respectively. The female infant mortality rate was 61 while for males it was 56 per 1,000
live births respectively.

Statistics on Women in India 2007
97
The infant mortality rate (IMR) for males and females in rural and urban areas is given
in Table 16.
Table 16: Infant Mortality Rate, Sex-wise and Rural Urban Distribution,
2005
S. India/State/ Union Infant Mortality Infant Mortality Infant Mortality
No. Territory Rate (IMR) 2005 Rate (IMR) 2005 Rate (IMR) 2005
(per 1000 live (per 1000 live (per 1000 live
births) Total births)Rural births)Urban
Total Male Female Total Male Female Total Male Female
India 58 56 61 64 62 66 40 37 43
1 Andhra Pradesh 57 56 58 63 62 64 39 38 40
2 Arunachal Pradesh 37 29 46 * * * * * *
3 Assam 68 66 69 71 69 72 39 36 43
4 Bihar 61 60 62 62 61 63 47 45 50
5 Chhattisgarh 63 63 64 65 65 66 52 49 55
6 Delhi 35 33 37 44 50 36 33 30 37
7 Goa 16 14 17 * * * * * *
8 Gujarat 54 52 55 63 61 64 37 36 38
9 Haryana 60 51 70 64 55 76 45 40 52
10 Himachal Pradesh 49 47 51 * * * * * *
11 Jammu & Kashmir 50 47 55 53 49 58 39 36 43
12 Jharkhand 50 43 58 53 45 62 33 31 35
13 Karnataka 50 48 51 54 54 55 39 37 42
14 Kerala 14 14 15 15 15 16 12 11 14
15 Madhya Pradesh 76 72 79 80 77 84 54 52 56
16 Maharashtra 36 34 37 41 40 42 27 25 29
17 Manipur 13 12 13 * * * * * *
18 Meghalaya 49 48 51 * * * * * *
19 Mizoram 20 18 22 * * * * * *
20 Nagaland 18 19 18 * * * * * *
21 Orissa 75 74 77 78 77 79 55 50 61
22 Punjab 44 41 48 49 46 51 37 32 43
23 Rajasthan 68 64 72 75 71 79 43 37 49
24 Sikkim 30 29 31 * * * * * *
25 Tamil Nadu 37 35 39 39 38 40 34 30 39
26 Tripura 31 30 31 * * * * * *
27 Uttar Pradesh 73 71 75 77 75 79 54 53 55
28 Uttarakhand 42 37 48 * * * * * *
29 West Bengal 38 38 39 40 40 40 31 28 35
Union Territories
30 Andaman & Nicobar Islands 27 26 27 * * * * * *
31 Chandigarh 19 17 22 * * * * * *
32 Dadra & Nagar Haveli 42 42 43 * * * * * *
33 Daman & Diu 28 27 28 * * * * * *
34 Lakshadweep 22 23 21 * * * * * *
35 Pondicherry 28 29 27 * * * * * *
Note: N.A: Not available due to part receipt of returns.
# : Inadequate sample to provide estimate.
Estimates of Infant mortality rate by sex are subject to year by year fluctuations.
* : Infant mortality rates for smaller States and Union Territories are based on three – years period
2003 – 05. On account of wide year – to – year fluctuations due to inadequate sample size, the infant
mortality rate by sex, separately for rural and urban areas is not given.
Source: India, Registrar General, Vital Statistics Division. (2006). Sample Registration System Bulletin October
2006. New Delhi. P.8.

Statistics on Women in India 2007
98
The sex ratio of women of all ages, expectation of life at birth, and maternal mortality
rate is given in Table 17.
Table 17: Sex Ratio, Expectation of Life at Birth, Maternal Mortality Rate,
2001-2006
S. India/State/UTs Sex Ratio Expectation of Life at Maternal
No. 2001@ Birth 2001-2006 # Mortality Rate
(per 1,00,000 Live
Births) 2003 $
Total Male Female
India 933 63.87 66.91 301 (SRS) 2003
540 (NFHS 2, 2000)
407 (SRS) 1998
437 (1990)
1. Andhra Pradesh 978 62.79 65.00 195
2. Arunachal Pradesh 893 - - -
3. Assam 935 58.96 60.87 490
4. Bihar 919 65.66 64.79 371
5. Chhattisgarh 989 - - 379
6. Delhi 821 - - -
7. Goa 961 - - -
8. Gujarat 920 63.12 64.10 172
9. Haryana 861 64.64 69.30 162
10. Himachal Pradesh 968 - - -
11. Jammu & Kashmir 892 - - -
12. Jharkhand 941 - - 371
13. Karnataka 965 62.43 66.44 228
14. Kerala 1058 71.67 75.00 110
15. Madhya Pradesh 919 59.19 58.01 379
16. Maharashtra 922 66.75 69.76 149
17. Manipur 978 - - -
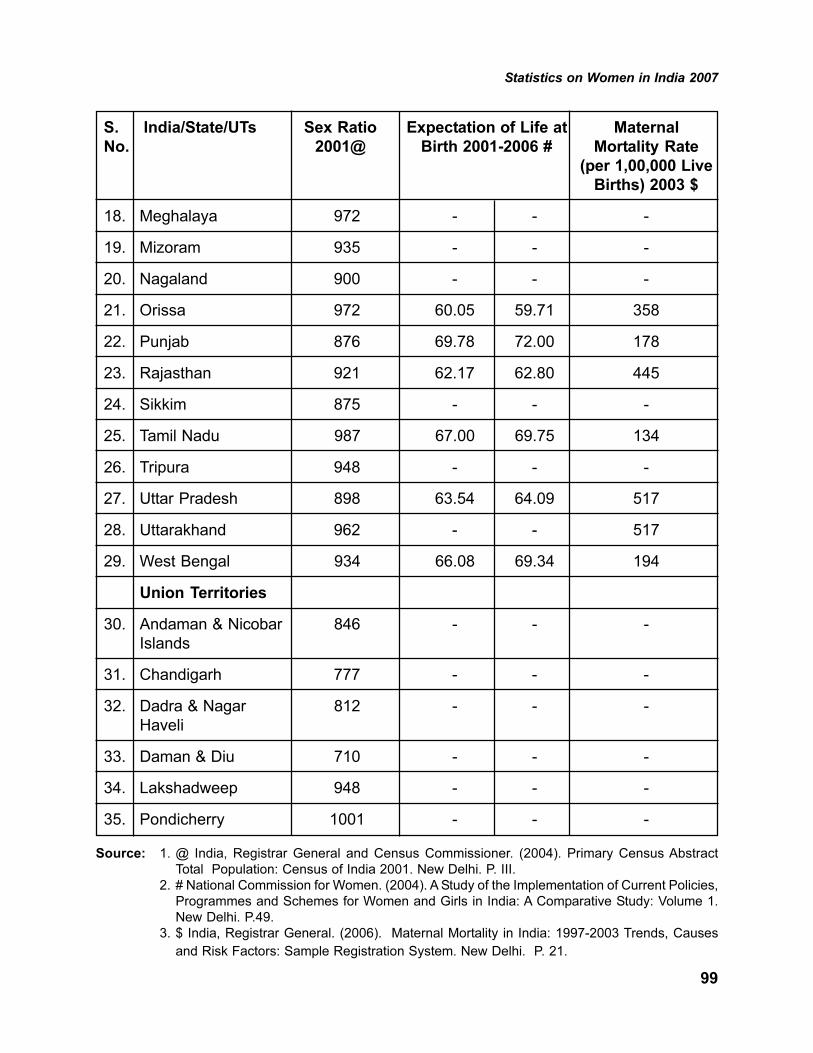
Statistics on Women in India 2007
99
S. India/State/UTs Sex Ratio Expectation of Life at Maternal
No. 2001@ Birth 2001-2006 # Mortality Rate
(per 1,00,000 Live
Births) 2003 $
18. Meghalaya 972 - - -
19. Mizoram 935 - - -
20. Nagaland 900 - - -
21. Orissa 972 60.05 59.71 358
22. Punjab 876 69.78 72.00 178
23. Rajasthan 921 62.17 62.80 445
24. Sikkim 875 - - -
25. Tamil Nadu 987 67.00 69.75 134
26. Tripura 948 - - -
27. Uttar Pradesh 898 63.54 64.09 517
28. Uttarakhand 962 - - 517
29. West Bengal 934 66.08 69.34 194
Union Territories
30. Andaman & Nicobar 846 - - -
Islands
31. Chandigarh 777 - - -
32. Dadra & Nagar 812 - - -
Haveli
33. Daman & Diu 710 - - -
34. Lakshadweep 948 - - -
35. Pondicherry 1001 - - -
Source: 1. @ India, Registrar General and Census Commissioner. (2004). Primary Census Abstract
Total Population: Census of India 2001. New Delhi. P. III.
2. # National Commission for Women. (2004). A Study of the Implementation of Current Policies,
Programmes and Schemes for Women and Girls in India: A Comparative Study: Volume 1.
New Delhi. P.49.
3. $ India, Registrar General. (2006). Maternal Mortality in India: 1997-2003 Trends, Causes
and Risk Factors: Sample Registration System. New Delhi. P. 21.

Statistics on Women in India 2007
100
The sex ratio of some select countries is given in Table 18.
Table 18: Sex Ratio of Select Countries, 1998 and 2007
S. No. Country Sex Ratio
(females per 1,000 males)
1998 2007 (estimated) *
1. China 944 943
2. India 933 943
3. U.S.A. 1,029 1,031
4. Indonesia 1,004 1,000
5. Brazil 1,025 1,020
6. Pakistan 938 952
7. Russian Fed. 1,140 1,163
8. Bangladesh 953 952
9. Japan 1,041 1,053
10. Nigeria 1,016 980
11. Sri Lanka - 1,042
World 986 990
Notes: World Population Prospects (mid year estimates) 1998 Revision, volume 2, Sex and Age, United
Nations.
Source: India, Registrar General and Census Commissioner. (2001). Provisional Population Totals: Paper
1 of 2001: Census of India 2001. New Delhi. P. 83.
* United Nations, Population Division. (2007). Internet : www.photicus.com dated 24.4.07
The sex ratio in India from 1901 to 2001 is given in Table 19.
Table 19: Sex Ratio, India, 1901-2001
Census Year Sex Ratio Sex Ratio
(females per 1,000 males) 0-6 Years (females per 1,000 males)
1901 972 N.A.
1911 964 N.A.
1921 955 N.A.
1931 950 N.A.
1941 945 N.A.
1951 946 N.A.
1961 941 976
1971 930 964
1981 934 962
1991 927 945
2001 933 927
Source: India, Registrar General and Census Commissioner. (2001). Provisional Population Totals : Paper
1 of 2001: Census of India 2001. New Delhi. P. 96, 154.

Statistics on Women in India 2007
101
Statewise sex ratio for all ages, and in the age group 0-6 years is given in Table 20.
Table 20: Sex Ratio of Total Population and Child Population in the Age
Group 0-6 Years, 1991 and 2001
S. India/ State/ UT Sex Ratio (Females per 1,000 Males)
No Total Child Population Population Aged
Population # in the Age Group 7 Years and
0-6 Years # Above $
1991 2001 1991 2001 1991 2001
India1,2 927 933 945 927 923 935
1. Andhra Pradesh 972 978 975 961 972 980
2. Arunachal Pradesh 859 893 982 964 829 888
3. Assam 923 935 975 965 910 926
4. Bihar 907 919 953 942 895 916
5. Chhattisgarh 985 989 984 975 986 992
6. Delhi# 827 821 915 868 810 813
7. Goa 967 961 964 938 967 964
8. Gujarat 934 920 928 883 936 927
9. Haryana 865 861 879 819 862 869
10. Himachal Pradesh 976 968 951 896 980 981
11. Jammu & Kashmir1 N.A 892 N.A 941 N.A 894
12. Jharkhand 922 941 979 965 908 936
13. Karnataka 960 965 960 946 960 966
14. Kerala 1,036 1058 958 960 1,049 1,071
15. Madhya Pradesh 912 919 941 932 905 918
16. Maharashtra 934 922 946 913 931 923
17. Manipur2 958 978 974 957 955 981
18. Meghalaya 955 972 986 973 947 974
19. Mizoram 921 935 969 964 911 932
20. Nagaland 886 900 993 964 865 899
21. Orissa 971 972 967 953 972 976
22. Punjab 882 876 875 798 883 886
23. Rajasthan 910 921 916 909 908 925
24. Sikkim 878 875 965 963 860 858

Statistics on Women in India 2007
102
S. India/ State/ UT Sex Ratio (Females per 1,000 Males)
No Total Child Population Population Aged
Population # in the Age Group 7 Years and
0-6 Years # Above $
1991 2001 1991 2001 1991 2001
25. Tamil Nadu 974 987 948 942 978 992
26. Tripura 945 948 967 966 940 947
27. Uttar Pradesh 876 898 927 916 863 895
28. Uttarakhand 937 962 949 908 933 976
29. West Bengal 917 934 967 960 907 929
Union Territories
30. Andaman & Nicobar 818 846 973 957 790 830
Islands
31. Chandigarh 790 777 899 845 772 763
32. Dadra & Nagar Haveli 952 812 1,013 979 937 779
33. Daman & Diu 969 710 958 926 971 682
34. Lakshadweep 943 948 941 959 943 943
35. Pondicherry 979 1001 963 967 982 1,007
Notes:
i) While working out sex ratio of child population for 1991 Census in the age group 0-6 and population
aged 7 and above for India, the population in the age group 0-6 and population aged 7 and above of
areas of Gujarat and Himachal Pradesh affected by natural calamities have been excluded. The details
of affected areas are given in Note numbers 2 and 3 below.
ii) To make the data comparable with Census of India, 2001, the proportion of child population for 1991
Census in the age group 0-6 and population aged 7 and above shown against Himachal Pradesh for
1991 excludes population in the age group 0-6 and population aged 7 and above of Kinnaur district
where population enumeration of Census of India, 2001, could not be conducted due to natural calamity.
iii) To make the data comparable with Census of India, 2001, the proportion of child population for 1991
Census in the age group 0-6 and population aged 7 and above shown against Gujarat excludes the
population data of entire Kachchh district, Morvi, Maliya-Miyana and Wankaner talukas of Rajkot district
and Jodiya taluka of Jamnagar district of Gujarat state where population enumeration of Census of
India, 2001, could not be conducted due to natural calamity.
iv) 1Excludes Jammu & Kashmir for ranking as 1991 Census Data is not available
v) 2Excludes figures of Paomata, Mao Maram and Puru sub-divisions of Senapati district of Manipur for
2001
Source: $ India, Registrar General and Census Commissioner. (2001). Provisional Population Totals:
Paper 1 of 2001: Census of India 2001. New Delhi. P. 92.
# India, Registrar General and Census Commissioner. (2004). Primary Census Abstract Total
Population: Census of India 2001. New Delhi. P. lii-liii.

Statistics on Women in India 2007
103
The sex ratio of total population and sex ratio of children aged 0-4 years is given in
table 21.
Table 21: Sex Ratio (Females per 1000 Males) and Sex Ratio Children
Aged 0-4 Years, 2002-2004
S. India/ Bigger States Sex Ratio Sex Ratio Children
No Aged 0-4 Years
Total Rural Urban Total Rural Urban
India 882 884 872 905 910 888
1. Andhra Pradesh 916 901 968 953 956 943
2. Assam 915 914 929 936 934 961
3. Bihar 863 865 841 892 894 879
4. Chhattisgarh 964 976 938 975 983 962
5. Delhi 835 787 842 858 859 857
6. Gujarat 855 876 807 841 856 807
7. Haryana 821 825 807 813 795 850
8. Himachal Pradesh 851 849 876 867 864 881
9. Jammu & Kashmir 816 807 867 890 891 883
10. Jharkhand 865 875 811 928 934 886
11. Karnataka 923 913 948 968 969 964
12. Kerala 889 876 931 940 935 958
13. Madhya Pradesh 916 916 918 910 912 899
14. Maharashtra 878 880 874 893 899 880
15. Orissa 944 950 891 940 946 881
16. Punjab 797 804 777 788 790 780
17. Rajasthan 838 837 842 889 891 881
18. Tamil Nadu 946 968 904 945 954 921
19. Uttar Pradesh 859 858 862 891 892 890
20. West Bengal 931 941 884 942 948 915
Source: India, Registrar General, Vital Statistics Division. (2006). Sample Registration System: Statistical
Report 2004. New Delhi. P. 34 & 36.
The projected population of adolescents to total population is given in Table 22.
Table 22: Percentage Distribution of Adolescent Population and Projected
Adolescent Population by Sex and Age Group, 1981-2016
Age 1981 1991 1996* 2001* 2006* 2011* 2016*Group
M F M F M F M F M F M F M F
10-14 13.2 12.6 11.9 11.6 12.0 11.5 12.1 12.1 10.5 10.6 8.9 9.0 8.7 8.7
15-19 9.9 9.4 9.7 9.1 9.9 9.5 11.0 10.5 11.2 11.2 9.7 9.9 8.3 8.3
Notes: 1. India, Central Statistical Organisation. (1998). Youth in India: Profile and Programmes 1998.
New Delhi: Central Statistical Organization, 1998. P. 23-24.
2. * Projected figures.
Source: United Nations Population Fund. (2000). Adolescents in India : A Profile. New Delhi. P.6.

Statistics on Women in India 2007
104
The age specific fertility rate is defined as the number of live births in a specific age
group of women per one thousand female population of that age group. It is the number of
live births in a particular age group divided by the mid-year female population of the same
age group multiplied by 1000. The age specific fertility rates in five year age groups are
given in Table 23.
Table 23: Age-Specific Fertility Rates (ASFRs) in India and Bigger States,
2004
S. India and Bigger Age-Specific Fertility Rates in Age Groups 2004
No States Age 15- Age 20- Age 25- Age 30- Age 35- Age 40- Age 45-
19 Years 24 Years 29 Years 34 Years 39 Years 44 Years 49 Years
India 51.6 218.3 171.2 85.8 38.0 16.8 7.9
1. Andhra Pradesh 77.2 206.6 91.9 25.8 8.7 2.7 0.6
2. Arunachal Pradesh
3. Assam 45.7 165.1 183.9 116.2 48.8 17.7 11.9
4. Bihar 65.2 259.7 238.2 146.9 78.6 42.2 30.1
5. Chhattisgarh 53.3 259.0 193.5 101.5 46.5 8.8 7.5
6. Delhi 24.5 159.3 148.4 65.3 22.8 7.8 1.3
7. Goa
8. Gujarat 41.6 229.4 179.6 79.0 26.7 9.4 3.1
9. Haryana 48.7 260.8 176.8 75.3 26.7 11.1 6.1
10. Himachal Pradesh 21.8 197.9 140.3 45.8 10.8 1.6 1.6
11. Jammu & Kashmir 10.1 108.9 170.1 106.4 52.7 20.9 9.2
12. Jharkhand 68.0 222.6 186.0 114.5 65.7 33.5 16.8
13. Karnataka 56.2 208.6 130.2 43.7 12.5 4.0 1.1
14. Kerala 21.3 135.1 124.4 53.1 12.8 1.2 0.2
15. Madhya Pradesh 67.9 292.8 210.3 98.0 47.8 21.0 9.2
16. Maharashtra 51.2 201.1 128.3 45.8 11.8 2.4 1.5
17. Manipur
18. Meghalaya
19. Mizoram
20. Nagaland
21. Orissa 34.5 185.1 172.8 84.7 38.8 15.0 7.7
22. Punjab 19.6 183.2 165.6 52.8 16.3 3.7 0.7
23. Rajasthan 57.2 276.7 212.8 112.1 52.2 24.4 12.6
24. Sikkim
25. Tamil Nadu 21.8 152.6 123.9 47.7 13.5 3.8 0.6
26. Tripura
27. Uttar Pradesh 48.7 270.1 258.2 153.0 85.0 42.7 20.2
28. Uttarakhand
29. West Bengal 79.2 175.1 110.4 46.5 20.0 9.6 3.2
Source : India, Registrar General and Census Commissioner, Vital Statistics Division. (2006). Sample
Registration System: Statistical Report 2004. New Delhi. P. 44.

Statistics on Women in India 2007
105
Total marital fertility rate (TMFR) is the cumulative value of age specific marital fertility
rates at the end of the reproductive period. It indicates the average number of children
expected to be born per married woman during the entire span of her reproductive period,
if the ASMFR continues to be the same and there is no mortality. The TMFR worked out
on the basis of ASMFR for the year 1999 and 2004 for India and bigger states for rural and
urban areas is given in Table 24.
Table 24: Total Marital Fertility Rate (TMFR) by Residence India and
Bigger States, 1999 and 2004
S. India and Bigger States Total Marital Fertility Rate (TMFR)
No. 1999 2004
Total Rural Urban Total Rural Urban
India* 4.7 4.9 4.2 4.4 4.6 3.9
1. Andhra Pradesh 3.5 3.5 3.5 3.4 3.5 3.0
2. Assam 6.1 6.2 5.1 5.0 5.4 3.1
3. Bihar 5.5 5.6 5.0 5.1 5.2 4.8
4. Chhattisgarh 5.0 5.2 4.1
5. Delhi 3.8 3.5 3.9
6. Gujarat 4.1 4.4 3.5 4.1 4.5 3.6
7. Haryana 4.5 4.5 4.6 4.7 4.8 4.4
8. Himachal Pradesh 4.9 4.9 4.4 4.6 4.7 3.7
9. Jammu & Kashmir 4.6 4.8 4.0
10. Jharkhand 4.7 4.9 4.0
11. Karnataka 4.4 4.6 4.2 4.0 4.2 3.7
12. Kerala 3.6 3.5 3.7 3.8 3.8 4.2
13. Madhya Pradesh 5.1 5.3 4.4 5.0 5.2 4.3
14. Maharashtra 3.8 3.7 3.9 3.7 3.8 3.6
15. Orissa 4.4 4.4 4.5 4.4 4.6 3.7
16. Punjab 4.8 4.9 4.7 4.2 4.2 4.2
17. Rajasthan 5.1 5.3 4.0 4.6 4.8 4.1
18. Tamil Nadu 3.8 3.8 3.8 3.6 3.6 3.8
19. Uttar Pradesh 6.1 6.2 5.9 5.8 5.9 5.4
20. West Bengal 4.0 4.2 3.6 3.5 3.7 3.0
Source: India, Registrar General and Census Commissioner, Vital Statistics Division. (2006). Sample
Registration System: Statistical Report 1999 and 2004. New Delhi. P. 55.

Statistics on Women in India 2007
106
Under Five Death Rates break up sex-wise and by rural urban status are given in Table 25.
Table 25: Under Five Death Rates by Sex and Residence India and Bigger
States, 2004
S. India and Bigger Total Rural UrbanNo. States
Total Male Female Total Male Female Total Male Female
India 17.0 16.6 17.5 19.1 18.7 19.6 10.1 9.8 10.5
1. Andhra Pradesh 13.8 14.2 13.3 16.2 16.8 15.7 7.9 8.3 7.4
2. Assam 21.3 24.2 18.2 23.0 26.2 19.6 8.4 8.9 7.9
3. Bihar 16.8 15.8 17.9 17.3 16.2 18.4 12.0 11.3 12.7
4. Chhattisgarh 19.3 23.4 14.9 20.7 25.6 15.4 11.9 11.6 12.2
5. Delhi 7.6 7.8 7.4 13.0 13.6 12.2 6.5 6.6 6.4
6. Gujarat 16.0 14.9 17.2 18.9 18.7 19.1 11.0 8.7 13.8
7. Haryana 17.7 15.7 20.1 19.8 18.2 21.8 12.3 9.3 16.0
8. Himachal Pradesh 11.9 11.7 12.2 12.7 12.4 12.9 2.9 2.8 3.1
9. Jammu & Kashmir 11.7 10.1 13.5 12.7 10.5 15.2 7.2 8.5 5.9
10. Jharkhand 13.8 12.4 15.3 15.0 14.0 16.1 7.7 4.6 11.3
11. Karnataka 12.8 13.2 12.4 15.1 14.9 15.3 8.6 10.1 7.0
12. Kerala 3.0 3.6 2.4 3.4 4.1 2.5 1.9 2.0 1.8
13. Madhya Pradesh 26.9 26.7 27.1 30.0 30.0 30.0 15.0 14.2 15.8
14. Maharashtra 8.7 7.6 9.8 10.4 8.5 12.5 6.0 6.2 5.8
15. Orissa 22.2 22.0 22.4 23.3 23.3 23.4 14.1 13.3 15.0
16. Punjab 12.2 10.3 14.4 13.6 11.6 16.1 9.7 8.2 11.5
17. Rajasthan 21.0 20.8 21.3 23.1 22.2 24.1 13.8 15.7 11.7
18. Tamil Nadu 10.1 11.0 9.1 11.1 11.9 10.3 8.7 9.8 7.4
19. Uttar Pradesh 24.3 22.5 26.4 25.9 24.1 28.0 16.8 14.9 19.0
20. West Bengal 10.4 11.5 9.3 115 12.9 10.1 6.3 6.4 6.3
Source: India, Registrar General and Census Commissioner, Vital Statistics Division. (2006). Sample
Registration System: Statistical Report 2004. New Delhi. P.83.

Statistics on Women in India 2007
107
The percentage distribution of deaths in five year age groups to total number of deaths
are given in Table 26.
Table 26: Distribution of Deaths to Total Deaths in India by Residence,
Sex and Age Group (Percentage), 2004
S. AgeGroup Deaths to Total Deaths (%)
No. (Years) Total Rural Urban
Person Male Female Person Male Female Person Male Female
1. Below 1 18.7 18.0 19.6 20.2 19.4 21.2 13.1 12.5 13.8
2. 1-4 5.7 4.5 7.1 6.3 5.0 7.8 3.5 2.7 4.4
3. 0-4 24.4 22.5 26.7 26.5 24.5 28.9 16.5 15.2 18.2
4. 5-9 2.3 2.2 2.5 2.5 2.4 2.7 1.5 1.3 1.7
5. 10-14 1.5 1.5 1.4 1.6 1.6 1.5 1.1 1.1 1.1
6. 15-19 2.1 1.9 2.4 2.1 2.0 2.3 2.2 1.8 2.8
7. 20-24 2.5 2.2 2.8 2.5 2.1 3.0 2.3 2.3 2.2
8. 25-29 2.5 2.5 2.5 2.4 2.4 2.5 2.7 3.0 2.4
9. 30-34 2.7 2.8 2.6 2.6 2.6 2.6 3.1 3.5 2.6
10. 35-39 2.8 3.2 2.2 2.7 3.0 2.3 3.2 4.1 2.0
11. 40-44 3.0 3.7 2.2 2.8 3.4 2.1 3.8 4.7 2.6
12. 45-49 3.3 4.0 2.5 3.0 3.6 2.4 4.4 5.4 3.1
13. 50-54 4.5 4.7 4.1 4.2 4.5 3.9 5.2 5.4 5.0
14. 55-59 5.1 5.5 4.7 5.0 5.3 4.6 5.8 6.2 5.3
15. 60-64 7.4 7.9 6.7 7.3 7.8 6.7 7.9 8.6 6.9
16. 65-69 7.9 8.1 7.6 7.6 7.8 7.4 8.7 8.9 8.3
17. 70-74 9.3 9.6 9.0 9.2 9.6 8.8 9.8 9.7 9.8
18. 75-79 6.3 6.4 6.1 6.0 6.2 5.7 7.2 6.9 7.7
19. 80-84 6.0 5.7 6.4 5.7 5.6 5.9 7.0 6.1 8.2
20. 85+ 6.4 5.7 7.3 6.1 5.7 6.6 7.7 5.6 10.3
All Ages 100.0 100.0 100.0 100.0 100.0 100.0 100.0 100.0 100.0
Source : India, Registrar General, Vital Statistics Division. (2006). Sample Registration System: Statistical
Report 2004. New Delhi. P.185.

Statistics on Women in India 2007
108
Maternal deaths due to various causes related to pregnancy are given in Table 27.
Table 27: Percentage Distribution of Deaths Due to Causes Related to
Child Birth and Pregnancy, 2003
S.No. Causes of Maternal Deaths 1995* 1998* 2003 $
1. Abortion 17.6 12.4 8
2. Toxaemia 7.9 9.9
3. Anaemia 17.0 23.7
4. Bleeding during Pregnancy and Puerperium 28.9 23.3 38
(Haemorrhage)
5. Mal-position of Child Leading to Death of Mother 4.0 7.4 5
(Obstructed Labour)
6. Puerperial Sepsis (Sepsis) 8.5 9.5 11
7. Not Classifiable (Other Conditions) 14.1 13.8 34
8. Hypertensive Disorders - - 5
Total 100.0 100.0 100.0
Notes: India, Registrar General, Vital Statistical Division. (1998). Survey of Causes of Death 1995 and
1998. New Delhi.
Source: * India, Ministry of Statistics and Programme Implementation, Central Statistical Organisation.
(2003). Women and Men in India 2002. New Delhi. P. 25.
$ India, Registrar General. (2006). Maternal Mortality in India: 1997-2003 Trends, Causes and
Risk Factors: Sample Registration System. New Delhi. P. 23.

Statistics on Women in India 2007
109
3. Girl Child
Although the Constitution of India guarantees equality to all citizens, the status of women
and girls is not at par with that of males in some sections of society. The skewed sex ratio
in the 0-6 years age group is an indicator of this fact. The Government of India has launched
several schemes and programmes for the welfare of the girl child, and reduce discrimination
against the girl child. Some of these are:
Girl Child Scheme/ Adolescent Girl Scheme
1. Sarva Shiksha Abhiyan (2002)
2. Balika Samriddhi Yojana (1997).
3. Kishori Shakti Yojana (2000)
4. Jan Shikshan Sansthan (1998)
5. District Primary Education Programme (1994)
6. Repoductive and Child Health Programme (1996)
7. Integrated Child Development Services (1975)
8. National Programme of Nutritional Support to Primary Education ( Mid Day Meal
Scheme) (!995)
Legislative Measures
Various legislations have been enacted for the protection of children. These are:
1. The Pre-natal Diagnostic Techniques (Regulation and Prevention of Misuse) Act, 1994.
2. The Medical Termination of Pregnancy Act, 1971.
3. Child Marriage Restraint Act, 1929 (Amended in 1979 & 2006).
4. Child Labour (Regulation and Prohibition) Act, 1986 (Amended in 2006).
5. Infant Milk Substitutes, Feeding Bottles and Infant Food (Regulation of Production,
Supply and Distribution) Act, 1992.
Discrimination against girls is evident from indicators such as enrolment of girls in
schools, drop out rates, and sex ratio in the age group 0-6 years, which are given in
Table 28.

Statistics on Women in India 2007
110
Table 28: Discrimination against the Girl Child, 2003-04
S. India/State/UT Sex Ratio School Enrolment 2003-2004 (%) Dropout RateNo. 2001 0-6 Classes I – VIII
Years* Classes I – V Classes VI – VIII 2003-04 (%)
Boys Girls Total Boys Girls Total Boys Girls Total
India 927 100.63 95.58 98.20 66.76 57.62 62.40 51.85 52.92 52.32
1. Andhra Pradesh 964 87.42 88.03 87.72 67.10 62.49 64.86 57.93 61.78 59.79
2. Arunachal Pradesh 961 115.35 103.47 109.56 67.99 59.06 63.60 64.38 62.46 63.52
3. Assam 964 88.22 88.09 88.16 66.02 61.15 63.65 69.54 72.41 70.81
4. Bihar 938 80.20 64.20 72.57 30.64 19.21 25.33 77.00 79.62 78.03
5. Chhattisgarh 975 123.69 122.86 123.29 78.51 62.21 70.52 - - -
6. Delhi 865 90.34 89.81 90.10 84.83 85.91 85.34 26.43 29.02 27.71
7. Goa 933 100.30 95.50 97.96 104.77 97.55 101.23 6.15 12.91 9.43
8. Gujarat 878 117.67 108.62 113.41 81.88 57.40 70.40 45.09 49.48 46.94
9. Haryana 820 73.53 77.31 75.25 68.24 62.40 65.51 19.03 23.92 21.26
10. Himachal Pradesh 897 106.10 106.88 106.47 99.91 96.49 98.24 13.29 15.32 14.28
11. Jammu & Kashmir 937 75.55 67.25 71.52 54.46 46.46 50.60 51.26 41.87 47.49
12. Jharkhand 966 86.70 71.10 79.09 42.47 32.19 37.54 - - -
13. Karnataka 949 110.53 107.23 108.91 78.95 73.32 76.20 50.29 50.94 50.59
14. Kerala 963 97.25 96.59 96.92 95.69 91.49 93.64 -12.55 -6.40 -9.54
15. Madhya Pradesh 929 112.11 100.68 106.59 71.78 53.88 63.30 44.41 49.99 46.81
16. Maharashtra 917 108.32 106.84 107.60 89.41 85.52 87.55 30.71 36.01 33.25
17. Manipur 961 139.30 135.64 137.51 86.95 81.57 84.33 31.52 29.59 30.61
18. Meghalaya 975 104.19 106.88 105.51 60.27 62.02 61.14 70.67 71.59 71.13
19. Mizoram 971 122.54 117.71 120.17 77.25 76.70 76.98 65.18 63.08 64.19
20. Nagaland 975 80.95 79.97 80.48 43.56 45.85 44.66 46.76 42.73 44.83
21. Orissa 950 114.23 107.44 110.91 58.13 49.69 54.01 64.58 57.51 61.72
22. Punjab 793 71.04 76.38 73.45 59.31 60.93 60.06 35.13 35.26 35.19
23. Rajasthan 909 120.18 109.41 115.07 74.30 47.22 61.54 64.64 73.87 68.50
24. Sikkim 986 116.54 116.48 116.51 52.02 61.63 56.75 76.63 69.62 73.29
25. Tamil Nadu 939 117.47 115.49 116.51 102.28 98.44 100.41 25.35 24.92 25.15
26. Tripura 975 125.73 119.68 122.76 75.34 70.23 72.84 62.64 66.10 64.29
27. Uttar Pradesh 916 96.69 92.58 94.75 53.61 42.97 48.64 44.96 39.48 42.84
28. Uttarakhand 906 106.10 107.66 106.85 81.08 79.59 80.36 - - -
29. West Bengal 963 107.45 107.21 107.33 65.90 62.57 64.28 62.72 64.92 63.77
Union Territories
30. Andaman & 965 118.78 113.23 116.05 100.13 91.41 95.85 18.67 19.07 18.86
Nicobar Islands
31. Chandigarh 845 72.00 70.77 71.44 69.19 69.85 69.50 -1.23 -2.91 -2.03
32. Dadra & Nagar 973 133.92 117.88 126.06 95.75 66.08 81.64 35.81 56.61 45.24
Haveli
33. Daman & Diu 925 111.66 111.01 111.35 100.85 94.11 97.62 12.05 23.14 17.36
34. Lakshadweep 974 111.65 100.93 106.37 104.04 89.77 97.09 -1.35 11.66 4.90
35. Pondicherry 958 121.94 118.72 120.37 121.89 117.37 119.68 -3.20 -6.11 -4.60
Source : * India, Registrar General and Census Commissioner. (2001). Provisional Population Totals :
Paper 1 of 2001 : Census of India 2001. New Delhi. P.92-94.
India, Ministry of Human Resource Development, Department of Education. (2006).
Annual Report 2005-2006. New Delhi. P.277, 282.

Statistics on Women in India 2007
111
The National Family Health Survey 2006 found that the two child norm is gradually
being accepted in the country, but this is more so among women who have two sons living.
The sex preference of women with two children living is given in Table 29.
Table 29: Sex Preference of Women with Two Children Living, Wanting
No More Children, (%), 2006
S. India/States/UTs Married Women Married Women Married Women Married WomenNo. with 2 Living Wanting No More Wanting No Wanting No More
Children, Wanting Children, with More Children, Children, withNo More Children Two Sons Living with One Son, Two Daughters
(%) (%) One Daughter Living (%)Living (%)
T R U T R U T R U T R U
India 83.2 79.9 88.9 89.9 88.6 92.1 88.1 85.3 92.8 62.1 54.4 74.7
1. Andhra Pradesh 91.5 91.2 92.0 94.1 94.7 92.8 93.6 93.5 93.9 85.0 83.2 88.5
2. Arunachal Pradesh 72.2 71.4 73.8 85.0 85.0 * 76.0 76.7 74.4 45.5 * *
3. Assam 82.9 79.8 93.8 85.2 82.8 94.2 89.7 87.6 96.5 67.1 60.3 87.2
4. Bihar 60.2 56.1 80.2 77.4 75.6 85.7 67.5 62.4 92.0 20.0 15.6 41.9
5. Chhattisgarh 75.3 71.2 87.2 85.7 83.3 94.4 77.3 73.1 88.4 46.8 33.3 73.0
6. Delhi 91.6 * * 95.2 * * 94.6 * * 70.7 * *
7. Goa 82.5 81.4 83.2 86.3 89.1 84.2 84.8 84.7 84.9 71.7 63.8 77.4
8. Gujarat 85.7 83.6 87.9 94.8 96.0 93.3 90.1 86.0 93.7 48.8 50.0 47.5
9. Haryana 87.8 87.8 87.6 97.4 97.7 96.7 91.8 91.4 92.7 25.8 17.9 *
10. Himachal Pradesh 96.3 96.2 96.6 99.5 99.5 98.8 99.4 99.4 99.4 63.7 62.0 74.1
11. Jammu & Kashmir 77.6 71.5 87.1 84.9 81.6 90.8 82.5 73.5 94.2 38.6 34.1 46.4
12. Jharkhand 64.3 55.6 82.7 79.9 72.7 96.5 69.3 60.5 85.8 32.1 22.7 51.4
13. Karnataka 88.4 87.8 89.2 92.7 92.5 93.1 91.4 90.9 92.3 76.9 72.9 80.8
14. Kerala 88.0 85.5 93.0 87.5 84.5 92.8 90.9 89.3 94.5 86.4 82.8 92.6
15. Madhya Pradesh 81.9 79.9 86.0 92.1 92.5 91.2 89.7 87.1 94.3 37.6 27.8 57.0
16. Maharashtra 88.0 87.4 88.5 95.5 97.5 93.1 92.8 94.2 91.5 55.1 36.5 69.2
17. Manipur 64.5 60.2 72.7 68.8 62.1 81.0 75.8 75.5 76.4 24.3 19.6 35.0
18. Meghalaya 36.0 27.3 55.4 33.1 25.9 45.5 44.2 36.2 61.4 27.1 14.3 60.7
19. Mizoram 43.0 35.0 48.0 51.4 * 63.6 51.7 51.2 51.9 35.4 * 35.7
20. Nagaland 57.8 52.1 67.7 62.2 57.5 67.9 60.7 53.5 75.0 46.7 40.5 57.7
21. Orissa 82.3 79.5 94.3 90.3 89.2 94.8 87.6 85.0 97.5 53.2 48.5 78.9
22. Punjab 91.2 90.8 91.7 96.5 97.9 94.1 95.3 95.1 95.7 43.4 31.6 *
23. Rajasthan 72.8 64.6 85.3 83.9 79.2 92.1 77.7 68.9 90.5 33.1 18.2 51.4
24. Sikkim 95.8 95.8 95.7 97.9 98.6 95.7 97.0 97.2 96.6 88.8 88.6 *
25. Tamil Nadu 94.6 94.1 95.2 96.3 96.0 96.7 95.9 96.0 95.7 90.0 85.6 94.4
26. Tripura 92.3 92.6 91.2 93.8 94.9 89.3 94.4 94.6 93.8 84.4 83.0 88.5
27. Uttar Pradesh 64.2 58.6 76.3 73.7 71.4 78.3 72.2 66.5 84.2 30.8 21.3 51.9
28. Uttarakhand 86.3 85.7 87.5 93.0 93.0 93.0 91.3 91.1 91.7 49.4 40.6 60.7
29. West Bengal 89.4 87.2 95.2 93.5 91.9 97.6 92.9 91.3 96.9 74.3 86.8 68.9
Note: *Not shown on fewer than 25 unweighted cases.
Source: International Institute for Population Sciences. (2006). National Family Health Survey (NFHS-3)
2005-06 India. Mumbai. P.3.

Statistics on Women in India 2007
112
4. Early Marriage
Early marriage is defined as a marriage in which the bride is below 18 years and the
groom is below 21 years. Girls who bear children before they close their adolescent
growth spurt remain physically under developed and have greater risk of complications of
pregnancy and maternal death. To reduce the incidence of child marriage, the Child Marriage
Restraint Act, 1929 was passed and amended in 1979.
Under this Act, unless there is anything repugnant in the subject or context, (a) “child”
means a person who, if a male, under 21 years of age and if a female, is under 18 years of
age ; (b) “child marriage” means a marriage to which either of the contracting parties is a
child; (c) “contracting party” to a marriage means either of the parties whose marriage is or
is about to be thereby solemnised; and (d) “minor” means a person of either sex who is
under 18 years of age.
Punishment under the Act: Whoever performs conducts or directs any child marriage
shall be punishable with simple imprisonment which may extend to three months and shall
also be liable to fine, unless he proves that he had reason to believe that the marriage was
not a child marriage.
The Child Marriage Act was amended in 2006 and the guardian who solemnizes a
child marriage can be punished with rigorous imprisonment which may extend to two years
and also be liable to fine which may extend up to rupees one lakh. However, no woman
can be imprisoned. Any person who attends a child marriage can also be penalized under
the Act.
Legislative Measures
To reduce and eliminate the incidence of child marriage, the following act has been
enacted:
1. Child Marriage Restraint Act, 1929 (Amended in 1979 & 2006).
Although the incidence of early marriage has come down from 50% in 1998-99 (NFHS-
II) to 44.5% in 2006 (NFHS-III) for India as a whole, the incidence of early marriage remains
above 60% in rural areas of Jharkhand (71.0%), Rajasthan (65.7%), Bihar (65.2%), West
Bengal (62.6%), Madhya Pradesh (62.0%), Andhra Pradesh (61.4%), Uttar Pradesh (61.1%)
and Chhattisgarh (60.3%).
Census of India 2001 found that there were nearly 300,000 married girls who became
mothers before the age of 15 years. Early motherhood places the mother and the child at
grave health risk. The incidence of early marriage and early motherhood is given in
Table 30.

Statistics on Women in India 2007
113
Table 30: Incidence of Early Marriage, 2006, and Early Motherhood in
India, 2001
S. India/States Percentage Women 20-24 Years No. of EverNo. Married before 18 Years 2006 Married Mothers
Below 15 Yearsof Age 2001 #
Total Rural Urban
India 44.5 52.5 28.1 296,790
1. Andhra Pradesh 54.7 61.4 41.2 12848
2. Arunachal Pradesh 40.6 39.8 42.5 267
3. Assam 38.0 41.3 23.3 7045
4. Bihar 60.3 65.2 37.3 31665
5. Chhattisgarh 51.8 60.3 25.4 4060
6. Delhi 21.2 41.1 61.6 2348
7. Goa 11.7 7.8 14.6 127
8. Gujarat 33.5 37.9 27.3 12300
9. Haryana 39.8 42.8 33.3 7605
10. Himachal Pradesh 12.3 12.2 13.6 1280
11. Jammu & Kashmir 14.0 17.1 4.9 5159
12. Jharkhand 61.2 71.0 33.6 5713
13. Karnataka 41.2 49.4 28.0 11822
14. Kerala 15.4 19.4 9.2 3504
15. Madhya Pradesh 53.0 62.0 31.1 16211
16. Maharashtra 38.8 48.9 28.9 15672
17. Manipur 12.7 13.2 11.7 349
18. Meghalaya 24.5 28.1 15.6 458
19. Mizoram 20.6 25.0 16.9 115
20. Nagaland 21.1 23.7 14.6 464
21. Orissa 36.3 38.7 24.3 8565
22. Punjab 19.4 20.4 17.7 8387
23. Rajasthan 57.1 65.7 35.8 21156
24. Sikkim 30.1 34.5 15.9 129
25. Tamil Nadu 21.5 26.1 17.2 15896
26. Tripura 41.0 41.7 37.8 728
27. Uttar Pradesh 53.0 61.1 30.0 73408
28. Uttarakhand 22.6 24.7 16.3 1987
29. West Bengal 53.3 62.6 31.5 27082
Union Territories
30. Andaman & Nicobar Islands 74
31. Dadra & Nagar Haveli 19
32. Daman & Diu 18
33. Lakshadweep 4
34. Pondicherry 112
35. Chandigarh 213
Source : International Institute for Population Sciences. (2006). National Family Health Survey-3, 2006.
Mumbai. P.3.
# National Centre for Advocacy Studies. (2005). Parliament Digest Monsoon Session 2005:
Bridging the Gap between Parliament and People: Gender, Agriculture, Natural Resources,
Social Development Indicators. New Delhi. P. 2.

Statistics on Women in India 2007
114
The percentage of never married, married, and widowed, divorced or separated women
is given in Table 31.
Table 31: Distribution of Population Age 10+ by Marital Status and Sex
in India and Bigger States, (Percentage), 2004
S.No India and Bigger Never Married Married Widowed/Divorced/States Separated
Total Males Females Total Males Females Total Males Females
India* 34.8 40.6 28.7 58.7 56.2 61.3 6.5 3.2 10.1
1. Andhra Pradesh 30.6 36.6 24.5 61.4 60.4 62.4 8.0 3.0 13.2
2. Assam 41.7 47.6 35.4 52.1 49.8 54.5 6.2 2.5 10.2
3. Bihar 32.9 38.9 26.3 61.9 57.4 66.8 5.2 3.7 6.9
4. Chattisgarh 33.2 37.3 29.1 60.8 59.0 62.6 6.0 3.7 8.3
5. Delhi 38.0 42.6 32.3 57.8 55.0 61.2 4.3 2.4 6.5
6. Gujarat 31.9 36.6 26.8 61.8 60.0 63.8 6.3 3.4 9.5
7. Haryana 36.1 41.7 29.8 58.9 55.4 62.8 5.0 2.8 7.4
8. Himachal Pradesh 36.0 41.8 30.3 56.8 54.6 59.0 7.2 3.7 10.7
9. Jammu & Kashmir 43.5 47.5 39.1 51.0 48.8 53.3 5.6 3.6 7.7
10. Jharkhand 34.6 40.0 28.6 59.9 57.0 63.0 5.6 3.0 8.3
11. Karnataka 36.1 43.2 28.8 55.8 54.5 57.2 8.1 2.3 14.0
12. Kerala 33.5 40.5 27.0 58.0 57.4 58.6 8.5 2.1 14.3
13. Madhya Pradesh 33.9 39.4 28.0 60.4 57.1 63.9 5.7 3.5 8.0
14. Maharashtra 33.5 39.8 26.8 59.1 57.4 61.0 7.4 2.9 12.1
15. Orissa 34.8 39.8 29.9 57.4 55.9 58.9 7.8 4.3 11.2
16. Punjab 36.6 41.8 30.8 57.7 54.9 60.8 5.7 3.3 8.4
17. Rajasthan 32.8 38.1 26.9 61.9 59.0 65.1 5.3 2.9 7.9
18. Tamil Nadu 33.9 40.0 27.8 57.9 57.1 58.7 8.2 2.9 13.5
19. Uttar Pradesh 37.5 43.0 31.4 56.8 52.8 61.3 5.7 4.2 7.3
20. West Bengal 33.9 40.4 27.0 59.4 57.4 61.6 6.6 2.2 11.5
Source: India, Registrar General, Vital Statistics Division. (2006). Sample Registration System: Statistical
Report 2004. New Delhi. P. 23.

Statistics on Women in India 2007
115
5. Child Labour
Children who are working before they attain the age of 14 years are termed as child
labour. The Government enacted “The Child Labour (Prohibition and Regulation) Act”,
1986 to prevent the employment of children in hazardous industries or in hazardous
processes. A high powered body, the National Authority for the Elimination of Child Labour
(NAECL), was constituted in September 1994 to lay down policies and programmes for
elimination of child labour, particularly in hazardous industries. In 1996, the Supreme Court
issued a directive ordering the setting up of a corpus fund “Child Labour Rehabilitation-
cum-Welfare Fund” with Rs.25,000 to be contributed by the employer of a child in a
hazardous industry, towards the compulsory primary education of all working children.
In 1981, out of a total population 685 million, working children were 13.6 million, which
was about 2 per cent of the total population. In 1991, out of a total population of 838.6
million, working children were 11.28 million, which was 1.34 per cent of the total population.
As per Census of India 2001, there were 12,666,377 child labourers in India. Out of the
total working population of 402,234,724 workers, including main and marginal workers,
working children constituted 3.15% of the total labour force. Out of a total population of
1.028 billion persons in India working children numbered 12.666 million, which was 1.23%
of the population.
Child Labour Act has been amended in 2001 and the scope of the Act has been extended
to prohibit employment of children in 70 hazardous occupations and processes, including
rag-picking and scavenging. In 2006, employment of children in domestic work and hotels
was included in the list of occupations where the employment of children was banned.
Legislative/Other Measures for Child Labour
1. Child Labour (Regulation and Prohibition Act), 1986 (Amended in 2000 & 2006)
2. National Child Labour Policy, 1987
3. National Child Labour Projects
4. International Programme on the Elimination of Child Labour (IPEC), 1992
5. Committee on Child Labour (Gurupadswamy : 1979)
6. Task Force on Child Labour (Singhvi : 1989)
7. National Commission on Rural Labour, 1991
8. National Authority for Elimination of Child Labour, 1994
9. The Children (Pledging of Labour) Act, 1933
10.The Factories Act, 1948
11. The Mines Act, 1952
12.The Motor Transport Workers Act, 1961
13.The Beedi and Cigar Workers (Condition of Employment), Act, 1966
14.The Plantation Labour Act, 1951
15.The Minimum Wages Act, 1948

Statistics on Women in India 2007
116
The incidence of child labour as revealed by Census of India 2001 is given in Table 32.
Table 32: Child Labour in India, 1991 and 2000
S. India/State/UTs Child Labour 1991 Child Labour 2000 $
No. Main Marginal Total Number Pecentage
India 9,082,141 2,203,208 11,285,349 10,404,869 100.00
1. Andhra Pradesh 1,537,293 124,647 1,661,940 18,62,168 17.89
2. Arunachal Pradesh 11,632 763 12,395 6,423 0.06
3. Assam 259,953 67,645 327,598 1,71,237 1.64
4. Bihar 795,444 146,801 942,245 5,45,796 5.24
5. Chhattisgarh - - - - -
6. Delhi 26,670 681 27,351 70,076 0.67
7. Goa 3,938 718 4,656 1,158 0.01
8. Gujarat 373,027 150,558 523,585 5,01,555 4.82
9. Haryana 89,030 20,661 109,691 70,677 0.67
10. Himachal Pradesh 30,771 25,667 56,438 56,461 0.51
11. Jammu & Kashmir NA NA NA 35,538 0.34
12. Jharkhand - - - - -
13. Karnataka 818,159 158,088 976,247 7,74,251 7.44
14. Kerala 28,590 6,210 34,800 19,747 0.18
15. Madhya Pradesh 997,940 354,623 1,352,563 6,89,355 6.62
16. Maharashtra 805,847 262,571 1,068,418 7,45,953 7.16
17. Manipur 13,478 3,015 16,493 3,651 0.03
18. Meghalaya 30,730 3,903 34,633 18,187 0.17
19. Mizoram 6,391 10,020 16,411 7,508 0.07
20. Nagaland 16,106 370 16,476 8,921 0.08
21. Orissa 325,250 127,144 452,394 3,41,749 3.28
22. Punjab 132,414 10,454 142,868 1,60,100 1.53
23. Rajasthan 490,522 283,677 774,199 11,85,873 1.39
24. Sikkim 5,254 344 5,598 2108 0.02
25. Tamil Nadu 523,125 55,764 578,889 4,29,229 4.12
26. Tripura 13,506 2,972 16,478 7,901 0.07
27. Uttar Pradesh 1,145,087 264,999 1,410,086 13,67,723 13.14
28. Uttarakhand - - - - -
29. West Bengal 593,387 118,304 711,691 82,553 7.93
Union Territories
30. Andaman &Nicobar Islands 758 507 1,265 1,557 0.01
31. Chandigarh 1,839 31 1,870 979 0.009
32. Dadra & NagarHaveli 2,677 1,739 4,416 1,378 0.01
33. Daman & Diu 741 200 941 595 0.005
34. Lakshadweep 17 17 34 111 0.001
35. Pondicherry 2,565 115 2,680 879 0.008
Source: India, Ministry of Labour. (2000). Annual Report 1999-2000. New Delhi. P.160.
$ Diwedi, H.K. (2004). Towards Eradicating Child Labour: Magnitude, Concern and Strategy. In
Labour and Development, 2004 Jun, 10(1): 80-112. Noida: V.V. Giri National Labour Institute.
P.84.

Statistics on Women in India 2007
117
The incidence of child labour in various Census years is given in Table 33.
Table 33: Child Labour in Census, 1971-2001
S.No India/State /UTs 1971 1981 1991 2001****
1. India 10753985 13640870 11285349 12666377
2. Andhra Pradesh 1627492 1951312 1661940 1363339
3. Arunachal Pradesh 17925 17950 12395 18482
4. Assam 239349 ** 327598 351419
5. Bihar 1059359 1101764 942245 1117500
6. Chhattisgarh 364572
7. Delhi 17120 25717 27351 418999
8. Goa 4656 4138
9. Gujarat 518061 616913 523585 485530
10. Haryana 137826 194189 109691 253491
11. Himachal Pradesh 71384 99624 56438 107774
12. Jammu & Kashmir 70489 258437 ** 175630
13. Jharkhand 407200
14. Karnataka 808719 1131530 976247 822615
15. Kerala 111801 92854 34800 26156
16. Madhya Pradesh 1112319 1698597 1352563 1085259
17. Maharashtra 988357 1557756 1068427 764075
18. Manipur 16380 20217 16493 28836
19. Meghalaya 30440 44916 34633 53940
20. Mizoram 6314 16411 26265
21. Nagaland 13726 16235 16467 45874
22. Orissa 492477 702293 452394 377594
23. Punjab 232774 216939 142868 177268
24. Rajasthan 587389 819605 774199 1262570
25. Sikkim 15661 8561 5598 16457
26. Tamil Nadu 713305 975055 578889 418801
27. Tripura 17490 24204 16478 21756
28. Uttar Pradesh 1326726 1434675 1410086 1927997
29. Uttarakhand 70183
30. West Bengal 11443 605263 711691 857087
Union Territories
31. Andaman & Nicobar Islands 572 1309 1265 1960
32. Chandigarh 1086 1986 1870 3779
33. Dadra & Nagar Haveli 3102 3615 4416 4274
34. Daman & Diu 7391 9378 941 729
35. Lakshadweep 97 56 34 27
36. Pondicherry 3725 3606 2680 190
Note: *1971 Census figures of Assam includes figures of Mizoram.**Census could not be conducted.*** Census figures 1971 in respect of Mizoram included under Assam.**** Includes marginal workers also.
Source: India, Ministry of Labour. (2006). Statewise Distribution of Working Children according to 1971, 1981, 1991
and 2001 Census in the Age Group 5-14 years: Internet. New Delhi : 2006. P.1.

Statistics on Women in India 2007
118
6. Health and Nutrition
For a nation’s progress it is essential that the health and nutrition of women and girls,
mothers of the new generation, is adequately cared for. Although the expectation of life at
birth for women has increased from 36.1 years in 1951 to 66.91 years in 2001-06, the
health and nutrition status of women and girls leaves much scope for improvement. The
dietary intake of women in low economic group was deficient by 500 to 600 calories. Other
factors influencing the poor status of women and girls are unsafe drinking water, inadequate
sanitation facilities, poor hygiene and housing conditions in rural and urban poor areas,
disproportionate workload, physical and mental violence, etc. Information on a few health
and nutrition indicators is given in the subsequent tables.
Health situation in India at a glance is given in Table 34.
Table 34: Commitment to Health: Access, Services and Resources, 2005
S.No Indicator Percentage
1. Population with sustainable access to improved sanitation (%)2000 33
2. Population with sustainable access to improved water source(%) 2004 86
3. One year olds fully immunized
• against tuberculosis (%) 2004 73
• against measles (%) 2004 56
4. Oral rehydration therapy use rate (%) b1996-2004 22
5. Contraceptive Prevalence Ratea (%) (% of married women ages 15-49) 48g
1996-2004b
6. Physicians (per 100,000 population) 1990-2004 b 60
7. Health expenditure – private (as % of GDP) 2003 3.6
8. Undernourished people (as % of total population) 2001/03a 20
9. Children under weight for age (% under age 5 ) 1996-2004 b 49
10. Children under height for age (% under age 5 ) 1996-2004b 45
11. Infants with low birth weight (%) 1996-2004 b 30
12. HIV Prevalence in age group 15-49 years a1 (%) 2005 0.9[0.5-1.5]
13. Malaria cases (per 100,000 people) c1 2000 7
14. Tuberculosis cases (per 100,000 people) c 2004 312
15. Prevalence of Smoking ( % of adults)f
• Women 2002-2004g1 17
• Men 2002-2004g1 47
Note: Sources of information are UNICEF, WHO, UNAIDS
a: Data usually to women aged 15-49 who are married or in union; the actual age range covered may vary
across countries.
a1 Data are point and range estimates based on estimation based on estimation models developed by the
Joint United Nations Programme on HIV/AIDS (UNAIDS). Range estimates are in swuare brackets.
b: Data refer to the most recent year available during the period specified.
c: Data refer to all forms of tuberculosis.
c1: Data refer to malaria cases reported to the World Health Organization (WHO) and may represent only a
fraction of the true number in a country.
f: The age range varies among countries, but in most is 18 and older or 15 and older.
g: Excluding the state of Tripura.
g1: Data refer to the most recent year available during the perios specified.
Source: United Nations Development Programme. (2006). Human Development Report 2006.
New York: Oxford University Press. P.303-314.

Statistics on Women in India 2007
119
Urban areas in India have many health facilities, comparable to the best in the world.
However, there are pockets where the urban infrastructure in many places also needs
strengthening for improved delivery of services.
The state-wise situation of urban infrastructure under special schemes is given in Table 35.
Table 35: Urban Health Infrastructure, 2005-06
S. India/ States/ UTs Urban Family Urban Health Sterlisation
No. Welfare Centres Posts Beds Scheme
1. Andhra Pradesh 131 0 330
2. Arunachal Pradesh 6 0 1
3. Assam 10 0 12
4. Bihar 26 0 55
5. Chhattisgarh 8 16 7
6. Delhi 69 28 81
7. Goa 0 0 0
8. Gujarat 113 28 382
9. Haryana 19 16 30
10. Himachal Pradesh 89 0 0
11. Jammu & Kashmir 12 0 17
12. Jharkhand 16 0 36
13. Karnataka 87 0 258
14. Kerala 0 0 135
15. Madhya Pradesh 55 83 65
16. Maharashtra 74 278 809
17. Manipur 2 0 3
18. Meghalaya 1 0 4
19. Mizoram 1 0 7
20. Nagaland 0 0 0
21. Orissa 10 8 3
22. Punjab 23 64 10
23. Rajasthan 61 90 22
24. Sikkim 1 0 0
25. Tamil Nadu 65 100 629
26. Tripura 9 0 0
27. Uttar Pradesh 78 141 115
28. Uttarakhand 3 9 0
29. West Bengal 111 0 288
Union Territories
30. Andaman &Nicobar Islands 0 0 0
31. Chandigarh 3 10 0
32. Dadra & NagarHaveli 0 0 0
33. Daman & Diu 0 0 0
34. Lakshadweep 0 0 0
35. Pondicherry 0 0 0
Total 1083 871 3299
Source: India, Ministry of Health and Family Welfare. (2006). Annual Report 2005-2006. New Delhi. P. 354.

Statistics on Women in India 2007
120
Safe Drinking Water
A vast section of the Indian population does not have access to safe drinking water,
which is the cause of many diseases such as cholera, typhoid, dysentery, jaundice
(hepatitis), etc. The status of rural habitations having access to safe drinking water and
those yet to be covered is given in Table 36.
Table 36: Rural Habitations Having Safe Drinking Water, 2004
S. No. India/States/ UTs Rural Habitations Having Safe Drinking Water
Not Covered Partially Fully Covered TotalCovered
India 5738 66845 1349710 1422293
1. Andhra Pradesh 0 732 69000 69732
2. Arunachal Pradesh 253 686 3359 4298
3. Assam 305 11625 58625 70555
4. Bihar 0 0 105340 105340
5. Chhattisgarh 0 0 50379 50379
6. Delhi 0 0 219 219
7. Goa 3 29 363 395
8. Gujarat 1 58 30210 30269
9. Haryana 0 0 6745 6745
10. Himachal Pradesh 0 7800 37567 45367
11. Jammu & Kashmir 777 2774 7633 11184
12. Jharkhand 0 0 100096 100096
13. Karnataka 0 8279 48403 56682
14. Kerala 0 7651 2112 9763
15. Madhya Pradesh 0 0 109489 109489
16. Maharashtra 392 23974 61564 85930
17. Manipur 0 1 2790 2791
18. Meghalaya 13 419 8204 8636
19. Mizoram 0 152 655 807
20. Nagaland 41 690 794 1525
21. Orissa 0 0 114099 114099
22. Punjab 927 1324 11198 13449
23. Rajasthan 2974 0 90972 93946
24. Sikkim 0 96 1583 1679
25. Tamil Nadu 0 0 66631 66631
26. Tripura 0 0 7412 7412
27. Uttar Pradesh 0 0 243508 243508
28. Uttarakhand 33 294 30657 30984
29. West Bengal 0 0 79036 79036
Union Territories
30. Andaman & Nicobar Islands 0 102 402 504
31. Chandigarh 0 0 18 18
32. Dadra & Nagar Haveli 19 41 456 516
33. Daman & Diu 0 0 32 32
34. Lakshadweep 0 10 0 10
35. Pondicherry 0 108 159 267
Source: India Ministry of Health & Family Welfare (MHFW), Central Bureau of Health Intelligence (CBHI).
(2006). Health Information of India 2005. New Delhi. Pg. 73.

Statistics on Women in India 2007
121
The rural health infrastructure in India is often plagued with inadequate resources of
trained manpower, equipment, medicines, electricity and transport. To reduce the high
maternal mortality rate of 301 per 1,00,000 live births, rural health infrastructure needs
strengthening. In 2005, National Rural Health Mission has been launched to provide
improved health care services in rural areas. The number of health centres, and trained
personnel available in rural areas is given in Table 37.
Table 37: Number of Primary Health Centres (PHC), Community HealthCentres (CHC), Doctors, Lady Health Visitors (LHV), and Multi-Purpose Workers (Female)/ Auxiliary Nurse Midwives (ANM)in Rural Areas, 2005
S. No. India/States/UTs Sub Primary CHCs ANMs Lady DoctorsCentres Health (2005) Health at PHCs
Centres Visitors (2005)(PHC) (LHVs)
(2005)
India 146026 23236 3346 133194 17371 203081. Andhra Pradesh 12522 1570 164 13740 1564 21372. Arunachal Pradesh 379 85 31 454 16 783. Assam 5109 610 100 5719 NA NA4. Bihar 10337 1648 101 NA NA NA5. Chhattisgarh 3818 517 116 3667 734 6286. Delhi 41 8 0 51 19 237. Goa 172 19 5 179 11 538. Gujarat 7274 1070 272 6508 952 8489. Haryana 2433 408 72 2818 289 86210. Himachal Pradesh 2068 439 66 1790 348 46711. Jammu and Kashmir 1879 334 70 1588 62 64312. Jharkhand 4462 561 47 NA NA NA13. Karnataka 8143 1681 254 8544 1170 204114. Kerala 5094 911 106 5565 873 94915. Madhya Pradesh 8874 1192 229 9345 1074 83916. Maharashtra 10453 1768 382 10699 2666 315817. Manipur 420 72 16 463 48 6718. Meghalaya 401 101 24 608 32 12319. Mizoram 366 57 9 345 57 3520. Nagaland 394 87 21 342 15 5321. Orissa 5927 1282 231 6768 998 135322. Punjab 2858 484 116 2602 313 37323. Rajasthan 10512 1713 326 11425 1358 150624. Sikkim 147 24 4 260 23 4825. Tamil Nadu 8682 1380 35 10112 1153 225726. Tripura 539 73 10 561 23 15227. Uttarakhand 1576 225 44 1486 181 18228. Uttar Pradesh 20521 3660 386 18146 2128 NA29. West Bengal 10356 1173 95 9070 1227 1319
Union Territories30. Andaman and Nicobar Islands 107 20 4 127 20 3631. Chandigarh 13 0 1 13 0 032. Dadra and Nagar Haveli 38 6 1 38 5 633. Daman and Diu 21 3 1 24 3 534. Lakshadweep 14 4 3 22 0 435. Pondicherry 76 39 4 115 9 63
Source: India, Ministry of Health & Family Welfare, Department of Family Welfare, Infrastructure Division. (2004).
Bulletin on Rural Health Statistics in India March 2006 (updated upto September, 2005). New Delhi. P. 27, 35,
38, 40.

Statistics on Women in India 2007
122
The maternal mortality rate (MMR) of developed countries ranges between 4 and 20.
India’s maternal mortality rate of 301 maternal deaths per 100,000 live births is unacceptably
high and all efforts are being made to increase the number of institutional deliveries, so
that emergency medical services can be provided when needed. Rural areas lack all weather
roads and transport services, blood banks, operation theatres and other support services.
The aim must be to ensure that every delivery takes place in a hospital. The incidence of
safe delivery and assisted delivery is given in Table 38.
Table 38: Safe Delivery and Assisted Delivery among Women, 2006
S.No. India/States/ UTs Births Assisted by Institutional
Doctor/ Nurse/ Health Deliveries (%)
Personnel (%)
Total Rural Urban Total Rural Urban
India 48.3 39.1 75.2 40.7 31.1 69.4
1. Andhra Pradesh 74.2 66.1 89.1 68.6 60.5 85.02. Arunachal Pradesh 33.4 20.8 65.4 30.8 18.8 61.43. Assam 31.2 27.5 62.4 22.7 18.3 59.04. Bihar 30.9 27.6 56.1 22.0 18.6 47.75. Chhattisgarh 44.3 38.5 74.0 15.7 7.5 58.06. Delhi 65.1 - - 60.7 - -7. Goa 94.3 93.8 94.6 92.6 92.4 92.68. Gujarat 64.7 54.6 83.9 54.6 42.2 78.09. Haryana 54.2 45.9 79.0 39.4 30.3 66.710. Himachal Pradesh 50.2 47.6 78.4 45.3 42.1 79.111. Jammu & Kashmir 60.5 54.8 83.0 54.3 48.8 75.812. Jharkhand 28.7 20.8 62.2 19.2 11.0 54.113. Karnataka 71.3 61.9 87.7 66.9 56.7 84.814. Kerala 99.7 95.5 100.0 99.5 99.3 100.015. Madhya Pradesh 37.1 28.0 66.4 29.7 20.2 59.916. Maharashtra 70.7 56.5 87.6 66.1 50.5 84.817. Manipur 61.7 52.8 85.2 49.3 40.9 71.218. Meghalaya 31.7 22.2 78.1 29.7 20.4 75.019. Mizoram 69.4 47.4 91.1 64.6 39.1 89.820. Nagaland 25.9 17.9 54.3 12.2 6.6 32.021. Orissa 46.4 42.9 68.9 38.7 34.6 65.022. Punjab 68.6 67.4 70.7 52.5 48.4 60.223. Rajasthan 43.2 34.6 77.0 32.2 23.3 67.724. Sikkim 55.8 50.2 92.4 49.0 43.1 87.625. Tamil Nadu 93.2 90.6 96.4 90.4 86.7 94.926. Tripura 50.0 45.4 79.7 48.9 44.8 75.727. Uttar Pradesh 29.2 23.8 50.5 22.0 17.5 39.928. Uttarakhand 41.5 34.4 64.6 36.0 28.6 59.929. West Bengal 45.7 96.8 80.2 43.1 33.8 79.2
Union Territories
30. Andaman & Nicobar Islands 71.7 $31. Chandigarh 71.3 $32. Dadra & Nagar Haveli N.A33. Daman & Diu 89.9 $34. Lakshadweep N.A
35. Pondicherry 93.6 $
Source: International Institute for Population Sciences. (2006). National Family Health Survey-3, 2006 :India. Mumbai. P.1.$ India, Ministry of Health and Family Welfare. (2000). Annual Report 1999-2000. New Delhi.P.58-59.

Statistics on Women in India 2007
123
International Institute for Population Sciences conducted the NFHS-III survey on
maternal health services in 2006, and the percentage of mothers receiving antenatal and
post natal care is given in Table 39.
Table 39: Mothers Receiving Antenatal and Post Natal Care, 2006
S. India/State/ UT Mothers Who Had at Mothers Who Mothers Who ReceivedNo. least 3 Antenatal Visits Consumed IFA for Post Natal Care within
for Last Birth (%) 90 Days when 2 Days of Delivery (%)Pregnant (%)
Total Rural Urban Total Rural Urban Total Rural Urban
India 50.7 42.8 73.8 22.3 18.1 34.5 36.4 28.1 60.7
1. Andhra Pradesh 86.0 84.0 90.2 39.3 35.8 46.2 69.8 63.7 82.3
2. Arunachal Pradesh 36.4 28.3 56.6 11.6 6.6 24.3 23.3 15.2 43.4
3. Assam 36.3 32.3 68.9 15.6 13.7 31.1 13.8 10.9 37.1
4. Bihar 16.9 14.5 36.2 9.7 7.9 24.7 15.3 13.1 33.0
5. Chhattisgarh 54.7 49.2 82.3 21.8 19.7 32.1 25.3 17.6 63.6
6. Delhi 74.4 - - 38.3 - - 50.4 - -
7. Goa 95.0 93.2 96.4 72.0 63.3 78.9 78.4 75.8 80.4
8. Gujarat 64.9 55.8 81.5 35.7 28.9 48.3 54.0 43.8 72.7
9. Haryana 58.8 52.8 75.5 28.3 23.1 42.9 40.6 32.5 63.3
10. Himachal Pradesh 62.6 61.2 76.2 38.6 37.7 46.9 40.8 39.6 52.3
11. Jammu & Kashmir 74.2 69.9 90.5 27.5 25.5 35.1 48.0 41.4 73.0
12. Jharkhand 36.1 28.8 67.1 14.6 11.9 25.9 17.0 10.5 44.0
13. Karnataka 79.3 73.4 89.3 40.0 34.7 48.9 61.0 55.6 70.2
14. Kerala 93.9 92.4 96.9 77.3 76.3 79.2 87.7 91.1 86.1
15. Madhya Pradesh 40.2 34.6 58.4 11.8 9.2 20.2 27.9 20.1 53.4
16. Maharashtra 75.3 65.5 86.3 30.5 30.5 30.5 58.8 48.7 70.4
17. Manipur 70.1 64.0 85.9 13.9 10.8 21.8 49.1 40.9 70.1
18. Meghalaya 53.4 47.8 81.0 16.6 13.3 32.7 28.8 20.7 68.5
19. Mizoram 57.8 41.3 75.1 25.0 16.4 34.0 51.5 32.0 72.1
20. Nagaland 31.6 23.9 57.9 3.5 1.8 9.0 11.3 5.7 30.5
21. Orissa 60.9 58.0 79.2 32.8 31.4 42.0 38.3 35.9 21.5
22. Punjab 72.5 70.2 76.7 26.1 24.2 29.6 55.3 51.6 61.9
23. Rajasthan 41.2 32.5 74.7 12.8 8.1 30.7 28.9 21.7 56.8
24. Sikkim 69.4 65.0 96.1 39.4 36.2 58.8 48.5 42.9 82.4
25. Tamil Nadu 96.5 94.8 98.5 43.2 39.2 47.9 89.6 86.6 93.0
26. Tripura 58.7 56.5 72.5 18.6 16.3 33.3 26.7 26.1 30.4
27. Uttar Pradesh 26.3 22.6 40.9 8.7 6.7 16.4 14.2 9.9 31.1
28. Uttarakhand 44.8 36.2 71.5 26.2 20.8 43.0 30.2 23.1 52.3
29. West Bengal 62.4 55.8 87.3 24.3 20.8 37.4 37.8 29.9 67.4
Note: The survey was not conducted in Union Territories.
Source: International Institute for Population Sciences. (2006). National Family Health Survey - 3,
2006 : India and States Factsheets. Mumbai. P.3.

Statistics on Women in India 2007
124
The percentage of ever married women who make decisions regarding their own health
care is given in Table 40.
Table 40 : Decision Making by Ever Married Women Aged 15-49 Years
on Own Health Care (Percentage), 1998-99.
S.No. India/States/UTs Decision Making on HealthCare by Married Women Aged
15-49 Years (%)
India 51.6
1. Andhra Pradesh 56.1
2. Arunachal Pradesh 70.0
3. Assam 65.1
4. Bihar 47.6
5. Chhattisgarh -
6. Delhi 68.7
7. Goa 61.6
8. Gujarat 71.4
9. Haryana 67.2
10. Himachal Pradesh 80.8
11. Jammu & Kashmir 55.5
12. Jharkhand -
13. Karnataka 49.3
14. Kerala 72.6
15. Madhya Pradesh 36.6
16. Maharashtra 49.9
17. Manipur 43.3
18. Meghalaya 78.9
19. Mizoram 73.2
20. Nagaland 69.4
21. Orissa 38.6
22. Punjab 78.5
23. Rajasthan 40.6
24. Sikkim 60.2
25. Tamil Nadu 61.1
26. Tripura N.A
27. Uttar Pradesh 44.8
28. Uttarakhand -
29. West Bengal 45.1
Union Territories
30. Andaman & Nicobar Islands N.A
31. Chandigarh N.A
32. Dadra & Nagar Haveli N.A
33. Daman & Diu N.A
34. Lakshadweep N.A
35. Pondicherry N.A
Source: International Institute for Population Sciences. (2000). National Family Health Survey– 2,
1998-99: India. Mumbai. P. 440.

Statistics on Women in India 2007
125
The percentage of children below 3 years who were fully immunized and who received
a dose of Vitamin A supplementation is given in Table 41.
Table 41: Child Immunization and Vitamin A Supplementation, 2006S. No India/States/UT Children 12 -23 Children 12-23 Children 12-23 Children 12-23 Children 12-23 Children age 12-35
Months Fully Months Who Months Who Months Who Months Who Months Who
Immunized Received Received 3 Doses Received Received Received a Vitamin
(BCG, Measles BCG (%) of Polio Vaccine 3 Doses of Measles Vaccine A Dose in Last
and 3 Doses Each (%) DPT Vaccine (%) (%) 6 Months (%)
of Polio/DPT) (%)
T R U T R U T R U T R U T R U T R U
India 43.5 38.6 57.5 78.2 75.1 86.9 78.2 76.5 83.1 55.3 50.4 69.1 58.8 54.2 71.7 21.0 20.4 22.7
1. Andhra Pradesh 46.0 42.9 51.2 92.9 93.2 92.5 79.2 76.9 83.1 61.4 57.8 67.6 69.4 70.1 68.3 21.4 21.0 22.4
2. Arunachal Pradesh 28.4 21.1 51.2 57.7 55.3 65.1 55.8 53.5 62.8 39.3 32.5 60.5 38.3 33.3 53.5 17.4 16.0 21.3
3. Assam 31.6 31.9 29.3 62.6 60.8 75.9 59.2 59.8 55.2 45.1 44.6 48.3 37.5 37.3 39.7 16.6 17.1 12.9
4. Bihar 32.8 31.1 45.6 64.7 63.9 70.6 82.4 81.3 90.4 46.1 45.2 52.2 40.4 39.3 48.5 29.4 30.7 19.8
5. Chhattisgarh 48.7 43.1 74.7 84.6 82.7 93.3 85.1 82.7 96.0 62.8 57.9 85.3 62.5 58.4 81.3 12.7 10.7 22.9
6. Delhi 63.2 - - 87.0 - - 79.1 - - 71.7 - - 78.2 - - 17.1 - -
7. Goa 78.6 73.0 83.5 96.8 95.5 97.9 87.2 85.6 88.7 87.5 83.8 90.7 91.2 88.3 93.8 37.3 42.3 33.3
8. Gujarat 45.2 40.1 54.7 86.4 84.7 89.6 65.3 61.9 71.7 61.4 58.4 67.0 65.7 61.4 73.6 17.1 17.9 15.7
9. Haryana 65.3 60.3 82.2 84.9 83.7 88.9 82.8 81.0 88.9 74.2 71.2 84.4 75.5 72.8 84.4 13.0 11.7 17.0
10. Himachal Pradesh 74.2 73.6 80.0 97.2 97.1 98.0 88.6 87.9 96.0 85.1 85.0 86.0 86.3 85.7 92.0 28.9 28.3 34.3
11. Jammu & Kashmir 66.7 64.9 73.0 90.9 89.2 96.8 82.2 81.6 84.1 84.5 83.2 88.9 78.3 75.7 87.3 15.2 12.4 25.9
12. Jharkhand 34.5 29.8 51.0 72.9 68.2 89.6 79.6 78.8 82.3 40.3 34.8 59.4 48.0 44.4 60.4 23.3 24.4 19.1
13. Karnataka 55.0 52.2 59.6 87.8 85.8 91.1 73.8 71.3 78.1 74.0 72.0 77.4 72.0 67.5 79.5 17.1 16.4 18.2
14. Kerala 75.3 69.4 87.5 96.3 94.6 100 83.1 78.9 91.7 84.0 79.6 93.1 82.1 76.9 93.1 38.2 38.4 37.7
15. Madhya Pradesh 40.3 31.5 68.7 80.5 77.0 91.4 75.6 71.8 87.6 49.8 41.6 75.8 61.4 56.4 77.4 16.1 14.6 21.0
16. Maharashtra 58.8 49.8 68.0 95.3 93.5 97.0 73.4 63.7 83.4 76.1 69.7 82.7 84.7 82.6 32.0 29.9 34.2 29.9
17. Manipur 46.8 42.8 59.6 80.0 77.0 89.5 77.5 75.7 83.3 61.2 56.8 75.4 52.8 49.1 64.9 15.4 12.6 22.4
18. Meghalaya 32.8 32.9 32.3 66.3 63.6 78.5 56.9 55.9 61.5 47.6 47.6 47.7 43.8 42.7 49.2 19.9 18.2 28.0
19. Mizoram 46.4 36.2 57.4 87.4 81.2 94.1 63.2 55.0 72.1 66.6 57.5 76.5 68.7 58.7 79.4 42.2 42.8 41.6
20. Nagaland 21.0 17.3 35.6 45.9 40.4 67.5 46.4 39.6 73.0 28.8 23.9 47.9 27.4 22.4 47.2 8.7 6.5 16.6
21. Orissa 51.8 51.6 52.7 83.6 84.0 81.3 65.1 64.3 69.2 67.9 68.4 64.8 66.5 68.0 58.2 25.6 25.9 24.0
22. Punjab 60.1 58.1 64.4 88.0 86.2 91.8 75.9 74.9 78.1 70.5 68.9 74.0 78.0 76.0 82.2 17.0 14.8 21.2
23. Rajasthan 26.5 22.1 44.3 68.5 66.7 76.1 65.2 63.0 73.9 38.7 32.6 63.6 42.7 38.4 60.2 13.2 11.7 19.0
24. Sikkim 69.6 66.7 85.4 95.9 95.6 97.6 85.6 83.3 97.6 84.3 82.2 95.1 83.1 82.2 87.8 21.8 19.7 33.8
25. Tamil Nadu 80.8 83.6 77.8 99.5 99.3 99.7 87.8 89.6 85.8 95.7 97.0 94.2 92.4 93.3 91.5 37.2 32.4 42.8
26. Tripura 49.7 47.9 * 81.1 80.2 * 65.3 64.6 * 60.2 59.4 * 59.9 58.3 * 38.0 37.4 41.7
27. Uttar Pradesh 22.9 20.5 32.6 61.0 59.6 66.6 87.5 87.1 89.3 30.0 27.8 38.7 37.5 34.7 48.7 7.3 6.9 8.7
28. Uttarakhand 60.0 57.4 67.2 83.5 83.2 84.4 80.3 79.4 82.8 67.1 66.5 68.7 71.6 70.3 75.0 15.6 14.1 19.7
29. West Bengal 64.3 62.8 70.3 90.1 89.1 94.2 80.7 79.7 85.0 71.5 69.5 79.4 74.7 73.7 78.7 41.2 44.4 28.4
Note: T: Total; R: Rural; U: Urban;
Not shown based on fewer than 25 unweighted cases.
Union Territories were not covered in the survey.
Source: International Instiute for Population Sciences. (2006). National Family Health Survey (NFHS-3)
2006: Data Sheets. Mumbai. P.3.
The death rate in India in 2005 is 7.6 per 1,00,000 population, as per statistics from the
Vital Statistics Division of the Office of the Registrar General and Census Commissioner of
India (October 2006). The death rate in rural and urban areas is 8.1 and 6.0 per 1,00,000
population respectively. The various causes of death among the general population, infants
and children, and women are given in the subsequent tables.

Statistics on Women in India 2007
126
The major causes of infant mortality are given in Table 42 .
Table 42: Major Causes of Infant Mortality in India, 2003
S. No. Causes of Infant Deaths Share of Total Infant Deaths (%)
1. Prematurity 51
2. Unclassified 18
3. Acute Respiratory Infection (ARI) 17
4. Congenital Malformation 5
5. Diarrhoea 4
6. Birth Injury 3
7. Cord Infection 2
Total 100
Source: India, Ministry of Health and Family Welfare. (2006). Annual Report 2005-2006. New Delhi. P.51.
Infant mortality is a sensitive indicator showing the level of human development or a
nation. Efforts are being made to going down IMR to below 30 per 1000 live births as per
the Millennium Development Goals set for 2010 A.D. The major share of infant mortality is
contributed by neonatal mortality, which is the death of infants from birth to 28 days. The
share of various states to the neonatal mortality in India is given in Table 43.
Table 43: Burden of Neonatal Deaths in India State-wise, 2002
S. No. India/ States Population of the IMR (per 1000 Burden of NeonatalState (in million) live births) 2002 Deaths (%) #
1. Andhra Pradesh 76.2 62 6.4
2. Assam 26.7 70 2.9
3. Bihar 83.0 61 11.8
4. Chhattisgarh 20.8 73
5. Gujarat 50.7 60 4.5
6. Haryana 21.1 62 1.8
7. Himachal Pradesh 6.1 52 0.4
8. Jharkhand 26.9 58
9. Karnataka 52.9 55 4.1
10. Kerala 31.8 10 0.5
11. Madhya Pradesh 60.4 85 13.0
12. Maharashtra 96.9 45 5.6
13. Orissa 36.8 87 4.7
14. Punjab 24.4 51 1.3
15. Rajasthan 56.5 78 7.2
16. Tamil Nadu 62.4 44 3.8
17. Uttar Pradesh 166.1 80 26.1
18. Uttarakhand 8.5 44
19. West Bengal 80.2 49 4.5
20. Rest of the States 1.5
India 1,028 63
Source: # National Neonatology Forum. (2004). State of India’s Newborns/ by National Neonatology Forum,
India Ministry of Health and Family Welfare, World Health Organization, UNICEF, World Bank
and Save the Children (USA). New Delhi: Save the Children. P.187.

Statistics on Women in India 2007
127
The percentage of causes of death in various age groups by sex are given in Table 44.
Table 44: Percentage Distribution of Deaths for Selected Major Cause
Groups by Age and Sex, 2000
ICDCode Major Cause Groups Sex Age Group (in years) (%)
Below 1-4 5-14 15-24 25-34 35-44 45-54 55-64 65-69 70+ N.S Total
1 Year
A00-B99 Certain Infectious and M 6.6 3.8 3.9 6.2 12.7 16.7 14.4 12.3 10.1 10.1 3.3 100.0
parasitic diseases F 7.8 5.6 6.4 11.2 13.6 12.4 9.5 11.1 9.2 10.2 3.0 100.0
C00-D48 Neoplasms M 1.0 1.3 2.5 3.1 5.3 11.1 17.8 22.5 11.6 21.0 2.7 100.0
F 1.1 0.8 1.8 3.3 6.6 14.8 21.4 21.3 10.4 16.3 2.2 100.0
D50-D89 Diseases of the blood
and blood forming M 6.3 6.6 8.2 9.2 9.6 10.7 10.5 11.9 4.6 16.4 6.0 100.0
organs and certain F 4.4 6.0 7.7 13.2 14.1 10.2 9.0 8.8 4.9 16.5 5.3 100.0
disorders involving the
immune mechanism
E00-E89 Endocrine nutritional M 2.4 1.4 0.8 1.4 2.9 7.4 16.6 24.6 12.6 27.2 2.5 100.0
and Metabolic diseases F 3.5 2.1 1.4 2.4 3.1 6.0 12.6 21.7 13.3 32.0 2.1 100.0
F01-F99 Mental and behavioural M 1.1 0.7 2.3 2.5 14.4 17.8 32.0 16.9 3.4 6.6 2.1 100.0
disorders F 2.9 1.9 1.0 7.8 12.6 16.5 15.5 21.4 10.7 9.7 0.0 100.0
G00-G98 Diseases of the M 10.9 8.6 9.3 7.5 8.9 11.9 10.8 10.4 5.5 11.6 4.6 100.0
nervous system F 11.3 10.9 11.2 9.7 10.3 8.6 8.3 8.5 4.9 11.8 4.4 100.0
H00-H59 Diseases of the Eye M 6.3 9.4 6.3 6.3 12.5 28.1 9.4 12.5 3.1 3.1 3.1 100.0
and Adnexa F 9.1 9.1 27.3 18.2 9.1 18.2 9.1 0.0 0.0 0.0 0.0 100.0
H60-H95 Diseases of the Ear and M 3.0 9.1 15.2 15.2 3.0 6.1 9.1 9.1 3.0 24.2 3.0 100.0
Mastoid process F 0.0 9.1 18.2 18.2 0.0 9.1 18.2 0.0 0.0 27.3 0.0 100.0
I00-I99 Diseases of the M 1.1 0.4 0.8 2.2 4.7 9.7 16.7 22.1 11.9 27.1 3.2 100.0
circulatory system F 1.2 0.5 1.1 3.4 5.2 7.6 12.0 19.0 12.4 35.0 2.8 100.0
J00-J98 Diseases of the M 12.6 5.0 3.0 3.8 5.7 8.5 11.7 15.4 8.1 22.2 3.9 100.0
respiratory system F 16.2 8.0 4.4 5.1 5.3 6.4 8.4 12.1 7.6 23.6 2.9 100.0
K00-K92 Diseases of the M 1.7 1.5 2.1 3.7 10.5 20.2 22.7 17.4 7.1 9.4 3.8 100.0
digestive system F 3.0 2.5 5.0 8.1 11.2 12.7 16.2 14.6 8.0 15.1 3.6 100.0
L00-L98 Diseases of the skin and M 2.6 1.4 1.4 5.7 7.8 14.5 16.4 17.8 7.1 20.0 5.2 100.0
subcutaneous tissue F 5.8 2.5 2.5 6.7 9.2 16.7 16.3 14.2 5.4 18.8 2.1 100.0
M00-M99 Diseases of the M 2.5 0.6 5.1 10.8 6.3 17.7 8.2 18.4 7.0 19.6 3.8 100.0
Musculoskeletal system F 4.2 0.8 1.7 9.2 10.1 15.1 17.6 14.3 7.6 15.1 4.2 100.0
and connective tissue
N00-N99 Diseases of the M 3.2 1.3 2.5 4.2 8.1 11.0 16.5 17.5 9.5 21.3 4.9 100.0
genitourinary system F 2.9 1.6 3.0 7.5 9.6 11.0 14.2 17.1 9.5 19.8 3.6 100.0
O00-O99 Pregnancy, child birth F 0.0 0.0 0.1 38.4 43.2 14.2 1.9 0.0 0.0 0.0 2.2 100.0
and puerperium
P00-P96 Certain conditions M 100.0 0.0 0.0 0.0 0.0 0.0 0.0 0.0 0.0 0.0 0.0 100.0
originating in the F 100.0 0.0 0.0 0.0 0.0 0.0 0.0 0.0 0.0 0.0 0.0 100.0
perinatal period
Q00-Q99 Congenital M 67.0 8.3 5.8 4.1 1.0 2.0 1.6 2.0 0.5 1.8 5.9 100.0
malformations, F 63.0 9.2 3.5 9.9 2.2 2.1 1.1 1.5 0.6 1.3 5.6 100.0
deformations,
chromosomal and
abnormalities
R00-R99 Symptoms,signs and M 5.2 1.9 2.4 5.2 8.7 10.6 13.5 14.6 10.1 25.0 2.7 100.0
abnormal clinical and F 5.7 2.3 3.0 6.6 7.3 6.1 9.8 12.2 9.4 35.6 1.9 100.0
laboratory findings not
else where classified
S00-T98 Injuries poisoning and M 1.1 1.9 4.5 17.2 22.9 19.3 12.3 8.0 3.8 4.2 4.8 100.0
other consequences of F 1.0 2.1 5.3 28.0 26.6 14.1 7.4 4.9 2.6 3.6 4.5 100.0
external causes
All Causes M 11.7 2.1 2.6 5.2 8.8 11.8 13.8 14.9 8.6 17.1 3.3 100.0
F 12.6 2.8 3.4 9.2 10.3 8.8 9.7 12.1 8.0 20.3 2.8 100.0
T 12.0 2.4 2.9 6.7 9.3 10.7 12.3 13.9 8.4 18.3 3.1 100.0
Source: India, Registrar General, Vital Statistics Division. (2006). Medical Certification of Causes of Death
2000. New Delhi. P.36.

Statistics on Women in India 2007
128
The survey of medical certification of causes of death was conducted in 23 States/UTs
for the year 2000 in hospitals (public or private) covered under the Scheme Medical
Certification of Cause of Death. In 2000, data petaining to 510,580 deaths occurring in
hospitals was analyzed. The percentage and number of deaths occurring in various age
groups is given in Table 45.
Table 45: Age-wise Total Deaths in India by Major Cause Group
(Percentage), 2000
ICDCode Cause of Death Age Group (in years)
Below 1-4 5-14 15-24 25-34 35-44 45-54 55-64 65-69 70+ N.S Total
1 Year
I. A00-B99 Certain Infectious and 5625 3534 3799 6353 10421 12211 10209 9555 7865 8140 2571 80283
parasitic diseases (9.1) (28.9) (25.6) (18.5) (21.9) (22.3) (16.3) (13.5) (18.3) (8.7) (16.4) (15.7)
II. C00- D48 Neoplasms 190 208 408 580 1077 2329 3559 4056 2049 3499 466 18421
(0.3) (1.7) (2.8) (1.7) (2.3) (4.3) (5.7) (5.7) (4.8) (3.7) (3.0) (3.6)
III. D50- D89 Diseases of the blood 438 518 649 913 971 853 796 848 386 1346 459 8177
and blood forming organs and (0.7) (4.2) (4.4) (2.7) (2.0) (1.6) (1.3) (1.2) (0.9) (1.4) (2.9) (1.6)
certain disorders involving the
immune mechanism
IV.E00-E89 Endocrine nutritional and 473 285 178 304 496 1142 2501 3903 2148 4862 392 16684
Metabolic diseases (0.8) (2.3) (1.2) (0.9) (1.0) (2.1) (4.0) (5.5) (5.0) (5.2) (2.5) (3.3)
V.F01-F99 Mental and behavioural 8 5 11 19 76 95 156 96 26 39 9 540
disorders (0.0) (0.0) (0.1) (0.1) (0.2) (0.2) (0.2) (0.1) (0.1) (0.0) (0.1) (0.1)
VI.G00-G98 Diseases of the nervous 1754 1502 1593 1323 1494 1690 1561 1537 839 1848 713 15854
system (2.9) (12.2) (10.8) (3.9) (3.1) (3.1) (2.5) (2.2) (2.0) (2.0) (4.5) (3.1)
VII.H00-H59 Diseases of the Eye and Adnexa 3 4 5 4 5 11 4 4 1 1 1 43
(0.0) (0.0) (0.0) (0.0) (0.0) (0.0) (0.0) (0.0) (0.0) (0.0) (0.0) (0.0)
VIII.H60-H95 Diseases of the Ear and Mastoid 1 4 7 7 1 3 5 3 1 11 1 44
process (0.0) (0.0) (0.0) (0.0) (0.0) (0.0) (0.0) (0.0) (0.0) (0.0) (0.0) (0.0)
IX.I00-I99 Diseases of the circulatory 1359 565 1132 3268 6008 11127 18676 26083 15030 37236 3786 124270
system (2.2) (4.6) (7.6) (9.5) (12.6) (20.4) (29.8) (36.8) (35.0) (39.9) (24.2) (24.3)
X.J00-J98 Diseases of the respiratory 4990 2183 1254 1537 2000 2791 3778 5118 2856 8149 1272 35928
system (8.1) (17.9) (8.5) (4.5) (4.2) (5.1) (6.0) (7.2) (6.7) (8.7) (8.1) (7.0)
XI.K00-K92 Diseases of the digestive 462 405 660 1110 2482 4286 4918 3895 1699 2518 875 23310
system (0.8) (3.3) (4.5) (3.2) (5.2) (7.8) (7.9) (5.5) (4.0) (2.7) (5.6) (4.6)
XII.L00-L98 Diseases of the skin and 25 12 12 40 55 101 108 109 43 129 27 661
subcutaneous tissue (0.0) (0.1) (0.1) (0.1) (0.1) (0.2) (0.2) (0.2) (0.1) (0.1) (0.2) (0.1)
XIII.M00-M99 Diseases of the Musculoskeletal 9 2 10 28 22 46 34 46 20 49 11 277
system and connective tissue (0.0) (0.0) (0.1) (0.1) (0.0) (0.1) (0.1) (0.1) (0.0) (0.1) (0.1) (0.1)
XIV.N00-N99 Diseases of the genitourinary 304 140 264 530 856 1087 1541 1712 935 2046 437 9852
system (0.5) (1.1) (1.8) (1.5) (1.8) (2.0) (2.5) (2.4) (2.2) (2.2) (2.8) (1.9)
XV.O00-O99 Pregnancy, child birth and 0 0 3 1531 1722 564 74 0 0 0 88 3982
puerperium (0.0) (0.0) (0.0) (8.7) (8.7) (3.3) (0.4) (0.0) (0.0) (0.0) (1.7) (2.1)
XVI.P00-P96 Certain conditions originating 39784 0 0 0 0 0 0 0 0 0 0 39784
in the perinatal period (64.7) (0.0) (0.0) (0.0) (0.0) (0.0) (0.0) (0.0) (0.0) (0.0) (0.0) (7.8)
XVII.Q00-Q99 Congenital malformations, 1538 203 116 148 33 48 33 42 12 38 136 2347
deformations, chromosomal (2.5) (1.7) (0.8) (0.4) (0.1) (0.1) (0.1) (0.1) (0.0) (0.0) (0.9) (0.5)
and abnormalities
XVII.R00-R99 Symptoms,signs and abnormal 3913 1515 1949 4165 5899 6363 8737 9927 7132 21200 1746 72546
clinical and laboratory findings (6.4) (12.4) (13.2) (12.2) (12.4) (11.6) (13.9) (14.0) (16.6) (22.7) (11.1) (14.2)
not else where classified
XIX.S00-T98 Injuries poisoning and other 622 1140 2762 12410 14036 9903 5951 3892 1882 2295 2684 57577
consequences of external causes (1.0) (9.3) (18.6) (36.2) (29.5) (18.1) (9.5) (5.5) (4.4) (2.5) (17.1) (11.3)
All Causes 61498 12225 14812 34270 47654 54650 62641 70826 42924 93406 15674 510580
(100.0) (100.0) (100.0) (100.0) (100.0) (100.0) (100.0) (100.0) (100.0) (100.0) (100.0) (100.0)
Source: India, Registrar General, Vital Statistics Division. (2006). Medical Certification of Causes of Death 2000.
New Delhi. P.34.

Statistics on Women in India 2007
129
The age and sex-wise break-up of deaths in various age groups is given in Table 46.
Table 46: Age and Sex-Wise Total Deaths in India by Major Cause Group
(Percentage), 2000.
ICDCode Cause of Death Sex Age Group (in years)
Below 1-4 5-14 15-24 25-34 35-44 45-54 55-64 65-69 70+ N.S Total
1 Year
I. A00-B99 Certain Infectious and M 9.3 28.8 24.6 19.5 23.8 23.3 17.2 13.6 19.3 9.8 16.9 16.5
parasitic diseases F 8.9 29.0 27.0 17.6 19.1 20.3 14.1 13.2 16.6 7.2 15.4 14.4
II. C00-D48 Neoplasms M 0.3 2.1 3.3 2.0 2.0 3.1 4.3 5.0 4.5 4.1 2.8 3.3
F 0.4 1.2 2.1 1.4 2.6 6.8 9.0 7.1 5.3 3.3 3.3 4.1
III. D50- D89 Diseases of the blood M 0.7 4.0 4.1 2.3 1.4 1.2 1.0 1.0 0.7 1.2 2.4 1.3
and blood forming F 0.7 4.6 4.8 3.1 2.9 2.5 2.0 1.5 1.3 1.7 4.1 2.1
organs and certain
disorders involving the
immune mechanism
IV.E00-E89 Endocrine nutritional M 0.6 2.1 1.0 0.9 1.0 2.0 3.7 5.1 4.5 5.0 2.4 3.1
and Metabolic diseases F 1.0 2.7 1.4 0.9 1.1 2.4 4.6 6.3 5.8 5.5 2.7 3.5
V.F01-F99 Mental and behavioural M 0.0 0.0 0.1 0.1 0.2 0.2 0.3 0.2 0.1 0.1 0.1 0.1
disorders F 0.0 0.0 0.0 0.0 0.1 0.1 0.1 0.1 0.1 0.0 0.0 0.1
VI.G00-G98 Diseases of the M 2.9 12.4 11.2 4.5 3.1 3.1 2.4 2.2 2.0 2.1 4.3 3.1
nervous system F 2.8 12.1 10.2 3.3 3.1 3.1 2.7 2.2 1.9 1.8 5.0 3.1
VII.H00-H59 Diseases of the Eye M 0.0 0.0 0.0 0.0 0.0 0.0 0.0 0.0 0.0 0.0 0.0 0.0
and Adnexa F 0.0 0.0 0.0 0.0 0.0 0.0 0.0 0.0 0.0 0.0 0.0 0.0
VIII.H60-H95 Diseases of the M 0.0 0.0 0.1 0.0 0.0 0.0 0.0 0.0 0.0 0.0 0.0 0.0
Ear and F 0.0 0.0 0.0 0.0 0.0 0.0 0.0 0.0 0.0 0.0 0.0 0.0
Mastoid process
IX.I00-I99 Diseases of the M 2.2 4.9 8.0 10.7 13.3 20.6 30.3 37.1 34.6 39.8 24.6 25.1
circulatory system F 2.2 4.2 7.2 8.5 11.6 19.8 28.7 36.2 35.8 39.9 23.3 23.1
X.J00-J98 Diseases of the M 7.8 16.8 8.4 5.3 4.7 5.2 6.1 7.5 6.8 9.4 8.7 7.2
respiratory system F 8.6 19.2 8.6 3.7 3.5 4.9 5.8 6.7 6.4 7.8 6.9 6.7
XI.K00-K92 Diseases of the M 0.8 3.9 4.6 3.9 6.6 9.4 9.1 6.4 4.5 3.1 6.5 5.5
digestive system F 0.7 2.6 4.3 2.6 3.2 4.3 5.0 3.6 2.9 2.2 3.8 3.0
XII.L00-L98 Diseases of the skin & M 0.0 0.1 0.1 0.1 0.1 0.2 0.2 0.2 0.1 0.2 0.2 0.1
subcutaneous tissue F 0.1 0.1 0.1 0.1 0.1 0.2 0.2 0.1 0.1 0.1 0.1 0.1
XIII.M00-M99 Diseases of the M 0.0 0.0 0.1 0.1 0.0 0.1 0.0 0.1 0.0 0.1 0.1 0.0
Musculoskeletal system F 0.0 0.0 0.0 0.1 0.1 0.1 0.1 0.1 0.1 0.0 0.1 0.1
and connective tissue
XIV.N00-N99 Diseases of the M 0.5 1.2 1.9 1.6 1.8 1.8 2.3 2.3 2.2 2.5 3.0 2.0
genitourinary system F 0.4 1.1 1.6 1.5 1.7 2.3 2.7 2.6 2.2 1.8 2.5 1.9
XV.O00-O99 Pregnancy, child birth F 0.0 0.0 0.0 8.7 8.7 3.3 0.4 0.0 0.0 0.0 1.7 2.1
and puerperium
XVI.P00-P96 Certain conditions M 65.1 0.0 0.0 0.0 0.0 0.0 0.0 0.0 0.0 0.0 0.0 7.6
originating in the F 64.0 0.0 0.0 0.0 0.0 0.0 0.0 0.0 0.0 0.0 0.0 8.1
perinatal period
XVII.Q00-Q99 Congenital M 2.6 1.8 1.0 0.4 0.1 0.1 0.1 0.1 0.0 0.0 0.8 0.5
malformations, F 2.3 1.5 0.5 0.5 0.1 0.1 0.1 0.1 0.0 0.0 0.9 0.5
deformations,
chromosomal and
abnormalities
XVIII.R00-R99 Symptoms,signs and M 6.0 12.4 13.0 13.5 13.6 12.2 13.4 13.4 16.0 20.1 11.5 13.7
abnormal clinical and F 6.9 12.4 13.4 10.8 10.7 10.3 15.3 15.2 17.7 26.4 10.4 15.1
laboratory findings not
else where classified
XIX.S00-T98 Injuries poisoning and M 1.0 9.4 18.6 35.3 28.1 17.5 9.6 5.8 4.7 2.7 15.7 10.8
other consequences of F 1.0 9.2 18.7 37.1 31.4 19.4 9.3 4.9 3.9 2.2 19.8 12.2
external causes
All Causes M 100.0 100.0 100.0 100.0 100.0 100.0 100.0 100.0 100.0 100.0 100.0 100.0
F 100.0 100.0 100.0 100.0 100.0 100.0 100.0 100.0 100.0 100.0 100.0 100.0
Source: India, Registrar General, Vital Statistics Division. (2006). Medical Certification of Causes of Death
2000. New Delhi. P.35.

Statistics on Women in India 2007
130
The infant motality rate in India has been coming down over the years and was recorded
at 58 per 1000 live birth in 2005, as in given in Table 16. Although efforts are being made
to bring down IMR to 30 by 2010, the rate of decline in recent years has slowed down.
Efforts are required on various fronts and the National Rural Health Mission is endeavouring
to achieve this goal.The percentage distribution of top ten killer diseases of infants in rural
India is given in Table 47.
Table 47: Percentage Distribution of Ten Top Killer Diseases of Infants
(Below One year) in Rural India, 1998
S. India/StatesP
rem
atu
rity
No.
Rank I II III IV V VI VII VIII IX X
ICD P 07 J 18 P 22 Q 00 – D 50 – P 75- P 10- A 33 A 09 G 40
Codes 99 64 78 15
⇒
India 34.4 13.5 11.5 3.5 3.3 2.4 2.0 1.3 1.1 0.9 73.7
1 Andhra Pradesh 21.0 3.2 14.9 2.3 1.7 4.4 2.6 2.9 0.6 2.0 55.7
2 Bihar 23.2 29.3 9.8 3.7 14.6 3.7 2.4 0.0 0.0 0.0 86.6
3 Gujarat 29.2 4.5 5.8 10.4 2.6 0.6 0.0 0.0 0.6 1.9 55.8
4 Haryana 13.7 24.8 2.0 2.6 5.9 3.3 0.7 5.2 0.7 0.0 58.8
5 Karnataka 39.5 0.0 15.6 4.2 0.0 1.8 1.2 1.8 0.0 0.0 64.1
6 Kerala 16.7 16.7 16.7 16.7 0.0 0.0 0.0 0.0 0.0 0.0 66.7
7 Maharashtra 54.8 12.8 4.1 2.8 0.4 0.4 0.7 0.0 0.2 1.8 78.1
8 Madhya Pradesh 37.7 20.5 14.8 3.4 5.6 2.5 2..8 2.0 0.7 0.1 90.0
9 Orissa 41.8 8.8 22.0 4.4 4.4 1.1 1.1 2.2 1.1 0.0 86.8
10 Punjab 14.3 0.0 7.1 0.0 14.3 7.1 0.0 0.0 14.3 0.0 57.1
11 Rajasthan 25.3 25.0 6.4 4.2 10.3 0.6 1.0 0.0 0.3 0.0 73.1
12 Tamil Nadu 23.9 1.7 25.5 4.8 0.4 2.5 2.6 0.6 0.6 0.7 63.3
13 Uttar Pradesh 28.1 21.4 7.4 2.2 4.9 3.6 1.7 1.2 1.2 1.3 73.0
Source: India, Registrar General, Vital Statistics Division. (2002). Survey of Causes of Death (Rural),
India: Annual Report 1998. New Delhi. P. 26.
Pn
eu
mo
nia
Re
sp
ira
tory
infe
cti
on
of
ne
w b
orn
Co
ng
en
ita
lm
alf
orm
ati
on
An
ae
mia
Dia
rrh
oea o
fn
ew
bo
rn
Bir
th i
nju
ry
Teta
nu
sn
eo
na
toru
m
Dia
rrh
oea &
ga
str
oe
ntr
itis
Co
nv
uls
ion
s
To
tal

Statistics on Women in India 2007
131
The major causes of child deaths in the age group 1-4 years sex-wise are given in Table 48.
Table 48: Child Deaths in 1-4 Years Age Group by Major Cause Groups
Sex-wise, 2000
S. ICD Major Cause Groups Number of Child Total Deaths of All Ages
No. Code Deaths 1-4 Years (N=510580)
Reported Where
510580 Deaths Were
Reported
M F P M F P
1. A00-B99 CertainInfectious and
parasitic diseases 1976 1558 3534 52674 27609 80283
2. C00-D48 Neoplasm 142 66 208 10655 7766 18421
3. D50-D89 Diseases of the blood 273 245 518 4106 4071 8177
and blood forming
organsand certain
disorders involving
immune mechanism
4. E00-E89 Endocrine nutritional 142 143 285 9937 6747 16684
and Metabolic diseases
5. F01-F99 Mental and behavioural 3 2 5 437 103 540
disorders
6. G00-G98 Diseases of the 851 651 1502 9886 5968 15854
nervous system
7. H00-H59 Diseases of eye and 3 1 4 32 11 43
adnexa
8. H60-H95 Diseases of the Ear and 3 1 4 33 11 44
mastoid process
9. I00-I99 Diseases of the 337 228 565 79947 44323 124270
circulatory system
10. J00-J98 Diseases of the 1155 1028 2183 23079 12849 35928
respiratory system
11. K00-K92 Diseases of the 265 140 405 17650 5660 23310
digestive system
12. L00-L98 Diseases of the skin 6 6 12 421 240 661
and subcutaneous tissue
13. M00-M99 Diseases of 1 1 2 158 119 277
Musculoskeletal system
and connective tissue
14. N00-N99 Diseases of 82 58 140 6283 3569 9852
genitourinary system
15. O00-O99 Pregnancy child and 0 0 0 - 3982 3982
the puerprium
16. P00-P96 Certain conditions 0 0 0 24328 15456 39784
originating in the
perinatal period
17. Q00-Q99 Congenital malformations 122 81 203 1471 876 2347
deformations and
chromosomal
abnormalities

Statistics on Women in India 2007
132
S. ICD Major Cause Groups Number of Child Total Deaths of All Ages
No. Code Deaths 1-4 Years (N=510580)
Reported Where
510580 Deaths Were
Reported
M F P M F P
18. R00-R99 Symptoms, signs and 851 664 1515 43715 28831 72546
abnormal clinical findings
not elsewhere mentioned
19. S00-T98 Injuries, poisoning and 647 493 1140 34307 23270 57577
certain other
consequences of external
causes
20. V01-Y89 External causes of 512 391 903 28414 18734 47148
morbidity and mortality
Total Child Deaths 6859 5366 12225 319119 191461 510580
Note: P= Persons M=Males F=Female
Source: India, Ministry of Home Affairs, Registrar General. (2006).
Medical Certification of Cause of Death (2000). New Delhi. P. 62-73.
The ten major killer diseases of children aged 1-4 years in bigger states of India are
given in Table 49.
Table 49: Ten Top Killer Diseases of Children 1-4 Years by Specific
Causes, 1998
S. India/States
No.
ICD J 18 D 50- A 09 A 01 J 10- 151 X 71 G 40 A B 50-
Code 64 11 06 54
India 19.0 9.0 6.3 5.1 3.8 3.5 3.4 3.3 3.1 2.6 59.2
1 Andhra Pradesh 6.3 7.9 3.2 3.2 0.0 7.9 7.9 6.3 1.6 0.0 44.4
2 Bihar 22.0 22.0 2.4 7.3 2.4 0.0 2.4 2.4 7.3 0.0 68.3
3 Gujarat 1.7 11.9 1.7 5.1 0.0 1.7 3.4 5.1 0.0 1.7 32.2
4 Haryana 26.0 4.0 6.0 6.0 4.0 0.0 6.0 2.0 2.0 2.0 58.0
5 Karnataka 14.7 13.3 8.0 1.3 6.7 2.7 2.7 0.0 5.3 0.0 54.7
6 Kerala 0.0 0.0 0.0 0.0 0.0 60.0 20.0 20.0 0.0 0.0100.0
7 Madhya Pradesh 22.1 6.2 1.6 2.3 0.0 8.1 3.3 7.5 0.3 0.0 51.5
8 Maharashtra 26.2 13.9 7.5 6.5 7.8 0.0 1.0 1.4 2.4 10.2 76.9
9 Orissa 25.0 21.4 7.1 0.0 0.0 3.6 3.6 3.6 3.6 7.1 75.0
10 Punjab 20.0 0.0 20.0 0.0 0.0 0.0 0.0 0.0 0.0 20.0 60.0
11 Rajasthan 39.1 15.2 0.0 3.3 3.3 0.0 4.3 1.1 3.3 0.0 69.6
12 Tamil Nadu 2.4 3.2 7.1 0.0 4.8 8.7 8.7 2.4 4.0 0.0 41.3
13 Uttar Pradesh 25.9 6.5 7.3 14.6 2.8 1.2 2.0 3.2 5.7 2.0 71.3
Source: India, Registrar General, Vital Statistics Division. (2002). Survey of Causes of Death (Rural),
India : Annual Report 1998. New Delhi. P. 28.
Pn
eu
mo
nia
An
ae
mia
Dia
rrh
oe
a a
nd
Ga
str
oe
nte
riti
s
Ty
ph
oid
an
d
Pa
raty
ph
oid
Infl
ue
nza
Co
ng
es
tiv
ea
nd
Oth
er
He
art
Dro
wn
ing
Co
nv
uls
ion
s
Dy
se
nte
ry
Ma
lari
a
To
tal

Statistics on Women in India 2007
133
The major causes of child deaths in the age group 5-14 years sex-wise are given in Table 50.
Table 50: Child Deaths in 5-14 Years Age Group by Major Cause Groups
Sex-wise, 2000
S. ICD Major Cause-Groups Number of Child Total Deaths in all Ages in
No. Code Deaths in 5-14 Years Selected Hospitals, 2000
Where 510580 Deaths
Were Reported
M F P M F P
1. A00-B99 CertainInfectious and 2032 1767 3799 52674 27609 80283
parasitic diseases
2. C00-D48 Neoplasm 271 137 408 10655 7766 18421
3. D50-D89 Diseases of the blood and 336 313 649 4106 4071 8177
blood forming organsand
certain disorders involving
immune mechanism
4. E00-E89 Endocrine nutritional and 83 95 178 9937 6747 16684
Metabolic diseases
5. F01-F99 Mental and behavioural 10 1 11 437 103 540
disorders
6. G00-G98 Diseases of the nervous 924 669 1593 9886 5968 15854
system
7. H00-H59 Diseases of eye and adnexa 2 3 5 32 11 43
8. H60-H95 Diseases of the Ear and 5 2 7 33 11 44
mastoid process
9. I00-I99 Diseases of the circulatory 658 474 1132 79947 44323 124270
system
10. J00-J98 Diseases of the respiratory 693 561 1254 23079 12849 35928
system
11. K00-K92 Diseases of the digestive 377 283 660 17650 5660 23310
system
12. L00-L98 Diseases of the skin and 6 6 12 421 240 661
subcutaneous tissue
13. M00-M99 Diseases of Musculoskeletal 8 2 10 158 119 277
system and connective tissue
14. N00-N99 Diseases of genitourinary 157 107 264 6283 3569 9852
system
15. O00-O99 Pregnancy child and the 3 - 3 - 3982 3982
puerprium
16. P00-P96 Certain conditions originating 0 0 0 24328 15456 39784
in the perinatal period
17. Q00-Q99 Congenital malformations 85 31 116 1471 876 2347
deformations and
chromosomal abnormalities
18. R00-R99 Symptoms, signs and 1070 879 1949 43715 28831 72546
abnormal clinical findings
not elsewhere mentioned
19. S00-T98 Injuries, poisoning and 1539 1223 2762 34307 23270 57577
certain other consequences
of external causes
20. V01-Y89 External causes of 1209 948 2157 28414 18734 47148
morbidity and mortality
Total 8256 6556 14812 319119 191461 510580
Note: P= Persons M=Males F=Females
Source: India, Ministry of Home Affairs, Registrar General. (2006).
Medical Certification of Cause of Death (2000). New Delhi. P. 62-73.

Statistics on Women in India 2007
134
The ten major causes of death of women in the reproductive age group 15-44 years in
major states of India are given in Table 51.
Table 51: Top Ten Killer Diseases of Females in Reproductive Age Group
15- 44 Years in Major States of India, (%), 1998
S. India/StateNo
ICD X60- A15 T20- C 00- I 21- D50- J20 R10 X 71 V 1-Code 84 32 97 25 64 &45 99⇒
India 11.3 9.2 7.1 6.7 5.3 3.6 3.5 2.8 2.6 2.4 54.4
1 Andhra Pradesh 12.8 7.3 6.1 6.4 9.5 4.3 3.4 1.5 2.4 1.5 55.2
2 Bihar 0.0 9.6 1.1 2.1 3.2 17.0 4.3 8.5 3.2 2.1 51.1
3 Gujarat 13.1 10.7 10.7 8.3 10.7 1.2 1.2 2.4 0.0 7.1 65.5
4 Haryana 10.8 10.8 9.2 13.8 10.8 1.5 0.0 4.6 0.0 1.5 63.1
5 Karnataka 15.5 9.5 2.6 13.8 8.6 0.9 5.2 0.9 2.6 0.9 60.3
6 Kerala 26.5 0.0 0.0 14.7 11.8 2.9 8.8 0.0 2.9 0.0 67.6
7 Maharashtra 3.9 8.6 15.2 7.4 2.0 2.0 6.4 1.6 4.7 3.1 55.1
8 Madhya Pradesh 6.9 13.2 7.2 4.1 5.5 4.4 2.5 5.5 2.5 0.8 52.6
9 Orissa 14.5 5.8 0.0 1.4 8.7 8.7 2. 9 2.9 1.4 0.0 46.4
10 Punjab 12.9 6.5 0.0 6.5 32.3 0.0 3.2 0.0 3.2 9.7 74.2
11 Rajasthan 7.9 19.7 3.9 5.5 2.4 1.6 3.9 6.3 0.8 7.1 59.1
12 Tamil Nadu 33.0 4.3 3.4 6.5 4.7 2.7 0.2 2.0 4.3 2.5 63.7
13 Uttar Pradesh 5.2 14.9 5.9 2.8 3.5 4.9 2.1 2.4 0.3 1.4 43.4
Source: India, Registrar General, Vital Statistics Division. (2002). Survey of Causes of Death (Rural),
India : Annual Report 1998. New Delhi. P. 34.
Su
icid
e
T.B
. o
flu
ng
s
Bu
rns
Ca
nc
er
He
art
Att
ac
k
An
ae
mia
Bro
nc
-h
itis
&A
sth
ma
Ac
ute
Ab
do
me
n
Dro
wn
ing
Ve
hic
ula
r
Ac
cid
en
t
To
tal

Statistics on Women in India 2007
135
The killer diseases of women in ten year age groups in the reproductive period 15-44
years and other age groups are given in Table 52.
Table 52: Killer Diseases of Females in the Reproductive and Other Age
Groups (15-44 years and 45-54 years) India, 2000
S.No ICD Code Specific Causes Number of Deaths of Women in Reproductive Number of Deaths
(Killer diseases) and Other Age Groups Where 510580 Deaths
Were Reported
Persons 15-24 25-34 35-44 45-54 Total of All Ages
1. A00-B99 Certain Infectious and M 3259 6665 8789 7595 52674parasitic diseases F 3094 3756 3422 2614 27609
P 6353 10421 12211 10209 80283
2. C00-D48 Neoplasm M 327 568 1181 1899 10655F 253 509 1148 1660 7766P 580 1077 2329 3559 18421
3. D50-D89 Diseases of the blood M 376 396 439 431 4106and blood forming F 537 575 414 365 4071organs and certain P 913 971 853 796 8177disorders involvingimmune mechanism
4. E00-E89 Endocrine nutritional M 144 289 740 1653 9937and Metabolic F 160 207 402 848 6747diseases P 304 496 1142 2501 16684
5. F01-F99 Mental and M 11 63 78 140 437behavioural disorders F 8 13 17 161 103
P 19 76 95 56 540
6. G00-G98 Diseases of the M 744 877 1175 1063 9886nervous system F 579 617 515 498 5968
P 1323 1494 1690 1561 15854
7. H00-H59 Diseases of eye and M 2 4 9 3 32adnexa F 2 1 2 1 11
P 4 5 11 4 43
8. H60-H95 Diseases of the ear M 5 1 2 3 33and mastoid process F 2 0 1 2 11
P 7 1 3 5 44
9. I00-I99 Diseases of the M 1780 3721 7779 13374 79947circulatory system F 1488 2287 3348 5302 44323
P 3268 6008 11127 18676 124270
10. J00-J98 Diseases of the M 887 1318 1963 2698 23079respiratory system F 650 682 828 1080 12849
P 1537 2000 2791 3778 35928
11. K00-K92 Diseases of the M 649 1848 3567 3999 17650digestive system F 461 634 719 919 5660
P 1110 2482 4286 4918 23310
12. L00-L98 Diseases of the skin M 24 33 61 69 421and subcutaneous F 16 22 40 39 240tissue P 40 55 101 108 661
13. M00-M99 Diseases of Muscu- M 17 10 28 13 158loskeletal system F 11 12 18 21 119and connective tissue P 28 22 46 34 277
14. N00-N99 Diseases of M 262 512 694 1035 6283genitourinary system F 268 344 393 506 3569
P 530 856 1087 1541 9852

Statistics on Women in India 2007
136
S.No ICD Code Specific Causes Number of Deaths of Women in Reproductive Number of Deaths
(Killer diseases) and Other Age Groups Where 510580 Deaths
Were Reported
Persons 15-24 25-34 35-44 45-54 Total of All Ages
15. O00-O99 Pregnancy child and M - - - - -the puerprium F 1531 1722 564 74 3982
P 1531 1722 564 74 3982
16. P00-P96 Certain conditions M 0 0 0 0 24328originating in the F 0 0 0 0 15456perinatal period P 0 0 0 0 39784
17. Q00-Q99 Congenital M 61 14 30 23 1471malformations F 87 19 18 10 876deformations and P 148 33 48 33 2347chromosomalabnormalities
18. R00-R99 Symptoms, signs and M 2260 3795 4617 5913 43715abnormal clinical F 1905 2104 1746 2824 28831findings not P 4165 5899 6363 8537 72546elsewhere mentioned
19. S00-T98 Injuries, poisoning M 5888 7857 6621 4235 34307and certain other F 6522 6179 3282 1716 23270consequences of P 12410 14036 9903 5951 57577external causes
20. V01-Y89 External causes of M 4834 6451 5570 3510 28414morbidity and F 5182 5003 2732 1382 18734mortality P 10016 11454 8302 4892 47148
Total M 16696 27971 37773 44146 319119F 17574 19683 16877 18495 191461P 34270 47654 54650 62641 510580
Note: M = Male, F = Female, P = Persons.
Source: India, Ministry of Home Affairs, Registrar General. (2006).
Medical Certification of Cause of Death (2000). New Delhi. P. 62-73.
AIDS has emerged as a major killer in India. The incidence of AIDS is spreading from the
high risk population to the general population, and the infection has spread even to new born
babies. The incidence of AIDS among adults, women and children is given in Table 52.
Table 53: Adults and Children Living with HIV/AIDS, 2003
S.No. Group Persons Living with HIV / AIDS
1. Adults 50,00,000
2. Women 19,00,000
3. Children 1,20,000
Total 55,00,000
Note: Adult HIV prevalence estimate 0.9%.
Figures are for the end of 2003.
These calculations are based on previously published estimates for 1999 and 2001 and recent.
trends in HIV/AIDS surveillance in various populations.
Adults are defined as Men and Women aged 15 to 49 years.
NACO sources.
Source: The Pioneer (India, New Delhi), Wednesday October 13, 2004. P. 3.

Statistics on Women in India 2007
137
AIDS Cases in India, as on 31.12.2005
The officially reported number of AIDS cases in India state-wise is given in Table 54.
Table 54: AIDS Cases in India/ States/ UTs, 2005
S No. India/States/UTs AIDS Cases
India 117716
1. Andhra Pradesh 14053
2. Arunachal Pradesh 0
3. Assam 265
4. Bihar 155
5. Chhattisgarh 0
6. Delhi 1976
7. Goa 634
8. Gujarat 6333
9. Haryana 535
10. Himachal Pradesh 292
11. Jammu & Kashmir 2
12. Jharkhand 0
13. Karnataka 3790
14. Kerala 1769
15. Madhya Pradesh 1486
16. Maharashtra 14024
17. Manipur 2866
18. Meghalaya 8
19. Mizoram 106
20. Nagaland 736
21. Orissa 641
22. Punjab 386
23. Rajasthan 1153
24. Sikkim 8
25. Tamil Nadu 52036
26. Tripura 5
27. Uttar Pradesh 1751
28. Uttarakhand 60
29. West Bengal 2397
Union Territories
30. Andaman & Nicobar Islands 37
31. Chandigarh 1497
32. Dadra & Nagar Haveli 0
33. Daman & Diu 1
34. Lakshadweep 0
35. Pondicherry 302
Note: National AIDS Control Organization 2005
Source: India, Ministry of Health and Family Welfare, Central Bureau of Health Intelligence. (2006). National
Health Profile 2005. New Delhi: CBHI. P.61

Statistics on Women in India 2007
138
Malaria is a major public health problem in India, and adds to the burden of morbidity and
mortality. To achieve the Millennium Development Goals, it is important to reduce the incidence
of malaria. The number of malaria cases and deaths due to malaria is given in Table 55.
Table 55: Malaria Cases in India and States/ UTs, 2005
S. India/ State/ UT State-wise Cases and Deaths due to Malaria (2004-2005)
No. 2004* 2005**
Positive Deaths Positive Deaths
India 1844413 943 394978 295
1. Andhra Pradesh 35427 2 15607 1
2. Arunachal Pradesh 29849 0 1268 0
3. Assam 58134 54 15876 45
4. Bihar 1872 0 8 0
5. Chhattisgarh 194256 4 20154 2
6. Delhi 1316 0 172 0
7. Goa 7839 7 1281 1
8. Gujarat 222759 89 33942 0
9. Haryana 10064 0 4617 0
10. Himachal Pradesh 126 0 36 0
11. Jammu & Kashmir 250 0 66 0
12. Jharkhand 73893 39 12339 0
13. Karnataka 80961 27 37074 5
14. Kerala 2790 12 740 0
15. Madhya Pradesh 132094 36 23871 0
16. Maharashtra 68988 61 14511 7
17. Manipur 2736 8 805 2
18. Meghalaya 18080 29 3033 3
19. Mizoram 7830 72 3548 50
20. Nagaland 2486 1 756 0
21. Orissa 416732 283 107654 90
22. Punjab 1643 0 326 0
23. Rajasthan 105022 20 4043 0
24. Sikkim 160 3 23 1
25. Tamil Nadu 41732 0 8917 0
26. Tripura 17453 16 7182 7
27. Uttar Pradesh 85868 0 17537 0
28. Uttarakhand 1255 0 298 0
29. West Bengal 220904 180 57118 81
Union Territories
30. Andaman & Nicobar Islands 745 0 1718 0
31. Chandigarh 199 0 89 0
32. Dadra & Nagar Haveli 787 0 343 0
33. Daman & Diu 118 0 10 0
34. Lakshadweep 2 0 0 0
35. Pondicherry 43 0 16 0
Source: India, Ministry of Health and Family Welfare. (2006). Annual Report 2005-2006. New Delhi. P.61.

Statistics on Women in India 2007
139
The nutritional status of women and children in India is not quite satisfactory and requires
intervention to bring improvement in the current situation. Although programmes have
targeted vulnerable sections of the population, more concerted effort is required to bring
about tangible change in the situation. In spite of programmes like Public Distribution
System and Targeted Public Distribution System (TPDS), poverty alleviation programmes
and rural and urban employment programmes, the nutritional status of 33% women and
28% men is below normal. The benefits of programmes does not seem to reach about
30% of the population, hence a different approach is required. Persons having Body Mass
Index below normal is given in Table 56.
Table 56: Nutritional Status of Women and Body Mass Index (BMI), 2006
S.No. India/ States/UTs Body Mass Index below Normal (%) Obese or Overweight
Women (%)
Women Men
India 33.0 28.1 14.8
1. Andhra Pradesh 30.8 24.8 17.7
2. Arunachal Pradesh 15.5 13.6 10.5
3. Assam 36.5 33.4 9.0
4. Bihar 43.0 28.7 5.3
5. Chhattisgarh 41.0 31.8 6.7
6. Delhi 10.6 10.4 32.9
7. Goa 20.5 16.8 27.0
8. Gujarat 32.3 28.2 20.3
9. Haryana 27.8 26.8 21.0
10. Himachal Pradesh 24.3 19.8 17.3
11. Jammu & Kashmir 21.3 19.9 22.7
12. Jharkhand 42.6 33.4 5.9
13. Karnataka 31.4 25.5 18.1
14. Kerala 12.5 11.9 34.0
15. Madhya Pradesh 40.1 36.3 8.6
16. Maharashtra 32.6 24.9 17.1
17. Manipur 13.9 12.2 17.6
18. Meghalaya 13.7 8.0 7.1
19. Mizoram 15.3 6.0 12.0
20. Nagaland 15.9 10.8 8.9
21. Orissa 40.5 32.1 7.6
22. Punjab 13.5 12.0 37.5
23. Rajasthan 33.6 33.8 10.2
24. Sikkim 9.6 7.2 19.5
25. Tamil Nadu 23.5 18.5 24.4
26. Tripura 35.1 38.3 7.8
27. Uttar Pradesh 34.1 32.7 11.1
28. Uttarakhand 25.7 21.8 16.0
29. West Bengal 37.7 31.6 12.5
Notes: Union Territories were not covered in the Survey.
Source: International Institute for Population Sciences. (2006). National Family Health Survey (NFHS-3)
2005-06: Datasheets. Mumbai. P.3.

Statistics on Women in India 2007
140
The incidence of anaemia among married women is quite high in India. The incidence
of anaemia among pregnant women and married women is given in Table 57.
Table 57: Anaemia among Pregnant Women, Currently Married (15-49
Years), and Ever Married Women, (Percentage), 2006
S.No. India/States Ever Married Ever Married Anaemia Anaemia among
Women with Women with among Pregnant Women
Anaemia (%) Anaemia (%) Pregnant 2006 ##
1998-99 # 2006 ## Women 2002 $
T R U Total T R U
India 51.8 56.2 58.2 51.5 39 57.9 59.0 54.6
1. Andhra Pradesh 49.8 62.0 63.7 58.4 37 56.4 58.2 51.7
2. Arunachal Pradesh 62.5 48.9 46.9 53.8 - 49.2 47.3 *
3. Assam 69.7 69.0 69.5 66.3 - 72.0 72.7 67.4
4. Bihar 60.4 68.3 68.2 68.8 37 60.2 59.4 66.4
5. Chhattisgarh 68.7 57.6 59.4 50.3 51 63.1 62.7 65.2
6. Delhi 40.5 43.4 - - - 29.9 - -
7. Goa 36.4 38.9 38.8 38.9 36.9 26.1 43.3
8. Gujarat 46.3 55.5 59.2 50.5 - 60.8 61.7 59.1
9. Haryana 47.0 56.5 56.9 55.6 58 69.7 71.7 61.5
10. Himachal Pradesh 40.5 40.9 41.2 37.9 36 37.0 36.1 46.2
11. Jammu & Kashmir 58.7 53.1 53.6 51.5 - 54.0 53.8 54.8
12. Jharkhand 72.9 70.4 73.7 59.4 31 68.4 68.2 69.6
13. Karnataka 42.4 50.3 52.5 46.7 - 59.5 65.6 48.7
14. Kerala 22.7 32.3 32.4 32.3 5 33.1 35.8 27.7
15. Madhya Pradesh 49.3 57.6 61.0 48.3 42 57.9 62.4 44.3
16. Maharashtra 48.5 49.0 51.1 46.6 60 57.8 56.4 60.1
17. Manipur 28.9 39.3 38.7 40.6 - 36.4 36.1 37.1
18. Meghalaya 63.3 45.4 47.9 36.1 - 56.1 57.1 *
19. Mizoram 48.0 38.2 47.5 30.2 - 49.3 50.8 46.4
20. Nagaland 38.4 NA NA NA - NA NA NA
21. Orissa 63.0 62.8 64.0 56.4 38 68.1 71.3 46.2
22. Punjab 41.4 38.4 37.4 40.0 58 41.6 41.0 42.6
23. Rajasthan 48.5 53.1 54.9 48.0 42 61.2 60.1 64.5
24. Sikkim 61.1 46.8 49.0 37.1 - 53.1 56.3 35.7
25. Tamil Nadu 56.5 53.3 53.9 52.6 26 53.3 50.5 57.4
26. Tripura 59.0 67.4 67.1 68.9 - 57.6 55.6 *
27. Uttar Pradesh 49.0 50.8 50.8 50.7 43 51.6 51.7 51.3
28. Uttarakhand 45.6 47.6 48.8 44.3 28 45.2 45.0 45.7
29. West Bengal 62.7 63.8 65.6 59.0 32 62.6 62.5 63.1
Note: Union Territories were not covered. NA: Not available* Not shown; based on fewer than 25 unweighted cases.
Source: 1. # International Institute for Population Sciences. (2000). National Family Health Survey-2, 2000. Mumbai. P. 252.2. ## International Institute for Population Sciences. (2006). National Family Health Survey-3, 2006 : Datasheets.
Mumbai. P. 3.3. $ International Institute for Population Sciences. (2004). National Dissemination Seminar on Reproductive and
Child Health Project (Phase 1, Round 2, 2002) Results, New Delhi, 2004 Jan. 27-28. Fifth Session: Reproductiveand Child Health Services. Mumbai. P.145.

Statistics on Women in India 2007
141
The incidence of anaemia among children in the age group 0-6 years is given in Table 58.
Table 58: Anaemia among Children 0-72 Months 2002, and 6-35 Months
(Percentage), 2006
S.No. India/State/UTs Children Aged 6-35 Anaemia among Children
Months with any (0-72 months) 2002
Anaemia 2006 (%) #
T R U Moderate (%) Severe (%) Total (%)
India 79.2 81.2 72.7 39 3 42
1. Andhra Pradesh 79.0 82.7 72.0 38 3 41
2. Arunachal Pradesh 66.3 64.3 71.7 - - -
3. Assam 76.7 77.4 70.4 - - -
4. Bihar 87.6 89.0 75.8 41 2 43
5. Chhattisgarh 81.0 82.1 75.6 48 4 52
6. Delhi 63.2 70.9 71.4 - - -
7. Goa 49.3 49.2 49.4 - - -
8. Gujarat 80.1 83.6 73.8 43 1 44
9. Haryana 82.5 83.3 79.8 54 5 59
10. Himachal Pradesh 58.8 59.8 49.1 39 2 41
11. Jammu & Kashmir 68.1 67.3 72.0 - - -
12. Jharkhand 77.7 80.5 65.9 33 0 33
13. Karnataka 82.7 84.3 79.4 35 4 39
14. Kerala 55.7 57.9 51.3 5 0 5
15. Madhya Pradesh 82.6 84.9 75.2 44 3 47
16. Maharashtra 71.9 76.8 65.7 53 3 56
17. Manipur 52.8 52.5 53.6 - - -
18. Meghalaya 68.7 69.8 61.1 - - -
19. Mizoram 51.7 58.5 44.4 - - -
20. Nagaland NA NA NA - - -
21. Orissa 74.2 75.8 63.2 37 4 41
22. Punjab 80.2 80.0 80.5 48 6 54
23. Rajasthan 79.6 80.1 77.5 36 2 38
24. Sikkim 56.9 56.5 59.2 - - -
25. Tamil Nadu 72.5 71.0 74.2 27 4 31
26. Tripura 67.9 67.8 68.5 - - -
27. Uttar Pradesh 85.1 85.7 82.5 41 2 43
28. Uttarakhand 61.5 62.0 60.2 21 1 22
29. West Bengal 69.4 71.9 58.2 24 4 28
Note: Union Territories were not covered.
NA- Not available
Source: International Institute for Population Sciences. (2004). National Dissemination Seminar on
Reproductive and Child Health Project (Phase 1, Round 2, 2002) Reproductive and Child Health
Services: Fifth Session: Results: 2004 Jan. 27-28, New Delhi. Mumbai. P.138.
# International Institute for Population Sciences. (2006). National Family Health Survey-3, 2006.
Mumbai. P.3.

Statistics on Women in India 2007
142
The incidence of malnutrition and undernutrition among children aged 0-6 years is
given in Table 59.
Table 59: Children with Malnutrition/ Undernutrition 0-6 Years, (%), 1994-
96, 2006
S.No India/State/UTs Percentage of Percentage of Children under 3 Years (NFHS 3, 2006) ** Under
Moderately and Weight
Severely Children
Malnourished 0-6 Years
Children 1-5 below
Yrs. (1994-96) -2 & -3 SD
(Wt. for age) * (%) ***
Male Female Stunted Wasted Under Weight
India 42.1P 40.8 47
India (1995) NFHS 1 52.0 17.5 53.4
India (2000) NFHS 2 45.5 15.5 47.0
T R U T R U T R U
India (2006) NFHS 3 38.4 40.7 31.1 19.1 19.8 16.9 45.9 49.0 36.4
1. Andhra Pradesh 48.6R 49.6 33.9 37.3 27.4 12.7 12.5 13.0 36.5 40.4 29.1 42
2. Arunachal Pradesh 59.2R 54.5 34.2 35.2 31.7 16.5 20.5 6.3 36.9 42.1 23.8 -
3. Assam 29.4R 27.6 34.8 35.5 28.9 13.1 12.7 16.3 40.4 41.1 34.1 -
4. Bihar 56.6C 55.4 42.3 43.7 31.9 27.7 27.5 28.8 58.4 59.3 51.5 56
5. Chhattisgarh - - 45.4 47.9 32.8 17.9 17.9 17.7 52.1 54.6 38.9 42
6. Delhi 37.0C 33.4 35.4 - - 15.5 - - 33.1 - - -
7. Goa 25.1C 17.5 21.3 24.9 18.3 12.1 16.3 8.7 29.3 38.6 21.6 -
8. Gujarat 74.2R 61.8 42.4 45.6 36.7 17.0 17.7 15.7 47.4 50.0 42.7 46
9. Haryana 34.3R 33.0 35.9 38.9 26.9 16.7 16.2 17.9 41.9 41.8 42.1 42
10. Himachal Pradesh 36.6R 34.7 26.6 26.7 25.0 18.8 18.8 18.5 36.2 36.4 33.9 34
11. Jammu & Kashmir - - 27.6 28.3 25.2 15.4 16.1 12.2 29.4 31.6 20.6 -
12. Jharkhand - - 41.0 44.2 28.1 31.1 32.9 23.7 59.2 63.1 43.3 52
13. Karnataka 55.6R 51.1 38.0 43.3 28.4 17.9 19.1 15.8 41.1 45.1 33.8 40
14. Kerala 34.4R 34.2 21.1 21.1 21.3 16.1 19.1 10.1 28.8 31.9 22.5 31
15. Madhya Pradesh 57.9R 49.6 39.9 41.6 34.6 33.3 32.9 34.3 60.3 62.6 52.8 58
16. Maharashtra 52.7R 55.6 37.9 40.3 34.8 14.6 15.6 13.4 39.7 43.5 34.8 50
17. Manipur 31.0C 28.6 24.7 26.8 18.9 8.3 8.6 7.4 23.8 25.2 20.3 -
18. Meghalaya 11.5C 10.7 41.7 42.2 39.1 28.2 28.9 23.9 46.3 48.0 35.9 -
19. Mizoram 17.5C 18.2 30.1 36.7 23.0 9.2 9.6 8.7 21.6 28.8 13.8 -
20. Nagaland 27.5R 27.1 30.3 32.4 21.5 14.6 15.3 11.7 29.7 31.8 21.3 -
21. Orissa 55.1C 51.4 38.3 39.1 32.9 18.5 19.4 12.6 44.0 45.7 33.3 52
22. Punjab 32.2R 31.6 27.9 28.7 26.5 9.0 10.0 7.2 27.5 29.9 21.5 41
23. Rajasthan 42.3C 42.6 33.7 36.4 22.9 19.7 19.9 19.2 44.0 45.9 36.3 62
24. Sikkim 37.7C 36.8 28.9 29.3 26.0 13.1 12.0 20.5 22.6 22.1 26.0 -
25. Tamil Nadu 40.9R 39.7 25.1 24.4 25.9 21.5 22.1 20.6 33.2 34.8 31.3 -
26. Tripura 33.6C 40.6 30.0 30.2 29.0 19.9 20.8 14.5 39.0 39.2 37.1 -
27. Uttar Pradesh - - 46.0 47.4 39.9 13.5 13.6 12.9 47.3 49.4 37.9 52
28. Uttarakhand - - 31.9 36.3 18.4 16.2 17.8 11.0 38.0 40.8 29.4 41
29. West Bengal - - 33.0 35.4 22.7 19.0 20.2 14.2 43.5 46.7 30.0 46
Union Territories
30. Andaman &
Nicobar Islands - - -
31. Chandigarh 21.1C 25.2 -
32. Dadra & Nagar
Haveli 44.9R 37.7 -
33. Daman & Diu 29.7R 35.5 -
34. Lakshadweep - - -
35. Pondicherry - - -
Note: P=Pooled R=Rural C=CombinedSource: * India, Planning Commission. (2000). Status of Women & Men: Data Sheet. New Delhi. P. 1.
** International Institute for Population Sciences. (2006). National Family Health Survey-3, 2006. Mumbai. P.3.*** International Instititute for Population Sciences. (2004). National Dissemination Seminar on Reproductive and Child
Health Project (Phase I, Round 2, 2002) Reproductive and Child Health Services: Fifth Session: Results: 2004 Jan. 27-28, New Delhi. Mumbai. P.133.

Statistics on Women in India 2007
143
From time to time, National Nutritional Monitoring Bureau undertakes surveys of the
dietary intake of the population of India in various states and special groups, such as tribal
and rural. In 2001, NNMB undertook a dietary intake survey of the rural population in 9
states namely Andhra Pradesh, Gujarat, Karnataka Kerala, Madhya Pradesh, Maharashtra,
Orissa, Tamil Nadu and West Bengal. The dietary intake of energy and proteins was found
to be less than the recommended amount, as given in Table 60.
Table 60: Daily Average Intake of Energy and Proteins against
Recommended Intake by Age/Sex/Physical Activity of Rural
Population, 2001
S. Age Group Male/Female Nature of Energy Proteins
No. Activity (kcal/day) (gms/day)
Intake of RDI Intake of RDI
Energy Proteins
1. 1-3 Boy & Girl 729 1240 20 22
2. 4-6 Boy & Girl 1066 1690 28 30
3. 7-9 Boy & Girl 1294 1950 34 41
4. 10-12 Boy 1524 2190 40 54
Girl 1500 1970 39 57
5. 13-15 Boy 1856 2450 49 70
Girl 1689 2060 44 65
6. 16-17 Boy 2114 2640 55 78
Girl 1856 2060 49 63
7. >=18 Male Sedentary 2225 2425 59 60
Moderate 2371 2875 61 60
>=18 Female Sedentary 1878 1875 48 50
(NNPL) Moderate 2020 2225 52 50
Note: RDI – Recommended Dietary Intakes
Source: India, Ministry of Statistics and Programme Implementation, Central Statistical Organisation.
(2007). Women & Men in India 2006. New Delhi. P.33.

Statistics on Women in India 2007
144
The average intake of energy, proteins, iron and Vitamin A against the Recommended
Daily Intake Allowances (RDA) by boys and girls in various age groups is given in Table 61.
Table 61: Average Intake of Energy, Proteins, Iron and Vitamin A against
the Recommended Daily Intake Allowances (RDA), 1998
S.No. Age (Yrs.) Sex Energy Proteins Iron (mg) Vitamin A (ug)
(Kcals/day) (g/day)
Intake RDA Intake RDA Intake RDA Intake RDA
1. 1-3 Boys 918.1 1240 30.1 22 8.9 12 195.5 400
Girls 925.9 30.5 9.2 200.8
2. 4-6 Boys 1299.5 1690 40.6 30 13.0 18 249.8 400
Girls 1298.5 41.2 11.3 240.7
3. 7-9 Boys 1570.3 1950 50.0 41 20.0 26 258.4 600
Girls 1520.0 49.7 18.3 246.5
4. 10-12 Boys 1847.0 2190 56.8 54 18.7 34 306.6 600
Girls 1482.2 1970 45.7 57 15.1 19 309.8
5. 13-15 Boys 2184.9 2450 67.1 70 22.1 41 356.3 600
Girls 2097.1 2060 65.6 65 21.4 28 369.4
6. 16-17 Boys 2514.3 2640 79.2 78 25.7 50 416.2 600
Girls 2327.1 2060 74.2 63 23.9 30 396.7
7. >=18 Boys 2592.3 2425 79.7 60 26.1 20 396.6 600
Girls 2292.9 1875 70.8 50 23.0 30 376.1
Note: Pooled for 18 States/UTs.
Source: India, Ministry of Human Resource Development, Department of Women and Child Development.
(1998). India Nutrition Profile 1998. New Delhi. P.14-15.
The per capita consumption of various food items per day in rural areas of different states
and the ICMR Norms are given in Table 62.
Table 62: Per Capita Consumption of Various Foods Items (gms/day) in
Rural Areas, 1993-94
S.No. State Cereals Cereals Sugar Pulses Vegetables Fruits Fats and Milk Eggs Meat Fish
Substitute Oils
ICMR Norm 420 75 30 40 125 50 22 150 45 25 25
1. Andhra Pradesh 442.33 0.00 14.33 23.33 66.00 22.36 12.33 78.60 6.00 7.33 3.67
2. Assam 439.00 0.33 14.00 17.00 47.33 32.15 11.00 36.30 4.67 5.00 14.33
3. Bihar 477.00 0.00 10.67 24.00 63.00 17.52 9.67 71.70 0.58 2.33 4.00
4. Gujarat 355.33 0.00 32.00 12.33 74.67 17.72 21.67 152.10 0.71 1.67 0.67
5. Haryana 430.67 0.00 53.33 20.67 64.67 30.18 9.67 414.60 0.33 2.00 0.00
6. Himachal Pradesh 445.67 0.00 32.33 36.00 51.3 12.88 18.00 225.60 0.92 3.00 0.00
7. Karnataka 438.33 0.00 19.00 26.33 62.67 31.93 8.00 86.40 3.71 4.33 4.67
8. Kerala 337.00 54.00 27.67 14.33 35.67 43.41 8.67 78.30 8.33 8.00 45.00
9. Madhya Pradesh 473.33 0.67 19.33 32.33 56.33 10.27 10.00 82.80 0.63 2.00 2.00
10. Maharashtra 379.67 3.00 33.00 31.00 61.67 20.57 10.00 75.00 2.54 4.00 3.67
11. Orissa 531.00 0.33 11.00 15.00 58.67 13.50 6.00 23.10 1.21 2.00 9.67
12. Punjab 359.33 0.00 56.00 29.67 77.33 21.50 18.00 429.90 1.96 2.00 0.00
13. Rajasthan 495.00 0.00 32.00 21.33 47.33 14.91 8.67 312.30 0.29 1.67 0.00
14. Tamil Nadu 390.67 0.67 14.67 22.67 67.33 35.38 8.67 63.60 4.42 5.67 5.67
15. Uttar Pradesh 463.67 0.33 17.33 32.67 56.33 18.08 12.67 163.20 0.88 3.67 1.33
16. West Bengal 498.67 0.33 12.00 14.00 63.67 19.20 11.33 46.20 7.04 4.33 18.00
Average 434.79 3.73 24.92 23.29 59.63 22.60 11.52 146.23 2.76 3.69 7.04
Notes: Col. 1, 2, 4, NSSO, 50th Round, (Report No.402), Level and Patterns of Consumer Expenditure (1993-94) Col. 3, 5-11,NSSO, 50th Round, Quantity of Consumption of all Food Items (Rural)
Source: M. S. Swaminathan Research Foundation (2001). Food Insecurity Atlas of Rural India/ M.S. Swaminathan ResearchFoundation and World Food Programme. Chennai. P.35.

Statistics on Women in India 2007
145
National Institute of Nutrition conducted a survey of the diet and nutritional status of
sections of the population in 9 states during 2004-05. The consumption of all foods except
roots and tubers was below the RDI in all the age/sex/physiological groups. The consumption
of protective foods such as pulses, green leafy vegetables (GLV), milk and fruits was
grossly inadequate. Consequently, the intake of micronutrients such as iron, vitamin A,
riboflavin and folic acid were far below the recommended levels in all the age groups. Only
25% of the preschool and school age children were consuming diets adequate in protein
and energy, the proportion of which was higher in adolescents (30-60%) and adults (70-
80%). The nutritional status of children aged 1-5 years according to Gomez Classification
is given in Table 63.
Table 63: Nutritional Status of Children 1-5 Years by Gender Gomez Classification,
(%), 2006
S. No. State Gender Sample Nutrition Grades*
Size Normal Mild Moderate Severe
Pooled Boys 2458 13.3 44.0 38.2 4.6
Girls 2401 12.8 44.5 38.2 4.5
Pooled 4859 13.0 44.2 38.2 4.5
1. Andhra Pradesh Boys 228 12.7 46.5 38.6 2.2
2. Girls 203 9.4 43.3 44.8 2.5
3. Pooled 431 11.1 45.0 41.5 2.3
4. Gujarat Boys 291 15.1 32.3 43.0 9.6
5. Girls 274 21.2 34.7 35.4 8.8
6. Pooled 565 18.1 33.5 39.3 9.2
7. Karnataka Boys 258 11.2 48.1 36.4 4.3
8. Girls 256 14.5 45.3 35.5 4.7
9. Pooled 514 12.8 46.7 36.0 4.5
10. Kerala Boys 200 26.5 57.0 16.0 0.5
11. Girls 196 20.9 51.5 26.0 1.5
12. Pooled 396 23.7 54.3 21.0 1.0
13. Madhya Pradesh Boys 253 9.9 33.2 49.4 7.5
14. Girls 252 13.9 34.1 42.1 9.9
15. Pooled 505 11.9 33.7 45.7 8.7
16. Maharashtra Boys 373 11.5 43.2 42.9 2.4
17. Girls 329 10.6 47.4 37.7 4.3
18. Pooled 702 11.1 45.2 40.5 3.3
19. Orissa Boys 294 11.9 42.2 40.1 5.8
20. Girls 331 7.6 43.8 43.8 4.8
21. Pooled 625 9.6 43.0 42.1 5.3
22. Tamil Nadu Boys 344 12.5 51.2 33.4 2.9
23. Girls 331 11.8 52.9 33.2 2.1
24. Pooled 675 12.1 52.0 33.3 2.5
25. West Bengal Boys 217 11.5 45.2 37.8 5.5
Girls 229 8.3 46.7 44.1 0.9
Pooled 446 9.9 46.0 41.0 3.1
Notes: * NCHS Standards
Source: National Institute of Nutrition. (2006). Diet and Nutritional Status of Population and Prevalence
of Hypertension among Adults in Rural Areas. Hyderabad. P.58.
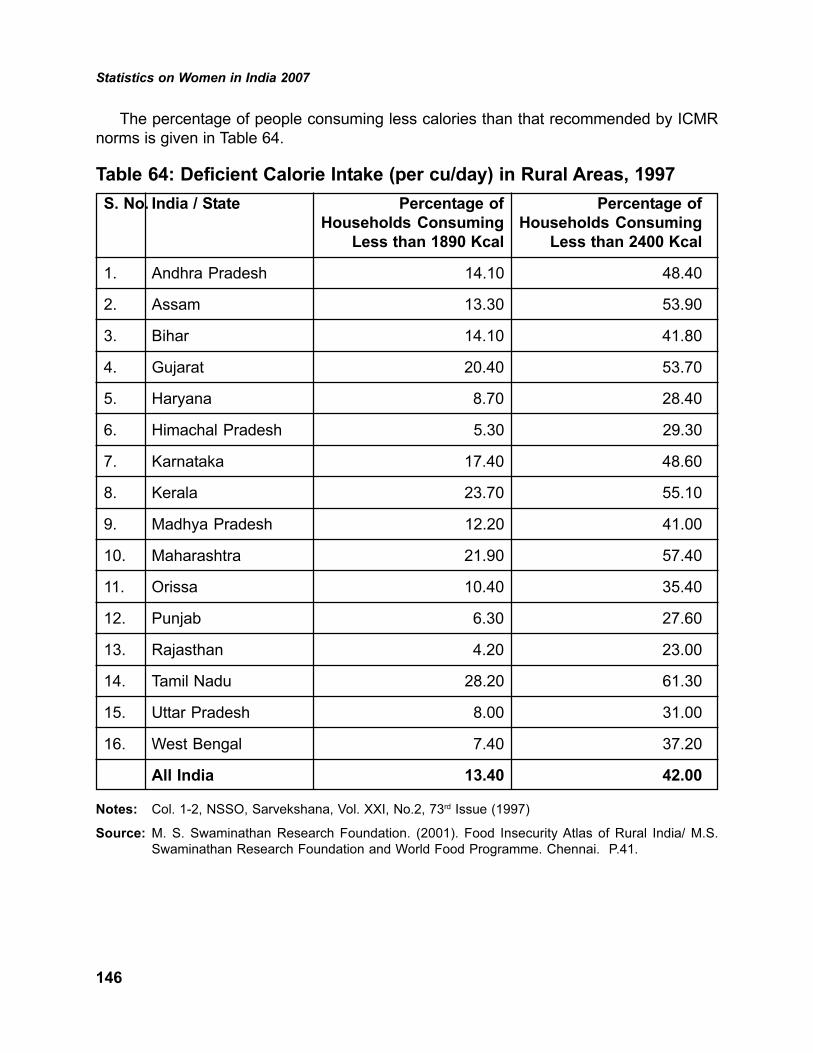
Statistics on Women in India 2007
146
The percentage of people consuming less calories than that recommended by ICMR
norms is given in Table 64.
Table 64: Deficient Calorie Intake (per cu/day) in Rural Areas, 1997
S. No. India / State Percentage of Percentage of
Households Consuming Households Consuming
Less than 1890 Kcal Less than 2400 Kcal
1. Andhra Pradesh 14.10 48.40
2. Assam 13.30 53.90
3. Bihar 14.10 41.80
4. Gujarat 20.40 53.70
5. Haryana 8.70 28.40
6. Himachal Pradesh 5.30 29.30
7. Karnataka 17.40 48.60
8. Kerala 23.70 55.10
9. Madhya Pradesh 12.20 41.00
10. Maharashtra 21.90 57.40
11. Orissa 10.40 35.40
12. Punjab 6.30 27.60
13. Rajasthan 4.20 23.00
14. Tamil Nadu 28.20 61.30
15. Uttar Pradesh 8.00 31.00
16. West Bengal 7.40 37.20
All India 13.40 42.00
Notes: Col. 1-2, NSSO, Sarvekshana, Vol. XXI, No.2, 73rd Issue (1997)
Source: M. S. Swaminathan Research Foundation. (2001). Food Insecurity Atlas of Rural India/ M.S.
Swaminathan Research Foundation and World Food Programme. Chennai. P.41.
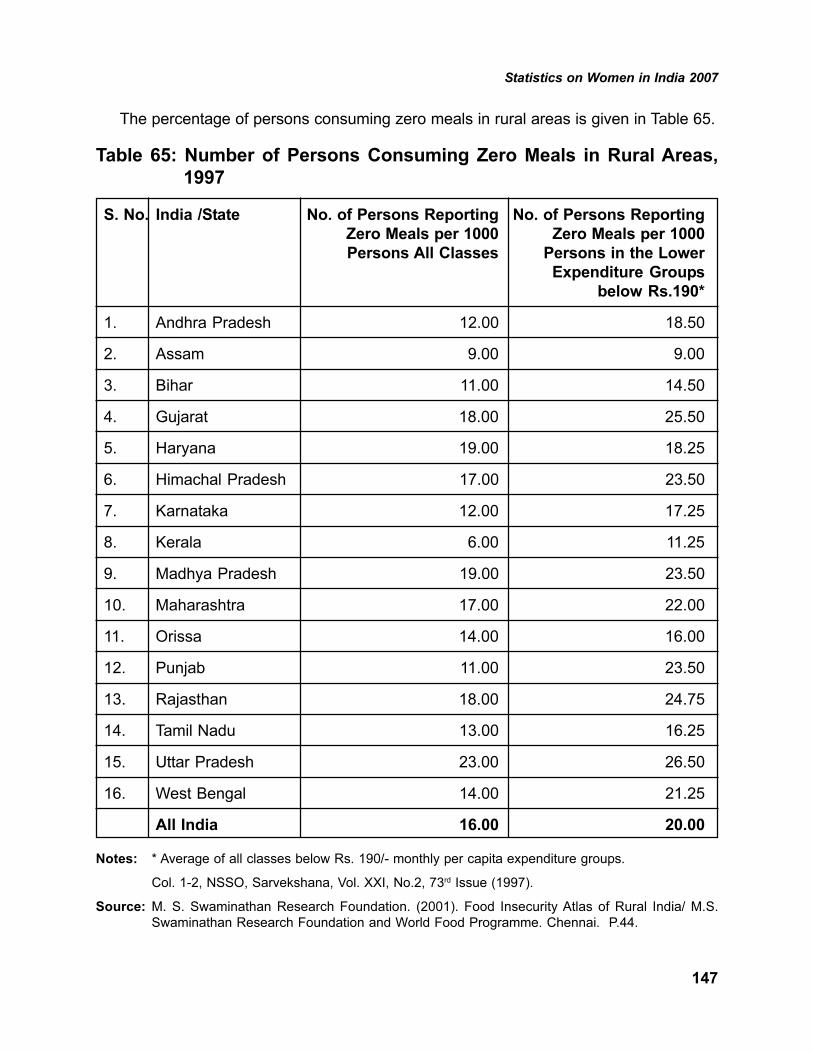
Statistics on Women in India 2007
147
The percentage of persons consuming zero meals in rural areas is given in Table 65.
Table 65: Number of Persons Consuming Zero Meals in Rural Areas,
1997
S. No. India /State No. of Persons Reporting No. of Persons Reporting
Zero Meals per 1000 Zero Meals per 1000
Persons All Classes Persons in the Lower
Expenditure Groups
below Rs.190*
1. Andhra Pradesh 12.00 18.50
2. Assam 9.00 9.00
3. Bihar 11.00 14.50
4. Gujarat 18.00 25.50
5. Haryana 19.00 18.25
6. Himachal Pradesh 17.00 23.50
7. Karnataka 12.00 17.25
8. Kerala 6.00 11.25
9. Madhya Pradesh 19.00 23.50
10. Maharashtra 17.00 22.00
11. Orissa 14.00 16.00
12. Punjab 11.00 23.50
13. Rajasthan 18.00 24.75
14. Tamil Nadu 13.00 16.25
15. Uttar Pradesh 23.00 26.50
16. West Bengal 14.00 21.25
All India 16.00 20.00
Notes: * Average of all classes below Rs. 190/- monthly per capita expenditure groups.
Col. 1-2, NSSO, Sarvekshana, Vol. XXI, No.2, 73rd Issue (1997).
Source: M. S. Swaminathan Research Foundation. (2001). Food Insecurity Atlas of Rural India/ M.S.
Swaminathan Research Foundation and World Food Programme. Chennai. P.44.

Statistics on Women in India 2007
148
The number of households per 1,000 households getting adequate and inadequate
food for some months and all months in the year 2004-05 is given in Table 66.
Table 66: Per Thousand Distribution of Households by Availability of
Adequate and Inadequate Food in Rural and Urban Areas,
2004-05
Number Per 1000 of Households Getting Food
S. India/States Adequate Food Inadequate Inadequate Not Households
No. Throughout Food Some Food all Reported
the Year Months of Months of
the Year the Year
Rural Urban Rural Urban Rural Urban Rural Urban Rural Urban
1. Andhra Pradesh 993 999 6 1 0 0 1 0 1000 1000
2. Assam 940 973 17 3 36 21 6 3 1000 1000
3. Bihar 967 975 20 8 8 11 6 7 1000 1000
4. Chhattisgarh 974 999 26 1 0 0 0 0 1000 1000
5. Gujarat 998 1000 3 0 0 0 0 0 1000 1000
6. Haryana 1000 998 0 0 0 2 0 0 1000 1000
7. Jharkhand 993 1000 6 0 1 0 0 0 1000 1000
8. Karnataka 997 998 3 1 0 0 0 0 1000 1000
9. Kerala 975 982 22 17 3 1 1 0 1000 1000
10. Madhya Pradesh 979 996 15 4 5 0 0 0 1000 1000
11. Maharashtra 990 994 10 5 0 0 0 0 1000 1000
12. Orissa 934 994 48 4 13 2 5 1 1000 1000
13. Punjab 991 998 8 2 1 0 0 0 1000 1000
14. Rajasthan 999 1000 0 0 0 0 0 0 1000 1000
15. Tamil Nadu 998 997 1 4 1 0 0 0 1000 1000
16. Uttar Pradesh 981 990 14 7 3 1 3 1 1000 1000
17. West Bengal 880 984 106 7 13 6 2 4 1000 1000
All India 974 994 20 4 4 1 2 1 1000 1000
Source: India, Ministry of Statistics and Programme Implementation, National Sample Survey Organisation (NSSO).
(2007). Perceived Adequacy of Food Consumption in Indian Households 2004-05: NSS 61St Round, July
2004 – June 2005. New Delhi. P.18-20.

Statistics on Women in India 2007
149
The per capita consumption of food Items in kilograms per month in urban areas in
1999-2000 is given in Table 67.
Table 67: Per Capita Consumption of Food Items (kg/month) in Urban
Areas, 1999-2000
S.No. India / States/ Cereals Pulses & Milk* Edible Eggs* Fish & Meats Vege- Fruits Sugar
UTs Pulse Oil Prawn tables
Products
1. Andhra Pradesh 10.94 0.87 3.96 0.60 0.32 0.08 0.29 2.93 0.97 0.67
2. Assam 12.26 0.75 1.93 0.55 0.34 0.79 0.23 2.25 0.80 0.64
3. Bihar 12.70 0.93 3.06 0.52 0.16 0.16 0.20 2.76 0.80 0.67
4. Delhi 8.61 1.17 7.86 0.74 0.24 0.12 0.26 3.29 1.94 1.07
5. Gujarat 8.49 1.03 5.92 1.05 0.11 0.03 0.12 3.31 1.01 1.16
6. Haryana 9.36 1.05 8.13 0.63 0.12 0.00 0.07 2.81 1.21 1.49
7. Himachal Pradesh 10.33 1.40 9.07 0.73 0.31 0.01 0.18 3.06 1.23 1.16
8. Jammu & Kashmir 12.84 0.93 7.22 0.77 0.27 0.01 0.56 3.69 1.29 0.72
9. Karnataka 10.21 1.04 4.56 0.59 0.31 0.12 0.33 2.85 1.12 0.97
10. Kerala 9.25 0.69 3.14 0.46 0.40 1.88 0.33 1.66 1.02 0.88
11. Madhya Pradesh 11.09 1.00 3.90 0.64 0.14 0.05 0.12 3.22 0.82 1.02
12. Maharashtra 9.35 1.02 4.31 0.84 0.24 0.15 0.29 3.17 1.16 1.15
13. Orissa 14.51 0.74 1.77 0.43 0.21 0.35 0.19 3.41 0.78 0.66
14. Punjab 9.21 1.17 8.76 0.67 0.18 0.00 0.08 3.65 1.17 1.62
15. Rajasthan 11.56 0.96 6.95 0.62 0.07 0.00 0.11 2.97 0.76 1.16
16. Tamil Nadu 9.65 1.02 4.29 0.58 0.47 0.18 0.35 3.16 1.17 0.75
17. Uttar Pradesh 10.79 0.98 4.74 0.60 0.14 0.03 0.24 2.64 1.13 1.06
18. West Bengal 11.17 0.60 2.37 0.68 0.58 0.86 0.25 2.88 0.93 0.68
Union Territories
19. Chandigarh 8.74 1.39 9.48 0.76 0.31 0.00 0.13 3.65 1.83 1.35
20. Pondicherry 9.62 1.00 4.18 0.64 0.56 0.43 0.26 3.33 0.93 0.67
All India 10.42 1.00 4.59 0.72 0.26 0.22 0.24 3.02 1.06 1.00
Notes: NSSO, 55th Round, Report No. 461.
*One litre of milk is taken as 900 grams; one egg is taken as 125 grams.
Source: M.S. Swaminathan Research Foundation (2002). Food Insecurity Atlas of Urban India/ M.S.
Swaminathan Research Foundation and World Food Prorgramme. Chennai. P. 16.
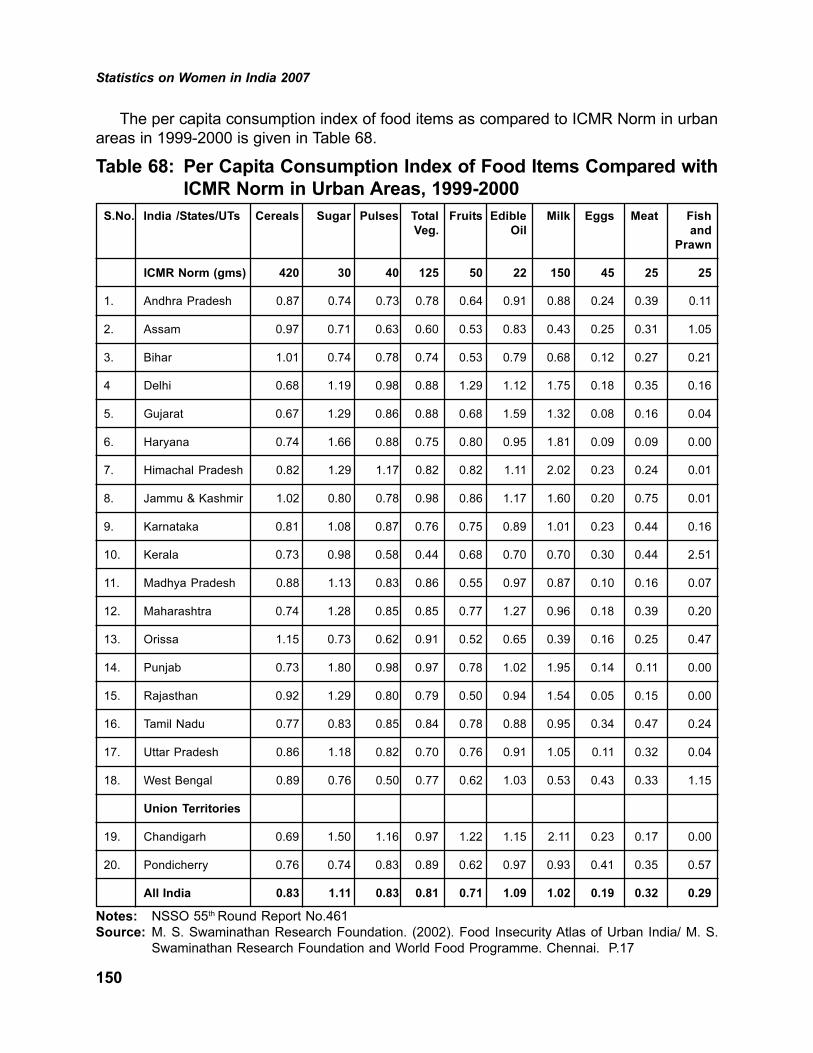
Statistics on Women in India 2007
150
The per capita consumption index of food items as compared to ICMR Norm in urban
areas in 1999-2000 is given in Table 68.
Table 68: Per Capita Consumption Index of Food Items Compared with
ICMR Norm in Urban Areas, 1999-2000
S.No. India /States/UTs Cereals Sugar Pulses Total Fruits Edible Milk Eggs Meat Fish
Veg. Oil and
Prawn
ICMR Norm (gms) 420 30 40 125 50 22 150 45 25 25
1. Andhra Pradesh 0.87 0.74 0.73 0.78 0.64 0.91 0.88 0.24 0.39 0.11
2. Assam 0.97 0.71 0.63 0.60 0.53 0.83 0.43 0.25 0.31 1.05
3. Bihar 1.01 0.74 0.78 0.74 0.53 0.79 0.68 0.12 0.27 0.21
4 Delhi 0.68 1.19 0.98 0.88 1.29 1.12 1.75 0.18 0.35 0.16
5. Gujarat 0.67 1.29 0.86 0.88 0.68 1.59 1.32 0.08 0.16 0.04
6. Haryana 0.74 1.66 0.88 0.75 0.80 0.95 1.81 0.09 0.09 0.00
7. Himachal Pradesh 0.82 1.29 1.17 0.82 0.82 1.11 2.02 0.23 0.24 0.01
8. Jammu & Kashmir 1.02 0.80 0.78 0.98 0.86 1.17 1.60 0.20 0.75 0.01
9. Karnataka 0.81 1.08 0.87 0.76 0.75 0.89 1.01 0.23 0.44 0.16
10. Kerala 0.73 0.98 0.58 0.44 0.68 0.70 0.70 0.30 0.44 2.51
11. Madhya Pradesh 0.88 1.13 0.83 0.86 0.55 0.97 0.87 0.10 0.16 0.07
12. Maharashtra 0.74 1.28 0.85 0.85 0.77 1.27 0.96 0.18 0.39 0.20
13. Orissa 1.15 0.73 0.62 0.91 0.52 0.65 0.39 0.16 0.25 0.47
14. Punjab 0.73 1.80 0.98 0.97 0.78 1.02 1.95 0.14 0.11 0.00
15. Rajasthan 0.92 1.29 0.80 0.79 0.50 0.94 1.54 0.05 0.15 0.00
16. Tamil Nadu 0.77 0.83 0.85 0.84 0.78 0.88 0.95 0.34 0.47 0.24
17. Uttar Pradesh 0.86 1.18 0.82 0.70 0.76 0.91 1.05 0.11 0.32 0.04
18. West Bengal 0.89 0.76 0.50 0.77 0.62 1.03 0.53 0.43 0.33 1.15
Union Territories
19. Chandigarh 0.69 1.50 1.16 0.97 1.22 1.15 2.11 0.23 0.17 0.00
20. Pondicherry 0.76 0.74 0.83 0.89 0.62 0.97 0.93 0.41 0.35 0.57
All India 0.83 1.11 0.83 0.81 0.71 1.09 1.02 0.19 0.32 0.29
Notes: NSSO 55th Round Report No.461
Source: M. S. Swaminathan Research Foundation. (2002). Food Insecurity Atlas of Urban India/ M. S.
Swaminathan Research Foundation and World Food Programme. Chennai. P.17

Statistics on Women in India 2007
151
The cereal consumption and calorie intake in urban areas in 1999-2000 is given in
Table 69.
Table 69: Cereal Consumption and Calorie Intake in Urban Areas, 1999-
2000
S. India/State/UTs Cereal Cereal Calorie Calorie
No. Consumption Consump- Intake by Intake by
of the Lowest tion for All the Lowest All Classes
Ten Percent Classes Ten Percent
(Kg/month) (Kg/month) (Kcal/cu/day) (Kcal/cu/day)
1. Andhra Pradesh 9.67 10.94 1842 2508
2. Assam 10.68 12.26 1876 2630
3. Bihar 9.87 12.70 1813 2645
4. Delhi 7.96 8.61 1943 2623
5. Gujarat 7.62 8.49 1829 2518
6. Haryana 7.66 9.36 1692 2665
7. Himachal Pradesh 10.47 10.33 2222 3218
8. Jammu & Kashmir 11.51 12.84 2357 5955
9. Karnataka 8.57 10.21 1776 2494
10. Kerala 6.93 9.25 1581 2498
11. Madhya Pradesh 9.51 11.09 1867 2904
12. Maharashtra 9.74 9.35 1867 2484
13. Orissa 13.03 14.51 2100 2802
14. Punjab 8.06 9.21 1979 2667
15. Rajasthan 10.19 11.56 2071 2869
16. Tamil Nadu 8.04 9.65 1676 2509
17. Uttar Pradesh 8.83 10.79 1765 2610
18. West Bengal 10.03 11.17 1900 2597
Union Territories
19. Chandigarh 7.03 8.74 1803 2741
20. Pondicherry 8.20 9.62 1665 2441
All India 9.55 10.44 1890 2637
Notes: NSSO 55th Round Report No.457, NSSO 55th Round, Report No. 471.
(Kcal/ cu/day = Kilocalories per consumer unit per day)
Source: M. S. Swaminathan Research Foundation. (2002). Food Insecurity Atlas of Urban India/ M. S.
Swaminathan Research Foundation and World Food Programme. Chennai. P.19.

Statistics on Women in India 2007
152
Adolescent girls from vulnerable sections of society do not get adequate nutrition and
are deficit in calories. Many adolescent girls are also anaemic. To improve the nutritional
status of adolescent girls, the Ministry of Women and Child Development provides foodgrains
to undernourished girls identified by the anganwadi worker. This programme was undertaken
during 2005-06 on a pilot project basis and is being implemented 51 identified districts.
Two backward districts in major states are selected on the basis of ranking developed by
the Rural Development Division of the Planning Commission. Free foodgrains at the rate
of 6 kg per beneficiary per month are provided to underweight (less than 35 kg) adolescent
girls (11-19 years). The foodgrains released under Nutrition Programme for Adolescent
Girls is given in Table 70.
Table 70: Foodgrains Allotted and Funds Released under Nutrition
Programme for Adolescent Girls (NPAG), 2006-07
S. India/State/UT Nutrition Programme for Adolescent Girls 2006-07
No. Allocation Amount Requirement Allocation
of ACA Released of Food of Food
(2006-07) (50% of Grains Grains (in
(Rs.in lakhs) allocation) (in Metric Metric
(Rs. in lakhs) Tonnes) Tonnes)
India 12409.29 6204.65 205500 44390
1. Andhra Pradesh 1113.73 556.87 18700 9350
2. Arunachal Pradesh 7.48 3.74 100 0
3. Assam 251.29 125.65 4100 0
4. Bihar 1073.78 536.89 18000 550
5. Chhattisgarh 336.73 168.37 5600 900
6. Delhi 160.01 80.005 2300 20
7. Goa 93.07 46.54 1500 0
8. Gujarat 624.63 312.32 10400 0
9. Haryana 248.32 124.16 4000 530
10. Himachal Pradesh 185.48 92.74 3000 1790
11. Jammu & Kashmir 138.29 69.15 2200 0
12. Jharkhand 365.78 182.89 6100 0
13. Karnataka 1055.39 527.70 17700 6030
14. Kerala 520.73 260.37 8100 0

Statistics on Women in India 2007
153
S. India/State/UT Nutrition Programme for Adolescent Girls 2006-07
No. Allocation Amount Requirement Allocation
of ACA Released of Food of Food
(2006-07) (50% of Grains Grains (in
(Rs.in lakhs) allocation) (in Metric Metric
(Rs. in lakhs) Tonnes) Tonnes)
15. Madhya Pradesh 566.33 283.17 9500 440
16. Maharashtra 1253.27 626.64 21000 0
17. Manipur 33.12 16.56 500 200
18. Meghalaya 34.99 17.50 600 0
19. Mizoram 14.08 7.04 200 90
20. Nagaland 35.26 17.63 600 590
21. Orissa 589.1 294.55 10000 1950
22. Punjab 273.02 136.51 4200 0
23. Rajasthan 483.4 241.70 8100 1270
24. Sikkim 13.17 6.59 200 100
25. Tamil Nadu 436.36 218.18 7100 7100
26. Tripura 188.17 94.09 3100 1420
27. Uttar Pradesh 636.93 318.47 10600 840
28. Uttarakhand 219.67 109.84 3600 390
29. West Bengal 1265.5 632.75 21300 10140
Union Territories
30. Andaman & Nicobar
Islands 38.79 19.40 600 190
31. Chandigarh 65.7 32.85 1000 10
32. Dadra & Nagar
Haveli 35.68 17.84 600 490
33. Daman & Diu 23.83 11.92 400 0
34. Lakshadweep 5.13 2.57 100 0
35. Pondicherry 23.08 11.54 400
Notes: ACA: Additional Central Assistance
Source: India, Ministry of Women and Child Development (2007). Annual Report 2006-2007. New Delhi.
P 191.

Statistics on Women in India 2007
154
Kishori Shakti Yojana (KSY) addresses the needs of adolescent girls in the age group
11-18 years for self development, nutrition and health, literacy and numerical skills,
vocational skills, etc. Approximately 44 adolescent girls are benefited in 1 year in 1 KSY
Block. Each project is sanctioned Rs.1.10 lakhs per block per year. The scheme has been
extended to all 6108 ICDS Blocks in the country, and the total number of KSY Blocks is
given in Table 71.
Table 71: Kishori Shakti Yojana (KSY) Blocks Sanctioned, 2006-07
S. India/State/UT Kishori Shakti Yojana 2006-07
No. KSY Blocks Total Blocks Funds
Sanctioned Sanctioned Released
Prior to 2005* for KSY (Till 31.12.2006)
$ (Rs. in Lakhs) $
India 2000 6118 3125.85
1. Andhra Pradesh 63 376 199.1
2. Arunachal Pradesh 21 79 31.90
3. Assam 62 219 107.8
4. Bihar 159 538 216.15
5. Chhattisgarh 96 158 83.6
6. Delhi 3 34 15.4
7. Goa 1 11 6.05
8. Gujarat 40 260 124.3
9. Haryana 85 128 63.8
10. Himachal Pradesh 15 76 39.8
11. Jammu & Kashmir 2 140 77.0
12. Jharkhand 66 204 112.2
13. Karnataka 38 185 101.75
14. Kerala 13 163 89.65
15. Madhya Pradesh 234 367 184.8
16. Maharashtra 98 416 204.6
17. Manipur 14 34 18.7
18. Meghalaya 23 39 18.7

Statistics on Women in India 2007
155
S. India/State/UT Kishori Shakti Yojana 2006-07
No. KSY Blocks Total Blocks Funds
Sanctioned Sanctioned Released
Prior to 2005* for KSY (Till 31.12.2006)
$ (Rs. in Lakhs) $
19. Mizoram 22 23 11.55
20. Nagaland 41 56 29.7
21. Orissa 112 326 179.3
22. Punjab 47 148 78.1
23. Rajasthan 165 274 150.7
24. Sikkim 1 11 2.75
25. Tamil Nadu 37 434 238.7
26. Tripura 16 51 23.1
27. Uttar Pradesh 423 835 455.95
28. Uttarakhand 40 99 54.45
29. West Bengal 57 416 196.9
Union Territories
30. Andaman & Nicobar Islands 1 5 2.75
31. Chandigarh 1 3 1.65
32. Dadra & Nagar Haveli 1 2 0.55
33. Daman & Diu 1 2 1.1
34. Lakshadweep 1 1 0.55
35. Pondicherry 1 5 2.75
Source: 1. * India, Ministry of Women and Child Development (2006). Annual Report 2005-2006. New
Delhi. P.206.
2. $ India, Ministry of Women and Child Development (2007). Annual Report 2006-2007. New
Delhi. P. 192-193.

Statistics on Women in India 2007
156
7. Education
Education is a critical input in human resource development and is essential for the
country’s economic growth. A high literacy rate, especially in the case of women, correlates
with improvement in several socio-economic indicators, namely low birth rate, low IMR
and increase in life expectancy. The recognition of this fact has created awareness on the
need to focus on improving literacy and universalizing elementary education programme.
The task of providing basic education for all, with concrete plans of action, gained greater
momentum only after the National Policy of Education (NPE) was adopted in 1986 and
revised in 1992.
Primary education was earlier a State subject under the Constitution, but it has been
brought under the Concurrent List to enable both, the Centre and State, to undertake
measures to achieve universalization of primary education. The Supreme Court of India,
in the Unnikrishnan Case (1993), declared primary education to be a fundamental right.
The Constitution (86th Amendment) Act, 2002, was enacted by the Parliament of India
making education a fundamental right. It was enacted to provide free and compulsory
education to all children in the age group 6-14 years.
With the World Declaration on Education For All (EFA) adopted in Jomtien, Thailand in
1990, basic education in all its facets - Early Childhood Care and Education (ECCE),
Elementary Education, Education for Adolescents, Adult Education, Gender Equality and
Quality Improvement - was recognised as a fundamental right of every citizen. The nation
is firmly committed to providing Education for All, the priority areas being free and compulsory
primary education, covering children with special needs, eradication of illiteracy,
vocationalisation, education for women’s equality, and special focus on the education of
SCs/STs and minorities.
Major programmes of the Department of Education are Sarva Shiksha Abhiyan, District
Primary Education Programme, National Programme for Education of Girls at Elementary
Level, Prarambhik Shiksha Kosh, National Institute of Open Schooling, Jan Shikshan
Sansthan, Mahila Samakhya, National Programme of Nutritional Support to Primary
Education (Mid-Day Meals), and other schemes which accord priority to areas of
concentration of SCs, STs, OBCs and minorities.
The Sarva Shiksha Abhiyan (SSA), the National Programme for Universalisation of
Elementary Education for children in the age group 6-14 years, was launched by the
Government of India in mission mode in partnership with the States and Union Territories.
Apart from providing quality elementary education, the SSA also focuses on free textbooks
for girls, toilets especially for girls, setting up of Village Education Committees and Mother
Teacher Associations.
The literacy rate has been going up steadily, and the Census of India 2001 revealed that
while the total literacy rate was 65 per cent, for women and girls it was 54 per cent. The
literacy rate of the population aged 7 years and above is given in Table 72.

Statistics on Women in India 2007
157
Table 72: Literacy Rate of Population Aged 7 Years and Above in 2001,
and Children Aged 11-14 Years in School, (%), 1998-99.
S. India/State/UTs Literacy Rate> 7 Years (%) * Children Aged
No. 11-14 Years in
School (%) #
2001 1998-99
Total Male Female Boys Girls
India 65.38 75.85 54.16 80.2 67.0
India (Census 1991)
Aged 15 yrs. & above 48.3%1
1. Andhra Pradesh 61.11 70.85 51.17 71.0 54.6
2. Arunachal Pradesh 54.74 64.07 44.24 88.1 78.1
3. Assam 64.28 71.93 56.03 76.3 70.8
4. Bihar 47.53 60.32 33.57 72.4 52.6
5. Chhattisgarh 65.18 77.86 52.40 - -
6. Delhi 81.82 87.37 75.00 91.0 89.9
7. Goa 82.32 88.88 75.51 95.1 89.7
8. Gujarat 69.97 80.50 58.60 79.4 63.1
9. Haryana 68.59 79.25 56.31 89.1 80.0
10. Himachal Pradesh 77.13 86.02 68.08 98.2 95.5
11. Jammu & Kashmir 54.46 65.75 41.82 88.6 71.1
12. Jharkhand 54.13 67.94 39.38 - -
13. Karnataka 67.04 76.29 57.45 75.2 68.0
14. Kerala 90.92 94.20 87.86 96.9 96.8
15. Madhya Pradesh 64.11 76.80 50.28 78.5 61.1
16. Maharashtra 77.27 86.27 67.51 87.0 82.5
17. Manipur 68.87 77.87 59.70 90.7 87.6
18. Meghalaya 63.31 66.14 60.41 80.8 86.8
19. Mizoram 88.49 90.69 86.13 90.4 87.9
20. Nagaland 67.11 71.77 61.92 86.1 80.2
21. Orissa 63.61 75.95 50.97 79.7 66.1
22. Punjab 69.95 75.63 63.55 89.1 84.9
23. Rajasthan 61.03 76.46 44.34 84.3 52.7
24. Sikkim 69.68 76.73 61.46 85.3 85.9
25. Tamil Nadu 73.47 82.33 64.55 84.8 79.6
26. Tripura 73.66 81.47 65.41 - -

Statistics on Women in India 2007
158
S. India/State/UTs Literacy Rate> 7 Years *(%) Children Aged
No. 11-14 Years in
School (%) #
2001 1998-99
Total Male Female Boys Girls
27. Uttar Pradesh 57.36 70.23 42.98 80.6 62.4
28. Uttarakhand 72.28 84.01 60.26 - -
29. West Bengal 69.22 77.58 60.22 75.4 68.7
Union Territories
30. Andaman & Nicobar 81.18 86.07 75.29 - -
Islands
31. Chandigarh 81.76 85.65 76.65 - -
32. Dadra & Nagar Haveli 60.03 73.32 42.99 - -
33. Daman & Diu 81.09 88.40 70.37 - -
34. Lakshadweep 87.52 93.15 81.56 - -
35. Pondicherry 81.49 88.89 74.13 - -
Source : * India, Registrar General and Census Commissioner. (2001).
Provisional Population Totals : Paper 1 of 2001. New Delhi. P. 143.
1 India, Ministry of Human Resource Development, Department of Women and Child
Development (2000). India Report on the World Summit for Children 2000 Office of
Registrar General of India, Census 1991). New Delhi. P. 31.
# International Institute for Population Sciences. (2000). National Family Health Survey-2,
1998-99, India : Data Sheet. Mumbai. P. 1.
Literacy Rate (> 7 years) Census 2001
National Average : 65.38%
Literacy Rate Above 80%
Kerala (90.92%), Mizoram (88.49%), Lakshadweep (87.52%), Goa (82.32%),
Delhi (81.82%), Chandigarh (81.76%), Pondicherry (81.49%), Andaman & Nicobar
Islands (81.18%), Daman and Diu (81.09%)
Literacy Rate Between 60% to 79%
Maharashtra (77.27%), HP (77.13%), Karnataka (67.04%), Tripura (73.66%), Tamil
Nadu (73.47%), Uttarakhand (72.28%), Gujarat (69.97%), Punjab (69.95%),
Sikkim (69.68%) WB (69.22%), Manipur (68.87%), Haryana (68.59%), Nagaland
(67.11%), Chhattisgarh (65.18%), Assam (64.28%), Meghalaya (63.31%), Orissa
(63.61%), MP (64.11%), AP (61.11%), Rajasthan (61.03%), Dadra & Nagar Haveli
(60.03%)
Literacy Rate Below 60%
UP (57.36%), Arunachal Pradesh (54.74%), J&K (54.46%), Jharkhand (54.13%),
Bihar (47.53%)

Statistics on Women in India 2007
159
The Gross Enrolment Ratio (GER) for primary and middle school children is given in Table 73.
Table 73: Gross Enrolment Ratio in Schools for General Education
(All Students) as on 30.9.2004, 2004-2005
S.No. India/State/UT School Enrolment Ratio 2004-2005
Classes I – V Classes VI–VIII Classes IX-XII
(6-11 Years) (11-14 Years) (14-18 Years)
Boys Girls Total Boys Girls Total Boys Girls Total
India 110.70 104.67 107.80 74.30 65.13 69.93 44.26 35.05 39.91
1. Andhra Pradesh 96.05 97.40 96.71 73.73 69.68 71.76 52.12 42.91 47.66
2. Arunachal Pradesh 129.95 115.90 123.12 81.75 69.16 75.53 0.57 0.47 42.37
3. Assam 105.59 104.80 105.20 72.05 67.22 69.70 35.90 28.32 32.23
4. Bihar 95.40 71.18 83.75 39.66 24.29 32.43 21.64 10.31 32.23
5. Chhattisgarh 136.06 127.53 131.84 89.20 70.19 79.87 44.18 30.07 37.30
6. Delhi 89.83 99.72 94.42 82.61 93.54 87.59 49.37 55.77 52.26
7. Goa 111.43 108.76 110.13 102.18 98.90 100.61 58.39 57.24 57.82
8. Gujarat 126.44 109.86 118.65 80.39 66.27 73.77 43.19 33.47 38.64
9. Haryana 80.00 84.90 82.23 77.68 74.85 76.39 46.20 40.46 43.60
10. Himachal Pradesh 109.27 108.49 108.90 109.85 107.04 108.50 135.69 126.56 131.26
11. Jammu & Kashmir 84.41 82.98 83.72 64.87 55.39 60.28 38.90 31.63 35.38
12. Jharkhand 102.91 86.34 94.80 49.41 36.98 43.41 17.58 11.74 14.80
13. Karnataka 108.40 105.73 107.10 87.64 83.19 85.47 47.69 45.03 46.40
14. Kerala 93.53 93.69 93.61 100.91 95.38 98.19 58.98 61.34 60.15
15. Madhya Pradesh 135.35 128.74 132.16 89.41 76.52 83.29 42.86 27.58 35.72
16. Maharashtra 110.34 110.40 110.37 98.96 97.09 98.08 57.98 52.90 55.60
17. Manipur 154.41 148.88 151.69 97.72 91.53 94.69 50.45 46.77 48.61
18. Meghalaya 145.34 149.95 147.62 72.08 80.96 76.45 32.63 33.93 33.27
19. Mizoram 132.25 122.71 127.53 82.19 81.33 81.77 44.22 45.13 44.67
20. Nagaland 88.68 87.15 87.94 55.68 55.50 55.60 21.45 21.10 21.28
21. Orissa 131.89 127.37 129.69 78.82 69.21 74.11 51.89 34.72 43.43
22. Punjab 74.49 80.52 77.20 63.78 67.40 65.42 39.17 40.10 39.60
23. Rajasthan 125.40 116.66 121.24 84.82 54.80 70.67 43.65 20.98 33.06
24. Sikkim 144.46 142.71 143.58 61.50 72.16 66.70 33.09 33.51 33.30
25. Tamil Nadu 119.52 117.23 118.41 109.22 104.66 107.00 62.58 61.55 62.08
26. Tripura 133.67 128.26 131.03 80.65 75.55 78.16 41.25 36.34 38.86
27. Uttar Pradesh 110.63 104.15 107.54 57.82 46.29 52.43 42.68 28.87 36.32
28. Uttarakhand 117.02 118.52 117.74 88.23 87.92 88.08 63.16 52.46 58.03
29. West Bengal 112.92 111.27 112.11 69.43 63.31 66.46 35.19 27.29 31.39
Union Territories
30. Andaman & 109.75 107.90 108.85 103.68 109.87 106.50 47.91 50.31 49.04
Nicobar Islands
31. Chandigarh 77.80 69.94 74.01 65.35 72.75 68.57 51.35 58.85 54.67
32. Dadra & Nagar Haveli 139.12 129.49 134.50 89.90 66.64 79.05 44.74 32.51 38.95
33. Daman & Diu 144.93 127.08 136.01 108.63 127.17 116.57 68.60 70.73 69.54
34. Lakshadweep 62.27 55.28 58.78 57.45 60.40 58.71 43.96 48.55 46.00
35. Pondicherry 141.30 122.70 131.64 112.96 103.48 108.22 76.33 75.88 76.10
Source: India, Ministry of Human Resource Development, Department of Higher Education and Literacy,
Department of Higher Education. (2007). Annual Report 2006-07 (as on 30th September 2004).
New Delhi. P.251.

Statistics on Women in India 2007
160
The enrolment of girls per 100 boys enrolled is given in Table 74.
Table 74: Girls Enrolled per 100 Boys Enrolled, 2004-05
S.No. India/State/UT No. of Girls Enrolled per 100 Boys
Classes Classes Classes Classes ClassesI-V VI-VIII I-VIII IX-X IX-XII
India 88 80 85 71 71
1. Andhra Pradesh 98 90 95 85 77
2. Arunachal Pradesh 85 82 84 74 70
3. Assam 96 89 94 79 74
4. Bihar 69 54 66 44 41
5. Chhattisgarh 92 76 87 65 65
6. Delhi 96 95 96 92 93
7. Goa 92 89 91 96 96
8. Gujarat 77 73 76 67 68
9. Haryana 89 81 86 72 73
10. Himachal Pradesh 91 91 91 85 88
11. Jammu & Kashmir 92 80 88 75 76
12. Jharkhand 80 70 78 61 61
13. Karnataka 94 90 92 88 88
14. Kerala 96 91 94 99 102
15. Madhya Pradesh 89 77 85 56 56
16. Maharashtra 93 90 92 84 92
17. Manipur 101 109 103 96 101
18. Meghalaya 101 109 103 106 101
19. ‘ Mizoram 91 96 92 102 100
20. Nagaland 92 92 92 93 90
21. Orissa 92 84 90 80 65
22. Punjab 88 88 88 88 86
23. Rajasthan 84 54 77 42 42
24. Sikkim 99 112 102 105 101
25. Tamil Nadu 93 91 92 90 94
26. Tripura 92 89 91 88 84
27. Uttar Pradesh 86 70 82 53 58
28. Uttarakhand 93 92 93 73 77
29. West Bengal 95 86 93 76 72
Union Territories
30. Andaman & Nicobar Islands 93 88 91 93 95
31. Chandigarh 84 86 85 88 91
32. Dadra & Nagar Haveli 86 65 80 62 65
33. Daman & Diu 88 88 88 86 82
34. Lakshadweep 89 79 85 87 88
35. Pondicherry 94 92 93 98 102
Source: India, Ministry of Human Resource Development, Department of Higher Education, Statistics
Division. (2007). Selected Educational Statistics 2004-05 (as on 30th September 2004): New
Delhi. P.68.

Statistics on Women in India 2007
161
The Gross Enrolment Ratio (GER) of Scheduled Castes Students in primary and
middle schools is given in Table 75.
Table 75: Gross Enrolment Ratio for Scheduled Castes (SC) Students
(as on 30.9.2004), (Percentage), 2004-2005
S.No. India/State/UT School Enrolment Ratio for Scheduled Castes (SC) 2004-2005
Classes (I-V) Classes (VI-VIII) Classes IX-XII
(6-11 Years) (11-14 Years) (14-18 Years)
Boys Girls Total Boys Girls Total Boys Girls Total
India 123.33 106.62 115.30 77.92 61.50 70.17 39.76 28.73 34.68
36. Andhra Pradesh 107.29 108.68 107.97 79.64 73.70 76.78 60.77 49.09 55.26
37. Arunachal Pradesh - - - - - - - - -
38. Assam 161.93 161.27 161.61 118.20 112.14 115.23 68.69 56.67 62.85
39. Bihar 97.66 60.92 80.15 34.43 19.45 27.58 11.49 6.46 62.85
40. Chhattisgarh 152.44 144.60 148.60 101.70 80.06 91.16 50.58 36.06 43.71
41. Delhi 65.38 67.86 66.49 52.76 63.72 57.86 20.93 24.53 22.62
42. Goa 107.00 104.50 105.75 47.80 41.70 44.75 37.10 30.60 33.85
43. Gujarat 158.42 155.11 156.86 103.75 89.30 96.98 47.74 34.65 41.62
44. Haryana 99.46 105.20 102.11 76.18 73.92 75.15 33.75 27.92 31.13
45. Himachal Pradesh 121.37 122.11 121.73 112.07 109.14 110.65 59.65 53.88 56.85
46. Jammu & Kashmir 122.56 111.98 117.54 101.57 91.53 96.72 69.81 44.21 57.34
47. Jharkhand 105.40 78.39 92.18 48.41 32.34 40.78 15.76 8.84 12.61
48. Karnataka 116.07 113.71 114.91 88.71 82.55 85.74 45.59 42.65 44.23
49. Kerala 108.61 105.49 107.08 108.42 99.43 103.98 55.86 59.02 57.43
50. Madhya Pradesh 149.42 144.16 146.91 100.78 87.84 94.79 41.55 27.26 35.27
51. Maharashtra 149.96 147.24 148.63 134.36 126.63 130.67 76.86 68.75 73.15
52. Manipur 147.93 135.10 141.52 137.70 130.15 133.93 64.03 54.53 59.28
53. Meghalaya - - - - - - - - -
54. Mizoram - - - - - - - - -
55. Nagaland - - - - - - - - -
56. Orissa 141.97 135.08 138.61 67.37 54.75 61.20 34.38 24.46 29.47
57. Punjab 107.56 113.99 110.53 72.65 75.67 74.04 32.25 32.54 32.39
58. Rajasthan 131.48 121.27 126.66 80.93 48.06 65.54 33.77 14.29 25.03
59. Sikkim 155.20 155.50 155.35 74.70 83.20 78.95 44.60 39.70 42.15
60. Tamil Nadu 110.12 102.05 106.19 96.24 91.84 94.08 52.89 51.67 52.29
61. Tripura 152.38 146.11 149.30 81.73 76.00 78.93 59.09 36.22 43.78
62. Uttar Pradesh 131.91 88.54 111.27 67.46 29.80 50.12 33.60 9.77 23.04
63. Uttarakhand 144.20 150.67 147.32 122.02 110.43 116.47 56.33 36.55 46.99
64. West Bengal 116.28 110.32 113.36 65.59 51.84 58.92 53.33 21.07 25.95
Union Territories
65. Andaman & - - - - - - - - -
Nicobar Islands
66. Chandigarh 52.10 47.59 49.84 37.82 40.20 38.90 16.74 17.54 17.11
67. Dadra & Nagar - - - - - - - - -
Haveli
68. Daman & Diu - - - - - - - - -
69. Lakshadweep - - - - - - - - -
70. Pondicherry 133.81 115.11 123.84 114.38 104.88 109.63 76.01 66.40 70.89
Note: SC : Scheduled Castes
Source: India, Ministry of Human Resource Development, Department of Higher Education and Literacy,
Department of Higher Education. (2007). Annual Report 2006-07 (as on 30th September 2006).
New Delhi. P.253.

Statistics on Women in India 2007
162
The Gross Enrolment Ratio (GER) of scheduled tribes students in primary and
middle schools is given in Table 76.
Table 76: Gross Enrolment Ratio of Scheduled Tribes (ST) Students (as
on 30.9.2004), 2004-2005
S.No. India/State/UT School Enrolment Ratio for Scheduled Tribes (ST) 2004-2005
Classes (I-V) Classes (VI-VIII) Classes IX-XII
(6-11 Years) (11-14 Years) (14-18 Years)
Boys Girls Total Boys Girls Total Boys Girls Total
India 128.06 115.49 121.91 73.88 59.49 66.98 32.99 21.95 27.68
1. Andhra Pradesh 104.85 103.17 104.03 71.92 60.91 66.92 53.25 33.36 43.99
2. Arunachal Pradesh 139.23 123.94 131.74 86.05 74.73 80.39 47.06 40.86 44.24
3. Assam 111.11 116.61 113.74 99.15 90.64 95.05 49.48 33.74 41.56
4. Bihar 87.24 55.90 72.23 26.26 14.72 21.13 10.59 6.50 41.56
5. Chhattisgarh 132.08 123.38 127.79 79.98 59.02 69.61 37.61 23.40 30.57
6. Delhi - - - - - - - - -
7. Goa - - - - - - - - -
8. Gujarat 135.15 122.47 129.02 67.69 61.05 64.54 32.72 25.36 29.22
9. Haryana - - - - - - - - -
10. Himachal Pradesh 137.74 140.35 139.00 128.66 126.30 127.55 77.35 62.18 69.76
11. Jammu & Kashmir 111.30 90.83 101.35 93.37 64.52 79.77 26.38 17.00 22.01
12. Jharkhand 125.85 97.74 111.84 53.24 37.85 45.76 16.82 10.32 13.64
13. Karnataka 112.89 112.90 112.89 85.21 78.45 81.94 42.25 36.58 39.64
14. Kerala 115.98 116.02 116.00 99.42 97.52 98.52 40.56 41.72 41.14
15. Madhya Pradesh 155.58 139.77 147.85 82.10 62.53 72.57 23.76 12.51 18.29
16. Maharashtra 140.72 120.50 130.50 85.38 74.63 80.26 41.33 28.86 35.45
17. Manipur 149.05 137.13 143.23 71.91 65.84 68.99 32.73 28.35 30.57
18. Meghalaya 131.86 136.24 134.04 65.82 76.63 71.16 28.66 28.01 28.34
19. Mizoram 137.38 127.58 132.53 84.54 83.66 84.11 46.29 47.32 46.80
20. Nagaland 84.06 82.01 83.07 51.91 51.25 51.59 20.13 19.59 19.87
21. Orissa 125.38 114.14 119.93 47.92 34.07 41.19 22.27 15.21 18.84
22. Punjab - - - - - - - - -
23. Rajasthan 114.03 100.63 107.57 86.67 51.01 70.01 39.03 14.65 27.55
24. Sikkim 252.92 252.88 252.90 87.92 106.18 97.05 46.55 53.02 49.78
25. Tamil Nadu 153.32 101.47 128.23 119.04 122.39 120.63 50.40 54.77 52.40
26. Tripura 134.58 121.21 128.04 62.58 53.30 58.11 30.43 23.13 26.89
27. Uttar Pradesh 172.78 121.70 148.35 75.46 36.30 57.66 92.05 50.00 75.23
28. Uttarakhand 123.81 132.38 127.97 128.23 136.68 132.23 64.36 51.99 58.42
29. West Bengal 120.47 104.33 112.35 62.12 49.22 56.08 26.80 17.15 22.22
Union Territories
30. Andaman & 95.30 173.20 121.27 105.20 83.10 94.15 30.25 32.30 31.28
Nicobar Islands
31. Chandigarh - - - - - - - - -
32. Dadra & Nagar 133.52 129.67 131.69 88.92 62.20 76.77 42.46 24.31 33.39
Haveli
33. Daman & Diu - - - - - - - - -
34. Lakshadweep 61.93 54.85 58.39 57.05 60.13 58.37 43.08 47.70 45.13
35. Pondicherry - - - - - - - - -
Note: ST: Scheduled Tribes
Source: India, Ministry of Human Resource Development, Department of Higher Education and Literacy,
Department of Higher Education. (2007). Annual Report 2006-07 (as on 30th September 2004).
New Delhi. P.255.

Statistics on Women in India 2007
163
School dropout rate in primary, middle and secondary schools is given in Table 77.
Table 77: School Dropout Rate Classes I-X, (%), 2004-2005
S.No. India/State/UT Dropout Rates
Classes I-V Classes I – VIII Classes I – X
Boys Girls Total Boys Girls Total Boys Girls Total
India 31.81 25.42 29.00 50.49 51.28 50.84 60.41 63.88 61.92
1. Andhra Pradesh 31.77 32.14 31.95 57.72 61.08 59.36 62.30 65.24 63.69
2. Arunachal Pradesh 45.86 48.01 46.85 63.23 61.90 62.63 69.59 72.30 70.79
3. Assam 51.58 48.34 50.07 72.41 74.60 73.38 75.18 74.69 74.96
4. Bihar 53.37 48.62 51.59 73.57 76.44 74.69 81.46 85.64 83.06
5. Chhattisgarh - - - - - - - - -
6. Delhi -9.27 -1.47 -5.37 27.71 28.53 28.12 45.04 48.84 46.92
7. Goa -1.11 6.26 2.43 4.28 9.69 6.90 42.66 38.52 40.65
8. Gujarat 35.72 34.27 35.09 43.63 50.00 46.34 58.01 61.05 59.29
9. Haryana 5.04 4.54 4.81 19.86 29.61 24.51 28.01 37.72 32.48
10. Himachal Pradesh 5.78 9.82 7.74 13.48 18.36 15.89 -13.16 -0.47 -6.98
11. Jammu & Kashmir 40.92 31.80 36.92 39.72 37.02 38.57 54.63 52.53 53.75
12. Jharkhand - - - - - - - - -
13. Karnataka 16.25 15.49 15.88 49.81 50.21 49.99 59.71 58.99 59.38
14. Kerala -9.28 -5.54 -7.43 -15.93 -8.42 -12.24 10.64 3.52 7.15
15. Madhya Pradesh 11.12 9.13 10.21 43.09 45.07 43.95 60.48 70.31 64.70
16. Maharashtra 6.60 6.81 6.70 26.46 31.74 28.99 52.11 56.40 54.16
17. Manipur 29.71 32.74 31.18 34.47 30.91 32.80 46.04 39.58 43.02
18. Meghalaya 51.77 48.15 49.97 65.99 62.43 64.21 79.64 78.65 79.15
19. Mizoram 50.84 48.71 49.84 68.99 64.34 66.84 69.52 64.11 66.95
20. Nagaland 41.79 43.66 42.69 41.09 43.93 42.49 66.98 67.63 67.29
21. Orissa 42.60 35.17 39.34 65.56 56.64 61.95 66.40 61.46 64.42
22. Punjab 27.42 19.91 23.96 32.64 34.82 33.67 43.68 44.49 44.06
23. Rajasthan 58.92 52.90 56.59 60.85 71.33 65.34 69.33 80.72 73.87
24. Sikkim 52.01 46.80 49.44 72.48 70.02 71.22 83.34 81.15 82.30
25. Tamil Nadu 1.94 -0.14 0.94 24.62 23.24 23.96 57.27 52.71 55.19
26. Tripura 43.76 42.58 43.20 62.05 66.42 64.15 73.58 73.11 73.36
27. Uttar Pradesh 21.80 -3.78 12.06 43.71 39.18 41.94 40.49 48.99 43.77
28. Uttarakhand - - - - - - - - -
29. West Bengal 43.23 44.10 43.65 63.70 63.55 63.63 75.92 80.34 78.03
Union Territories
30. Andaman &
Nicobar Islands 4.03 3.36 3.72 8.98 12.03 10.44 38.55 35.30 36.97
31. Chandigarh 1.46 3.91 2.59 17.03 9.14 13.40 17.69 15.63 16.73
32. Dadra & Nagar Haveli 21.37 36.10 28.23 44.81 60.55 51.95 64.23 70.60 67.06
33. Daman & Diu 1.51 0.06 0.84 12.91 21.29 17.03 41.62 45.36 43.43
34. Lakshadweep 0.77 14.51 7.62 2.91 31.24 16.41 19.16 18.57 18.88
35. Pondicherry -2.20 -1.93 -2.07 -6.90 -7.98 -7.41 18.24 15.47 16.89
Source: India, Ministry of Human Resource Development, Department of Higher Education and Literacy, Department
of Higher Education. (2007). Annual Report 2006-07 (as on 30th September 2004). New Delhi. P.256.

Statistics on Women in India 2007
164
School dropout rate of Scheduled Castes (SC) students is given in Table 78.
Table 78: School Dropout Rates of Scheduled Castes (SC) Students
Classes I-X, (%), 2004-2005
S.No. India/States/UTs Dropout Rates(SC Students)
Classes I-V Classes I – VIII Classes I – X
Boys Girls Total Boys Girls Total Boys Girls Total
India 32.73 36.14 34.21 55.20 59.95 57.26 69.11 74.17 71.25
1. Andhra Pradesh 32.77 34.40 33.58 62.22 67.53 64.83 68.42 72.59 70.39
2. Arunachal Pradesh 17.50 26.67 20.00 34.29 45.00 38.18 17.86 15.38 17.07
3. Assam 55.85 49.86 53.15 70.15 70.49 70.30 72.65 68.98 71.01
4. Bihar 44.02 74.10 54.83 81.88 81.76 81.84 89.83 92.10 90.61
5. Chhattisgarh - - - - - - - - -
6. Delhi 4.67 5.28 4.95 0.00 0.00 0.00 70.36 67.72 69.15
7. Goa 53.68 58.66 56.10 62.50 69.25 65.72 79.69 77.69 78.71
8. Gujarat 23.3 25.6 24.4 39.23 56.59 47.34 57.88 70.72 63.90
9. Haryana 15.73 13.41 14.63 39.04 45.52 42.13 60.87 69.94 65.11
10. Himachal Pradesh 16.12 16.96 16.53 31.42 35.08 33.24 47.62 48.60 48.09
11. Jammu & Kashmir 33.30 16.60 26.25 25.24 21.31 23.56 60.67 59.84 60.29
12. Jharkhand - - - - - - - - -
13. Karnataka 24.22 14.90 19.95 42.82 51.93 47.32 64.46 65.70 65.04
14. Kerala 0.00 0.00 0.00 0.00 0.00 0.00 23.24 14.04 18.74
15. Madhya Pradesh 18.41 11.57 15.39 39.62 41.57 40.45 61.81 72.25 66.23
16. Maharashtra 6.66 8.71 7.65 25.44 34.38 29.76 54.71 58.21 56.38
17. Manipur 37.14 25.68 31.62 0.00 0.00 0.00 1.17 1.15 1.16
18. Meghalaya 52.04 46.25 49.41 63.38 61.32 62.37 76.08 74.85 75.48
19. Mizoram - - - - - - - - -
20. Nagaland - - - - - - - - -
21. Orissa 48.10 39.42 44.58 65.86 66.17 66.00 70.61 71.94 71.20
22. Punjab 32.05 25.87 29.20 53.67 51.12 52.46 65.32 66.10 65.69
23. Rajasthan 54.49 57.59 55.83 67.55 78.05 71.97 77.14 86.72 80.74
24. Sikkim 51.82 45.19 48.55 79.83 70.09 75.49 86.13 84.11 85.23
25. Tamil Nadu 15.77 10.10 13.66 28.37 25.42 26.98 62.66 61.76 62.23
26. Tripura 35.20 35.33 35.26 62.29 70.22 66.20 66.77 73.55 70.02
27. Uttar Pradesh 25.81 38.41 30.60 51.03 67.35 57.17 64.51 86.95 72.92
28. Uttarakhand - - - - - - - - -
29. West Bengal 51.77 58.33 54.93 70.22 75.31 72.55 79.72 81.07 80.25
Union Territories
30. Andaman &
Nicobar Islands - - - - - - - - -
31. Chandigarh 9.65 10.82 10.20 60.41 54.31 57.53 85.93 80.78 83.83
32. Dadra & Nagar Haveli 15.15 8.22 11.51 18.46 25.42 21.77 20.37 44.68 31.68
33. Daman & Diu 0.00 0.00 0.00 4.62 1.52 3.05 2.25 4.17 3.11
34. Lakshadweep - - - - - - - - -
35. Pondicherry 1.01 2.89 1.95 0.00 0.00 0.00 21.56 24.23 22.89
Source: India, Ministry of Human Resource Development, Department of Higher Education and Literacy, Department
of Higher Education. (2007). Annual Report 2006-07 (as on 30th September 2004). New Delhi. P.257.

Statistics on Women in India 2007
165
School dropout rate of Scheduled Tribes (ST) students is given in Table 79.
Table 79: School Dropout Rates of Scheduled Tribes (ST) Students
Classes I-X, (%), 2004-2005
S.No. India/State/UT Dropout Rates (ST Students)
Classes I-V Classes I – VIII Classes I – X
Boys Girls Total Boys Girls Total Boys Girls Total
India 42.55 42.04 42.32 64.97 67.09 65.87 77.75 80.66 78.97
1. Andhra Pradesh 51.27 56.94 54.04 76.57 81.46 78.81 81.16 85.11 82.87
2. Arunachal Pradesh 47.91 47.74 47.83 68.03 66.58 67.37 73.38 74.89 74.05
3. Assam 58.65 50.15 54.98 74.17 77.41 75.53 78.15 75.89 77.18
4. Bihar 59.16 62.99 60.82 76.27 76.10 76.20 88.02 90.29 88.96
5. Chhattisgarh - - - - - - - - -
6. Delhi 0.00 0.00 0.00 0.00 0.00 0.00 13.72 33.61 23.37
7. Goa 0.00 0.00 0.00 0.00 0.00 0.00 0.00 0.00 0.00
8. Gujarat 50.00 47.3 48.8 64.47 70.19 67.08 72.45 76.61 74.36
9. Haryana - - - - - - - - -
10. Himachal Pradesh 0.11 6.67 3.40 11.55 22.48 17.01 37.84 43.07 40.35
11. Jammu & Kashmir 0.00 0.00 0.00 0.00 0.00 0.00 66.00 79.49 71.79
12. Jharkhand - - - - - - - - -
13. Karnataka 9.42 6.36 7.97 44.39 51.28 47.56 62.38 64.09 63.17
14. Kerala 4.43 4.25 4.34 21.11 23.51 22.26 55.40 50.18 52.87
15. Madhya Pradesh 17.36 7.35 13.07 45.37 51.44 48.04 74.57 80.22 76.92
16. Maharashtra 28.24 36.98 32.35 54.86 62.43 58.42 73.57 83.64 78.26
17. Manipur 46.12 56.27 51.00 57.69 56.53 57.16 72.27 72.07 72.18
18. Meghalaya 54.17 47.36 50.80 70.68 68.40 69.55 82.00 82.87 82.43
19. ‘ Mizoram 50.77 48.68 49.79 68.39 63.85 66.28 69.21 63.80 66.64
20. Nagaland 39.71 37.71 38.78 44.78 40.81 42.93 68.66 68.86 68.75
21. Orissa 58.67 58.54 58.62 80.18 79.88 80.06 83.00 83.61 83.24
22. Punjab - - - - - - - - -
23. Rajasthan 53.72 59.51 56.22 66.27 73.74 69.14 70.24 83.80 75.30
24. Sikkim 30.51 18.27 24.47 52.14 36.05 44.49 73.02 61.74 67.72
25. Tamil Nadu 12.41 10.00 11.67 44.12 23.74 35.31 65.00 53.13 59.68
26. Tripura 57.27 60.59 58.84 79.83 83.11 81.40 85.09 87.06 85.99
27. Uttar Pradesh 27.13 16.29 22.70 23.14 23.50 23.29 50.42 57.41 53.32
28. Uttarakhand - - - - - - - - -
29. West Bengal 48.93 47.71 48.40 81.06 73.01 78.47 89.55 83.41 87.90
Union Territories
30. Andaman &
Nicobar Islands 7.34 7.94 7.62 24.76 20.67 22.87 55.92 47.09 51.85
31. Chandigarh - - - - - - - - -
32. Dadra & Nagar Haveli 25.35 42.31 33.34 50.82 69.10 59.01 70.10 79.13 74.11
33. Daman & Diu 1.69 0.80 1.28 38.20 38.42 38.30 76.51 81.34 78.94
34. Lakshadweep 1.03 8.24 4.50 0.00 0.00 0.00 19.05 19.08 19.07
35. Pondicherry - - - - - - - - -
Note: ST: Scheduled Tribes
Dropout rates are shown combined with the respective parent State.
Source: India, Ministry of Human Resource Development, Department of Higher Education and Literacy, Department of Higher
Education. (2007). Annual Report 2006-07 (as on 30th September 2004). New Delhi. P.258.

Statistics on Women in India 2007
166
Reasons given for children never attending school or currently not attending school
are given in Table 80.
Table 80: Reasons for Children Not Attending School in India, 1999
S. Reason Rural Urban Combined
No. Female Male Female Male Female Male
1 2 3 4 5 6 7
A Main reason for never attending schoola
1. School too far away 4.5 3.8 2.8 1.3 4.3 3.5
2. Transport not available 0.7 0.6 0.6 0.2 0.7 0.6
3. Education not considered necessary 13.1 7.8 12.9 6.1 13.1 7.6
4. Required for household work 15.5 6.7 9.6 4.6 14.9 6.4
5. Required for work on farm/family business 3.4 5.2 1.2 2.8 3.2 4.9
6. Required for outside work for payment in cash or kind 2.6 4.3 2.9 4.6 2.6 4.4
7. Costs too much 23.8 25.8 30.1 28.5 24.5 26.2
8. No proper school facilities for girls 2.6 0.0 1.1 0.0 2.5 0.0
9. Required for care of siblings 3.0 0.9 1.7 0.6 2.9 0.9
10. Not interest in studies 15.9 25.7 15.7 26.5 15.8 25.8
11. Other 12.8 17.0 18.6 21.9 13.4 17.6
12. Don’t Know 2.1 2.0 2.8 3.0 2.2 2.2
13. Total percent 100.0 100.0 100.0 100.0 100.0 100.0
14. Number of children in the sample 12614 7081 1438 1107 14052 8188
B Main reason for currently not attending school b
1. School too far away 5.9 1.0 1.0 0.2 4.8 0.8
2. Transport not available 1.6 0.4 0.2 0.1 1.3 0.3
3. Further education not considered necessary 4.3 2.3 5.4 2.4 4.5 2.4
4. Required for household work 17.3 8.7 14.7 5.7 16.7 8.0
5. Required for work on farm/family business 2.9 9.2 1.6 4.7 2.6 8.0
6. Required for outside work for payment in cash or kind 3.7 9.9 3.0 11.3 3.5 10.3
7. Costs too much 11.4 13.3 17.0 15.2 12.6 13.8
8. No proper school facilities for girls 3.5 0.0 1.2 0.0 3.0 0.0
9. Required for care of siblings 2.3 0.6 1.5 0.2 2.2 0.5
10. Not interested in studies 24.8 40.0 30.2 42.5 26.0 40.6
11. Repeated failures 3.7 5.3 6.1 6.0 4.2 5.5
12. Got married 8.5 0.2 4.9 0.1 7.7 0.2
13. Other 6.2 5.3 8.2 5.8 6.6 5.5
14. Don’t know 4.0 3.8 5.1 5.7 4.2 4.2
15. Total percent 100.0 100.0 100.0 100.0 100.0 100.0
Number of children in the sample 6121 5475 1747 1852 7868 7327
Notes: National Family Health Survey-II, 1998-99
Figures give the percent distribution of children age 6-17 years who never attended school by the
main reason for never attending school and percent distribution of children age 6-17 years who
have dropped out of school by the main reason for not currently attending school, according to
residence and sex, India, 1998-99.
a. For children who have never attended school.
b. For children who have dropped out of school.
Source: India, Ministry of Statistics and Programme Implemention, Central Statistical Organisation. (2003).
Women and Men in India 2002. New Delhi. P. 90.

Statistics on Women in India 2007
167
The foundation for human development is laid in early childhood, hence it is essential
that children attend play school where opportunities are provided for their physical, mental,
social and emotional development, adopting play way method for joyful learning. The number
of children attending preschool is given in Table 81.
Table 81: Preschool Education Gender-wise, 2004-05
S. India/State/ UT Pre-Primary Education Class I
No.
Boys Girls Total Boys Girls Total
India 2494441 2267044 4761485 17768996 15381041 33150037
1. Andhra Pradesh 166413 133889 300302 800716 769705 1570421
2. Arunachal Pradesh 19058 14408 33466 28756 24621 53377
3. Assam 323299 316272 639571 415089 400912 816001
4. Bihar 106 94 200 1959462 1394652 3354114
5. Chhattisgarh 29513 24043 53556 422758 396260 819018
6. Delhi 34212 34043 68255 158141 154445 312586
7. Goa 0 0 0 12394 11398 23792
8. Gujarat 62802 41868 104670 996810 584956 1581766
9. Haryana 54979 46607 101586 229178 196022 425200
10. Himachal Pradesh 9529 6370 15899 71919 65344 137263
11. Jammu & Kashmir 56479 46819 103298 124932 114888 239820
12. Jharkhand 572 304 876 609592 525338 1134930
13. Karnataka 0 0 0 572994 528801 1101795
14. Kerala 0 0 0 242849 236260 479109
15. Madhya Pradesh 0 0 0 1375778 1230467 2606245
16. Maharashtra 1270011 1180764 2450775 1295369 1188895 2484264
17. Manipur 58390 54220 112610 49896 47813 97709
18. Meghalaya 86338 91327 177665 79913 79400 159313
19. Mizoram 0 0 0 19808 17734 37542
20. Nagaland 55155 52516 107631 29406 26648 56054
21. Orissa 0 0 0 646445 606470 1252915
22. Punjab 19968 14637 34605 217166 193213 410379
23. Rajasthan 54643 37056 91699 1470337 1269185 2739522
24. Sikkim 13755 12176 25931 11388 10590 21978
25. Tamil Nadu 0 0 0 641626 593099 1234725
26. Tripura 121309 115920 237229 62959 55992 118951
27. Uttar Pradesh 29023 17517 46540 3742028 3249029 6991057
28. Uttarakhand 0 0 0 156112 145509 301621
29. West Bengal 0 0 0 1296527 1237358 2533885
Union Territories
30. Andaman & Nicobar 3393 3160 6553 4210 3940 8150
Islands
31. Chandigarh 6181 4891 11072 6723 5549 12272
32. Dadra & Nagar Haveli 0 0 0 4274 4034 8308
33. Daman & Diu 1214 928 2142 1797 1476 3273
34. Lakshadweep 569 659 1228 701 677 1378
35. Pondicherry 17570 16556 34126 10943 10361 21304
Source: India, Ministry of Human Resource Development, Department of Secondary and Higher Education,
Planning, Monitoring and Statistics Division. (2006). Selected Educational Statistics 2004-05 (as
on 30 September 2004). New Delhi. P.29.
Statistics on Women in India 2007
168
8. Women and Economy
With the advent of industrialization and modernization, women have assumed greater
responsibility, both at home and in the world of work. This is reflected in the work participation
rate of women which was 19.7% in 1981 and rose to 25.7% in 2001. However, this is still
low compared to male work participation rate, which was 52.6% in 1981 and 51.9 % in
2001.
The number of women in the organised sector was 4.95 million on 31st March 2001, of
whom 2.86 million were in the public sector and 2.09 million were in the private sector. The
number rose to 5.0162 million on 31.03.2005, and of these women, 2.921 million were in
the public sector and 2.0952 million were in the private sector.
Support Measures for Working Women
The Government of India has undertaken several initiatives to provide support to working
women. Some of these initiatives are:
1. Rajiv Gandhi National Creche Scheme for the Children of Working Mothers
2. Working Women’s Hostels with Day Care Centres
3. Swawlamban, erstwhile Setting up of Employment and Income Generating Training -
cum -Production Units for Women (NORAD) transferred to the States with effect from
01.04.2006
4. Support to Training and Employment Programme for Women (STEP)
6. Swayamsidha
Legislation for Working Women
Several legislations have been enacted since Independence for the welfare of workers
and women workers. These are:
1. The Equal Remuneration Act, 1976
2. The Minimum Wages Act, 1948
3. The Mines Act, 1952
4. The Factories Act, 1948 (Amended in 1949, 1950 and 1954)
5. The Contract Labour Act 1976 (Regulation and Abolition)
6. The Employees State Insurance Act, 1948 (with rules uptil 1984)
7. The Maternity Benefit Act, 1961 (Amended in 1995)
8. Supreme Court Order regarding Sexual Harassment of Women at Work Place and
Other Institutions, 1999

Statistics on Women in India 2007
169
The percentage work participation rate of males and females by rural urban residence
is given in Table 82.
Table 82: Workforce Participation Rate by Sex and Residence in India,
States and Union Territories, (Percentage), 2001
S. India/State/Union Work Participation Rate (Provisional)
No. Territory
Rural Urban Combined
Female Male Total Female Male Total Female Male Total
India 30.98 52.36 41.97 11.55 50.85 32.23 25.68 51.93 39.26
1. Andhra Pradesh 43.28 58.30 50.85 13.17 50.76 32.30 35.11 56.23 45.79
2. Arunachal Pradesh 41.33 50.66 46.20 17.15 50.53 35.50 36.54 50.63 43.98
3. Assam 22.15 49.41 36.17 10.61 52.90 33.20 20.71 49.87 35.78
4. Bihar 20.18 48.05 34.65 7.04 41.69 25.59 18.84 47.37 33.70
5. Chhattisgarh 46.54 54.12 50.32 13.19 47.18 31.11 40.04 52.81 46.46
6. Delhi 10.18 49.42 31.87 9.31 52.25 32.89 9.37 52.06 32.82
7. Goa 26.39 54.51 40.53 18.17 54.68 37.04 22.36 54.60 38.80
8. Gujarat 38.54 55.46 47.24 9.41 53.91 33.08 27.22 54.87 41.95
9. Haryana 33.91 50.73 42.93 10.55 49.23 31.49 27.22 50.30 39.62
10. Himachal Pradesh 46.42 54.67 50.57 15.23 54.22 36.96 43.67 54.62 49.24
11. Jammu & Kashmir 26.20 49.49 38.35 10.39 51.43 32.95 22.45 49.99 37.01
12. Jharkhand 31.81 49.65 40.90 6.52 42.36 25.68 26.41 47.96 37.52
13. Karnataka 39.87 58.10 49.09 16.37 53.85 35.67 31.98 56.64 44.53
14. Kerala 15.90 50.06 32.54 13.64 50.61 31.61 15.38 50.20 32.30
15. Madhya Pradesh 40.72 53.00 47.09 11.98 47.41 30.65 32.31 51.51 42.74
16. Maharashtra 43.61 53.93 48.88 12.57 52.43 33.85 30.81 53.28 42.50
17. Manipur 41.53 49.25 45.45 32.25 44.94 38.57 39.02 48.12 43.62
18. Meghalaya 38.62 49.43 44.11 20.98 43.82 32.51 35.15 48.34 41.84
19. Mizoram 54.55 59.66 57.21 40.52 54.84 47.87 47.54 57.29 52.57
20. Nagaland 42.48 47.32 45.01 15.61 43.81 31.03 38.06 46.70 42.60
21. Orissa 27.12 53.17 40.23 10.02 49.06 30.62 24.66 52.53 38.79
22. Punjab 23.37 53.88 39.51 10.44 53.06 33.49 19.05 53.60 37.47
23. Rajasthan 40.63 50.74 45.87 9.55 47.42 29.59 33.49 49.95 42.06
24. Sikkim 40.60 57.69 49.69 21.67 55.51 40.16 38.57 57.44 48.64
25. Tamil Nadu 41.40 59.10 50.28 18.94 55.80 37.54 31.54 57.64 44.67
26. Tripura 22.87 50.42 37.03 12.45 51.64 32.45 21.08 50.62 36.25
27. Uttar Pradesh 19.05 47.39 33.93 6.80 44.61 26.95 16.54 46.80 32.48
28. Uttarakhand 33.55 45.69 39.60 7.59 47.36 29.15 27.33 46.14 36.92
29. West Bengal 20.86 54.09 37.90 11.57 53.74 33.85 18.32 53.99 36.77
Union Territories
30. Andaman & 18.50 57.05 39.20 12.09 56.09 36.33 16.45 56.73 38.27
Nicobar Islands
31. Chandigarh 11.08 63.88 43.64 14.54 55.12 37.13 14.22 56.11 37.80
32. Dadra and Nagar Haveli 45.10 61.26 53.84 14.54 65.63 44.75 38.74 62.33 51.76
33. Daman & Diu 20.03 70.78 52.03 16.74 53.80 35.42 18.61 65.47 46.01
34. Lakshadweep 6.20 40.63 23.77 8.65 44.62 27.24 7.28 42.41 25.32
35. Pondicherry 23.93 54.36 39.22 13.89 52.49 33.13 17.23 53.12 35.17
Notes: The figures for India and Gujarat exclude the data for the entire Kachchh district, Morvi, Maliya-
Miyana and Wankaner talukas of Rajkot district and Jodiya taluka of Jamnagar district where
population enumeration of Census of India, 2001 could not be conducted due to earthquake
Source: India, Ministry of Statistics and Programme Implementation, Central Statistical Organisation. (2007).
Women and Men in India 2006. New Delhi. P. 44.

Statistics on Women in India 2007
170
The work participation rate of males and females in rural and urban areas in given in
Figure 3.
Figure 3: Workforce Participation Rate in India, (%), 2001

Statistics on Women in India 2007
171
The total population of main and marginal workers by sectors, and non workers is
given in Table 83.
Table 83: Total Workers, Main and Marginal Workers, (Cultivators,
Agricultural Labourers, Household Industry Workers, Other
Workers), Non-Workers by Residence and Sex, India, 2001
Total Workers(1) Main Workers(2) Marginal Workers(3)
Total/R/U Person Male Female Person Male Female Person Male Female
India Total 402234724 275014476 127220248 313004983 240147813 72857170 89229741 34866663 54363078
Rural 309956070 198839153 111116917 229186552 169101251 60085301 80769518 29737902 51031616
Urban 92278654 76175323 16103331 83818431 71046562 12771869 8460223 5128761 3331462
Cultivators
Total 103626068 78258978 25367090 23686783 7157520 16529263
Rural 101345252 76435797 24909455 23374495 7040054 16334441
Urban 2280816 1823181 457635 312288 117466 194822
Agricultural Labourers
Total 63497114 41119069 22378045 43278216 16210031 27068185
Rural 60517788 39130317 21387471 41913430 15575894 26337536
Urban 2979326 1988752 990574 1364786 634137 730649
Household Industry Workers
Total 12206084 7509013 4697071 4750858 1235170 3515688
Rural 8330814 5036347 3294467 3811866 954879 2856987
Urban 3875270 2472666 1402604 938992 280291 658701
Other Workers
Total 133675717 113260753 20414964 17513884 10263942 7249942
Rural 58992698 48498790 10493908 11669727 6167075 5502652
Urban 74683019 64761963 9921056 5844157 4096867 1747290
Total/R/U Non Workers(4)
Total 626375604 257142296 369233308
Rural 432534569 182763521 249771048
Urban 193841035 74378775 119462260
Source: India, Registrar General and Census Commissioner. (2004).
Census of India 2001: Primary Census Abstract: Total Population. New Delhi. P.1.

Statistics on Women in India 2007
172
The number of workers in the organized and unorganized sectors by industrial category
is given in Table 84.
Table 84: Women in Public and Private Sectors by Industrial Activity, 2004
S.No. Industrial Activity Women’s Employment
(in thousands ’000)
Public Sector Private Sector
1. Agricultural Forestry, Fishing 47.7 411.0
and Hunting
2. Mining and quarrying 66.0 7.3
3. Manufacturing 81.5 867.9
4. Electricity, gas and water 49.7 2.4
5. Construction 62.6 3.4
6. Wholesale and Retail Trade, hotels 14.0 32.0
and restaurants
7. Transport, storage and 179.0 10.4
communication
8. Financing, Insurance, Real Estate 206.0 81.2
and Business services
9. Community, social and personal 2183.6 628.8
services
All Sectors (Total) 2890.0 2044.4
Source: India, Ministry of Statistics and Programme Implementation, Central Statistical Organisation. (2007).
Women and Men in India 2006. New Delhi. P. 47.

Statistics on Women in India 2007
173
The percentage work participation rate of main and marginal workers, and non workers
by sex in different states and union territories is given in Table 85.
Table 85: Work Participation Rate, Main and Marginal Workers by Sex
(Percentage), 1991 and 2001
S. India/States/ Main Workers Marginal Workers Non-Workers
No. UnionTerritories
1991 2001 1991 2001 1991 2001
F M F M F M F M F M F M
India 15.9 50.9 14.68 45.5 6.3 0.6 10.99 6.59 77.7 48.4 74.32 48.07
1. Andhra Pradesh 30.0 55.1 25.21 50.71 0.4 0.3 9.72 5.74 65.7 44.5 65.07 43.56
2. Arunachal Pradesh 35.6 53.5 28.33 46.9 1.9 0.2 8.13 4.60 62.5 46.2 63.55 49.31
3. Assam 12.6 48.4 9.68 42.35 0.9 1.1 11.12 7.58 78.4 50.6 79.20 50.07
4. Bihar 10.0 47.6 8.76 40.72 4.9 0.3 10.07 7.01 85.1 52.1 81.16 52.27
5. Chhattisgarh - - 22.28 45.44 - - 17.15 7.54 - - 59.06 47.03
6. Delhi 7.2 51.6 8.19 50.06 0.2 0.1 0.96 2.15 92.6 48.3 90.85 47.79
7. Goa 16.8 48.3 14.79 47.89 3.8 1.3 7.46 6.97 79.5 50.4 77.76 45.14
8. Gujarat 13.7 53.2 14.53 51.25 12.2 0.4 13.50 3.77 74.0 46.4 71.97 44.98
9. Haryana 6.0 48.3 13.37 43.62 4.7 0.3 13.94 6.86 89.2 51.5 72.69 49.57
10. Himachal Pradesh 19.4 49.1 21.08 43.30 15.5 1.6 22.61 11.40 65.2 49.4 56.31 45.30
11. Jammu & Kashmir - - 7.28 41.30 - - 14.68 8.53 - - 78.04 50.17
12. Jharkand - - 10.00 37.22 - - 16.41 11.00 - - 73.60 51.79
13. Karnataka 22.7 53.5 20.92 51.92 6.7 0.6 10.96 4.95 70.6 45.9 68.12 43.13
14. Kerala 12.8 44.8 10.74 41.89 3.0 2.8 4.54 8.48 84.2 52.4 84.72 49.64
15. Madhya Pradesh 22.8 51.5 17.31 44.87 9.9 0.8 15.79 6.76 67.3 47.7 66.90 48.38
16. Maharashtra 26.5 51.2 24.10 48.65 6.6 0.9 8.49 4.85 66.9 47.8 67.41 46.51
17. Manipur 32.7 44.2 23.22 39.83 6.3 1.1 17.29 9.08 61.0 54.7 59.49 51.09
18. Meghalaya 30.7 49.5 23.80 40.40 4.3 0.5 11.22 7.36 65.1 49.9 64.98 52.24
19. Mizoram 34.0 49.6 31.82 49.29 9.6 4.3 15.82 8.16 56.5 46.1 52.37 42.55
20. Nagaland 37.3 46.7 30.01 40.73 4.8 0.6 8.24 6.10 62.5 62.0 61.75 53.18
21. Orissa 12.1 52.9 8.60 43.07 8.7 0.9 16.02 9.68 69.1 79.2 75.38 47.25
22. Punjab 2.8 54.1 11.92 49.97 1.6 0.1 6.76 4.13 95.6 45.8 81.32 45.90
23. Rajasthan 13.0 48.5 16.83 43.81 14.4 0.8 16.66 6.26 72.6 50.7 66.52 49.93
24. Sikkim 28.6 50.8 26.09 50.89 1.8 0.4 12.51 6.69 69.6 48.7 61.41 42.42
25. Tamil Nadu 25.1 56.1 23.79 52.28 4.8 0.3 7.52 5.78 68.9 70.1 68.68 41.94
26. Tripura 10.1 47.0 10.70 45.24 3.6 0.6 10.32 5.57 86.2 52.5 78.98 49.19
27. Uttarakhand - - 16.24 38.13 - - 10.85 8.29 - - 72.91 53.58
28. Uttar Pradesh 7.5 49.3 6.10 39.58 4.9 0.4 10.18 7.68 87.7 50.3 83.72 52.74
29. West Bengal 8.0 50.7 8.86 47.32 3.3 0.7 9.22 6.91 88.8 48.6 81.92 45.77
Union Territories
30. Andaman & Nicobar 8.0 52.3 9.85 50.70 5.1 1.1 6.60 6.03 86.9 46.7 83.55 43.27
Islands
31. Chandigarh 10.3 54.2 12.87 54.77 0.1 0.1 0.85 1.33 89.6 45.7 86.28 43.90
32. Dadra & Nagar 31.3 55.9 25.30 58.62 17.5 1.6 13.38 3.77 51.2 42.5 61.32 37.62
Haveli
33. Daman & Diu 12.0 50.7 13.07 63.84 10.1 1.0 5.27 1.72 76.8 48.4 81.66 34.44
34. Lakshadweep 5.9 41.0 4.77 33.20 1.7 3.1 2.42 9.31 92.4 55.8 92.81 57.49
35. Pondicherry 14.3 50.1 14.57 50.52 0.9 0.4 2.43 2.76 84.8 49.4 83.0 46.72
Source: India, Ministry of Human Resource Development, Department of Women and Child Development. (2004).
Government of India, II & IIIrd Periodic Report on the Convention on the Elimination of All Forms of
Discrimination against Women : CEDAW Periodic Report. New Delhi. P. 102.

Statistics on Women in India 2007
174
The total workforce population, main workers and marginal workers by residence
and sex are given in Table 86.
Table 86: Total Workforce Population, Main and Marginal Workers, by
Residence and Sex, India and States/ Union Territories, 2001
S. India/State/ Total Workforce Population Main Worker Marginal Worker
No. Union Territory Total/R/U Person Male Female Person Male Female Person Male Female
1 2 3 4 5 6 7 8 9 10 11 12
India Total 402234724 275014476 127220248 313004983 240147813 72857170 89229741 34866663 54363078
Rural 309956070 198839153 111116917 229186552 169101251 60085301 80769518 29737902 51031616
Urban 92278654 76175323 16103331 83818431 71046562 12771869 8460223 5128761 3331462
1 Andhra Pradesh Total 34893859 21662192 13231667 29040873 19455492 9585381 5852986 2206700 3646286
Rural 28172888 16287101 11885787 22977594 14467183 8510411 5195294 1819918 3375376
Urban 6720971 5375091 1345880 6063279 4988309 1074970 657692 386782 270910
2 Arunachal Pradesh Total 482902 293612 189290 415007 267384 147623 67895 26228 41667
Rural 402010 230320 171690 340027 207110 132917 61983 23210 38773
Urban 80892 63292 17600 74980 60274 14706 5912 3018 2894
3 Assam Total 9538591 6870960 2667631 7114097 5849032 1265065 2424494 1021928 1402566
Rural 8396769 5899204 2497565 6050639 4926395 1124244 2346130 972809 1373321
Urban 1141822 971756 170066 1063458 922637 140821 78364 49119 29245
4 Bihar Total 27974606 20483003 7491603 21052875 17511018 3541857 6921731 2971985 3949746
Rural 25752569 18544822 7207747 19112829 15760425 3352404 6639740 2784397 3855343
Urban 2222037 1938181 283856 1940046 1750593 189453 281991 187588 94403
5 Chhattisgarh Total 9679871 5531859 4148012 7054595 4742935 2311660 2625276 788924 1836352
Rural 8377674 4495979 3881695 5883797 3777194 2106603 2493877 718785 1775092
Urban 1302197 1035880 266317 1170798 965741 205057 131399 70139 61260
6 Delhi Total 4545234 3960101 585133 4317516 3794345 523171 227718 165756 61962
Rural 301064 258032 43032 273677 240572 33105 27387 17460 9927
Urban 4244170 3702069 542101 4043839 3553773 490066 200331 148296 52035
7 Goa Total 522855 375218 147637 425305 326993 98312 97550 48225 49325
Rural 274452 185648 88804 204915 154069 50846 69537 31579 37958
Urban 248403 189570 58833 220390 172924 47466 28013 16646 11367
8 Gujarat Total 21255521 14477286 6778235 17025074 13480566 3544508 4230447 996720 3233727
Rural 14993312 9049438 5943874 11114041 8210091 2903950 3879271 839347 3039924
Urban 6262209 5427848 834361 5911033 5270475 640558 351176 157373 193803
9 Haryana Total 8377466 5715526 2661940 6241324 4933004 1308320 2136142 782522 1353620
Rural 6451587 4085621 2365966 4519240 3425749 1093491 1932347 659872 1272475
Urban 1925879 1629905 295974 1722084 1507255 214829 203795 122650 81145
10 Himachal Pradesh Total 2992461 1686658 1305803 1963882 1333361 630521 1028579 353297 675282
Rural 2772351 1506711 1265640 1758872 1162619 596253 1013479 344092 669387
Urban 220110 179947 40163 205010 170742 34268 15100 9205 5895

Statistics on Women in India 2007
175
S. India/State/ Total Workforce Population Main Worker Marginal Worker
No. Union Territory Total/R/U Person Male Female Person Male Female Person Male Female
1 2 3 4 5 6 7 8 9 10 11 12
11 Jammu & Kashmir Total 3753815 2679941 1073874 2608668 2226958 381710 1145147 452983 692164
Rural 2924686 1968549 956137 1862629 1559977 302652 1062057 408572 653485
Urban 829129 711392 117737 746039 666981 79058 83090 44411 38679
12 Jharkhand Total 10109030 6659856 3449174 6446782 5134067 1312715 3662248 1525789 2136459
Rural 8569591 5302143 3267448 5105341 3921518 1183823 3464250 1380625 2083625
Urban 1539439 1357713 181726 1341441 1212549 128892 197998 145164 52834
13 Karnataka Total 23534791 15235355 8299436 19364759 13896845 5467914 4170032 1338510 2831522
Rural 17127803 10254252 6873551 13462535 9194812 4267723 3665268 1059440 2605828
Urban 6406988 4981103 1425885 5902224 4702033 1200191 504764 279070 225694
14 Kerala Total 10283887 7765645 2518242 8236973 6460693 1776280 2046914 1304952 741962
Rural 7671110 5732387 1938723 5998150 4677067 1321083 1672960 1055320 617640
Urban 2612777 2033258 579519 2238823 1783626 455197 373954 249632 124322
15 Madhya Pradesh Total 25793519 16194368 9599151 19102572 14056279 5046293 6690947 2138089 4552858
Rural 20900226 12205916 8694310 14776619 10387506 4389113 6123607 1818410 4305197
Urban 4893293 3988452 904841 4325953 3668773 657180 567340 319679 247661
16 Maharashtra Total 41173351 26852095 14321256 34748053 24416295 10331758 6425298 2435800 3989498
Rural 27261431 15348636 11912795 21853804 13528493 8325311 5407627 1820143 3587484
Urban 13911920 11503459 2408461 12894249 10887802 2006447 1017671 615657 402014
17 Manipur Total 945213 527216 417997 659364 430227 229137 285849 96989 188860
Rural 723087 398374 324713 494747 320432 174315 228340 77942 150398
Urban 222126 128842 93284 164617 109795 54822 57509 19047 38462
18 Meghalaya Total 970146 568491 401655 757011 485694 271317 213135 82797 130338
Rural 822531 468095 354436 626538 393364 233174 195993 74731 121262
Urban 147615 100396 47219 130473 92330 38143 17142 8066 9076
19 Mizoram Total 467159 263008 204151 362450 225428 137022 104709 37580 67129
Rural 256044 138855 117189 201599 120662 80937 54445 18193 36252
Urban 211115 124153 86962 160851 104766 56085 50264 19387 30877
20 Nagaland Total 847796 488968 358828 703977 424811 279166 143819 64157 79662
Rural 741439 406859 334580 608335 348972 259363 133104 57887 75217
Urban 106357 82109 24248 95642 75839 19803 10715 6270 4445
21 Orissa Total 14276488 9802006 4474482 9589269 8004740 1584529 4687219 1797266 2889953
Rural 12586969 8373695 4213274 8071999 6677417 1394582 4514970 1696278 2818692
Urban 1689519 1428311 261208 1517270 1327323 189947 172249 100988 71261
22 Punjab Total 9127474 6960213 2167261 7835732 6426028 1409704 1291742 534185 757557
Rural 6360351 4589049 1771302 5248225 4161003 1087222 1112126 428046 684080
Urban 2767123 2371164 395959 2587507 2265025 322482 179616 106139 73477
23 Rajasthan Total 23766655 14695802 9070853 17436888 12841318 4595570 6329767 1854484 4475283
Rural 19856423 11379536 8476887 13962042 9771540 4190502 5894381 1607996 4286385
Urban 3910232 3316266 593966 3474846 3069778 405068 435386 246488 188898
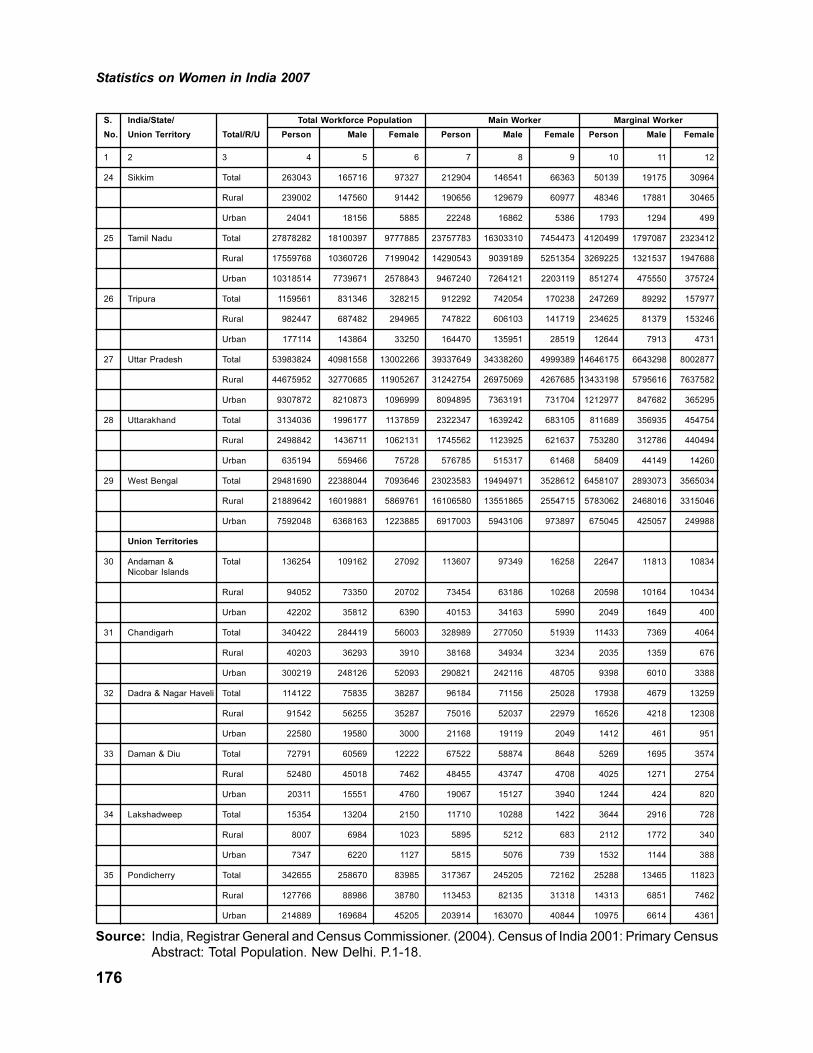
Statistics on Women in India 2007
176
S. India/State/ Total Workforce Population Main Worker Marginal Worker
No. Union Territory Total/R/U Person Male Female Person Male Female Person Male Female
1 2 3 4 5 6 7 8 9 10 11 12
24 Sikkim Total 263043 165716 97327 212904 146541 66363 50139 19175 30964
Rural 239002 147560 91442 190656 129679 60977 48346 17881 30465
Urban 24041 18156 5885 22248 16862 5386 1793 1294 499
25 Tamil Nadu Total 27878282 18100397 9777885 23757783 16303310 7454473 4120499 1797087 2323412
Rural 17559768 10360726 7199042 14290543 9039189 5251354 3269225 1321537 1947688
Urban 10318514 7739671 2578843 9467240 7264121 2203119 851274 475550 375724
26 Tripura Total 1159561 831346 328215 912292 742054 170238 247269 89292 157977
Rural 982447 687482 294965 747822 606103 141719 234625 81379 153246
Urban 177114 143864 33250 164470 135951 28519 12644 7913 4731
27 Uttar Pradesh Total 53983824 40981558 13002266 39337649 34338260 4999389 14646175 6643298 8002877
Rural 44675952 32770685 11905267 31242754 26975069 4267685 13433198 5795616 7637582
Urban 9307872 8210873 1096999 8094895 7363191 731704 1212977 847682 365295
28 Uttarakhand Total 3134036 1996177 1137859 2322347 1639242 683105 811689 356935 454754
Rural 2498842 1436711 1062131 1745562 1123925 621637 753280 312786 440494
Urban 635194 559466 75728 576785 515317 61468 58409 44149 14260
29 West Bengal Total 29481690 22388044 7093646 23023583 19494971 3528612 6458107 2893073 3565034
Rural 21889642 16019881 5869761 16106580 13551865 2554715 5783062 2468016 3315046
Urban 7592048 6368163 1223885 6917003 5943106 973897 675045 425057 249988
Union Territories
30 Andaman & Total 136254 109162 27092 113607 97349 16258 22647 11813 10834
Nicobar Islands
Rural 94052 73350 20702 73454 63186 10268 20598 10164 10434
Urban 42202 35812 6390 40153 34163 5990 2049 1649 400
31 Chandigarh Total 340422 284419 56003 328989 277050 51939 11433 7369 4064
Rural 40203 36293 3910 38168 34934 3234 2035 1359 676
Urban 300219 248126 52093 290821 242116 48705 9398 6010 3388
32 Dadra & Nagar Haveli Total 114122 75835 38287 96184 71156 25028 17938 4679 13259
Rural 91542 56255 35287 75016 52037 22979 16526 4218 12308
Urban 22580 19580 3000 21168 19119 2049 1412 461 951
33 Daman & Diu Total 72791 60569 12222 67522 58874 8648 5269 1695 3574
Rural 52480 45018 7462 48455 43747 4708 4025 1271 2754
Urban 20311 15551 4760 19067 15127 3940 1244 424 820
34 Lakshadweep Total 15354 13204 2150 11710 10288 1422 3644 2916 728
Rural 8007 6984 1023 5895 5212 683 2112 1772 340
Urban 7347 6220 1127 5815 5076 739 1532 1144 388
35 Pondicherry Total 342655 258670 83985 317367 245205 72162 25288 13465 11823
Rural 127766 88986 38780 113453 82135 31318 14313 6851 7462
Urban 214889 169684 45205 203914 163070 40844 10975 6614 4361
Source: India, Registrar General and Census Commissioner. (2004). Census of India 2001: Primary Census
Abstract: Total Population. New Delhi. P.1-18.

Statistics on Women in India 2007
177
The number of child labour, women labour and labour in various age groups are
given in Table 87.
Table 87: Child Labour, Women Labour, and Labour, 2001
S.No. India/State/UT T/R/U Age Group Main Workers Marginal Workers
years
Persons Males Females Persons Males Females
1. India T All Ages 313004983 240147813 72857170 89229741 34866663 54363078
R 229186552 169101251 60085301 80769518 29737902 51031616
U 83818431 710465562 12771869 8460223 5128761 3331462
T 5-9 820050 507111 312939 1029630 494752 534878
R 657033 398578 258455 965993 460134 505859
U 163017 108533 54484 63637 34618 29019
T 10-14 4958941 3089793 1869148 5857756 2712680 3145076
R 4165427 2527984 1637443 5556500 2537732 3018768
U 793514 561809 231705 301256 174948 126308
T 15-19 20642416 15167982 5474434 11747146 5821580 5925566
R 16392967 11659849 4733118 10771622 5159377 5612245
U 4249449 3508133 741316 975524 662203 313321
T 20-24 35442698 27114855 8327843 12768725 5628239 7140486
R 26259445 19222059 7037386 11436946 4706929 6730017
U 9183253 7892796 1290457 1331779 921310 410469
T 25-29 42269247 32331772 9937475 11901409 4521629 7379780
R 30373031 22167517 8205514 10648178 3723465 6924713
U 11896216 10164255 1731961 1253231 798164 455067
T 30-34 42049980 32059675 9990305 10263309 3429216 6834093
R 29983262 21809064 8174198 9206685 2818928 6387757
U 12066718 10250611 1816107 1056624 610288 446336
T 35-39 42090591 31941636 10148955 9259328 2978344 6280984
R 29941956 21779628 8162318 8266051 2445234 5820817
U 12148635 10161998 1986637 993277 533110 460167
T 40-49 63426352 49119357 14306995 12595381 3994391 8600990
R 44701364 33209787 11491577 11317814 3296993 8020821
U 18724988 15909570 2815418 1277567 697398 580169
T 50-59 36037600 28371884 7665716 7336595 2393671 4942924
R 26151686 19884152 6267534 6687078 2034984 4652094
U 9885914 8487732 1398182 649517 358687 290830
T 60-69 17850055 14188148 3661907 4611342 1890643 2720699
R 14585117 11423942 3161175 4229837 1668309 2561528

Statistics on Women in India 2007
178
S.No. India/State/UT T/R/U Age Group Main Workers Marginal Workers
years
Persons Males Females Persons Males Females
U 3264938 2764206 500732 381505 222334 159171
T 70-79 5374296 4585141 789155 1340257 734948 605309
R 4423666 3759385 664281 1221795 656214 565581
U 950630 825756 124874 118462 78734 39728
T 80+ 1380978 1173222 207756 329225 183817 145408
R 1102307 934279 168028 296611 162316 134295
U 278671 238943 39728 32614 21501 11113
2. Andhra Pradesh T All Ages 29040873 19455492 9585381 5852986 2206700 3646286
R 22977594 14467183 8510411 5195294 1819918 3375376
U 6063279 4988309 1074970 657692 386782 270910
T 5-9 104150 55067 49083 53009 22820 30189
R 85061 43099 41962 46809 19596 27213
U 19089 11968 7121 6200 3224 2976
T 10-14 839326 419978 419348 366854 140018 226836
R 754542 363628 390914 342015 126359 215656
U 84784 56350 28434 24839 13659 11180
T 15-19 2432386 1509643 922743 738746 323931 414815
R 2106388 1257874 848514 667607 279520 388087
U 325998 251769 74229 71139 44411 26728
T 20-24 3388039 2209185 1178854 779090 313192 465898
R 2759273 1695955 1063318 685105 252228 432877
U 628766 513230 115536 93985 60964 33021
T 25-29 4069286 2655307 1413979 806503 283141 523362
R 3178868 1926776 1252092 706039 223154 482885
U 890418 728531 161887 100464 59987 40477
T 30-34 3752074 2535100 1216974 650370 228682 421688
R 2869307 1803397 1065910 568636 181162 387474
U 882767 731703 151064 81734 47520 34214
T 35-39 3798250 2531779 1266471 644199 213244 430955
R 2897794 1796260 1101534 562157 168923 393234
U 900456 735519 164937 82042 44321 37721
T 40-49 5576006 3897274 1678732 877246 306222 571024
R 4238358 2769044 1469314 773814 247721 526093
U 1337648 1128230 209418 103432 58501 44931
T 50-59 3099794 2181090 918704 527917 185903 342014

Statistics on Women in India 2007
179
S.No. India/State/UT T/R/U Age Group Main Workers Marginal Workers
years
Persons Males Females Persons Males Females
R 2427556 1613862 813694 475262 156661 318601
U 672238 567228 105010 52655 29242 23413
T 60-69 1475806 1062291 413515 307242 131863 175379
R 1245446 873911 371535 278187 114882 163305
U 230360 188380 41980 29055 16981 12074
T 70-79 398613 318524 80089 80649 46343 34306
R 334419 264523 69896 72017 40582 31435
U 64194 54001 10193 8632 5761 2871
T 80+ 76156 58905 17251 15138 8499 6639
R 59960 45626 14334 13027 7157 5870
U 16196 13279 2917 2111 1342 769
3. Arunachal T All Ages 415007 267384 147623 67895 26228 41667
Pradesh R 340027 207110 132917 61983 23210 38773
U 74980 60274 14706 5912 3018 2894
T 5-9 1340 661 679 1857 869 988
R 1142 556 586 1716 811 905
U 198 105 93 141 58 83
T 10-14 7007 2939 4068 8278 3670 4608
R 5978 2602 3376 7834 3508 4326
U 1029 337 692 444 162 282
T 15-19 25526 13404 12122 11790 5527 6263
R 22359 11375 10984 10880 5050 5830
U 3167 2029 1138 910 477 433
T 20-24 45533 27399 18134 9771 4078 5693
R 37457 21233 16224 8769 3533 5236
U 8076 6166 1910 1002 545 457
T 25-29 62513 39182 23331 8726 3128 5598
R 49715 29445 20270 7702 2610 5092
U 12798 12798 9737 3061 1024 518
T 30-34 57455 38372 19083 5999 1859 4140
R 44335 27763 16572 5336 1529 3807
U 13120 10609 2511 663 330 333
T 35-39 60084 40513 19571 5419 1578 3841
R 46717 29484 17233 4784 1278 3506
U 13367 11029 2338 635 300 335

Statistics on Women in India 2007
180
S.No. India/State/UT T/R/U Age Group Main Workers Marginal Workers
years
Persons Males Females Persons Males Females
T 40-49 82626 55107 27519 6976 2030 4946
R 67405 42045 25360 6345 1689 4656
U 15221 13062 2159 631 341 290
T 50-59 46968 32137 14831 4392 1444 2948
R 40440 26232 14208 4112 1285 2827
U 6528 5905 623 280 159 121
T 60-69 19146 12718 6428 3180 1263 1917
R 18091 11784 6307 3058 1183 1875
U 1055 934 121 122 80 42
T 70-79 5043 3609 1434 1072 520 552
R 4826 3420 1406 1044 501 543
U 217 189 28 28 19 9
T 80+ 1406 1055 351 381 221 160
R 1285 951 334 374 214 160
U 121 104 17 7 7 0
4. Assam T All Ages 7114097 5849032 1265065 2424494 1021928 1402566
R 6050639 4926395 1124244 2346130 972809 1373321
U 1063458 922637 140821 78364 49119 29245
T 5-9 22896 14133 8763 37945 19425 18520
R 19849 12437 7412 37242 19095 18147
U 3047 1696 1351 703 330 373
T 10-14 112781 81370 31411 177794 99334 78460
R 98765 74267 24498 173988 97499 76489
U 14016 7103 6913 3806 1835 1971
T 15-19 387556 308207 79349 353778 194362 159416
R 349874 278157 71717 345293 188677 156616
U 37682 30050 7632 8485 5685 2800
T 20-24 664521 530098 134423 384343 182193 202150
R 578490 454396 124094 372147 173575 198572
U 86031 75702 10329 12196 8618 3578
T 25-29 965077 772944 192133 371903 147611 224292
R 822303 649175 173128 358527 138717 219810
U 142774 123769 19005 13376 8894 4482
T 30-34 1015081 822120 192961 283391 98208 185183
R 853464 682212 171252 273155 91825 181330

Statistics on Women in India 2007
181
S.No. India/State/UT T/R/U Age Group Main Workers Marginal Workers
years
Persons Males Females Persons Males Females
U 161617 139908 21709 10236 6383 3853
T 35-39 1095383 897150 198233 250468 79996 170472
R 921483 747055 174428 241296 74829 166467
U 173900 150095 23805 9172 5167 4005
T 40-49 1509544 1260233 249311 296429 92849 203580
R 1258629 1040206 218423 285621 86664 198957
U 250915 220027 30888 10808 6185 4623
T 50-59 795888 683037 112851 150806 50357 100449
R 663558 563887 99671 145670 47340 98330
U 132330 119150 13180 5136 3017 2119
T 60-69 370165 322592 47573 82333 36726 45607
R 327382 283995 43387 79280 34722 44558
U 42783 38597 4186 3053 2004 1049
T 70-79 131427 118633 12794 26091 15584 10507
R 118223 106617 11606 25072 14829 10243
U 13204 12016 1188 1019 755 264
T 80+ 3667 32582 4075 7592 4468 3124
R 32902 29270 3632 7309 4280 3029
U 3755 3312 443 283 188 95
5. Bihar T All Ages 21052875 17511018 3541857 6921731 2971985 3949746
R 19112829 15760425 3352404 6639740 2784397 3855343
U 1940046 1750593 189453 281991 187588 94403
T 5-9 84856 58423 26433 87515 44293 43222
R 79282 54515 24767 84486 42600 41886
U 5574 3908 1666 3029 1693 1336
T 10-14 454904 346626 108278 490225 261501 228724
R 428303 325409 102894 475251 251937 223314
U 26601 21217 5384 14974 9564 5410
T 15-19 1462138 1227178 234960 815488 457534 357954
R 1369466 1143956 225510 784376 434623 349753
U 92672 83222 9450 31112 22911 8201
T 20-24 2187840 1805675 382165 921614 418684 502930
R 2024078 1655656 368422 884172 391516 492656
U 163762 150019 13743 37442 27168 10274
T 25-29 2570735 2114781 455954 907325 368932 538393
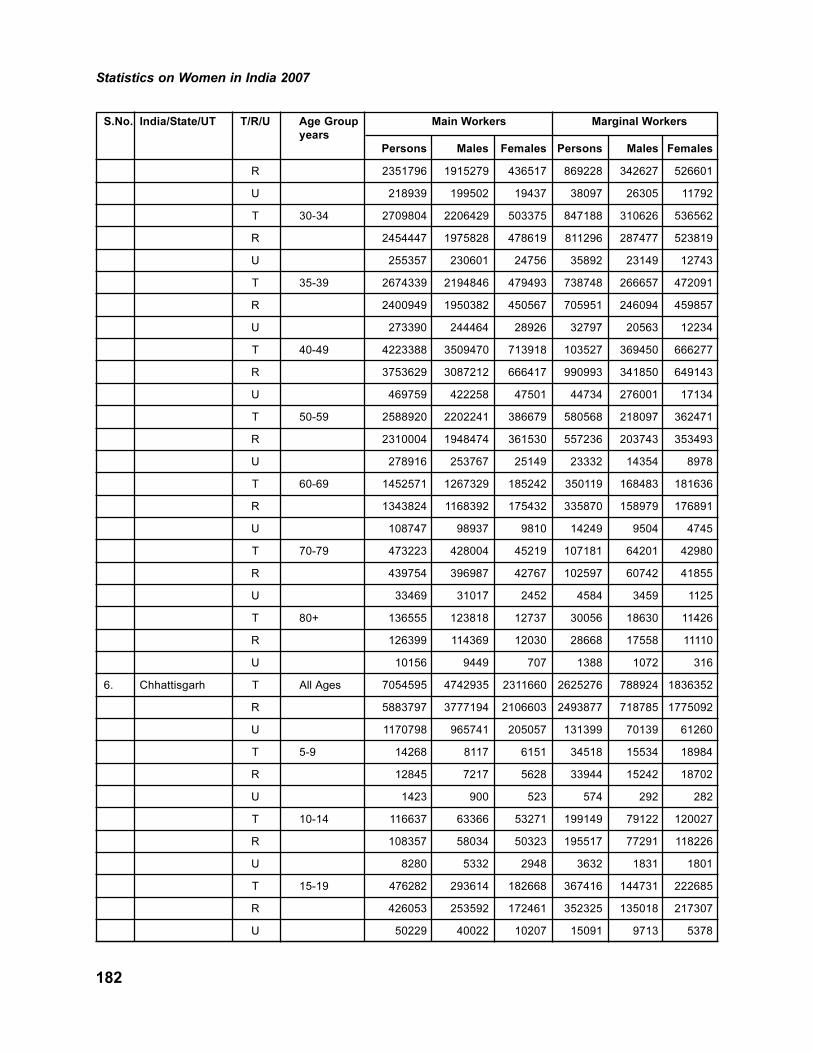
Statistics on Women in India 2007
182
S.No. India/State/UT T/R/U Age Group Main Workers Marginal Workers
years
Persons Males Females Persons Males Females
R 2351796 1915279 436517 869228 342627 526601
U 218939 199502 19437 38097 26305 11792
T 30-34 2709804 2206429 503375 847188 310626 536562
R 2454447 1975828 478619 811296 287477 523819
U 255357 230601 24756 35892 23149 12743
T 35-39 2674339 2194846 479493 738748 266657 472091
R 2400949 1950382 450567 705951 246094 459857
U 273390 244464 28926 32797 20563 12234
T 40-49 4223388 3509470 713918 103527 369450 666277
R 3753629 3087212 666417 990993 341850 649143
U 469759 422258 47501 44734 276001 17134
T 50-59 2588920 2202241 386679 580568 218097 362471
R 2310004 1948474 361530 557236 203743 353493
U 278916 253767 25149 23332 14354 8978
T 60-69 1452571 1267329 185242 350119 168483 181636
R 1343824 1168392 175432 335870 158979 176891
U 108747 98937 9810 14249 9504 4745
T 70-79 473223 428004 45219 107181 64201 42980
R 439754 396987 42767 102597 60742 41855
U 33469 31017 2452 4584 3459 1125
T 80+ 136555 123818 12737 30056 18630 11426
R 126399 114369 12030 28668 17558 11110
U 10156 9449 707 1388 1072 316
6. Chhattisgarh T All Ages 7054595 4742935 2311660 2625276 788924 1836352
R 5883797 3777194 2106603 2493877 718785 1775092
U 1170798 965741 205057 131399 70139 61260
T 5-9 14268 8117 6151 34518 15534 18984
R 12845 7217 5628 33944 15242 18702
U 1423 900 523 574 292 282
T 10-14 116637 63366 53271 199149 79122 120027
R 108357 58034 50323 195517 77291 118226
U 8280 5332 2948 3632 1831 1801
T 15-19 476282 293614 182668 367416 144731 222685
R 426053 253592 172461 352325 135018 217307
U 50229 40022 10207 15091 9713 5378

Statistics on Women in India 2007
183
S.No. India/State/UT T/R/U Age Group Main Workers Marginal Workers
years
Persons Males Females Persons Males Females
T 20-24 763489 494949 268540 360092 120313 239779
R 652725 401892 250833 339890 107371 232519
U 110764 93057 17707 20202 12942 7260
T 25-29 946359 642292 304067 337163 99378 237785
R 783995 505950 278045 316604 87440 229164
U 162364 136342 26022 20550 11938 8621
T 30-34 985493 655559 329934 303285 73931 229354
R 802143 504006 298137 285159 64959 220200
U 183350 151553 31797 18126 8972 9154
T 35-39 958588 652250 306338 259124 63741 195383
R 776360 503610 272750 243321 56471 186850
U 182228 148640 33588 15803 7270 8533
T 40-49 1397236 948392 448844 350516 78996 271520
R 1127498 724952 402546 331253 70452 260801
U 269738 223440 46298 19263 8544 10719
T 50-59 852157 590057 262100 227560 51341 176219
R 707254 469246 238008 217156 46782 170374
U 144903 120811 24092 10404 4559 5845
T 60-69 406704 288370 118334 138969 41828 97141
R 363243 254428 108815 133021 38900 94121
U 43461 33942 9519 5948 2928 3020
T 70-79 105690 81661 24029 37202 15391 21811
R 95361 73061 22300 35836 14499 21337
U 10329 8600 1729 1366 892 474
T 80+ 24224 19045 5179 7974 3715 4259
R 21708 16919 4789 7673 3529 4144
U 2516 2126 390 301 186 115
7. Delhi T All Ages 4317516 3794345 523171 227718 165756 61962
R 273677 240572 33105 27387 17460 9927
U 4043839 3553773 490066 200331 148296 52035
T 5-9 4859 3767 1092 1448 853 595
R 258 204 54 135 76 59
U 4601 3563 1038 1313 777 536
T 10-14 28627 23539 5088 6965 4786 2179
R 1511 1234 277 846 527 319

Statistics on Women in India 2007
184
S.No. India/State/UT T/R/U Age Group Main Workers Marginal Workers
years
Persons Males Females Persons Males Females
U 27116 22305 4811 6119 4259 1860
T 15-19 228024 208599 19425 30484 24371 6113
R 15271 14011 1260 3605 2680 925
U 213753 194588 18165 26879 21691 5188
T 20-24 561244 504879 56365 43832 35247 8585
R 37273 33938 3335 5005 3690 1315
U 523971 470941 53030 38827 31557 7270
T 25-29 721705 642429 79276 37352 28621 8731
R 46610 41753 4857 4445 3058 1387
U 675095 600676 74419 32907 25563 7344
T 30-34 668102 588303 79799 29394 20132 9262
R 45107 39739 5368 3727 2217 1510
U 622995 548564 74431 25667 17915 7752
T 35-39 632980 546906 86074 26710 17388 9322
R 41920 36280 5640 3276 1803 1473
U 591060 510626 80434 23434 15585 7849
T 40-49 889972 767437 122535 30591 20108 10483
R 52899 45231 7668 3592 1838 1754
U 837073 722206 114867 26999 18270 8729
T 50-59 428368 372297 56071 11960 7991 3969
R 23316 20013 3303 1569 798 771
U 405052 352284 52768 10391 7193 3198
T 60-69 111344 98199 13145 6361 4330 2031
R 6876 5814 1062 888 546 342
U 104468 92385 12083 5473 3784 1689
T 70-79 29676 26800 2876 1837 1364 473
R 1888 1684 204 233 180 53
U 27788 25116 2672 1604 1184 420
T 80+ 6919 6144 775 425 297 128
R 430 391 39 49 35 14
U 6489 5753 736 376 262 114
8. Goa T All Ages 425305 326993 98312 97550 48225 49325
R 204915 154069 50846 69537 31579 37958
U 220390 172924 47766 28013 16646 11367
T 5-9 332 222 110 291 160 131

Statistics on Women in India 2007
185
S.No. India/State/UT T/R/U Age Group Main Workers Marginal Workers
years
Persons Males Females Persons Males Females
R 138 90 48 147 80 67
U 194 132 62 144 80 64
T 10-14 2087 1093 994 1428 689 739
R 863 430 433 862 363 499
U 1224 663 561 566 326 240
T 15-19 18015 12013 6002 8297 4320 3977
R 8715 5290 3425 5988 2802 3186
U 9300 6723 2577 2309 1518 791
T 20-24 52740 38799 13941 15756 8968 6788
R 25868 18173 7695 11023 5801 5222
U 26872 20626 6246 4733 3167 1566
T 25-29 65359 50975 14384 14539 7975 6564
R 31836 24503 7333 10089 5124 4965
U 33523 26472 7051 4450 2851 1599
T 30-34 63085 50254 12831 11285 5690 5595
R 29993 23835 6158 7714 3532 4182
U 33092 26419 6673 3571 2158 1413
T 35-39 58874 45310 13564 10447 4617 5830
R 27680 21058 6622 7336 2931 4405
U 31194 24252 6942 3111 1686 1425
T 40-49 90254 69478 20776 16307 6927 9380
R 42457 32115 10342 11788 4531 7257
U 47797 37363 10434 4519 2396 2123
T 50-59 52034 41147 10887 11106 4808 6298
R 24475 18767 5708 8323 3362 4961
U 27559 22380 5179 2783 1446 1337
T 60-69 15992 12529 3463 5938 2986 2952
R 8912 6695 2217 4561 2240 2321
U 7080 5834 1246 1377 746 631
T 70-79 3631 2883 748 1391 738 653
R 2039 1608 431 1051 534 517
U 1592 1275 317 340 204 136
T 80+ 745 597 148 229 133 96
R 388 303 85 167 104 63
U 357 294 63 62 29 33

Statistics on Women in India 2007
186
S.No. India/State/UT T/R/U Age Group Main Workers Marginal Workers
years
Persons Males Females Persons Males Females
9. Gujarat T All Ages 17025074 13480566 3544508 4230447 996720 3233727
R 11114041 8210091 2903950 3879271 839347 3039924
U 5911033 5270475 640558 351176 157373 193803
T 5-9 18816 12231 6585 26633 11003 15630
R 12394 7494 4900 24501 9918 14583
U 6422 4737 1685 2132 1085 1047
T 10-14 197706 126927 70779 242375 88661 153714
R 153373 92736 60637 229033 81768 147265
U 44333 34191 10142 13342 6893 6449
T 15-19 1251329 954443 296886 661078 244057 417021
R 878011 624346 253665 607663 213054 394609
U 373318 330097 43221 53415 31003 22412
T 20-24 2259093 1820031 439062 688132 209549 478583
R 1458618 1086546 372072 627864 174654 453210
U 800475 733485 66990 60268 34895 25373
T 25-29 2399108 1934173 464935 556039 126269 429770
R 1520264 1132673 387591 508876 104095 404781
U 878844 801500 77344 47163 22174 24989
T 30-34 2421224 1897294 523930 503113 80994 422119
R 1549159 1117958 431201 459757 65639 394118
U 872065 779336 92729 43356 15355 28001
T 35-39 2303993 1810113 493880 415176 58230 356946
R 1466208 1073215 392993 375716 46178 329538
U 837785 736898 100887 39460 12052 27408
T 40-49 3452914 2719019 733895 595131 71684 523447
R 2190300 1606561 583739 544951 55714 489237
U 1262614 1112458 150156 50180 15970 34210
T 50-59 1770241 1423381 346860 327338 47960 279378
R 1177916 898488 279428 304166 39045 265121
U 592325 524893 67432 23172 8915 14257
T 60-69 726203 593916 132287 165975 40618 125357
R 543322 433311 110011 152993 34643 118350
U 182881 160605 22276 12982 5975 7007
T 70-79 176078 149161 26917 38226 13599 24627
R 130837 109452 21385 34594 11618 22976

Statistics on Women in India 2007
187
S.No. India/State/UT T/R/U Age Group Main Workers Marginal Workers
years
Persons Males Females Persons Males Females
U 45241 39709 5532 3632 1981 1651
T 80+ 39908 33255 6653 8840 3201 5639
R 28911 23725 5186 7767 2643 5124
U 10997 9530 1467 1073 558 515
10. Haryana T All Ages 6241324 4933004 1308320 2136142 782522 1353620
R 4519240 3425749 1093491 1932347 659872 1272475
U 1722084 1507255 214829 203795 122650 81145
T 5-9 10577 7062 3515 22129 10772 11357
R 8037 5230 2807 20943 10115 10828
U 2540 1832 708 1186 657 529
T 10-14 62161 42197 19964 158624 74798 83826
R 50188 32673 17515 152245 70838 81407
U 11973 9524 2449 6379 3960 2419
T 15-19 399020 317410 81610 332196 168973 1632223
R 317966 244304 73662 307519 151261 156258
U 81054 73106 7948 24677 17712 6965
T 20-24 850334 682031 168303 329278 137934 191344
R 646207 498132 148075 295206 114149 181057
U 204127 183899 20228 34072 23785 10287
T 25-29 959094 760789 198305 282837 93539 189298
R 698093 529139 168954 252232 74565 177667
U 261001 231650 29351 30605 18974 11631
T 30-34 885440 682925 202515 241858 66420 175438
R 634843 465418 169425 215002 52034 162968
U 250597 217507 33090 26856 14386 12470
T 35-39 850962 656409 194553 213418 57205 156213
R 597069 439907 157162 188181 44383 143798
U 253893 216502 37391 25237 12822 12415
T 40-49 1226732 966283 260449 275108 72607 202501
R 835702 628178 207524 244828 56587 188241
U 391030 338105 52925 30280 16020 14260
T 50-59 591595 479313 112282 139538 40043 99495
R 411597 321498 90099 126912 33073 93839
U 179998 157815 22183 12626 6970 5656
T 60-69 286785 234368 52417 103264 39050 64214

Statistics on Women in India 2007
188
S.No. India/State/UT T/R/U Age Group Main Workers Marginal Workers
years
Persons Males Females Persons Males Females
R 228603 182316 46287 95125 34265 60860
U 58182 52052 6130 8139 4785 3354
T 70-79 88968 78853 10115 29023 16451 12572
R 69679 61048 8631 26292 14563 11729
U 19289 17805 1484 2731 1888 843
T 80+ 18079 15845 2234 5583 3320 2263
R 13593 11816 1777 4995 2911 2084
U 4486 4029 457 588 409 179
11. Himachal Pradesh T All Ages 1963882 1333361 630521 1028579 353297 675282
R 1758872 1162619 596253 1013479 344092 669387
U 205010 170742 34268 15100 9205 5895
T 5-9 2268 1240 1028 16993 8426 8567
R 2077 1121 956 16925 8391 8534
U 191 119 72 68 35 33
T 10-14 11423 6030 5393 77090 36915 40175
R 10447 5366 5081 76743 36719 40024
U 976 664 312 347 196 151
T 15-19 80210 49937 30273 132605 60905 71700
R 72756 43268 29488 131345 59976 71369
U 7454 6669 785 1260 929 331
T 20-24 223649 146345 77304 155502 60569 94933
R 201325 126464 74861 152976 58776 94200
U 22324 19881 2443 2526 1793 733
T 25-29 279517 188423 91094 130537 42666 87871
R 249865 163362 86503 127941 40969 86972
U 29652 25061 4591 2596 1697 899
T 30-34 263907 180150 83757 97542 26642 70900
R 233418 155171 78247 95631 25539 70092
U 30489 24979 5510 1911 1103 808
T 35-39 259085 173210 85875 90112 21094 69018
R 228209 148489 79720 88323 20150 68173
U 30876 24721 6155 1789 944 845
T 40-49 406833 278131 128702 137021 30920 106101
R 358064 238313 119751 134775 29753 105022
U 48769 39818 8951 2246 1167 1079

Statistics on Women in India 2007
189
S.No. India/State/UT T/R/U Age Group Main Workers Marginal Workers
years
Persons Males Females Persons Males Females
T 50-59 254268 177641 76627 94303 24496 69807
R 228505 156318 72187 93100 23879 69221
U 25763 21323 4440 1203 617 586
T 60-69 122796 85950 36846 65751 25090 40661
R 117407 81259 36148 64983 24619 40364
U 5389 4691 698 768 471 297
T 70-79 45565 35167 10398 24368 11875 12493
R 43413 33211 10202 24078 11696 12382
U 2152 1956 196 290 179 111
T 80+ 12225 9565 2660 5984 3378 2606
R 11577 8998 2579 5902 3316 2586
U 648 567 81 82 62 20
12. Jammu & Kashmir T All Ages 2608668 2226958 381710 1145147 452983 692164
R 1862629 1559977 302652 1062057 408572 653485
U 746039 666981 79058 83090 44411 38679
T 5-9 12191 7336 4855 23249 11119 12130
R 9971 5928 4043 22397 10703 11694
U 2220 1408 812 852 416 436
T 10-14 42090 26534 15556 98100 44910 53190
R 35705 21881 13824 95207 43393 51814
U 6385 4653 1732 2893 1517 1376
T 15-19 140692 105809 34883 168665 76842 91823
R 117096 85822 31274 159825 71755 88070
U 23596 19987 3609 8840 5087 3753
T 20-24 273457 227693 45764 162607 71524 91083
R 203356 165257 38099 150027 64223 85804
U 70101 62436 7665 12580 7301 5279
T 25-29 343737 291996 51741 142347 55681 86666
R 238698 198283 40415 130341 48962 81379
U 105039 93713 11326 12006 6719 5287
T 30-34 357789 307421 50368 116372 40356 76016
R 239973 201894 38079 106384 35315 71069
U 117816 105527 12289 9988 5041 4947
T 35-39 363533 310490 53043 113239 34495 78744
R 248021 208555 39466 103324 29967 73357

Statistics on Women in India 2007
190
S.No. India/State/UT T/R/U Age Group Main Workers Marginal Workers
years
Persons Males Females Persons Males Females
U 115512 101935 13577 9915 4528 5387
T 40-49 545940 476012 69928 155618 49416 106202
R 375383 323438 51945 142289 43066 99223
U 170557 152574 17983 13329 6350 6979
T 50-59 302875 269169 33706 87461 30471 56990
R 214538 187902 26636 80586 26907 53679
U 88337 81267 7070 6875 3564 3311
T 60-69 149021 134414 14607 50759 23307 27452
R 118243 105416 12827 46971 20844 26127
U 30778 28998 1780 3788 2463 1325
T 70-79 54118 49429 4689 17872 10041 7831
R 43990 39944 4046 16600 9122 7478
U 10128 9485 643 1272 919 353
T 80+ 15504 14129 1375 4885 2928 1957
R 12625 11486 1139 4522 2664 1858
U 2879 2643 236 363 264 99
13. Jharkhand T All Ages 6446782 5134067 1312715 3662248 1525789 2136459
R 5105341 3921518 1183823 3464250 1380625 2083625
U 1341441 1212549 128892 197998 145164 52834
T 5-9 19948 12327 7621 42319 19632 22687
R 17712 10759 6953 41187 18986 22201
U 2236 1568 668 1132 646 486
T 10-14 112635 71371 41264 232298 105156 127142
R 102349 64111 38238 226553 101622 124931
U 10286 7260 3026 5745 3534 2211
T 15-19 377025 278301 98724 444354 215151 229203
R 333904 240715 93189 425165 200462 224703
U 43121 37586 5535 19189 14689 4500
T 20-24 622311 477654 144657 512491 224111 288380
R 522558 386700 135858 483309 201007 282302
U 99753 90954 8799 29182 23104 6078
T 25-29 806251 635398 170853 509705 212489 297216
R 651778 494614 157164 477365 187351 290014
U 154473 140784 13689 32340 25138 7202
T 30-34 872709 686328 186381 463459 176050 287409

Statistics on Women in India 2007
191
S.No. India/State/UT T/R/U Age Group Main Workers Marginal Workers
years
Persons Males Females Persons Males Females
R 688378 519498 168880 434445 154796 279649
U 184331 166830 17501 29014 21254 7760
T 35-39 900350 719887 180463 406260 156083 250177
R 698033 538611 159422 380261 137776 242485
U 202317 181276 21041 25999 18307 7692
T 40-49 1426733 1157850 268883 550696 205315 345381
R 1069118 835729 233389 518637 183046 335591
U 357615 322121 35494 32059 22269 9790
T 50-59 850185 710101 140084 296395 111685 184710
R 627833 504898 122935 282568 102360 180208
U 222352 205203 17149 13827 9325 4502
T 60-69 334067 277427 56640 150845 69979 80866
R 287574 235270 52304 144200 65273 78927
U 46493 42157 4336 6645 4706 1939
T 70-79 91454 79394 12060 39320 22360 16960
R 79357 68308 11049 37425 20887 16538
U 12097 11086 1011 1895 1473 422
T 80+ 27158 23501 3657 11470 6536 4934
R 22515 19251 3264 10769 5999 4770
U 4643 4250 393 701 537 164
14. Karnataka T All Ages 19364759 13896845 5467914 4170032 1338510 2831522
R 13462535 9194812 4267723 3665268 1059440 2605828
U 5902224 4702033 1200191 504764 279070 225694
T 5-9 48757 30626 18131 37382 17559 19823
R 35835 21874 13961 33564 15371 18193
U 12922 8752 4170 3818 2188 1630
T 10-14 438588 264956 173632 297888 126268 171620
R 354036 206216 147820 275161 112939 162222
U 84552 58740 25812 22727 13329 9398
T 15-19 1553743 1091526 462217 576187 256481 319706
R 1171570 799369 372201 510700 213695 297005
U 382173 292157 90016 65487 42786 22701
T 20-24 2310615 1686072 624543 581812 228422 353390
R 1589896 1110194 479702 499019 174816 324203
U 720719 575878 144841 82793 53606 29187

Statistics on Women in India 2007
192
S.No. India/State/UT T/R/U Age Group Main Workers Marginal Workers
years
Persons Males Females Persons Males Females
T 25-29 2634337 1853389 780948 556787 165677 391110
R 1747927 1154004 593923 480841 123052 357789
U 886410 699385 187025 75946 42625 33321
T 30-34 2461387 1734681 726706 445698 114735 330963
R 1639372 1082743 556629 386999 84863 302136
U 822015 651938 170077 58699 29872 28827
T 35-39 2582246 1782868 799378 453850 103598 350252
R 1746410 1131728 614682 395911 76867 319044
U 835836 651140 184696 57939 26731 31208
T 40-49 3905316 2852482 1052834 605757 144950 460807
R 2657022 1840448 816574 532681 109626 423055
U 1248294 1012034 236260 73076 35324 37752
T 50-59 2098387 1570471 527916 344216 84415 259801
R 1470681 1049323 421358 307271 66555 240716
U 627706 521148 106558 36945 17860 19085
T 60-69 966892 736021 230871 195486 62923 132563
R 762810 569441 193369 175990 52811 123179
U 204082 166580 37502 19496 10112 9384
T 70-79 285625 231911 53714 58016 25763 32253
R 226844 182739 44105 52194 22302 29892
U 58781 49172 9609 5822 3461 2361
T 80+ 66142 52789 13353 14337 6700 7637
R 51055 40493 10562 12688 5742 6946
U 15087 12296 2791 1649 958 691
15. Kerala T All Ages 8236973 6460693 1776280 2046914 1304952 741962
R 5998150 4677067 1321083 1672960 1055320 617640
U 2238823 1783626 455197 373954 249632 124322
T 5-9 5438 3793 1645 2510 1549 961
R 4020 2818 1202 2038 1268 770
U 1418 975 443 472 281 191
T 10-14 11228 6999 4229 6980 4085 2895
R 8257 5105 3152 5807 3369 2438
U 2971 1894 1077 1173 716 457
T 15-19 242625 185965 56660 117321 84361 32960
R 185858 140395 45463 95562 67881 27681

Statistics on Women in India 2007
193
S.No. India/State/UT T/R/U Age Group Main Workers Marginal Workers
years
Persons Males Females Persons Males Females
U 56767 45570 11197 21759 16480 5279
T 20-24 783592 639232 144360 270602 197666 72936
R 582692 472645 110047 217417 157295 60122
U 200900 166587 34313 53185 40371 12814
T 25-29 1087266 880816 206450 279480 191457 88023
R 789901 635745 154156 225322 152039 73283
U 297365 245071 52294 54158 39418 14740
T 30-34 1170641 924628 246013 258153 160509 97644
R 842010 660230 181780 209272 128145 81127
U 328631 264398 64233 48881 32364 16517
T 35-39 1231656 929240 302416 270065 153238 116827
R 893303 667834 225469 221877 124177 97700
U 338353 261406 76947 48188 29061 19127
T 40-49 2009790 1536234 473556 415875 241529 174346
R 1439019 1092216 346803 342383 196712 145671
U 570771 444018 126753 73492 44817 28675
T 50-59 1110572 872018 238554 241723 148319 93404
R 795943 622003 173940 199552 121869 77683
U 314629 250015 64614 42171 26450 15721
T 60-69 434371 353572 80799 137928 89145 48783
R 337137 274661 62476 114895 74534 40361
U 97234 78911 18323 23033 14611 8422
T 70-79 122394 105347 17047 38399 27503 10896
R 98393 85211 13182 32231 23304 8927
U 24001 20136 3865 6168 4199 1969
T 80+ 24069 20358 3711 7000 5032 1968
R 19210 16389 2821 5927 4295 1632
U 4859 3969 890 1073 737 336
16. Madhya Pradesh T All Ages 19102572 14056279 5046293 6690947 2138089 4552858
R 14776619 10387506 4389113 6123607 1818410 4305197
U 4325953 3668773 657180 567340 319679 247661
T 5-9 41766 24295 17471 89585 41580 48005
R 35443 20038 15405 86459 39851 46608
U 6323 4257 2066 3126 1729 1397
T 10-14 346499 210336 136163 587409 257706 329703

Statistics on Women in India 2007
194
S.No. India/State/UT T/R/U Age Group Main Workers Marginal Workers
years
Persons Males Females Persons Males Females
R 312328 185378 126950 566170 245691 320479
U 34171 24958 9213 21239 12015 9224
T 15-19 1355989 969185 386804 957421 428732 528689
R 1150612 794281 356331 888391 381683 506708
U 205377 174904 30473 69030 47049 21981
T 20-24 2328436 1707724 620712 984558 349521 635037
R 1862265 1301676 560589 894630 288711 605919
U 466171 406048 60123 89928 60810 29118
T 25-29 2610429 1922345 688084 865019 254212 610807
R 2017771 1412280 605491 782249 204862 577387
U 592658 510065 82593 82770 49350 33420
T 30-34 2661394 1925808 735586 775849 192280 583569
R 2019201 1383125 636076 701421 153345 548076
U 642193 542683 99510 74428 38935 35493
T 35-39 2531170 1863804 667366 638322 157277 481045
R 1878956 1319304 559652 571633 124808 446825
U 652214 544500 107714 66689 32469 34220
T 40-49 3604407 2672588 931819 825277 184468 640809
R 2645845 1858783 787062 744351 145644 598707
U 958562 813805 144757 80926 3824 42102
T 50-59 2075187 1551212 523975 502326 108452 393874
R 1567780 1119849 447931 461269 89934 371335
U 507407 431363 76044 41057 18518 22539
T 60-69 117477 855660 261817 339942 106490 233452
R 931152 703572 227580 312379 92998 219381
U 186325 152088 34237 27563 13492 14071
T 70-79 318275 263948 54327 92797 42729 50068
R 265928 218857 47071 85091 38047 47044
U 52347 45091 7256 7706 4682 3024
T 80+ 70781 59012 11769 19588 9955 9633
R 58090 48042 10048 17904 8886 9018
U 12691 10970 1721 1684 1069 615
17. Maharashtra T All Ages 34748053 24416295 10331758 6425298 2435800 3989498
R 21853804 13528493 8325311 5407627 1820143 3587484
U 12894249 10887802 2006447 1017671 615657 402014

Statistics on Women in India 2007
195
S.No. India/State/UT T/R/U Age Group Main Workers Marginal Workers
years
Persons Males Females Persons Males Females
T 5-9 44868 26601 18267 44741 21352 23389
R 32039 17841 14198 41252 19423 21829
U 12829 8760 4069 3489 1929 1560
T 10-14 347318 199882 147436 327148 150811 176337
R 269200 141321 127879 305774 137462 168312
U 78118 58561 19557 21374 13349 8025
T 15-19 2048503 1402986 645517 838724 415777 422947
R 1423691 866839 556852 727231 334233 392998
U 624812 536147 88665 111493 81544 29949
T 20-24 4093124 2922154 1170970 944029 442071 501958
R 2517164 1561566 955598 764397 311289 453108
U 1575960 1360588 215372 179632 130782 48850
T 25-29 4906345 3492389 1413956 822740 311932 510808
R 2866581 1751813 1114768 661367 207561 453806
U 2039764 1740576 299188 161373 104371 57002
T 30-34 4930570 3454939 1475631 694491 223538 470953
R 2923783 1758170 1165613 560818 148933 411885
U 2006787 1696769 310018 133673 74605 59068
T 35-39 4760147 3275672 1484475 645457 189641 455816
R 2887783 1726182 1161601 523424 129299 394125
U 1872364 1549490 322874 122033 60342 61691
T 40-49 7039087 5002480 2036607 874460 261139 613321
R 4260678 2671711 1588967 723763 183784 539979
U 2778409 2330769 447640 150697 77355 73342
T 50-59 3798581 2705925 1092656 550831 158228 392603
R 2430231 1540418 889813 478698 120306 358392
U 1368350 1165507 202843 72133 37922 34211
T 60-69 2113401 1410138 703263 510485 170876 339609
R 1714550 1086293 628257 464798 147526 317272
U 398851 323845 75006 45687 23350 22337
T 70-79 526407 419470 106937 139622 74122 65500
R 424427 332869 91558 126892 66095 60797
U 101980 86601 15379 12730 8027 4703
T 80+ 104048 79479 24569 25689 13496 12193
R 77716 57304 20412 22995 11826 11169

Statistics on Women in India 2007
196
S.No. India/State/UT T/R/U Age Group Main Workers Marginal Workers
years
Persons Males Females Persons Males Females
U 26332 22175 4157 2694 1670 1024
18. Manipur T All Ages 659364 430227 229137 285849 96989 188860
R 494747 320432 174315 228340 77942 150398
U 164617 109795 54822 57509 19047 38462
T 5-9 3052 1665 1387 3951 1813 2138
R 2593 1395 1198 3504 1625 1879
U 459 270 189 447 188 259
T 10-14 7342 3942 3400 14491 6829 7662
R 6515 3468 3047 12903 6125 6778
U 827 474 353 1588 704 884
T 15-19 25413 14016 11397 32496 13960 18536
R 22116 11942 10174 27865 12090 15775
U 3297 2074 1223 4631 1870 2761
T 20-24 59874 36788 23086 44192 16430 27762
R 48908 29721 19187 35962 13485 22477
U 10966 7067 3899 8230 2945 5285
T 25-29 85603 54789 30814 43186 14254 28932
R 66145 41803 24342 33965 11155 22810
U 19458 12986 6472 9221 3099 6122
T 30-34 89908 59730 30178 33413 10307 23106
R 67165 44443 22722 25864 7842 18022
U 22743 15287 7456 7549 2465 5084
T 35-39 92851 61147 31704 29309 7950 21359
R 68493 44991 23502 22720 6083 16637
U 24358 16156 8202 6589 1867 4722
T 40-49 145729 95336 50393 39471 10101 29370
R 104942 68438 36504 30730 7817 22913
U 40787 26898 13889 8741 2284 6457
T 50-59 88157 60056 28101 23338 6279 17059
R 62565 42522 20043 18152 4864 13288
U 25592 17534 8058 5186 1415 3771
T 60-69 41795 28671 13124 14577 5404 9173
R 30929 21292 9637 11151 4111 7040
U 10866 7379 3487 3426 1293 2133
T 70-79 14498 10415 4083 5541 2774 2767

Statistics on Women in India 2007
197
S.No. India/State/UT T/R/U Age Group Main Workers Marginal Workers
years
Persons Males Females Persons Males Females
R 10572 7712 2860 4175 2081 2094
U 3926 2703 1223 1366 693 673
T 80+ 3798 2745 1053 1341 694 647
R 2836 2069 767 1024 541 483
U 962 676 286 317 153 164
19. Meghalaya T All Ages 757011 485694 271317 213135 82797 130338
R 626538 393364 233174 195993 74731 121262
U 130473 92330 38143 17142 8066 9076
T 5-9 4695 2569 2126 5465 2670 2795
R 4335 2356 1979 5142 2527 2615
U 360 213 147 323 143 180
T 10-14 20788 12134 8654 22992 11333 11659
R 19531 11537 7994 21814 10763 11051
U 1257 597 660 1178 570 608
T 15-19 61702 37349 24353 34947 17027 17920
R 56194 34124 22070 32545 15778 16767
U 5508 3225 2283 2402 1249 1153
T 20-24 82965 50206 32759 30611 12491 18120
R 71708 42201 29507 27881 11070 16811
U 11257 8005 3252 2730 1421 1309
T 25-29 106155 65818 40337 29543 10251 19292
R 87046 52123 34923 26756 8883 17873
U 19109 13695 5414 2787 1368 1419
T 30-34 98890 64169 34721 20833 6702 14131
R 78834 49850 28984 18912 5871 13041
U 20056 14319 5737 1921 831 1090
T 35-39 107307 70403 36904 20568 6241 14327
R 85990 55081 30909 18703 5463 13240
U 21317 15322 5995 1865 778 1087
T 40-49 143751 94283 49468 24002 7494 16508
R 114189 73301 40888 21946 6673 15273
U 29562 20982 8580 2056 821 1235
T 50-59 76409 51027 25382 12715 3963 8752
R 61027 39800 21227 11686 3539 8147
U 15382 11227 4155 1029 424 605

Statistics on Women in India 2007
198
S.No. India/State/UT T/R/U Age Group Main Workers Marginal Workers
years
Persons Males Females Persons Males Females
T 60-69 37781 25895 11886 7650 2821 4829
R 33001 22490 10511 7080 2529 4551
U 4780 3405 1375 570 292 278
T 70-79 12073 8603 3470 2780 1314 1466
R 10668 7611 3057 2572 1194 1378
U 1405 992 413 208 120 88
T 80+ 3610 2602 1008 813 393 420
R 3214 2322 892 751 352 399
U 396 280 116 62 41 21
20. Mizoram T All Ages 362450 225428 137022 104709 37580 67129
R 201599 120662 80937 54445 18193 36252
U 160851 104766 56085 50264 19387 30877
T 5-9 656 344 312 3335 1648 1687
R 514 257 257 2284 1124 1160
U 142 87 55 1051 524 527
T 10-14 4520 2358 2162 17754 8512 9242
R 3567 1828 1739 12636 6004 6632
U 953 530 423 5118 2508 2610
T 15-19 30022 17270 12752 20957 9663 11294
R 21126 11697 9429 11173 4821 6352
U 8896 5573 3323 9784 4842 4942
T 20-24 49692 31101 18591 17206 6435 10771
R 29780 17633 12147 7325 2078 5247
U 19912 13468 6444 9881 4357 5524
T 25-29 52772 34118 18654 12175 3467 8708
R 28373 17645 10728 5307 1013 4294
U 24399 16473 7926 6868 2454 4414
T 30-34 45574 28972 16602 7234 1578 5656
R 22755 13877 8878 3125 402 2723
U 22819 15095 7724 4109 1176 2933
T 35-39 47263 29420 17843 6050 1128 4922
R 23895 14334 9561 2515 315 2200
U 23368 15086 8282 3535 813 2722
T 40-49 69322 41682 27640 7385 1283 6102
R 36488 21224 15264 3336 411 2925

Statistics on Women in India 2007
199
S.No. India/State/UT T/R/U Age Group Main Workers Marginal Workers
years
Persons Males Females Persons Males Females
U 32834 20458 12376 4049 872 3177
T 50-59 40735 25456 15279 5078 976 4102
R 22248 13594 8654 2508 396 2112
U 18487 11862 6625 2570 580 1990
T 60-69 16531 10882 5649 4587 1475 3112
R 9700 6333 3367 2524 785 1739
U 6831 4549 2282 2063 690 1373
T 70-79 4443 3181 1262 2463 1156 1307
R 2591 1848 743 1407 683 724
U 1852 1333 519 1056 473 583
T 80+ 659 468 191 420 231 189
R 407 290 117 264 143 121
U 252 178 74 156 88 68
21. Nagaland T All Ages 703977 424811 279166 143819 64157 79662
R 608335 348972 259363 133104 57887 75217
U 95642 75839 19803 10715 6270 4445
T 5-9 4716 2432 2284 5578 2764 2814
R 4203 2171 2032 5341 2636 2705
U 513 261 252 237 128 109
T 10-14 16811 8621 8190 18769 9397 9372
R 15401 7817 7584 17782 8911 8871
U 1410 804 606 987 486 501
T 15-19 47518 25728 21790 28396 14446 13950
R 43963 23105 20858 26814 13532 13282
U 3555 2623 932 1582 914 668
T 20-24 78692 44250 34442 24566 12108 12458
R 70908 38360 32548 22929 11089 11840
U 7784 5890 1894 1637 1019 618
T 25-29 92804 53992 38812 17655 7657 9998
R 78412 43178 35234 16117 6747 9370
U 14392 10814 3578 1538 910 628
T 30-34 85630 53030 32600 11312 4359 6953
R 70062 40643 29419 10095 3646 6449
U 15568 12387 3181 1217 713 504
T 35-39 92163 56869 35294 10094 3322 6772

Statistics on Women in India 2007
200
S.No. India/State/UT T/R/U Age Group Main Workers Marginal Workers
years
Persons Males Females Persons Males Females
R 75789 43688 32101 8924 2625 6299
U 16374 13181 3193 1170 697 473
T 40-49 146305 90385 55920 13409 4269 9140
R 124643 72841 51802 12008 3466 8542
U 21662 17544 4118 1401 803 598
T 50-59 81060 52401 28659 7071 2534 4537
R 70684 43504 27180 6521 2198 4323
U 10376 8897 1479 550 336 214
T 60-69 37566 23640 13926 4179 1894 2285
R 34937 21352 13585 3909 1713 2196
U 2629 2288 341 270 181 89
T 70-79 13412 8617 4795 1800 888 912
R 12612 7938 4674 1720 834 886
U 800 679 121 80 54 26
T 80+ 6028 4010 2018 760 400 360
R 5635 3692 1943 733 384 349
U 393 318 75 27 16 11
22. Orissa T All Ages 9589269 8004740 1584529 4687219 1797266 2889953
R 8071999 6677417 1394582 4514970 1696278 2818692
U 1517270 1327323 189947 172249 100988 71261
T 5-9 15154 9539 5615 32431 14640 17791
R 13153 8233 4920 31189 13993 17196
U 2001 1306 695 1242 647 595
T 10-14 94606 59862 34744 235403 99229 136174
R 82920 51813 31107 229090 95900 133190
U 11686 8049 3637 6313 3329 2984
T 15-19 452782 342009 110773 597776 284346 313430
R 396772 295396 101376 578406 272065 306341
U 56010 46613 9397 19370 12281 7089
T 20-24 863503 702617 160886 659190 300853 358337
R 736885 591944 144941 633089 282973 350116
U 126618 110673 15945 26101 17880 8221
T 25-29 1252054 1032046 220008 657524 247079 410445
R 1050989 856103 194886 630950 230202 400748
U 201065 175943 25122 26574 16877 9697

Statistics on Women in India 2007
201
S.No. India/State/UT T/R/U Age Group Main Workers Marginal Workers
years
Persons Males Females Persons Males Females
T 30-34 1349510 1116043 233467 562868 180915 381953
R 1118897 914600 204297 541119 168721 372398
U 230613 201443 29170 21749 12194 9555
T 35-39 1406701 1171916 234785 514529 159935 354594
R 1166484 963905 202579 494514 149711 344803
U 240217 208011 32206 20015 10224 9791
T 40-49 2093342 1775351 317991 682947 209342 473605
R 1724014 1449197 274817 658040 196506 461534
U 369328 326154 43174 24907 12836 12071
T 50-59 1186101 1024876 161225 397814 129651 268163
R 992297 850878 141419 384456 122794 261662
U 193804 173998 19806 13358 6857 6501
T 60-69 623058 544397 78661 250805 113832 136973
R 563645 492571 71074 242068 108655 133413
U 59413 51826 7587 8737 5177 3560
T 70-79 193370 174252 19118 73523 44901 28622
R 175367 158378 16989 70681 42922 27759
U 18003 15874 2129 2842 1979 863
T 80+ 46784 41719 5065 16838 10004 6834
R 40478 36157 4321 16078 9493 6585
U 6306 5562 744 760 511 249
23. Punjab T All Ages 7835732 6426028 1409704 1291742 534185 757557
R 5248225 4161003 1087222 1112126 428046 684080
U 2587507 2265025 322482 179616 106139 73477
T 5-9 18478 12057 6421 10442 5694 4748
R 12698 8230 4468 8406 4495 3911
U 5780 3827 1953 2036 1199 837
T 10-14 92160 68577 23583 56188 30003 26185
R 66463 48105 18358 48928 25287 23641
U 25697 20472 5225 7260 4716 2544
T 15-19 511515 426201 85314 173497 93164 80333
R 369436 298544 70892 150638 77035 73603
U 142079 127657 14422 22859 16129 6730
T 20-24 1003439 845780 157659 202294 97643 104651
R 687867 561304 126563 171999 77263 94736

Statistics on Women in India 2007
202
S.No. India/State/UT T/R/U Age Group Main Workers Marginal Workers
years
Persons Males Females Persons Males Females
U 315572 284476 31096 30295 20380 9915
T 25-29 1042703 865390 177313 161954 64775 97179
R 680811 542957 137854 137994 50245 87749
U 361892 322433 39459 23960 14530 9430
T 30-34 1001903 806266 195637 148816 48824 99992
R 658083 506771 151312 128313 38308 90005
U 343820 299495 44325 20503 10516 9987
T 35-39 1024609 820588 204021 140603 45340 95263
R 667895 514133 153762 120284 35510 84774
U 356714 306455 50259 20319 9830 10489
T 40-49 1589886 1283574 306312 194743 63556 131187
R 1016561 790203 226358 167486 49689 117797
U 573325 493371 79954 27257 13867 13390
T 50-59 861217 709917 151300 98477 35014 63463
R 569918 457317 112601 86347 28222 58125
U 291299 252600 38699 12130 6792 5338
T 60-69 460813 385545 75268 71900 31075 40825
R 347909 284392 63517 63505 26054 37451
U 112904 101153 11751 8395 5021 3374
T 70-79 167986 149611 18375 23566 14093 9473
R 127447 112307 15140 20443 11911 8532
U 40539 37304 3235 3123 2182 941
T 80+ 43738 38550 5188 6372 3677 2695
R 33066 28930 4136 5530 3093 2437
U 10672 9620 1052 842 584 258
24. Rajasthan T All Ages 17436888 12841318 4595570 6329767 1854484 4475283
R 13962042 9771540 4190502 5894381 1607996 4286385
U 3474846 3069778 405068 435386 246488 188898
T 5-9 52808 28484 24324 150713 69514 81199
R 45563 23423 22140 147209 67603 79606
U 7245 5061 2184 3504 1911 1593
T 10-14 337212 167484 169728 721837 294744 427093
R 307552 145324 162228 702449 284476 417973
U 29660 22160 7500 19388 10268 9120
T 15-19 1405578 961330 444248 1013516 410515 603001

Statistics on Women in India 2007
203
S.No. India/State/UT T/R/U Age Group Main Workers Marginal Workers
years
Persons Males Females Persons Males Females
R 1219841 798717 421124 953617 371478 582139
U 185737 162613 23124 59899 39037 20862
T 20-24 2295798 1680179 615619 887030 279299 607731
R 1870530 1294164 576366 813890 230697 583193
U 425268 386015 39253 73140 48602 24538
T 25-29 2452534 1818511 634023 740807 180651 560156
R 1942371 1361506 580865 677327 142880 534447
U 510163 457005 53158 63480 37771 25709
T 30-34 2376255 1739027 637228 645340 126915 518425
R 1867985 1291864 576121 591124 98953 492171
U 508270 447163 61107 54216 27962 26254
T 35-39 2226574 1651117 575457 543929 102954 440975
R 1728774 1217406 511368 496214 79869 41635
U 497800 433711 64089 47715 23085 24630
T 40-49 3282621 2460695 821926 756880 139158 617722
R 2526908 1797088 729820 696924 110489 586435
U 755713 663607 92106 59956 28669 31287
T 50-59 1810092 1387738 422354 461604 101163 360441
R 1436575 1056188 380387 432375 86392 345983
U 373517 331550 41967 29229 14771 14458
T 60-69 847953 667933 180020 284051 95494 188557
R 727023 560920 166103 267683 86328 181355
U 120930 107013 13917 16368 9166 7202
T 70-79 220708 185118 35590 75729 36907 38822
R 184058 151840 32218 70817 33726 37091
U 36650 33278 3372 4912 3181 1731
T 80+ 40653 33642 7011 14167 7362 6805
R 32381 26282 6099 12988 6561 6427
U 8272 7360 912 1179 801 378
25. Sikkim T All Ages 212904 146541 66363 50139 19175 30964
R 190656 129679 60977 48346 17881 30465
U 22248 16862 5386 1793 1294 499
T 5-9 973 526 447 1644 771 873
R 842 451 391 1621 758 863
U 131 75 56 23 13 10
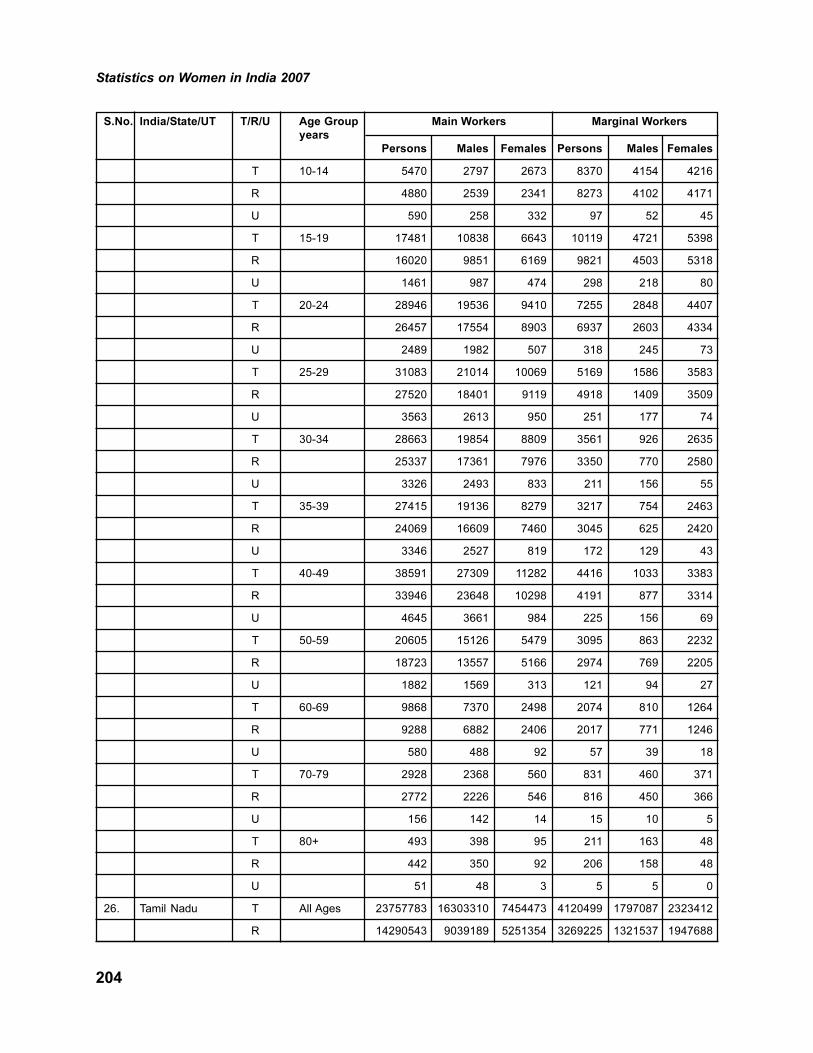
Statistics on Women in India 2007
204
S.No. India/State/UT T/R/U Age Group Main Workers Marginal Workers
years
Persons Males Females Persons Males Females
T 10-14 5470 2797 2673 8370 4154 4216
R 4880 2539 2341 8273 4102 4171
U 590 258 332 97 52 45
T 15-19 17481 10838 6643 10119 4721 5398
R 16020 9851 6169 9821 4503 5318
U 1461 987 474 298 218 80
T 20-24 28946 19536 9410 7255 2848 4407
R 26457 17554 8903 6937 2603 4334
U 2489 1982 507 318 245 73
T 25-29 31083 21014 10069 5169 1586 3583
R 27520 18401 9119 4918 1409 3509
U 3563 2613 950 251 177 74
T 30-34 28663 19854 8809 3561 926 2635
R 25337 17361 7976 3350 770 2580
U 3326 2493 833 211 156 55
T 35-39 27415 19136 8279 3217 754 2463
R 24069 16609 7460 3045 625 2420
U 3346 2527 819 172 129 43
T 40-49 38591 27309 11282 4416 1033 3383
R 33946 23648 10298 4191 877 3314
U 4645 3661 984 225 156 69
T 50-59 20605 15126 5479 3095 863 2232
R 18723 13557 5166 2974 769 2205
U 1882 1569 313 121 94 27
T 60-69 9868 7370 2498 2074 810 1264
R 9288 6882 2406 2017 771 1246
U 580 488 92 57 39 18
T 70-79 2928 2368 560 831 460 371
R 2772 2226 546 816 450 366
U 156 142 14 15 10 5
T 80+ 493 398 95 211 163 48
R 442 350 92 206 158 48
U 51 48 3 5 5 0
26. Tamil Nadu T All Ages 23757783 16303310 7454473 4120499 1797087 2323412
R 14290543 9039189 5251354 3269225 1321537 1947688

Statistics on Women in India 2007
205
S.No. India/State/UT T/R/U Age Group Main Workers Marginal Workers
years
Persons Males Females Persons Males Females
U 9467240 7264121 2203119 851274 475550 375724
T 5-9 51137 29727 21410 22063 10815 11248
R 32040 18016 14024 16212 7758 8454
U 19097 11711 7386 5851 3057 2794
T 10-14 253202 142154 111048 92399 42337 50062
R 168649 90094 78555 75411 33255 42156
U 84553 52060 32493 16988 9082 7906
T 15-19 1527808 944840 582968 412678 196918 215760
R 1025859 605395 420464 337061 153253 183808
U 501949 339445 162504 75617 43665 31952
T 20-24 2520871 1715705 805166 534059 255432 278627
R 1554784 991562 563222 419627 185834 233793
U 966087 724143 241944 114432 69598 44834
T 25-29 3155510 2158793 996717 561509 239417 322092
R 1852645 1151438 701207 439708 168998 270710
U 1302865 1007355 295510 121801 70419 51382
T 30-34 2958388 2045269 913119 447291 183898 263393
R 1666468 1042180 624288 347800 128772 219028
U 1291920 1003089 288831 99491 55126 44365
T 35-39 3199768 2141568 1058200 495730 189083 306647
R 1868760 1129463 739297 391429 135870 255559
U 1331008 1012105 318903 104301 53213 51088
T 40-49 4913148 3426213 1486935 700057 284916 415141
R 2864656 1821949 1042707 557169 209328 347841
U 2048492 1604264 444228 142888 75588 67300
T 50-59 3040486 2140922 899564 455632 191593 264039
R 1843247 1198321 644926 367188 143971 223217
U 1197239 942601 254638 88444 47622 40822
T 60-69 1434192 1026247 407945 269323 129513 139810
R 976593 669346 307247 217999 100113 117886
U 457599 356901 100698 51324 29400 21924
T 70-79 445732 344305 101427 85208 49620 35588
R 304579 230367 74212 67886 38546 29340
U 141153 113938 27215 17322 11074 6248
T 80+ 115903 87677 28226 22091 12698 9393

Statistics on Women in India 2007
206
S.No. India/State/UT T/R/U Age Group Main Workers Marginal Workers
years
Persons Males Females Persons Males Females
R 74180 54870 19310 17066 9558 7508
U 41723 32807 8916 5025 3140 1885
27. Tripura T All Ages 912292 742054 170238 247269 89292 157977
R 747822 606103 141719 234625 81379 153246
U 164470 135951 28519 12644 7913 4731
T 5-9 1542 867 675 1485 693 792
R 1333 751 582 1435 674 761
U 209 116 93 50 19 31
T 10-14 7601 4459 3142 11128 5362 5766
R 6258 3939 2319 10771 5237 5534
U 1343 520 823 357 125 232
T 15-19 39252 29164 10088 32841 16621 16220
R 34995 26084 8911 31709 15877 15832
U 4257 3080 1177 1132 744 388
T 20-24 80375 64380 15995 38753 16846 21907
R 70361 55697 14664 36899 15544 21355
U 10014 8683 1331 1854 1302 552
T 25-29 121987 99064 22923 38570 14012 24558
R 103189 82121 20068 36277 12479 23798
U 18798 15943 2855 2293 1533 760
T 30-34 131921 107693 24228 29717 8766 20951
R 107299 87092 20207 27854 7587 20267
U 24622 20601 4021 1863 1179 684
T 35-39 145842 117789 28053 27566 6998 20568
R 117652 94895 22757 25970 6083 19887
U 28190 22894 5296 1596 915 681
T 40-49 200730 163554 37176 32372 7555 24817
R 156718 127380 29338 30588 6558 24030
U 44012 36174 7838 1784 997 787
T 50-59 106571 89559 17012 16943 4517 12426
R 82733 69627 13106 16150 4050 12100
U 23838 19932 3906 793 467 326
T 60-69 49095 41799 7296 10944 4258 6686
R 42978 36451 6527 10390 3877 6513
U 6117 5348 769 554 381 173
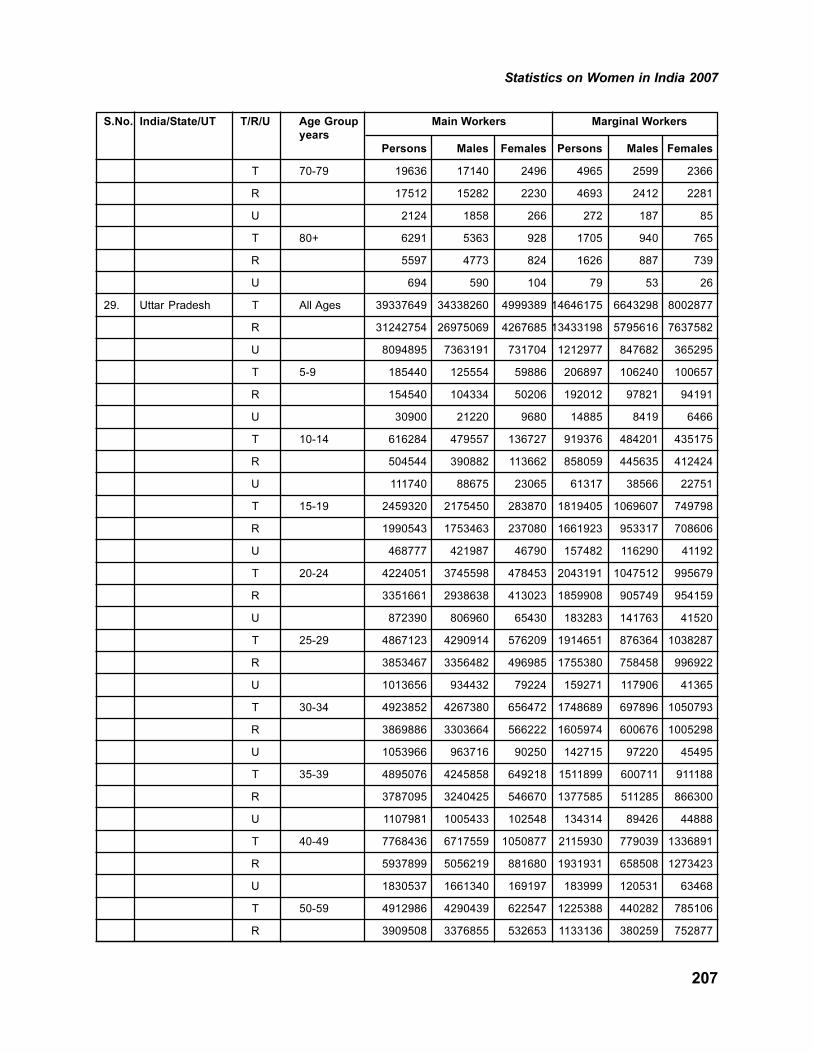
Statistics on Women in India 2007
207
S.No. India/State/UT T/R/U Age Group Main Workers Marginal Workers
years
Persons Males Females Persons Males Females
T 70-79 19636 17140 2496 4965 2599 2366
R 17512 15282 2230 4693 2412 2281
U 2124 1858 266 272 187 85
T 80+ 6291 5363 928 1705 940 765
R 5597 4773 824 1626 887 739
U 694 590 104 79 53 26
29. Uttar Pradesh T All Ages 39337649 34338260 4999389 14646175 6643298 8002877
R 31242754 26975069 4267685 13433198 5795616 7637582
U 8094895 7363191 731704 1212977 847682 365295
T 5-9 185440 125554 59886 206897 106240 100657
R 154540 104334 50206 192012 97821 94191
U 30900 21220 9680 14885 8419 6466
T 10-14 616284 479557 136727 919376 484201 435175
R 504544 390882 113662 858059 445635 412424
U 111740 88675 23065 61317 38566 22751
T 15-19 2459320 2175450 283870 1819405 1069607 749798
R 1990543 1753463 237080 1661923 953317 708606
U 468777 421987 46790 157482 116290 41192
T 20-24 4224051 3745598 478453 2043191 1047512 995679
R 3351661 2938638 413023 1859908 905749 954159
U 872390 806960 65430 183283 141763 41520
T 25-29 4867123 4290914 576209 1914651 876364 1038287
R 3853467 3356482 496985 1755380 758458 996922
U 1013656 934432 79224 159271 117906 41365
T 30-34 4923852 4267380 656472 1748689 697896 1050793
R 3869886 3303664 566222 1605974 600676 1005298
U 1053966 963716 90250 142715 97220 45495
T 35-39 4895076 4245858 649218 1511899 600711 911188
R 3787095 3240425 546670 1377585 511285 866300
U 1107981 1005433 102548 134314 89426 44888
T 40-49 7768436 6717559 1050877 2115930 779039 1336891
R 5937899 5056219 881680 1931931 658508 1273423
U 1830537 1661340 169197 183999 120531 63468
T 50-59 4912986 4290439 622547 1225388 440282 785106
R 3909508 3376855 532653 1133136 380259 752877

Statistics on Women in India 2007
208
S.No. India/State/UT T/R/U Age Group Main Workers Marginal Workers
years
Persons Males Females Persons Males Females
U 1003478 913584 89894 92252 60023 32229
T 60-69 2971311 2632277 339034 777076 339667 437409
R 2572102 2269807 302295 722714 303102 419612
U 399209 362470 36739 54362 36565 17797
T 70-79 1060688 967568 93120 237990 132912 105078
R 930097 847866 82231 220319 120018 100301
U 130591 119702 10889 17671 12894 4777
T 80+ 306334 279427 26907 68081 40014 28067
R 266963 243586 23377 62527 35908 26619
U 39371 35841 3530 5554 4106 1448
29. Uttarakhand T All Ages 2322347 1639242 683105 811689 356935 454754
R 1745562 1123925 621637 753280 312786 440494
U 576785 515317 61468 58409 44149 14260
T 5-9 3988 2475 1513 6928 3117 3811
R 3014 1787 1227 6608 2926 3682
U 974 688 286 320 191 129
T 10-14 19304 11947 7357 39963 17633 22330
R 15209 8573 6636 38382 16516 21866
U 4095 3374 721 1581 1117 464
T 15-19 123040 79899 43141 105562 50203 55359
R 98095 56631 41464 98912 44667 54245
U 24945 23268 1677 6650 5536 1114
T 20-24 256031 166900 89131 117612 56177 61435
R 197630 113159 84471 107569 47815 59754
U 58401 53741 4660 10043 8362 1681
T 25-29 304969 211907 93062 99930 45616 54314
R 228544 143219 85325 90855 38429 52426
U 76425 68688 7737 9075 7187 1888
T 30-34 302591 217626 84965 81585 34824 46761
R 220631 144636 75995 74382 29494 44888
U 81960 72990 8970 7203 5330 1873
T 35-39 306702 219917 86785 77502 31027 46475
R 220537 143779 76758 70592 26219 44373
U 86165 76138 10027 6910 4808 2102
T 40-49 490804 352228 138576 116348 44677 71671

Statistics on Women in India 2007
209
S.No. India/State/UT T/R/U Age Group Main Workers Marginal Workers
years
Persons Males Females Persons Males Females
R 354236 231809 122427 107541 38592 68949
U 136568 120419 16149 8807 6085 2722
T 50-59 307364 221640 85724 83716 32316 51400
R 231946 154275 77671 79385 29273 50112
U 75418 67365 8053 4331 3043 1288
T 60-69 145780 104913 40867 58491 27292 31199
R 124621 85951 38670 56141 25644 30497
U 21159 18962 2197 2350 1648 702
T 70-79 46247 37320 8927 18587 10966 7621
R 39330 30993 8337 17773 10367 7406
U 6917 6327 590 814 599 215
T 80+ 10602 8919 1683 3450 2242 1208
R 8522 7026 1496 3246 2094 1152
U 2080 1893 187 204 148 56
30. West Bengal T All Ages 23023583 19494971 3528612 6458107 2893073 3565034
R 16106580 13551865 2554715 5783062 2468016 3315046
U 6917003 5943106 973897 675045 425057 249988
T 5-9 39109 24376 14733 55656 26983 28673
R 25762 15755 10007 50618 24357 26261
U 13347 8621 4726 5038 2626 2412
T 10-14 345846 227402 118444 416476 218666 197810
R 266463 179823 86640 387661 202824 184837
U 79383 47579 31804 28815 15842 12973
T 15-19 1407195 1131852 275343 899221 527907 371314
R 1121390 910571 210819 819594 474380 345214
U 285805 221281 64524 79627 53527 26100
T 20-24 2363888 1984543 379345 1004227 511378 492849
R 1785618 1491431 294187 892058 432942 459116
U 578270 493112 85158 112169 78436 33733
T 25-29 3123569 2619999 503570 976582 417054 559528
R 2267804 1885694 382110 864854 342557 522297
U 855765 734305 121460 111728 74497 37231
T 30-34 3243488 2732871 510617 785590 298478 487112
R 2291566 1912057 379509 697615 244201 453414
U 951922 820814 131108 87975 54277 33698

Statistics on Women in India 2007
210
S.No. India/State/UT T/R/U Age Group Main Workers Marginal Workers
years
Persons Males Females Persons Males Females
T 35-39 3324351 2801568 522783 688447 241431 447016
R 2302786 1927409 375377 610743 197656 413087
U 1021565 874159 147406 77704 43775 33929
T 40-49 4969283 4273092 696191 847207 298811 548396
R 3272675 2792734 479941 755774 246616 509158
U 1696608 1480358 216250 91433 52195 39238
T 50-59 2691593 2360804 330789 440833 167887 272946
R 1696380 1481112 215268 398139 142704 255435
U 995213 879692 115521 42694 25183 17511
T 60-69 1044029 921135 122894 237053 120053 117000
R 745173 659801 85372 212578 104325 108253
U 298856 261334 37522 24475 15728 8747
T 70-79 308789 277513 31276 73060 47067 25993
R 223296 202619 20677 64455 41104 23351
U 85493 74894 10599 8605 5963 2642
T 80+ 133688 116112 17576 27581 14350 13231
R 89398 77906 11492 23690 11898 11792
U 44290 38206 6084 3891 2452 1439
Union Territories
31. Andaman & T All Ages 113607 97349 16258 22647 11813 10834
Nicobar Islands
R 73454 63186 10268 20598 10164 10434
U 40153 34163 5990 2049 1649 400
T 5-9 124 92 32 172 88 84
R 69 52 17 161 84 77
U 55 40 15 11 4 7
T 10-14 477 346 131 1187 656 531
R 337 232 105 1159 643 516
U 140 114 26 28 13 15
T 15-19 4340 3819 521 3422 2205 1217
R 2963 2577 386 3182 1998 1184
U 1377 1242 135 240 207 33
T 20-24 12706 11228 1478 4584 2925 1659
R 7840 6892 948 4052 2475 1577
U 4866 4336 530 532 450 82

Statistics on Women in India 2007
211
S.No. India/State/UT T/R/U Age Group Main Workers Marginal Workers
years
Persons Males Females Persons Males Females
T 25-29 17669 15145 2524 3713 2024 1689
R 10981 9395 1586 3259 1648 1611
U 6688 5750 938 454 376 78
T 30-34 17002 14205 2797 2285 1004 1281
R 10553 8825 1728 2046 825 1221
U 6449 5380 1069 239 179 60
T 35-39 17284 14094 3190 2082 763 1319
R 11049 9098 1951 1886 617 1269
U 6235 4996 1239 196 146 50
T 40-49 25071 21310 3761 2704 1015 1689
R 16285 13993 2292 2462 819 1643
U 8786 7317 1469 242 196 46
T 50-59 12879 12565 1314 1263 446 817
R 9218 8382 836 1208 404 804
U 4661 4183 478 55 42 13
T 60-69 3484 3126 358 832 430 402
R 2869 2568 301 804 410 394
U 615 558 57 28 20 8
T 70-79 1059 964 95 296 187 109
R 920 846 74 288 181 107
U 139 118 21 8 6 2
T 80+ 269 239 30 51 34 17
R 231 206 25 48 33 15
U 38 33 5 3 1 2
32. Chandigarh T All Ages 328989 277050 51939 11433 7369 4064
R 38168 34934 3234 2035 1359 676
U 290821 242116 48705 9398 6010 3388
T 5-9 465 273 192 244 137 107
R 46 26 20 58 35 23
U 419 247 172 186 102 84
T 10-14 2592 1946 646 478 320 158
R 363 292 71 82 53 29
U 2229 1654 575 396 267 129
T 15-19 18202 16443 1759 1632 1265 367
R 3691 3501 190 290 229 61

Statistics on Women in India 2007
212
S.No. India/State/UT T/R/U Age Group Main Workers Marginal Workers
years
Persons Males Females Persons Males Females
U 14511 12942 1569 1342 1036 306
T 20-24 43494 38360 5134 2527 1878 649
R 7570 7154 416 428 342 86
U 35924 31206 4718 2099 1536 563
T 25-29 55016 47234 7782 1907 1258 649
R 7875 7331 544 326 227 99
U 47141 39903 7238 1581 1031 550
T 30-34 48259 40415 7844 1239 665 574
R 6047 5506 541 240 126 114
U 42212 34909 7303 999 539 460
T 35-39 46173 37416 8757 1108 542 566
R 4706 4157 549 202 112 90
U 41467 33259 8208 906 430 476
T 40-49 69337 56177 13160 1179 591 588
R 5025 4440 585 211 113 98
U 64312 51737 12575 968 478 490
T 50-59 35896 30450 5446 542 296 246
R 1953 1728 225 98 51 47
U 33943 28722 5221 444 245 199
T 60-69 6622 5743 879 375 257 118
R 574 502 72 58 36 22
U 6048 5241 807 317 221 96
T 70-79 2183 1944 239 143 111 32
R 244 228 16 26 20 6
U 1939 1716 223 117 91 26
T 80+ 543 484 59 49 41 8
R 66 63 3 16 15 1
U 477 421 56 33 26 7
33. Dadra & Nagar
Haveli T All Ages 96184 71156 25028 17938 4679 13259
R 75016 52037 22979 16526 4218 12308
U 21168 19119 2049 1412 461 951
T 5-9 158 82 76 408 174 234
R 144 71 73 405 173 232
U 14 11 3 3 1 2

Statistics on Women in India 2007
213
S.No. India/State/UT T/R/U Age Group Main Workers Marginal Workers
years
Persons Males Females Persons Males Females
T 10-14 1822 821 1001 1886 638 1248
R 1718 748 970 1856 623 1233
U 104 73 31 30 15 15
T 15-19 9113 6086 3027 2693 929 1764
R 7505 4682 2823 2535 856 1679
U 1608 1404 204 158 73 85
T 20-24 18509 14895 3614 2763 687 2076
R 14177 10843 3334 2513 595 1918
U 4332 4052 280 250 92 158
T 25-29 18339 14778 3561 2223 497 1726
R 13423 10214 3209 1991 431 1560
U 4916 4564 352 232 66 166
T 30-34 13329 9980 3349 1805 362 1443
R 9786 6792 2994 1628 312 1316
U 3543 3188 355 177 50 127
T 35-39 11145 8005 3140 1651 332 1319
R 8598 5758 2840 1486 292 1194
U 2547 2247 300 165 40 125
T 40-49 13828 9614 4214 2260 462 1798
R 11169 7283 3886 2060 415 1645
U 2659 2331 328 200 47 153
T 50-59 6754 4680 2074 1374 323 1051
R 5701 3771 1930 1239 279 960
U 1053 909 144 135 44 91
T 60-69 2605 1781 824 716 219 497
R 2296 1513 783 671 195 476
U 309 268 41 45 24 21
T 70-79 445 330 115 127 45 82
R 387 280 107 112 37 75
U 58 50 8 15 8 7
T 80+ 108 79 29 27 9 18
R 90 64 26 26 8 18
U 18 15 3 1 1 0
34. Daman & Diu T All Ages 67522 58874 8648 5269 1695 3574
R 48455 43747 4708 4025 1271 2754

Statistics on Women in India 2007
214
S.No. India/State/UT T/R/U Age Group Main Workers Marginal Workers
years
Persons Males Females Persons Males Females
U 19067 15127 3940 1244 424 820
T 5-9 39 28 11 28 14 14
R 20 15 5 20 8 12
U 19 13 6 8 6 2
T 10-14 518 352 166 144 62 82
R 412 294 118 114 45 69
U 106 58 48 30 17 13
T 15-19 7240 6376 864 733 348 385
R 6168 5552 616 598 281 317
U 1072 824 248 135 67 68
T 20-24 16289 15285 1004 964 471 493
R 13616 13019 597 760 365 395
U 2673 2266 407 204 106 98
T 25-29 13242 12073 1169 798 255 543
R 9844 9204 640 624 197 427
U 3398 2869 529 174 58 116
T 30-34 9169 7941 1228 600 131 469
R 6088 5403 685 434 86 348
U 3081 2538 543 166 45 121
T 35-39 7006 5776 1230 517 87 430
R 4491 3815 676 375 60 315
U 2515 1961 554 142 27 115
T 40-49 8077 6476 1601 732 143 589
R 4688 3914 774 552 103 449
U 3389 2562 827 180 40 140
T 50-59 3989 3061 928 431 88 343
R 2051 1638 413 313 62 251
U 1938 1423 515 118 26 92
T 60-69 1548 1179 369 233 61 172
R 850 698 152 168 37 131
U 696 481 217 65 24 41
T 70-79 308 244 64 74 28 46
R 164 138 26 57 23 34
U 144 106 38 17 5 12
T 80+ 76 63 13 13 7 6

Statistics on Women in India 2007
215
S.No. India/State/UT T/R/U Age Group Main Workers Marginal Workers
years
Persons Males Females Persons Males Females
R 46 40 6 8 4 4
U 30 23 7 5 3 2
35. Lakshadweep T All Ages 11710 10288 1422 3644 2916 728
R 5895 5212 683 2112 1772 340
U 5815 5076 739 1532 1144 388
T 5-9 3 2 1 3 2 1
R 2 1 1 2 1 1
U 1 1 0 1 1 0
T 10-14 9 8 1 12 11 1
R 4 3 1 7 7 0
U 5 5 0 5 4 1
T 15-19 154 145 9 229 189 40
R 83 81 2 139 119 20
U 71 64 7 90 70 20
T 20-24 959 846 113 685 547 138
R 486 437 49 401 330 71
U 473 409 64 284 217 67
T 25-29 1482 1269 213 745 616 129
R 710 612 98 443 374 69
U 772 657 115 302 242 60
T 30-34 1740 1500 240 529 431 98
R 871 756 115 325 279 46
U 869 744 125 204 152 52
T 35-39 1920 1636 284 344 254 90
R 990 846 144 213 166 47
U 930 790 140 131 88 43
T 40-49 3173 2754 419 443 315 128
R 1623 1408 215 247 201 46
U 1550 1346 204 196 114 82
T 50-59 1919 1793 126 334 261 73
R 963 911 52 168 141 27
U 956 882 74 166 120 46
T 60-69 290 279 11 259 233 26
R 138 134 4 134 125 9
U 152 145 7 125 108 17

Statistics on Women in India 2007
216
S.No. India/State/UT T/R/U Age Group Main Workers Marginal Workers
years
Persons Males Females Persons Males Females
T 70-79 46 42 4 50 48 2
R 16 15 1 25 23 2
U 30 27 3 25 25 0
T 80+ 9 9 0 7 7 0
R 5 5 0 5 5 0
U 4 4 0 2 2 0
36. Pondicherry T All Ages 317367 245205 72162 25288 13465 11823
R 113453 82135 31318 14313 6851 7462
U 203914 163070 40844 10975 6614 4361
T 5-9 183 118 65 63 29 34
R 59 33 26 21 10 11
U 124 85 39 42 19 23
T 10-14 1360 883 477 298 163 135
R 439 282 157 117 41 76
U 921 601 320 181 122 59
T 15-19 15678 10947 4731 2476 1491 985
R 6617 4342 2275 1325 728 597
U 9061 6605 2456 1151 763 388
T 20-24 34599 26738 7861 3507 2237 1270
R 13414 9923 3491 1763 1046 717
U 21185 16815 4370 1744 1191 553
T 25-29 47515 37290 10225 3766 2088 1678
R 16881 12297 4584 1959 947 1012
U 30634 24993 5641 1807 1141 666
T 30-34 47753 37393 10360 3155 1583 1572
R 16016 11757 4259 1733 747 986
U 31737 25636 6101 1422 836 586
T 35-39 48801 36966 11835 3169 1410 1759
R 17008 11892 5116 1880 739 1141
U 31793 25074 6719 1289 671 618
T 40-49 68140 53295 14845 4161 2021 2140
R 22693 16536 6157 2554 1135 1419
U 45447 36759 8688 1607 886 721
T 50-59 35767 28137 7630 2507 1209 1298
R 12322 8994 3328 1585 717 868

Statistics on Women in India 2007
217
S.No. India/State/UT T/R/U Age Group Main Workers Marginal Workers
years
Persons Males Females Persons Males Females
U 23445 19143 4302 922 492 430
T 60-69 12993 9842 3151 1640 898 742
R 5919 4381 1538 1044 534 510
U 7074 5461 1613 596 364 232
T 70-79 3558 2812 746 458 288 170
R 1656 1352 304 283 181 102
U 1902 1460 442 175 107 68
T 80+ 816 637 179 77 42 35
R 386 315 71 43 22 21
U 430 322 108 34 20 14
Source: India, Registrar General and Census Commissioner. (2005). Child Labour, Women Labour and
Labour : Census of India 2001 : Compact disc. New Delhi.

Statistics on Women in India 2007
218
The proportion of main workers to total population in the Census of India 2001 is given
in Table 88.
Table 88: Proportion of Main Workers to Total Population, (%), 2001
S. No. India/State/ UT T/R/U Proportion of Main Workers to
Total Population 2001 Census (%)
Persons Males Females
1 2 3 4 5 6
India Total 30.43 45.13 14.68
Rural 30.87 44.31 16.65
Urban 29.29 47.19 9.42
Andhra Pradesh Total 38.11 50.50 25.44
Rural 41.48 51.78 30.99
Urban 29.14 47.10 10.52
Arunachal Pradesh Total 37.80 46.11 28.50
Rural 39.08 45.55 32.00
Urban 32.90 48.12 14.33
Assam Total 26.69 42.45 9.82
Rural 26.06 41.26 9.97
Urban 30.92 50.22 8.79
Bihar Total 25.37 40.49 8.91
Rural 25.72 40.84 9.38
Urban 22.35 37.66 4.70
Chhattisgarh Total 33.86 45.28 22.31
Rural 35.34 45.47 25.26
Urban 27.97 44.57 10.16
Delhi Total 31.17 49.88 8.38
Rural 28.97 46.08 7.83
Urban 31.33 50.16 8.44
Goa Total 31.56 47.58 14.89
Rural 30.26 45.24 15.11
Urban 32.87 49.88 14.66

Statistics on Women in India 2007
219
S. No. India/State/ UT T/R/U Proportion of Main Workers to
Total Population 2001 Census (%)
Persons Males Females
1 2 3 4 5 6
Gujarat Total 33.60 51.09 14.60
Rural 35.02 50.31 18.83
Urban 31.23 52.35 7.23
Haryana Total 29.52 43.41 13.38
Rural 30.07 42.54 15.67
Urban 28.16 45.52 7.66
Himachal Pradesh Total 32.31 43.18 21.09
Rural 32.08 42.18 21.87
Urban 34.42 51.45 12.99
Jammu & Kashmir Total 25.72 41.54 7.98
Rural 24.42 39.22 8.29
Urban 29.64 48.22 6.98
Jharkhand Total 23.92 36.98 10.05
Rural 24.37 36.72 11.52
Urban 22.38 37.83 4.62
Karnataka Total 36.64 51.66 21.07
Rural 38.59 52.10 24.75
Urban 32.86 50.83 13.78
Kerala Total 25.87 41.77 10.85
Rural 25.44 40.84 10.90
Urban 27.08 44.40 10.71
Madhya Pradesh Total 31.65 44.70 17.46
Rural 33.30 45.10 20.56
Urban 27.09 43.61 8.70
Maharashtra Total 35.87 48.44 22.23
Rural 39.18 47.54 30.47
Urban 31.37 49.62 10.47

Statistics on Women in India 2007
220
S. No. India/State/ UT T/R/U Proportion of Main Workers to
Total Population 2001 Census (%)
Persons Males Females
1 2 3 4 5 6
Manipur Total 30.43 39.27 21.39
Rural 31.10 39.61 22.29
Urban 28.58 38.30 18.95
Meghalaya Total 32.65 41.30 23.74
Rural 33.60 41.54 25.41
Urban 28.73 40.30 16.95
Mizoram Total 40.79 49.10 31.91
Rural 45.04 51.85 37.67
Urban 36.47 46.28 26.13
Nagaland Total 35.38 40.57 29.61
Rural 36.93 40.59 32.93
Urban 27.90 40.46 12.75
Orissa Total 26.05 42.90 8.73
Rural 25.80 42.40 8.98
Urban 27.50 45.59 7.29
Punjab Total 32.17 49.49 12.39
Rural 32.60 48.86 14.34
Urban 31.32 50.69 8.50
Rajasthan Total 30.86 43.65 16.97
Rural 32.25 43.57 20.08
Urban 26.30 43.90 6.51
Sikkim Total 39.36 50.80 26.30
Rural 39.64 50.70 27.08
Urban 37.16 51.54 19.83
Tamil Nadu Total 38.07 51.92 24.04
Rural 40.92 51.56 30.20
Urban 34.45 52.38 16.18

Statistics on Women in India 2007
221
S. No. India/State/ UT T/R/U Proportion of Main Workers to
Total Population 2001 Census (%)
Persons Males Females
1 2 3 4 5 6
Tripura Total 28.52 45.19 10.93
Rural 28.18 44.45 10.99
Urban 30.14 48.80 10.67
Uttar Pradesh Total 23.67 39.21 6.36
Rural 23.73 39.01 6.83
Urban 23.44 40.00 4.54
Uttarakhand Total 27.36 37.89 16.41
Rural 27.66 35.74 19.64
Urban 26.47 43.62 6.16
West Bengal Total 28.72 47.01 9.12
Rural 27.89 45.76 9.08
Urban 30.84 50.15 9.21
Union Territories
Andaman &
Nicobar Islands Total 31.90 50.45 9.96
Rural 30.61 49.00 9.25
Urban 34.56 53.37 11.48
Chandigarh Total 36.53 54.65 13.19
Rural 41.43 61.49 9.16
Urban 35.97 53.79 13.59
Dadra & Nagar Haveli Total 43.62 58.48 25.33
Rural 44.12 56.67 29.39
Urban 41.95 64.08 9.93
Daman & Diu Total 42.68 63.64 13.16
Rural 48.04 68.78 12.64
Urban 33.25 52.33 13.85
Lakshadweep Total 19.31 33.05 4.82
Rural 17.50 30.32 4.14
Urban 21.56 36.41 5.67
Pondicherry Total 32.57 50.35 14.81
Rural 34.83 50.17 19.33
Urban 31.44 50.45 12.55
Source: India, Ministry of Health and Family Welfare, Central Bureau of Health Inteligence. (2006). Health
Information of India 2005. New Delhi. P. 13-15.

Statistics on Women in India 2007
222
Employment of women in the organized sector in the States and Union Territories is
given in Table 89 .
Table 89: Employment of Women in the Organised Sector State-wise, 2005
S. No. India/State/UTs Employment of Women Employment of Women(in thousands) (in thousands)as on 31.3.2004 as on 31.3.2005
Public Private Total Public Private Total
Sector Sector Sector Sector
India 2890.0 2044.4 4934.4 2921.0 2095.2 5016.2
1. Andhra Pradesh 248.0 228.9 241.8 241.8 231.8 473.6
2. Arunachal Pradesh - - - - - -
3. Assam 77.3 255.6 332.9 81.7 284.9 366.6
4. Bihar 29.5 2.0 31.5 29.5 2.0 31.5
5. Chhattisgarh 37.5 4.5 42.0 36.9 5.0 41.8
6. Delhi 92.4 32.9 125.3 92.6 32.9 125.5
7. Goa 5.4 4.8 13.3 13.3 9.0 22.2
8. Gujarat 135.5 82.0 217.5 144.7 90.2 234.9
9. Haryana 60.8 37.4 98.3 60.7 38.2 98.9
10. Himachal Pradesh 40.6 6.3 46.9 44.4 7.5 52.0
11. Jammu & Kashmir 20.7 1.9 22.6 20.7 1.9 22.6
12. Jharkhand 61.8 13.7 75.5 61.8 13.7 75.5
13. Karnataka 266.8 297.6 268.4 268.4 309.9 578.3
14. Kerala 186.8 308.8 187.6 187.6 262.0 449.7
15. Madhya Pradesh 122.1 19.5 141.5 124.0 19.2 143.3
16. Maharashtra 356.5 204.4 357.7 357.7 215.4 573.1
17. Manipur 18.0 1.0 18.9 18.0 1.0 18.9
18. Meghalaya 15.0 4.4 19.3 15.0 4.4 19.3
19. Mizoram 10.4 0.6 11.0 10.4 0.6 11.0
20. Nagaland 12.3 1.4 13.7 12.4 1.4 13.9
21. Orissa 95.3 10.5 105.7 98.1 10.5 108.6
22. Punjab 98.4 37.2 135.5 89.8 39.1 128.9
23. Rajasthan 131.4 39.7 171.1 138.1 40.8 179.0
24. Sikkim - - - - - -
25. Tamil Nadu 418.7 273.5 419.8 419.8 288.3 708.1
26. Tripura 21.0 5.8 26.9 21.0 5.8 26.9
27. Uttar Pradesh 168.6 50.4 219.0 171.1 50.1 221.2
28. Uttarakhand 27.4 4.9 32.7 29.1 4.9 34.0
29. West Bengal 105.9 104.4 210.3 106.4 113.6 220.0
Union Territories
30. Andaman & Nicobar Islands 5.6 0.2 5.7 5.7 0.2 5.9
31. Chandigarh 13.5 6.4 19.9 13.4 6.5 19.9
32. Dadra & Nagar Haveli - - - - - -
33. Daman & Diu 0.3 1.0 0.3 0.3 1.0 1.3
34. Lakshadweep - - - - - -
35. Pondicherry 6.4 2.8 6.5 6.5 3.3 9.8
Source: India, Ministry of Labour, Directorate General of Employment and Training. (2004). Employment
Review Jan-Mar. 2005. P. 25.

Statistics on Women in India 2007
223
The number of women employed in various sectors and industries in the organized
sectors is given in Table 90.
Table 90: Women’s Employment in the Organised Sector by Major
Industry Divisions, as on 31.03.2004 and 31.03.2005
S. Division & Industry Women Employees Women EmployeesNo. (in Thousands) (in Thousands)
as on 31-03-2004 as on 31-03-2005
Public Private Total Public Private TotalSector Sector Sector Sector
1. Agriculture, Hunting, Forestry & Fishing (0) 47.7 411.0 458.7 53.7 430.5 484.1
2. Mining and Quarrying (1) 66.0 7.3 73.3 65.0 12.4 77.4
3. Manufacturing (2 & 3) 81.5 867.9 949.3 80.0 859.3 939.3
4. Electricity, Gas & Water (4) 49.7 2.4 52.1 50.5 2.5 53.0
5. Construction (5) 62.6 3.4 66.0 63.6 3.4 67.0
6. Wholesale & Retail Trade & Restaurants 14.0 32.0 46.0 14.3 35.3 49.6
and Hotels (6)
7. Transport, Storage & Communications (7) 179.0 10.4 189.4 181.1 10.5 191.6
8. Financing, Insurance, Real Estate & 206.0 81.2 287.3 207.9 94.3 302.2
Business Services (8)
9. Community, Social & Personal Services (9) 2183.6 628.8 2812.3 2205.0 647.1 2852.1
Total 2890.0 2044.4 4934.4 2921.0 2095.2 5016.2
Notes : Figures in brackets are industrial codes of National Industrial Classification.
Source: India, Ministry of Labour, Directorate General Employment and Training. (2006).
Employment Review January – March 2004. New Delhi. P. 26.
Women’s employment in the public and private organized sector is given in Table 91.
Table 91: Women’s Employment in the Organised Sector (Public and
Private) as on 31.03.2004
S.No. Sector Employment (in Thousands) Women to
as on 31st March Total Persons
Employed (%)
2001 2004 2004
1. Public 2859.2 2890.0 15.9
2. Private 2090.1 2044.4 24.8
Total 4949.3 4934.4 18.7
Source : India, Ministry of Labour, Directorate General Employment and Training. (2006).
Employment Review January – March 2004. New Delhi. P. 26.
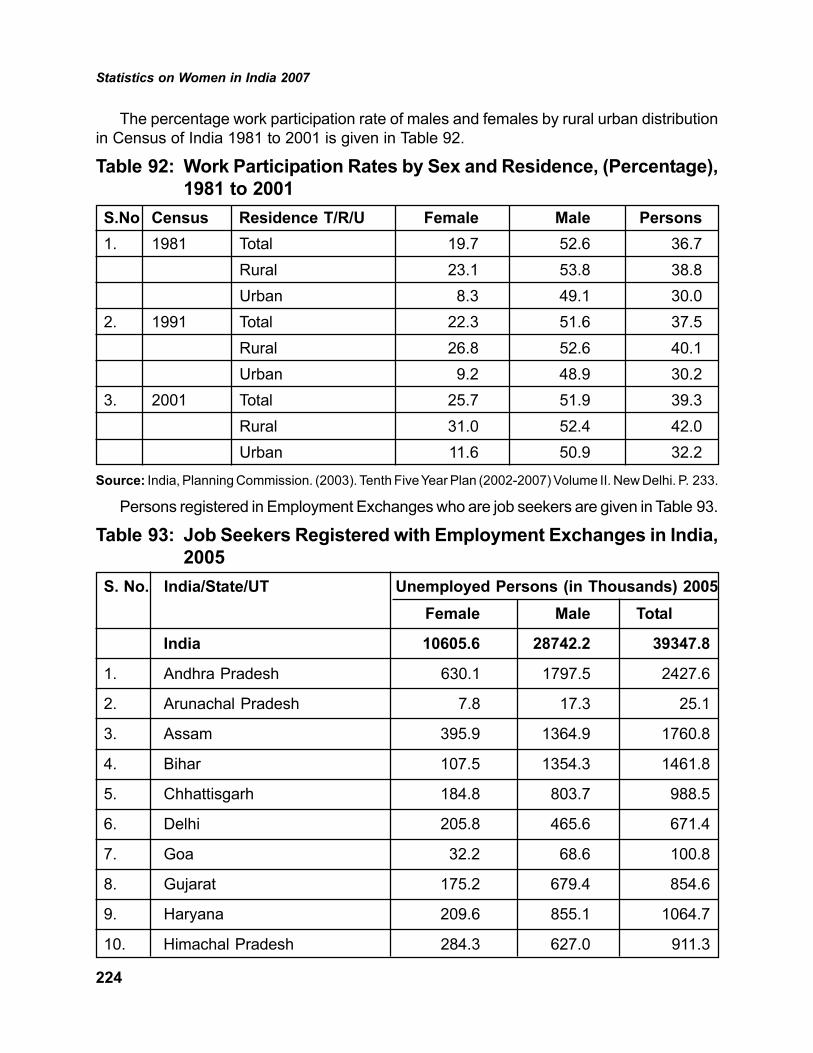
Statistics on Women in India 2007
224
The percentage work participation rate of males and females by rural urban distribution
in Census of India 1981 to 2001 is given in Table 92.
Table 92: Work Participation Rates by Sex and Residence, (Percentage),
1981 to 2001
S.No Census Residence T/R/U Female Male Persons
1. 1981 Total 19.7 52.6 36.7
Rural 23.1 53.8 38.8
Urban 8.3 49.1 30.0
2. 1991 Total 22.3 51.6 37.5
Rural 26.8 52.6 40.1
Urban 9.2 48.9 30.2
3. 2001 Total 25.7 51.9 39.3
Rural 31.0 52.4 42.0
Urban 11.6 50.9 32.2
Source: India, Planning Commission. (2003). Tenth Five Year Plan (2002-2007) Volume II. New Delhi. P. 233.
Persons registered in Employment Exchanges who are job seekers are given in Table 93.
Table 93: Job Seekers Registered with Employment Exchanges in India,
2005
S. No. India/State/UT Unemployed Persons (in Thousands) 2005
Female Male Total
India 10605.6 28742.2 39347.8
1. Andhra Pradesh 630.1 1797.5 2427.6
2. Arunachal Pradesh 7.8 17.3 25.1
3. Assam 395.9 1364.9 1760.8
4. Bihar 107.5 1354.3 1461.8
5. Chhattisgarh 184.8 803.7 988.5
6. Delhi 205.8 465.6 671.4
7. Goa 32.2 68.6 100.8
8. Gujarat 175.2 679.4 854.6
9. Haryana 209.6 855.1 1064.7
10. Himachal Pradesh 284.3 627.0 911.3

Statistics on Women in India 2007
225
S. No. India/State/UT Unemployed Persons (in Thousands) 2005
Female Male Total
11. Jammu & Kashmir 17.5 98.5 116.0
12. Jharkhand 135.1 1073.8 1208.9
13. Karnataka 326.2 992.1 1318.3
14. Kerala 2106.9 1521.7 3628.6
15. Madhya Pradesh 403.0 1757.9 2160.9
16. Maharashtra 826.7 3165.1 3991.8
17. Manipur 138.9 393.4 532.3
18. Meghalaya 15.3 22.7 38.0
19. Mizoram 12.4 22.0 34.4
20. Nagaland 12.7 31.6 44.3
21. Orissa 189.8 643.4 833.2
22. Punjab 128.4 334.7 463.1
23. Rajasthan 100.7 692.9 793.6
24. Sikkim1 - - -
25. Tamil Nadu 1528.9 2152.3 3681.2
26. Tripura 146.3 253.4 399.7
27. Uttar Pradesh 179.1 1692.2 1871.3
28. Uttarakhand 61.2 317.7 378.9
29. West Bengal 1934.9 5357.0 7291.9
Union Territories
30. Andaman & Nicobar Islands 12.9 26.1 39.0
31. Chandigarh 13.6 42.4 56.0
32. Dadra & Nagar Haveli 1.9 4.6 6.5
33. Daman & Diu 2.9 7.7 10.6
34. Lakshadweep 3.5 7.7 11.2
35. Pondicherry 73.6 97.8 171.4
Note : 1 No employment exchange is functioning in Sikkim.
Directorate General of Employment and Training, Ministry of Labour.
Source: India, Ministry of Statistics and Programme Implementation, Central Statistical Organisation.
(2007). Women & Men in India 2006. New Delhi. P. 53.
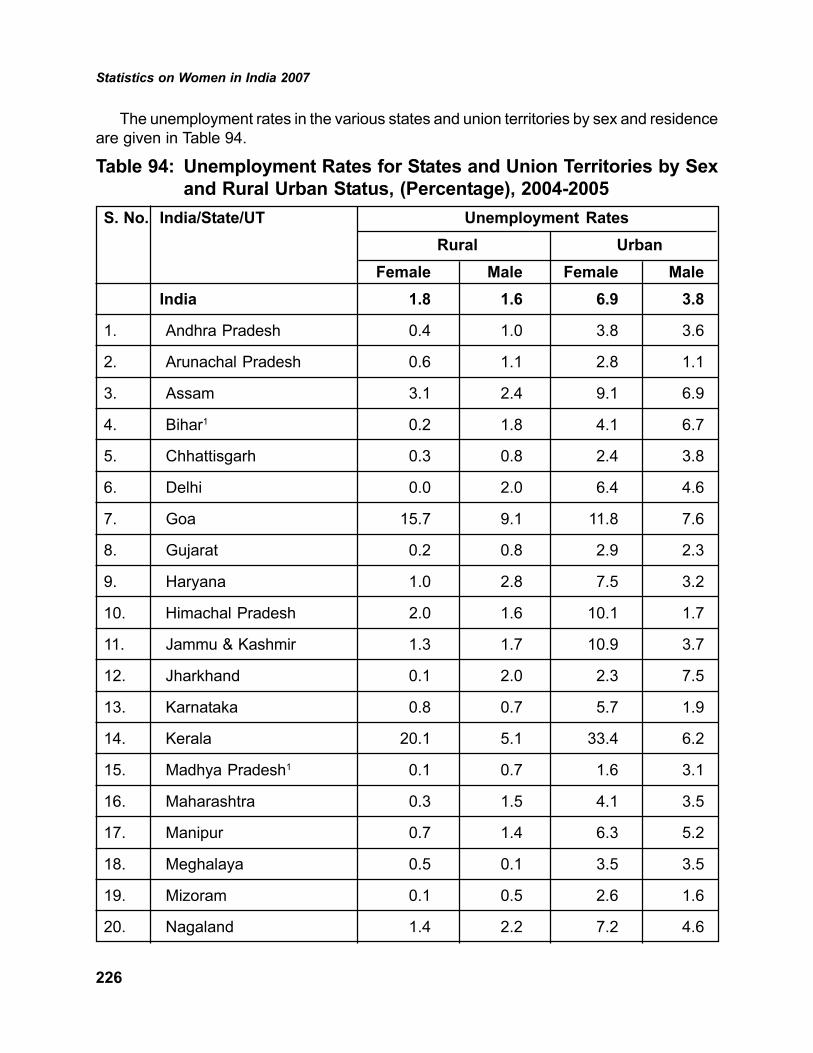
Statistics on Women in India 2007
226
The unemployment rates in the various states and union territories by sex and residence
are given in Table 94.
Table 94: Unemployment Rates for States and Union Territories by Sex
and Rural Urban Status, (Percentage), 2004-2005
S. No. India/State/UT Unemployment Rates
Rural Urban
Female Male Female Male
India 1.8 1.6 6.9 3.8
1. Andhra Pradesh 0.4 1.0 3.8 3.6
2. Arunachal Pradesh 0.6 1.1 2.8 1.1
3. Assam 3.1 2.4 9.1 6.9
4. Bihar1 0.2 1.8 4.1 6.7
5. Chhattisgarh 0.3 0.8 2.4 3.8
6. Delhi 0.0 2.0 6.4 4.6
7. Goa 15.7 9.1 11.8 7.6
8. Gujarat 0.2 0.8 2.9 2.3
9. Haryana 1.0 2.8 7.5 3.2
10. Himachal Pradesh 2.0 1.6 10.1 1.7
11. Jammu & Kashmir 1.3 1.7 10.9 3.7
12. Jharkhand 0.1 2.0 2.3 7.5
13. Karnataka 0.8 0.7 5.7 1.9
14. Kerala 20.1 5.1 33.4 6.2
15. Madhya Pradesh1 0.1 0.7 1.6 3.1
16. Maharashtra 0.3 1.5 4.1 3.5
17. Manipur 0.7 1.4 6.3 5.2
18. Meghalaya 0.5 0.1 3.5 3.5
19. Mizoram 0.1 0.5 2.6 1.6
20. Nagaland 1.4 2.2 7.2 4.6

Statistics on Women in India 2007
227
S. No. India/State/UT Unemployment Rates
Rural Urban
Female Male Female Male
21. Orissa 8.3 3.1 26.6 9.0
22. Punjab 4.9 3.3 14.0 2.9
23. Rajasthan 0.1 1.2 2.9 2.8
24. Sikkim 1.5 2.8 4.3 3.6
25. Tamil Nadu 1.1 1.2 4.8 2.9
26. Tripura 32.0 9.6 56.8 16.6
27. Uttar Pradesh1 0.3 0.7 2.5 3.5
28. Uttarakhand 0.4 2.0 10.2 4.2
29. West Bengal 3.3 2.2 8.4 5.6
Union Territories
30. Andaman & Nicobar Islands 12.3 3.7 17.2 6.5
31. Chandigarh 4.8 2.5 7.5 3.1
32. Dadra & Nagar Haveli 3.6 3.1 9.1 1.3
33. Daman & Diu 0.0 0.4 3.3 2.8
34. Lakshadweep 57.1 0.9 51.5 11.1
35. Pondicherry 3.2 9.4 19.5 4.1
Note: Figures relate to usual status of individuals. The figures represent size of unemployment as
percentage of labour force.
1. Figure is for undivided state.The states of Bihar, Madhya Pradesh and Uttar Pradesh here
include the newly constituted states of Jharkhand, Chhattisgarh and Uttarakhand respectively.
National Sample Survey Organization, 61st Round (July 2004 – June 2005)
Source: India, Ministry of Statistics and Programme Implementation, Central Statistical Organisation.
(2007). Women and Men in India 2006. New Delhi. P. 52.

Statistics on Women in India 2007
228
Poverty line is defined as the number of rupees required to purchase the amount of
food required for subsistence level. It is defined as Rs.328 per person per month for India,
and it ranges from Rs.263 in Andhra Pradesh to Rs.375 in Kerala. The normal family size
is 5.2 persons per family. Persons below the poverty line, and state specific poverty line for
2000 is given in Table 95.
Table 95: Population below Poverty Line in India, and State Specific
Poverty Line, 1999-2000.
S. India/ States/Union State Specific Poverty 1999-2000
No Territories Poverty Line Rural Urban Total
1999-2000 (Per No. of Persons No. of Persons No. of Persons
Capita Per Persons (%) Persons (%) Persons (%)
Month) (Rs.) # (in lakhs) (in lakhs) (in lakhs)
Rural Urban
India 327.56 454.11 1932.43 27.09 670.07 23.62 2602.50 26.10
1. Andhra Pradesh 262.94 457.40 58.13 11.05 60.88 26.63 119.01 15.77
2. Arunachal Pradesh - - 3.80 40.04 0.18 7.47 3.98 33.47
3. Assam 365.43 343.99 92.17 40.04 2.38 7.47 94.55 36.09
4. Bihar1 333.07 379.78 376.51 44.30 49.13 32.91 425.64 42.60
5. Chhattisgarh - -
6. Delhi 362.68 505.45 0.07 0.40 11.42 9.42 11.49 8.23
7. Goa - - 0.11 1.35 0.59 7.52 0.70 4.40
8. Gujarat 318.94 474.41 39.80 13.17 28.09 15.59 67.89 14.07
9. Haryana 362.81 420.20 11.94 8.27 5.39 9.99 17.34 8.74
10. Himachal Pradesh 367.45 420.20 4.84 7.94 0.29 4.63 5.12 7.63
11. Jammu & Kashmir - - 2.97 3.97 0.49 1.98 3.46 3.48
12. Jharkhand - -
13. Karnataka 309.59 511.44 59.91 17.38 44.49 25.25 104.40 20.04
14. Kerala 374.79 477.06 20.97 9.38 20.07 20.27 41.04 12.72
15. Madhya Pradesh1 311.34 481.65 217.32 37.06 81.22 38.44 298.54 37.43
16. Maharashtra 318.63 539.71 125.12 23.72 102.87 26.81 227.99 25.02
17. Manipur - - 6.53 40.04 0.66 7.47 7.19 28.54
18. Meghalaya - - 7.89 40.04 0.34 7.47 8.23 33.87
19. Mizoram - - 1.40 40.04 0.45 7.47 1.85 19.47

Statistics on Women in India 2007
229
S. India/ States/Union State Specific Poverty 1999-2000
No Territories Poverty Line Rural Urban Total
1999-2000 (Per No. of Persons No. of Persons No. of Persons
Capita Per Persons (%) Persons (%) Persons (%)
Month) (Rs.) # (in lakhs) (in lakhs) (in lakhs)
Rural Urban
20. Nagaland - - 5.21 40.04 0.28 7.47 5.49 32.67
21. Orissa 323.92 473.12 143.69 48.01 25.40 42.83 169.09 47.15
22. Punjab 362.68 388.15 10.20 6.35 4.29 5.75 14.49 6.16
23. Rajasthan 344.03 465.92 55.06 13.74 26.78 19.85 81.83 15.28
24. Sikkim - - 2.00 40.04 0.04 7.47 2.05 36.55
25. Tamil Nadu 307.64 475.60 80.51 20.55 49.97 22.11 130.48 21.12
26. Tripura - - 12.53 40.04 0.49 7.47 13.02 34.44
27. Uttarakhand - -
28. Uttar Pradesh1 336.88 416.29 412.01 31.22 117.88 30.89 529.89 31.15
29. West Bengal 350.17 409.22 180.11 31.85 33.38 14.86 213.49 27.02
Union Territories
30. Andaman & - - 0.58 20.55 0.24 22.11 0.82 20.99
Nicobar Islands
31. Chandigarh - - 0.06 5.75 0.45 5.75 0.51 5.75
32. Dadra & Nagar - - 0.30 17.57 0.03 13.52 0.33 17.14
Haveli
33. Daman & Diu - - 0.01 1.35 0.05 7.52 0.06 4.44
34. Lakshadweep - - 0.03 9.38 0.08 20.27 0.11 15.60
35. Pondicherry - - 0.64 20.55 1.77 22.11 2.41 21.67
Note: Planning Commission. Data for 1999 – 2000 relates to NSSO 55th Round.
1. Data for the years prior to 2001 for the states of Bihar, Madhya Pradesh and Uttar Pradesh includes
the data of newly created states namely Jharkhand, Chhattisgarh and Uttrakhand respectively.
2. Poverty ratio of Assam is used for North Eastern States; of Tamil Nadu is used for Andaman &
Nicobar Islands and Pondicherry; of Kerala for Lakshadweep; urban poverty ratio of Punjab is used
for Chandigarh; of Goa is used for Daman & Diu. Urban poverty ratio of Rajasthan is tentative.
3. Poverty line of Himachal Pradesh and expenditure of Jammu and Kashmir (J&K) is used to estimate
poverty ratio of J&K; poverty line of Maharashtra and expenditure of Goa and Dadra & Nagar Haveli
is used to estimate poverty ratio of Goa and Dadra & Nagar Haveli.
Source:# India, Ministry of Health and Family Welfare, Central Bureau of Health Intelligence. (2006). National
Health Profile 2005. New Delhi. P.28.
India, Ministry of Statistics and Programme Implementation, Central Statistical Organisation. (2007).
Selected Socio-Economic Statistics India 2006. New Delhi. P.154.

Statistics on Women in India 2007
230
The number of homeless persons and homeless households is given in Table 96.
Table 96: Number of Homeless Households and Homeless Persons by
Sex and Rural Urban Residence, 2001
S. India/State City/Town Homeless Number of Homeless Persons 2001No. Persons in Homeless
City/ Town House-2001 holds 2001
Male Female Person
India* 447585 1136496 807270 1943766
Rural* 259775 634152 531015 1165167
Urban* 187810 502344 276255 778599
1. Andhra Pradesh Hyderabad 13638 163938
2. Arunachal Pradesh 442
3. Assam 13355
4. Bihar Patna 5624 42498
5. Chhattisgarh 28772
6. Delhi Delhi 21895 24966
Municipal
Corporation
(Urban)
7. Goa 5280
8. Gujarat Ahmedabad 7787 220786
Surat 22307
Vadodara 7638
9. Haryana Faridabad 1446 59360
10. Himachal Pradesh 8364
11. Jammu & Kashmir 12751
12. Jharkhand 10887
13. Karnataka Bangalore 12104 102226
14. Kerala 16533
15. Madhya Pradesh Bhopal 5895 231246
Indore 4885
16. Maharashtra Greater Mumbai 39074 340924
Nashik 2995
Kalyan-Dombivli 2751
Thane 2610

Statistics on Women in India 2007
231
S. India/State City/Town Homeless Number of Homeless Persons 2001No. Persons in Homeless
City/ Town House-2001 holds 2001
Male Female Person
Pune 2565
Nagpur 2225
Pimpri 548
Chinchwad
17. Manipur 2607
18. Meghalaya 1827
19. Mizoram 336
20. Nagaland 2002
21. Orissa 42871
22. Punjab Ludhiana 4590 46958
23. Rajasthan Jaipur 8529 143497
24. Sikkim 286
25. Tamil Nadu Chennai 27329 86472
26. Tripura 857
27. Uttarakhand 14703
28. Uttar Pradesh Lucknow 7469 201029
Kanpur 26305
Agra 1942
Varanasi 1711
Meerut 3427
29. West Bengal Kolkata 67676 110535
Haora 2443
Union Territories
30. Andaman &
Nicobar Islands 242
31. Chandigarh 2722
32. Dadra & Nagar 1471
Haveli
33. Daman & Diu 1071
34. Lakshadweep -
35. Pondicherry 1662
Source: 1. *India, Ministry of Statistics and Programme Implementation, Central Statistical Organisation.
(2007). Selected Socio-Economic Statistics India 2006. New Delhi. P.136.
1. The Economic Times, 26.12.2006. P.14.

Statistics on Women in India 2007
232
The per capita net state domestic product (NSDP) at current prices (per capita income)
is given in Table 97.
Table 97: Per Capita Net State Domestic Product at Current Prices,
2003-05
S.No India/State/Union Territory Per Capita Income Per Capita Income
2002-03 (Rs.) 2004-05 (Rs.)
India 19040 23241
1. Andhra Pradesh 19087 23153
2. Arunachal Pradesh 15589 -
3. Assam 12247 13633
4. Bihar 5683 6327
5. Chhattisgarh 12244 -
6. Delhi 47441 -
7. Goa 57432 -
8. Gujarat 22838 -
9. Haryana 26818 32712
10. Himachal Pradesh 22902 27486
11. Jammu & Kashmir 14507 16126
12. Jharkhand 11139 13013
13. Karnataka 19865 -
14. Kerala 22776 27048
15. Madhya Pradesh 11483 14626
16. Maharashtra 26291 -
17. Manipur 13658 -
18. Meghalaya 16803 19572
19. Mizoram 22207 -
20. Nagaland 20746 -
21. Orissa 10208 13026
22. Punjab 26395 30701
23. Rajasthan 12745 15673
24. Sikkim 20013 24115
25. Tamil Nadu 21740 25965
26. Tripura 18676 -
27. Uttarakhand 14934 -
28. Uttar Pradesh 9963 11477
29. West Bengal 18549 -
Union Territories
30. Andaman & Nicobar Islands 28340 -
31. Chandigarh 53886 67370
32. Dadra & Nagar Haveli - -
33. Daman & Diu - -
34. Lakshadweep - -
35. Pondicherry 45431 56034
Source: India, Ministry of Health and Family Welfare, Central Bureau of Health Intelligence. (2006). National
Health Profile 2005. New Delhi. P.29.

Statistics on Women in India 2007
233
To increase employment among women, several initiatives have been taken by
Government of India, and programmes have been launched for the economic empowerment
of women. Some of these are Swawlamban, STEP and Hostels for Working Women, with
day care centres for their children.
Swawlamban
The Swawlamban programme, previously also called Women’s Economic Programme
and NORAD scheme, was launched in 1982-83 with assistance from the Norwegian Agency
for Development Cooperation (NORAD) to provide training and skills to women to facilitate
them to obtain employment or self-employment. The target group under the scheme are
poor and needy women and women from weaker sections of society, such as scheduled
castes and scheduled tribes.
Under the programme, financial assistance is provided to Women’s Development
Corporations (WDCs), public sector corporations, autonomous bodies and voluntary
organizations (NGOs) to train poor women, mostly in non-traditional trades and to ensure
their employment in these areas. Some of the popular trades under the programme are
computer programming, desktop publishing, medical transcription, electronics, watch
assembling, radio and television repairs, garment making, dress designing and fashion
technology, handloom weaving, secretarial practice, community health work, embroidery,
etc., and the aim is to make women self – reliant.
Financial assistance is also provided to the grantee organizations for hiring of training-
cum-production sheds, training cost, machinery and equipments, stipend to the trainees
and remuneration for the trainers.
Various evaluation studies have shown that nearly 50-60 per cent of the women trained
under the programme have been able to get employment or self-employment. From 2006,
Swawlamban has been transferred to the States/ Union Territories.
Support to Training and Employment Programme for Women (STEP)
Support to Training and Employment Programme for Women (STEP) was launched in
1987 to provide skills and knowledge to poor and assetless women in traditional occupations
such as agriculture, animal husbandry, dairying, fisheries, handloom, handicrafts, khadi
and village industries, sericulture, social forestry and wasteland development for enhancing
their productivity and income generation. This would enhance and broaden their employment
opportunities, including self-employment and development of entrepreneurship skills.
Women beneficiaries are organized into co-operatives. Services such as training, extension,
infrastructure, market linkages, etc. are provided, besides linkage with credit for transfer of
assets.
Women in the dairying sector have been receiving the maximum support, keeping in
view the nature of demands. This is followed by handlooms, handicrafts, sericulture and
poultry.
The number of women beneficiaries under Swawlamban and STEP are given in
Table 98.

Statistics on Women in India 2007
234
Table 98: Projects Sanctioned under Swawlamban and STEP (Support
to Training and Employment Programme) for Women, 2006-07
S. India/State/UT STEP Swawlamban
No. Amount No. of Amount No. of No. of
Sanctioned Beneficiaries Released Beneficiaries Proposals
(as on (as on (as on 2005-06 2006-07 Sanctioned
15.1.2007) 15.1.2007) 31.1.2007) (as on (as on
(Rs. in Lakhs) (Rs. in Lakhs) 31.1.07) 31.1.07)
India 1089.90 15565 111.60 36700 4290 75
1. Andhra Pradesh 3.99 - 8.86 9010 660 10
2. Arunachal Pradesh - - - - - -
3. Assam 488.80 5250 - 790 - -
4. Bihar - - - - - -
5. Chhattisgarh - - - 450 - -
6. Delhi 17.31 100 - 150 - -
7. Goa - - - - - -
8. Gujarat - - 5.31 270 290 5
9. Haryana - - 6.02 1650 300 7
10. Himachal Pradesh - - 0.55 350 50 1
11. Jammu & Kashmir - - 9.37 590 460 12
12. Jharkhand - - - 50 - -
13. Karnataka 255.83 4100 1.69 790 60 1
14. Kerala - - 4.90 360 200 4
15. Madhya Pradesh 45.73 610 2.59 2430 110 1
16. Maharashtra 6.97 125 9.87 1550 410 6
17. Manipur 3.25 75 5.57 2190 280 5
18. Meghalaya - - - 50 - -
19. Mizoram 11.40 325 - 60 - -
20. Nagaland 2.47 125 - - - -
21. Orissa 34.96 600 8.16 2400 370 6
22. Punjab 20.77 500 33.23 290 400 1
23. Rajasthan - - - 630 - -
24. Sikkim - -
25. Tamil Nadu 74.29 1750 5.97 990 290 4
26. Tripura - - - - - -
27. Uttar Pradesh 47.20 605 - 8770 - -
28. Uttarakhand 76.89 1400 - 710 - -
29. West Bengal - - 9.51 2170 410 6
Union Territories
30. Andaman & Nicobar - - -
Islands
31. Chandigarh - - - - - -
32. Dadra & Nagar Haveli - - -
33. Daman & Diu - - -
34. Lakshadweep - - -
35. Pondicherry - - - - - -
Notes: From 2006, Swawlamban is transferred to States.
Source: India, Ministry of Women and Child Development. (2007). Annual Report 2006-07. New Delhi.
P.183-184.

Statistics on Women in India 2007
235
The Ministry of Rural Development provides employment under the Swarnjayanti Gram
Swarozgar Yojana (SGSY) to persons residing in rural areas. Efforts are made to include
women under the scheme. The number of beneficiaries and women beneficiaries under
SGSY is given in Table 99.
Table 99: Beneficiaries under Swarnjayanti Gram Swarozgar Yojana
(SGSY) (as on 9.2.2007), 2006-07
S. India/ State/ UT Beneficiaries under Swarnjayanti Gram Swarozgar Yojana (SGSY)
No. Groups Groups Women No. of Total No. of WomenFormed Formed SHGs Women Swaroz- Women %
since during Formed SHGS garis1.4.99 the Year Who Assisted/
Took up TrainedEconomic
Activity
India 2437913 154182 111206 34956 981696 656183 66.84
1. Andhra Pradesh 466837 7867 7877 5013 61778 59858 96.89
2. Arunachal Pradesh 376 20 4 4 140 54 38.57
3. Assam 132180 8282 4937 2718 109438 77493 70.81
4. Bihar 108242 11710 5156 2507 54553 25096 46.00
5. Chhattisgarh 51780 2031 1349 1065 25059 12880 51.40
6. Delhi - - - - - - -
7. Goa 700 75 67 73 1275 1173 92.00
8. Gujarat 91852 3197 1480 2274 8185 4024 49.16
9. Haryana 11825 1598 897 329 4494 3687 82.04
10. Himachal Pradesh 5801 445 283 240 13170 8944 67.91
11. Jammu & Kashmir 7420 316 202 157 731 400 54.72
12. Jharkhand 34001 5057 3052 1410 12056 10315 85.56
13. Karnataka 42292 4489 3784 1817 27648 24449 88.43
14. Kerala 60303 4162 3192 718 24442 20047 82.02
15. Madhya Pradesh 255395 9953 3315 2339 52646 28231 53.62
16. Maharashtra 138339 13861 11884 2875 61578 55144 89.55
17. Manipur 705 6 360 279 77.50
18. Meghalaya 5413 1053 446 311 2139 1764 82.47
19. Mizoram 1455 129 111 104 1898 1704 89.78
20. Nagaland 2813 172 406 143 2062 1111 53.88
21. Orissa 160399 9028 8163 3012 36697 26857 73.19
22. Punjab 4483 373 311 305 4159 2581 62.06
23. Rajasthan 29219 3431 2357 585 17058 10365 60.76
24. Sikkim 1395 389 248 69 3006 2098 69.79
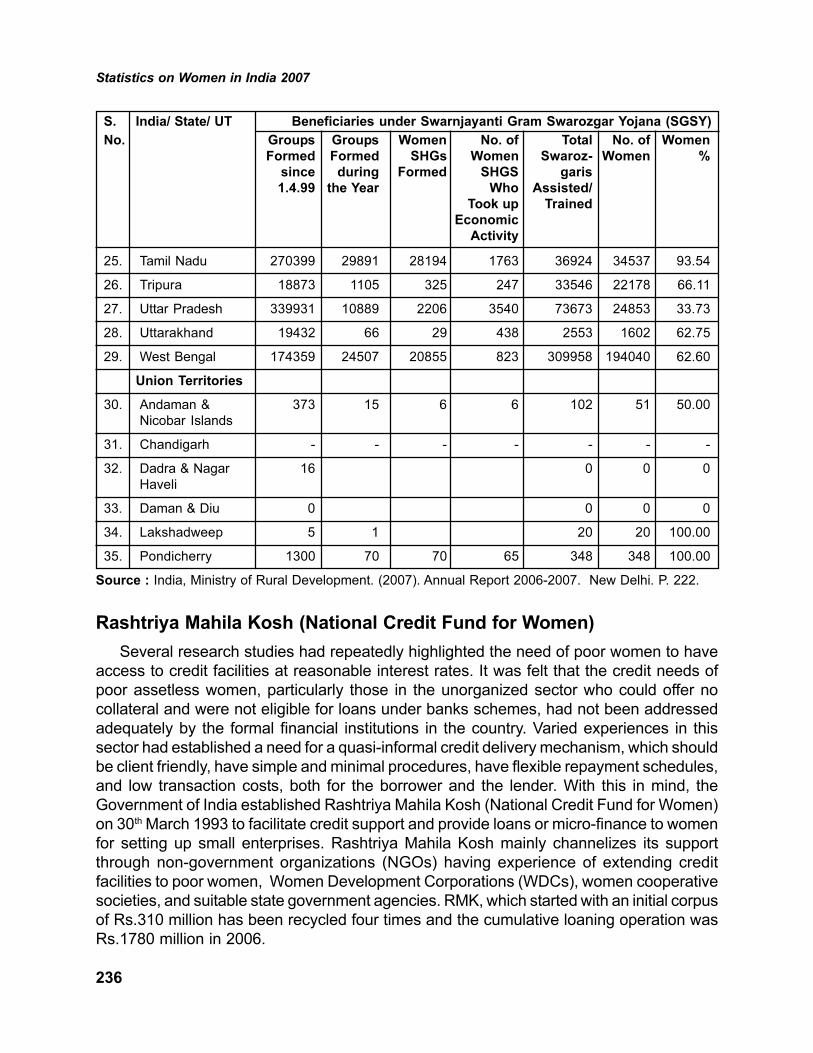
Statistics on Women in India 2007
236
S. India/ State/ UT Beneficiaries under Swarnjayanti Gram Swarozgar Yojana (SGSY)
No. Groups Groups Women No. of Total No. of WomenFormed Formed SHGs Women Swaroz- Women %
since during Formed SHGS garis1.4.99 the Year Who Assisted/
Took up TrainedEconomic
Activity
25. Tamil Nadu 270399 29891 28194 1763 36924 34537 93.54
26. Tripura 18873 1105 325 247 33546 22178 66.11
27. Uttar Pradesh 339931 10889 2206 3540 73673 24853 33.73
28. Uttarakhand 19432 66 29 438 2553 1602 62.75
29. West Bengal 174359 24507 20855 823 309958 194040 62.60
Union Territories
30. Andaman & 373 15 6 6 102 51 50.00
Nicobar Islands
31. Chandigarh - - - - - - -
32. Dadra & Nagar 16 0 0 0
Haveli
33. Daman & Diu 0 0 0 0
34. Lakshadweep 5 1 20 20 100.00
35. Pondicherry 1300 70 70 65 348 348 100.00
Source : India, Ministry of Rural Development. (2007). Annual Report 2006-2007. New Delhi. P. 222.
Rashtriya Mahila Kosh (National Credit Fund for Women)
Several research studies had repeatedly highlighted the need of poor women to have
access to credit facilities at reasonable interest rates. It was felt that the credit needs of
poor assetless women, particularly those in the unorganized sector who could offer no
collateral and were not eligible for loans under banks schemes, had not been addressed
adequately by the formal financial institutions in the country. Varied experiences in this
sector had established a need for a quasi-informal credit delivery mechanism, which should
be client friendly, have simple and minimal procedures, have flexible repayment schedules,
and low transaction costs, both for the borrower and the lender. With this in mind, the
Government of India established Rashtriya Mahila Kosh (National Credit Fund for Women)
on 30th March 1993 to facilitate credit support and provide loans or micro-finance to women
for setting up small enterprises. Rashtriya Mahila Kosh mainly channelizes its support
through non-government organizations (NGOs) having experience of extending credit
facilities to poor women, Women Development Corporations (WDCs), women cooperative
societies, and suitable state government agencies. RMK, which started with an initial corpus
of Rs.310 million has been recycled four times and the cumulative loaning operation was
Rs.1780 million in 2006.

Statistics on Women in India 2007
237
The number of women beneficiaries and loans disbursed under RMK is given in Table 100.
Table 100: Loans Disbursed under Rashtriya Mahila Kosh and
Beneficiaries, 2006
S. No. India/ State Rashtriya Mahila Kosh
Sanction Disbursement Recovery Benefi-
(Rs. in Lakh) (Rs. in Lakh) (Rs. in Lakh) ciaries
India 17899.34 14207.09 9684.39 537652
1. Andhra Pradesh 6572.31 5423.27 4032.54 192402
2. Assam 59.50 46.00 23.97 1280
3. Bihar 337.25 260.83 145.16 12526
4. Chhattisgarh 14.50 2.50 0.50 370
5. Delhi 324.72 283.12 139.08 3785
6. Gujarat 103.50 73.50 34.44 5950
7. Haryana 135.01 101.66 40.04 2423
8. Himachal Pradesh 436.48 415.63 254.54 11596
9. Jammu & Kashmir 22.00 12.00 12.00 880
10. Jharkhand 61.43 26.70 15.09 1070
11. Karnataka 407.25 198.00 171.79 12666
12. Kerala 708.22 528.52 424.24 32567
13. Madhya Pradesh 764.30 681.00 224.05 7017
14. Maharashtra 880.40 745.80 645.75 28341
15. Manipur 162.00 118.25 101.64 6176
16. Mizoram 4.00 2.00 0.70 70
17. Nagaland 64.00 15.50 2.00 789
18. Orissa 933.85 703.35 224.93 22580
19. Pondicherry 51.00 16.00 8.55 300
20. Rajasthan 507.40 433.24 318.57 16794
21. Tamil Nadu 3663.34 2942.12 2117.59 121517
22. Uttar Pradesh 644.85 439.92 248.97 22994
23. Uttarakhand 101.24 76.89 21.45 1424
24. West Bengal 940.79 661.29 476.80 32135
Source: India, Ministry of Women and Child Development. (2006). Annual Report 2005-06.New Delhi. P.267.

Statistics on Women in India 2007
238
9. Support Services to Women
The Department of Women and Child Development, Government of India has
undertaken several programmes and assists voluntary organizations providing services to
various groups of women. Working women, widows, women in distress, and women from
vulnerable backgrounds are in need of special services. To create an enabling environment
to enhance the self confidence and autonomy of women so that they can take their rightful
place in the mainstream of the nation’s social, political and economic life, the Government
has started the following programmes for women’s empowerment:
Support Measures for Women
1. Rajiv Gandhi National Creche Scheme for the Children of Working Mothers
2. Integrated Child Development Services (ICDS)
3. Working Women’s Hostels with Day Care Centres
4. Swawlamban, erstwhile (NORAD)
5. Support to Training and Employment Programme for Women (STEP)
6. Mahila Samakhya (MS)
7. Swayamsidha
8. Rashtriya Mahila Kosh (RMK) (credit to women)
9. Mahila Mandal Programme
10.Short Stay Homes for Women and Girls (SSH) (for women in distress)
11. Condensed Courses of Education for Women (CCE)
12.Family Counselling Centres (FCC)
13. Innovative Scheme (for women and children not covered by others schemes)
14.Swa-Shakti Project (SSP)
15.Swadhar (Women in Difficult Circumstances)
16.Women Helplines
17.Awareness Generation Project
The Government of India has a framework for empowering women outlined in the
policy document “National Policy for Empowerment of Women (NPEW), 2001”.
The National Commission for Women was set up in 1990 to intervene in matters
relating to human rights of women.

Statistics on Women in India 2007
239
Legislation for Women
The various legislations enacted for the protection of women are:
1. The Family Courts Act, 1984
2. The Dowry Prohibition Act, 1961 (Amended 1985)
3. The Hindu Marriage and Divorce Act, 1956
4. The Hindu Widows Remarriage Act, 1856 (Amended 1985)
5. The Special Marriage Act, 1954 (Amended 1985)
6. The Christian Marriage Act, 1972
7. The Muslim Personal Law (Shariat) Application Act, 1937
8. The Foreign Marriage Act, 1969
9. The Indian Divorce Act, 1969
10.The Indecent Representation of Women (Prohibition) Act, 1986
11. The Commission of Sati (Prevention) Act, 1987
12.The National Commission for Women Act, 1990
13.The Medical Termination of Pregnancy Act, 1971
14.The Indian Succession Act, 1925
15.The Married Women’s Property Act, 1876 (Amended 1984)
16.The Hindu Adoptions and Maintenance Act, 1956
17.The Hindu Minority and Guardianship Act, 1956
18.The Hindu Succession Act, 1956
19.The Pre-Natal Diagnostic Technique (Regulation and Prevention of Misuse) Act, 1994
20.The Juvenile Justice Act, 1986
21.The Infant Milk Substitute, Feeding Bottles and Infant Foods (Regulation of Production,
Supply and Distribution) Act, 1992
22.The Equal Remuneration Act, 1976
23.The Minimum Wages Act, 1948
24.The Child Labour (Prohibition and Regulation) Act, 1986
25.The Mines Act, 1952
26.The Plantation Labour Act, 1951

Statistics on Women in India 2007
240
27.The Beedi and Cigar Workers (Conditions of Employment) Act, 1966
28.The Factories Act, 1948 (Amended in 1949, 1950 and 1954)
29.The Contract Labour (Regulation and Abolition) Act, 1970
30.The Employees State Insurance Act, 1948
31.The Maternity Benefit Act, 1961 (Amended in 1995)
32.The Wokrmen’s Compensation Act, 1923
33.The Immoral Traffic (Prevention) Act, 1961
34.The Code of Criminal Procedure, 1973
35.Rape is an Offence under Section 376 of IPC
36.Supreme Court Order regarding Sexual Harassment of Women at Work Place and
Other Institutions, 1999 (Section 509 IPC)
37. The Domestic Violence (Prevention) Act, 2006
38. The Child Marriage (Prevention) Act, 2006
Some of the support measures for women initiated by the Government of India are
given below.
Hostels for Working Women
With progressive change in the economic structure of the country, more and more
women are living out of their homes in search of employment in big cities. These women
are exposed to risks due to lack of suitable and safe accommodation. The Government of
India acknowledged the difficulties faced by such women and decided to introduce a Scheme
for Construction / Expansion of Hostels for Working Women.
Under the Scheme for Construction / Expansion of Hostel Building for Working Women,
financial assistance is given to voluntary organizations, local bodies and cooperative
institutions for the construction of hostels for working women in order to enable women to
seek employment and participate in technical training. The objective of the scheme is to
provide cheap and safe hostel accommodation to working women living out of their homes.
The target beneficiaries are single working women, widows, divorcees, separated women,
and working women, whose husbands are out of town.
In 2005-06, an additional 65 working women’s hostels were sanctioned benefiting 1625
women. The number of working women’s hostels sanctioned, number of working women
benefited, hostels with day care centres, and number of children benefited till March 2004
is given in Table 101.

Statistics on Women in India 2007
241
Table 101: Working Women’s Hostels Sanctioned, Women Benefited,
Hostels with Day Care Centres and Children Benefited, (as
on 31.3.2004), 2004
S.No India/State/UT No.of Working Working No. of Day No. ofWomen Hostels Women Care Centres Children
(WWH) Benefited (DCC) Benefited
India 914 56214 329 8681
1. Andhra Pradesh 52 3604 13 360
2. Arunachal Pradesh 10 441 2 45
3. Assam 15 837 5 80
4. Bihar 8 482 4 105
5. Chhattisgarh 1 50 - -
6. Delhi 20 2620 7 193
7. Goa 2 120 - -
8. Gujarat 26 1868 6 180
9. Haryana 19 1513 9 255
10. Himachal Pradesh 14 564 - -
11. Jammu & Kashmir 5 352 2 40
12. Karnataka 83 6926 29 801
13. Kerala 148 2579 83 2396
14. Madhya Pradesh 68 3537 15 411
15. Maharashtra 129 9749 47 1120
16. Manipur 12 579 7 200
17. Meghalaya 3 214 1 15
18. Mizoram 4 149 - -
19. Nagaland 15 817 3 60
20. Orissa 29 1825 8 140
21. Punjab 16 1660 5 110
22. Rajasthan 37 1711 13 300
23. Sikkim 2 144 1 30
24. Tamil Nadu 96 6392 36 910
25. Tripura 1 50 - -
26. Uttar Pradesh 43 3282 14 425
27. Uttarakhand 3 190 2 74
28. West Bengal 41 2964 15 376
Union Territories
29. Andaman & Nicobar 1 36 - -
Islands
30. Chandigarh 7 736 2 55
31. Dadra & Nagar Haveli - - - -
32. Daman & Diu - - - -
33. Lakshadweep - - - -
34. Pondicherry 4 223 - -
Source: India, Ministry of Human Resource Development, Department of Women and Child Development.
(2004). Annual Report 2003-2004. New Delhi. P.98.

Statistics on Women in India 2007
242
Swayamsidha Scheme
Swayamsidha is an integrated scheme for empowerment of women through formation
of self help groups (SHGs). The scheme was launched in February 2001 and aimed for
holistic empowerment of women through sustained mobilization and convergence of all
the on-going sectoral programmes by improving access of women to micro credit, economic
resources, bank linkages, etc. The scheme is expected to culminate in March 2007. Against
a target of 65,000 SHGs, 68,575 SHGs were formed and 1 million women covered under
the scheme. The number of SHGs formed under Swayamsidha is given in Table 102.
Table 102: Self Help Groups Formed under Swayamsidha, 2006-07
S. No. India/State/UT Funds Release No. of No. of Blocks No. of SHGsduring 2005-06 Districts Covered Formed(as on 31.1.07)(Rs. in Lakhs)
India 1885.20 335 650 68575
1. Andhra Pradesh 50.56 23 38 3874
2. Arunachal Pradesh 0 6 6 263
3. Assam 0 20 24 2400
4. Bihar 270.00 19 63 6332
5. Chhattisgarh 25.00 16 17 1708
6. Delhi 0 3 4 175
7. Goa
8. Gujarat 299.40 20 27 2772
9. Haryana 0 6 13 1300
10. Himachal Pradesh 34.39 7 8 800
11. Jammu & Kashmir 36.85 13 13 1250
12. Jharkhand 50.00 11 24 2427
13. Karnataka 26.05 12 20 2992
14. Kerala 29.94 7 18 2424
15. Madhya Pradesh 100.00 13 36 3667
16. Maharashtra 100.00 20 36 3939
17. Manipur 14.49 3 3 300
18. Meghalaya 30.89 5 5 531

Statistics on Women in India 2007
243
S. No. India/State/UT Funds Release No. of No. of Blocks No. of SHGsduring 2005-06 Districts Covered Formed(as on 31.1.07)(Rs. in Lakhs)
19. Mizoram 0.33 3 3 300
20. Nagaland 0 5 6 600
21. Orissa 0 9 36 3600
22. Punjab 0 8 15 1898
23. Rajasthan 200.00 26 30 3000
24. Sikkim 39.84 4 5 572
25. Tamil Nadu 150.01 5 44 5452
26. Tripura 0 3 3 327
27. Uttar Pradesh 100.00 54 94 8666
28. Uttarakhand 37.79 5 11 1100
29. West Bengal 270.37 4 39 5184
Union Territories
30. Andaman & Nicobar 0 3 3 196
Islands
31. Chandigarh - - - -
32. Dadra & Nagar Haveli - - - -
33. Daman & Diu - - - -
34. Lakshadweep 0 1 3 226
35. Pondicherry 14.80 1 3 300
Other Expenses 4.49 - - -
Source: India, Ministry of Women and Child Development. (2007). Annual Report 2006-07. New Delhi.
P.182.
Short Stay Homes
The Central Social Welfare Board (CSWB) has implemented the scheme of Short Stay
Homes (SSH), which provide temporary shelter to women and girls who i) are being forced
into prostitution, ii) are, as a result of family tension or discord, made to leave their homes
and are without any means of subsistence and have no social protection from exploitation,
or are facing litigation on account of marital disputes, iii) have been sexually assaulted and
are facing the problem of re-adjustment in the family or society, iv) are victims of mental
maladjustment, emotional disturbances and social ostracism, v) have escaped from their
homes due to family problems, mental or physical torture and need shelter, psychiatric
treatment and counselling for their rehabilitation and re-adjustment in family and society.

Statistics on Women in India 2007
244
The number of short stay homes, beneficiaries and funds released is given in Table 103.
Table 103: Short Stay Homes (SSH), Funds Released, and SSH
Beneficiaries as on 31.03.2006
S.No. India /States/UTs No. of Short Amount No. of
Stay Homes Released Beneficiaries
Sanctioned (Rs. In lakhs)
India 342 1589.23 18600
1. Andhra Pradesh 31 138.18 1701
2. Arunachal Pradesh 2 10.30 126
3. Assam 11 47.04 630
4. Bihar 19 73.71 1008
5. Chhattisgarh 1 5.17 68
6. Delhi 3 15.67 189
7. Goa 1 3.88 68
8. Gujarat 4 19.51 252
9. Haryana 2 9.20 126
10. Himachal Pradesh 0 3.33 0
11. Jammu & Kashmir 2 6.60 63
12. Jharkhand 6 20.45 252
13. Karnataka 27 97.90 1134
14. Kerala 5 16.63 252
15. Madhya Pradesh 20 83.09 945
16. Maharashtra 26 126.96 1638
17. Manipur 10 55.41 504
18. Meghalaya 0 0 0
19. Mizoram 1 5.24 03
20. Nagaland 1 2.59 63
21. Orissa 32 157.42 1890
22. Punjab 2 10.10 126

Statistics on Women in India 2007
245
S.No. India /States/UTs No. of Short Amount No. of
Stay Homes Released Beneficiaries
Sanctioned (Rs. In lakhs)
23. Rajasthan 9 42.69 504
24. Sikkim 1 2.59 68
25. Tamil Nadu 46 266.81 2394
26. Tripura 5 17.78 252
27. Uttar Pradesh 30 155.63 1827
28. Uttarakhand 5 25.95 252
29. West Bengal 35 144.51 1890
Union Territories
30. Andaman & Nicobar 1 4.60 63
Islands
31. Chandigarh 1 4.08 63
32. Dadra & Nagar Haveli 1 4.72 63
33. Daman & Diu - - -
34. Lakshadweep 0 0 0
35. Pondicherry 2 11.49 126
Notes: A Short Stay Home provides shelter to 30 women at a time, and is located in towns or cities
with a population of 50,000 or more.
Source: Central Social Welfare Board. (2007). Annual Report 2005-06.New Delhi. P.50.
ICDS
The Integrated Child Development Services (ICDS) is a centrally sponsored scheme,
wherein the Central Government is responsible for programme planning and operating
costs, and the State Governments are responsible for programme implementation and
supplementary nutrition.
The Scheme aims at the holistic development of children (0-6 years) and pregnant and
nursing mothers. It provides an integrated comprehensive package of services comprising
i) supplementary nutrition; ii) immunization; iii) health check-ups; iv) referral services; v)
pre-school non-formal education; and vi) nutrition and health education.
The ICDS Scheme was introduced in 33 blocks in 1975 and expanded to nearly 6,118
projects in 2006, of which 5724 projects became fully operational till 31 September 2006
(Department of Women and Child Development, ICDS Cell).
Currently, services under the scheme are being provided to about 54.3 million children
and 11.12 million pregnant and nursing mothers as on 31 September 2006, through a
network of anganwadi centres.
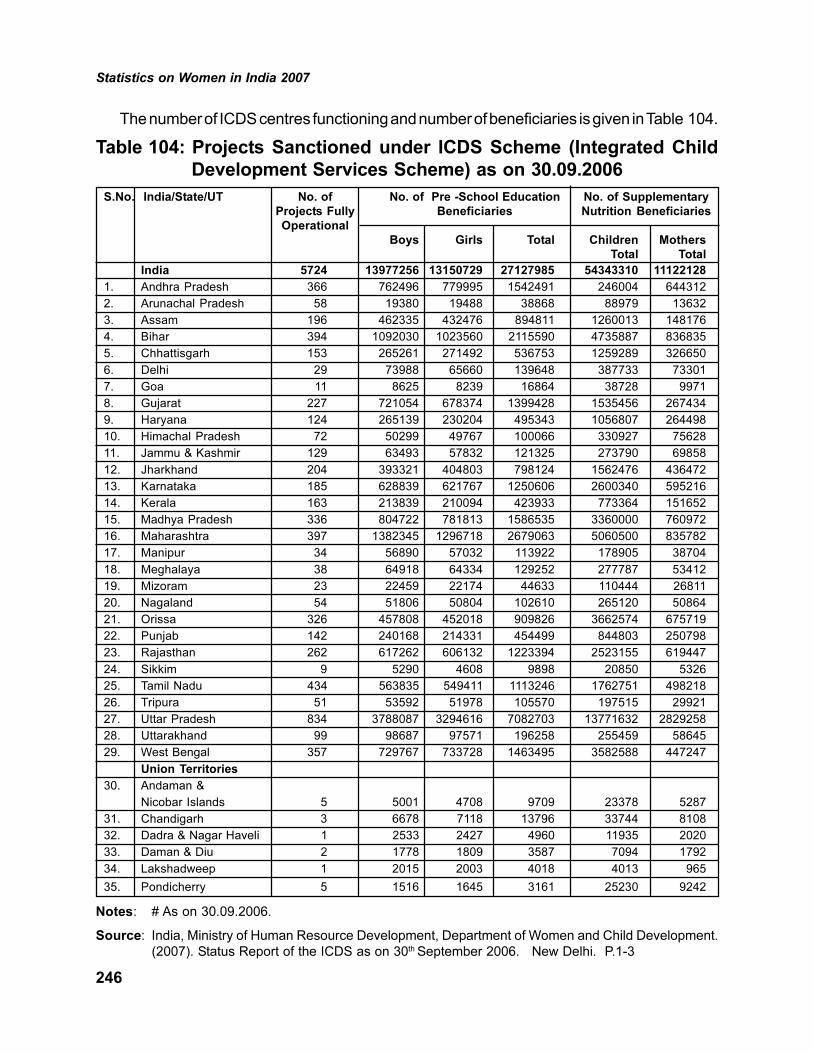
Statistics on Women in India 2007
246
The number of ICDS centres functioning and number of beneficiaries is given in Table 104.
Table 104: Projects Sanctioned under ICDS Scheme (Integrated Child
Development Services Scheme) as on 30.09.2006
S.No. India/State/UT No. of No. of Pre -School Education No. of Supplementary
Projects Fully Beneficiaries Nutrition Beneficiaries
Operational
Boys Girls Total Children Mothers
Total Total
India 5724 13977256 13150729 27127985 54343310 11122128
1. Andhra Pradesh 366 762496 779995 1542491 246004 644312
2. Arunachal Pradesh 58 19380 19488 38868 88979 13632
3. Assam 196 462335 432476 894811 1260013 148176
4. Bihar 394 1092030 1023560 2115590 4735887 836835
5. Chhattisgarh 153 265261 271492 536753 1259289 326650
6. Delhi 29 73988 65660 139648 387733 73301
7. Goa 11 8625 8239 16864 38728 9971
8. Gujarat 227 721054 678374 1399428 1535456 267434
9. Haryana 124 265139 230204 495343 1056807 264498
10. Himachal Pradesh 72 50299 49767 100066 330927 75628
11. Jammu & Kashmir 129 63493 57832 121325 273790 69858
12. Jharkhand 204 393321 404803 798124 1562476 436472
13. Karnataka 185 628839 621767 1250606 2600340 595216
14. Kerala 163 213839 210094 423933 773364 151652
15. Madhya Pradesh 336 804722 781813 1586535 3360000 760972
16. Maharashtra 397 1382345 1296718 2679063 5060500 835782
17. Manipur 34 56890 57032 113922 178905 38704
18. Meghalaya 38 64918 64334 129252 277787 53412
19. Mizoram 23 22459 22174 44633 110444 26811
20. Nagaland 54 51806 50804 102610 265120 50864
21. Orissa 326 457808 452018 909826 3662574 675719
22. Punjab 142 240168 214331 454499 844803 250798
23. Rajasthan 262 617262 606132 1223394 2523155 619447
24. Sikkim 9 5290 4608 9898 20850 5326
25. Tamil Nadu 434 563835 549411 1113246 1762751 498218
26. Tripura 51 53592 51978 105570 197515 29921
27. Uttar Pradesh 834 3788087 3294616 7082703 13771632 2829258
28. Uttarakhand 99 98687 97571 196258 255459 58645
29. West Bengal 357 729767 733728 1463495 3582588 447247
Union Territories
30. Andaman &
Nicobar Islands 5 5001 4708 9709 23378 5287
31. Chandigarh 3 6678 7118 13796 33744 8108
32. Dadra & Nagar Haveli 1 2533 2427 4960 11935 2020
33. Daman & Diu 2 1778 1809 3587 7094 1792
34. Lakshadweep 1 2015 2003 4018 4013 965
35. Pondicherry 5 1516 1645 3161 25230 9242
Notes: # As on 30.09.2006.
Source: India, Ministry of Human Resource Development, Department of Women and Child Development.
(2007). Status Report of the ICDS as on 30th September 2006. New Delhi. P.1-3

Statistics on Women in India 2007
247
Creches
Creches directly benefit children in the preschool age by providing preschool education,
supplementary nutrition and opportunities for psychosocial development and recreation.
They also indirectly benefit mothers by giving them an opportunity to join the workforce, as
creche workers look after the children, while mothers are at work. Rajiv Gandhi National
Creche Scheme for the Children of Working Mothers was launched on 1st January 2006 by
merging the National Creche Fund and the Scheme of Assistance to Voluntary Organisations
for Creche for Working and Ailing Mothers Children. The financial norms have been revised
from Rs.18,480 to Rs.42,384 per crèche per annum, and the target is to set up 14,719 new
crèches by the end of the 10th Five Year Plan. The number of creches and children availing
services under Crèche Scheme are given in Table 105.
Table 105: Creches Sanctioned and Beneficiaries, 2006
S.No. India/State/UT No. of Creche No. of No. of
Centres under Creche Centres Beneficiaries
Creche Scheme under National under Both
Creche Fund the Schemes
India 12470 5137 440175
1. Andhra Pradesh 1340 1316 66400
2. Arunachal Pradesh 98 8 2650
3. Assam 195 290 12125
4. Bihar 249 154 10075
5. Chhattisgarh
(included under
Madhya Pradesh) - - -
6. Delhi 229 10 5975
7. Goa 31 8 975
8. Gujarat 853 89 23550
9. Haryana 431 309 18500
10. Himachal Pradesh 504 38 13550
11. Jammu & Kashmir 153 - 3825
12. Jharkhand -
13. Karnataka 583 177 19000
14. Kerala 643 20 16575
15. Madhya Pradesh
(includes
Chhattisgarh) 1327 228 38875
16. Maharashtra 1171 410 39525
17. Manipur 240 69 7725

Statistics on Women in India 2007
248
S.No. India/State/UT No. of Creche No. of No. of
Centres under Creche Centres Beneficiaries
Creche Scheme under National under Both
Creche Fund the Schemes
18. Meghalaya 171 8 4475
19. Mizoram 143 8 3775
20. Nagaland 41 8 1225
21. Orissa 619 265 22100
22. Punjab 145 36 4525
23. Rajasthan 348 86 10850
24. Sikkim 126 8 3350
25. Tamil Nadu 962 377 33475
26. Tripura 166 8 4350
27. Uttar Pradesh 740 368 27700
28. Uttarakhand - 205 5125
29. West Bengal 706 609 32875
Union Territories
30. Andaman & Nicobar 88 4 2300
Islands
31. Chandigarh 37 5 1050
32. Dadra & Nagar Haveli 9 4 325
33. Daman & Diu - 4 100
34. Lakshadweep 10 4 350
35. Pondicherry 112 4 2900
Source: India, Ministry of Human Resource Development , Department of Women and Child Development.
(2006). Annual Report 2005-2006. New Delhi. P.208.
Condensed Courses of Education for Women (CCE)
The National Policy on Education has laid special emphasis on skill development for
girls and women to provide employment or work opportunities in rural and urban areas.
The Central Social Welfare Board (CSWB) started the programmes of Condensed Courses
of Education in 1958 and the Vocational Training Programme during the year 1975, to help
women complete their schooling and also upgrade their skills in order to meet the demands
of changing work environment.
Under the scheme of Condensed Courses, voluntary organisations are given grants to
conduct courses of 2 years and 1 year duration to enable women above 15 years to pass
Matric/ Secondary, Middle and Primary level examinations. The scheme contains provisions
for engaging teachers for conducting these courses.

Statistics on Women in India 2007
249
The number of beneficiaries under the programme Condensed Courses of Education
for Women is given in Table 106.
Table 106: Condensed Courses of Education (CCE) for Women, 2005-06
S.No. India/State/UT Condensed Courses of Education
No. of Courses Amount Released No. of
Sanctioned (Rs. in Lakh) Beneficiaries
India 700 600.00 17500
1. Andhra Pradesh 38 27.58 950
2. Arunachal Pradesh 16 12.20 400
3. Assam 18 16.37 450
4. Bihar 64 75.30 1600
5. Chhattisgarh 21 19.30 525
6. Delhi 10 7.65 250
7. Goa 2 1.32 50
8. Gujarat 14 9.78 350
9. Haryana 15 12.57 375
10. Himachal Pradesh 6 4.62 150
11. Jammu & Kashmir 8 6.69 200
12. Jharkhand 21 17.32 525
13. Karnataka 36 27.20 900
14. Kerala 23 13.67 575
15. Madhya Pradesh 70 61.45 1750
16. Maharashtra 55 41.69 1375
17. Manipur 15 13.44 375
18. Meghalaya 20 23.54 500
19. Mizoram 14 15.29 350
20. Nagaland 10 8.73 250
21. Orissa 22 18.47 550
22. Punjab 16 15.08 400
23. Rajasthan 29 20.44 725
24. Sikkim 5 3.58 125
25. Tamil Nadu 23 14.62 575
26. Tripura 4 3.29 100
27. Uttar Pradesh 72 64.69 1800
28. Uttarakhand 18 15.74 450
29. West Bengal 26 22.76 650
Union Territories
30. Andaman & Nicobar Islands - - -
31. Chandigarh 1 0.72 25
32. Dadra & Nagar Haveli - - -
33. Daman & Diu - - -
34. Lakshadweep 3 1.58 75
35. Pondicherry 5 3.31 125
Source: Central Social Welfare Board (CSWB). (2007). Annual Report 2005-06. New Delhi. P.53.

Statistics on Women in India 2007
250
Family Counselling Centres
Family Counselling Centres (FCC) were set up with the objective of providing preventive
and rehabilitative services to women and families who are victims of atrocities and family
mal-adjustment, through crisis intervention and systematic counselling. The number of
beneficiaries and funds released for Family Counselling Centres (FCC) during 2004-05 is
given in Table 107.
Table 107: Family Counselling Centres (FCC), 2006
S.No. India/State/UT Family Counselling CentresNo. of Units Amount Released BeneficiariesSanctioned (Rs. in Lakh)
India 745 562.91 93125
1. Andhra Pradesh 45 37.59 5625
2. Arunachal Pradesh 5 3.68 625
3. Assam 16 12.51 2000
4. Bihar 46 39.96 5750
5. Chhattisgarh 12 4.80 1500
6. Delhi 30 20.38 3750
7. Goa 2 1.60 250
8. Gujarat 45 33.26 5625
9. Haryana 20 11.13 2500
10. Himachal Pradesh 6 6.30 750
11. Jammu & Kashmir 12 7.05 1500
12. Jharkhand 18 11.65 2250
13. Karnataka 52 40.99 6500
14. Kerala 36 25.51 4500
15. Madhya Pradesh 51 38.97 6375
16. Maharashtra 77 58.81 9125
17. Manipur 7 5.61 875
18. Meghalaya 2 1.11 250
19. Mizoram 4 2.55 500
20. Nagaland 4 2.29 500
21. Orissa 30 24.23 3750
22. Punjab 15 10.76 1875
23. Rajasthan 31 26.33 3875
24. Sikkim 3 3.44 375
25. Tamil Nadu 54 38.22 6750
26. Tripura 11 7.78 1375
27. Uttar Pradesh 55 43.75 6875
28. Uttarakhand 7 5.38 875
29. West Bengal 41 29.32 5125
Union Territories
30. Andaman & Nicobar Islands 2 1.93 250
31. Chandigarh 5 2.98 625
32. Dadra & Nagar Haveli - - -
33. Daman & Diu - - -
34. Lakshadweep - - -
35. Pondicherry 5 3.49 625
Source: Central Social Welfare Board (CSWB). (2006). Annual Report 2005-06. New Delhi. P.49.

Statistics on Women in India 2007
251
Swadhar
Swadhar was launched in 2001-2002 for the benefit of women in difficult circumstances,
like destitute widows deserted by their families in religious places; women prisoners released
from jail and without family support; women survivors of natural disasters who have been
rendered homeless and are without any social and economic support; trafficked women/
girls rescued or runaway from brothels, victims of sexual crimes, who are disowned by the
family or who do not want to go back to their respective family for various reasons; women
victims of terrorist violence who are without any family support and without any economic
means of survival; mentally disordered women who are without any support of family or
relatives, etc.
The package of assistance under the scheme includes provisions for shelter, food,
clothing, health care and counseling for such women; measures for social and economic
rehabilitation through education, awareness, skill upgradation and personality development
through behavioural training, helpline for such women in distress, etc.
The implementing agencies can be the social welfare / women and child welfare
departments of state governments, women’s development corporations, urban local bodies,
reputed public/ private trusts or voluntary organizations who are willing to take the
responsibility of rehabilitating such women.
The organizations assisted in implementing Swadhar scheme is given in Table 108.
Table 108: Projects Sanctioned under Swadhar Scheme as on 20.12.2005,
and Funds Released, 2006-07
S.No. India/State Name of Organization Assisted Amount Released Purpose of Grant
as on 20.12.2005
(Rs. in lakh)
Andhra Pradesh 130.63* 63.61*
(31.3.06) (15.1.07)
1. Andhra Pradesh Government 19.55 Construction of
Shelter Home
2. Ambedkar Harijan Sangham, Kadiri, 6.13 Run Shelter Home
Anantpur and Helpline
3. Rashtriya Seva Samiti, ARKVA, 5.93 Run Shelter Home
Chittoor and Helpline
4. Rural Infrastructure Development 5.10 Run Shelter Home
Organization, Nizamabad
5. Praja Seva Samaj, Kadiri, Anantpur 5.09 Run Shelter Home
6. Development Organization of Village 4.91 Run Shelter Home
Environment (DOVE), Rangareddy,
Distt. Medak
7. Mahila Dakshita Samiti, Hyderabad 5.06 Run Shelter Home
8. Prakriti Environment Society, 4.64 Run Shelter Home
Karimnagar
9. Bark Educational Society, Guntur 5.83 Run Shelter Home
and Helpline

Statistics on Women in India 2007
252
S.No. India/State Name of Organization Assisted Amount Released Purpose of Grant
as on 20.12.2005
(Rs. in lakh)
10. Annie Owe Memorial Orphanage 6.08 Run Shelter Home
(AOMO), Eluru, West Godavari and Helpline
11. Vasantha Lakshmi Charitable Trust 4.94 Run Shelter Home
and Research Centre, Nellor
12. Hyderabad City Women’s Welfare 6.15 Run Shelter Home
Council, Hyderabad (for Habsiguda, and Helpline
R.R. Distt.)
Arunachal - 4.90*
Pradesh (31.3.06) (15.1.07)
Assam 24.84* 17.31*
(31.3.06) (15.1.07)
13. Woodwichee Lakshirbon, Silchar 4.00 Run Shelter Home
14. Global Organization and Life 5.10 Run Shelter Home
Development (GOLD), Guwahati
15. Woodwichee, PO Lakshirbond, 6.14 Run Shelter Home
Distt. Hailakandi and Helpline
16. Gram Vikas Parishad, Nagaon 5.09 Run Shelter Home
and Helpline
Bihar - 5.09*
(31.3.06) (15.1.07)
Chhattisgarh 7.74* -
(31.3.06) (15.1.07)
17. Education Society, Rahod, Distt. 7.74 Run Shelter Home
Janigar Champa
Delhi
18. Central Social Welfare Board 72.45 Run 38 Helplines in
(CSWB), New Delhi different states and
Orientation Training
Programme
Gujarat 9.61* 13.66*
(31.3.06) (15.1.07)
19. The Gujarat Musturat (Mahila) 6.81 Run Shelter Home
SEWA Trust, Ahmedabad
Haryana 3.60* -
(31.3.06) (15.1.07)
20. Ramjas Shiksha Samiti, Sonepat 3.60 Run Shelter Home
and Helpline
Himachal 5.10* -
Pradesh (31.3.06) (15.1.07)
21. Universal Social Health Association, 5.10 Run Shelter Home
Simla

Statistics on Women in India 2007
253
S.No. India/State Name of Organization Assisted Amount Released Purpose of Grant
as on 20.12.2005
(Rs. in lakh)
Jammu & 24.33* 5.33*
Kashmir (31.3.06) (15.1.07)
22. Guild of Service, Srinagar 6.55 & Run Shelter Home
5.31
Karnataka 61.73* 88.72*
(31.3.06) (15.1.07)
23. Sri Maitri Association, Davanagere 4.00 Run Shelter Home
24. Vidyaranya Education and 1.04 Run Helpline
Development Society, Mandur,
Virgo Nagar, Via Bangalore
25. Sarvodaya Service Society, 6.15 Run Shelter Home
Devanhally Taluk, Banglore and Helpline
26. Sneha Education & Development 6.14 Run Shelter Home
Society, Dharwad and Helpline
Kerala 9.40* -
(31.3.06) (15.1.07)
27. Sreeniketan Centre Social Develop- 1.04 Run Helpline
ment, Chethannoor PO Koelam
28. People’s Service Society, Palakkad 1.05 Run Helpline
Madhya Pradesh 79.79* 11.08*
(31.3.06) (15.1.07)
29. Churhat Children Welfare Society, 7.20 Run Shelter Home
Bhopal
30. Gopal Mahila Mandal, Biaora, 5.92 Run Shelter Home
Distt. Rajgarh and Helpline
Maharashtra 30.90* 67.34*
(31.3.06) (15.1.07)
31. Rescue Foundation, Mumbai 3.34 Run Shelter Home
32. Priyadarshani Pratishthan, Pune 5.07 Run Shelter Home
33. Kalawati Adarsh Mahila Vikas 1.04 Run Helpline
Kendra, Pune
34. Shivam Mahila Shikshak Prasarak 1.05 Run Helpline
Mandal, Parbhani Jalna
35. Rajshri Shahu Maharaj Shikshan 1.04 Run Helpline
Sanstha Vidyanagar, Chandrapur
36. Liberal Friends Association, Amravati 1.05 Run Helpline
37. Council for Rural Technology &
Research Institute, Aurangabad 1.05 Run Helpline
38. Pragathi Vidya Prasarak Sanstha, 1.05 Run Helpline
Nandurbar Distt.

Statistics on Women in India 2007
254
S.No. India/State Name of Organization Assisted Amount Released Purpose of Grant
as on 20.12.2005
(Rs. in lakh)
Manipur 44.08* 37.99*
(31.3.06) (15.1.07)
39. The SC/ST Backward Women & 4.00 Run Shelter Home
Children Development Organization
in Rural Areas, Thoubal, Khunou
40. Rural Voluntary Services, Vangbal 1.05 Run Helpline
Mayai Leikai, PO Thoubal
41. Chil Chil Asian Mission Society, 4.35 Run Shelter Home
Senapati
42. Muolviphei Rural Health Research 4.35 Run Shelter Home
Centre, Churachandpur
43. Social Upliftment and Development 5.09 Run Shelter Home
Agency (SURDA), Khangabok,
Thoubal
Mizoram 30.37* -
(31.3.06) (15.1.07)
44. Mizoram Govt., Dept. of Social 30.71 Construction of
Welfare Shelter Home
Nagaland 8.44* -
(31.3.06) (15.1.07)
Orissa 92.80* 35.49*
(31.3.06) (15.1.07)
45. Association for Health, Education & 1.05 Run Helpline
Development (AHEAD),
Bhubaneswar
46. Association of Social Work and Social 1.04 Run Helpline
Research in Orrisa, AT-Seva Vihar,
PO Batupali, Distt. Boudh
47. Awmruta, AT Adaishapada, 1.04 Run Helpline
PO/Distt. Bolangir
48. Bhairabi Club, AT Kurumpada, 1.04 Run Helpline
PO Hadapada, Dist. Khurda
49. Bharat Integrated Social Welfare 5.99 Run Shelter Home
Agency (BISWA), Sambalpur and Helpline
50. Bright Career Academy, Dolomandap, 1.04 Run Helpline
PO-Jeypore, Distt. Koraput
51. Eklabya Voluntary Blood Donor 1.05 Run Helpline
Association, Distt. Bargaih
52. Gandhi Orissa Balashram, AT PO 5.10 Run Shelter Home
Gradapur, Distt. Bhadrak

Statistics on Women in India 2007
255
S.No. India/State Name of Organization Assisted Amount Released Purpose of Grant
as on 20.12.2005
(Rs. in lakh)
53. Gangadhar Yubak Sangha, 5.09 Run Shelter Home
Bhawaipatna, Kalahandi
54. Institute of Women Welfare, 1.05 Run Helpline
Behrampur, Ganjam
55. Jayanti Pathagar, AT- Sahapada, PO 1.04 Run Helpline
Brahmabarada, Dist. Jajpur
56. Maharishi Dayananda Service Mission, 1.05 Run Helpline
At. Gudianali, Dist. Dhenkanal
57. Nilachal Nari Seba Samity, Puri 1.44 Run Shelter Home
58. Nilachal Seva Pratisthan, AT/PO 1.05 Run Helpline
Kanas, Dist. Puri
59. Prakalpa, AT/PO Jyotipur, 1.05 Run Helpline
Dist. Keonjhar
60. People’s Fourm, Khurda 5.10 Run Shelter Home
61. Radha Krishna Club, Dist. 1.04 Run Helpline
Jagatsinghpur
62. Ramakrishan Pathghar, AT/PO Borida, 1.04 Run Helpline
Ganjam
63. Research Academy for Rural 1.05 Run Helpline
Enrichment (RARE), AT/PO
Gokerneshwar Pada, Distt. Subarnpur
64. Rural Development Action Cell, AT 1.05 Run Helpline
Tulsichaura, PO Baraipada,
Distt. Mayurbhanj
65. Sahara, AT/PO Gorupur, Rayagada 1.04 Run Helpline
66. Sarvodaya Samiti, AT/PO Dharamgarh, 1.04 Run Helpline
Kalahandi, Distt. Koraput
67. SEHADA, Socio Economic Health & 1.04 Run Helpline
Agricultural Development Association,
AT/PO Old Power House,
Dist. Jharsuguda
68. Society for Weaker Community, 1.05 Run Helpline
Dist. Bhadrak
69. Support, Taanla Sahi, Distt. Deoghar 1.04 Run Helpline
70. Universal Service Organization, 4.65 Run Shelter Home
AT Devadala, PO Komatalpeta,
Distt. Rayagada
71. Voluntary Institute for Rural 1.05 Run Helpline
Development AT Titigaon,
PO AIDA, Angul
Punjab 6.06* 2.02*
(31.3.06) (15.1.07)

Statistics on Women in India 2007
256
S.No. India/State Name of Organization Assisted Amount Released Purpose of Grant
as on 20.12.2005
(Rs. in lakh)
72. Association for Social Health in India, 1.01 Run Helpline
Jalandhar
73. Border Area Project, Wagha, 1.01 Run Helpline
Distt. Amritsar
74. Indian Red Cross Society, Faridkot 1.01 Run Helpline
75. Indian Red Cross Society, Ferozepur 1.01 Run Helpline
76. Indian Red Cross Society, Moga 1.01 Run Helpline
77. Indian Red Cross Society, Patiala 1.01 Run Helpline
78. Indian Red Cross Society, Ropar 1.01 Run Helpline
79. Progressive Youth Fourm, 1.01 Run Helpline
V & PO Gagga, Patiala
80. Shri Saran Welfare Society, Ludhiana 1.01 Run Helpline
Rajasthan 11.85* -
(31.3.06) (15.1.07)
81. Adarsh Saroj Vidya Mandir Samiti, 11.86 Run Shelter Home
Dausa
Tamil Nadu 44.75* 22.85*
(31.3.06) (15.1.07)
82. Community Action for Rural 4.35 Run Shelter Home
Development (CARD),
Samathuvapuram, Pullivalam,
Pudukkottai
83. Kalaiselvi Karunalaya Social 5.10 Run Shelter Home
Welfare Society
84. Maitri Society, Koduvilarpatty, 5.40 Run Shelter Home
Distt. Theni and Helpline
85. Mass Action Network India Trust, 5.10 Run Shelter Home
Saligramum, Chennai
86. Marilaya, Thannirpandal, 5.39 Run Shelter Home
Distt. Coimbatore and Helpline
87. Shri Venkateswara Orphanage, 4.86 Run Shelter Home
Kadoveli, Distt. Thanjavur
88. Society for Rural Development, 5.10 Run Shelter Home
Namakkal
89. Society for Rural Development 5.10 Run Shelter Home
Promotional Services, Vellore
90. Vinmathi Educational and Rural 4.35 Run Shelter Home
Development Society, Manaparai,
Trichy

Statistics on Women in India 2007
257
S.No. India/State Name of Organization Assisted Amount Released Purpose of Grant
as on 20.12.2005
(Rs. in lakh)
Uttar Pradesh 5.77* 95.99*
(31.3.06) (15.1.07)
91. Deep Jan Kalyan Samitee, Bareilly 1.05 Run Helpline
92. Lohia Public School Samiti, Lucknow 1.04 Run Helpline
93. Uttar Pradesh Government, Vrindavan 3.68 Run Shelter Home
Uttarakhand - 21.19*
(31.3.06) (15.1.07)
West Bengal 35.77* 42.81*
(31.3.06) (15.1.07)
94. All Bengal Women’s Union, Kolkata 1.14 Run Shelter Home
95. Centre for Communication and 5.40 Run Shelter Home
Development, Baikunthdeb and Helpline
Road, 24 Parganas
96. Dulal Samriti Samsad, PO 5.40 Run Shelter Home
Khajurdana, Distt. Hoogly and Helpline
97. Garden Reach Slum Development, 2.42 Run Shelter Home
Tilakpara, Kolkata
98. Janashiksha Prochar Kendra, Kolkata 4.35 Run Shelter Home
99. Jaya Prakash Institute of Social 5.07 Run Shelter Home
Change, Salt Lake, Kolkata
100. Malipukur Samaj Unnayan Samity, 3.78 Run Shelter Home
V&PO Jujersa, Distt. Howrah
101. Saujatya, Ashutosh Colony, Kolkata 1.94 Run Shelter Home
CSWB (not a State/UT) 72.45* 69.68*
(31.3.06) (15.1.07)
India 740.41* 605.06*
(31.3.06) (15.1.07)
Notes: CSWB: Central Social Welfare Board
Source: India, Ministry of Women and Child Development. (2006). Annual Report 2005-06. New Delhi. P. 216 - 219.
*India, Ministry of Women and Child Development. (2007). Annual Report 2006-07. New Delhi. P. 186.

Statistics on Women in India 2007
258
Women’s Helplines
Women’s Helplines, which be came operational since 2002-03, have been set up in
many cities and towns to provide assistance to women in distress or in problem situations.
The woman or anyone on her behalf can dial a toll-free number 1091 and receive information
or guidance telephonically. The details of Women’s Helplines sanctioned and beneficiaries
assisted is given in Table 109.
Table 109: Women’s Helplines, 2005
S. India/State/UT No. of Amount Amount No. of
No. Helplines Sanctioned Released (Rs. Beneficiaries
Sanctioned (Rs. in Lakhs) in Lakhs)
India 38 74.60 64.47 6172
1. Andhra Pradesh 3 6.27 5.42 538
2. Arunachal Pradesh 1 2.09 1.88 13
3. Assam 1 2.09 1.95 56
4. Bihar - - - -
5. Chhattisgarh - - - -
6. Delhi 2 4.18 3.91 1340
7. Goa - - - -
8. Gujarat 2 4.18 2.91 430
9. Haryana - - - -
10. Himachal Pradesh - - - -
11. Jammu & Kashmir - - - -
12. Jharkhand - - - -
13. Karnataka 2 4.18 3.96 68
14. Kerala 2 4.18 3.84 475
15. Madhya Pradesh 1 2.09 1.88 141
16. Maharashtra 6 12.54 10.66 743
17. Manipur - - - -
18. Meghalaya - - - -
19. Mizoram - - - -

Statistics on Women in India 2007
259
S. India/State/UT No. of Amount Amount No. of
No. Helplines Sanctioned Released Beneficiaries
Sanctioned (Rs. in Lakhs) (Rs. in Lakhs)
20. Nagaland - - - -
21. Orissa - - - -
22. Punjab 1 2.09 1.90 89
23. Rajasthan 2 4.18 3.79 107
24. Sikkim 1 2.09 1.04 58
25. Tamil Nadu 3 6.27 5.33 1333
26. Tripura - - - -
27. Uttar Pradesh 1 2.09 1.98 170
28. Uttarakhand - - - -
29. West Bengal 6 12.54 10.89 569
Union Territories
30. Andaman & Nicobar 1 0.40 0.20 -
Islands
31. Chandigarh - - - -
32. Dadra & Nagar Haveli 1 2.09 1.88 42
33. Daman & Diu
34. Lakshadweep - - - -
35. Pondicherry 2 1.05 1.05 -
Source: Central Social Welfare Board (CSWB). (2005). Annual Report 2004-05. New Delhi. P.29-30.
Mahila Mandal Programme
In rural areas, many restrictions are placed on the movement of women. However, if
women are organised into groups, it not only empowers them by increasing their collective
strength, but also makes it socially more acceptable that women can travel to urban areas
to market their products if they are in a group. Under this programme, services like balwadis
for children, craft activities, social education, maternity services for women, etc. are provided.
Beneficiaries under the Mahila Mandal Programme are given in Table 110.

Statistics on Women in India 2007
260
Table 110: Mahila Mandal Programme Beneficiaries, 2004-05
S.No. India/State/UT Mahila Mandal Programme
No. of No. of Amount No. of
Centres Institutions Released (Rs.) Beneficiaries
India 184 163 16,000,000 48535
1. Andhra Pradesh 9 19 207302 N.G
2. Arunachal Pradesh - - - -
3. Assam 11 11 797245 2540
4. Bihar 3 1 61613 N.G
5. Chhattisgarh - - - -
6. Delhi 2 2 149725 475
7. Goa - - - -
8. Gujarat 16 13 647235 6302
9. Haryana - - - -
10. Himachal Pradesh 5 5 2650990 5929
11. Jammu & Kashmir - - - -
12. Jharkhand - - - -
13. Karnataka 6 6 - 89
14. Kerala 35 35 195559 1664
15. Madhya Pradesh - - - -
16. Maharashtra 9 9 - 433
17. Manipur - - - -
18. Meghalaya 8 8 53455 2641
19. Mizoram - - - -
20. Nagaland - - - -
21. Orissa 12 12 4814264 8200
22. Punjab 12 8 2641146 N.G

Statistics on Women in India 2007
261
S.No. India/State/UT Mahila Mandal Programme
No. of No. of Amount No. of
Centres Institutions Released (Rs.) Beneficiaries
23. Rajasthan - - - -
24. Sikkim - - - -
25. Tamil Nadu 7 7 40247 -
26. Tripura 4 4 712998 280
27. Uttar Pradesh 9 7 565727 900
28. Uttarakhand 36 1 96025 17258
29. West Bengal 9 35 2400469 1824
Union Territories
30. Andaman & - - - -
Nicobar Islands
31. Chandigarh - - - -
32. Dadra & Nagar Haveli - - - -
33. Daman & Diu - - - -
34. Lakshadweep - - - -
35. Pondicherry - - - -
Notes: N.G. Not Given.
Source: Central Social Welfare Board (CSWB). (2005). Annual Report 2004-05. New Delhi. P.40.
Awareness Generation Camps
The Central Social Welfare Board (CSWB) has been funding Awareness Generation
Camps for Women since 1986-87. Under this scheme, women are empowered by making
them aware about their various rights, including legal rights, AIDS awareness, property
and inheritance rights, etc. The number of beneficiaries and units assisted under Awareness
Generation Scheme is given in Table 111.

Statistics on Women in India 2007
262
Table 111: Awareness Generation Camps, 2005
S. No. India/State/UT Awareness Generation Camps
No. of No. of Units Amount No. of
Institutions Sanctioned Released Beneficiaries
(Rs. in Lakhs)
India 596 4776 487.47 119150
1. Andhra Pradesh 20 150 14.97 3750
2. Arunachal Pradesh 7 75 07.15 1875
3. Assam 4 114 11.21 2850
4. Bihar 30 268 26.59 6700
5. Chhattisgarh 20 149 13.83 3725
6. Delhi 10 110 14.02 2750
7. Goa - 20 02.00 500
8. Gujarat 28 236 23.45 5900
9. Haryana 15 161 15.90 4025
10. Himachal Pradesh 9 131 13.10 3275
11. Jammu & Kashmir 5 110 10.24 2750
12. Jharkhand
13. Karnataka 7 174 17.07 4350
14. Kerala 10 116 23.05 2900
15. Madhya Pradesh 120 426 45.80 10650
16. Maharashtra 53 303 30.86 7575
17. Manipur 5 74 06.35 1850
18. Meghalaya 6 72 07.37 1800
19. Mizoram 6 56 05.80 1400
20. Nagaland 4 70 06.80 1750
21. Orissa 33 219 19.98 5475
22. Punjab 12 105 09.85 2625

Statistics on Women in India 2007
263
S. No. India/State/UT Awareness Generation Camps
No. of No. of Units Amount No. of
Institutions Sanctioned Released Beneficiaries
(Rs. in Lakhs)
23. Rajasthan 27 190 19.13 4750
24. Sikkim - 40 04.07 1000
25. Tamil Nadu 48 345 34.83 8625
26. Tripura 6 59 05.80 1475
27. Uttar Pradesh 71 454 46.28 11350
28. Uttarakhand 6 79 07.39 1975
29. West Bengal 21 215 21.15 5375
Union Territories
30. Andaman & Nicobar 2 50 04.45 1250
Islands
31. Chandigarh - 60 05.01 1250
32. Dadra & Nagar
Haveli - - - -
33. Daman & Diu - - - -
34. Lakshadweep - 52 05.20 1300
35. Pondicherry 11 93 08.77 2325
Source: Central Social Welfare Board (CSWB). (2005). Annual Report 2004-05. New Delhi. P.31-32.

Statistics on Women in India 2007
264
Female Headed Households
The National Sample Survey Organization conducted a survey on the employment and
unemployment situation in India in 2004-05. It was found that about 11% households in
both rural and urban areas were headed by females. Compared to all households, they
had, on an average, a relatively smaller household size and a much higher sex ratio.
Female headed households are in need of special support services, as women have to
fulfil both economic and domestic roles. The number of female headed households is
given in Table 112.
Table 112: Female Headed Households (FHH) per 1000 Households in India/ States
and UTs, 2005
S. No. India/State/UT Number of Female Headed
Households per 1000 Households
Rural Urban
India 113 111
1. Andhra Pradesh 136 132
2. Arunachal Pradesh 98 110
3. Assam 76 114
4. Bihar 111 74
5. Chhattisgarh 89 99
6. Delhi 4 79
7. Goa 264 158
8. Gujarat 104 95
9. Haryana 86 92
10. Himachal Pradesh 194 129
11. Jammu & Kashmir 56 67
12. Jharkhand 75 117
13. Karnataka 166 152
14. Kerala 233 251
15. Madhya Pradesh 62 71
16. Maharashtra 106 97
17. Manipur 115 163

Statistics on Women in India 2007
265
S. No. India/State/UT Number of Female Headed
Households per 1000 Households
Rural Urban
18. Meghalaya 157 270
19. Mizoram 123 127
20. Nagaland 38 45
21. Orissa 96 100
22. Punjab 93 108
23. Rajasthan 105 79
24. Sikkim 89 114
25. Tamil Nadu 163 146
26. Tripura 107 141
27. Uttar Pradesh 187 160
28. Uttarakhand 98 76
29. West Bengal 90 121
Union Territories
30. Andaman & Nicobar Islands 92 111
31. Chandigarh 58 71
32. Dadra & Nagar Haveli 35 17
33. Daman & Diu 88 145
34. Lakshadweep 339 288
35. Pondicherry 243 188
Source: India, Ministry of Statistics and Programme Implementation, National Sample Survey Organisation.
2006. Employment and Unemployment Situation in India 2004-05: Part I : NSS 61st Round : July
2004 – June 2005. New Delhi. P.37.

Statistics on Women in India 2007
266
10. Crime against Women and Children
Crimes against women have been increasing over the years. The reported crimes
against women in 2005 were 155,553 (under IPC and SLL) compared to 154,333 during
2004, recording a marginal increase of 0.8% in 2005. The rate of crime decreased marginally
from 14.2 during 2004 to 14.1 during 2005. Delhi and Andhra Pradesh were the two states
reporting the highest crime rate at 27.6 and 26.1 respectively. About 92% of the crimes
were IPC crimes and 8% were crimes under special and local laws (SLL). Although
women may be victims of many crimes but rape is one of the most heinous crimes. Rape
is defined under Section 375 of the Indian Penal Code (IPC) as the unlawful and carnal
knowledge by a man of a woman (a) against her will, (b) without her consent, (c) consent
obtained by putting her in fear of hurt, (d) obtaining her consent by making her believe that
she is his lawfully married wife, and (e) with or without her consent when she is under 16
years of age. Exception to Section 375 is the sexual intercourse by a man with his own
wife, the wife not being under 15 years of age.
Punishment for Rape
Normal punishment for rape is minimum 7 to 10 years imprisonment and maximum life
imprisonment and fine. Punishment for raping one’s own wife, who is not under 12 years,
is two years imprisonment or fine or both.
Public Interest Litigation
The Supreme Court has decreed that any citizen, can on behalf of any other person,
petition the Court regarding any serious matter which involves the fundamental rights of a
citizen of India. Even a letter addressed to the Court can be treated as a petition on which
suo moto action can be initiated.
Lok Adalats
To redress the grievances or complaints of common citizens who wish to avoid lengthy,
complicated, expensive court procedures, provision has been made to dispense justice
through Lok Adalats or People’s Courts, wherein a bench of judges (or tribunal) listens to
the petitions and dispenses justice at the same time in accordance with law. This is a way
of Courts moving out to people to provide speedy justice to the common man, and reducing
the load of cases pending in Courts. Cases which pertain to minor charges can be settled
out of Court in an informal atmosphere.
Legislative Measures
The special enactments and legislation to safeguard women and their interests specifically
are:

Statistics on Women in India 2007
267
1. The Employees State Insurance Act, 1948
2. The Plantation Labour Act, 1951
3. The Family Courts Act, 1954
4. The Special Marriage Act, 1954
5. The Hindu Marriage Act, 1956
6. The Hindu Succession Act, 1956
7. Immoral Traffic (Prevention) Act, 1956
8. The Maternity Benefit Act, 1961 (Amended in 1995)
9. Dowry Prohibition Act, 1961
10.The Medical Termination of Pregnancy Act, 1971
11. The Contract Labour (Regulation and Abolition), 1976
12.The Equal Remuneration Act, 1976
13.The Child Marriage Restraint (Amendment) Act, 1979 (Amended 2006)
14.The Criminal Law (Amendment) Act, 1983
15.The Factory Amendment) Act, 1986
16. Indecent Representation of Women (Prohibition) Act, 1986
17.Commission of Sati (Prevention) Act, 1987
18.Sexual Harassment of Women at Work Place, 1999
19.The Domestic Violence (Prevention) Act, 2006
Child Rape
The incidence of crime against children was 14975 in 2005 compared to 14,423 in
2004, reporting an increase of 3.8 per cent. The crime rate increased marginally from 1.3
in 2004 to 1.4 in 2005. The rate was highest in Delhi (6.5), followed by Chandigarh (5.7)
and Madhya Pradesh (5.6) compared to the national average of 1.4. Among IPC crimes,
child rape cases increased by 13.7%, from 3542 cases in 2004 to 4026 cases in 2005.
Madhya Pradesh (870) and Maharashtra (634) reported the highest number of child rape
cases and accounted for 37.3% of the total cases reported in the country. The incidence of
child rape is given in Table 113.

Statistics on Women in India 2007
268
Table 113: Victims of Rape by Age Group, 1991-2005
S.No. Year Age Below Group Share of Child Rape Victims
10 years 10-16 years to Total Rape Victims (%)
1. 1991 1099 2630 35.8
2. 1992 532 2581 26.5
3. 1993 634 2759 27.8
4. 1994 734 3244 30.2
5. 1995 747 3320 29.5
6. 1996* 608 3475 27.5
7. 1997* 770 3644 28.8
8. 1998* 646 3507 27.4
9. 1999* 731 2422 $ 20.4
10. 2000* 744 2388 $ 19.0
11. 2001** 530** 1440**
(10-14 Years)
3911**
(14-18 Years)
12. 2002 # 411 # 854 # 14.90
(10-14 Years)
1325 #
(14-18 Years)
13. 2005 @ 557 @ 1174 @ 22.18
(10-14 Years)
2344 @
(14-18 Years)
Note: $ Age Group 11-15 Years
Source: UNFPA. (2000). Adolescents in India: A Profile. New Delhi. P.18.
* India, Ministry of Home Affairs, National Crime Records Bureau. (2002).
Crime in India 2000. New Delhi. P.212.
** India, Ministry of Home Affairs, National Crime Records Bureau. (2003).
Crime in India 2001. New Delhi P.273.
# India, Ministry of Home Affairs, National Crime Records Bureau. (2004).
Crime in India 2002. New Delhi P.283.
@ India, Ministry of Home Affairs, National Crime Records Bureau. (2006).
Crime in India 2005. New Delhi P.259.

Statistics on Women in India 2007
269
The incidence and rate of crime against children is given in Table 114.
Table 114: Incidence and Rate of Crime against Children, 2005
S. No. India/State/UT Crime against Children
Incidence Percentage Estimated Rate of Total
Contribution Mid-Year Cognizable
to All India Population Crimes
Total (in lakhs) @
India 14975 100.0 11027.91 1.4
1. Andhra Pradesh 950 6.3 798.09 1.2
2. Arunachal Pradesh 22 0.1 11.59 1.9
3. Assam 199 1.3 286.62 0.7
4. Bihar 115 0.8 898.20 0.1
5. Chhattisgarh 997 6.7 225.82 4.4
6. Delhi 1026 6.9 157.43 6.5
7. Goa 53 0.4 15.07 3.5
8. Gujarat 836 5.6 542.74 1.5
9. Haryana 374 2.5 227.92 1.6
10. Himachal Pradesh 131 0.9 63.81 2.1
11. Jammu & Kashmir 57 0.4 113.71 0.5
12. Jharkhand 97 0.6 288.85 0.3
13. Karnataka 191 1.3 557.02 0.3
14. Kerala 386 2.6 333.38 1.2
15. Madhya Pradesh 3721 24.8 659.52 5.6
16. Maharashtra 2305 15.4 1031.59 2.2
17. Manipur 20 0.1 25.39 0.8
18. Meghalaya 81 0.5 24.52 3.3
19. Mizoram 0 0.0 9.47 0.0
20. Nagaland 0 0.0 21.17 0.0
21. Orissa 86 0.6 387.53 0.2
22. Punjab 211 1.4 257.64 0.8
23. Rajasthan 580 3.9 616.68 0.9
24. Sikkim 25 0.2 5.75 4.3
25. Tamil Nadu 288 1.9 648.56 0.4
26. TripuraRa 28 0.2 33.90 0.8
27. Uttar Pradesh 1801 12.0 1814.88 1.0
28. Uttarakhand 76 0.5 91.19 0.8
29. West Bengal 236 1.6 850.55 0.3
Union Territories
30. Andaman & Nicobar Islands 8 0.1 3.88 2.1
31. Chandigarh 57 0.4 9.98 5.7
32. Dadra & Nagar Haveli 5 0.0 2.44 2.0
33. Daman & Diu 5 0.0 1.75 2.9
34. Lakshadweep 0 0.0 0.65 0.0
35. Pondicherry 8 0.1 10.32 0.8
Notes: @ Based on actual Census 2001
Rate of total cognizable crime : Number of crimes per 1,00,000 inhabitants.
1 lakh = 100,000
Source: India, Ministry of Home Affairs, National Crime Records Bureau. (2006).
Crime in India 2005. New Delhi. P. 271.

Statistics on Women in India 2007
270
The incidence of murder and infanticide of children is given in Table 115.
Table 115: Crime against Children - Murder and Infanticide, 2005
S.No. India/State/UT Estimated Murder InfanticideMid-Year
Population(in lakhs)
@ 2005 I P R I P R
India 11027.91 1219 100.0 0.1 108 100.0 0.0
1. Andhra Pradesh 798.09 56 4.6 0.1 1 0.9 0.0
2. Arunachal Pradesh 11.59 0 0.0 0.0 0 0.0 0.0
3. Assam 286.92 12 1.0 0.0 1 0.9 0.0
4. Bihar 898.20 25 0.0 2.1 1 0.9 0.0
5. Chhattisgarh 225.82 28 0.1 2.3 28 2.3 0.1
6. Delhi 157.43 34 2.8 0.2 0 0.0 0.0
7. Goa 15.07 4 0.3 0.3 0 0.0 0.0
8. Gujarat 542.74 74 6.1 0.1 2 1.9 0.0
9. Haryana 227.92 38 3.1 0.2 0 0.0 0.0
10. Himachal Pradesh 63.81 6 0.5 0.1 0 0.0 0.0
11. Jammu & Kashmir 113.71 4 0.3 0.0 0 0.0 0.0
12. Jharkhand 288.85 33 2.7 0.1 33 2.7 0.1
13. Karnataka 557.02 42 3.4 0.1 5 4.6 0.0
14. Kerala 333.38 45 3.7 0.1 0 0.0 0.0
15. Madhya Pradesh 659.52 122 10.0 0.2 28 0.0 25.9
16. Maharashtra 1031.59 189 15.5 0.2 3 2.8 0.0
17. Manipur 25.39 3 0.2 0.1 3 0.2 0.1
18. Meghalaya 24.52 8 0.7 0.3 1 0.9 0.0
19. Mizoram 9.47 0 0.0 0.0 0 0.0 0.0
20. Nagaland 21.17 0 0.0 0.0 0 0.0 0.0
21. Orissa 387.53 9 0.7 0.0 9 0.7 0.0
22. Punjab 257.64 17 1.4 0.1 17 1.4 0.1
23. Rajasthan 616.68 1 0.9 0.0 56 4.6 0.1
24. Sikkim 5.75 0 0.0 0.0 1 0.9 0.2
25. Tamil Nadu 648.56 53 4.3 0.1 1 0.9 0.0
26. Tripura 33.90 1 0.1 0.0 0 0.0 0.0
27. Uttar Pradesh 1814.88 346 28.4 0.2 44 40.7 0.0
28. Uttarakhand 91.19 6 0.5 0.1 0 0.0 0.0
29. West Bengal 850.55 2 0.2 0.0 0 0.0 0.0
Union Territories
30. Andaman & Nicobar Islands 3.88 1 0.1 0.3 0 0.0 0.0
31. Chandigarh 9.98 3 0.2 0.3 0 0.0 0.0
32. Dadra & Nagar Haveli 2.44 1 0.1 0.4 0 0.0 0.0
33. Daman & Diu 1.75 1 0.1 0.6 0 0.0 0.0
34. Lakshadweep 0.65 0 0.0 0.0 0 0.0 0.0
35. Pondicherry 10.32 0 0.0 0.0 0 0.0 0.0
Notes: @ Based on actual Census 2001
I- Incidence P-Percentage
R-Rate (Number of crimes per 1,00,000 inhabitants)
1 Lakh = 1,00,000
Source: India, Ministry of Home Affairs, National Crime Records Bureau. (2006). Crime in India 2005.
New Delhi. P.273

Statistics on Women in India 2007
271
The incidence of rape, kidnapping and abduction of children, and foeticide is given in
Table 116.
Table 116: Crime against Children - Rape, Kidnapping and Abduction,
Foeticide, 2005
S. No. India/State/UT Estimated Rape Kidnapping and Foeticide
Mid-Year Abduction
Population
(in lakhs) @ I P R I P R I P R
India 11027.91 4026 100.0 0.4 3518 100.0 0.3 86 100.0 0.0
1. Andhra Pradesh 798.09 315 7.8 0.4 332 9.4 0.4 1 1.2 0.0
2. Arunachal Pradesh 11.59 10 0.2 0.9 12 0.3 1.0 0 0.0 0.0
3. Assam 286.92 90 2.2 0.3 18 0.5 0.1 1 1.2 0.0
4. Bihar 898.20 8 0.2 0.00 72 2.0 0.1 0 0.0 0.0
5. Chhattisgarh 225.82 382 9.5 1.7 110 3.1 0.5 21 24.4 0.1
6. Delhi 157.43 235 5.8 1.5 507 14.4 3.2 3 3.5 0.0
7. Goa 15.07 15 0.4 1.0 11 0.3 0.7 0 0.0 0.0
8. Gujarat 542.74 90 2.2 0.2 285 8.1 0.5 4 4.7 0.0
9. Haryana 227.92 131 3.3 0.6 101 2.9 0.4 8 9.3 0.0
10. Himachal Pradesh 63.81 58 1.4 0.9 37 1.1 0.6 1 1.2 0.0
11. Jammu & Kashmir 113.71 4 0.1 0.0 48 1.4 0.4 0 0.0 0.0
12. Jharkhand 288.85 22 0.5 0.1 11 0.3 0.0 0 0.0 0.0
13. Karnataka 557.02 48 1.2 0.1 35 1.0 0.1 7 8.1 0.0
14. Kerala 333.38 140 3.5 0.4 45 1.3 0.1 1 1.2 0.0
15. Madhya Pradesh 659.52 870 21.6 1.3 240 6.8 0.4 12 14.0 0.0
16. Maharashtra 1031.59 634 15.7 0.6 420 11.9 0.4 4 4.7 0.0
17. Manipur 25.39 4 0.1 0.2 13 0.4 0.5 0 0.0 0.0
18. Meghalaya 24.52 51 1.3 2.1 11 0.3 0.4 0 0.0 0.0
19. Mizoram 9.47 0 0.0 0.0 0 0.0 0.0 0 0.0 0.0
20. Nagaland 21.17 0 0.0 0.0 0 0.0 0.0 0 0.0 0.0
21. Orissa 387.53 28 0.7 0.1 16 0.5 0.0 0 0.0 0.0
22. Punjab 257.64 51 1.3 0.2 59 1.7 0.2 12 14.0 0.0
23. Rajasthan 616.68 246 6.1 0.4 132 3.8 0.2 10 11.6 0.0
24. Sikkim 5.75 14 0.3 2.4 2 0.1 0.3 1 1.2 0.2
25. Tamil Nadu 648.56 115 2.9 0.2 69 2.0 0.1 0 0.0 0.0
26. TripuraRa 33.90 20 0.5 0.6 6 0.2 0.2 0 0.0 0.0
27. Uttar Pradesh 1814.88 394 9.8 0.2 749 21.3 0.4 0 0.0 0.0
28. Uttarakhand 91.19 18 0.4 0.2 41 1.2 0.4 0 0.0 0.0
29. West Bengal 850.55 6 0.1 0.0 102 2.9 0.1 0 0.0 0.0
Union Territories
30. Andaman & 3.88 2 0.0 0.5 2 0.1 0.5 0 0.0 0.0
Nicobar Islands
31. Chandigarh 9.98 21 0.5 2.1 23 0.7 2.3 0 0.0 0.0
32. Dadra & Nagar Haveli 2.44 0 0.0 0.0 4 0.1 1.6 0 0.0 0.0
33. Daman & Diu 1.75 1 0.0 0.6 2 0.1 1.1 0 0.0 0.0
34. Lakshadweep 0.65 0 0.0 0.0 0 0.0 0.0 0 0.0 0.0
35. Pondicherry 10.32 3 0.1 0.3 3 0.1 0.3 0 0.0 0.0
Notes: @ Based on actual Census 2001
I - Incidence P - Percentage R - Rate (Number of crimes per 1,00,000 inhabitants)
1 Lakh = 1,00,000
Source: India, Ministry of Home Affairs, National Crime Records Bureau. (2006). Crime in India 2005. New
Delhi. P. 273, 275.

Statistics on Women in India 2007
272
The incidence of abetment of suicide, exposure and abandonment, and child marriage
is given in Table 117.
Table 117: Crime against Children – Abetment of Suicide, Exposure and
Abandonment, Child Marriage Restraint Act, 2005
S.No India/State/UT Estimated Abetment of Exposure and Child Marriage
Mid-Year Suicide Abandonment Restraint Act
Population
(in lakhs) @ I P R I P R I P R
India 11027.91 43 100.0 0.0 933 100.0 0.1 122 100.0 0.0
1. Andhra Pradesh 798.09 4 9.3 0.0 99 10.6 0.1 9 7.4 0.0
2. Arunachal Pradesh 11.59 0 0.0 0.0 0 0.0 0.0 0 0.0 0.0
3. Assam 286.92 5 11.6 0.0 0 0.0 0.0 0 0.0 0.0
4. Bihar 898.20 0 0.00 0.0 0 0.0 0.0 4 3.3 0.0
5. Chhattisgarh 225.82 8 18.6 0.0 6 0.6 0.0 3 2.5 0.0
6. Delhi 157.43 0 0.0 0.0 47 5.0 0.3 0 0.0 0.0
7. Goa 15.07 0 0.0 0.0 2 0.2 0.1 0 0.0 0.0
8. Gujarat 542.74 1 2.3 0.0 141 15.1 0.3 25 20.5 0.0
9. Haryana 227.92 0 0.0 0.0 32 3.4 0.1 7 5.7 0.0
10. Himachal Pradesh 63.81 0 0.0 0.0 12 1.3 0.2 3 2.5 0.0
11. Jammu & Kashmir 113.71 0 0.0 0.0 0 0.0 0.0 0 0.0 0.0
12. Jharkhand 288.85 0 0.0 0.0 0 0.0 0.0 0 0.0 0.0
13. Karnataka 557.02 1 2.3 0.0 18 1.9 0.0 3 2.5 0.0
14. Kerala 333.38 1 2.3 0.0 3 0.3 0.0 3 2.5 0.0
15. Madhya Pradesh 659.52 7 16.3 0.0 95 10.2 0.1 18 14.8 0.0
16. Maharashtra 1031.59 11 25.6 0.0 321 34.4 0.3 22 18.0 0.0
17. Manipur 25.39 0 0.0 0.0 0 0.0 0.0 0 0.0 0.0
18. Meghalaya 24.52 0 0.0 0.0 0 0.0 0.0 0 0.0 0.0
19. ‘ Mizoram 9.47 0 0.0 0.0 0 0.0 0.0 0 0.0 0.0
20. Nagaland 21.17 0 0.0 0.0 0 0.0 0.0 0 0.0 0.0
21. Orissa 387.53 0 0.0 0.0 0 0.0 0.0 0 0.0 0.0
22. Punjab 257.64 0 0.0 0.0 13 1.4 0.1 11 9.0 0.0
23. Rajasthan 616.68 0 0.0 0.0 123 13.2 0.2 3 2.5 0.0
24. Sikkim 5.75 1 2.3 0.2 5 0.5 0.9 0 0.0 0.0
25. Tamil Nadu 648.56 1 2.3 0.0 6 0.6 0.0 4 3.3 0.0
26. TripuraRa 33.90 0 0.0 0.0 0 0.0 0.0 1 0.8 0.0
27. Uttar Pradesh 1814.88 2 4.7 0.0 0 0.0 0.0 4 3.3 0.0
28. Uttarakhand 91.19 0 0.0 0.0 0 0.0 0.0 0 0.0 0.0
29. West Bengal 850.55 1 2.3 0.0 0 0.0 0.0 2 1.6 0.0
Union Territories
30. Andaman & Nicobar 3.88 0 0.0 0.0 2 0.2 0.5 0 0.0 0.0
Islands
31. Chandigarh 9.98 0 0.0 0.0 7 0.8 0.7 0 0.0 0.0
32. Dadra & Nagar Haveli 2.44 0 0.0 0.0 0 0.0 0.0 0 0.0 0.0
33. Daman & Diu 1.75 0 0.0 0.0 1 0.1 0.6 0 0.0 0.0
34. Lakshadweep 0.65 0 0.0 0.0 0 0.0 0.0 0 0.0 0.0
35. Pondicherry 10.32 0 0.0 0.0 0 0.0 0.0 0 0.0 0.0
Notes: @ Based on actual Census 2001
I- Incidence P-Percentage R-Rate (Number of crimes per 1,00,000 inhabitants)
1 Lakh = 1,00,000
Source: India, Ministry of Home Affairs, National Crime Records Bureau. (2006). Crime in India 2005. New Delhi.
P. 275, 277.

Statistics on Women in India 2007
273
The incidence of procuring minor girls, and buying and selling of minor girls for prostitution
is given in Table 118.
Table 118: Crime against Children – Procuration of Minor Girls, Buying
of Girls for Prostitution, Selling of Girls for Prostitution, 2005
S.No. India/State/UT Estimated Procuration of Buying of Girls Selling of Girls
Mid-Year Minor Girls for Prostitution for Prostitution
Population
(in lakhs) @ I P R I P R I P R
India 11027.91 145 100.0 0.0 28 100.0 0.0 50 100.0 0.0
1. Andhra Pradesh 798.09 48 33.1 0.1 9 32.1 0.0 2 4.0 0.0
2. Arunachal Pradesh 11.59 0 0.0 0.0 0 0.0 0.0 0 0.0 0.0
3. Assam 286.92 0 0.0 0.0 0 0.0 0.0 2 4.0 0.0
4. Bihar 898.20 5 3.4 0.0 0 0.0 0.0 0 0.0 0.0
5. Chhattisgarh 225.82 0 0.0 0.0 0 0.0 0.0 0 0.0 0.0
6. Delhi 157.43 0 0.0 0.0 9 32.1 0.1 0 0.0 0.0
7. Goa 15.07 0 0.0 0.0 0 0.0 0.0 0 0.0 0.0
8. Gujarat 542.74 12 8.3 0.0 0 0.0 0.0 0 0.0 0.0
9. Haryana 227.92 0 0.0 0.0 0 0.0 0.0 0 0.0 0.0
10. Himachal Pradesh 63.81 0 0.0 0.0 0 0.0 0.0 0 0.0 0.0
11. Jammu & Kashmir 113.71 0 0.0 0.0 0 0.0 0.0 0 0.0 0.0
12. Jharkhand 288.85 4 2.8 0.0 0 0.0 0.0 0 0.0 0.0
13. Karnataka 557.02 7 4.8 0.0 0 0.0 0.0 0 0.0 0.0
14. Kerala 333.38 21 14.5 0.1 0 0.0 0.0 0 0.0 0.0
15. Madhya Pradesh 659.52 4 2.8 0.0 1 3.6 0.0 0 0.0 0.0
16. Maharashtra 1031.59 5 3.4 0.0 6 21.4 0.0 1 2.0 0.0
17. Manipur 25.39 0 0.0 0.0 0 0.0 0.0 0 0.0 0.0
18. Meghalaya 24.52 4 2.8 0.2 0 0.0 0.0 0 0.0 0.0
19. Mizoram 9.47 0 0.0 0.0 0 0.0 0.0 0 0.0 0.0
20. Nagaland 21.17 0 0.0 0.0 0 0.0 0.0 0 0.0 0.0
21. Orissa 387.53 0 0.0 0.0 0 0.0 0.0 0 0.0 0.0
22. Punjab 257.64 2 1.4 0.0 1 3.6 0.0 0 0.0 0.0
23. Rajasthan 616.68 1 0.7 0.0 0 0.0 0.0 1 2.0 0.0
24. Sikkim 5.75 0 0.0 0.0 0 0.0 0.0 0 0.0 0.0
25. Tamil Nadu 648.56 0 0.0 0.0 0 0.0 0.0 0 0.0 0.0
26. TripuraRa 33.90 0 0.0 0.0 0 0.0 0.0 0 0.0 0.0
27. Uttar Pradesh 1814.88 3 2.1 0.0 0 0.0 0.0 0 0.0 0.0
28. Uttarakhand 91.19 9 6.2 0.1 0 0.0 0.0 0 0.0 0.0
29. West Bengal 850.55 20 13.8 0.0 2 7.1 0.0 44 88.0 0.1
Union Territories
30. Andaman & 3.88 0 0.0 0.0 0 0.0 0.0 0 0.0 0.0
Nicobar Islands
31. Chandigarh 9.98 0 0.0 0.0 0 0.0 0.0 0 0.0 0.0
32. Dadra & Nagar Haveli 2.44 0 0.0 0.0 0 0.0 0.0 0 0.0 0.0
33. Daman & Diu 1.75 0 0.0 0.0 0 0.0 0.0 0 0.0 0.0
34. Lakshadweep 0.65 0 0.0 0.0 0 0.0 0.0 0 0.0 0.0
35. Pondicherry 10.32 0 0.0 0.0 0 0.0 0.0 0 0.0 0.0
Notes: @ Based on actual Census 2001
I - Incidence P - Percentage R - Rate (Number of crimes per 1, 00,000 inhabitants)
1 Lakh = 1,00,000
Source: India, Ministry of Home Affairs, National Crime Records Bureau. (2006).
Crime in India 2005. New Delhi. P. 275, 277.

Statistics on Women in India 2007
274
Other miscellaneous crimes against children include immoral trafficking and child labour.
The incidence of other crime against children is given in Table 119.
Table 119: Crime against Children – Other Miscellaneous Crime against
Children, 2005
S.No. India/State/UT Estimated Other Miscellaneous Crime
Mid-Year (including Trafficking and Child Labour)
Population
(in lakhs) @ I P R
India 11027.91 4697 100.0 0.4
1. Andhra Pradesh 798.09 74 1.6 0.1
2. Arunachal Pradesh 11.59 0 0.0 0.0
3. Assam 286.92 70 1.5 0.2
4. Bihar 898.20 0 0.0 0.0
5. Chhattisgarh 225.82 430 9.2 1.9
6. Delhi 157.43 191 4.1 1.2
7. Goa 15.07 21 0.4 1.4
8. Gujarat 542.74 202 4.3 0.4
9. Haryana 227.92 57 1.2 0.3
10. Himachal Pradesh 63.81 14 0.3 0.2
11. Jammu & Kashmir 113.71 1 0.0 0.0
12. Jharkhand 288.85 27 0.6 0.1
13. Karnataka 557.02 25 0.5 0.0
14. Kerala 333.38 127 2.7 0.4
15. Madhya Pradesh 659.52 2324 49.5 3.5
16. Maharashtra 1031.59 689 0.7 14.7
17. Manipur 25.39 0 0.0 0.0
18. Meghalaya 24.52 6 0.1 0.2
19. Mizoram 9.47 0 0.0 0.0
20. Nagaland 21.17 0 0.0 0.0
21. Orissa 387.53 32 0.7 0.1
22. Punjab 257.64 36 0.8 0.1
23. Rajasthan 616.68 7 0.1 0.0
24. Sikkim 5.75 1 0.0 0.2
25. Tamil Nadu 648.56 39 0.8 0.1
26. TripuraRa 33.90 0 0.0 0.0
27. Uttar Pradesh 1814.88 259 5.5 0.1
28. Uttarakhand 91.19 2 0.0 0.0
29. West Bengal 850.55 57 1.2 0.1
Union Territories
30. Andaman & Nicobar Islands 3.88 1 0.0 0.3
31. Chandigarh 9.98 3 0.1 0.3
32. Dadra & Nagar Haveli 2.44 0 0.0 0.0
33. Daman & Diu 1.75 0 0.0 0.0
34. Lakshadweep 0.65 0 0.0 0.0
35. Pondicherry 10.32 2 0.0 0.2
Notes: @ Based on Actual Census 2001
I - Incidence P - Percentage R - Rate (Number of crimes per 1, 00,000 inhabitants)
1 Lakh = 1,00,000
Other Miscellaneous Crime includes immoral traffic and child labour
Source: India, Ministry of Home Affairs, National Crime Records Bureau. (2006).
Crime in India 2005. New Delhi. P. 277.

Statistics on Women in India 2007
275
Crime against Women
Despite the existence of a number of legislations for providing protection to women,
crime against women has increased. A total of 155,553 crimes against women were reported
in 2005 compared to 154,333 during 2004, recording an increased of 0.8% during 2005.
The incidence of various crimes against women under IPC and SLL is given in Table 120.
Table 120: Crimes against Women, 2005
S. No. Crime Head No. of Crimes against Variation Share of
Women in 2005 Total
over Crimes
2004 % against
Women
%
2002 2004 2005
1. Rape (Sec. 376 IPC) 16373 18233 18359 0.7 11.8
2. Kidnapping & Abduction
(Sec. 363 to 373 IPC) 14506 15578 15750 1.1 10.1
3. Dowry Death
(Sec. 302/304B IPC) 6822 7026 6787 -3.4 4.4
4. Torture (Sec. 498A IPC) 49237 58121 58319 0.3 37.5
5. Molestation (Sec. 354 IPC) 33943 34567 34175 -1.1 22.0
6. Sexual Harassment
(Sec. 509 IPC) 10155 10001 9984 -0.2 6.4
7. Importation of Girls
(Sec. 366-B IPC) 76 89 149 67.4 0.1
8. Sati Prevention Act, 1987 0 0 1 100.0 0.0
9. Immoral Traffic (P)
Act, 1956 6598 5748 5908 2.8 3.8
10. Indecent Rep. of
Women (P) Act, 1986 2508 1378 2917 111.7 1.9
11. Dowry Prohibition
Act, 1961 2816 3592 3204 -10.8 2.1
Total 143034 154333 155553 0.8 100.0
Source: India, Ministry of Home Affairs, National Crime Records Bureau. (2006). Crime in India 2005.
New Delhi. P.242.

Statistics on Women in India 2007
276
Source: India, Ministry of Home Affairs, National Crime Records Bureau. (2006). Crime in India 2005.
New Delhi. P. 242.

Statistics on Women in India 2007
277
The incidence and rate of crime against women in the various States and Union Territories
is given in Table 121.
Table 121: Incidence and Rate of Crime Committed against Women, 2005
S. No. India/State/UT Estimated Incidence Percentage Rate of Total
Mid-Year Contribution Cognizable
Population to All India
(In Lakhs) @ (I) Total (P) Crimes(R)
India 11027.91 155553 100.0 14.1
1. Andhra Pradesh 798.1 20819 13.4 26.1
2. Arunachal Pradesh 11.6 150 0.1 12.9
3. Assam 286.9 6027 3.9 21.0
4. Bihar 898.2 6019 3.9 6.7
5. Chhattisgarh 225.8 3599 2.3 15.9
6. Delhi 157.4 4351 2.8 27.6
7. Goa 15.1 121 0.1 8.0
8. Gujarat 542.7 6343 4.1 11.7
9. Haryana 227.9 4161 2.7 18.3
10. Himachal Pradesh 63.8 793 0.5 12.4
11. Jammu & Kashmir 113.7 2144 1.4 18.9
12. Jharkhand 288.9 2544 1.6 8.8
13. Karnataka 557.0 6057 3.9 10.9
14. Kerala 33.4 6762 4.3 20.3
15. Madhya Pradesh 659.5 14529 9.3 22.0
16. Maharashtra 1031.6 13370 8.6 13.0
17. Manipur 25.4 140 0.1 5.5
18. Meghalaya 24.5 131 0.1 5.3
19. Mizoram 9.5 95 0.1 10.0
20. Nagaland 21.2 37 0.0 1.7
21. Orissa 387.5 6249 4.0 16.1
22. Punjab 257.6 1969 1.3 7.6
23. Rajasthan 616.7 11657 7.5 18.9
24. Sikkim 5.8 62 0.0 10.8
25. Tamil Nadu 648.6 8648 5.6 13.3
26. Tripura 33.9 840 0.5 24.8
27. Uttar Pradesh 1814.9 14875 9.6 8.2
28. Uttarakhand 91.2 786 0.5 8.6
29. West Bengal 850.6 11887 7.6 14.0
Union Territories
30. Andaman & Nicobar Islands 3.9 22 0.0 5.7
31. Chandigarh 10.0 205 0.1 20.5
32. Dadra & Nagar Haveli 2.4 24 0.0 9.8
33. Daman & Diu 1.8 10 0.0 5.7
34. Lakshadweep 0.7 0 0.0 0.0
35. Pondicherry 10.3 127 0.1 12.3
Note: @ Based on Census 2001
Source: India, Ministry of Home Affairs, National Crime Records Bureau. (2006). Crime in India 2005.
New Delhi. P. 247.

Statistics on Women in India 2007
278
The incidence of rape cases and victims by age groups in States and Union
Territories is given in Table 122.
Table 122: Age Group-wise Victims of Rape Cases (Total), 2005
S.No. India/State/UT No. of No. of Rape Victims
Rape Upto 10-14 14-18 18-30 30-50 Above Total
Cases 10 Years Years Years Years 50 Victims
Reported Years Years
India 18359 557 1174 2344 10809 3381 111 18376
1. Andhra Pradesh 935 32 106 177 490 124 6 935
2. Arunachal Pradesh 35 3 5 2 25 0 0 35
3. Assam 1238 19 34 37 847 286 15 1238
4. Bihar 1147 0 6 2 872 267 0 1147
5. Chhattisgarh 990 15 112 255 392 200 16 990
6. Delhi 658 60 120 55 404 25 2 666
7. Goa 20 4 4 7 4 1 0 20
8. Gujarat 324 18 28 44 218 16 0 324
9. Haryana 461 0 34 97 181 143 6 461
10. Himachal Pradesh 141 11 17 30 63 18 2 141
11. Jammu & Kashmir 201 1 0 3 153 42 2 201
12. Jharkhand 753 6 7 12 384 343 1 753
13. Karnataka 343 14 13 21 234 61 0 343
14. Kerala 478 30 31 86 236 90 8 481
15. Madhya Pradesh 2921 102 294 474 1396 629 26 2921
16. Maharashtra 1545 85 132 421 735 174 2 1549
17. Manipur 25 3 1 0 14 7 0 25
18. Meghalaya 63 9 10 32 8 4 0 63
19. Mizoram 37 0 0 0 30 7 0 37
20. Nagaland 17 3 0 0 12 2 0 17
21. Orissa 799 18 0 10 636 132 3 799
22. Punjab 398 9 19 23 239 108 0 398
23. Rajasthan 993 21 44 181 515 216 16 993
24. Sikkim 18 4 5 7 2 2 0 20
25. Tamil Nadu 571 29 28 58 396 60 0 571
26. TripuraRa 162 3 13 4 129 13 0 162
27. Uttar Pradesh 1217 44 103 247 656 162 5 1217
28. Uttarakhand 133 3 3 12 95 20 0 133
29. West Bengal 1686 3 0 3 1451 228 1 1686
Union Territories
30. Andaman & Nicobar Islands 4 0 0 2 2 0 0 4
31. Chandigarh 33 7 4 10 5 7 0 33
32. Dadra & Nagar Haveli 5 0 0 0 5 0 0 5
33. Daman & Diu 2 0 1 0 0 1 0 2
34. Lakshadweep 0 0 0 0 0 0 0 0
35. Pondicherry 6 1 0 2 3 0 0 6
Source: India, Ministry of Home Affairs, National Crime Records Bureau. (2006). Crime in India 2005.
New Delhi. P. 259.

Statistics on Women in India 2007
279
DOWRY
Dowry, as defined in the Act, means any property or valuable security given or agreed
to be given either directly or indirectly (a) by one party to a marriage to the other party to
the marriage; or (b) by the persons of either party to a marriage or by any other person, to
either party to the marriage or to any other person; at or before 3[or any time after the
marriage] 4[in connection with the marriage of said parties but does not include] dower or
meher in the case of persons to whom the Muslim Personal Law (Shariat) applies.
Punishment for Giving or Accepting Dowry : The person or persons guilty of giving
or accepting dowry may be imprisoned for a minimum of five years and fined not less than
Rs.15,000 or the amount of the value of the dowry – whichever is more.
Death of a woman is known as dowry death, when it is caused by any burns or bodily
injury or occurs otherwise than under normal circumstances within seven years of her
marriage and it is shown that soon before her death she was subjected to cruelty or
harassment by her husband or any relative of her husband for, or in connection with, any
demand for dowry.
Punishment for Dowry Death: A person guilty and convicted for dowry death can be
jailed from seven years to life (20 years).
The incidence of dowry deaths, cases registered under Dowry Prohibition Act, and
cruelty by husband and relatives is given in Table 123.
Table 123: Crime against Women – Dowry Deaths, Cruelty by Husband
and Relatives, and Dowry Prohibition Act, 2005
S.No. India/State/UTs Dowry Deaths Cruelty by Husband Dowry Act
and Relatives Prohibition
I P R I P R I P R
India 6787 100.0 0.6 58319 100.0 5.3 3204 0.3 100.0
1. Andhra Pradesh 44.3 6.5 0.6 8696 14.9 10.9 306 9.6 0.4
2. Arunachal Pradesh 0 0.0 0.0 9 0.0 0.8 0 0.0 0.0
3. Assam 99 1.5 0.3 2206 3.8 7.7 82 2.6 0.3
4. Bihar 1014 14.9 1.1 1574 2.7 1.8 789 24.6 0.9
5. Chhattisgarh 100 1.5 0.4 732 1.3 3.2 5 0.2 0.0
6. Delhi 114 1.7 0.7 1324 2.3 8.4 9 0.3 0.1
7. Goa 2 0.0 0.1 11 0.0 0.7 0 0.0 0.0
8. Gujarat 48 0.7 0.1 4090 7.0 7.5 0 0.0 0.0
9. Haryana 212 3.1 0.9 2075 3.6 9.1 7 0.2 0.0
10. Himachal Pradesh 2 0.0 0.0 228 0.4 3.6 1 0.0 0.0
11. Jammu & Kashmir 5 0.1 0.0 76 0.1 0.7 0 0.0 0.0
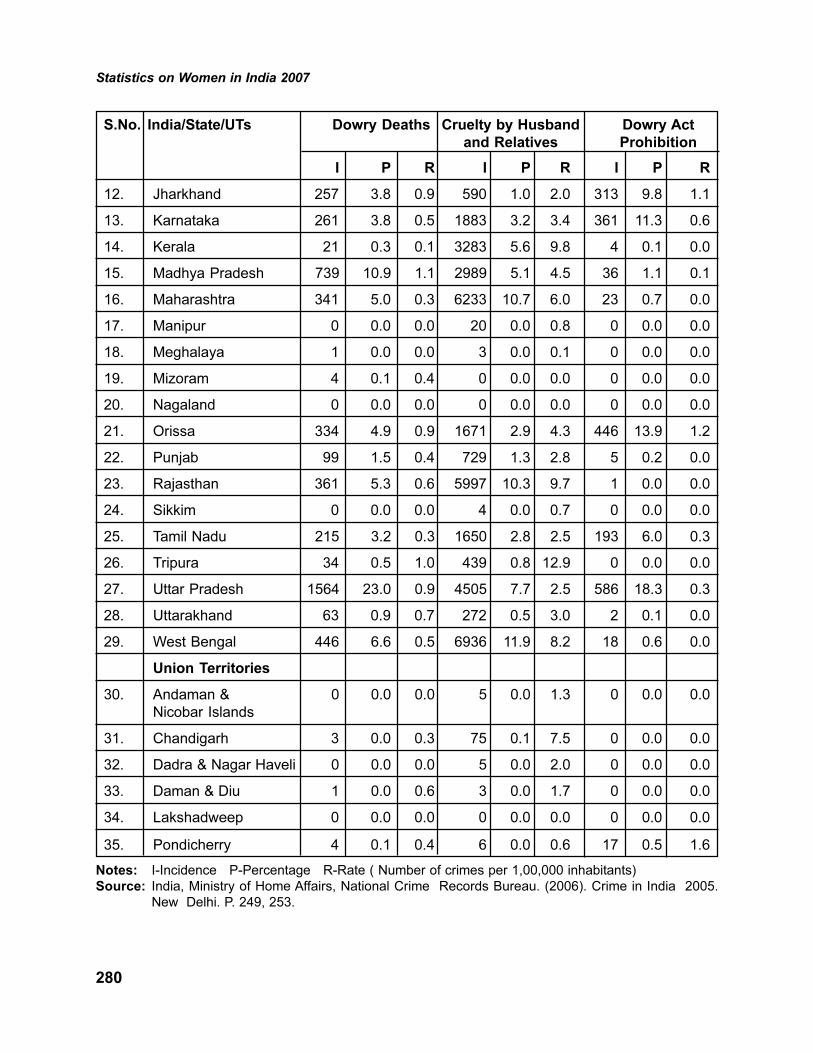
Statistics on Women in India 2007
280
S.No. India/State/UTs Dowry Deaths Cruelty by Husband Dowry Act
and Relatives Prohibition
I P R I P R I P R
12. Jharkhand 257 3.8 0.9 590 1.0 2.0 313 9.8 1.1
13. Karnataka 261 3.8 0.5 1883 3.2 3.4 361 11.3 0.6
14. Kerala 21 0.3 0.1 3283 5.6 9.8 4 0.1 0.0
15. Madhya Pradesh 739 10.9 1.1 2989 5.1 4.5 36 1.1 0.1
16. Maharashtra 341 5.0 0.3 6233 10.7 6.0 23 0.7 0.0
17. Manipur 0 0.0 0.0 20 0.0 0.8 0 0.0 0.0
18. Meghalaya 1 0.0 0.0 3 0.0 0.1 0 0.0 0.0
19. Mizoram 4 0.1 0.4 0 0.0 0.0 0 0.0 0.0
20. Nagaland 0 0.0 0.0 0 0.0 0.0 0 0.0 0.0
21. Orissa 334 4.9 0.9 1671 2.9 4.3 446 13.9 1.2
22. Punjab 99 1.5 0.4 729 1.3 2.8 5 0.2 0.0
23. Rajasthan 361 5.3 0.6 5997 10.3 9.7 1 0.0 0.0
24. Sikkim 0 0.0 0.0 4 0.0 0.7 0 0.0 0.0
25. Tamil Nadu 215 3.2 0.3 1650 2.8 2.5 193 6.0 0.3
26. Tripura 34 0.5 1.0 439 0.8 12.9 0 0.0 0.0
27. Uttar Pradesh 1564 23.0 0.9 4505 7.7 2.5 586 18.3 0.3
28. Uttarakhand 63 0.9 0.7 272 0.5 3.0 2 0.1 0.0
29. West Bengal 446 6.6 0.5 6936 11.9 8.2 18 0.6 0.0
Union Territories
30. Andaman & 0 0.0 0.0 5 0.0 1.3 0 0.0 0.0
Nicobar Islands
31. Chandigarh 3 0.0 0.3 75 0.1 7.5 0 0.0 0.0
32. Dadra & Nagar Haveli 0 0.0 0.0 5 0.0 2.0 0 0.0 0.0
33. Daman & Diu 1 0.0 0.6 3 0.0 1.7 0 0.0 0.0
34. Lakshadweep 0 0.0 0.0 0 0.0 0.0 0 0.0 0.0
35. Pondicherry 4 0.1 0.4 6 0.0 0.6 17 0.5 1.6
Notes: I-Incidence P-Percentage R-Rate ( Number of crimes per 1,00,000 inhabitants)
Source: India, Ministry of Home Affairs, National Crime Records Bureau. (2006). Crime in India 2005.
New Delhi. P. 249, 253.

Statistics on Women in India 2007
281
The incidence of kidnapping and abduction, molestation, eve-teasing, sexual harassment
and indecent representation of women is given in Table 124.
Table 124: Crime against Women – Kidnapping and Abduction,
Molestation, Eve-Teasing, Sexual Harassment and Indecent
Representation of Women (P) Act, 2005
S.No. India/State/UT Kidnapping & Molestation Eve-Teasing and Indecent
Abduction Sexual Harassment Representation
of Women (P) Act
(I) (P) (R) (I) (P) (R) (I) (P) (R) (I) (P) (R)
India 15750 100.0 1.4 34175 100.0 3.1 9984 100.0 0.9 2917 100.0 0.3
1. Andhra Pradesh 995 6.3 1.2 3595 10.5 4.5 2508 25.1 3.1 2657 91.1 3.3
2. Arunachal Pradesh 39 0.2 3.4 67 0.2 5.8 0 0.0 0.0 0 0.0 0.0
3. Assam 1456 9.2 5.1 899 2.6 3.1 19 0.2 0.1 0 0.0 0.0
4. Bihar 929 5.9 1.0 451 1.3 0.5 13 0.1 0.0 0 0.0 0.0
5. Chhattisgarh 184 1.2 0.8 1450 4.2 6.4 132 1.3 0.6 0 0.0 0.0
6. Delhi 1106 7.0 7.0 762 2.2 4.8 225 2.3 1.4 1 0.0 0.0
7. Goa 12 0.1 0.8 30 0.1 2.0 8 0.5 0.1 0 0.0 0.0
8. Gujarat 916 5.8 1.7 802 2.3 1.5 104 0.1 0.2 0 0.0 0.0
9. Haryana 344 2.2 1.5 380 1.1 1.7 597 6.0 2.6 0 0.0 0.0
10. Himachal Pradesh 102 0.6 1.6 286 0.8 4.5 29 0.3 0.5 0 0.0 0.0
11. Jammu & Kashmir 658 4.2 5.8 830 2.4 7.3 371 3.7 3.3 0 0.0 0.0
12. Jharkhand 283 1.8 1.0 293 0.9 1.0 36 0.4 0.1 2 0.1 0.0
13. Karnataka 312 2.0 0.6 185 4.6 2.8 71 0.7 0.1 0 0.0 0.0
14. Kerala 129 0.8 0.4 2339 7.0 6.8 175 0.5 1.8 108 3.7 0.3
15. Madhya Pradesh 604 3.8 0.9 6426 18.8 9.7 792 7.9 1.2 0 0.0 0.0
16. Maharashtra 851 5.4 0.8 3228 9.4 3.1 919 9.2 0.9 8 0.3 0.0
17. Manipur 69 0.4 2.7 25 0.1 1.0 0 0.0 0.0 0 0.0 0.0
18. Meghalaya 19 0.1 0.8 44 0.1 1.8 0 0.0 0.0 0 0.0 0.0
19. Mizoram 0 0.0 0.0 49 0.1 5.2 4 0.0 0.4 0 0.0 0.0
20. Nagaland 9 0.1 0.4 7 0.0 0.3 0 0.0 0.0 0 0.0 0.0
21. Orissa 547 3.5 1.4 2238 6.5 5.8 184 1.8 0.5 1 0.0 0.0
22. Punjab 329 2.1 1.3 308 0.9 1.2 43 0.4 0.2 0 0.0 0.0
23. Rajasthan 1549 9.8 2.5 2503 4.1 7.3 28 0.3 0.0 109 3.7 0.2
24. Sikkim 2 0.0 0.3 38 0.1 6.6 0 0.0 0.0 0 0.0 0.0
25. Tamil Nadu 783 5.0 1.2 1764 5.2 2.7 665 6.7 1.0 30 1.0 0.0
26. Tripura 43 0.3 1.3 161 0.5 4.7 1 0.0 0.0 0 0.0 0.0
27. Uttar Pradesh 2256 14.3 1.2 1835 5.4 1.0 2881 28.9 1.6 0 0.0 0.0
28. Uttarakhand 125 0.8 1.4 100 0.3 1.1 89 0.9 1.0 0 0.0 0.0
29. West Bengal 1039 6.6 1.2 1572 4.6 1.8 54 0.5 0.1 1 0.0 0.0
Union Territories
30. Andaman & 1 0.0 0.3 11 0.0 2.8 1 0.0 0.3 0 0.0 0.0
Nicobar Islands
31. Chandigarh 45 0.3 4.5 31 3.1 0.1 9 0.1 0.9 0 0.0 0.0
32. Dadra & Nagar Haveli 9 0.1 3.7 5 0.0 2.0 0 0.0 0.0 0 0.0 0.0
33. Daman & Diu 2 0.0 1.1 1 0.6 0.0 0 0.0 0.0 0 0.0 0.0
34. Lakshadweep 0 0.0 0.0 0 0.0 0.0 0 0.0 0.0 0 0.0 0.0
35. Pondicherry 3 0.0 0.3 60 0.2 5.8 26 0.3 2.5 0 0.0 0.0
Notes: I-Incidence P-Percentage R-Rate (Number of crimes per 1,00,000 inhabitants)
Source: India, Ministry of Home Affairs, National Crime Records Bureau. (2006).
Crime in India 2005. New Delhi. P. 249, 251, 253.

Statistics on Women in India 2007
282
The incidence of crimes under Immoral Traffic (P) Act, and Importation of Girls is given
in Table 125.
Table 125: Crime against Women – Immoral Traffic (P) Act, and
Importation of Girls, 2005
S.No. India/State/UT Immoral Traffic (P) Act Importation of Girls
(I) (P) (R) (I) (P) (R)
India 5908 100.0 0.5 149 100.0 0.0
1. Andhra Pradesh 681 11.5 0.9 3 2.0 0.0
2. Arunachal Pradesh 0 0.0 0.0 0 0.0 0.0
3. Assam 25 0.4 0.1 3 2.0 0.0
4. Bihar 28 0.5 0.0 74 49.7 0.1
5. Chhattisgarh 6 0.1 0.0 0 0.0 0.0
6. Delhi 151 2.6 1.0 1 0.7 0.0
7. Goa 38 0.6 2.5 0 0.0 0.0
8. Gujarat 59 1.0 0.1 0 0.0 0.0
9. Haryana 85 1.4 0.4 0 0.0 0.0
10. Himachal Pradesh 4 0.1 0.1 0 0.0 0.0
11. Jammu & Kashmir 3 0.1 0.0 0 0.0 0.0
12. Jharkhand 13 0.2 0.0 4 2.7 0.0
13. Karnataka 1241 21.0 2.2 0 0.0 0.0
14. Kerala 225 3.8 0.7 0 0.0 0.0
15. Madhya Pradesh 19 0.3 0.0 3 2.0 0.0
16. Maharashtra 222 3.8 0.2 0 0.0 0.0
17. Manipur 1 0.0 0.0 0 0.0 0.0
18. Meghalaya 1 0.0 0.0 0 0.0 0.0
19. Mizoram 1 0.0 0.1 0 0.0 0.0
20. Nagaland 4 0.1 0.2 0 0.0 0.0
21. Orissa 29 0.5 0.1 0 0.0 0.0
22. Punjab 58 1.0 0.2 0 0.0 0.0
23. Rajasthan 115 1.9 0.2 0 0.0 0.0
24. Sikkim 0 0.0 0.0 0 0.0 0.0
25. Tamil Nadu 2777 47.0 4.3 0 0.0 0.0
26. Tripura 0 0.0 0.0 0 0.0 0.0
27. Uttar Pradesh 31 0.5 0.0 0 0.0 0.0
28. Uttarakhand 2 0.0 0.0 0 0.0 0.0
29. West Bengal 74 1.3 0.1 61 40.9 0.1
Union Territories
30. Andaman & Nicobar Islands 0 0.0 0.0 0 0.0 0.0
31. Chandigarh 9 0.2 0.9 0 0.0 0.0
32. Dadra & Nagar Haveli 0 0.0 0.0 0 0.0 0.0
33. Daman & Diu 1 0.0 0.6 0 0.0 0.0
34. Lakshadweep 0 0.0 0.0 0 0.0 0.0
35. Pondicherry 5 0.1 0.5 0 0.0 0.0
Notes: I-Incidence P-Percentage R-Rate (Number of crimes per 1,00,000 inhabitants)
Source: India, Ministry of Home Affairs, National Crime Records Bureau. (2006).
Crime in India 2005. New Delhi. P. 251, 253.

Statistics on Women in India 2007
283
The National Family Health Survey III, 2006 found that a substantial proportion of women
face spousal violence at home, a supposedly safe domain for women. The incidence of
violence faced by ever married women is given in Table 126.
Table 126: Ever Married Women Who Have Experienced Spousal
Violence, 2006
S. India/State Ever Married Women
No. Facing Spousal Violence
Urban Rural Total
India 30.4 40.2 37.2
1. Andhra Pradesh 31.3 37.1 35.2
2. Arunachal Pradesh 38.0 39.1 38.8
3. Assam 25.0 42.7 39.6
4. Bihar 62.2 58.5 59.0
5. Chhattisgarh 28.1 30.5 30.0
6. Delhi - - 16.3
7. Goa 16.4 17.2 16.8
8. Gujarat 24.2 30.2 27.6
9. Haryana 23.9 28.8 27.3
10. Himachal Pradesh 4.6 6.4 6.2
11. Jammu & Kashmir 13.1 12.4 12.6
12. Jharkhand 24.6 40.8 37.0
13. Karnataka 15.0 23.4 20.0
14. Kerala 14.4 17.5 16.4
15. Madhya Pradesh 44.1 46.4 45.8
16. Maharashtra 26.2 34.9 30.7
17. Manipur 44.4 43.7 43.9
18. Meghalaya 10.8 13.9 13.1
19. Mizoram 21.0 24.1 22.5
20. Nagaland 15.6 15.3 15.4
21. Orissa 31.0 39.9 38.5
22. Punjab 23.4 26.5 25.4
23. Rajasthan 45.5 46.6 46.3
24. Sikkim 10.9 17.9 16.5
25. Tamil Nadu 39.0 44.4 41.9
26. Tripura 32.2 46.5 44.1
27. Uttar Pradesh 36.0 44.3 42.4
28. Uttarakhand 22.8 29.8 27.9
29. West Bengal 30.4 44.2 40.3
Notes: Union Territories were not covered in the Survey
Source: International Institute for Population Sciences. (2006). National Family Health Survey-3, 2005-
2006, India. Mumbai. P.3.

Statistics on Women in India 2007
284
Although crime is mainly committed by males, females are also involved in criminal
activities. Persons arrested under various IPC Crimes gender-wise are given in Table 127.
Table 127: Persons Arrested under IPC Crimes (Crime Head-Wise and
Gender-Wise), 2005
S.No. Crime Head Persons Arrested under IPC Crimes
Male Female Total Percentage to Total
Male Female
1. Murder 61958 3543 65501 94.6 5.4
2. Attempt to Commit Murder 62635 2091 64726 96.8 3.2
3. C.H. Not Amounting to Murder 6675 151 6826 97.8 2.2
4. Rape 22640 572 23212 97.5 2.5
i) Custodial Rape 3 0 3 100.0 0.0
ii) Other Rape 22637 572 23209 97.5 2.5
5. Kidnapping and Abduction 30033 1757 31790 94.5 5.5
i) Of Women and Girls 17957 1369 19326 92.9 7.1
ii) Of Others 12076 388 12464 96.9 3.1
6. Dacoity 19414 202 19616 99.0 1.0
7. Preparation and Assembly for Dacoity 11029 17 11046 99.8 0.2
8. Robbery 27834 156 27990 99.4 0.6
9. Burglary 65642 1380 67022 97.9 2.1
10. Theft 202560 6110 208670 97.1 2.9
i) Auto Theft 43334 108 43442 99.8 0.2
ii) Other Theft 159226 6002 165228 96.4 3.6
11. Riots 304991 15882 320873 95.1 4.9
12. Criminal Breach of Trust 15278 534 15812 96.6 3.4
13. Cheating 47415 2445 49860 95.1 4.9
14. Counterfeiting 2553 54 2607 97.9 2.1
15. Arson 11366 315 11681 97.3 2.7
16. Hurt 435829 29180 465009 93.7 6.3
17. Dowry Death 13325 3848 17173 77.6 22.4
18. Molestation 42705 719 43424 98.3 1.7
19. Sexual Harassment 13038 154 13192 98.8 1.2
20. Cruelty by Husband And Relatives 98815 28745 127560 77.5 22.5
21. Importation Of Girls 190 22 212 89.6 10.4
22. Causing Death by Negligence 62726 258 62984 99.6 0.4
23. Other IPC Crimes 911587 53174 964761 94.5 5.5
Total Cognizable Crimes under IPC 2470238 151309 2621547 94.2 5.8
Notes: IPC: Indian Penal Code, CH: Culpable Homicide
Source: India, Ministry of Home Affairs, National Crime Records Bureau. (2006).
Crime in India 2005. New Delhi. P. 429.

Statistics on Women in India 2007
285
Women arrested under Indian Penal Code (IPC) crimes state-wise are given in Table 128.
Table 128: Persons Arrested for Total Cognizable Crimes under IPC
State-wise, 2005
S. No. India/States/UT Persons Arrested for Total Cognizable Percentage
Crimes under IPC of Female
to Total
Male Female Total
India 2470238 151309 2621547 5.8
1 Andhra Pradesh 199728 16549 216277 7.7
2 Arunachal Pradesh 2453 35 2488 1.4
3 Assam 66367 2307 68674 3.4
4 Bihar 183519 2621 186140 1.4
5 Chhattisgarh 53388 2612 56000 4.7
6 Delhi 50881 2437 53318 4.6
7 Goa 2433 155 2588 6.0
8 Gujarat 144385 12212 156597 7.8
9 Haryana 56014 2926 58940 5.0
10 Himachal Pradesh 16387 2241 18628 12.0
11 Jammu & Kashmir 25641 1975 27616 7.2
12 Jharkhand 44650 2264 46914 4.8
13 Karnataka 129597 8991 138588 6.5
14 Kerala 140721 4888 145609 3.4
15 Madhya Pradesh 301294 13667 314961 4.3
16 Maharashtra 261065 26049 287114 9.1
17 Manipur 1254 136 1390 9.8
18 Meghalaya 1575 19 1594 1.2
19 Mizoram 2257 459 2716 16.9
20 Nagaland 1203 23 1226 1.9
21 Orissa 74219 4081 78300 5.2
22 Punjab 37192 2345 39537 5.9
23 Rajasthan 165979 12832 178811 7.2
24 Sikkim 427 28 455 6.2
25 Tamil Nadu 180015 14830 194845 7.6
26 Tripura 3692 560 4252 13.2
27 Uttar Pradesh 206326 4949 211275 2.3
28 Uttarakhand 12466 958 13424 7.1
29 West Bengal 94526 7635 102161 7.5
Union Territories
30 Andaman & Nicobar Islands 747 101 848 11.9
31 Chandigarh 2896 93 2989 3.1
32 Dadra & Nagar Haveli 693 21 714 2.9
33 Daman & Diu 272 18 290 6.2
34 Lakshadweep 45 0 45 0.0
35 Pondicherry 5931 292 6223 4.7
Source: India, Ministry of Home Affairs, National Crime Records Bureau. (2006).
Crime in India 2005. New Delhi. P. 431.

Statistics on Women in India 2007
286
Persons arrested under various Special and Local Laws (SLL) crimes gender-wise are
given in Table 129.
Table 129: Persons Arrested under SLL Crimes by Crime Head and Sex-
wise, 2005
S.No. Crime Head Persons Arrested under Percentage to Total
SLL Crimes
Male Female Total Male Female
1. Arms Act 77402 255 77657 99.7 0.3
2. Narcotics Drugs and Psychotropic 32019 1876 33895 94.5 5.5
Substances Act
3. Gambling Act 388285 601 388886 99.8 0.2
4. Excise Act 155056 10053 165109 93.9 6.1
5. Prohibition Act 267743 72694 340437 78.6 21.4
6. Explosive and Explosive Substances Act 5041 67 5108 98.7 1.3
7. Immoral Traffic (P) Act 3547 9118 12665 28.0 72.0
8. Indian Railways Act 342 1 343 99.7 0.3
9. Registration of Foreigners Act 2041 757 2798 72.9 27.1
10. Protection of Civil Rights Act 613 22 635 96.5 3.5
i) PCR Act for SCs 562 22 584 96.2 3.8
ii) PCR Act for STs 51 0 51 100.0 0.0
11. Indian Passport Act 1494 326 1820 82.1 17.9
12. Essential Commodities Act 9953 93 10046 99.1 0.9
13. Terrorist and Distruptive Activities Act 170 8 178 95.5 4.5
14. Antiquity and Art Treasure Act 39 0 39 100.0 0.0
15. Dowry Prohibition Act 5995 1202 7197 83.3 16.7
16. Child Marriage Restraint Act 312 99 411 75.9 24.1
17. Indecent Representation of Women (P) Act 2408 568 2976 80.9 19.1
18. Copyrights Act 8739 21 8760 99.8 0.2
19. Sati Prevention Act 18 0 18 100.0 0.0
20. SC/ST (Prevention of Atrocities) Act 16518 556 17074 96.7 3.3
i) Atrocities Act for SCs 14718 466 15184 96.9 3.1
ii)Atrocities Act for STs 1800 90 1890 95.2 4.8
21. Forest Act 7639 7 7646 99.9 0.1
22. Other SLL Crimes 2347884 56317 2404201 97.7 2.3
Total Cognizable Crimes Under SLL 3333258 154641 3487899 95.6 4.4
Note: SLL: Special and Local Laws
Source: India, Ministry of Home Affairs, National Crime Records Bureau. (2006).
Crime in India 2005. New Delhi. P. 433.

Statistics on Women in India 2007
287
Persons arrested under various Special and Local Laws in States and UTs are given in
Table 130.
Table 130: Persons Arrested under Different SLL Crimes State-wise, 2005
S. No. India/States/UT Persons Arrested for Total Percentage
Cognizable Crimes under SLL of Female
to Total
Male Female Total
India 3333258 154641 3487899 4.4
1 Andhra Pradesh 500984 12687 513671 2.5
2 Arunachal Pradesh 84 0 84 0.0
3 Assam 3728 229 3957 5.8
4 Bihar 14772 216 14988 1.4
5 Chhattisgarh 115630 1701 117331 1.4
6 Delhi 28731 3150 31881 9.9
7 Goa 4203 261 4464 5.8
8 Gujarat 162841 47299 210140 22.5
9 Haryana 27088 382 27470 1.4
10 Himachal Pradesh 4860 620 5480 11.3
11 Jammu & Kashmir 2768 52 2820 1.8
12 Jharkhand 3812 425 4238 10.0
13 Karnataka 37102 3438 40540 8.5
14 Kerala 70895 890 71785 1.2
15 Madhya Pradesh 263092 3268 266360 1.2
16 Maharashtra 173748 15668 189416 8.3
17 Manipur 564 54 618 8.7
18 Meghalaya 186 11 197 5.6
19 Mizoram 1581 126 1707 7.4
20 Nagaland 469 114 583 19.6
21 Orissa 17610 1023 18633 5.5
22 Punjab 28451 1453 29904 4.9
23 Rajasthan 42985 925 43910 2.1
24 Sikkim 229 39 268 14.6
25 Tamil Nadu 600676 55622 656298 8.5
26 Tripura 158 0 158 0.0
27 Uttar Pradesh 1078154 1697 1079851 0.2
28 Uttarakhand 127202 1101 128303 0.9
29 West Bengal 11378 1378 12756 10.8
Union Territories
30 Andaman & Nicobar Islands 6582 752 7334 10.3
31 Chandigarh 1072 32 1104 2.9
32 Dadra & Nagar Haveli 60 0 60 0.0
33 Daman & Diu 13 4 17 23.5
34 Lakshadweep 7 0 7 0.0
35 Pondicherry 1542 24 1566 1.5
Note: SLL: Special and Local Laws
Source: India, Ministry of Home Affairs, National Crime Records Bureau. (2006).
Crime in India 2005. New Delhi. P.434.

Statistics on Women in India 2007
288
Women prisoners who are lodged in various central, district, sub-jails and women’s
jails state-wise are given in Table 131.
Table 131: Women Prisoners in Jails, 2005
S.No. India/State/UT Inmate Population
Central Jail District Jail Sub Jails Women’s
Jails
Male Female Total Male Female Total Male Female Total Female
India 156668 4323 160991 133083 4649 137732 46798 1745 48543 2961
1 Andhra Pradesh 8059 141 8200 2090 222 2312 3283 51 3334 470
2 Arunachal Pradesh - - - - - - - - - -
3 Assam 4070 99 4169 3819 108 3927 32 0 32 0
4 Bihar 12877 284 13161 22552 704 23256 9067 237 9304 97
5 Chhattisgarh 6019 360 6379 1620 63 1683 1759 0 1759 0
6 Delhi 10839 0 10839 991 0 991 0 0 0 487
7 Goa 125 20 145 0 0 0 107 0 107 0
8 Gujarat 5741 219 5960 3140 115 3255 1641 62 1703 0
9 Haryana 2750 68 2818 8908 311 9219 303 0 303 0
10 Himachal Pradesh 576 15 591 214 11 225 290 8 298 0
11 Jammu & Kashmir 858 14 872 1126 57 1183 82 0 82 0
12 Jharkhand 7180 255 7435 9894 409 10303 1431 34 1465 0
13 Karnataka 7867 332 8199 1002 49 1051 2630 67 2697 0
14 Kerala 3602 78 3680 799 22 821 1375 34 1409 50
15 Madhya Pradesh 15641 433 16074 6033 291 6324 8803 93 8896 0
16 Maharashtra 16842 602 17444 6502 377 6879 NA NA NA 338
17 Manipur 503 26 529 0 0 0 0 0 0 0
18 Meghalaya 0 0 0 542 13 555 0 0 0 0
19 Mizoram 258 20 278 376 59 435 0 0 0 0
20 Nagaland 275 0 275 193 5 198 137 15 152 0
21 Orissa 0 0 0 6706 158 6864 5254 223 5477 28
22 Punjab 10411 424 10835 2011 128 2139 1149 0 1149 228
23 Rajasthan 6931 119 7050 3305 81 3386 1901 9 1910 205
24 Sikkim 188 7 195 0 0 0 0 0 0 0
25 Tamil Nadu 15731 104 15835 0 0 0 3106 621 3727 862
26 Tripura 681 0 681 221 6 227 472 11 483 19
27 Uttar Pradesh 8589 33 8622 46021 1182 47203 474 3 477 125
28 Uttarakhand 0 0 0 1271 36 1307 727 12 739 0
29 West Bengal 9809 664 10473 3501 238 3739 2696 264 2960 52
Union Territories
30 Andaman & Nicobar Islands 0 0 0 215 4 219 5 0 5 0
31 Chandigarh 0 0 0 0 0 0 0 0 0 0
32 Dadra & Nagar Haveli 0 0 0 0 0 0 29 0 29 0
33 Daman & Diu 0 0 0 0 0 0 34 1 35 0
34 Lakshadweep 0 0 0 0 0 0 6 0 6 0
35 Pondicherry 246 6 252 31 0 31 5 0 5 0
Note: NA stands for data not available. Arunachal Pradesh has no Jail.
Source : India, Ministry of Home Affairs, National Crime Records Bureau (NCRB). (2007). Prison Statistics India 2005. New Delhi. P.22-24.

Statistics on Women in India 2007
289
Some women who commit crimes have young children below 6 years, or have children
after they have been imprisoned. The number of women prisoners with children in jails are
given in Table 132.
Table 132: Number of Women Prisoners in Jails, and Women Prisoners
with Children, 2005S. India/State/UT Male Female Total Total No. of Total
No. Inmate Inmate Inmate Women No. of
Population Population Population Prisoners with Children
Children *
India 344382 13986 358368 1251 1413
1 Andhra Pradesh 13729 884 14613 58 68
2 Arunachal Pradesh - - - - -
3 Assam 8299 214 8513 24 26
4 Bihar 44496 1322 45818 32 94
5 Chhattisgarh 9398 423 9821 48 53
6 Delhi 11830 487 12317 38 39
7 Goa 364 20 384 1 1
8 Gujarat 10806 410 11216 22 22
9 Haryana 12032 515 12547 46 46
10 Himachal Pradesh 1134 34 1168 1 1
11 Jammu & Kashmir 2066 71 2137 4 4
12 Jharkhand 18535 698 19233 102 116
13 Karnataka 11779 448 12227 34 34
14 Kerala 6662 201 6863 8 8
15 Madhya Pradesh 30663 817 31480 121 137
16 Maharashtra 24105 1326 25431 136 151
17 Manipur 503 26 529 0 0
18 Meghalaya 542 13 555 0 0
19 Mizoram 634 79 713 8 8
20 Nagaland 605 20 625 0 0
21 Orissa 13528 430 13958 50 54
22 Punjab 13898 780 14678 74 80
23 Rajasthan 12565 428 12993 41 47
24 Sikkim 188 7 195 0 0
25 Tamil Nadu 19072 1609 20681 75 75
26 Tripura 1374 36 1410 1 1
27 Uttar Pradesh 55375 1343 56718 246 246
28 Uttarakhand 2302 48 2350 3 4
29 West Bengal 16898 1260 18158 77 96
Union Territories
30 Andaman &
Nicobar Islands 220 4 224 0 0
31 Chandigarh 429 26 455 1 2
32 Dadra & Nagar
Haveli 29 0 29 0 0
33 Daman & Diu 34 1 35 0 0
34 Lakshadweep 6 0 6 0 0
35 Pondicherry 282 6 288 0 0
Notes: * Includes undertrial women, detenue women prisoners and other women prisoners.
Source: India, Ministry Home Affairs, National Crime Records Bureau. (2007). Prison Statistics India 2005.
New Delhi. P.20, 71.

Statistics on Women in India 2007
290
11. Gender Development Index
The Convention on the Elimination of All Forms of Discrimination against Women
(CEDAW), was adopted by the UN General Assembly in 1979 to attain the goal of equal
rights for women. Consisting of a preamble and 30 articles, it defines what constitutes
discriminations against women and sets up an agenda for national action to end such
discrimination. According to the Convention, discrimination against women is “… any
distinction, exclusion or restriction made on the basis of sex which has the effect or purpose
of impairing or nullifying the recognition, enjoyment of exercise by women, irrespective of
their marital status, on a basis of equality of men and women, of human rights and
fundamental freedoms in the political, economic, social, cultural, civil or any other field”.
The Convention ensures women’s equal access to, and equal opportunities in, political
and public life including right to vote and stand for election, as well as education and
employment. It is the only human rights treaty which affirms the reproductive rights of
women. The Convention, which entered into force on 3 September 1981, had till 31 May
1996, been ratified by 152 UN member states.
India ratified the Convention on 25 June 1993 with “Declaratory Statement” in respect
of Articles 16(1) and Article 16(2) of the Convention and “Reservation” in respect of Article
29(1) of the Convention. Under Article 16(1) of the Convention, the Government of the
Republic of India declared that it shall abide by and ensure these provisions in conformity
with its policy of non-interference in the personal affairs of any community without its initiative
and consent. Under Article 16(2) of the Convention, the Government of India declares that
it agrees to the principle of compulsory registration of marriages. However, failure to get
the marriage registered, will not invalidate the marriage, particularly in India, with its variety
of customs, religions and literacy level. Article 29(1) of the Convention establishes
compulsory arbitration or adjudication by the International Court of Justice of Disputes
concerning interpretation. Government of India declares that it does not consider itself
bound by paragraph 1 of this Article.
When India ratified the UN Convention to End Discrimination against Women in 1993,
disaggregated data regarding the situation of women and girls was not available. Efforts
were then initiated by the Government of India to collect disaggregated data on various
indicators so that a clearer picture of the situation of women and girls vis-à-vis men and
boys would emerge. Data at the district and sub-district level are required for planning
programmes based on facts at the micro level. The Gender Development Index (GDI) of
Indian women is illustrated by the statistics given below in Table 133.

Statistics on Women in India 2007
291
Table 133: Gender Development Index, 2002-2006
1. Gender-related development index
Gender-related development index (GDI) Rank* 96
Gender-related development index (GDI) Value* 0.591
Life expectancy at birth (years), female, 2006 # 66.91
Life expectancy at birth (years), male, 2006 # 63.87
Adult literacy, male rate (% age 15 and above), 2004* 73.4
Adult literacy, female rate (% age 15 and above), 2004* 47.8
Combined gross enrolment ratio for primary, secondary and tertiary level
schools, male (%), 2004b 66f
Combined gross enrolment ratio for primary, secondary and tertiary level
schools, female (%), 2004b 58f
Estimated earned income (PPP US$), female, 2004 1471h
Estimated earned income (PPP US$), male, 2004 4723h
HDI rank minus GDI rankd 0
2. Gender empowerment measure
Female legislators, senior officials and managersb1 (% of total) ..
Seats in parliament held by womena (% of total) 9.2
Gender empowerment measure (GEM) Value ..
Gender empowerment measure (GEM) Rank ..
Ratio of estimated female to male earned incomec 0.31
Female professional and technical workersb1 (% of total) ..
3. Gender inequality in education
MDG Net primary enrolmentb2,c1, female ratio (%), 2004f2 87g
MDG Youth literacya1, female rate (% ages 15-24), 2004 67.7
MDG Youth literacya1, female rate as % of male rate, 2004 80
MDG Net primary enrolment, female ratio as % of malee ratio, 2004f2 094g
MDG Net secondary enrolmentb2,c1, female ratio (%), 2004f2 ..

Statistics on Women in India 2007
292
MDG Gross tertiary enrolmentc1,d1, female ratio (%), 2004 9
Adult literacya1, female rate (% ages 15 and above), 2004 47.8
MDG Gross tertiary enrolmentc1,d1, ratio of female to malee 2004f2 0.66
Adult literacya1, female rate as % of male rate, 2004 65
MDG Net secondary enrolmentb2,c1, ratio of female to malee , 2004f2 ..
4. Gender inequality in economic activity
Female employment by economic activity (%): agriculture, as % of female
rate 1995-2003b3 ..
Female employment by economic activity (%): agriculture, as % of male
rate, 1995-2004b3 ..
Contributing family workers (%), Women, 1995-2004b3 ..
Contributing family workers (%), Men, 1995-2004b3 ..
Employment by economic activity (%): services as % of female,
1995-2003b3 ..
Employment by economic activity (%): services, as % of male rate,
1995-2003b3 ..
Employment by economic activity (%): industry as % of female rate,
1995-2003b3 ..
Employment by economic activity (%): industry, as % of male rate,
1995-2003b3 ..
Female economic activity (ages 15 and above): as % of male rate, 2004 41
Female economic activity (ages 15 and above): index (1990=100), 2004 94
Female economic activity (ages 15 and above): rate (%), 2004 34.0
5. Women’s political participation
MDG Seats in parliament held by women (% of total)c2 upper house or
senate 2006 11.2
MDG Seats in parliament held by women (% of total)c2 lower house or
single house 2006 8.3
Year women received right to vote a2 1950
Year women received right to stand for election a2 1950
Women in government at ministerial level (% of total)b4 2005 3.4
Year first woman elected (E) or appointed (A) to parliament 1952 E

Statistics on Women in India 2007
293
Notes: a: Data are as of 31 May 2006, unless otherwise specified. Where there are lower and upper
houses, data refer to the weighted average of women’s shares of seats in both houses.
a1: Data refer to national literacy estimates from ensuses or surveys conducted between 2000
and 2005, unless otherwise specified. Due to differences in methodology and timeliness of
underlying data, comparisons across countries and over time should be made with caution.
For more details, see www.uis.unesco.org.
b: In 2006 the United Nations Educational, Scientific and Cultural Organization (UNESCO) Institute
for Statistics changed its convention for citing the reference year of education data to the
calendar year in which the academic or financial year ends-from 2003/04, for example, to
2004. Data for some countries may refer to national or UNESCO Institute for Statistics estimates.
For details see www.uis.unesco.org. Because data are from different sources, comparisons
across countries should be made with caution.
b1: Data refer to the most recent years available during the period 1992-2004. Estimates for
countries that have implemented the recent International Standard Classification of Occupations
(ISCO-88) are not strictly comparable with those for countries using the previous classification
(ISCO-68).
b2: The net enrolment ratio is the ratio of enrolled children of the official age for the education level
indicated to the total population at that age. Net enrolment ratios exceeding 100% reflect
discrepancies between these two data sets.
b3: Data refer to the most recent year available during the period specified.
c: Calculated on the basis of data in columns 9 and 10 in table 24. Estimates are based on data
for the most recent year available during 1991-2004.
c1: Calculated on the basis of data in col.9 and 10 in table 24. Estimates are based on data for the
most recent years available during the period 1991- 2001.
c2: Data refer to 2001 / 02 school years
d: The HDI ranks used in this calculation are recalculated for the 136 countries with a GDI value.
Appositive figure indicated that the GDI rank is higher than the HDI rank, a negative the opposite.
d1: Tertiary enrolment is generally calculated as a gross ratio.
e: Calculated as ratio of the female enrolment ratio to the male enrolment ratio
E: Refers to the year women were elected to the current parliamentary system.
f: Preliminary UNESCO Institute for Statistics estimate, subject to further revision.
f2: In 2006 the UNESCO Institute for Statistics changed its convention for citing the reference
year of education data to the calendar year in which the academic or financial year ends-from
2003/04, for example, to 2004.
g: Preliminary UNESCO Institute for Statistics estimate, subject to further revision.
Source: *United Nations Development Programme. (2007). Human Development Report 2006: Beyond
Scarcity: Power, Poverty and the Global Water Crisis. New Delhi : Oxford University Press. P.363-
382.
# National Commission for Women. (2004). A Study of the Implementation of Current Policies,
Programmes and Schemes for Women and Girls in India: A Comparative Study: Volume 1. New
Delhi. P.49.

Statistics on Women in India 2007
294
12. Political Participation of Women and Women in
Decision Making
The 73rd and 74th Amendment to the Constitution ensured that 33 per cent seats for
panchyats in rural areas and urban local bodies were to be reserved for women. This
ensured the direct involvement of women in positions of decision making. Elected women
representives are slowly bringing about a change in the rural countryside and urban areas,
by bringing social development issues to the forefront.
The representation of women in the central council of ministers is given in Table 134.
Table 134: Representation of Women in the Central Council of Ministers,2006
S.No. Ministerial Rank Central Council of Ministers
Female Male Total Percentage
Female to Total
1. Cabinet Minister 1 28 29 3.45
2. MOS 6 33 39 15.38
Total 7 61 68 10.29
Note: MOS - Minister of State
Source: www.parliamentofindia.nic.in
India, Ministry of Statistics and Programme Implementation, Central Statistical Organisation.
(2007). Women and Men in India 2006. New Delhi. P.104.
Although women have entered many male dominated professions, their representation
in the higher echelons of society, and in positions of decision making is much below that of
men.
The number of women judges in the Supreme Court and in High Courts in various
states is given in Table 135.

Statistics on Women in India 2007
295
Table 135: Number of Judges by Sex in Supreme Court/ High Courts as
on 23.12.2005
S. No. Name of the Court Number of Judges
Female Male Total
Supreme Court 1 21 22
High Court
1. Allahabad 4 77 81
2. Andhra Pradesh 2 28 30
3. Mumbai 5 50 55
4. Kolkata 1 28 29
5. Chhattisgarh - 8 8
6. Delhi 3 23 26
7. Guwahati 1 15 16
8. Gujarat 2 32 34
9. Himachal Pradesh 1 7 8
10. Jammu & Kashmir - 10 10
11. Jharkhand - 6 6
12. Karnataka 1 30 31
13. Kerala 1 27 28
14. Madhya Pradesh 3 36 39
15. Chennai 4 34 38
16. Orissa - 14 14
17. Patna 3 19 22
18. Punjab & Haryana 2 27 29
19. Rajasthan 1 31 32
20. Sikkim - 3 3
21. Uttarakhand - 9 9
Total 34 535 548
Note: Department of Justice, Ministry of Law and Justice and Company Affairs.
Source: India, Ministry of Statistics and Programme Implementation, Central Statistical Organisation.
(2007). Women and Men in India 2006. New Delhi. P.104.

Statistics on Women in India 2007
296
The number of women IAS and IPS officers in various states and union territories is
given in Table 136.
Table 136: Women in Bureaucracy, Indian Administrative Service (IAS)
and Police, 2000
S.No. India/ State/ Union Territory Decision-making
Administrative
I.A.S I.P.S
(As on 1.6.2000) 1 (As on 1.4.2000) 2
Female Male Female Male
India 535 4624 110 3191
(10.4%) (3.3%)
1. Andhra Pradesh 33 281 11 179
2. Arunachal Pradesh X X X X
3. Assam 10 216 2 134
4. Bihar 33 360 14 233
5. Delhi 38 194 9 147
6. Goa X X X X
7. Gujarat 23 225 3 133
8. Haryana 32 180 4 100
9. Himachal Pradesh 17 109 1 73
10. Jammu & Kashmir 3 109 1 80
11. Karnataka 35 213 4 137
12. Kerala 21 157 2 114
13. Madhya Pradesh 54 342 9 273
14. Maharashtra 40 311 6 201
15. Manipur 5 193 3 98
16. Meghalaya XX XX XX XX
17. Mizoram X X X X
18. Nagaland 1 63 1 39
19. Orissa 17 185 7 129
20. Punjab 28 165 6 144
21. Rajasthan 29 231 6 141
22. Sikkim 5 45 Nil 24
23. Tamil Nadu 37 288 7 176
24. Tripura XXX XXX XXX XXX
25. Uttar Pradesh 51 484 10 381
26. West Bengal 23 273 4 255
Union Territories
27. Andaman & Nicobar Islands X X X X
28. Chandigarh X X X X
29. Dadra & Nagar Haveli X X X X
30. Daman & Diu X X X X
31. Lakshadweep X X X X
32. Pondicherry X X X X
Notes : 1. Department of Personnel and Training, Government of India, New Delhi.
2. Ministry of Home Affairs, Government of India, New Delhi.
X Included under Delhi
XX Included under Assam
XXX Included under Manipur
Source: India, Planning Commission. (2000). Development Indicators : A Comparative
Picture of the Status of Women and Men in India : Data Sheet. New Delhi. P. 1.

Statistics on Women in India 2007
297
The representation of women in All India and Central Services, and selected other
positions is given in Table 137.
Table 137: Personnel by Sex in All India and Central Services, and Other
Positions, 2005-2006
S. No. Service Female Male Total Female to Total
Percentage
1 Supreme Court Judges 2005 1 21 22 4.5
2 High Court Judges 2003 17 497 514 3.31
3 Indian Administrative Service 19971 512 4479 5011 10.22
19982 522 4489 5011 10.42
2002 535 4624 5159 10.42
4 Indian Audit and Account Service 1997 129 519 647 19.94
2005 149 434 583 25.55
5 Indian Customs and Central Excise 117 1520 1637 7.5
Service 1995
1996 130 1531 1661 7.83
6 Indian Economic Service 1996 64 330 394 16.24
2006 94 282 376 25.00
7 Indian Foreign Service 1997 67 519 586 11.43
2005 85 536 621 13.68
Scheduled Castes 6 80
Scheduled Tribes 8 40
8 Indian Forest Service 1995 73 2390 2463 2.96
1996 78 2387 2465 3.16
9 Indian Information Service 1995 76 417 493 5.42
2004 74 296 370 20.00
10 Indian Police Service 1997 96 2868 2964 3.24

Statistics on Women in India 2007
298
S. No. Service Female Male Total Female to Total
Percentage
2005 142 3056 3198 4.44
11 Indian Postal Service 1995 70 256 326 21.47
2005 94 339 433 21.70
12 Indian Revenue Service 1994 246 2022 2268 10.85
1995 276 1980 2256 12.23
13 Indian Statistical Service 1997 38 492 530 7.17
2006 86 469 555 15.49
14 Central Secretariat Service
1995 NA NA 678 -
1996 51 657 708 7.20
15 Central Cabinet Minister 1997 0 20 20 0.00
2002 2 30 32 6.25
2004 1 28 29 3.44
16 Minister of State 1997 5 19 24 20.83
2002 6 35 41 14.63
2004 6 33 39 15.38
17 Chartered Accountants 19963 5.8
18 Registered Medical Practioners 20.8
(Doctors) 19954
Notes: Ministry of Home Affairs
Ministry of External Affairs1.As on 01.11.98 (includes 1998 Batch)2.As on 31.12. 98 (includes 1999 Batch)3 Institute of Chartered Accountants of India4 Medical Council of India
Source:1. India, Ministry of Statistics and Programme Implementation, Central Statistical Organisation.
(2007). Women and Men in India 2006. New Delhi. P. 104-106.
2. India, Ministry of Human Resource Development, Department of Women and Child
Development. (2004). Government of India, II & IIIrd Periodic Report on the Convention on the
Elimination of All Forms of Discrimination against Women: CEDAW Periodic Report. New
Delhi. P. 90.
3. Website: www.parliamentofindia.nic.in

Statistics on Women in India 2007
299
The various types of seats in the Lok Sabha are given in Table 138.
Table 138: Seats in the Lok Sabha, Number and Type of Constituencies
S.No. India/State/UT Type of Constituencies
General SC ST Total
India 423 79 41 543
1. Andhra Pradesh 34 6 2 42
2. Arunachal Pradesh 2 - - 2
3. Assam 11 1 2 14
4. Bihar 33 7 - 40
5. Jharkhand 8 1 5 14
6. Goa 2 - - 2
7. Gujarat 20 2 4 26
8. Haryana 8 2 - 10
9. Himachal Pradesh 3 1 - 4
10. Jammu & Kashmir 6 - - 6
11. Karnataka 24 4 - 28
12. Kerala 18 2 - 20
13. Madhya Pradesh 20 4 5 29
14. Chhattisgarh 5 2 4 11
15. Maharashtra 41 3 4 48
16. Manipur 1 - 1 2
17. Meghalaya 2 - - 2
18. Mizoram - - 1 1
19. Nagaland 1 - - 1
20. Orissa 13 3 5 21
21. Punjab 10 3 - 13
22. Rajasthan 18 4 3 25
23. Sikkim 1 - - 1
24. Tamil Nadu 32 7 - 39
25. Tripura 1 - 1 2
26. Uttar Pradesh 63 17 - 80
27. Uttarakhand 4 1 - 5
28. West Bengal 32 8 2 42
Union Territories
29. Andaman & Nicobar Islands 1 - - 1
30. Chandigarh 1 - - 1
31. Dadra & Nagar Haveli - - 1 1
32. Daman & Diu 1 - - 1
33. Delhi 6 1 - 7
34. Lakshadweep - - 1 1
35. Pondicherry 1 - - 1
Notes: SC- Scheduled Castes ST- Scheduled Tribes
Source: Election Commission of India.

Statistics on Women in India 2007
300
The representation of women in three levels of political decision making is given in Table 139.
Table 139: Political Participation and Decision-making by Women, 2000-
2006
S. India/ State / Union Territory Political Decision-making
No. Lok Sabha Legislative Panchayati Raj
(2004)1 Assembly Institutions @
(2000) 2 (as on 1.12.2006) $
Female Male Female Male Female % of Total
India/States/UTs (1999) 49 (9.0%) 494 229(5.6%) 3838 813676 31.3
India/States/UTs (2004 May) 44 495
(8.16%) (91.84%)
India/States/UTs (2006 Dec.) 1038989 36.7
1. Andhra Pradesh 3 39 28 266 74019 33.0
2. Arunachal Pradesh - 2 1 59 3183 38.5
3. Assam - 14 6 116 9903 38.9
4. Bihar 3 37 19 305 70400 54.1
5. Chhattisgarh 1 10 54102 33.7
6. Delhi 1 6 9 61 - -
7. Goa - 2 2 38 453 30.2
8. Gujarat 1 25 4 178 38068 33.3
9. Haryana 1 9 4 86 24994 36.0
10. Himachal Pradesh 1 3 6 62 9128 33.5
11. Jammu & Kashmir 1 5 2 85 - -
12. Jharkhand 1 13 - -
13. Karnataka 2 26 6 218 41210 42.9
14. Kerala 2 18 13 127 6515 35.2
15. Madhya Pradesh 2 27 26 294 134368 33.9
16. Maharashtra 5 43 12 276 77118 33.6
17. Manipur - 2 1 59 646 36.5
18. Meghalaya - 2 3 57 - -
19. Mizoram - 1 0 40 - -
20. Nagaland - 1 0 60 - -
21. Orissa 2 19 13 134 36086 35.8
22. Punjab 2 11 7 110 31838 35.0
23. Rajasthan 2 23 14 186 42402 35.4
24. Sikkim - 1 1 31 384 38.2
25. Tamil Nadu 4 35 9 225 39364 33.8
26. Tripura - 2 2 58 1986 34.6
27. Uttar Pradesh 7 73 20 404 299025 38.8
28. Uttarakhand - 5 21517 37.4
29. West Bengal 4 38 20 274 21428 36.5
Union Territories
30. Andaman & Nicobar Islands - 1 ## ## 296 34.6
31. Chandigarh - 1 ## ## 62 33.2
32. Dadra & Nagar Haveli - 1 ## ## 49 39.2
33. Daman & Diu - 1 ## ## 37 38.1
34. Lakshadweep - 1 ## ## 38 37.6
35. Pondicherry - 1 1 29 370 36.2
Notes: 1. Lok Sabha Members : Fourteenth Lok Sabha. Lok Sabha Secretariat, New Delhi, 2004.2. Election Commission, Government of India, New Delhi.@ Includes Village Panchayats, Intermediate Panchayats, District Panchayats## No Legislative Assembly NA - Not Available
Source: India, Planning Commission. (2000). Women in India : A Statistical Profile : DevelopmentIndicators : A Comparative Picture of the Status of Women and Men in India : Data Sheet. New Delhi. P. 1.$ India, Ministry of Panchayati Raj. (2006). The State of the Panchayats: A Mid-Term Review and Appraisal 22 November
2006. New Delhi. P.26.

Statistics on Women in India 2007
301
Figure 5: Elected Women Members of Parliament, 2004
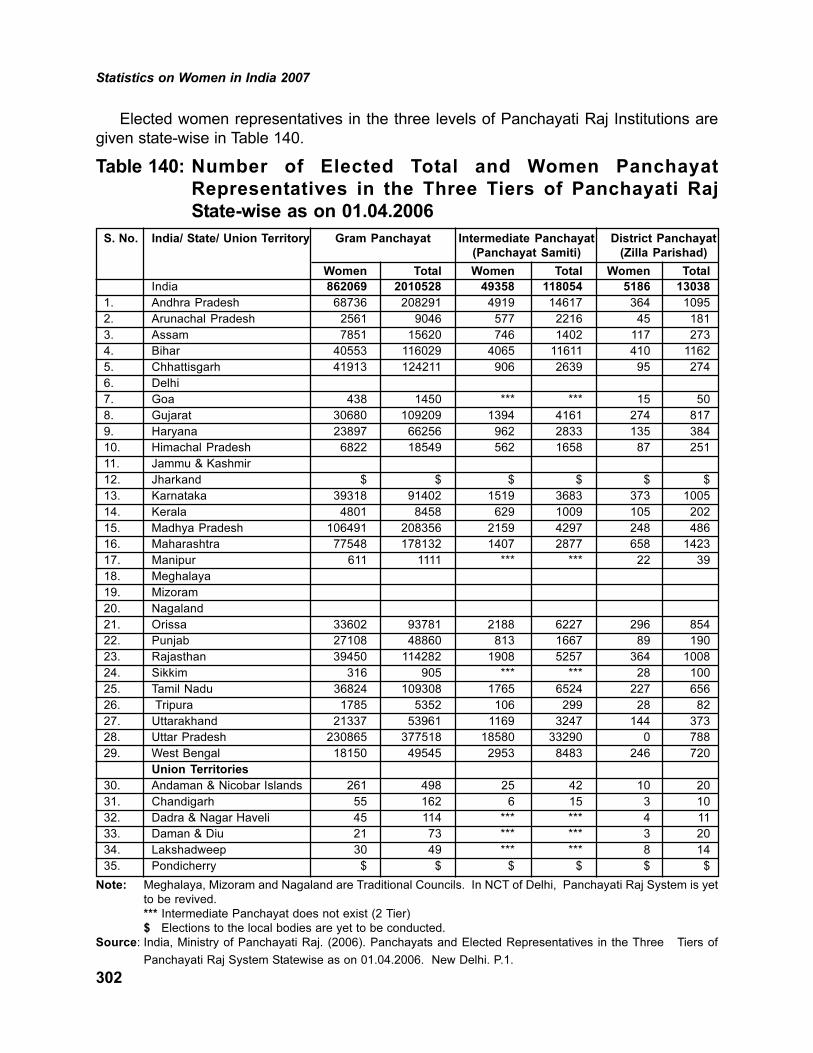
Statistics on Women in India 2007
302
Elected women representatives in the three levels of Panchayati Raj Institutions are
given state-wise in Table 140.
Table 140: Number of Elected Total and Women Panchayat
Representatives in the Three Tiers of Panchayati Raj
State-wise as on 01.04.2006
S. No. India/ State/ Union Territory Gram Panchayat Intermediate Panchayat District Panchayat
(Panchayat Samiti) (Zilla Parishad)
Women Total Women Total Women Total
India 862069 2010528 49358 118054 5186 13038
1. Andhra Pradesh 68736 208291 4919 14617 364 1095
2. Arunachal Pradesh 2561 9046 577 2216 45 181
3. Assam 7851 15620 746 1402 117 273
4. Bihar 40553 116029 4065 11611 410 1162
5. Chhattisgarh 41913 124211 906 2639 95 274
6. Delhi
7. Goa 438 1450 *** *** 15 50
8. Gujarat 30680 109209 1394 4161 274 817
9. Haryana 23897 66256 962 2833 135 384
10. Himachal Pradesh 6822 18549 562 1658 87 251
11. Jammu & Kashmir
12. Jharkand $ $ $ $ $ $
13. Karnataka 39318 91402 1519 3683 373 1005
14. Kerala 4801 8458 629 1009 105 202
15. Madhya Pradesh 106491 208356 2159 4297 248 486
16. Maharashtra 77548 178132 1407 2877 658 1423
17. Manipur 611 1111 *** *** 22 39
18. Meghalaya
19. Mizoram
20. Nagaland
21. Orissa 33602 93781 2188 6227 296 854
22. Punjab 27108 48860 813 1667 89 190
23. Rajasthan 39450 114282 1908 5257 364 1008
24. Sikkim 316 905 *** *** 28 100
25. Tamil Nadu 36824 109308 1765 6524 227 656
26. Tripura 1785 5352 106 299 28 82
27. Uttarakhand 21337 53961 1169 3247 144 373
28. Uttar Pradesh 230865 377518 18580 33290 0 788
29. West Bengal 18150 49545 2953 8483 246 720
Union Territories
30. Andaman & Nicobar Islands 261 498 25 42 10 20
31. Chandigarh 55 162 6 15 3 10
32. Dadra & Nagar Haveli 45 114 *** *** 4 11
33. Daman & Diu 21 73 *** *** 3 20
34. Lakshadweep 30 49 *** *** 8 14
35. Pondicherry $ $ $ $ $ $
Note: Meghalaya, Mizoram and Nagaland are Traditional Councils. In NCT of Delhi, Panchayati Raj System is yet
to be revived.
*** Intermediate Panchayat does not exist (2 Tier)
$ Elections to the local bodies are yet to be conducted.
Source: India, Ministry of Panchayati Raj. (2006). Panchayats and Elected Representatives in the Three Tiers of
Panchayati Raj System Statewise as on 01.04.2006. New Delhi. P.1.

Statistics on Women in India 2007
303
The percentage representation of women in the three levels of Panchayat Raj Institutions
is given in Table 141.
Table 141: Percentage of Women Representatives in Panchayati Raj
Institutions (PRI), 2006
S. No India/ State/ UT Village Panchayats Intermediate Panchayats District Panchayats
No. of Total Women No. of Total Women No. of Total Women
Pancha- No. % Panch- No. % Pancha- No. %
yats ayats yats
India 232913 2656476 975116 36.7 6094 156609 58094 37.1 537 15694 5779 36.8
1. Andhra Pradesh 21825 208291 68736 33.0 1098 14617 4919 33.7 22 1095 364 33.2
2. Arunachal Pradesh 1639 6485 2561 39.5 136 1639 577 35.2 14 136 45 33.1
3. Assam 2223 22898 8977 39.2 188 2148 791 36.8 20 390 135 34.6
4. Bihar 8471 117397 64152 54.6 531 11537 5671 49.2 38 1157 577 49.9
5. Chhatisgarh 9820 157250 53045 33.7 146 2831 954 33.7 16 305 103 33.8
6. Delhi - - - - - - - - - - - -
7. Goa 190 1450 438 30.2 - - - - 2 50 15 30.0
8. Gujarat 13819 109209 36400 33.3 224 4161 1394 33.5 25 817 274 33.5
9. Haryana 6187 66256 23897 36.1 119 2833 962 34.0 19 384 135 35.2
10. Himachal Pradesh 3243 25352 8483 33.5 75 1667 559 33.5 12 251 86 34.3
11. Jammu & Kashmir - - - - - - - - - - - -
12. Jharkhand 3746 - - - 211 - - - 22 - - -
13. Karnataka 5653 91402 39318 43.0 176 3683 1519 41.2 27 1005 373 37.1
14. Kerala 999 16139 5701 35.3 152 2005 695 34.7 14 339 119 35.1
15. Madhya Pradesh 23051 388829 131671 33.9 313 7164 2393 33.4 48 884 304 34.4
16. Maharashtra 27918 223857 75148 33.6 351 3902 1317 33.8 33 1951 653 33.5
17. Manipur 165 1707 625 36.6 4 61 21 34.4
18. Meghalaya - - - - - - - - - - - -
19. Mizoram - - - - - - - - - - - -
20. Nagaland - - - - - - - - - - - -
21. Orissa 6234 93781 33602 35.8 314 6227 2188 35.1 30 854 296 34.7
22. Punjab 12447 88136 30875 35.0 141 2622 866 33.0 17 298 97 32.6
23. Rajasthan 9188 113541 40012 35.2 237 5256 2013 38.3 32 1007 377 37.4
24. Sikkim 166 905 352 38.9 - - - - 4 100 32 32.0
25. Tamil Nadu 12618 109308 36824 33.7 385 6524 2313 35.5 28 656 227 34.6
26. Tripura 513 5352 1852 34.6 23 299 106 35.5 4 82 28 34.1
27. Uttar Pradesh 52000 703294 273229 38.8 820 65669 24674 37.6 70 2698 1122 41.6
28. Uttarakhand 7227 53988 20319 37.6 95 3152 1079 34.2 13 360 119 33.1
29. West Bengal 3354 49545 18150 36.6 341 8483 3033 35.8 18 721 245 34.0
Union Territories
30. Andaman & Nicobar Islands 67 759 261 34.4 7 67 25 37.3 1 30 10 33.3
31. Chandigarh 17 162 53 32.7 1 15 6 40.0 1 10 3 30.0
32. Dadra & Nagar Haveli 11 114 45 39.5 - - - - 1 11 4 36.4
33. Daman & Diu 14 77 30 39.0 - - - - 1 20 7 35.0
34. Lakshadweep 10 79 30 38.0 1 22 8 36.4
35. Pondicherry 98 913 330 36.1 10 108 40 - - - - -
Source: India, Ministry of Panchayati Raj. (2006). The State of the Panchayats: A Mid-Term Review and Appraisal 22 November 2006. New Delhi.
P.23-26.

Statistics on Women in India 2007
304
Women’s participation in Parliament since 1952 is given in Table 142.
Table 142: Women’s Representation in Parliament, 1952-2004
S. No. Year Lok Sabha (Lower House) Rajya Sabha (Upper House)
Total Women Men Percent- Total Women Men Percent-
Seats Members Members age Seats Members Members age
Women Women
1. 1952 499 22 4.4 219 16 7.3
2. 1957 500 27 5.4 237 18 7.5
3. 1962 503 34 6.8 238 18 7.6
4. 1967 523 31 5.9 240 20 8.3
5. 1971 521 22 4.2 243 17 7.0
6. 1977 544 19 3.4 244 25 10.2
7. 1980 544 28 7.9 244 24 9.8
8. 1984 544 44 8.1 244 28 11.4
9. 1989 517 27 5.3 245 24 9.7
10. 1991 544 39 7.2 245 38 15.5
11. 1996 543 39 7.2 223 20 9.0
12. 1998 543 43 7.9 245 15 6.1
13. 1999 543 49 9.0 245 19 7.8
14. 2004 545 45 500 8.2 245 28 217 11.4
Note: CSDS Data Unit
Source: 1. India, Ministry of Human Resource Development, Department of Women and Child
Development. (2004). Government of India, II & IIIrd Periodic Report on the Convention on
the Elimination of All Forms of Discrimination against Women : CEDAW Periodic Report.
New Delhi. P. 86.
2. www.parliamentofIndia.nic.in

Statistics on Women in India 2007
305
Party-wise break-up of women in the Thirteenth and Fourteenth Lok Sabha is given
in Table 143.
Table 143: Women MPs in Thirteenth and Fourteenth Lok Sabha Party-
wise, 2004
S.No. Political Parties Number of Number of
Women MPs Women MPs
(13th Lok Sabha) (14th Lok Sabha)
1. Bharatiya Janata Party (BJP) 15 10
2. Indian National Congress (INC) 13 13
3. Telugu Desam (TD) 03 -
4. Samajwadi Party (SP) 03 03
5. Communist Party of India (M) (CPI)M 03 05
6. All India Anna Dravida Munnetra
Kazhagam (AIADMK) 02 -
7. All India Trinamool Congress (AITC) 02 01
8. Shiv Sena (SS) 01 02
9. Bahujan Samaj Party (BSP) 01 -
10. Communist Party of India (CPI) 01 -
11. Nationalist Congress Party (NCP) 01 02
12. Rashtriya Janta Dal (RJD) 01 01
13. Janta Dal (U) 01 -
14. Indian National Lok Dal (INLD) 01 -
15. Dravida Munnetra Kazhagam (DMK) - 03
16. Shiromani Akali Dal (SAD) - 01
17. J&K People’s Democratic Party (J&K PDP) - 01
18. Biju Janata Dal (BJD) - 01
19. Lok Jan Shakti Party (LJSP) - 01
20. Rashtriya Lok Dal (RLD) - 01
21. Independent 01 -
Total 49 45
Notes: In 1999, out of 545 parliament seats, 49 seats were held by women In 1998, 7.92% of total
number of parliament seats were occupied by women; and 10% of total ministerial positions were
held by women
Source: Election Commission of India
Website: www.parliamentofindia.nic.in

Statistics on Women in India 2007
306
13. Women and Disability
Women in India are at a disadvantage as compared to their male counterparts. Disabled
women are even more vulnerable because of their gender and the disability. The incidence of
disability is more in rural areas, but support services in rural areas are less than in urban areas.
The various kinds of disabilities in rural and urban areas gender-wise are as given in Table 144.
Table 144: Disabled Persons in India, 2001
S. No. Residence Total Disabled
Disabled Persons Males Females
1. Total 21906769 12605635 9301134
Rural 16388382 9410185 6978197
Urban 5518387 3195450 2322937
2. Visually Handicapped
Residence Disabled Persons Males Females
Total 10634881 5732338 4902543
Rural 7873383 4222717 3650666
Urban 2761498 1509621 1251877
3. Speech Impaired
Residence Disabled Persons Males Females
Total 1640868 942095 698773
Rural 1243854 713966 529888
Urban 397014 228129 168885
4. Hearing Impaired
Residence Disabled Persons Males Females
Total 1261722 673797 587925
Rural 1022816 549002 473814
Urban 238906 124795 114111
5. Locomotor Disability (Movement)
Residence Disabled Persons Males Females
Total 6105477 3902752 2202725
Rural 4654552 2975127 1679425
Urban 1450925 927625 523300
6 Mentally Handicapped
Residence Disabled Persons Males Females
Total 2263821 1354653 909168
Rural 1593777 949373 644404
Urban 670044 405280 264764
Source: India, Registrar General and Census Commissioner. (2005). Data on Disability 2001: Compact
Disc. New Delhi.

Statistics on Women in India 2007
307
The number of disabled persons by type of disability is given in Table 145.
Table 145: Disabled Population by Type of Disability in India State-wise,
2001
S. No. India/ State/ Visual Speech Hearing Locomotor Mental Total
Union Territory Disability Disability Disability Disability Disability
only
India 10634881 1640868 1261722 6105477 2263821 21906769
1. Andhra Pradesh 581587 138974 73373 415848 155199 1364981
2. Arunachal Pradesh 23079 2429 3072 3474 1261 33315
3. Assam 282056 56974 51825 91970 47475 530300
4. Bihar 1005605 130471 73970 512246 165319 1887611
5. Chhattisgarh 160131 30438 34093 151611 43614 419887
6. Delhi 120712 15505 8741 64885 26043 235886
7. Goa 4393 1868 1000 4910 3578 15749
8. Gujarat 494624 66534 70321 310765 103221 1045465
9. Haryana 201358 24920 27682 151485 49595 455040
10. Himachal Pradesh 64122 12762 15239 46512 17315 155950
11. Jammu & Kashmir 208713 16956 14157 37965 24879 302670
12. Jharkand 186216 39683 28233 138323 55922 448377
13. Karnataka 440875 90717 49861 266559 92631 940643
14. Kerala 334622 67066 79713 237707 141686 860794
15. Madhya Pradesh 63614 75825 85354 495878 115257 1408528
16. Maharashtra 580930 113043 92390 56945 213274 1569582
17. Manipur 11713 2769 2994 6177 4723 28376
18. Meghalaya 13381 3431 3668 5127 3196 28803
19. Mizoram 6257 2006 2421 2476 2851 16011
20. Nagaland 9968 4398 5245 4258 2630 26499
21. Orissa 514104 68673 84115 250851 103592 1021335
22. Punjab 170853 22756 17348 149758 63808 424523
23. Rajasthan 753962 73147 75235 400577 109058 1411979
24. Sikkim 10790 3174 3432 2172 799 20367
25. Tamil Nadu 964063 124479 72636 353798 127521 1642497
26. Tripura 27505 5105 5699 13970 6661 58940
27. Uttarakhand 85668 16749 15990 56474 19888 194769
28. Uttar Pradesh 1852071 255951 128303 930580 286464 3453369
29. West Bengal 862073 170022 131579 412658 270842 1847174
30. Union Territories
31. Andaman & Nicobar Islands 3321 652 545 1870 669 7057
32. Chandigarh 8422 882 607 3828 1799 15538
33. Dadra & Nagar Haveli 2346 295 337 795 275 4048
34. Daman & Diu 1898 189 120 690 274 3171
35. Lakshadweep 603 207 147 505 216 1678
36. Pondicherry 10646 1818 2277 8830 2286 25857
Source: India, Ministry of Health and Family Welfare, Central Bureau of Health Intelligence. (2006). National
Health Profile 2005. New Delhi. P.76.

Statistics on Women in India 2007
308
The number of disabled persons gender-wise by type of disability is given in Table 146.
Table 146: Disabled Population in Seeing, Speech, Hearing, Movement
and Mental Handicap Rural, Urban India, 2001
S. No. India/ State/UT T/R/U Total Disabled Population In Seeing In Speech
Person Male Female Person Male Female Person Male Female
India T 21906769 12605635 9301134 10634881 5732338 4902543 1640868 942095 698773
R 16388382 9410185 6978197 7873383 4222717 3650666 1243854 713966 529888
U 5518387 3195450 2322937 2761498 1509621 1251877 397014 228129 168885
1. Andhra Pradesh T 1364981 773971 591010 581587 318730 262857 138974 76032 62942
R 1050400 590258 460142 435239 235461 199778 107500 58637 48863
U 314581 183713 130868 146348 83269 63079 31474 17395 14079
2. Arunachal Pradesh T 33315 22175 11140 23079 16283 6796 2429 1420 1009
R 27456 17848 9608 18329 12630 5699 2175 1273 902
U 5859 4327 1532 4750 3653 1097 254 147 107
3. Assam T 530300 297516 232784 282056 154136 127920 56974 31783 25191
R 468113 261460 206653 244103 132655 111448 51566 28714 22852
U 62187 36056 26131 37953 21481 16472 5408 3069 2339
4. Bihar T 1887611 1131526 756085 1005605 556688 448917 130471 77193 53278
R 1692454 1013699 678755 903016 498654 404362 117605 69488 48117
U 195157 117827 77330 102589 58034 44555 12866 7705 5161
5. Chhattisgarh T 419887 231768 188119 160131 84047 76084 30438 16702 13736
R 344993 188571 156422 129417 67167 62250 25280 13803 11477
U 74894 43197 31697 30714 16880 13834 5158 2899 2259
6. Delhi T 235886 144872 91014 120712 71342 49370 15505 9421 6084
R 13432 8424 5008 4925 2867 2058 1035 640 395
U 222454 136448 86006 115787 68475 47312 14470 8781 5689
7. Goa T 15749 8889 6860 4393 2316 2077 1868 1037 831
R 8559 4846 3713 2251 1157 1094 1028 563 465
U 7190 4043 3147 2142 1159 983 840 474 366
8. Gujarat T 1045465 604964 440501 494624 273694 220930 66534 40710 25824
R 719367 415093 304274 337141 184883 152258 46110 28515 17595
U 326098 189871 136227 157483 88811 68672 20424 12195 8229
9. Haryana T 455040 273837 181203 201358 111545 89813 24920 15643 9277
R 339792 204908 134884 148286 81300 66986 18332 11623 6709
U 115248 68929 46319 53072 30245 22827 6588 4020 2568
10. Himachal Pradesh T 155950 90444 65506 64122 34819 29303 12762 7512 5250
R 144756 83646 61110 58132 31163 26969 11989 7057 4932
U 11194 6798 4396 5990 3656 2334 773 455 318
11. Jammu & Kashmir T 302670 171816 130854 208713 116034 92679 16956 9748 7208
R 229718 129443 100275 152494 83563 68931 13992 8090 5902
U 72952 42373 30579 56219 32471 23748 2964 1658 1306
12. Jharkhand T 448377 264229 184148 186216 104147 82069 39683 22516 17167
R 348928 203463 145465 142109 78292 63817 31553 17776 13777
U 99449 60766 38683 44107 25855 18252 8130 4740 3390

Statistics on Women in India 2007
309
S. No. India/ State/UT T/R/U Total Disabled Population In Seeing In Speech
Person Male Female Person Male Female Person Male Female
13. Karnataka T 940643 537730 402913 440875 241439 199436 90717 50492 40225
R 661139 375809 285330 304701 164907 139794 65283 36255 29028
U 279504 161921 117583 136174 76532 59642 25434 14237 11197
14. Kerala T 860794 458350 402444 334622 167352 167270 67066 37179 29887
R 647782 344491 303291 251284 124846 126438 51003 28299 22704
U 213012 113859 99153 83338 42506 40832 16063 8880 7183
15. Madhya Pradesh T 1408528 824693 583835 636214 346567 289647 75825 45600 30225
R 1060433 618152 442281 478225 259729 218496 56242 33872 22370
U 348095 206541 141554 157989 86838 71151 19583 11728 7855
16. Maharashtra T 1569582 933867 635715 580930 320466 260464 113043 63802 49241
R 1020371 600603 419768 375886 201617 174269 70809 39729 31080
U 549211 333264 215947 205044 118849 86195 42234 24073 18161
17. Manipur T 28376 15456 12920 11713 6264 5449 2769 1502 1267
R 20955 11387 9568 8733 4696 4037 1986 1057 929
U 7421 4069 3352 2980 1568 1412 783 445 338
18. Meghalaya T 28803 15317 13486 13381 7170 6211 3431 1751 1680
R 22740 12052 10688 9643 5114 4529 2932 1514 1418
U 6063 3265 2798 3738 2056 1682 499 237 262
19. Mizoram T 16011 8763 7248 6257 3506 2751 2006 1084 922
R 9691 5228 4463 3770 2089 1681 1217 650 567
U 6320 3535 2785 2487 1417 1070 789 434 355
20. Nagaland T 26499 14541 11958 9968 5627 4341 4398 2285 2113
R 23520 12778 10742 8209 4544 3665 4067 2122 1945
U 2979 1763 1216 1759 1083 676 331 163 168
21. Orissa T 1021335 568914 452421 514104 274151 239953 68673 37625 31048
R 877709 485418 392291 435405 230381 205024 59674 32509 27165
U 143626 83496 60130 78699 43770 34929 8999 5116 3883
22. Punjab T 424523 252856 171667 170853 93153 77700 22756 13492 9264
R 297018 177552 119466 112597 60743 51854 15992 9417 6575
U 127505 75304 52201 58256 32410 25846 6764 4075 2689
23. Rajasthan T 1411979 840650 571329 753962 430589 323373 73147 46552 26595
R 1109383 657600 451783 591450 336419 255031 55548 35681 19867
U 302596 183050 119546 162512 94170 68342 17599 10871 6728
24. Sikkim T 20367 11409 8958 10790 6100 4690 3174 1654 1520
R 18571 10365 8206 9454 5319 4135 3044 1580 1464
U 1796 1044 752 1336 781 555 130 74 56
25. Tamil Nadu T 1642497 791685 850812 964063 397227 566836 124479 68172 56307
R 945019 446948 498071 553331 219696 333635 75215 40989 34226
U 697478 344737 352741 410732 177531 233201 49264 27183 22081

Statistics on Women in India 2007
310
S. No. India/ State/UT T/R/U Total Disabled Population In Seeing In Speech
Person Male Female Person Male Female Person Male Female
26. Tripura T 58940 33461 25479 27505 15629 11876 5105 2859 2246
R 48800 27638 21162 22559 12824 9735 4269 2403 1866
U 10140 5823 4317 4946 2805 2141 836 456 380
27. Uttar Pradesh T 3453369 2076504 1376865 1852071 1042383 809688 255951 151428 104523
R 2705784 1625941 1079843 1445145 808866 636279 200181 118631 81550
U 747585 450563 297022 406926 233517 173409 55770 32797 22973
28. Uttarakhand T 194769 113209 81560 85668 46434 39234 16749 9942 6807
R 154829 88961 65868 66804 35336 31468 13600 8029 5571
U 39940 24248 15692 18864 11098 7766 3149 1913 1236
29. West Bengal T 1847174 1058685 788489 862073 468935 393138 170022 94645 75377
R 1354253 774521 579732 610221 329861 280360 132912 74059 58853
U 492921 284164 208757 251852 139074 112778 37110 20586 16524
Union Territories
30. Andaman & T 7057 4226 2831 3321 1907 1414 652 383 269
Nicobar Islands R 5082 3059 2023 2283 1314 969 451 275 176
U 1975 1167 808 1038 593 445 201 108 93
31. Chandigarh T 15538 9538 6000 8422 5041 3381 882 551 331
R 1656 1097 559 953 620 333 99 68 31
U 13882 8441 5441 7469 4421 3048 783 483 300
32. Dadra & Nagar T 4048 2329 1719 2346 1353 993 295 166 129
Haveli R 3269 1843 1426 1860 1054 806 229 126 103
U 779 486 293 486 299 187 66 40 26
33. Daman & Diu T 3171 1779 1392 1898 1069 829 189 106 83
R 1880 1143 737 1161 730 431 113 62 51
U 1291 636 655 737 339 398 76 44 32
34. Lakshadweep T 1678 901 777 603 295 308 207 127 80
R 989 520 469 369 183 186 105 63 42
U 689 381 308 234 112 122 102 64 38
35. Pondicherry T 25857 14765 11092 10646 5900 4746 1818 981 837
R 9541 5420 4121 3898 2037 1861 718 397 321
U 16316 9345 6971 6748 3863 2885 1100 584 516

Statistics on Women in India 2007
311
Table 146 (contd.): Disabled Population in Seeing, Speech, Hearing,
Movement and Mental Handicap Rural, Urban India, 2001
S. No. India/ State/UT T/R/U Total Disabled Population In Hearing
Person Male Female Person MaleFemale
India T 21906769 12605635 9301134 1261722 673797 587925
R 16388382 9410185 6978197 1022816 549002 473814
U 5518387 3195450 2322937 238906 124795 114111
1. Andhra Pradesh T 1364981 773971 591010 73373 35891 37482
R 1050400 590258 460142 61075 29841 31234
U 314581 183713 130868 12298 6050 6248
2. Arunachal Pradesh T 33315 22175 11140 3072 1669 1403
R 27456 17848 9608 2881 1556 1325
U 5859 4327 1532 191 113 78
3. Assam T 530300 297516 232784 51825 27554 24271
R 468113 261460 206653 48274 25731 22543
U 62187 36056 26131 3551 1823 1728
4. Bihar T 1887611 1131526 756085 73970 43441 30529
R 1692454 1013699 678755 67619 39693 27926
U 195157 117827 77330 6351 3748 2603
5. Chhattisgarh T 419887 231768 188119 34093 18345 15748
R 344993 188571 156422 30398 16420 13978
U 74894 43197 31697 3695 1925 1770
6. Delhi T 235886 144872 91014 8741 4855 3886
R 13432 8424 5008 710 379 331
U 222454 136448 86006 8031 4476 3555
7. Goa T 15749 8889 6860 1000 471 529
R 8559 4846 3713 611 308 303
U 7190 4043 3147 389 163 226
8. Gujarat T 1045465 604964 440501 70321 35430 34891
R 719367 415093 304274 52424 26908 25516
U 326098 189871 136227 17897 8522 9375
9. Haryana T 455040 273837 181203 27682 15144 12538
R 339792 204908 134884 22158 12167 9991
U 115248 68929 46319 5524 2977 2547
10. Himachal Pradesh T 155950 90444 65506 15239 8411 6828
R 144756 83646 61110 14722 8140 6582
U 11194 6798 4396 517 271 246
11. Jammu & Kashmir T 302670 171816 130854 14157 7693 6464
R 229718 129443 100275 11751 6481 5270
U 72952 42373 30579 2406 1212 1194

Statistics on Women in India 2007
312
S. No. India/ State/UT T/R/U Total Disabled Population In Hearing
Person Male Female Person MaleFemale
12. Jharkhand T 448377 264229 184148 28233 15753 12480
R 348928 203463 145465 23552 13043 10509
U 99449 60766 38683 4681 2710 1971
13. Karnataka T 940643 537730 402913 49861 25455 24406
R 661139 375809 285330 37381 18931 18450
U 279504 161921 117583 12480 6524 5956
14. Kerala T 860794 458350 402444 79713 36456 43257
R 647782 344491 303291 61066 28145 32921
U 213012 113859 99153 18647 8311 10336
15. Madhya Pradesh T 1408528 824693 583835 85354 48468 36886
R 1060433 618152 442281 70642 40251 30391
U 348095 206541 141554 14712 8217 6495
16. Maharashtra T 1569582 933867 635715 92390 51789 40601
R 1020371 600603 419768 69205 39007 30198
U 549211 333264 215947 23185 12782 10403
17. Manipur T 28376 15456 12920 2994 1516 1478
R 20955 11387 9568 2447 1238 1209
U 7421 4069 3352 547 278 269
18. Meghalaya T 28803 15317 13486 3668 1795 1873
R 22740 12052 10688 3279 1624 1655
U 6063 3265 2798 389 171 218
19. Mizoram T 16011 8763 7248 2421 1308 1113
R 9691 5228 4463 1531 824 707
U 6320 3535 2785 890 484 406
20. Nagaland T 26499 14541 11958 5245 2819 2426
R 23520 12778 10742 5050 2720 2330
U 2979 1763 1216 195 99 96
21. Orissa T 1021335 568914 452421 84115 45701 38414
R 877709 485418 392291 76356 41403 34953
U 143626 83496 60130 7759 4298 3461
22. Punjab T 424523 252856 171667 17348 9226 8122
R 297018 177552 119466 12765 6751 6014
U 127505 75304 52201 4583 2475 2108
23. Rajasthan T 1411979 840650 571329 75235 39868 35367
R 1109383 657600 451783 63828 33670 30158
U 302596 183050 119546 11407 6198 5209

Statistics on Women in India 2007
313
S. No. India/ State/UT T/R/U Total Disabled Population In Hearing
Person Male Female Person MaleFemale
24. Sikkim T 20367 11409 8958 3432 1920 1512
R 18571 10365 8206 3323 1856 1467
U 1796 1044 752 109 64 45
25. Tamil Nadu T 1642497 791685 850812 72636 34896 37740
R 945019 446948 498071 44236 21374 22862
U 697478 344737 352741 28400 13522 14878
26. Tripura T 58940 33461 25479 5699 2807 2892
R 48800 27638 21162 4914 2433 2481
U 10140 5823 4317 785 374 411
27. Uttar Pradesh T 3453369 2076504 1376865 128303 73144 55159
R 2705784 1625941 1079843 105236 60246 44990
U 747585 450563 297022 23067 12898 10169
28. Uttarakhand T 194769 113209 81560 15990 8809 7181
R 154829 88961 65868 14059 7748 6311
U 39940 24248 15692 1931 1061 870
29. West Bengal T 1847174 1058685 788489 131579 71160 60419
R 1354253 774521 579732 109457 59160 50297
U 492921 284164 208757 22122 12000 10122
Union Territories
30. Andaman & Nicobar T 7057 4226 2831 545 305 240
Islands R 5082 3059 2023 463 268 195
U 1975 1167 808 82 37 45
31. Chandigarh T 15538 9538 6000 607 354 253
R 1656 1097 559 61 32 29
U 13882 8441 5441 546 322 224
32. Dadra & Nagar Haveli T 4048 2329 1719 337 176 161
R 3269 1843 1426 309 161 148
U 779 486 293 28 15 13
33. Daman & Diu T 3171 1779 1392 120 45 75
R 1880 1143 737 55 22 33
U 1291 636 655 65 23 42
34. Lakshadweep T 1678 901 777 147 76 71
R 989 520 469 98 50 48
U 689 381 308 49 26 23
35. Pondicherry T 25857 14765 11092 2277 1047 1230
R 9541 5420 4121 880 421 459
U 16316 9345 6971 1397 626 771

Statistics on Women in India 2007
314
Table 146 (contd.) : Disabled Population in Seeing, Speech, Hearing,
Movement and Mental Handicap Rural, Urban India, 2001
S. No. India/ State/UT T/R/U Total Disabled Population In Movement Mental Handicap
Person Male Female Person Male Female Person Male Female
India T 21906769 12605635 9301134 6105477 3902752 2202725 2263821 1354653 909168
R 16388382 9410185 6978197 4654552 2975127 1679425 1593777 949373 644404
U 5518387 3195450 2322937 1450925 927625 523300 670044 405280 264764
1. Andhra Pradesh T 1364981 773971 591010 415848 256541 159307 155199 86777 68422
R 1050400 590258 460142 329677 202201 127476 116909 64118 52791
U 314581 183713 130868 86171 54340 31831 38290 22659 15631
2. Arunachal Pradesh T 33315 22175 11140 3474 2127 1347 1261 676 585
R 27456 17848 9608 3003 1820 1183 1068 569 499
U 5859 4327 1532 471 307 164 193 107 86
3. Assam T 530300 297516 232784 91970 56386 35584 47475 27657 19818
R 468113 261460 206653 82861 50493 32368 41309 23867 17442
U 62187 36056 26131 9109 5893 3216 6166 3790 2376
4. Bihar T 1887611 1131526 756085 512246 346763 165483 165319 107441 57878
R 1692454 1013699 678755 459061 311536 147525 145153 94328 50825
U 195157 117827 77330 53185 35227 17958 20166 13113 7053
5. Chhattisgarh T 419887 231768 188119 151611 88943 62668 43614 23731 19883
R 344993 188571 156422 125597 72806 52791 34301 18375 15926
U 74894 43197 31697 26014 16137 9877 9313 5356 3957
6. Delhi T 235886 144872 91014 64885 42700 22185 26043 16554 9489
R 13432 8424 5008 5219 3478 1741 1543 1060 483
U 222454 136448 86006 59666 39222 20444 24500 15494 9006
7. Goa T 15749 8889 6860 4910 3082 1828 3578 1983 1595
R 8559 4846 3713 2697 1735 962 1972 1083 889
U 7190 4043 3147 2213 1347 866 1606 900 706
8. Gujarat T 1045465 604964 440501 310765 191507 119258 103221 63623 39598
R 719367 415093 304274 218259 134819 83440 65433 39968 25465
U 326098 189871 136227 92506 56688 35818 37788 23655 14133
9. Haryana T 455040 273837 181203 151485 98797 52688 49595 32708 16887
R 339792 204908 134884 116707 76979 39728 34309 22839 11470
U 115248 68929 46319 34778 21818 12960 15286 9869 5417
10. Himachal Pradesh T 155950 90444 65506 46512 29141 17371 17315 10561 6754
R 144756 83646 61110 43938 27524 16414 15975 9762 6213
U 11194 6798 4396 2574 1617 957 1340 799 541
11. Jammu & Kashmir T 302670 171816 130854 37965 23312 14653 24879 15029 9850
R 229718 129443 100275 32522 19937 12585 18959 11372 7587
U 72952 42373 30579 5443 3375 2068 5920 3657 2263

Statistics on Women in India 2007
315
S. No. India/ State/UT T/R/U Total Disabled Population In Movement Mental Handicap
Person Male Female Person Male Female Person Male Female
12. Jharkhand T 448377 264229 184148 138323 87802 50521 55922 34011 21911
R 348928 203463 145465 110272 69515 40757 41442 24837 16605
U 99449 60766 38683 28051 18287 9764 14480 9174 5306
13. Karnataka T 940643 537730 402913 266559 168815 97744 92631 51529 41102
R 661139 375809 285330 191449 121400 70049 62325 34316 28009
U 279504 161921 117583 75110 47415 27695 30306 17213 13093
14. Kerala T 860794 458350 402444 237707 142359 95348 141686 75004 66682
R 647782 344491 303291 178587 107646 70941 105842 55555 50287
U 213012 113859 99153 59120 34713 24407 35844 19449 16395
15. Madhya Pradesh T 1408528 824693 583835 495878 313078 182800 115257 70980 44277
R 1060433 618152 442281 377044 236349 140695 78280 47951 30329
U 348095 206541 141554 118834 76729 42105 36977 23029 13948
16. Maharashtra T 1569582 933867 635715 569945 374671 195274 213274 123139 90135
R 1020371 600603 419768 379723 249528 130195 124748 70722 54026
U 549211 333264 215947 190222 125143 65079 88526 52417 36109
17. Manipur T 28376 15456 12920 6177 3507 2670 4723 2667 2056
R 20955 11387 9568 4599 2589 2010 3190 1807 1383
U 7421 4069 3352 1578 918 660 1533 860 673
18. Meghalaya T 28803 15317 13486 5127 2893 2234 3196 1708 1488
R 22740 12052 10688 4282 2427 1855 2604 1373 1231
U 6063 3265 2798 845 466 379 592 335 257
19. Mizoram T 16011 8763 7248 2476 1418 1058 2851 1447 1404
R 9691 5228 4463 1518 850 668 1655 815 840
U 6320 3535 2785 958 568 390 1196 632 564
20. Nagaland T 26499 14541 11958 4258 2332 1926 2630 1478 1152
R 23520 12778 10742 3864 2085 1779 2330 1307 1023
U 2979 1763 1216 394 247 147 300 171 129
21. Orissa T 1021335 568914 452421 250851 153077 97774 103592 58360 45232
R 877709 485418 392291 218955 132454 86501 87319 48671 38648
U 143626 83496 60130 31896 20623 11273 16273 9689 6584
22. Punjab T 424523 252856 171667 149758 96183 53575 63808 40802 23006
R 297018 177552 119466 112648 72923 39725 43016 27718 15298
U 127505 75304 52201 37110 23260 13850 20792 13084 7708
23. Rajasthan T 1411979 840650 571329 400577 253324 147253 109058 70317 38741
R 1109383 657600 451783 318538 200293 118245 80019 51537 28482
U 302596 183050 119546 82039 53031 29008 29039 18780 10259
24. Sikkim T 20367 11409 8958 2172 1306 866 799 429 370
R 18571 10365 8206 2035 1231 804 715 379 336
U 1796 1044 752 137 75 62 84 50 34
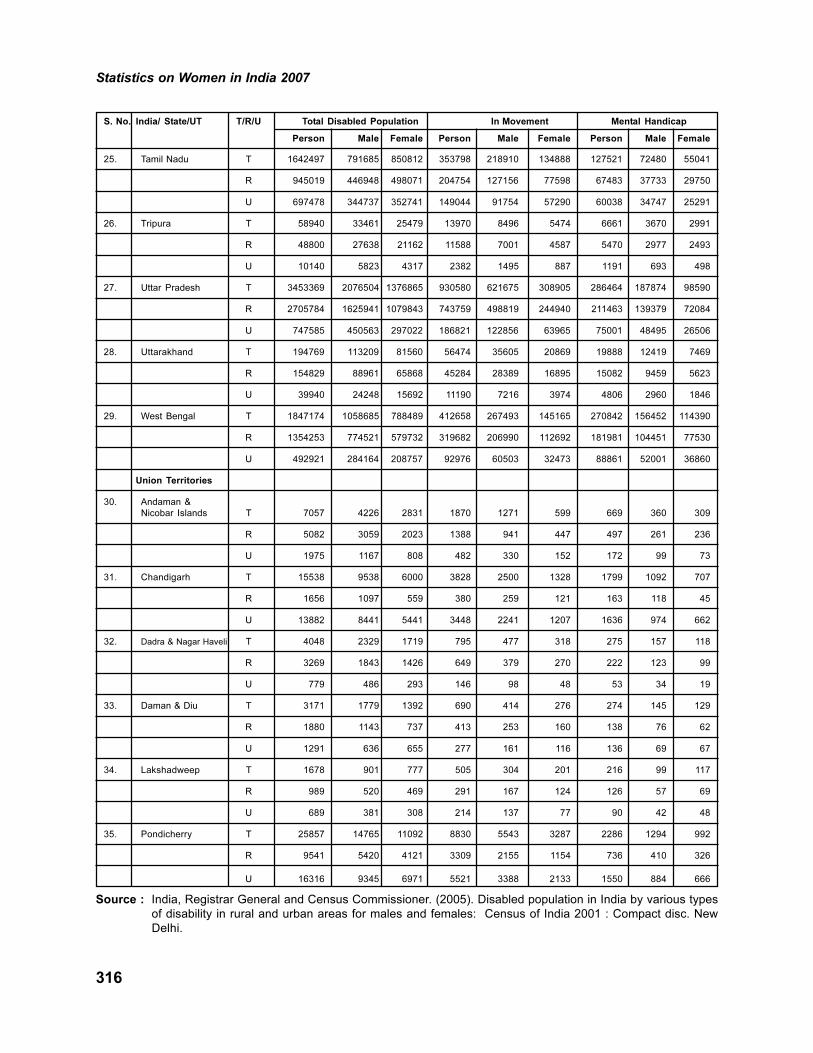
Statistics on Women in India 2007
316
S. No. India/ State/UT T/R/U Total Disabled Population In Movement Mental Handicap
Person Male Female Person Male Female Person Male Female
25. Tamil Nadu T 1642497 791685 850812 353798 218910 134888 127521 72480 55041
R 945019 446948 498071 204754 127156 77598 67483 37733 29750
U 697478 344737 352741 149044 91754 57290 60038 34747 25291
26. Tripura T 58940 33461 25479 13970 8496 5474 6661 3670 2991
R 48800 27638 21162 11588 7001 4587 5470 2977 2493
U 10140 5823 4317 2382 1495 887 1191 693 498
27. Uttar Pradesh T 3453369 2076504 1376865 930580 621675 308905 286464 187874 98590
R 2705784 1625941 1079843 743759 498819 244940 211463 139379 72084
U 747585 450563 297022 186821 122856 63965 75001 48495 26506
28. Uttarakhand T 194769 113209 81560 56474 35605 20869 19888 12419 7469
R 154829 88961 65868 45284 28389 16895 15082 9459 5623
U 39940 24248 15692 11190 7216 3974 4806 2960 1846
29. West Bengal T 1847174 1058685 788489 412658 267493 145165 270842 156452 114390
R 1354253 774521 579732 319682 206990 112692 181981 104451 77530
U 492921 284164 208757 92976 60503 32473 88861 52001 36860
Union Territories
30. Andaman &
Nicobar Islands T 7057 4226 2831 1870 1271 599 669 360 309
R 5082 3059 2023 1388 941 447 497 261 236
U 1975 1167 808 482 330 152 172 99 73
31. Chandigarh T 15538 9538 6000 3828 2500 1328 1799 1092 707
R 1656 1097 559 380 259 121 163 118 45
U 13882 8441 5441 3448 2241 1207 1636 974 662
32. Dadra & Nagar Haveli T 4048 2329 1719 795 477 318 275 157 118
R 3269 1843 1426 649 379 270 222 123 99
U 779 486 293 146 98 48 53 34 19
33. Daman & Diu T 3171 1779 1392 690 414 276 274 145 129
R 1880 1143 737 413 253 160 138 76 62
U 1291 636 655 277 161 116 136 69 67
34. Lakshadweep T 1678 901 777 505 304 201 216 99 117
R 989 520 469 291 167 124 126 57 69
U 689 381 308 214 137 77 90 42 48
35. Pondicherry T 25857 14765 11092 8830 5543 3287 2286 1294 992
R 9541 5420 4121 3309 2155 1154 736 410 326
U 16316 9345 6971 5521 3388 2133 1550 884 666
Source : India, Registrar General and Census Commissioner. (2005). Disabled population in India by various types
of disability in rural and urban areas for males and females: Census of India 2001 : Compact disc. New
Delhi.

Statistics on Women in India 2007
317
14. Household Consumer Expenditure
The National Sample Survey (NSS) collects some basic information on various
indicators. The present report is based on the data on consumer expenditure collected
during the NSS 61st Round (July 2004 – June 2005). The main findings discuss the pattern
of variation of monthly per capita consumer expenditure over rural and urban areas of
selected States, including the North- Eastern States, and the Group of Union Territories.
The all-India average Monthly Per Capita Consumer Expenditure (MPCE) was Rs.558.78
and Rs.1052.36 for rural and urban areas respectively. Thus, the average MPCE for urban
areas at all India level was higher than that in rural areas.
The average expenditure per person per month on various items in rural and urban
areas is given in Table 147.

Statistics on Women in India 2007
318
Table 147: Average Monthly Expenditure (Rs.) Per Person on Groups of
Items of Consumption for Selected States/UTs in Rural and
Urban Areas, 2004-05S. Item Per Capita Monthly Expenditure Rural and Urban (Rs.)
No. All-India Andhra Pradesh Assam
Rural Urban Rural Urban Rural Urban
1. Cereal 100.65 105.82 113.60 124.52 134.81 144.02
2. Gram 0.73 1.10 0.11 0.16 0.23 0.60
3. Cereal Substitutes 0.39 0.52 0.02 0.01 0.03 0.73
4. Pulses and Pulse Products 17.18 22.51 19.25 22.76 18.02 23.20
5. Milk & Milk Products 47.31 83.30 34.32 59.42 23.75 50.05
6. Edible Oil 25.72 36.37 28.00 31.97 26.58 38.62
7. Egg, Fish and Meat 18.60 28.47 25.10 31.51 55.01 82.38
8. Vegetables 34.07 46.84 31.06 35.95 50.71 64.05
9. Fruits (Fresh) 8.44 18.60 9.47 15.11 5.05 14.01
10. Fruits (Dry) 1.98 5.05 2.63 3.94 0.26 1.37
11. Sugar 13.25 15.88 8.05 9.80 8.62 11.91
12. Salt 1.12 1.44 1.27 1.48 1.73 2.03
13. Spices 12.78 16.21 17.19 17.71 10.23 14.16
14. Beverages, etc. 25.37 65.31 33.08 68.89 23.42 76.55
Food Total 307.60 447.41 323.15 423.24 358.44 523.68
15. Paan 2.46 2.68 1.12 1.09 11.27 14.29
16. Tobacco 8.05 8.71 11.53 12.70 5.99 10.53
17. Intoxicants 4.52 5.65 10.91 11.95 6.26 5.70
18. Fuel and Light 56.84 104.62 49.91 88.29 54.80 104.48
19. Clothing 25.33 42.09 25.82 45.25 24.10 27.26
20. Footwear 4.24 7.17 2.44 3.15 3.76 4.18
21. Education 14.90 52.69 7.70 26.03 7.96 48.37
22. Medical (Institutional) 10.03 13.05 7.50 12.41 0.78 37.17
23. Medical (Non-Institutional) 26.93 41.54 31.11 40.42 9.28 24.14
24. Entertainment 3.46 19.81 8.56 24.35 2.64 21.26
25. Minor personal effects 1.13 2.13 0.31 0.51 1.75 2.22
26. Toilet articles 14.96 27.84 21.35 31.39 13.14 25.23
27. Other hh consumables 13.02 23.48 14.50 23.34 11.00 17.74
28. Conveyance 21.03 68.59 21.70 60.32 10.68 52.95
29. Other consumer services 21.18 74.15 20.90 67.35 14.18 60.47
30. Rent 2.77 59.45 6.23 95.73 0.60 68.11
31. Taxes and Cesses 1.12 8.50 1.51 9.10 0.31 4.14
32. Durable Goods 19.23 42.81 19.31 41.94 6.23 6.09
Non-Food Total 251.19 604.95 262.40 595.31 184.74 534.30
Total Consumer Expenditure 558.78 1052.36 585.55 1018.55 543.18 1057.99
Clothing (Second Hand)* 0.14 0.13 0.02 0.00 0.20 0.00
Durable Goods (Second Hand)* 1.24 1.35 1.93 2.48 0.89 0.00
Imputed rent** 208.44 117.94 173.96
No. of Sample Households 79298 45346 5555 2876 3350 900
*included in total expenditure ** not included in total expenditure

Statistics on Women in India 2007
319
S. Item Per Capita Monthly Expenditure Rural and Urban (Rs.)
No. Bihar Chhattisgarh Gujarat
Rural Urban Rural Urban Rural Urban
1. Cereal 112.98 119.51 115.60 120.27 79.55 89.69
2. Gram 1.73 2.32 0.27 0.36 0.41 0.81
3. Cereal Substitutes 0.06 0.29 0.01 0.04 0.17 0.43
4. Pulses and Pulse Products 14.71 20.66 14.04 24.61 20.15 25.37
5. Milk & Milk Products 37.10 58.09 7.47 46.31 78.08 126.47
6. Edible Oil 23.51 29.92 19.85 34.40 43.57 57.82
7. Egg, Fish and Meat 9.95 13.03 10.56 17.91 5.19 8.00
8. Vegetables 33.11 43.10 35.50 56.11 42.64 59.22
9. Fruits (Fresh) 4.01 8.71 4.46 15.41 9.15 19.38
10. Fruits (Dry) 0.48 2.47 0.30 4.32 1.81 7.37
11. Sugar 7.73 10.73 9.34 15.42 18.93 21.21
12. Salt 1.01 1.34 0.81 1.60 0.70 1.16
13. Spices 9.68 12.06 8.51 14.10 13.37 16.77
14. Beverages, etc. 14.21 33.79 12.37 35.48 31.75 66.69
Food Total 270.26 356.01 239.08 386.34 345.46 500.39
15. Paan 1.08 4.20 1.92 5.74 3.18 4.05
16. Tobacco 3.94 3.11 4.81 5.62 11.78 8.42
17. Intoxicants 1.59 1.90 5.28 6.15 1.33 0.63
18. Fuel and Light 47.35 75.47 45.66 89.85 63.10 120.05
19. Clothing 20.88 24.15 19.26 35.99 15.56 42.54
20. Footwear 2.21 3.16 2.41 4.40 4.28 11.36
21. Education 7.25 45.16 5.95 81.05 7.47 47.22
22. Medical (Institutional) 1.76 3.06 7.25 19.99 4.37 3.37
23. Medical (Non-Institutional) 12.13 22.52 24.37 43.62 22.06 41.27
24. Entertainment 1.27 6.73 1.20 13.57 4.50 28.01
25. Minor personal effects 0.77 1.43 1.19 2.67 1.52 3.51
26. Toilet articles 10.42 18.26 16.02 29.67 14.53 30.53
27. Other hh consumables 9.91 14.28 11.57 23.03 17.09 26.12
28. Conveyance 5.47 22.30 10.26 49.70 31.70 87.44
29. Other consumer services 17.00 33.89 9.12 53.88 24.00 75.11
30. Rent 0.11 43.97 0.64 43.40 5.17 37.02
31. Taxes and Cesses 0.00 0.86 0.06 6.63 2.17 12.02
32. Durable Goods 3.70 15.80 19.06 88.68 16.81 36.13
Non-Food Total 146.85 340.26 186.02 603.63 250.63 614.81
Total Consumer Expenditure 417.11 696.27 425.10 989.97 596.09 1115.20
Clothing (Second Hand)* 0.05 0.06 0.01 0.00 0.25 0.11
Durable Goods (Second Hand)* 0.02 1.95 0.16 0.34 0.07 2.41
Imputed rent** 120.20 162.61 2320 253.55
No. of Sample Households 4354 1398 1997 799 1955
*included in total expenditure ** not included in total expenditure

Statistics on Women in India 2007
320
S. Item Per Capita Monthly Expenditure Rural and Urban (Rs.)
No. Haryana Jharkhand Karnataka
Rural Urban Rural Urban Rural Urban
1. Cereal 74.60 78.77 115.53 132.17 83.81 114.78
2. Gram 0.77 1.25 1.18 3.29 1.41 1.55
3. Cereal Substitutes 0.01 0.01 0.01 0.00 0.01 0.02
4. Pulses and Pulse Products 15.42 18.50 12.74 21.46 17.96 23.16
5. Milk & Milk Products 172.17 164.93 19.45 66.61 34.35 65.35
6. Edible Oil 19.01 29.12 22.40 36.70 23.00 29.97
7. Egg, Fish and Meat 5.02 8.01 15.30 29.99 17.81 30.07
8. Vegetables 36.58 51.23 37.80 65.24 23.44 32.28
9. Fruits (Fresh) 12.86 23.94 2.53 12.53 13.67 22.32
10. Fruits (Dry) 1.84 3.67 0.31 4.20 2.92 4.64
11. Sugar 28.23 22.07 7.65 14.00 14.17 14.92
12. Salt 1.35 1.52 1.24 1.79 1.08 1.28
13. Spices 11.71 13.78 10.34 16.51 13.25 14.89
14. Beverages, etc. 39.78 55.86 16.73 57.86 36.16 91.26
Food Total 419.34 472.65 263.22 462.34 283.04 446.48
15. Paan 0.05 1.01 1.84 1.83 4.53 2.02
16. Tobacco 13.61 11.36 3.88 4.16 7.74 7.27
17. Intoxicants 7.66 8.29 8.00 7.62 5.80 9.98
18. Fuel and Light 90.56 126.58 48.81 82.09 56.14 107.48
19. Clothing 42.49 41.66 21.00 49.95 17.89 29.55
20. Footwear 9.18 14.01 3.26 8.26 2.62 2.26
21. Education 50.53 83.58 6.54 62.33 8.29 29.16
22. Medical (Institutional) 18.80 43.32 1.06 11.40 4.04 9.66
23. Medical (Non-Institutional) 34.22 39.88 15.40 37.89 16.38 32.78
24. Entertainment 9.17 20.15 1.22 16.10 4.10 24.45
25. Minor personal effects 0.71 1.39 0.90 1.15 0.32 0.28
26. Toilet articles 18.23 26.14 12.14 28.24 17.16 29.14
27. Other hh consumables 18.59 23.36 11.00 21.54 13.81 22.83
28. Conveyance 42.10 67.20 9.11 61.39 22.43 71.69
29. Other consumer services 41.76 77.52 9.17 51.51 21.24 75.44
30. Rent 15.46 41.05 0.70 64.37 3.18 113.25
31. Taxes and Cesses 3.89 11.38 0.00 1.33 1.94 15.38
32. Durable Goods 26.55 31.82 8.05 11.94 17.80 4.11
Non-Food Total 443.55 669.70 162.08 523.10 225.42 586.73
Total Consumer Expenditure 862.89 1142.35 425.30 985.43 508.46 1033.21
Clothing (Second Hand)* 0.06 0.06 0.00 0.02 0.02 0.02
Durable Goods (Second Hand)* 0.32 2.70 1.34 0.01 4.93 0.07
Imputed rent** 248.67 131.58 195.19
No. of Sample Households 1680 1040 2379 1040 2880 2227
*included in total expenditure ** not included in total expenditure

Statistics on Women in India 2007
321
S. Item Per Capita Monthly Expenditure Rural and Urban (Rs.)
No. Kerala Madhya Pradesh Maharashtra
Rural Urban Rural Urban Rural Urban
1. Cereal 111.52 108.40 79.32 86.61 82.36 96.71
2. Gram 2.66 3.07 0.34 0.37 0.25 0.77
3. Cereal Substitutes 4.73 2.45 0.30 1.11 2.27 1.99
4. Pulses and Pulse Products 15.15 16.72 17.16 21.97 22.19 25.91
5. Milk & Milk Products 41.28 57.00 39.19 72.45 34.65 77.06
6. Edible Oil 26.62 30.56 20.48 31.47 33.90 44.15
7. Egg, Fish and Meat 67.87 77.75 5.03 10.06 14.24 26.57
8. Vegetables 33.80 38.34 24.07 36.93 28.95 45.52
9. Fruits (Fresh) 46.47 52.01 4.45 12.37 9.02 23.66
10. Fruits (Dry) 2.11 3.45 1.31 4.82 8.95 10.90
11. Sugar 16.06 16.17 13.59 18.04 18.10 17.56
12. Salt 1.24 1.27 0.95 1.37 1.15 1.47
13. Spices 20.52 20.27 10.34 13.29 13.49 16.07
14. Beverages, etc. 65.59 88.56 15.65 38.72 23.78 75.94
Food Total 455.64 516.02 232.17 351.56 293.29 464.27
15. Paan 2.34 1.07 2.39 3.57 2.34 3.20
16. Tobacco 9.35 10.27 8.38 7.15 5.89 6.02
17. Intoxicants 10.90 9.72 3.23 4.44 3.39 6.08
18. Fuel and Light 71.37 95.02 52.48 93.12 61.39 113.50
19. Clothing 45.07 72.90 24.21 37.61 19.43 42.97
20. Footwear 7.58 9.16 4.61 7.00 2.87 7.41
21. Education 35.03 55.76 10.28 62.90 10.21 45.77
22. Medical (Institutional) 42.78 24.22 2.51 13.56 10.72 18.93
23. Medical (Non-Institutional) 61.22 67.71 25.78 31.15 29.38 53.14
24. Entertainment 10.75 19.19 1.80 13.83 2.99 24.63
25. Minor personal effects 2.55 3.07 1.71 2.80 1.19 1.19
26. Toilet articles 23.24 27.20 11.88 22.14 17.83 31.78
27. Other hh consumables 18.82 22.91 11.28 18.85 15.02 28.36
28. Conveyance 68.49 98.17 16.86 55.45 31.46 80.95
29. Other consumer services 50.65 103.93 17.63 57.33 25.29 97.51
30. Rent 5.86 31.84 1.06 27.64 4.70 65.85
31. Taxes and Cesses 3.13 8.71 0.39 7.31 4.56 14.22
32. Durable Goods 88.41 114.04 10.42 86.29 25.80 42.47
Non-Food Total 557.52 774.87 206.89 552.13 274.46 684.00
Total Consumer Expenditure 1013.15 1290.89 439.06 903.68 567.76 1148.27
Clothing (Second Hand)* 0.03 0.00 0.19 0.05 0.02 0.05
Durable Goods (Second Hand)* 3.59 8.10 0.26 3.33 2.33 0.20
Imputed rent** 286.98 141.21 296.15
No. of Sample Households 3300 1950 3838 2075 5014 4993
*included in total expenditure ** not included in total expenditure

Statistics on Women in India 2007
322
S. Item Per Capita Monthly Expenditure Rural and Urban (Rs.)
No. Orissa Punjab Rajasthan
Rural Urban Rural Urban Rural Urban
1. Cereal 112.69 127.19 74.51 84.32 85.58 92.43
2. Gram 0.16 0.32 2.47 2.64 0.25 0.18
3. Cereal Substitutes 0.00 0.00 0.00 0.12 0.00 0.02
4. Pulses and Pulse Products 11.47 18.96 20.41 22.66 11.29 13.02
5. Milk & Milk Products 10.18 35.91 138.17 158.83 112.99 119.68
6. Edible Oil 16.17 24.57 33.66 38.56 21.93 31.17
7. Egg, Fish and Meat 16.74 33.79 3.75 6.95 4.37 9.23
8. Vegetables 35.18 47.81 38.79 45.27 27.13 40.40
9. Fruits (Fresh) 5.29 11.43 9.77 19.20 5.66 13.14
10. Fruits (Dry) 0.36 1.31 1.86 3.44 1.12 5.02
11. Sugar 6.78 10.28 34.31 26.33 18.52 18.66
12. Salt 1.27 1.74 1.28 1.44 1.26 1.50
13. Spices 8.63 12.37 12.45 13.71 13.72 15.28
14. Beverages, etc. 20.64 52.45 45.02 75.57 20.14 41.44
Food Total 245.58 378.13 416.45 499.03 323.97 401.17
15. Paan 3.70 5.42 0.00 0.23 0.05 0.64
16. Tobacco 3.89 4.65 4.21 5.41 14.56 8.77
17. Intoxicants 2.83 3.21 10.28 11.01 5.69 6.02
18. Fuel and Light 47.13 78.72 108.88 146.58 58.83 100.17
19. Clothing 14.50 27.95 28.72 41.29 30.72 50.67
20. Footwear 1.04 1.65 7.86 9.90 8.15 11.24
21. Education 10.27 49.88 35.96 83.84 15.65 48.27
22. Medical (Institutional) 4.36 8.53 14.91 17.09 16.11 5.52
23. Medical (Non-Institutional) 17.10 26.21 42.15 44.45 23.33 33.69
24. Entertainment 1.37 10.14 4.21 22.17 1.22 10.92
25. Minor personal effects 0.80 1.26 1.46 2.58 0.98 1.73
26. Toilet articles 11.10 19.53 25.04 37.18 11.88 23.05
27. Other hh consumables 8.54 15.17 22.19 27.54 15.81 22.34
28. Conveyance 8.09 33.47 48.63 89.63 21.96 57.44
29. Other consumer services 7.66 30.30 43.55 92.39 25.58 55.23
30. Rent 1.80 47.66 4.18 33.11 1.17 26.67
31. Taxes and Cesses 0.33 3.08 1.49 9.93 1.13 6.48
32. Durable Goods 8.82 12.35 26.56 152.73 14.03 93.99
Non-Food Total 153.31 379.18 430.30 827.05 266.86 562.85
Total Consumer Expenditure 398.89 757.31 846.75 1326.09 590.83 964.02
Clothing (Second Hand)* 0.04 0.02 0.05 0.30 0.09 0.15
Durable Goods (Second Hand)* 0.01 1.64 1.24 0.39 1.55 1.34
Imputed rent** 92.64 286.22 212.27
No. of Sample Households 3836 1187 2433 1855 3541 1630
*included in total expenditure ** not included in total expenditure

Statistics on Women in India 2007
323
S. Item Per Capita Monthly Expenditure Rural and Urban (Rs.)
No. Tamil Nadu Uttar Pradesh West Bengal
Rural Urban Rural Urban Rural Urban
1. Cereal 93.49 111.37 98.62 112.73 131.81 126.60
2. Gram 1.31 1.86 0.81 1.98 0.14 0.41
3. Cereal Substitutes 0.06 0.04 0.07 0.00 0.04 0.21
4. Pulses and Pulse Products 21.50 27.62 23.62 29.96 11.77 17.34
5. Milk & Milk Products 27.27 66.38 76.16 100.68 18.88 45.52
6. Edible Oil 24.14 31.71 28.68 34.96 27.44 40.67
7. Egg, Fish and Meat 24.38 33.33 10.92 17.22 44.51 81.06
8. Vegetables 34.85 42.49 36.54 48.19 43.50 58.45
9. Fruits (Fresh) 13.02 19.86 8.28 17.50 6.05 15.48
10. Fruits (Dry) 0.60 1.66 2.31 7.27 0.51 1.77
11. Sugar 7.27 10.62 21.24 21.57 7.77 11.76
12. Salt 1.08 1.33 1.22 1.72 1.28 1.81
13. Spices 21.50 23.55 11.56 14.24 13.33 17.73
14. Beverages, etc. 45.03 89.04 25.85 53.05 22.91 68.80
Food Total 315.49 460.85 345.88 461.08 329.93 487.61
15. Paan 3.62 1.45 0.15 0.61 2.40 3.15
16. Tobacco 7.25 8.29 11.41 11.56 7.99 16.34
17. Intoxicants 4.55 5.01 5.61 7.80 2.17 2.85
18. Fuel and Light 53.81 96.40 76.12 98.10 56.85 115.36
19. Clothing 19.82 39.55 26.06 44.64 30.65 50.31
20. Footwear 1.26 2.75 6.85 9.10 3.11 6.50
21. Education 14.18 33.65 27.22 72.60 18.12 73.52
22. Medical (Institutional) 27.87 9.81 12.03 14.19 7.75 9.21
23. Medical (Non-Institutional) 26.82 41.56 21.20 27.63 30.38 61.99
24. Entertainment 7.71 21.81 3.49 12.54 2.66 20.83
25. Minor personal effects 0.36 1.23 1.19 2.25 0.91 3.11
26. Toilet articles 19.87 29.19 13.67 21.88 13.93 28.30
27. Other hh consumables 16.77 29.79 12.47 20.74 10.53 21.38
28. Conveyance 30.11 75.79 18.91 42.41 14.64 54.43
29. Other consumer services 22.03 79.44 24.90 56.64 10.83 78.99
30. Rent 6.77 115.14 3.68 39.34 0.92 38.80
31. Taxes and Cesses 1.38 7.10 1.33 8.95 0.29 2.24
32. Durable Goods 22.50 20.82 35.00 26.20 18.06 48.70
Non-Food Total 286.68 618.80 301.27 517.18 232.18 636.01
Total Consumer Expenditure 602.17 1079.65 647.15 978.26 562.11 1123.61
Clothing (Second Hand)* 0.01 0.01 0.11 0.02 0.20 0.03
Durable Goods (Second Hand)* 0.71 1.27 18.99 0.88 0.02 1.46
Imputed rent** 173.53 219.88 214.61
No. of Sample Households 4159 4137 7868 3345 4988 2889
*included in total expenditure ** not included in total expenditure

Statistics on Women in India 2007
324
S. Item Per Capita Monthly Expenditure Per Capita Monthly Expenditure
No. Rural (Rs.) * Urban (Rs.) *
Rural Urban
N-Eastern States Group of UTs N-Eastern States Group of UTs
Sch. Sch. Sch. Sch. Sch. Sch. Sch. Sch.
Type 1 Type 2 Type 1 Type 2 Type 1 Type 2 Type 1 Type 2
1. Cereal 134.87 134.49 93.86 99.33 153.54 154.10 104.99 99.12
2. Gram 0.16 0.10 0.85 1.85 0.26 0.41 2.64 2.68
3. Cereal Substitutes 0.58 0.45 0.28 0.09 0.58 0.16 0.11 0.06
4. Pulses and Their Products 12.38 12.36 23.30 23.96 18.75 17.39 24.10 24.36
5. Milk & Milk Products 17.02 19.23 54.27 48.75 38.27 37.19 113.83 132.50
6. Edible Oil 18.72 24.02 37.09 39.34 26.85 37.81 36.22 41.31
7. Egg, Fish and Meat 63.01 98.93 49.66 47.97 89.42 139.13 29.65 46.41
8. Vegetables 45.72 73.71 48.96 63.75 60.85 95.35 50.25 68.87
9. Fruits (Fresh) 7.21 14.37 20.10 24.57 13.20 25.54 25.99 58.10
10. Fruits (Dry) 0.22 0.67 2.70 3.33 0.96 1.56 4.81 9.41
11. Sugar 7.61 7.69 11.82 12.31 10.28 10.08 13.68 14.31
12. Salt 1.70 1.68 1.57 1.57 1.96 1.89 1.61 1.62
13. Spices 8.24 13.85 19.56 22.41 11.05 17.42 21.92 29.26
14. Beverages, etc. 26.72 39.53 71.35 103.95 52.30 17.16 113.19 164.75
Food Total 344.16 441.09 435.36 493.19 478.29 608.20 542.99 692.77
15. Paan 11.51 15.87 10.34 10.83 13.72 18.54 3.10 5.58
16. Tobacco 12.81 14.35 7.72 8.39 14.80 17.81 5.45 10.55
17. Intoxicants 8.12 12.64 21.29 24.77 5.08 9.22 12.10 14.28
18. Fuel and Light 57.58 57.18 66.93 59.35 91.07 82.18 97.06 102.70
19. Clothing 41.36 39.69 51.62 46.03 63.12 57.82 89.75 91.56
20. Footwear 9.58 9.18 7.40 7.41 19.95 16.57 16.21 18.40
21. Education 24.80 24.63 45.72 27.24 77.76 62.05 148.37 189.34
22. Medical (Institutional) 4.31 5.34 4.34 4.10 6.13 6.73 37.47 11.73
23. Medical (Non-Institutional) 14.87 15.73 31.35 25.58 24.81 24.84 39.26 35.90
24. Miscellaneous Consumer goods 33.67 32.12 67.35 56.43 68.48 64.27 111.27 108.62
25. Consumer Services 33.63 33.30 98.35 60.71 96.76 85.36 196.62 238.71
26. Rent 1.87 2.27 43.24 27.55 35.80 43.36 137.07 170.96
27. Taxes and Cesses 0.21 0.15 1.96 2.11 3.54 2.70 13.02 24.28
28. Durable Goods 26.03 14.79 43.25 28.51 34.96 28.69 40.82 63.67
Non-Food Total 280.35 277.24 500.87 389.02 555.98 520.15 947.58 1086.28
Total Consumer Expenditure 624.51 718.33 936.24 882.21 1034.27 1128.35 1490.56 1779.05
29. Clothing (Second Hand) 2.88 2.69 0.35 0.82 4.72 3.84 0.02 0.25
30. Durable Goods (Second Hand) 0.29 0.59 0.77 0.00 0.31 1.88 0.17 3.63
31. Imputed Rent - - - - 224.25 125.39 234.15 238.97
32. Estd. No. of HHS (00) 16423 16467 2364 2367 4399 4369 3786 3807
33. Estd. No. of persons (00) 83015 79979 10083 10804 18732 20113 14394 13915
34. No. of Sample Persons 4516 4561 571 588 1901 1929 719 684
All India * Rural * Urban *
Sch. Type 1 Sch. Type 2 Sch. Type 1 Sch. Type 2
Food Total 304.60 357.35 441.48 528.73
Non-Food Total 260.10 259.22 618.68 620.79
Total Consumer Expenditure 564.70 616.57 1060.16 1149.52
Notes: Schedule Type 1 – was the average monthly expenditure during the survey period Jan-Jun 2004.Schedule Type 2 – was based on the average monthly expenditure using a 7 day reference period.
Source: 1. India, Ministry of Statistics and Programme Implementation, National Sample Survey Organisation. (2006). Leveland Pattern of Consumer Expenditure, July 2004-June 2005: NSS 61th Round. New Delhi. P 50-55.
2. *India, Ministry of Statistics and Programme Implementation, National Sample Survey Organisation. (2005). House-hold Consumer Expenditure in India: NSS 60th Round Jan-Jun 2004. New Delhi. P 42-43, 51.

Statistics on Women in India 2007
325
The average consumption expenditure per person per month in rural and urban areas
is given in Table 148.
Table 148: Average Monthly Per Capita Consumption Expenditure (Rs.)
in Rural and Urban Areas of Selected States/ UTs, 2004-05
S. No. India/ State/ Union Territory Monthly Per Capita Consumption
Expenditure (Rs.)
Rural Urban
India 558.78 1052.36
1. Andhra Pradesh 585.55 1018.55
2. Arunachal Pradesh 771.53 881.10
3. Assam 543.18 1057.99
4. Bihar 417.11 696.27
5. Chhattisgarh 425.10 989.97
6. Delhi 918.50 1319.31
7. Goa 985.49 1431.97
8. Gujarat 596.09 1115.20
9. Haryana 862.89 1142.35
10. Himachal Pradesh 798.11 1390.07
11. Jammu & Kashmir 793.16 1070.12
12. Jharkand 425.30 985.43
13. Karnataka 508.46 1033.21
14. Kerala 1013.15 1290.89
15. Madhya Pradesh 439.06 903.68
16. Maharashtra 567.76 1148.27
17. Manipur 614.20 726.38
18. Meghalaya 655.30 1190.09
19. Mizoram 778.35 1200.51
20. Nagaland 1010.81 1498.47
21. Orissa 398.89 757.31
22. Punjab 846.75 1326.09
23. Rajasthan 590.83 964.02
24. Sikkim 688.53 1106.79
25. Tamil Nadu 602.17 1079.65
26. Tripura 487.63 1000.54
27. Uttarakhand 647.1 978.26
28. Uttar Pradesh 532.63 857.05
29. West Bengal 562.11 1123.61
30. Union Territories
31. Andaman & Nicobar Islands 1069.08 1802.39
32. Chandigarh 862.75 1769.52
33. Dadra & Nagar Haveli 569.80 1407.50
34. Daman & Diu 1160.89 1079.59
35. Lakshadweep 1312.55 1421.22
36. Pondicherry 735.31 1022.53
Source: India, Ministry of Statistics and Programme Implementation, National Sample Survey Organisation.
(2006). Level and Pattern of Consumer Expenditure, July 2004-June 2005: NSS 61st

Statistics on Women in India 2007
326
15. Budget Outlay
The Central Government expenditure on social sectors, namely education, health and
family welfare, water supply, sanitation, housing, rural development, social welfare, nutrition
and minimum basic services as a ratio to total expenditure rose from 9.4 per cent in 1993-
94 to 11.4 per cent in 1999-2000. The Central outlay on women and child development
increased by 104.8 per cent in the Tenth Five Year Plan (2002-07) over the Ninth Five Year
Plan, from Rs.6729 crores to Rs.13,780 crores. The Ninth Plan 1997-2002 made two
significant changes in the conceptual strategy for planning for women. Firstly,
“empowerment of women” became one of the nine primary objectives of the Ninth Plan,
and secondly the plan attempted convergence of existing services, resources, infrastructure
and manpower available in both, women – specific and women – related sectors. To this
effect, it directed both the Centre and the States to adopt a special strategy of “Women’s
Component Plan” through which not less than 30 per cent of funds/benefits should be
earmarked in all the women - related sectors. In the Ninth Plan, the Women’s Component
Plan as a percentage of the Gross Budgetary Support (GBS) worked out to be 25.5. In
1986, at the instance of the Prime Minister’s Office (PMO), a special mechanism of
monitoring 27 Beneficiary Oriented Schemes (BOS) for women was put into action. The
same continues to be an effective instrument for monitoring women specific and women
related sectors of health, nutrition, education, labour, rural development, urban development,
science and technology, and women and child development. The Tenth Plan translated
gender commitment into budgetary commitment to ensure that women receive their rightful
share from all women and women – related general development sectors. The Approach
Paper to the Eleventh Plan states that adequate provisions need to be made in policies
and schemes to achieve gender equity. Impediments need to be removed and an enabling
environment provided to achieve just gender goals. Budget allocations for various Ministries,
Departments, schemes and programmes are given in Table 149.
Table 149: Union Budget Plan Outlay for Major Schemes in Social
Sectors, 2006-07 (RE) and 2007-08 (BE)
S. No Ministry/ Department/Schemes Revised Budget 2006-07 Budget Estimates
(Rs. in crores) 2007-08 (Rs. in crores)
Plan Non- Total Plan Non- Total
Plan Plan
1. Ministry of Agriculture
Department of Agriculture and Co-operation
Co-operation
Assistance to National Cooperative Development 52.00 - 52.00 56.00 - 56.00Corporation (NCDC) Programme for CooperativeDevelopment
Projects Schemes for North East Region and 486.00 - 486.00 552.00 - 552.00Sikkim

Statistics on Women in India 2007
327
S. No Ministry/ Department/Schemes Revised Budget 2006-07 Budget Estimates
(Rs. in crores) 2007-08 (Rs. in crores)
Plan Non- Total Plan Non- Total
Plan Plan
2. Ministry of Agro and Rural Industries
Prime Minister’s Rozgar Yojana 227.30 - 227.30 288.00 - 288.00
Khadi and Village Industries Commission 176.25 56.45 232.70 154.60 56.45 211.05
Restructuring of Rural Employment GenerationProgramme 334.48 - 334.48 445.50 - 445.50
Projects Schemes for North East Region and Sikkim 89.50 - 89.50 111.20 - 111.20
Grand Total 894.50 87.63 982.13 1112.00 87.63 1199.63
3. Ministry of Consumer Affairs, Food and
Public Distribution, Deptt. of Food and
Public Distribution
Civil Supplies
Village Grain Banks - - - 15.21 - 15.21
Consumer Industries
Evaluation, Monitoring & Research in Food GrainManagement and Strengthening of PublicDistribution System - - - 24.50 - 24.50
Projects Schemes for North East Region and Sikkim 10.73 - 10.73 12.44 - 12.44
4. Ministry of Health and Family Welfare,
Deptt. of Health
Central Government Health Scheme 36.57 326.50 363.07 36.00 330.00 366.00
Public Health
National AIDS Control Programme 636.67 - 636.67 719.50 - 719.50
National Mental Health Programme 40.00 - 40.00 58.00 - 58.00
National Programme for Deafness 2.50 - 2.50 5.42 - 5.42
Rashtriya Arogya Nidhi - 4.30 4.30 - 5.00 5.00
New Initiatives - - - 12.00 - 12.00
Total Public Health 979.60 131.26 1110.86 1701.85 145.44 1847.29
National Rural Health Mission
National Vector Borne Disease ControlProgramme (Anti-Malaria and Kala Azar) 346.80 6.15 352.95 362.00 6.40 368.40
National TB Control Programme 206.50 - 206.50 249.00 - 249.00
National Leprosy Control Programme 35.41 - 35.41 34.65 - 34.65
National Trachoma and Blindness Control Programme 98.39 - 98.39 126.00 - 126.00
National Iodine Deficiency Control Programme 14.17 - 14.17 24.00 - 24.00
National Drugs De-addiction Programme - - - 10.00 - 10.00
Rural Family Welfare Services (Sub-centres) 982.46 - 982.46 1824.00 - 1824.00
Urban Family Welfare Services 71.63 - 71.63 120.34 - 120.34
Contraception 399.36 - 399.36 350.50 - 350.50
Reproductive and Child Health Project 5.27 - 5.27 195.99 0.01 196.00

Statistics on Women in India 2007
328
S. No Ministry/ Department/Schemes Revised Budget 2006-07 Budget Estimates
(Rs. in crores) 2007-08 (Rs. in crores)
Plan Non- Total Plan Non- Total
Plan Plan
Pulse Polio Immunization 1006.72 - 1006.72 1289.38 - 1289.38
Routine Immunization 266.00 - 266.00 300.50 - 300.50
Information, Education and Communication (IEC) 140.00 2.72 142.72 152.30 3.31 155.61
Projects Schemes for North East Areas and Sikkim 1000.00 - 1000.00 1387.50 - 1387.50
Total National Rural Health Mission 7155.97 34.40 7190.37 9801.00 38.00 9839.00
Grand Total 10000.00 1366.00 11366.00 13875.00 1416.00 15291.00
5. Ministry of Housing and Urban Poverty
Alleviation
Water Supply and Sanitation
Low Cost Sanitation Programme 30.00 - 30.00 40.00 - 40.00
Housing
Other Housing Schemes 4.66 1.43 6.09 7.40 0.64 8.04
Interest Subsidy Schemes for Housing for Urban
Poor (ISSHU) - - - 30.00 - 30.00
Jawahar Lal Nehru National Urban Renewal Mission
(JNNURM) 14.00 - 14.00 14.00 - 14.00
UNDP Assistance for National Strategy for Urban Poor 9.00 - 9.00 5.00 - 5.00
Swarna Jayanti Shahari Rozgar Yojana 250.00 - 250.00 344.00 - 344.00
Valmiki Ambedkar Awas Yojana (VAMVAY) 49.34 - 49.34 - - -
Projects Schemes for North East Region and Sikkim 50.00 - 50.00 50.00 - 50.00
Grand Total 410.00 9.87 419.87 500.00 9.75 509.75
6. Ministry of Human Resource Development,
Deptt. of Elementary Education and Literacy
Strengthening Teachers Training Institutions 162.00 - 162.00 450.00 - 450.00
Mahila Samakhya 26.00 - 26.00 34.00 - 34.00
National Bal Bhawan, New Delhi 5.40 2.94 8.34 6.30 3.00 9.30
District Primary Education Programme ( DPEP) 100.00 - 100.00 80.00 - 80.00
Nutrition Support to Primary Education (MDM) 1898.20 - 1898.20 3191.60 - 3191.60
Sarva Shiksha Abhiyan (SSA) 4314.70 - 4314.70 2767.26 - 2767.26
Sarva Shiksha Abhiyan Amount (tranferred to
Prarambhik Shiksha Kosh (PSK) from education
cess) 8746.00 - 8746.00 10393.00 -10393.00
Total Elementary Education 15367.95 2.94 15370.89 16931.16 3.00 16934.16
Total Adult Education 211.95 2.06 214.01 360.90 2.22 363.12
Deptt. of Secondary and Higher Education
National Council for Educational Research and Training
(NCERT) - - - 36.00 61.95 97.95
Kendriya Vidyalaya Sangathan - - - 270.00 692.30 962.30
Navodaya Vidyalaya Samiti - - - 639.00 173.40 812.40

Statistics on Women in India 2007
329
S. No Ministry/ Department/Schemes Revised Budget 2006-07 Budget Estimates
(Rs. in crores) 2007-08 (Rs. in crores)
Plan Non- Total Plan Non- Total
Plan Plan
Integrated Education for Disabled Children - - - 108.00 - 108.00
Information and Communication Technology in Schools - - - 190.80 - 190.80
National Institute of Open Schooling - - - 6.00 - 6.00
Special Navodaya Vidyalayas - - - 247.48 - 247.48
Total Secondary Education - - - 2847.60 946.00 3793.60
National Merit Scholarship Scheme - - - 108.00 - 108.00
Polytechnics for the Disabled 3.60 - 3.60 3.60 - 3.60
Vocationalization of Education - - - 2.00 - 2.00
Grand Total 17128.00 5.00 17133.00 22191.00 951.22 23142.22
7. Ministry of Labour and Employment
Employees Pension Scheme, 1995 - 840.00 840.00 - 840.00 840.00
Family Pension cum Life Insurance Scheme for Plantation
Workers in Assam, Deposit Link Insurance Scheme for Tea
Plantation Workers in Assam - 13.44 13.44 - 14.80 14.80
Social Security for Unorganised Sector Workers 0.10 - 0.10 5.00 - 5.00
Total Social Security for Labour 0.10 853.44 853.54 5.00 854.80 859.80
Labour Education
Central Board for Workers Education 7.29 19.70 26.99 7.90 24.21 32.11
Rehabilitation of Bonded Labour 1.00 - 1.00 1.80 - 1.80
Improvement in Working Conditions of Child and
Women Labour 121.46 - 121.46 171.06 - 171.06
Total Labour 153.46 1102.90 1256.36 209.90 1230.80 1440.70
Labour and Employment
Welfare of SC, ST and Other Backward Classes 0.79 2.25 3.04 1.00 2.50 3.50
Schemes of North Eastern Areas and Sikkim 23.50 - 23.50 34.50 - 34.50
Grand Total 235.00 1170.00 1405.00 325.48 1308.00 1633.48
8. Ministry of Minority Affairs
Welfare of SC, ST and OBC
Grants-in-Aids to Maulana Azad Education Foundation 100.00 - 100.00 50.00 - 50.00
Coaching and Allied Scheme for Minorities 1.60 - 1.60 9.00 - 9.00
Merit-cum-Means Scholarship for Professional and Tech-
nical Courses at Undergraduate and Post graduate level 10.00 - 10.00 48.60 - 48.60
Pre-Matric Scholarship for Minorities - - - 72.00 - 72.00
Post-Matric Scholarship for Minorities - - - 90.00 - 90.00
Multi Sectoral Development Programme for Minorities in
Selected Minority Concentration Districts - - - 108.00 - 108.00
Grants-in-aid to State Channelising Agencies (SCA)
engaged in implementation of NMDFC programme - - - 9.00 - 9.00
Special Officer for Linguistic Minorities - 1.04 1.04 - 1.43 1.43
National Commission for Religious and Linguistic
Minorities - 1.99 1.99 - 0.19 0.19

Statistics on Women in India 2007
330
S. No Ministry/ Department/Schemes Revised Budget 2006-07 Budget Estimates
(Rs. in crores) 2007-08 (Rs. in crores)
Plan Non- Total Plan Non- Total
Plan Plan
National Commission for Minorities - 3.67 3.67 - 4.40 4.40
Grants-in-aid to Wakf - 2.06 2.06 - 2.90 2.90
Total- Social Security and Welfare 16.47 2.06 18.53 63.00 2.90 65.90
Lumpsum provision for project/schemes for the benefit of
North eastern Region and Sikkim 1.82 - 1.82 45.00 - 45.00
Grand Total 130.89 12.63 143.52 500.00 12.83 512.83
9. Ministry of Panchayati Raj
Other Rural Development Programmes
Panchayat Empowerment Incentive Scheme 10.00 - 10.00 10.00 - 10.00
Rashtriya Gram Swaraj Yojana 45.45 - 45.45 67.90 - 67.90
Contribution to Commonwealth Local Government
Forum under International Co-operation 0.05 - 0.05 0.10 - 0.10
Projects schemes for the benefit of the North Eastern
Region and Sikkim 7.50 - 7.50 10.00 - 10.00
Grand Total 2000.00 0.38 2000.38 4770.00 0.50 4770.50
10. Ministry of Rural Development/ Department of
Rural Development
Swaran Jayanti Gram Swarozgar Yojana 1080.00 - 1080.00 1620.00 - 1620.00
Sampoorna Gramin Rozgar Yojana (SGRY)
a. Cash Component for Food for Work Programme 2700.00 - 2700.00 2340.00 - 2340.00
b. Food Grains Component - - - 180.00 - 180.00
Total Rural Employment 12870.00 - 12870.00 13320.00 - 13320.00
Total Rural Housing 2625.05 - 2625.05 3636.00 - 3636.00
Total Other Rural Development Programmes 344.95 10.26 355.21 324.00 10.45 334.45
Project Schemes for North East Area and Sikkim 2252.56 - 2252.56 2490.00 - 2490.00
Grand Total 24275.62 22.10 24297.72 27500.00 22.86 27522.86
Department of Drinking Water Supply
Accelerated Rural Water Supply Programme 4050.00 0.01 4050.01 5850.00 - 5850.00
Rural Sanitation 720.00 - 720.00 954.00 - 954.00
Project Schemes for North East and Sikkim 530.00 - 530.00 756.00 - 756.00
Total Drinking Water Supply 5300.00 1.63 5301.63 7560.00 1.74 7561.74
11. Ministry of Science and Technology
Department of Science and Technology
Science and Technology Programmes for Socio
Economic Development - - - 95.00 - 95.00
Development Cooperation between India and UNDP
(Vocational Training for Employment Generation) 2.00 5.45 7.45 3.00 - 3.00
Others 20.00 - 20.00 40.00 5.60 45.60
Total Science and Technology 954.00 223.00 1177.00 1526.00 249.00 1775.00

Statistics on Women in India 2007
331
S. No Ministry/ Department/Schemes Revised Budget 2006-07 Budget Estimates
(Rs. in crores) 2007-08 (Rs. in crores)
Plan Non- Total Plan Non- Total
Plan Plan
12. Ministry of Small Scale Industries
Small Scale Industries
Promotion of Small Scale Industries Schemes 236.55 40.75 277.30 - 40.94 40.94
Credit Support Programme - - - 186.80 - 186.80
Promotion and Handholding of Micro and Small
Enterprises - - - 6.75 - 6.75
National Commission on Enterprises in the Unorganised/
Informal Sector 13.44 - 13.44 4.50 - 4.50
Trade Related Entrepreneurs Development for Women
(TREAD) 0.11 - 0.11 - - -
Total Small Scale Industries 466.33 54.89 521.22 530.00 55.41 585.41
13. Ministry of Social Justice and Empowerment
Welfare of SC / ST and Other Backward Classes (OBC)
Special Central Assistance for SC Component Plan 440.12 - 440.12 459.97 - 459.97
Post Matric Scholarship Scheme 475.06 - 475.06 611.00 - 611.00
Girls Hostels 32.00 - 32.00 32.00 - 32.00
Boys Hostels 28.00 - 28.00 33.00 - 33.00
Pre-Matric Scholarship Scheme 16.00 - 16.00 25.00 - 25.00
Assistance to Voluntary Organizations for Welfare of
Scheduled Castes 30.00 - 30.00 33.60 - 33.60
Total Welfare of SC 1158.74 10.87 1169.61 1395.07 9.36 1404.43
Welfare of Backward Classes
Pre-Matric Scholarship Scheme 22.50 - 22.50 22.50 - 22.50
Post Matric Scholarship Scheme 31.49 - 31.49 90.75 - 90.75
Boys and Girls Hostel 18.80 - 18.80 18.50 - 18.50
Total Welfare of Backward Classes 83.29 2.32 85.61 134.75 2.45 137.20
Common Programmes for SC/ST and OBC 6.40 - 6.40 7.00 - 7.00
Total Welfare of SC/ST and OBC 1248.43 13.19 1261.62 1536.82 11.81 1548.63
Welfare of Handicapped
Aids and Appliances for the Handicapped 63.90 - 63.90 62.00 - 62.00
Other Programmes for Handicapped 9.25 2.15 11.40 7.00 2.40 9.40
Total Welfare of Handicapped 194.15 26.22 220.37 191.70 28.25 219.95
Social Welfare
Education Work for Prohibition and Drug Abuse Prevention 19.50 - 19.50 29.60 - 29.60
Assistance to VOs for Old Age Homes 16.00 0.50 16.50 21.00 - 21.00
Total Social Welfare 52.50 4.84 57.34 72.10 4.67 76.77
Total Social Security and Welfare 246.65 31.06 277.71 263.80 32.92 296.72
Project Scheme for North East and Sikkim 69.53 - 69.53 78.38 - 78.38
Grand Total SJE 1686.11 56.71 1742.82 2001.00 58.15 2059.15
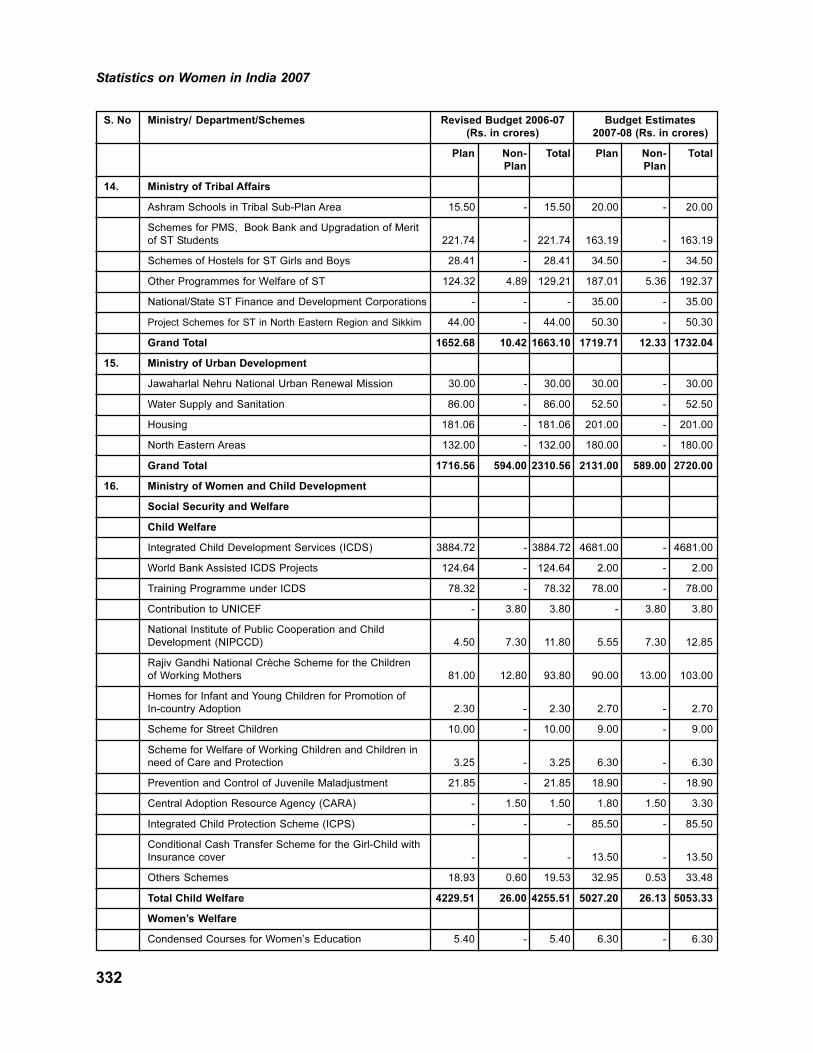
Statistics on Women in India 2007
332
S. No Ministry/ Department/Schemes Revised Budget 2006-07 Budget Estimates
(Rs. in crores) 2007-08 (Rs. in crores)
Plan Non- Total Plan Non- Total
Plan Plan
14. Ministry of Tribal Affairs
Ashram Schools in Tribal Sub-Plan Area 15.50 - 15.50 20.00 - 20.00
Schemes for PMS, Book Bank and Upgradation of Merit
of ST Students 221.74 - 221.74 163.19 - 163.19
Schemes of Hostels for ST Girls and Boys 28.41 - 28.41 34.50 - 34.50
Other Programmes for Welfare of ST 124.32 4.89 129.21 187.01 5.36 192.37
National/State ST Finance and Development Corporations - - - 35.00 - 35.00
Project Schemes for ST in North Eastern Region and Sikkim 44.00 - 44.00 50.30 - 50.30
Grand Total 1652.68 10.42 1663.10 1719.71 12.33 1732.04
15. Ministry of Urban Development
Jawaharlal Nehru National Urban Renewal Mission 30.00 - 30.00 30.00 - 30.00
Water Supply and Sanitation 86.00 - 86.00 52.50 - 52.50
Housing 181.06 - 181.06 201.00 - 201.00
North Eastern Areas 132.00 - 132.00 180.00 - 180.00
Grand Total 1716.56 594.00 2310.56 2131.00 589.00 2720.00
16. Ministry of Women and Child Development
Social Security and Welfare
Child Welfare
Integrated Child Development Services (ICDS) 3884.72 - 3884.72 4681.00 - 4681.00
World Bank Assisted ICDS Projects 124.64 - 124.64 2.00 - 2.00
Training Programme under ICDS 78.32 - 78.32 78.00 - 78.00
Contribution to UNICEF - 3.80 3.80 - 3.80 3.80
National Institute of Public Cooperation and Child
Development (NIPCCD) 4.50 7.30 11.80 5.55 7.30 12.85
Rajiv Gandhi National Crèche Scheme for the Children
of Working Mothers 81.00 12.80 93.80 90.00 13.00 103.00
Homes for Infant and Young Children for Promotion of
In-country Adoption 2.30 - 2.30 2.70 - 2.70
Scheme for Street Children 10.00 - 10.00 9.00 - 9.00
Scheme for Welfare of Working Children and Children in
need of Care and Protection 3.25 - 3.25 6.30 - 6.30
Prevention and Control of Juvenile Maladjustment 21.85 - 21.85 18.90 - 18.90
Central Adoption Resource Agency (CARA) - 1.50 1.50 1.80 1.50 3.30
Integrated Child Protection Scheme (ICPS) - - - 85.50 - 85.50
Conditional Cash Transfer Scheme for the Girl-Child with
Insurance cover - - - 13.50 - 13.50
Others Schemes 18.93 0.60 19.53 32.95 0.53 33.48
Total Child Welfare 4229.51 26.00 4255.51 5027.20 26.13 5053.33
Women’s Welfare
Condensed Courses for Women’s Education 5.40 - 5.40 6.30 - 6.30

Statistics on Women in India 2007
333
S. No Ministry/ Department/Schemes Revised Budget 2006-07 Budget Estimates
(Rs. in crores) 2007-08 (Rs. in crores)
Plan Non- Total Plan Non- Total
Plan Plan
Balika Samridhi Yojana 0.03 - 0.03 - - -
Hostels for Working Women 4.50 - 4.50 13.50 - 13.50
Support to Training and Employment Programme (STEP) 13.50 - 13.50 18.00 - 18.00
Central Social Welfare Board (CSWB) 23.70 11.90 35.60 23.10 12.22 35.32
Swawlamban 1.80 - 1.80 - - -
Short Stay Homes (SSH) 14.40 1.32 15.72 14.40 1.50 15.90
Awareness Generation Programme (AGP) 5.00 - 5.00 5.40 - 5.40
National Commission for Women (NCW) 3.60 2.45 6.05 4.50 2.45 6.95
Swa-Shakti Project 2.00 - 2.00 - - -
Rashtriya Mahila Kosh (RMK) 10.00 - 10.00 12.00 - 12.00
Swayamsiddha 27.00 - 27.00 45.81 - 45.81
Swadhar 7.00 - 7.00 13.50 - 13.50
Scheme for Rescue of Victims of Trafficking 0.45 - 0.45 9.00 - 9.00
Priyadarshini 1.00 - 1.00 10.00 - 10.00
Gender Budgeting - - - 2.70 - 2.70
Other Programmes 0.90 0.20 1.10 0.90 0.20 1.10
Total Women’s Welfare 120.28 15.87 136.15 179.11 16.37 195.48
Total Social Security and Welfare 4349.79 41.87 4391.66 5206.31 42.50 5248.81
Nutrition
National Nutrition Mission (NNM) 0.03 - 0.03 0.09 - 0.09
Other Schemes 5.54 7.10 12.64 6.30 7.50 13.80
Total Nutrition 5.57 7.10 12.67 6.39 7.50 13.89
Project Schemes for North East and Sikkim 483.99 - 483.99 579.30 - 579.30
Grand Total 4839.85 58.59 4898.44 5793.00 60.00 5853.00
Note : 1 crore = 10 million
Source: India, Ministry of Finance. (2007). Expenditure Budget 2007-08: Volume 2: February 2007. New Delhi. P. 11-13, 48, 99-
104, 130, 132-134, 138-140, 148-149, 157, 162, 178, 183, 185, 207-209, 230, 236-237, 245-246.
Several programmes pertaining to children which were earlier under the Ministry of
Social Justice and Empowerment have been brought under the Ministry of Women and
Child Development since 2006 so that the needs of children can be dealt with in a holistic
manner. Budget allocation for the programmes and activities of the Ministry of Women and
Child Development are given in Table 150.

Statistics on Women in India 2007
334
Table 150: Budget, Revised Estimates and Resource Allocation for the
Plans and Programmes of the Ministry of Women and Child
Development, 2007-2008
Name of the Scheme/ Programmes of Ministry Revised Estimates Budget Estimates
of Women and Child Development 2006-2007 2007-2008
Secretariat Social Services 0.50 9.62 10.12 1.00 10.00 11.00
Social Security and Welfare
Child Welfare
Integrated Child Development Services (ICDS) 3884.72 - 3884.72 4681.00 - 4681.00
World Bank Assisted ICDS Projects 124.64 - 124.64 2.00 - 2.00
Training Programme under ICDS 78.32 - 78.32 78.00 - 78.00
Contribution to UNICEF - 3.80 3.80 - 3.80 3.80
National Institute of Public Cooperation and Child
Development (NIPCCD) 4.50 7.30 11.80 5.55 7.30 12.85
Rajiv Gandhi National Crèche Scheme for the Children
of Working Mothers 81.00 12.80 93.80 90.00 13.00 103.00
Homes for Infant and Young Children for promotion
In-country adoption 2.30 - 2.30 2.70 - 2.70
Scheme for Street Children 10.00 - 10.00 9.00 - 9.00
Scheme for Welfare of Working Children and Children
in need of Care and Protection 3.25 - 3.25 6.30 - 6.30
Prevention and control and Juvenile Maladjustment 21.85 - 21.85 18.90 - 18.90
Central Adoption Resource Agency (CARA) - 1.50 1.50 1.80 1.50 3.30
Integrated Child Protection Scheme (ICPS) - - - 85.50 - 85.50
Conditional Cash Transfer Scheme for the Girl-Child
with Insurance cover - - - 13.50 - 13.50
Others Schemes 18.93 0.60 19.53 32.95 0.53 33.48
Total Child Welfare 4229.51 26.00 4255.51 5027.20 26.13 5053.33
Women’s Welfare
Condensed Courses for Women’s Education 5.40 - 5.40 6.30 - 6.30
Balika Samridhi Yojana 0.03 - 0.03 - - -
Hostels for Working Women 4.50 - 4.50 13.50 - 13.50
Support to Training and Employment Programme (STEP) 13.50 - 13.50 18.00 - 18.00
Central Social Welfare Board (CSWB) 23.70 11.90 35.60 23.10 12.22 35.32
Swawlamban 1.80 - 1.80 - - -
Short Stay Homes (SSH) 14.40 1.32 15.72 14.40 1.50 15.90
Awareness Generation Programme (AGP) 5.00 - 5.00 5.40 - 5.40
National Commission for Women (NCW) 3.60 2.45 6.05 4.50 2.45 6.95
Swa-Shakti Project 2.00 - 2.00 - - -
Rashtriya Mahila Kosh (RMK) 10.00 - 10.00 12.00 - 12.00
Swayamsiddha 27.00 - 27.00 45.81 - 45.81
Swadhar 7.00 - 7.00 13.50 - 13.50
Scheme for Rescue of Victims of Trafficking 0.45 - 0.45 9.00 - 9.00
Priyadarshini 1.00 - 1.00 10.00 - 10.00
Gender Budgeting - - - 2.70 - 2.70
Other Programmes 0.90 0.20 1.10 0.90 0.20 1.10
Total Women’s Welfare 120.28 15.87 136.15 179.11 16.37 195.48
Total Social Security and Welfare 4349.79 41.87 4391.66 5206.31 42.50 5248.81
Nutrition
National Nutrition Mission (NNM) 0.03 - 0.03 0.09 - 0.09
Other Schemes 5.54 7.10 12.64 6.30 7.50 13.80
Total Nutrition 5.57 7.10 12.67 6.39 7.50 13.89
Project Schemes for North East and Sikkim 483.99 - 483.99 579.30 - 579.30
Grand Total 4839.85 58.59 4898.44 5793.00 60.00 5853.00
Source: India, Ministry of Finance. (2007). Expenditure Budget 2007-08: Volume 2: February 2007. New Delhi. P. 245-246.

Statistics on Women in India 2007
335
Several programes of the Central Government and State Governments are implemented
in collaboration with voluntary organizations, and NGOs play a very important role in the
development of the country. Being situated at the grass roots level, NGOs are in close
touch with the communities and are instrumental in providing services and bringing about
social change. Voluntary organizations assisted for social development programmes
statewise are given in Table 151.
Table 151: Voluntary Organizations Assisted by Various Government
Ministries, 2005
S. No. India/State/Union Ministry of Ministry of Ministry of Ministry of Ministry of
Territory Rural Human Social Justice Health and Environment
Development Resource and Family and
Development Empowerment Welfare Forests
1. Andhra Pradesh 759 198 436 100 45
2. Arunachal Pradesh 4 8 8 2 0
3. Assam 84 110 45 29 11
4. Bihar 665 111 89 106 139
5. Chhattisgarh 24 5 6 1 7
6. Delhi 194 47 167 76 17
7. Goa 3 0 8 0 0
8. Gujarat 176 75 84 43 20
9. Haryana 99 33 68 8 1
10. Himachal Pradesh 54 18 14 13 3
11. Jammu & Kashmir 20 12 32 10 21
12. Jharkhand 111 30 11 19 34
13. Karnataka 232 107 212 50 20
14. Kerala 222 1 151 31 45
15. Madhya Pradesh 196 164 97 56 41
16. Maharashtra 308 159 201 103 16
17. Manipur 222 28 111 22 0
18. Meghalaya 8 5 12 1 0
19. Mizoram 22 2 21 1 0
20. Nagaland 26 14 13 23 0
21. Orissa 333 285 169 78 2
22. Punjab 6 20 42 2 0
23. Rajasthan 210 59 79 21 17
24. Sikkim 0 3 3 32 0
25. Tamil Nadu 519 162 208 207 22
26. Tripura 8 20 15 0 0
27. Uttar Pradesh 1122 217 391 189 82
28. Uttarakhand 98 11 19 5 20
29. West Bengal 804 131 203 107 84
Union Territories
30. Andaman & Nicobar Islands 2 1 1 4 0
31. Chandigarh 5 12 19 4 0
32. Dadra & Nagar Haveli 0 0 1 0 0
33. Daman & Diu 0 15 0 0 0
34. Lakshadweep 0 0 0 0 0
35. Pondicherry 5 11 8 0 2
India 6541 2074 2944 1343 649
India total (5 Ministries as above) 13,551
India total (All Ministries) 16,166
Note: Last updated on June 2005.
Source: India, Planning Commission. (2005). Voluntary Organisations Assisted by Various Ministries. New Delhi. P1.

Statistics on Women in India 2007
336
Annexure 1
Goals to be achieved by 2010 A.D. set by the National Population
Policy 2000
a) Infant Mortality Rate below 30 per 1000 live births.
b) Maternal Mortality Ratio below 100 per 100,000 live births.
c) Marriage age of girls not earlier than 18 years and preferably after 20 years.
d) 80 per cent institutional deliveries and 100 per cent deliveries attended by trained
persons.
e) Hundred per cent registration of births, deaths, marriage and pregnancies.
f) Universal immunization of children against all preventable diseases.
g) Spread of Acquired Immuno Deficiency Syndrome (AIDS) to be contained.
h) Total fertility rate brought to the replacement levels by 2010.
Source: India, Ministry of Human Resource Development , Department of Women and Child Development.
(2001). Working Group on Empowerment of Women : Tenth Plan 2002-07. New Delhi. P. 74.

Statistics on Women in India 2007
337
Annexure 2
The United Nations Millennium Declaration Goals for Development and
Poverty Eradication till 2015 A.D.
As the world entered the new millennium, heads of state and government gathered at
the United Nations General Assembly to lay out their vision for the United Nations Millennium
Declaration, recognizing their “collective responsibility to uphold the principles of human
dignity, equality and equity at the global level”. Among the many objectives set out by the
declaration are specific, quantified and monitorable goals for development and poverty
eradication by 2015 A.D. These goals are :
� To halve the proportion of the world’s people living on less than $ 1 a day.
� Halve the proportion of people living in extreme poverty.
� Halve the proportion of people suffering from hunger.
� Halve the proportion of people without access to safe water.
� Enrol all children in primary school. Achieve universal completion of primary schooling.
� Empower women and eliminate gender disparities in primary and secondary education.
� Reduce maternal mortality ratios by three-quarters.
� Reduce infant mortality rates by two-thirds.a
� Reduce under-five mortality rates by two-thirds.
� Halt and begin to reverse the spread of HIV/AIDS.
� Provide access for all who want reproductive health services.a
� Implement national strategies for sustainable development by 2005 to reverse the loss
of environmental resources by 2015.a
Note : International development goal.
Source: United Nations Development Programme. (2001). Human Development Report 2001. New York :
Oxford University Press. P. 21-22.

Statistics on Women in India 2007
338
Annexure 3
Definitions
Number of live births during the year
Crude birth rate = ––––––––––––––––––––––––––––––––––––––– x 1000
(CBR) Mid-year population
Number of live births in particular age-group
Age-specific fertility = ––––––––––––––––––––––––––––––––––––––– x 1000
rate (ASFR) Mid-year female population of the same age-group
Number of live births in a year
General fertility rate = ––––––––––––––––––––––––––––––––––––––– x 1000
(GFR) Mid-year female population in the age-group
(15-49) years
45-49
5 x ∑ ASFR
15-19
Total fertility rate = ——————
(TFR) 1000
45-49
5 x ∑ ASFR for female live births
15-19
Gross reproduction = ––––––––––––––––––––––––––
rate (GRR) 1000
Number of live births in a particular age-group
Age-specific marital = ––––––––––––––––––––––––––––––––––––––– x 1000
fertility rate (ASMFR) Mid-year married female population of the
same age-group
Number of live births in a year
General marital = ––––––––––––––––––––––––––––––––––––––– x 1000
fertility rate (GMFR) Mid-year married female population in the
age-group (15-49) years
45-49
5 x ∑ ASMFR
15-19
Total marital fertility rate = ———————————
(TMFR) 1000

Statistics on Women in India 2007
339
Number of deaths during the year
Crude death rate = –––––––––––––––––––––––––––––––––––––– 1000(CDR) Mid-year population
Number of deaths in a particular age-groupAge-specific mortality = ––––––––––––––––––––––––––––––––––– x 1000rate (ASMR) Mid-year population of the same age-group
Number of infant deaths during the yearInfant mortality rate = –––––––––––––––––––––––––––––––––––– x 1000(IMR) Number of live births during the year
Infant mortality rate comprises of two parts viz. Neo-natal mortality rate and Post neo-natal mortality rate. The neo-natal mortality rate also comprises of two parts viz. Early neo-natal mortality rate and Late neo-natal mortality rate. These are defined as :
Number of infant deaths of less than 29 daysduring the year
Neo-natal mortality = –––––––––––––––––––––––––––––––––––– x 1000rate (NMR) Number of live births during the year
Number of infant deaths of less than 7 daysEarly neo-natal during the yearmortality rate = ––––––––––––––––––––––––––––––––––– x 1000
Number of live births during the year
Number of infant deaths of 7 days to less thanLate neo-natal 29 days during the yearmortality rate = ––––––––––––––––––––––––––––––––––– x 1000
Number of live births during the year
Number of deaths of 29 days to less thanone year during the year
Post neo-natal = ––––––––––––––––––––––––––––––––––– x 1000mortality rate (PNMR) Number of live births during the year
Number of still births and infant deaths ofless than 7 days during the year
Peri-natal = ––––––––––––––––––––––––––––––––––– x 1000mortality rate (PMR) Number of live births and still births
during the year
Number of still births during the yearStill birth rate = ––––––––––––––––––––––––––––––––––– x 1000 (SBR) Number of live births and still births
during the year