statutory audit report - slhd.nsw.gov.au
TRANSCRIPT
Sydney South West Area Health ServiceStatutory Audit Report2009-2010

INDEPENDENT AUDITOR'S REPORT
GPO BOX 12 Sydney NSW 2001
Sydney South West Area Health Service and Controlled Entities
To Members of the New South Wales Parliament
Report on the Financial Statements
I have audited the accompanying financial statements of the Sydney South West Area Health Service (the Service), which comprise the statement of financial position as at 30 June 2010, the statement of comprehensive income, statement of changes in equity, statement of cash flows and service group statements for the year then ended, a summary of significant accounting policies and other explanatory notes for both the Service and the consolidated entity. The consolidated entity comprises the Service and the entities it controlled at the year's end or from time to time during the financial year.
Auditor's Opinion
In my opinion, the financial statements:
• present fairly, in all material respects, the financial position of the Service and the consolidated entity as at 30 June 2010, and of their financial performance and their cash flows for the year then ended in accordance with Australian Accounting Standards (including the Australian Accounting Interpretations)
• are in accordance with section 45E of the Public Finance and Audit Act 1983 (the PFftA Act) and the Public Finance and Audit Regulation 2010
My opinion should be read in conjunction with the rest of this report.
Chief Executive's Responsibility for the Financial Statements
The Chief Executive is responsible for the preparation and fair presentation of the financial statements in accordance with Australian Accounting Standards (including the Australian Accounting Interpretations) and the PFftA Act. This responsibility includes establishing and maintaining internal controls relevant to the preparation and fair presentation of the financial statements that are free from material misstatement, whether due to fraud or error; selecting and applying appropriate accounting policies; and making accounting estimates that are reasonable in the circumstances.
Auditor's Responsibility
My responsibility is to express an opm10n on the financial statements based on my audit. I conducted my audit in accordance with Australian Auditing Standards. These Auditing Standards require that I comply with relevant ethical requirements relating to audit engagements and plan and perform the audit to obtain reasonable assurance whether the financial statements are free from material misstatement.

An audit involves performing procedures to obtain audit evidence about the amounts and disclosures in the financial statements. The procedures selected depend on the auditor's judgement, including the assessment of the risks of material misstatement of the financial statements, whether due to fraud or error. In making those risk assessments, the auditor considers internal controls relevant to the Service's preparation and fair presentation of the financial statements in order to design audit procedures that are appropriate in the circumstances, but not for the purpose of expressing an opinion on the effectiveness of the Service's internal controls. An audit also includes evaluating the appropriateness of accounting policies used and the reasonableness of accounting estimates made by the Chief Executive, as well as evaluating the overall presentation of the financial statements.
I believe that the audit evidence I have obtained is sufficient and appropriate to provide a basis for my audit opinion.
My opinion does not provide assurance:
• about the future viability of the Service or consolidated entity,
• that they have carried out their activities effectively, efficiently and economically,
• about the effectiveness of their internal controls, or
• on the assumptions used in formulating the budget figures disclosed in the financial statements.
Independence
In conducting this audit, the Audit Office of New South Wales has complied with the independence requirements of the Australian Auditing Standards and other relevant ethical requirements. The PF&A Act further promotes independence by:
•
•
providing that only Parliament, and not the executive government, can remove an Auditor-General, and
mandating the Auditor-General as auditor of public sector agencies but precluding the provision of non-audit services, thus ensuring the Auditor-General and the Audit Office of New South Wales are not compromised in their role by the possibility of losing clients or income.
A T Whitfield Acting Auditor-General
SYDNEY 4 November 201 0

Certification of Parent/Consolidated Financial Statements for year ended 30 June 2010
The attached financial statements of the Sydney South West Area Health Service for the year ended 30 June 2010:
i. Have been prepared in accordance with the requirements of applicable Australian Accounting Standards (which include Australian Accounting Interpretations) and the Treasurer's Direction, and the requirements of the Public Finance and Audit Act 1983 and Public Finance and Audit Regulations 2010,
ii. Exhibit a true and fair view of the financial position and financial performance of the Sydney South West Area Health Service; and
iii. Have no circumstances which would render any particulars in the financial statements to be misleading or inaccurate.
~ Mike Wallace Chief Executive Sydney South West Area Health Service 3 November 2010
~~ Director of Financial Operations Sydney South West Area Health Service 3 November 201 0

Sydney South West Area Health Service Statement of Comprehensive Income for the year ended 30 June 2010
PARENT CONSOLIDATION
Actual Budget Actual Notes Actual Budget Actual
2010 2010 2009 2010 2010 2009 $000 $000 $000 $000 $000 $000
Expenses excluding losses Operating Expenses
0 0 0 Employee Related 3 1,613,443 1,630,902 1,560,517 1,609,729 1,630,902 1,556,877 Personnel Services 4 0 0 0
92,764 92,861 84,167 Visiting Medical Officers 92,764 92,861 84,167 812,747 832,234 777,978 Other Operating Expenses 5 815,162 832,234 780,158
72,810 76,955 73,032 Depreciation and Amortisation 2(i),6 73,594 76,955 73,539 35,256 27,909 26,921 Grants and Subsidies 7 36,043 27,909 27,162
61 0 286 Finance Costs 8 285 0 286 31,552. __ _1Q~z ___ 27,411 Payments to Affiliated Health Organisations 9 31,552 30,847 27 411
2,654,919 2,691,708 2,546,672 Total Expenses excluding losses 2,662,843 -. ~,?.()!!. ___ -~...§.5:i~40_
Revenue 551,668 537,527 476,975 Sale of Goods and Services 10 551,668 537,527 476,975
12,641 13,645 9,074 Investment Revenue 11 13,628 13,645 9,686 70,919 47,727 70,747 Grants and Contributions 12 57,828 47,727 55,804
--------- 9,15£- 8,557 9,586 Other Revenue 13 ___ 11,396_ .......... ___ 1!.??.1 ______ .__!().!!.!!! _
644,380 607,456 566,382 Total Revenue 634,520 607,456 553,283
(682) 0 (324) Gain/(Loss) on Disposal 14 (718) 0 (324) (5,217) (2,539) (5,537) Other Gains/(Losses) 15 (13,860) (2,539) (5,537)
----------- -~--~-- --------~ -- ------- -----------~
2,016,438 2,086,791 1,986,151 Net Cost of Services 32 21042,901 2,086,791 2,005,818
Government Contributions NSW Department of Health
1,946,275 1,946,275 1,915,968 Recurrent Allocations 2(d) 1,946,275 1,946,275 1,915,968 NSW Department of Hea~h
170,499 167,074 90,021 Capital Allocations 2(d) 170,499 167,074 90,021 Asset Sale Proceeds Transferred to the
0 0 (1,873) NSW Department of Health 0 0 (1,873) Prior Year Asset Sale Proceeds Returned to the
(1,000) 0 0 NSW Department of Health (1,000) 0 0 Acceptance by the Crown Entity of
_____ ()_ ~?,§.§.5 0 Employee Benefits 2(a)(ii) ----~,!1~1 ... _<!M~S. 25,166
__ 2_, 1_!_5_,??~ - _<!,136,914 ---- 2,004, !1.!. Total Government Contributions 2,140,695 2,1~~ -· . . 2,0291282 ..
99,336 50,123 17,965 RESULT FOR THE YEAR 97,794 50,123 23,464
Other Comprehensive Income
Net lncrease/(Decrease) in Property, Plant & Equipment
(26,043) 0 91,165 Asset Revaluation Reserve (26,229) 0 91,689
--·--- .. ------ ------------- ··-·- --------(26,043) 0 91,165 Net Change in the Asset Revaluation (26,229) 0 91,689
Reserve Arising from a Change in the Restoration Liability
------- ·---------- ------------------(26,043) 0 91,165 Other Comprehensive Income (26,229) 0 91,689
for the year TOTAL COMPREHENSIVE INCOME
731293 501123 1091130 FOR THE YEAR 711565 501123 1151153
The accompanying notes form part of these Financial Statements

Sydney South West Area Health Service Statement of Changes In Equity for the Year Ended 30 June 2010
Accumulated Asset Revaluation Available For Total Funds Surplus Sale Reserve
PARENT Notes $000 $000 $000 $000
Balance at 1 July 2009 1,258,700 129,996 373 1,389,069 Result For The Year 99,336 0 0 99,336 Other Comprehensive Income: Net lncrease/(Decrease) in Property, Plant & Equipment 808 (26,478) (373) (26,043)
Total Other Comprehensive Income 808 (26,478) (373) (26,043) Total Comprehensive Income For The Year 100,144 (26,478) (373) 73,293
Transactions With Owners In Their Capacity As Owners 0 0 0 0 Balance at 30 June 2010 1,358,844 103,518 0 1,462,362
Balance at 1 July 2008 1,234,034 40,385 5,520 1,279,939 Result For The Year 17,965 0 0 17,965 Other Comprehensive Income: Net Increase!( Decrease) in Property, Plant & Equipment 6,701 89,611 (5,147) 91,165
Total Other Comprehensive Income 6,701 89,611 (5,147) 91,165 Total Comprehensive Income For The Year 24,666 89,611 (5,147) 109,130
Transactions With Owners In Their Capacity As Owners 0 0 0 0
Balance at 30 June 2009 1,258,700 129,996 373 1!389!069
The accompanying notes form part of these financial statements.
Accumulated Asset Revaluation Available For Total Funds Surplus Sale Reserve
CONSOLIDATION Notes $000 $000 $000
Balance at 1 July 2009 1,282,786 130,882 373 Result For The Year 97,794 0 0 Other Comprehensive Income: Net lncrease/(Decrease) in Property, Plant & Equipment 808 (26,664) (373)
Total Other Comprehensive Income 808 (26,664) (373) Total Comprehensive Income For The Year 98,602 (26,664) (373)
Transactions With Owners In Their Capacity As Owners 0 0 0
Balance at 30 June 2010 1,381,388 104,218 0
Balance at 1 July 2008 1,252,621 40,747 5,520 Result For The Year 23,464 0 0 Other Comprehensive Income: Net lncrease/(Decrease) in Property, Plant & Equipment 6,701 90,135 (5,147)
Total Other Comprehensive Income 6,701 90,135 (5,147) Total Comprehensive Income For The Year 30,165 90,135 (5,147)
Transactions With Owners In Their Capacity As Owners 0 0 0
Balance at 30 June 2009 1,282,786 130,882 373
The accompanying notes form part of these financial statements.
$000
1,414,041 97,794
(26,229)
(26,229) 71,565
0
1,485,606
1,298,888 23,464
91,689
91,689 115,153
0
1,414,041

Sydney South West Area Health Service Statement of Financial Position as at 30 June 2010
PARENT CONSOLIDATION
Actual Budget Actual Notes Actual Budget Actual 2010 2010 2009 2010 2010 2009
$000 $000 $000 $000 $000 $000 ASSETS
Current Assets 191,320 166,087 170,720 Cash and Cash Equivalents 18 205,333 166,087 184,284
43,751 48,586 43,955 Receivables 19 44,160 48,586 45,110
11,943 11,472 11,689 Inventories 20 11,943 11,472 11,689 31,199 37,880 33,575 Financial Assets at Fair Value 21 33,718 37,880 37,880
278,213 26:'$,025 259,939 295,154 264,025 278,963
0 1,765 1,765 Non-Current Assets Held for Sale 24 0 1,765 1,765 ---·---
278~13 265,790 261,704 Total Current Assets 295,154 265,790 280,728
Non-Current Assets 1,530 1,575 1,575 Receivables 19 1,530 1,575 1,575
Property, Plant and Equipment 1,754,182 1,807,550 1,661,031 - Land and Buildings 22 1,762,552 1,807,550 1,669,120
122,441 112797 114,810 - Plant and Equipment 22 123,442 112,797 116,059 1,876,623 1,920,347 1,n5,841 Total Property, Plant and Equipment 1,885,994 1,920,347 1,785,179
537 474 474 Other 2(ab),23 537 474 474
1,878,690 1,922,396 1,7n,890 Total Non-Current Assets 1,888,061 1,922,396 1,787,228
2,156,903 2,188,186 2,039,594 Total Assets 2,183,215 2,188,186 ______ 2,06?,956
LIABILITIES
Current Liabilities 120,643 143,021 135,296 Payables 26 121,354 143,021 136,081
407 203 203 Borrowings 27 407 203 203 538,785 536,696 484,054 Provisions 28 539,275 536,696 484,616
659,835 679,920 619,553 Total Current Liabilities ____ _!61,036 ---679,92_D__~ - __ 620,900
Non-Current Liabilities 304 2,507 454 Borrowings 27 2,116 2,507 2,454
34,402 41,597 30,518 Provisions 28 34,457 41,597 30,561
~------:34~?~ ·---- --- 44,104 30,972 Total Non-Current Liabilities 36,573 44,104 _____ ~,015
694,541 724,024 650,525 Total Liabilities 697,609 724,024 - . 653Jj.1§_
1,462,362 1,464,162 1,389,069 Net Assets 1,485.606 11464.162 11414!041
EQUITY
103,518 50,121 129,996 Reserves 104,218 50,121 130,882 ---- 1,358,8<1!_ -- _1 ,414,04_! __ !,?58,700 Accumulated Funds 1,381,388 1,414,041 1,?.~286 __
1,462,362 1,464,162 1,388,696 1,485,606 1,464,162 1,413,668
Amount Recognised in Equity Relating to 0 0 373 Assets Held for Sale 24 0 0 373 --------
1,462,362 1,464,162 1,389,069 Total Equity 1,485.606 1,464,162 1,414!041
The accompanying notes form part of these Financial Statements

Actual
2010 $000
PARENT
Budget
2010 $000
(1,547,714) (1,541,921) (38,782) (58,756)
(14) 0 (1,001,0613L_ _ _® 3,!i20) -
(2,587 ,SZID__ .. J2,!i.14, 197)
Actual
2009 $000
(1,478,912) (29,613)
(3) (979,574)
(2,488,1~
519,678 12,773
. 146,857
496,345 456,307 13,645 9,244
. - 83,458____ 142,617
1,946,275 1,946,275 1,915,968 .. -~_1§,=24~3~~~ 12,!3!L ___ 2_1,49~
54,248 38,344 57,533
8,779 1,665 11,290 3,411 0 0
(46,433) (55,888) (38,502) (1,035) 0 1,853
_____ 1,63Q_ __ 0 ~
(33,648) (54,223) ~26,001)
0 0 0 0 0 _ ____ill.JO]l_
0 0 (3,907)
20,600 (15,879) 27,625 1_70,720 _____ 181 ,96_6_ ___ _143,095
191,320 166,087 170,720
Sydney South West Area Health Service
Statement of Cash Flows for the year ended 30 June 2010
CASH FLOWS FROM OPERATING ACTIVITIES Payments
Employee Related Grants and Subsidies Finance Costs Other
Total Payments
Receipts Sale of Goods and Services Interest Received Other
Total Receipts
Cash Flows From Government NSW Department of Health Recurrent Allocations NSW Department of Health Capital Allocations
Net Cash Flows From Government
Notes
CONSOLIDATION
Actual
2010 $000
(1,551,518) (48,290)
(14) __ f1.._oo4.077l
(2,603,89~) ..
519,678 13,325
. _161,819
Budget
2010 $000
(1,541,921) (58,756)
0 (913,5291
. - (2_,~14,197)
496,345 13,645 83,45_8
Actual
2009 $000
(1 ,482,393) (29,879)
(3) . - -~8?,1?!;)_
(2,494,430)
456,307 9,855
15! .•. §.~13
_ ___..6.._94.,.,822 -- _____ 5_~,4_._4._8.__~__.6.,1.._7,,7_..6.._0
1,946,275 .. 16,243
1,946,275 12,818
1,915,968 21,499
NET CASH FLOWS FROM OPERATING ACTIVITIES 32====~~~44~1~====~3~8~34~4~====~6~0~7~97~
CASH FLOWS FROM INVESTING ACTIVITIES Proceeds from Sale of Land and Buildings,
Plant and Equipment and Infrastructure Systems Proceeds from Sale of Investments Purchases of Land and Buildings, Plant and Equipment and Infrastructure Systems
Purchases of Investments Other
NET CASH FLOWS FROM INVESTING ACTIVITIES
CASH FLOWS FROM FINANCING ACTIVITIES Proceeds from Borrowings and Advances Repayment of Borrowings and Advances
NET CASH FLOWS FROM FINANCING ACTIVITIES
NET INCREASE I (DECREASE) IN CASH Opening Cash and Cash Equivalents
CLOSING CASH AND CASH EQUIVALENTS
The accompanying notes form part of these Financial Statements
18
8,779 5,399
(47,472) (1,237)
-~s1.:J9
(32,392)
0 __ Q_
0
21,049 184,284
205,333
1,665 11,290 0 3,262
(55,888) (38,985) 0 1,812 0 (95~1
(54,223) (23,580)
0 2,000 . ()___ (3,907)
0 (1,907)
(15,879) 35,310 . 1{!1,966 --- _ _1_4_1l.97_4_
166,087 184,284

SERVICE'S EXPENSES AND Service Group Service Group INCOME 1.1 • 1.2 •
2010 2009 2010 2009
$000 $000 $000 $000
Expenses excluding losses i ' •.•. :·· It
•••• ! .•••...•• ,················•·'''•·• Operating Expenses
Employee Related 113,102 109,392 1,291 1,307
Visiting Medical Officers 2,273 2,062 28 25
Other Operating Expenses 19,748 19,717 272 255
Depreciation and Amortisation 4,077 4,074 52 52
Grants and Subsidies 18,922 18,683 0 0
Finance Costs 0 0 0 0
Payments to Affiliated Health Organisations 9,651 5,434 0 0
Other Expenses 0 0 0 0
Total Expenses excluding losses 167,773 159,362 1,643 1,639
Revenue ·····• :·· ,, ... ·.: . .,.,.
I···· : ,t
Sale of Goods and Services 883 742 0 0
Investment Revenue 1,021 726 5 4
Grants and Contributions 3,188 3,344 0 0
Other Revenue 1153 1095 7 7
Total Revenue 6245 5907 12 11
Gain I (Loss) on Disposal 0 0 0 0
Other Gains I (Losses) 0 0 0 0 Net Cost of Services 161 528 153 455 1 631 1 628
Government Contributions I .······· .
. ,.·· 1'""""<".
RESULT FOR THE YEAR I'·'
Other Comprehensive Income Increase/( Decrease) in Asset Revaluation Reserve (1,681) 5,363 (21) 68
Total Other Comprehensive Income (1,681) 5,363 (21) 68 TOTAL COMPREHENSIVE INCOME
Service Group Statements focus on the key measures of service deHvery performance.
• The name and purpose of each service group is summarised in Note 17.
Service Group 1.3 •
2010 2009
$000 $000
· .... ·.•''···.··· .. ••••••••••
216,201 209,116
14,814 13,441
50,897 49,535
10,480 10,472
0 0
0 0
534 536
0 0
292 926 283100 ...... ,. ..· 9,103 7,847
1,073 762
5,259 5,516
833 791
16268 14 916
0 0
0 0 276 658 268184
.(to .. ···· ...
(4,322) 13,785
(4,322) 13,785
Service Group 2.1 •
2010 2009
$000 $000
, ..... li: ... ··.·····'•········· 112,780 109,080
2,115 1,919
51,551 49,159
5,623 5,618
0 0
0 0
0 0
0 0
172 069 165 776
17,709 15,333
391 278
1,570 1,649
423 401
20 093 17 661
0 0
0 0
151 976 148115 · ....
······'·········
(2,318) 7,396
(2,318) 7,396
Sydney South West Area Health Service Service Group Statements
for the Year Ended 30 June 2010
Service Group Service Group Service Group
2.2 • 2.3 • 3.1 •
2010 2009 2010 2009 2010 2009
$000 $000 $000 $000 $000 $000
.... , . .··'······ .. , ... ····,/'•:· ••
696,544 677,549 101,647 98,312 142,124 133,595
53,729 48,750 9,007 8,173 4,276 3,880
530,240 505,622 92,325 88,045 13,995 13,565
37,037 37,011 4,703 4,699 3,062 3,060
0 0 0 0 8,154 7,828
285 286 0 0 0 0
4,971 4,994 0 0 784 784
0 0 0 0 0 0
1 322 806 1274212 207 682 199,229 172 395 162 712
. t t. .·····••'•'' it' ·.'··
443,792 383,049 60,353 52,203 188 806
4,257 2,789 437 311 2 237
14,922 15,380 1,336 1,400 323 592
1 603 1 226 492 467 31 326
464 574 402 444 62 618 54 381 544 1 961
(718) (324) 0 0 0 0
(5 217 (5 537 0 0 0 0 864 167 877 629 145 064 144 848 171 851 160 751
.. • ·,, I ' . '
(15,275) 48,722 (1,939) 6,186 (1,553) 3,121
(15,275) 48,722 (1,939) 6,186 (1,553) 3,121
The Service Group Statement uses statistical data to 31 December 2009 to allocate the current period's financial information on expenses and revenue to each service group.
No changes have occumed during the period between 1 January 2010 and 30 June 2010 which would materially impact this allocation.
Service Group Service Group Service Group Non Attributable Total .
4.1 • 5.1 • 6.1 •
J
2010 2009 2010 2009 2010 2009 2010 2009 2010 2009
$000 $000 $000 $000 $000 $000 $000 $000 $000 $000
. i t .•i I·······I····,····
· ..• ' t . I .·., •i .• , •• <
< · .. ·•• •
108,746 105,179 27,590 26,656 93,418 90,331 0 0 1,613,443 1,560,517
3,794 3,442 1,058 960 1,670 1,515 0 0 92,764 84,167
40,292 38,570 5,641 5,542 10,201 10,148 0 0 815,162 780,158
5,520 5,516 773 772 2,267 2,265 0 0 73,594 73,539
571 651 0 0 8,396 0 0 0 36,043 27,162
0 0 0 0 0 0 0 0 285 286
15,567 15,617 0 0 45 46 0 0 31,552 27,411
0 0 0 0 0 0 0 0 0 0
174 490 168,975 35,062 33 930 1115,997 104.305 0 0 2 662 843 2 553.240
,) ····•···•··
. ]t . I '· .·· ·' I·········
. ··. ' 16,605 14,365 221 191 2,814 2,439 0 0 551,668 476,975
808 574 566 402 5,068 3,603 0 0 13,628 9,686
5,930 6,219 431 454 24,869 21,250 0 0 57,828 55,804
962 913 2 065 1 960 3 827 3 632 0 0 11396 10 818
24 305 22 071 3 283 3 007 36 578 30924 0 0 634 520 553 283
0 0 0 0 0 0 0 0 (718) (324)
0 0 0 0 (8 643 0 0 0 (13 860 (5 537)
150185 146 904 31 779 30923 88 062 73 381 0 0 2 042 901 2 005 818 • t. · .. ·.
·······'
... , ... ·.·,·>······ 2,140,695 2,029,282 2,140,695 2,029,282
..... ·. ··,······ t
.· ..... ··· 97 794 23 464
(2,276) 7,261 (319) 1,016 (935) 3,181 4,410 (4,410) (26,229) 91,689
(2,276) 7,261 (319) 1,016 (935) 3,181 4,410 (4,410) (26,229) 91,689 71 565 115153

AND Service Group 1.1 •
The name and purpose or each service group is summarise<~ In Note 17
Service Group 1.2 •
Service Group 1.3 •
Service Group 2.1 •
Sydney South West Area Health Service Service Group Statements (Continued)
for the Year Ended 30 June 2010
Service Group 2.2 •
Service Group 2.3 •
Service Group 3.1 •
Service Group 4.1 •
Service Group 5.1 •
Service Group 6.1 •
Non Attributable Total
Assets and liabilities that are specific to service groups are allocated accordingly, e.g. Non-Current Assels Held lor Sale. Remaining assets and liabililies are apportioned to service groups in accordance with lhe methodology advised in Note 2(ac), thereby ensuring that the benefit ol each asset and the liabilities Incurred in the provision or services are duly recognised in each service group.

Sydney South West Area Health Service Notes to and forming part of the Financial Statements
for the Year ended 30 June 201 0
1 The Health Service Reporting Entity
The Sydney South West Area Health Service (SSWAHS) was established under the provisions of the Health Services Act with effect from 1 January 2005.
SSWAHS, as a reporting entity, comprises all the operating activities of the Hospital facilities and the Community Health Centres under its control. It also encompasses the Special Purposes and Trust Funds which, while containing assets which are restricted for specified uses by the grantor or the donor, are nevertheless controlled by SSWAHS. SSWAHS is a not-for-profit entity (as profit is not its principal objective}.
SSWAHS Special Purpose Service Entity was established as a Division of the Government Service on 17 March 2006 in accordance with the Public Sector Employment and Management Act 2002 and the Health Services Act 1997. This Division provides personnel services to enable SSWAHS to exercise its functions.
In accordance with Accounting Standards this Division is regarded as a Special Purpose Entity that must be consolidated with the financial report of SSWAHS. This is because the Division was established to provide personnel services to enable SSWAHS to exercise its functions.
Sydney South West Area Health Service incorporates and manages all the operating activities of the following hospitals, community health services and other facilities under its control:
• Balmain Hospital • Bankstown Hospital • Bowral Hospital • Camden Hospital • Campbelltown Hospital • Canterbury Hospital • Concord Repatriation General Hospital (including Concord Centre for Mental Health) • Department of Forensic Medicine • Fairfield Hospital • Institute of Rheumatology and Orthopaedics • Liverpool Hospital • Population Health • Queen Victoria Memorial Nursing Home • Royal Prince Alfred Hospital • Sydney Dental Hospital • Thomas Walker Hospital • ANZAC Health and Medical Research Foundation • Ingham Health Research Institute (became an independent uncontrolled entity from 1 June 2010)
In addition, the following Affiliated Health Organisations are associated by special arrangements with SSWAHS:
• Central Sydney Scarba Services and South West Sydney Scarba Services • Tresillian Family Care Centre at Belmore • Braeside Hospital, Prairiewood • Carrington Centennial Hospital • Karitane • STARTTS
The financial statements encompasses the activities of the General Fund and the controlled segment of the Special Purposes and Trust Fund. As SSWAHS cannot use the uncontrolled segment of the latter fund to achieve its objectives, the cash balances and activity of that segment are disclosed by way of a note to the financial statements (Note 30). Within the controlled segment of the Special Purposes and Trust Fund there are assets restricted to specific uses by donors but nonetheless controlled by SSWAHS.
The primary objectives of SSWAHS are to protect, promote and maintain the health of Sydney South West residents and to provide state and nationwide health services, research and training.
Principles of Consolidation The financial statements of the controlled entity are prepared for the same reporting period as the parent entity, using consistent accounting policies.
The values in the annual financial statements presented herein consist of SSWAHS (as the parent entity), the financial statements of the Special Purpose Entity Division and the consolidated financial statements of the economic entity. Notes capture both the parent and consolidated values with notes 3, 4, 12, 26, 28 and 32 being especially relevant to the arrangements between SSWAHS and the Division.

Sydney South West Area Health Service Notes to and forming part of the Financial Statements
for the Year ended 30 June 2010
In the process of preparing the consolidated financial statements for the economic entity consisting of the controlling and controlled entities, all inter-entity transactions and balances have been eliminated.
The reporting entity is consolidated as part of the financial statements prepared for both the NSW Department of Health and the NSW Total State Sector Accounts.
The ANZAC Health and Medical Research Foundation is a controlled entity of SSWAHS. The Foundation is incorporated in Australia as a company limited by guarantee under the Corporations Act 2001, and it is an economic entity whose principal activity is research. The beneficial interest held by SSWAHS is 100%.
The Ingham Health Research Institute (IHRI) ceased to be a controlled entity of SSWAHS from 1 June 2010.
These consolidated financial statements for the year ended 30 June 2010 have been authorised for issue by the Chief Executive on 3 November 2010.
2 Summary of Significant Accounting Policies
SSWAHS's financial statements are general purpose financial statements which have been prepared in accordance with the requirements of applicable Australian Accounting Standards (which include Australian Accounting Interpretations} and the Treasurer's Direction, and the requirements of thff'ub/ic Finance and Audit Act 1983 and Public Finance and Audit Regulations 2010.
AASB 101 SSWAHS has applied the revised AASB 101 Presentation of Financial Statements (2007) from 1 July 2009. The revision of this standard now requires SSWAHS to present all non-owner changes to equity ('comprehensive income') in the statement of comprehensive income. SSWAHS has presented the income statement and non-owner changes in equity in one statement of comprehensive income. All owner changes in equity are presented separately in the statement of changes in equity.
Property, plant and equipment, investment property, assets (or disposal groups) held for sale and financial assets at "fair value through profit and loss" and available for sale are measured at fair value. Other financial statement items are prepared in accordance with the historical cost convention.
The consolidated entity has a deficiency of working capital of $365.882 million (2009: $340.172 million). Notwithstanding this deficiency the financial statements have been prepared on a going concern basis because the entity has the support of the New South Wales Department of Health.
All amounts are rounded to the nearest one thousand dollars and are expressed in Australian currency.
Judgments, key assumptions and estimations made by management are disclosed in the relevant notes to the financial statements.
Except when an Australian Accounting Standard permits or requires otherwise, comparative information is disclosed in respect of the previous period for all amounts reported in the financial statements.
No new or revised accounting standards or interpretations are adopted earlier than their prescribed date of application. SSWAHS has considered accounting standards and interpretations issued but not yet effective and determined that these will have no or insignificant impact on SSWAHS.
Other significant accounting policies used in the preparation of these financial statements are as follows:
a) Employee Benefits and Other Provisions
i) Salaries & Wages, Annual Leave, Sick Leave and On-Costs
At the consolidated level of reporting, liabilities for salaries and wages (including non-monetary benefits), annual leave and paid sick leave that are due to be settled within 12 months after the end of the period in which the employees render the service are recognised and measured in respect of employees' services up to the reporting date at undiscounted amounts based on the amounts expected to be paid when the liabilities are settled.
All Annual Leave employee benefits are reported as "Current" as there is an unconditional right to payment. Current liabilities are then further classified as "Short Term" or "Long Term" based on past trends and known resignations and retirements. Anticipated payments to be made in the next twelve months are reported as "Short Term". On-costs of 17% are applied to the value of leave payable at 30 June 2010, such on-costs being consistent with actuarial assessment (Comparable on-costs for 30 June 2009 were also 17%).
Unused non-vesting sick leave does not give rise to a liability as it is not considered probable that sick leave taken in the future will be greater than the benefits accrued in the future.
The outstanding amounts of workers' compensation insurance premiums and fringe benefits tax, which are consequential to employment, are recognised as liabilities and expenses where the employee benefits to which they relate have been recognised.

Sydney South West Area Health Service Notes to and forming part of the Financial Statements
for the Year ended 30 June 2010
ii) Long Service Leave and Superannuation
At the consolidated level of reporting, long service leave entitlements are dissected as "Current" if there is an unconditional right to payment and "Non-Current" if the entitlements are conditional. Current entitlements are further dissected between "Short Term" and "Long Term" on the basis of anticipated payments for the next twelve months. This in turn is based on past trends and known resignations and retirements.
Long service leave provisions are measured on a short hand basis at an escalated rate of 18.3% (9.8% at 30 June 2009) for all employees with five or more years of service. The escalation applied is consistent with actuarial assessment and is affected in the main by the fall in the Commonwealth Government 1 0 year bond yield which is used as the discount rate.
SSWAHS's liability for the closed superannuation pool schemes (State Authorities Superannuation Scheme and State Superannuation Scheme) is assumed by the Crown Entity. SSWAHS accounts for the liability as having been extinguished resulting in the amount assumed being shown as part of the non-monetary revenue item described as "Acceptance by the Crown Entity of Employee Benefits". Any liability attached to Superannuation Guarantee Charge cover is reported in Note 26, "Payables".
The superannuation expense for the financial year is determined by using the formulae specified by the NSW Department of Health. The expense for certain superannuation schemes (ie Basic Benefit and First State Super) is calculated as a percentage of the employees' salary. For other superannuation schemes (ie State Superannuation Scheme and State Authorities Superannuation Scheme), the expense is calculated as a multiple of the employees' superannuation contributions.
iii) Other Provisions
Other provisions exist when: SSWAHS has a present legal or constructive obligation as a result of a past event; it is probable that an outflow of resources will be required to settle the obligation; and a reliable estimate can be made of the amount of the obligation.
b) Insurance
SSWAHS's insurance activities are conducted through the NSW Treasury Managed Fund Scheme of self insurance for Government Agencies. The expense (premium) is determined by the Fund Manager based on past claim experience.
c) Finance Costs
Finance costs are recognised as expenses in the period in which they are incurred, in accordance
with the Department's mandate to not-for-profit general government sector agencies.
d) Income Recognition
Income is measured at the fair value of the consideration or contribution received or receivable. Additional comments regarding the accounting policies for the recognition of revenue are discussed below.
Sale of Goods
Revenue from the sale of goods is recognised as revenue when the agency transfers the significant risks and rewards of ownershiP of the assets.
Rendering of Services
Revenue is recognised when the service is provided.
Patient Fees
Patient Fees are derived from chargeable inpatients and non-inpatients on the basis of rates specified by the NSW Department of Health from time to time.
Investment Revenue
Interest revenue is recognised using the effective interest method as set out ill4ASB139, Financial Instruments: Recognition and Measurement. Rental revenue is recognised in accordance with AASB117 Leases on a straight line basis over the lease term.
Royalty revenue is recognised in accordance with AASB118 on an accrual basis in accordance with the substance of the relevant agreement.

Sydney South West Area Health Service Notes to and forming part of the Financial Statements
for the Year ended 30 June 2010
Debt Forgiveness
Debts are accounted for as extinguished when and only when settlement occurs through repayment or replacement by another liability.
Use of Hospital Facilities
Specialist doctors with rights of private practice are subject to an infrastructure charge for the use of hospital facilities at rates determined by the NSW Department of Health. Charges consist of two components:
a monthly charge raised by SSWAHS based on a percentage of receipts generated.
the residue of the Private Practice Trust Fund at the end of each financial year, such sum being credited for SSWAHS use in the advancement of SSWAHS or individuals within it.
Use of Outside Facilities
SSWAHS uses a number of facilities owned and maintained by the local authorities in the area to deliver community health services for which no charges are raised by the authorities. The cost method of accounting is used for the initial recording of all such services. Cost is determined as the fair value of the services given and is then recognised as revenue with a matching expense.
Grants and Contributions
Grants and Contributions are generally recognised as revenues when SSWAHS obtains control over the assets comprising the contributions. Control over contributions is normally obtained upon the receipt of cash.
NSW Department of Health Allocations
Payments are made by the NSW Department of Health on the basis of the allocation for SSWAHS as adjusted for approved supplementations mostly for salary agreements, patient flows between Health Services and approved enhancement projects. This allocation is included in the Statement of Comprehensive Income before arriving at the "Result for the Year" on the basis that the allocation is earned in return for the health services provided on behalf of the Department. Allocations are normally recognised upon the receipt of Cash.
General operating expenses/revenues of Scarba Services, Tresillian Family Care Centres, Braeside Hospital, Carrington Centennial Hospital, Karitane and STARTTS have only been included in the Statement of Comprehensive Income prepared to the extent of the cash payments made to the Health Organisations concerned. SSWAHS is not deemed to own or control the various assets/liabilities of the aforementioned Health Organisations and such amounts have been excluded from the Statement of Financial Position.
e) Accounting for the Goods & Services Tax (GST)
Income, expenses and assets are recognised net of the amount of GST, except that:
the amount of GST incurred by SSWAHS as a purchaser that is not recoverable from the Australian Taxation Office is recognised as part of the cost of acquisition of an asset or as part of an item of expense and receivables and payables are stated with the amount of GST included.
Cash flows are included in the Statement of Cash Flows on a gross basis. However, the GST components of cash flows arising from investing and financing activities which is recoverable from, or payable to, the Australian Taxation Office are classified as operating cash flows.
Sydney South West Area Health Service Notes to and forming part of the Financial Statements
for the Year ended 30 June 2010
f) Inter Area and Interstate Patient Flows
Inter Area Patient Flows
SSWAHS recognises patient flows for patients they have treated that live outside the Service's regional area. The flows recognised are for acute inpatients (other than Mental Health Services), emergency and rehabilitation and extended care.
Patient flows have been calculated using benchmarks for the cost of services for each of the categories identified and deducting estimated revenue, based on the payment category of the patient. The flow information is based on activity for the last completed calendar year. The NSW Department of Health accepts that category identification for various surgical and medical procedures is impacted by the complexities of the coding process and the interpretation of the coding staff when coding a patient's medical records. The Department reviews the flow information extracted from Health Service records and once it has accepted it, requires each Health Service and the Children's Hospital at Westmead to bring to account the value of patient flows in accordance with the Department's assessment.
The adjustments have no effect on equity values as the movement in Net Cost of Services is matched by a corresponding adjustment to the value of the NSW Department of Health Recurrent Allocation.
Inter State Patient Flows
SSWAHS recognises the outflow of acute inpatients that are treated by other States and Territories within Australia who normally reside in the Service's residential area. SSWAHS also recognises the value of inflows for acute inpatient treatment provided to residents from other States and territories. The expense and revenue values reported within the financial statements have been based on 2008/09 activity data using standard cost weighted separation values to reflect estimated costs in 2009/10 for acute weighted inpatient separations. Where treatment is obtained outside the home health service, the State/Territory providing the service is reimbursed by the benefiting Area.
The reporting adopted for both inter area and interstate patient flows aims to provide a greater accuracy of the cost of service provision to the Area's resident population and disclose the extent to which service is provided to non-residents. The composition of patient flow expense/revenue is disclosed in Notes 5 and 10.
g) Acquisition of Assets
The cost method of accounting is used for the initial recording of all acquisitions of assets controlled by SSWAHS. Cost is the amount of cash or cash equivalents paid or the fair value of the other consideration given to acquire the asset at the time of its acquisition or construction or, where applicable, the amount attributed to that asset when initially recognised in accordance with the specific requirements of other Australian Accounting Standards.
Assets acquired at no cost, or for nominal consideration, are initially recognised as assets and revenues at their fair value at the date of acquisition (See also assets transferred as a result of an equity transfer Note 2(x)).
Fair value is the amount for which an asset could be exchanged between knowledgeable, willing parties in an arm's length transaction.
Where payment for an asset is deferred beyond normal credit terms, its cost is the cash price equivalent, ie the deferred payment amount is effectively discounted at an asset-specific rate.
Land and Buildings which are owned by the Health Administration Corporation or the State and administered by SSWAHS are deemed to be controlled by SSWAHS and are reflected as such in the financial statements.
h) Capitalisation Thresholds
Individual items of property, plant & equipment are capitalised where their cost is $10,000 or above.

Sydney South West Area Health Service Notes to and forming part of the Financial Statements
for the Year ended 30 June 201 0
i) Depreciation of Property, Plant and Equipment
Depreciation is provided for on a straight-line basis for all depreciable assets so as to write off the depreciable amount of each asset as it is consumed over its useful life to the SSWAHS. Land is not a depreciable asset. All material separately identifiable components of assets are depreciated over their shorter useful lives.
Details of depreciation rates initially applied for major asset categories are as follows:
Buildings Electro Medical Equipment - Costing less than $200,000 - Costing more than or equal to $200,000
Computer Equipment Motor Vehicle Sedans Motor Vehicles, Trucks & Vans Office Equipment Plant and Machinery Furniture, Fittings and Furnishings
2.5%- 4.0%
10.0% 12.5% 20.0% 12.5% 20.0% 10.0%- 12.5% 10.0% 10.0%
Depreciation rates are subsequently varied where changes occur in the assessment of the remaining useful life of the assets reported.
j) Revaluation of Non-Current Assets
Physical non-current assets are valued in accordance with the NSW Department of Health's "Valuation of Physical Non-Current Assets at Fair Value" policy. This policy adopts fair value in accordance with AASB116, Property, Plant and Equipment.
Property, plant and equipment is measured on an existing use basis, where there are no feasible alternative uses in the existing natural, legal, financial and socio-political environment. However, in the limited circumstances where there are feasible alternative uses, assets are valued at their highest and best use.
SSWAHS revalues its Land and Buildings at minimum every three years by independent valuation. The last revaluation for assets assumed by SSWAHS as at 1 July 2009 was completed in April2010 and was based on an independent assessment.
Non-specialised assets with short useful lives are measured at depreciated historical cost, as a surrogate for fair value.
When revaluing non-current assets by reference to current prices for assets newer than those being revalued (adjusted to reflect the present condition of the assets), the gross amount and the related accumulated depreciation are separately restated.
For other assets, any balances of accumulated depreciation existing at the revaluation date in respect of those assets are credited to the asset accounts to which they relate. The net asset accounts are then increased or decreased by the revaluation increments or decrements.
Revaluation increments are credited directly to the asset revaluation reserve, except that, to the extent that an increment reverses a revaluation decrement in respect of that class of asset previously recognised as an expense in the Result for the Year, the increment is recognised immediately as revenue in the Result for the Year.
Revaluation decrements are recognised immediately as expenses in the Result for the Year, except that, to the extent that a credit balance exists in the asset revaluation reserve in respect of the same class of assets, they are debited directly to the asset revaluation reserve.
As a not-for-profit entity, revaluation increments and decrements are offset against one another within a class of non-current assets, but not otherwise.
Where an asset that has previously been revalued is disposed of, any balance remaining in the asset revaluation reserve in respect of that asset is transferred to accumulated funds.
k) Impairment of Property, Plant and Equipment
As a not-for-profit entity with no cash generating units, SSWAHS is effectively exempt from AASB 136 Impairment of Assets and impairment testing. This is because AASB136 modifies the recoverable amount test to the higher of fair value less costs to sell and depreciated replacement cost. This means that, for an asset already measured at fair value, impairment can only arise if selling costs are regarded as material. Selling costs are regarded as immaterial.

I) Restoration Costs
Sydney South West Area Health Service Notes to and forming part of the Financial Statements
for the Year ended 30 June 2010
The estimated cost of dismantling and removing an asset and restoring the site is included in the cost of an asset, to the extent it is recognised as a liability.
m) Non-Current Assets (or disposal groups) Held for Sale
SSWAHS has certain non-current assets (or disposal groups) classified as held for sale, where their carrying amount will be recovered principally through a sale transaction, not through continuing use. Non-current assets (or disposal groups) held for sale are recognised at the lower of carrying amount and fair value less costs to sell. These assets are not depreciated while they are classified as held for sale.
n) Transfer of Callan Park Hospital site to Leichardt Council
Given the relocation of health services from the Callan Park site to Concord Hospital an offer has been made to Leichardt Municipal Council for a 99 year lease of 40 of the 60 hectares contained in the Callan Park site. Leichardt Council has commenced a master planning study with the target completion date of December 2012 and public exhibition scheduled for February/March 2011. At this stage no date for transfer of the site has been discussed by the Council or Sydney Harbour Foreshore Authority.
Based on transfer of 40 hectares the potential reduction in the Area's land and buildings approximates $42M, such estimate been updated from last year's estimate of $39.1 M due to the formal revaluation of SWAHS's assets in 2009/10.
o) Maintenance
Day-to-day servicing costs or maintenance are charged as expenses as incurred, except where they relate to the replacement of a part or component of an asset, in which case the costs are capitalised and depreciated.
p) Leased Assets
A distinction is made between finance leases which effectively transfer from the lessor to the lessee substantially all the risks and benefits incidental to ownership of the leased assets, and operating leases under which the lessor effectively retains all such risks and benefits.
Where a non-current asset is acquired by means of a finance lease, the asset is recognised at its fair value at the commencement of the lease term. The corresponding liability is established at the same amount. Lease payments are allocated between the principal component and the interest expense.
SSWAHS has no finance leases. It does however, have a number of operating leases for buildings and office equipment and motor vehicles.
Operating lease payments are charged to the Statement of Comprehensive Income in the periods in which they are incurred.
q) Inventories
Inventories are stated at cost, adjusted when applicable for any loss of service potential. A loss of service potential is identified and measured based on the existence of a current replacement cost that is lower than the carrying amount.
Obsolete items are disposed of in accordance with instructions issued by the NSW Department of Health.
r) Loans and Receivables
Loans and receivables are non-derivative financial assets with fixed or determinable payments that are not quoted in an active market. These financial assets are recognised initially at fair value, usually based on the transaction cost or face value. Subsequent measurement is at amortised cost using the effective interest method, less an allowance for any impairment of receivables. Any changes are recognised in the Result for the Year when impaired, derecognised or through the amortisation process.
Short-term receivables with no stated interest rate are measured at the original invoice amount where the effect of discounting is immaterial.

Sydney South West Area Health Service Notes to and forming part of the Financial Statements
for the Year ended 30 June 2010
s) Investments
Investments are initially recognised at fair value plus, in the case of investments not at fair value through profit or loss, transaction costs. SSWAHS determines the classification of its financial assets after initial recognition and, when allowed and appropriate, re-evaluates this at each financial year end.
*
*
*
Fair value through profit or loss- SSWAHS subsequently measures investments classified as "held for trading" or designated upon initial recognition "at fair value through profit or loss" at fair value. Financial assets are classified as "held for trading" if they are acquired for the purpose of selling in the near term. Derivatives are also classified as held for trading. Gains or losses on these assets are recognised in the Result for the Year.
The Hour-Glass Investment facilities are designated at fair value through profit or loss using the second leg of the fair value option i.e. these financial assets are managed and their performance is evaluated on a fair value basis, in accordance with a documented risk management strategy, and information about these assets is provided internally on that basis to the agency's key management personnel.
The risk management strategy of SSWAHS has been developed consistent with the investment powers granted under the provision of the Public Authorities (Financial Arrangements) Act. T Corp investments are made in an effort to improve interest returns on cash balances otherwise available whilst also providing secure investments guaranteed by the State market exposures.
The movement in the fair value of the Hour-Glass Investment facilities incorporates distributions received as well as unrealised movements in fair value and is reported in the line item 'investment revenue'.
Held-to-maturity investments- Non-derivative financial assets with fixed or determinable payments and fixed maturity that SSWAHS has the positive intention and ability to hold to maturity are classified as "held-to-maturity". These investments are measured at amortised cost using the effective interest method. Changes are recognised in the Result for the Year when impaired, derecognised or through the amortisation process.
Available-for-sale investments- Any residual investments that do not fall into any other category are accounted for as available-for-sale investments and measured at fair value in other comprehensive income until disposed or impaired, at which time the cumulative gain or loss previously recognised in other comprehensive income is recognised in the Result for the Year. However, interest calculated using the effective interest method and dividends are recognised in the Result for the Year.
Purchases or sales of investments under contract that require delivery of the asset within the timeframe established by convention or regulation are recognised on the trade date; i.e. the date the Health Service· commits to purchase or sell the asset.
The fair value of investments that are traded at fair value in an active market is determined by reference to quoted current bid prices at the close of business on the Statement of Financial Position date.
t) Impairment of financial assets
All financial assets, except those measured at fair value through profit and loss, are subject to an annual review for impairment. An allowance for impairment is established when there is objective evidence that the entity will not be able to collect all amounts due.
For financial assets carried at amortised cost, the amount of the allowance is the difference between the asset's carrying amount and the present value of estimated future cash flows, discounted at the effective interest rate. The amount of the impairment loss is recognised in the Result for the Year.
When an available for sale financial asset is impaired, the amount of the cumulative loss is removed from equity and recognised in the Result for the Year, based on the difference between the acquisition cost (net of any principal repayment and amortisation) and current fair value, less any impairment loss previously recognised in the Result for the Year.
Any reversals of impairment losses are reversed through the Result for the Year, where there is objective evidence, except reversals of impairment losses on an investment in an equity instrument classified as "available for sale" must be made through the reserve. Reversals of impairment losses of financial assets carried at amortised cost cannot result in a carrying amount that exceeds what the carrying amount would have been had there not been an impairment loss.

Sydney South West Area Health Service Notes to and forming part of the Financial Statements
for the Year ended 30 June 2010
u) De-recognition of financial assets and financial liabilities
A financial asset is derecognised when the contractual rights to the cash flows from the financial assets expire; or if SSWAHS transfers the financial asset:
• where substantially all the risks and rewards have been transferred; or • where SSWAHS has not transferred substantially all the risks and rewards, if the
entity has not retained control.
Where SSWAHS has neither transferred nor retained substantially all the risks and rewards or transferred control, the asset is recognised to the extent of SSWAHS's continuing involvement in the asset.
A financial liability is derecognised when the obligation specified in the contract is discharged or cancelled or expires.
v) Payables
These amounts represent liabilities for goods and services provided to SSWAHS and other amounts. Payables are recognised initially at fair value, usually based on the transaction cost or face value. Subsequent measurement is at amortised cost using the effective interest method. Short-term payables with no stated interest rate are measured at the original invoice amount where the effect of discounting is immaterial.
Payables are recognised for amounts to be paid in the future for goods and services received, whether or not billed to SSWAHS.
w) Borrowings
Loans are not held for trading or designated at fair value through profit or loss and are recognised at amortised cost using the effective interest rate method. Gains or losses are recognised in the Result for the Year on derecognition.
The finance lease liability is determined in accordance with AASB 117, Leases.
x) Equity Transfers
The transfer of net assets between agencies as a result of an administrative restructure, transfers of programs/functions and parts thereof between NSW public sector agencies is designated or required by Accounting Standards to be treated as contributions by owners and is recognised as an adjustment to "Accumulated Funds". This treatment is consistent with AASB1004,Contributions and Australian Interpretation 1038 Contributions by Owners Made to Wholly-Owned Public Sector Entities
Transfers arising from an administrative restructure involving not-for-profit entities and for-profit government departments are recognised at the amount at which the asset was recognised by the transferor immediately prior to the restructure. Subject to below, in most instances this will approximate fair value.
All other equity transfers are recognised at fair value, except for intangibles. Where an intangible has been recognised at (amortised) cost by the transferor because there is no active market, the agency recognises the asset at the transferor's carrying amount. Where the transferor is prohibited from recognising internally generated intangibles, the agency does not recognise that asset.
y) Equity and Reserves
(i) Asset Revaluation Reserve
The asset revaluation reserve is used to record increments and decrements on the revaluation of non-current assets. This accords with SSWAHS's policy on the revaluation of property, plant and equipment as discussed in Note 20).
(ii) Accumulated Funds The category "accumulated funds" includes all current and prior period retained funds.
(iii) Separate Reserves
Separate reserve accounts are recognised in the financial statements only if such accounts are required by specific legislation or Australian Accounting Standards.

z) Trust Funds
Sydney South West Area Health Service Notes to and forming part of the Financial Statements
for the Year ended 30 June 2010
SSWAHS receives monies in a trustee capacity for various trusts as set out in Note 30. As SSWAHS performs only a custodial role in respect of these monies, and because the monies cannot be used for the achievement of SSWAHS's own objectives, they are not brought to account in the financial statements.
aa) Budgeted Amounts
The budgeted amounts are drawn from the budgets agreed with the NSW Health Department at the beginning of the financial reporting period and with any adjustments for the effects of additional supplementation provided.
ab) Emerging Asset
SSWAHS's emerging interest in the Bowral Private Medical Imaging has been valued in accordance with the Department of Health's policy for Accounting for Privately Financed Projects This policy required SSWAHS to initially determine the estimated written down replacement cost by reference to the project's historical cost escalated by a construction index and the system's estimated working life. The estimated written down replacement cost was then allocated on a systematic basis over the concession period of 15 years using the annuity method and the Government Bond rate of 9.15% at commencement of the concession period.
ac) Service Group Statements Allocation Methodology
Expenses and revenues are assigned to service groups in accordance with statistical data for the 6 months ended 31 December 2009 which is then applied to the current period's financial information. The same methodology is applied to attribute assets and liabilities to each service group.
In respect of assets and liabilities the Department requires that all Health Services take action to identify those components that can be specifically identified and reported by service groups. Remaining values are attributed to service groups in accordance with values advised by the NSW Department of Health, e.g. depreciation/amortisation charges form the basis of apportioning the values for Intangibles and Prooertv. Plant & Eouioment.

PARENT
2010 $000
0 0 0 0 0 0 0
0
1,202,221 58,325 24,921
108,664 62,830
132,604 20,164
1,609,729
2009 $000
0 0 0 0 0 0 0
0
1,159,938 60,632 25,166
104,506 45,843
138,905 21,887
1,556,877
Sydney South West Area Health Service Notes to and forming part of the Financial Statements
for the Year ended 30 June 2010
CONSOLIDATION
3. Employee Related
Employee related expenses comprise the following:
Salaries and Wages Awards Superannuation [see note 2(a)]- Defined Benefit Plans Superannuation [see note 2(a)]- Defined Contribution Plans Long Service Leave [see note 2(a)] Annual Leave [see note 2(a)] Workers' Compensation Insurance
The following additional information is provided:
2010 $000
1,205,637 58,325 24,921
108,664 62,828
132,904 20,164
1,613,443
Maintenance staff costs included in Employee Related Expenses totals $11.991 million Note 5 further refers.
4. Personnel Services
Personnel Services comprise the purchase of the following:
Salaries and Wages Awards Superannuation [see note 2(a)] - Defined Benefit Plans Superannuation [see note 2(a)] - Defined Contribution Plans Long Service Leave [see note 2(a)] Annual Leave [see note 2(a)] Workers' Compensation Insurance
0 0 0 0 0 0 0
0
2009 $000
1,163,172 60,632 25,166
104,520 45,913
139,227 21,887
1,560,517
0 0 0 0 0 0 0
0

Sydney South West Area Health Service Notes to and forming part of the Financial Statements
for the Year ended 30 June 2010
PARENT CONSOLIDATION
2010 2009 2010 2009 $000 $000 $000 $000
5. Other Operating Expenses
245.604 244,202 Allocations towards Inter Area Patient Outflows, NSW (see (c) below) 245,604 244,202
26,251 20,135 Blood and Blood Products 26,251 20,135
32,616 29,956 Domestic Supplies and Services 32,637 29,974
119,493 109,233 Drug Supplies 119,503 109,233
16,604 16,868 Food Supplies 16,621 16,884
28,315 22,588 Fuel, Light and Power 28,315 22,588
33,595 36,693 General Expenses (See (a) below) 34,054 37,179
4,878 5,539 Hospital Ambulance Transport Costs 4,878 5,539
16,163 11,615 Information Management Expenses 16,178 11,616
3,633 1,754 Insurance 3,647 1,756
3,634 5,337 Interstate Patient Outflows (see (d) below) 3,634 5,337 Maintenance (See (b) below)
17,745 15,283 Maintenance Contracts 17,749 15,283 5,776 6,304 New/Replacement Equipment under $10,000 5,992 6,495
2,703 3,782 Repairs 2,704 3,784
30,574 33,306 Maintenance/Non Contract 30,603 33,330
2,065 2,546 Capital Works< $10,000 2,065 2,546 155,609 142,316 Medical and Surgical Supplies 155,916 142,537
5,998 6,360 Postal and Telephone Costs 6,006 6,364
9,351 9,090 Printing and Stationery 9,398 9,145 159 214 Rates and Charges 159 214
2,572 2,682 Rental 2,572 2,682 37,461 39,811 Special Service Departments 38,515 40,796
2,876 3,154 Staff Related Costs 2,914 3,199 694 848 Aircraft Expenses (Ambulance) 694 848
8,378 -~~ Travel Related Costs ---- 8,55~ ______ _1l,j92
812,747 n7,978 815,162 780,158
(a) General Expenses include:-215 455 Advertising 233 462
1,395 1,437 Books, Magazines and Journals 1,408 1,448 621 532 Courier and Freight 647 546 366 376 Auditor's Remuneration - Audit of Financial Statements 383 406
0 0 Auditor's Remuneration - Other Services 0 0 1,469 1,635 Legal Services 1,471 1,639
720 777 Membership/Professional Fees 738 786 6,218 6,960 Motor Vehicle Operating Lease Expense - Minimum Lease Payments 6,226 6,967 6,525 5,770 Other Operating Lease Expense - Minimum Lease Payments 6,525 5,770
18 77 Payroll Services 18 77 527 259 Quality Assurance/Accreditation 527 264
1,361 1,330 Security Services 1,361 1,330 468 883 Translator Services 468 883
3,944 3,043 Motor Vehicle registration and fuel 3,948 3,045 4,737 5,120 Contract Services 4,799 5,196
~1 .. ---~~9 Other 5,302 .~.360
33,595 36,693 34,054 37,179
(b) Reconciliation Total Maintenance Maintenance Expense - Contracted Labour and Other (non employee
58,863 61,221 related), included in Note 5 59,113 61,438 Employee related/Personnel Services maintenance expense included
11,991 ---~ in Notes 3 and 4 ~~--1_1 .~~l 11,841
70,854 73,062 Total maintenance expenses included in Notes 3, 4 and 5 71,104 73,279
(c) Details of allocations applied to Inter Area Patient Outflows, NSW on an Area basis as accepted by the NSW Department of Health are as follows ($000):
South East lllawarra: $131,063 ($129,001) Sydney West: $46,158 ($46,663) Northern Sydney Central Coast: $14,692 ($14,628) Hunter New England: $1,322 ($1 ,513) North Coast: $782 ($771) Greater Southern: $823 ($599) Greater Western: $490 ($464) Children's Hospital Westmead: $50,274 ($50,563)
(d) Expenses for Interstate Patient Flows are as follows ($000):
ACT: $325 ($1,351) OLD: $1,161 ($1,528) SA: $353 ($167) VIC: $553 ($2,133) TAS: $397 (-$28) NT: $344 ($93) WA: $501 ($93)
Sydney South West Area Health Service Notes to and forming part of the Financial Statements
for the Year ended 30 June 2010
PARENT CONSOLIDATION
2010 2009 2010 2009 $000 $000 $000 $000
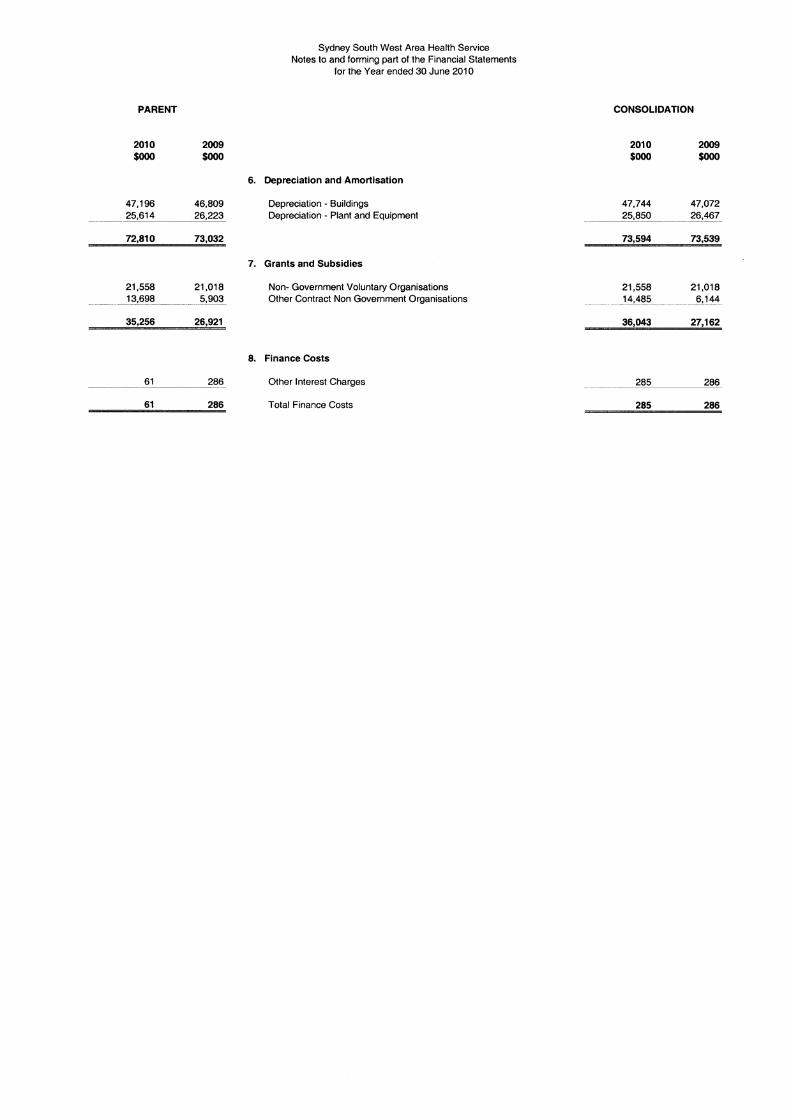
6. Depreciation and Amortisation
47,196 46,809 Depreciation - Buildings 47,744 47,072 25,614 26,223 Depreciation - Plant and Equipment 25,850 26,467
72,810 73,032 73,594 73,539
7. Grants and Subsidies
21,558 21,018 Non- Government Voluntary Organisations 21,558 21,018 13,698 5,903 Other Contract Non Government Organisations 14,485 - 6,144
35,256 26,921 36,043 27,162
a. Finance Costs
61 286 Other Interest Charges 285 286
61 286 Total Finance Costs 285 286

PARENT
2010 $000
6,145 970
2,201 4,241 4,224
13,771
31,552
10,387 1,735
135,468 469
44,113 29,598
260,884 5,996 4,777 3,085 1,492
342 18 46
1 92
7,103 982
43,460 1,620
551,668
2009 $000
6,173 1,012 2,068 4,199
0 13,959
27,411
9,856 1,636
120,612 488
39,319 23,738
253,269 6,118 4,612 2,934 1,782
293 19 46
5 128
7,295 913
0 3,912
476,975
Sydney South West Area Health Service Notes to and forming part of the Financial Statements
for the Year ended 30 June 2010
9. Payments to Affiliated Health Organisations
10.
Recurrent Sourced Tresillian Family Care Centre at Belmore Central Sydney Scarba Service and South West Sydney Scarba Services Carrington Centennial Hospital Karitane STARTTS Braeside Hospital, Prairiewood
Sale of Goods and Services
(a) Sale of Goods comprise the following:-
Sale of Prosthesis Pharmacy Sales
(b) Rendering of Services comprise the following:-
Patient Fees [see note 2(d)J Staff-Meals and Accommodation Infrastructure Fees - Monthly Facility Charge [see note 2(d)J
- Annual Charge •• Allocation from Inter Area Patient Inflows, NSW [see note (c) below] Cafeteria/Kiosk Car Parking Child Care Fees Clinical Services (excluding Clinical Drug Trials) Fees for Medical Records Information Retrieval Linen Service Revenues - Non Health Services Linen Service Revenues - Other Health Services PADP Patient Copayments Patient Inflows from Interstate (see note (d) below) Salary Packaging Fee
• High Cost Drug Revenue Other
CONSOLIDATION
2010 $000
6,145 970
2,201 4,241 4,224
13,771
31,552
10,387 1,735
135,468 469
44,113 29,598
260,884 5,996 4,777 3,085 1,492
342 18 46
1 92
7,103 982
43,460 1,620
551,668
2009 $000
6,173 1,012 2,068 4,199
0 _:13,959
27,411
9,856 1,636
120,612 488
39,319 23,738
253,269 6,118 4,612 2,934 1,782
293 19 46
5 128
7,295 913
0 3,912
476,975
• The Commonwealth Highly Specialised Drug program was varied from 1 July 2009. The State now claims on a recovery basis the cost of highly specialised drugs through Medicare (Commonwealth). In previous years these funds were received within annual Government Allocation from the NSW Department of Health.
(c) Details of allocations received for Inter Area Patient Flows, NSW on an Area basis as accepted by the NSW Department of Health are as follows ($000):
South East lllawarra: $68,007 ($67,795) Sydney West: $72,846 ($69,496) Northern Sydney Central Coast: $50,676 ($50,274) Hunter New England: $12,484 ($11 ,911) North Coast: $8,253 ($7,531) Greater Southern: $14,021 ($12,677) Greater Western: $34,597 ($33,585).
(d) Revenues from Patient Inflows from Interstate are as follows ($000):
ACT: $2,332 ($2,665) QLD: $1,797 ($1,342) SA: $90 ($411) VIC: $2,054 ($1,523) TAS: $429 ($326) NT: -$89 ($574) WA: $490 ($454)
•• The annual infrastructure charge revenue represent Trust Fund Income that is to be used for staff specialist's conference and study purposes and cannot be used for normal hospital operating purposes.
PARENT
2010 $000
7,541
3,045 1,988
67
2009 $000
3,684
3,278 2,079
33
12,641 9,074
5,424 5,019 9,400 9,524
10,684 8,936 8,040 6,274 5,577 5,844
24,921 25,166 3,940 5,295
106 119 -~2~,8~2_7 ____ 4,570
70,919 70,747
449 608 373 737
1,749 1,650 71 79 10 28 46 123
3,782 3,953 . 2,67_2 ___ 2.40_!3_
9,152 9,586
78,245 16,180 76,004 ----'1-='5,c::.O=c59=-
2,241 727
(1 ,514)
1,121 782
(339)
2,750 14,014 -3,582 _____ 14,0~-
832
(682)
(5,217) 0
(5,217)
15
(324)
(5,537) 0
(5,537)
Sydney South West Area Health Service Notes to and forming part of the Financial Statements
for the Year ended 30 June 2010
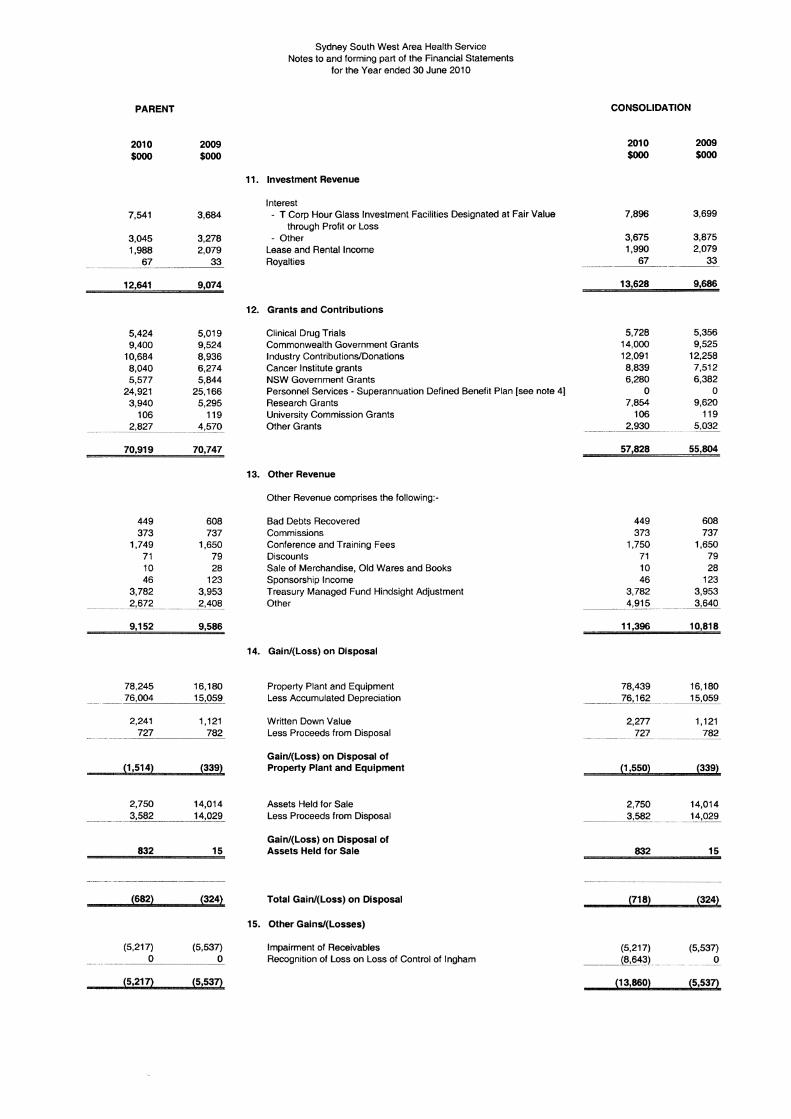
11. Investment Revenue
Interest - T Corp Hour Glass Investment Facilities Designated at Fair Value
through Profit or Loss - Other
Lease and Rental Income Royalties
12. Grants and Contributions
Clinical Drug Trials Commonwealth Government Grants Industry Contributions/Donations Cancer Institute grants NSW Government Grants Personnel Services - Superannuation Defined Benefit Plan [see note 4) Research Grants University Commission Grants Other Grants
13. Other Revenue
Other Revenue comprises the following:-
Bad Debts Recovered Commissions Conference and Training Fees Discounts Sale of Merchandise, Old Wares and Books Sponsorship Income Treasury Managed Fund Hindsight Adjustment Other
14. Gain/(Loss) on Disposal
Property Plant and Equipment Less Accumulated Depreciation
Written Down Value Less Proceeds from Disposal
Gain/(Loss) on Disposal of Property Plant and Equipment
Assets Held for Sale Less Proceeds from Disposal
Gain/(Loss) on Disposal of Assets Held for Sale
Total Gain/(Loss) on Disposal
15. Other Gains/(Losses)
Impairment of Receivables Recognition of Loss on Loss of Control of Ingham
CONSOLIDATION
2010 $000
7,896
3,675 1,990
67
13,628
5,728 14,000 12,091 8,839 6,280
0 7,854
106 2,930
57,828
449 373
1,750 71 10 46
3,782 4,~1_?_
11,396
78,439 - _____ Z_6_._1g_ -
2,277 727
-·-----
(1 ,550)
2,750 3,582
832
(718)
(5,217) -- (8,643)
(13,860)
2009 $000
3,699
3,875 2,079
33
9,686
5,356 9,525
12,258 7,512 6,382
0 9,620
119 5,032
55,804
608 737
1,650 79 28
123 3,953
__ 3,640
10,818
16,180 _15,059
1,121 782
(339)
14,014 . 14,029
15
(324)
(5,537) 0
(5,537)

Sydney South West Area Health SeNice Notes to and forming part of the Financial Statements
for the Year ended 30 June 2010
16. Conditions on Contributions
PARENT
Contributions recognised as revenues during the current reporting period for which expenditure in the manner specified had not occurred as at balance date
Contributions recognised in amalgamated balance as at 30 June 2009 which were not expended in the current reporting period
Total amount of unexpended contributions as at balance date
Comment on restricted assets appears in Note 25
CONSOLIDATION
Contributions recognised as revenues during the current reporting period for which expenditure in the manner specified had not occurred as at balance date
Contributions recognised in amalgamated balance as at 30 June 2009 which were not expended in the current reporting period
Total amount of unexpended contributions as at balance date
Comment on restricted assets appears in Note 25
Purchase of Assets
$000
4,590
6,580
11 '170
Purchase of Assets
$000
4,590
15,376
Health Promotion, Education and
Research $000
17,398
43,041
60,439
Health Promotion, Education and
Research $000
24,672
44,489
---~-------------
19,966 69,161
Other Total
$000 $000
47,180 69,168
90,019 139,640
137,199 208,808
Other Total
$000 $000
50,045 79,307
92,879 152,744
---------------
142,924 232,051

Sydney South West Area Health Service Notes to and forming part of the Financial Statements
for the Year ended 30 June 2010
17 Service Groups of the Health Service
Service Group 1.1 Primary and Community Based Services
Service Description: This service group covers the provision of health services to persons attending community health centres or in the home. including health promotion activities, community based women's health, dental, drug and alcohol and
Objective:
HI VI AIDS services. It also covers the provision of grants to non-Government organisations for community health purposes.
This service group contributes to making prevention everybody's business and strengthening primary health and continuing care in the community by working towards a range of intermediate results that include the following: • improved access to early intervention, assessment, therapy and treatment services for claims in a home or community setting • reduced rate of avoidable hospital admissions for conditions identified in the State Plan that can be appropriately treated in the community and • reduced rate of hospitalisation from fall-related injury for people aged 65 years and over.
Service Group 1.2 Aboriginal Health Services
Service Description: This service group covers the provision of supplementary health services to Aboriginal people, particularly in the areas of health promotion, health education and disease prevention. (Note: This Service Group excludes most services for Aboriginal people provided directly by Area Health Services and other general health services which are used by all members of the community).
Objective: This service group contributes to ensuring a fair and sustainable health system by working towards a range of intermediate results that include the following: • the building of regional partnerships for the provision of health services • raising the health status of Aboriginal people and • promoting a healthy lifestyle.
Service Group 1.3 Outpatient Services
Service Description: This service group covers the provision of services provided in outpatient clinics including low level emergency care, diagnostic and pharmacy services and radiotherapy treatment.
Objective: This service group contributes to creating better experiences for people using health services and ensuring a fair and sustainable health system by working towards a range of intermediate results including improving, maintaining or restoring the health of ambulant patients in a hospital setting through diagnosis, therapy, education and treatment services.
Service Group 2.1 Emergency Services
Service Description: This service group covers the provision of emergency ambulance services and treatment of patients in designated emergency departments of public hospitals.
Objective: This service group contributes to creating better experiences for people using the health system by working towards a range of intermediate results including reduced risk of premature death or disability by providing timely emergency diagnostic treatment and transport services.
Service Group 2.2 Overnight Acute Inpatient Services
Service Description: This service group covers the provision of health care to patients admitted to public hospitals with the intention that their stay will be overnight, including elective surgery and maternity services.
Objective: This service group contributes to creating better experiences for people using the health system by working towards a range of intermediate results that include the following: • timely treatment of booked surgical patients, resulting in improved clinical outcomes, quality of life and patient satisfaction and • reduced rate of unplanned and unexpected hospital readmissions.

Sydney South West Area Health Service Notes to and forming part of the Financial Statements
for the Year ended 30 June 2010
Service Group 2.3 Same Day Acute Inpatient Services
Service Description: This service group covers the provision of health care to patients who are admitted to public hospitals with the intention that they will be admitted, treated and discharged on the same day.
Objective: This service group contributes to creating better experiences for people using the health system by working towards a range of intermediate results that include the following: • timely treatment of booked surgical patients resulting in improved clinical outcomes, quality of life and patient satisfaction and • reduced rate of unplanned and unexpected hospital readmissions.
Service Group 3.1 Mental Health Services
Service Description: This service group covers the provision of an integrated and comprehensive network of services by Area Health Services and community based organisations for people seriously affected by mental illness and mental health problems. It also includes the development of preventative programs which meet the needs of specific client groups.
Objective: This service group contributes to strengthening primary health and continuing care in the community by working towards a range of intermediate results that include the following: • improving the health, wellbeing and social functioning of people with disabling mental disorders and • reducing the incidence of suicide, mental health problems and mental disorders in the community.
Service Group 4.1 Rehabilitation and Extended Care Services
Service Description: This service group covers the provision of appropriate health care services for persons with long-term physical and psycho-physical disabilities and for the frail-aged. It also includes the coordination of the Department's services for the aged and disabled, with those provided by other agencies and individuals.
Objective: This service group contributes to strengthening primary health and continuing care in the community and creating better experiences for people using the health system by working towards a range of intermediate results including improving or maintaining the wellbeing and independent functioning of people with disabilities or chronic conditions, the frail and terminally ill.
Service Group 5.1 Population Health Services
Service Description: This service group covers the provision of health services targeted at broad population groups including environmental health protection, food and poisons regulation and monitoring of communicable diseases.
Objective: This service group contributes to making prevention everybody's business by working towards a range of intermediate results that include the following: • reduced incidence of preventable disease and disability and • improved access to opportunities and prerequisites for good health.
Service Group 6.1 Teaching and Research
Service Description: This service group covers the provision of professional training for the needs of the New South Wales health system. It also includes strategic investment in research and development to improve the health and wellbeing of the people of New South Wales.
Objective: This service group contributes to ensuring a fair and sustainable health system by working towards a range of intermediate results that include the following: • developing the skills and knowledge of the health workforce to support patient care and population health and • ex1ending knowledge through scientific enquiry and applied research aimed at improving the health and wellbeing of the people of New South Wales.

PARENT
2010 $000
2009 $000
80,569 63,934 __ -'._11~0:_c,7:_:5:_:1_~ .. _1.Q?...J86
191,320 170,720
191,320 170,720
25,525 22,225 1,606 1,672 1,779 4,088
644 6,114 167 234
11,974 9,454 0 879
9,908 7,867 2,057 838
53,660 53,371
(7,321) (7,183) (2,600) (2,295}
43,739 43,893
12 62 ~-~-----~---~--~ ~-"··-------
43,751
(7,183) 4,552
(4,690}
(7,321)
(2,295) 222
(2,600)
43,955
(7,622) 5,474
(5,035}
(7,183)
(1,838) 45
(2,295)
Sydney South West Area Health Service Notes to and forming part of the Financial Statements
for the Year ended 30 June 2010
18. Cash and Cash Equivalents
Cash at Bank and On Hand TCorp- Cash Facility and Bank Term Deposits
CONSOLIDATION
2010 $000
2009 $000
80,486 63,936 __ _g4,84Z___ __ _1 20,348
205,333 184,284
Cash & cash equivalent assets recognised in the Statement of Financial Position are reconciled at the end of the financial year to the Statement of Cash Flows as follows:
Cash and Cash Equivalents (per Statement of Financial Position)
Closing Cash and Cash Equivalents (per Statement of Cash Flows)
Refer to Note 37 for details regarding credit risk, liquidity risk and market risk arising from financial instruments.
19. Receivables
Current
(a) Sale of Goods and Services Prostheses Intra Area charges NSW Health Department Workers Compensation Sundry Debtors Leave Mobility Goods and Services Tax Other Debtors
Sub Total
Less Allowance for Impairment - Patient Fees Allowance tor Impairment - Others
SubTotal
Prepayments
(b) Movement in the Allowance for Impairment Sale of Goods & Services
Balance at 1 July Amounts written off during the year (lncrease)/decrease in Allowance Recognised in
Result for the Year
Balance at 30 June
(c) Movement in the Allowance for Impairment Sundry Debtors
Balance at 1 July Amounts written off during the year (lncrease)/decrease in Allowance Recognised in
Result for the Year
Balance at 30 June
205,333 184,284
25,525 22,225 1,606 1,672 1,779 4,088
644 6,114 167 234
12,209 9,977 0 879
10,039 8,011 2,100 1,327
54,069 54,527
(7,321) (7, 183) (2,600) (2,295)
44,148 45,049
12 61 ·------~
44,160
(7,183) 4,552
j~"6_90)
(7,321)
(2,295) 222
(2,600)
45,110
(7,622) 5,474
... -~(~.Q.~~
(7,183)
(1,838) 45
(2,295)

PARENT
2010 $000
7,780 6,230
11,515
25,525
1,530
1,530
8,537 2,475
801 93 37 -------
11,943
--- 3_!. l!l!l ..
31,199
2009 $000
7,066 5,062
10,097
22,225
1,575
8,422 2,221
883 126 37
11,689
33,575
33,575
Sydney South West Area Health Service Notes to and forming part of the Financial Statements
for the Year ended 30 June 2010
19. Receivables (Continued)
(d) Sale of Goods and Services Receivables includes: Patient Fees - Compensable Patient Fees - Ineligible Patient Fees · Other
Details regarding credit risk, liquidity risk and market risk, including financial assets that are either past due or impaired are disclosed in Note 37.
Non-Current Prepayments
20. Inventories
Current - Held for Distribution Drugs Medical and Surgical Supplies Food and Hotel Supplies Engineering Supplies Other including Goods in Transit
21. Financial Assets at Fair Value
Current Treasury Corporation · Hour-Glass Facility
Refer to Note 37 for further information regarding credit risk, liquidity risk and market risk arising from financial investments.
CONSOLIDATION
2010 $000
2009 $000
7,780 7,066 6,230 5,062
_____ _____1_!2!L .. -~2
25,525 22,225
----~~-1 .~~0 ____ ---~~12_7§
1,530 1,575
8,537 8,422 2,475 2,221
801 883 93 126 37 37
-··--~
11,943 11,689
-~----'3'-'3"--', 7-'1-"'8~- . 3_'7,880
33,718 37,880

22. Property, Plant and Equipment
PARENT
2010 2009 $000 $000
2,709,989 2,639,194
_ 95?,807 __ __ _Jl78,1_~ _
1,754,182 1,661,031
424,877 467,636
3()?~- 352,826
122,441 114,810
1,876,623 1,775,841
Sydney South West Area Health Service Notes to and forming part of the Financial Statements
for the Year ended 30 June 2010
Land and Buildings- Fair Value Gross Carrying Amount Less Accumulated Depreciation and Impairment
Net Carrying Amount
Plant and Equipment- Fair Value Gross Carrying Amount Less Accumulated Depreciation and Impairment
Net Carrying Amount
Total Property, Plant and Equipment At Net Carrying Amount
22. Property, Plant and Equipment- Reconciliation
(a) PARENT Land Buildings Work in
Progress
$000 $000 $000
2010 Net Carrying Amount at Start of Year 316,670 1,199,908 152,380 Additions 79 184,844 Recognition of Assets Held for Sale (550) (435) Disposals Net Revaluation Increment Less
Revaluation Decrements Recognised in Reserves 24,869 (50,912)
Depreciation Expense (47,196) Reclassifications 18,006 (38,8651 Net Carrying Amount at End of Year 340,989 1,119,450 298,359
Land Buildings Work in Progress
$000 $000 $000
2009 Net Carrying Amount at Start of Year 341,294 1,127,222 63,894 Additions 550 1,380 97,662 Recognition of Assets Held for Sale (2,846) (450) 0 Disposals 0 0 0 Net Revaluation Increment Less
Revaluation Decrements Recognised in Reserves (22,328) 113,493 0
Depreciation Expense 0 (46,809) 0 Reclassifications 0 5,072 {9,176 Net Carrying Amount at End of Year 316,670 1,199,908 152,380
CONSOLIDATION
2010 $000
2,721,472
958,920
1,762,552
427,212
2009 $000
2,649,954
__ _c9c=_80_,!334
1,669,120
470,156
-- ----~03,77() ____ -~5j,_()_!l~
123,442 116,059
1,885,994 1,785,179
Plant and Total Equipment
$000 $000
106,883 1,775,841 17,938 202,861
(985) (2,241) (2,241)
(26,043) (25,614) (72,810)
20,859 0 117,825 1,876,623
Plant and Total Equipment
$000 $000
114,317 1,646,727 15,806 115,398
0 (3,296) (1,121) (1,121)
0 91,165 {26,223) (73,032)
4,104 0 106,883 1,775,841

(b) CONSOLIDATION
2010 Net Carrying Amount at Start of Year Additions Recognition of Assets Held for Sale Disposals Net Revaluation Increment Less
Revaluation Decrements Recognised in Reserves
Depreciation Expense Reclassifications Net Carrving Amount at End of Year
2009 Net Carrying Amount at Start of Year Additions Recognition of Assets Held for Sale Disposals Net Revaluation Increment Less
Revaluation Decrements Recognised in Reserves
Depreciation Expense Reclassifications Net Carrving Amount at End of Year
Sydney South West Area Health Service Notes to and forming part of the Financial Statements
for the Year ended 30 June 2010
Land Buildings Work in Progress
$000 $000 $000
316,670 1,207,998 152,380 1,093 184,844
(550) (435)
24,869 (51 ,098) (47,743}
18,006 (38,865) 340,989 1,127,821 298,359
Land Buildings Work in Progress
$000 $000 $000
341,294 1,131,710 63,894 550 4,721 97,662
(2,846) (450) 0 0 0 0
(22,328) 114,017 0 0 (47,072) 0 0 5,072 _(_9,176
316,670 1,207,998 152,380
Plant and Equipment
$000
108,131 17,963
(2,277)
(25,851) 20,859
118,825
Plant and Equipment
$000
115,696 15,919
0 (1 '121)
0 (26,467)
4,104 108,131
(i) Land and Buildings include land owned by the Health Administration Corporation and administered by SSWAHS [see note 2(g)].
Total
$000
1,785,179 203,900
(985) (2,277)
0
(26,229) (73,594}
0 1,885,994
Total
$000
1,652,594 118,852 (3,296) (1,121)
91,689 (73,539)
0 1,785,179
(ii) The SSWAHS's Land and Buildings were valued by Corporeal Property Valuers (Registered Property Valuers and Consultants) on 1 July 2009 [see note 2 G)]. Corporeal Property Valuers is not an employee of the SSWAHS.
(iii) In accordance with the fair value requirements of AASB 116, land and buildings have had a factor applied in relation to the movement in the market and variation in the building and infrastructure costs. The adjustment has been performed on a gross basis in accordance with note 2G). This factor gives consideration to the valuation of Physical Non-Current Assets at Fair value. The following table details the indice applied to Non Current Assets as determined by the Department of Lands:
Year Land Buildings 08/09 rl ---=_:::7::;%:;__--,--=~12::'7:':'o "'-----,
(iv) The value of Work in Progress $298.359 million at30 June 2010 is represented by $293.742 million for Building and $4.617 million for Plant and Equipment (for 2008/09 year, the corresponding Work in Progress value of $152.380 million is represented by $144.453 for Building and $7.927 million for Plant and Equipment).
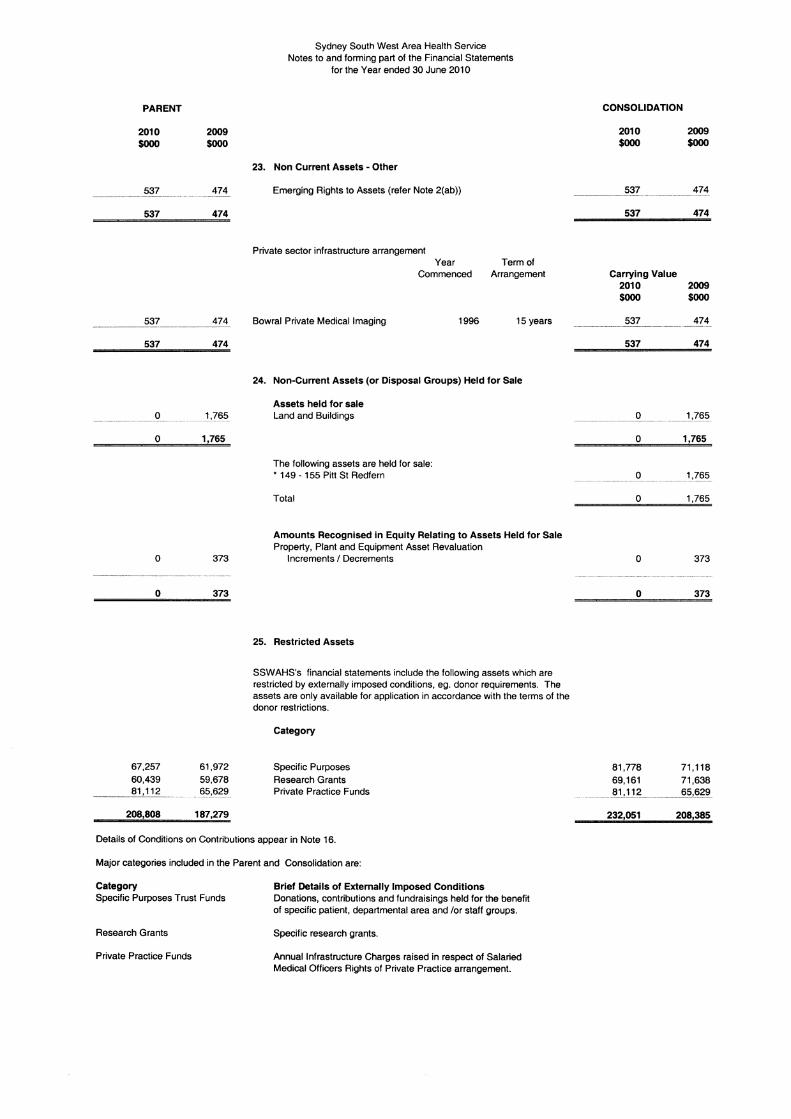
PARENT
2010 $000
537
537
537
537
0
0
0
0
67,257 60,439 81,112
208,808
2009 $000
474
474
474
474
1,765
1,765
373
373
61,972 59,678
~~&2_!l_
187,279
Sydney South West Area Health Service Notes to and forming part of the Financial Statements
for the Year ended 30 June 2010
23. Non Current Assets - Other
Emerging Rights to Assets (refer Note 2(ab))
Private sector infrastructure arrangement
Bowral Private Medical Imaging
Year Commenced
1996
Term of Arrangement
15 years
24. Non-Current Assets (or Disposal Groups) Held for Sale
Assets held for sale Land and Buildings
The following assets are held for sale: • 149 - 155 Pitt St Redfern
Total
Amounts Recognised in Equity Relating to Assets Held for Sale Property, Plant and Equipment Asset Revaluation
Increments I Decrements
25. Restricted Assets
SSWAHS's financial statements include the following assets which are restricted by externally imposed conditions, eg. donor requirements. The assets are only available for application in accordance with the terms of the donor restrictions.
Category
Specific Purposes Research Grants Private Practice Funds
Details of Conditions on Contributions appear in Note 16.
Major categories included in the Parent and Consolidation are:
Category Specific Purposes Trust Funds
Research Grants
Private Practice Funds
Brief Details of Externally Imposed Conditions Donations, contributions and fundraisings held for the benefit of specific patient, departmental area and /or staff groups.
Specific research grants.
Annual Infrastructure Charges raised in respect of Salaried Medical Officers Rights of Private Practice arrangement.
CONSOLIDATION
2010 $000
537
537
Carrying Value 2010 $000
2009 $000
474
474
2009 $000
___ ____:::53:::_7:__ 474
537 474
0 1,765
0 1,765
0 1,765
0 373
0 373
81,778 69,161 81,112
232,051
71,118 71,638 65,629
208,385

PARENT
2010 $000
0 10,042 26,683 43,915
5,745 1,367 8,089 2,923
17,096 4,783
120,643
PARENT
2010 $000
407
407
304
304
407 304
711
2009 $000
0 10,436 44,470 41,207
4,665 0
9,629 5,415
13,755 5,719
135,296
2009 $000
203
203
454 0
454
203 454
657
Sydney South West Area Health Service Notes to and forming part of the Financial Statements
for the Year ended 30 June 2010
26. Payables
Current Accrued Salaries, Wages and On-Costs Taxation and Payroll Deductions Accrued Uability - Purchase of Personnel Services Creditors GST Creditors Creditors Intra Health Sundry Creditors Accrual Leave Mobility Accrual Visiting Medical Officer Other Creditors - Capital Works
26a. Payables Parent Division
Accrued Salaries and Wages 0 26,683 Accrued Liability - Purchase of Personnel Services 26,683 (26,683)
26,683
Details regarding credit risk, liquidity risk and market risk, including a maturity analysis of the above payables are disclosed in Note 37.
27. Borrowings
Current Loan from NSW Health
Non-current Loan from NSW Health Other Loans and Deposits
Loans still to be extinguished represent monies to be repaid to the NSW Health Department. Final repayment is scheduled for June 2013.
Repayment of Borrowings
Not later than one year Between one and five years
Total Borrowings at face value
Details regarding credit risk, liquidity risk and market risk, including a maturity analysis of the above payables are disclosed in Note 37.
0
CONSOLIDATION
2010 $000
26,799 10,042
0 43,915
6,093 1,367 8,335 2,924
17,096 4,783
121,354
Other Controlled
Entities
116 0
116
2009 $000
44,594 10,436
0 41,207
4,964 0
9,991 5,415
13,755 5,719
136,081
Consolidation
26,799 0
26,799
CONSOLIDATION
2010 $000
407
407
304 1,812
2,116
407 2,116
2,523
2009 $000
203
203
454 2,000
2,454
203 2,454
2,657

PARENT
2010 $000
0 0 0 0
538,785
538,785
0 34,402
34,402
2009 $000
0 0 0 0
484,054
484,054
0 30,518
30,518
538,785 484,054 34,402 30,518
0 0 26,683 44,470
______ _!Q~--- 10,436
609,912 569,478
Sydney South West Area Health Service Notes to and forming part of the Financial Statements
for the Year ended 30 June 2010
28. Provisions
Current Employee Benefits and Related On-Costs Annual Leave- Short Term Benefit Annual Leave- Long Term Benefit Long Service Leave- Short Term Benefit Long Service Leave- Long Term Benefit Provision for Personnel Services Liability
Total Current Provisions
Amount expected to be settled no more than 12 months alter the reporting period
Amount expected to be settled more than 12 months alter the reporting period
Non-Current Employee Benefits and Related On-Costs Long Service Leave - Conditional Provision for Personnel Services Liability
Total Non-Current Provisions
Aggregate Employee Benefits and Related On-costs Provisions - Current Provisions - Non-Current Accrued Salaries, Wages and On-Costs (Note 26) Accrued Liability- Purchase of Personnel Services (Note 26) Taxation and Payroll Deductions
2010 $000
CONSOLIDATION
2010 $000
142,441 119,404 27,308
250,122 0
539,275
169,749
369,526
539,275
34,457 0
34,457
539,275 34,457 26,799
0 10,Q42
610,573
2009 $000
139,976 105,868 24,289
214,483 0
484,616
164,265
320,351
484,616
30,561 0
---~--
30,561
484,616 30,561 44,594
0 10,436
570,207
28a. Provisions Parent Division Other Consolidation Controlled
Entities Current Employee Benefits and Related On-Costs Employee Annual Leave -Short Term Benefit 0 142,048 393 142,441 Employee Annual Leave - Long Term Benefit 0 119,404 0 119,404 Employee Long Service Leave - Short Term Benefit 0 27,292 16 27,308 Employee Long Service Leave • Long Term Benefit 0 250,Q41 81 250,122 Provision for Personnel Services Liability 538,785 0 0 0
Total Current Provisions 538,785 538,785 490 539,275
Non Current Employee Benefits and Related On-Costs Employee Long Service Leave - Conditional 0 34,402 55 34,457 Provision for Personnel Services Liability 34,402 0 0 0
Total Non Current Provisions 34,402 34,402 55 34!457

Sydney South West Area Health Service Notes to and forming part of the Financial Statements
for the Year ended 30 June 2010
PARENT CONSOLIDATION
2010 $000
89,988 24,769
114,757
18,760
14,261 36,581
2009 $000
175,648 165,776
341,424
29. Commitments for Expenditure
(a) Capital Commitments Aggregate capital expenditure for the acquisition of land and buildings, plant and equipment, contracted for at balance date and not provided for:
Not later than one year Later than one year and not later than five years
Total Capital Expenditure Commitments (Including GST)
Of the commitments reported at 30 June 201 0 it is expected that $0.947 million will be met from locally generated moneys.
2010 $000
89,988 24,769
114,757
2009 $000
175,648 165,776
341,424
The Capital commitments above include commitments to the value of $113.810 million that are managed by the Health Infrastructure division of the Health Administration Corporation. Health Infrastructure are funded to manage all major capital projects greater than $10 million on behalf of Health Services. The commitments have been included above as they relate to work in progress that has been recognised with the Health Service's property, plant and equipment.
0
0
(b) Other Expenditure Commitments - Purchase of Goods & Services
Not later than one year
Total Other Expenditure Commitments (Including GST)
(c) Operating Lease Commitments Commitments in relation to non cancellable operating leases are payable as follows:
Not later than one year
18,760 0
18,760 0
14,261 12,246 36,581 37,584
- 6,738 ..
12,246 37,584
7!_5g'!_ Later than one year and not later than five years Later than five years --~-6238 _____ 72504
57,580 57,334 Total Operating Lease Commitments (Including GST)
The operating lease commitments above are for property, motor vehicles, information technology, equipment including personal computers, medical equipment and other equipment
(d) Contingent Asset related to Commitments for Expenditure
The total of "Commitments for Expenditure' above i.e. $191.097 million as at 30 June 2010 includes input tax credits of $17.372 million that are expected to be recoverable from the Australian Taxation Office.
57,580 57,334

PARENT AND CONSOLIDATION
30. Trust Funds
Sydney South West Area Health Service Notes to and forming part of the Financial Statements
for the Year ended 30 June 2010
SSWAHS holds trust fund moneys of $25.079 million which are used for the safe keeping of patients' monies, deposits on hired items of equipment and Private Practice Trusts. These monies are excluded from the financial statements as SSWAHS cannot use them for the achievement of its objectives. The following is a summary of the transactions in the trust account:
Patient Trust Refundable Private Practice Total
Deposits Trust Funds
2010 2009 2010 2009 2010 2009 2010 2009 $000 $000 $000 $000 $000 $000 $000 $000
Cash Balance at the beginning of the financial reporting period 127 144 5,398 5,014 16,917 15,713 22,442 20,871
Receipts 319 63 1,508 1,256 116,091 101,859 117,918 103,178
Expenditure (342) (80) (2,803) (872) (112,136) (100,655) (115,281) (101,607)
Cash Balance at the end of the financial reporting period 104 127 4,103 5,398 20,872 16,917 25,079 22,442
PARENT AND CONSOLIDATION
31. Contingent Liabilities
a) Claims on Managed Fund
Since 1 July 1989, SSWAHS has been a member of the NSW Treasury Managed Fund. The Fund will pay to or on behalf of SSWAHS all sums which it shall become legally liable to pay by way of compensation or legal liability if sued except for employment related, discrimination and harassment claims that do not have statewide implications. The costs relating to such exceptions are to be absorbed by SSWAHS. As such, since 1 July 1989, apart from the exceptions noted above no contingent liabilities exist in respect of liability claims against SSWAHS. A Solvency Fund (now called Pre-Managed Fund Reserve) was established to deal with the insurance matters incurred before 1 July 1989 that were above the limit of insurance held or for matters that were incurred prior to 1 July 1989 that would have become verdicts against the State. That Solvency Fund will likewise respond to all claims against the SSWAHS.
b) Workers Compensation Hindsight Adjustment
Treasury Managed Fund normally calculates hindsight premiums each year. However, in regard to workers compensation the final hindsight adjustment for the 2003/04 fund year and an interim adjustment for the 2005/06 fund year were not calculated until 2009/1 0. As a result, the 2004/05 final and 2006/07 interim hindsight calculations will be paid in 2010111.
It is not possible for SSWAHS to reliably quantify the benefit to be received.
c) Affiliated Health Organisations
Based on the definition of control in Australian Accounting Standard AASB 127, Consolidated and Separate Financial Statements, Affiliated Health Organisations listed in Schedule 3 of the Health Services Act, 1997 are only recognised in SSWAHS's consolidated financial statements to the extent of cash payments made (Note 2(d)).
However, it is accepted that a contingent liability exists which may be realised in the event of cessation of health service activities by any Affiliated Health Organisation. In this event the determination of assets and liabilities would be dependent on any contractual relationship which may exist or be formulated between the administering bodies of the organisation, SSWAHS and the NSW Department of Health.
d) Contingent Liability I Debtor
The lessee of certain property controlled by SSWAHS had made a claim against SSWAHS in relation to an agreement and lease for a proposed private hospital and car park. The private hospital and car park was to be constructed and operated by the lessee who only subsequently constructed a car park. The lessor, SSWAHS, terminated the lease in 2000. The lessee was seeking reinstatement to the land and in the alternative compensation and damages in respect of the SSWAHS's termination of the lease. SSWAHS sought some damages in a cross claim. The Supreme Court's judgment in favour of SSWAHS on both the lessee's claim and the cross claim was handed down in 200812009 in relation to the proceedings. The lessee's appeal against the Supreme Court's judgment was heard in 2010 and a decision is anticipated to be handed down prior to the end of 2010. Costs were awarded against the lessee on the Supreme Court proceedings on an indemnity basis on 7 October 2010.

PARENT
2010 2009 $000 $000
54,248 57,533 (72,810) (73,032)
(444) (16) 0 0
(58,614) (54,681) 7,639 (691)
15,743 22,527 (682) (324)
(1 ,946,275) (1 ,915,968) (16,243) (21,499)
1,000 0
--~~-~------- .-~---
(2,016,438~ (1 ,986,151 ~
32.
Sydney South West Area Health Service Notes to and forming part of the Financial Statements
for the Year ended 30 June 2010
CONSOLIDATION
2010 2009 $000 $000
Reconciliation of Net Cash Flows from Operating Activities to Net Cost Of Services
Net Cash Flows from Operating Activities Depreciation Allowance for Impairment Acceptance by the Crown Entity of Employee Superannuation Benefits Decrease/(lncrease) in Provisions Increase I (Decrease) in Prepayments and Other Assets (Increase)/ Decrease in Creditors Net Gain! (Loss) on Sale of Property, Plant and Equipment NSW Health Department Recurrent Allocations NSW Health Department Capital Allocations Prior Year Asset Sale Proceeds Returned to the NSW
Department of Health
Net Cost of Services
53,441 (73,594)
(444) (24,921) (58,555)
7,372 16,036
(718) (1 ,946,275)
(16,243)
1,000
(2,042,901)
60,797 (73,539)
(16) (25,166) (54,842)
2,305 22,434
(324) (1,915,968)
(21,499)
0
(2,005,818)
33. Non-Cash Financing and Investing Activities
Capital Works Liverpool Hospital Redevelopment $151.246 M (paid by Health Infrastructure}
Donation in Kind - Railway Bridge Works at Liverpool Hospital $3.643M
34. 2009/10 Voluntary Services
It is considered impracticable to quantify the monetary value of voluntary services provided to SSWAHS. Services provided include:
Voluntary Services Providers: Nature of Services: • Chaplaincies and Pastoral Care - Patient & Family Support • Pink Ladies - Patient Services, Fund Raising • Patient Support Groups - Practical Support to Patients and Relative • Community Organisations - Counselling, Health Education, Transport, Home Help & Patient Activities
PARENT AND CONSOLIDATION
35. Unclaimed Moneys
Unclaimed salaries and wages are paid to the credit of the NSW Treasury in accordance with the provisions of the Industrial Relations Act, 1996.
All money and personal effects of patients which are left in the custody of SSWAHS by any patient who is discharged or dies in the hospital and which are not claimed by the person lawfully entitled thereto within a period of twelve months are recognised as the property of SSWAHS.
All such money and the proceeds of the realisation of any personal effects are lodged to the credit of the Samaritan Fund which is used specifically for the benefit of necessitous patients or necessitous outgoing patients.

Sydney South West Area Health Service Notes to and forming part of the Financial Statements
for the Year ended 30 June 2010
36. Budget Review- Parent and Consolidation
The actual Net Cost of Services was $43.9 million lower than the budget. Expenditure was $28.8 million lower than budget target (mainly in the Salaries and Wages, Other Operating Expenses}. Revenue was $27.1 million favourable. The revenue favourability was mainly from Sale of Goods & Services ($14.1 million above target} and Grants & Contributions ($1 0.1 million above target}.
Result of the year was $47.7 million (in surplus) favourable. The favourability was mainly due to the favourable result in both expenditure and revenue.
Total Assets were $5 million less than budget target with $34.3 million unfavourable in Non Current Assets and offset by $29.4 million favourability in Current Assets.
Total Uabilities were $26.4 million favourable to budget target ($18.9 million favourable in Current Uabilities and $7.5 million favourable in Non Current Uabilities}.
Movements in the level of the NSW Department of Health Recurrent Allocation that have occurred since the time of the initial allocation on 16 June 2009 are as follows:-
Initial Allocation
Planned Surgery
Drug and Alcohol
Mental Health Services
Caring Together
Medical Physicists Awards
National Partnership Prevention Agreement on Subacute Care
Nurse I Midwifery Strategy
Severe Chronic Disease
Revenue Budget
AIDS Maternity Initiatives I Enhancement Visiting Medical Officers Awards Organ and Tissue Donation Funding Renal Services Enhancement Keep Them Safe Sustained Health Home Visiting Pilot High Cost Drug Oral Health Services Miscellaneous
Balance as per Statement of Comprehensive Income
$000
1,901,617
4,800
3,704
3,673
3,125
3,130
2,773
2,655
1,901
1,600
1,464 1,399 1,178 1,010
707 907 868 568 258
8,938
1,946,275

37. Flnanciallnstruments
Sydney South West Area Health Service Notes to and forming part of the Financial Statements
for the Year ended 30 June 2010
SSWAHS's financial instruments are outlined below. These financial instruments arise directly from the SSWAHS's operations or are required to finance its operations. SSWAHS does not enter into or trade financial instruments, including derivative financial instruments, for speculative purposes.
SSWAHS's main risks arising from financial instruments are outlined below, together with the SSWAHS's objectives, policies and processes for measuring and managing risk. Further quantitative and qualitative disclosures are included throughout these financial statements.
The Chief Executive has overall responsibility for the establishment and oversight of risk management and reviews and agrees policies for managing each of these risks. Risk management policies are established to identify and analyse the risk faced by SSWAHS, to set risk limits and controls and monitor risks. Compliance with policies is reviewed by the Audit Committee/Internal auditors on a continuous basis.
a) Financial Instrument Categories
PARENT
Financial Assets Class:
Cash and Cash Equivalents (note 18) Receivables (note 19) 1
Financial Assets at Fair Value (note 21)
Total Financial Assets
Financial Liabilities
Borrowings (Note 27) Payables (Note 26) 2
Other
Total Financial Liabilities
Notes
Category
N/A Loan and receivables (at amortised cost)
At fair value through profit or loss (designated as such upon initial recognition)
Financial liabilities
measured at amortised cost
1 Excludes statutory receivables and prepayments (ie not within scope of AASB 7)
2 Excludes statutory payables and uneamed revenue (ie not within scope of AASB 7)
CONSOLIDATION
Financial Assets Class:
Cash and Cash Equivalents (note 18) Receivables (note 19) 1
Financial Assets at Fair Value (note 21)
Total Rnancial Assets
Financial Liabilities
Borrowings (Note 27) Payables (Note 26) 2
Other
Total Financial Liabil~ies
Notes
Category
NIA Loan and receivables (at amortised cost)
At fair value through profit or loss (designated as such upon initial recognition)
Financial liabilities measured at amortised cost
1 Excludes statutory receivables and prepayments (ie not within scope of AASB 7)
2 Excludes statutory payables and unearned revenue (ie not within scope of AASB 7)
Carrying Amount
2010 $000
191,320 33,831
31,199
256,350
711
114,898
115,609
Carrying Amount
2010 $000
205,333
34,109
33,718
273,160
2,523
115,261
117,784
Carrying Amount
2009 $000
170,720
36,026
33,575
240,321
657
130,631
131,288
Carrying Amount
2009 $000
184,284
37,038
37,880
259,202
2,657 131,117
133,774

b) Credit Risk
Sydney South West Area Health Service Notes to and forming part of the Financial Statements
for the Year ended 30 June 2010
Credit risk arises when there is the possibility of SSWAHS's debtors defaulting on their contractual obligations, resulting in a financial loss to SSWAHS. The maximum exposure to credit risk is generally represented by the carrying amount of the financial assets (net of any allowance for impairment).
Credit risk arises from financial assets of SSWAHS, including cash, receivables and authority deposits. No collateral is held by SSWAHS. The SSWAHS has not granted any financial guarantees.
Cred~ risk associated w~h the SSWAHS's financial assets, other than receivables, is managed through the selection of counterparties and establishment of minimum credit rating standards. Authority deposits held with NSW TCorp are guaranteed by the State.
Cash
Cash comprises cash on hand and bank balance deposited in accordance with Public Authorities (Financial Arrangements) Act approvals. Interest is earned on daily bank balances at rates of approximately 2.45"/o to 3.63"/o in 2009/10 compared to 3.45"/o to 4.57% in the previous year. The TCorp Hour Glass cash facility is discussed in para (d) below.
Receivables - trade debtors
All trade debtors are recognised as amounts receivable at balance date. Collectability of trade debtors is reviewed on an ongoing basis. Procedures as established in the NSW Department of Health Accounting Manual and Fee Procedures Manual are followed to recover outstanding amounts, including letters of demand. Debts which are known to be uncollectable are written off. An allowance for impairment is raised when there is objective evidence that SSWAHS will not be able to collect the amounts due. The evidence includes past experience and current and expected changes in economic conditions and debtor credit ratings. No interest is earned on trade debtors.
SSWAHS is not materially exposed to concentrations of credit risk to a single trade debtor or group of debtors. Of the total debtors balance at year-end, $17.328 M (2009: $16.745 M) related to debtors that were not past due and not considered impaired and debtors of $17.781 M (2009: $20.293 M) were past due but not considered impaired. Together these represent 77% (2009: 80%) of total trade debtors. The Receivables include Patient Fees Compensables which are frequently not settled within 6 months of the date of the service provision due to the length of time it takes to settle legal claims. Most of the SSWAHS's debtors are Health Insurance Companies or Compensation Insurers settling claims in respect of inpatient treatments. There are no debtors which are currently not past due or impaired whose terms have been renegotiated.
Financial assets that are past due or impaired could be 'sales of goods and services', 'prosthese', 'sundry debtors' or 'other debtors' in the 'receivables' category of the Statement of Financial Position. Patient Fees Ineligibles may represent the majority of financial assets that are past due or impaired.
CONSOLIDATION $000 $000 Past due but not
impaired 1'2
Considered impaired
2010 <3 months overdue 3 months - 6 months overdue > 6 months overdue 2009 <3 months overdue 3 months - 6 months overdue > 6 months overdue
Notes
1 Each column in the table reports "gross receivables".
Total 1'2
8,172 7,757
11,773
6,517 3,579
19,675
7,361 5,925 4,495
5,742 1,829
12,722
2 The ageing analysis excludes statutory receivables, as these are not within the scope of AASB 7 and excludes receivables that are not past due and not impaired. Therefore, the "total" will not reconcile to the receivables total recognised in the statement of financial position.
Values under "Considered Impaired' should generally relate closely to current year allowance for impairment.
Authority Deposits
1,2
811 1,832 7,278
775 1,750 6,953
SSWAHS has placed funds on deposit with TCorp, which has been rated 'AAA' by Standard and Poor's. These deposits are similar to money market or bank deposits and can be placed 'at call' or for a fixed term. For fixed term deposits, the interest rate payable by TCorp is negotiated in~ially and is fixed for the term of the deposit, while the interest rate payable on at call deposits can vary. The deposits at balance date were earning an average interest rate of 4.39"/o (2009: 5.21"/o), while over the year the weighted average interest rate was 4.37% (2009: 5.07%) on a weighted average balance during the year of $122.146M (2009: $118.470M). None of these assets are past due or impaired.

c) Liquidity risk
Sydney South West Area Health Service Notes to and forming part of the Financial Statements
tor the Year ended 30 June 2010
Liquidity risk is the risk that SSWAHS will be unable to meet its payment obligations when they fall due. SSWAHS continuously manages risk through monitoring future cash flows and maturities planning to ensure adequate holding of high quality liquid assets. The objective is to maintain a balance between continuity of funding and flexibility through effective management of cash, investments and liquid assets and liabilities.
SSWAHS has negotiated no loan outside of arrangements with the NSW Department of Health or the Sustainable Energy Development Authority.
During the current and prior years, there were no defaults or breaches on any loans payable. No assets have been pledged as collateral. SSWAHS's exposure to liquidity risk is considered significant. However, the risk is minimised as the NSW Department of Health has indicated its ongoing financial support for SSWAHS (refer Note 2).
The liabilities are recognised for amounts due to be paid in the future for goods or services received, whether or not invoiced. Amounts owing to suppliers (which are unsecured) are generally settled in accordance with the policy set by the NSW Department of Health. If trade terms are not specified, payment is generally made no later than the end of the month following the month in which an invoice or a statement is received.
In those instances where settlement cannot be affected in accordance with the above, eg. due to short term liquidity constraints , terms of payment are negotiated with creditors.
The table below summarises the maturity profile of the SSWAHS's financial liabilities together with the interest rate exposure.
Maturity Analysis and interest rate exposure of financial liabilities
$'000 CONSOLIDATION Interest Rate Exposure Maturity Dates
Weighted Average Fixed Variable Non-Effective Nominal Interest Interest Interest Int. rate Amount' Rate Rate Bearing < 1 Yr 1-5 Yr > 5Yr
2010 % $000 $000 $000 $000 $000 $000 $000
Payables: Accrued Salaries, Wages and On-Costs 26,799 26,799 26,799 Taxation and Payroll Deductions 10,042 10,042 10,042 Creditors 58,400 58,400 58,400 NSW Health Loan 711 711 407 304 Other Loans and Deposits 6.7 2,900 2,900 475 2,425 Accrued Leave Mobility 2,924 2,924 2,924 AccruedVMO 17,096 17,096 17,096
118,872 2,900 115,972 115,668 779 2,425
2009 Payables: Accrued Salaries, Wages and On-Costs 44,594 44,594 44,594 Taxation and Payroll Deductions 10,436 10,436 10,436 Creditors 56,916 56,916 56,916 NSW Health Loan 657 657 203 454 Other Loans and Deposits 6.7 2,900 2,900 150 2,750 Accrued Leave Mobility 5,415 5,415 5,415 AccruedVMO 13,755 13,755 13,755
134,673 2,900 131,773 131,319 604 2,750
Notes: 1. The amounts disclosed are the contractual undiscounted cash flows of each class of financial liabilities based on the earliest date on which SSWAHS can be required to pay The tables include both interest and principal cash flows and therefore will not reconcile to the Statement of Financial Position.

d) Market risk
Sydney South West Area Health Service Notes to and forming part of the Financial Statements
for the Year ended 30 June 201 0
Market risk is the risk that the fair value of future cash flows of a financial instrument will fluctuate because of changes in market prices. SSWAHS's exposures to market risk are primarily through interest rate risk on the SSWAHS's borrowings and other price risks associated with the movement in the unit price of the Hour-Glass Investment facilities. SSWAHS has no exposure to foreign currency risk and does not enter into commodity contracts.
The effect on profit and equity due to a reasonably possible change in risk variable is outlined in the information below, for interest rate risk and other price risk. A reasonably possible change in risk variable has been determined after taking into account the economic environment in which SSWAHS operates and the time frame for the assessment (i.e. until the end of the next annual reporting period). The sensitivity analysis is based on risk exposures in existence at the Statement of Financial Position date. The analysis is pertormed on the same basis for 2009. The analysis assumes that all other variables remain constant.
Interest rate risk
Exposure to interest rate risk arises primarily through SSWAHS's interest bearing liabilities.
However, SSWAHS is not permitted to borrow external to the NSW Department of Health (Sustainable Energy Development Authority (SEDA) loans which are negotiated through Treasury excepted). Both SEDA and NSW Department of Health loans are set at fixed rates and therefore are generally not affected by fluctuations in market rates. The SSWAHS does not account for any fixed rate financial instruments at fair value through profit or loss or as available-for-sale. Therefore, for these financial instruments, a change of interest rates would not affect profit or loss or equity. A reasonably possible change of +1-1 is used consistent with current trends in interest rates. The basis will be reviewed annually and amended where there is a structural change in the level of interest rate volatility. SSWAHS's exposure to interest rate risk is set out below.
PARENT
2010 Financial assets
Cash and Cash Equivalents
Financial Assets at Fair Value
2009 Financial assets
Cash and Cash Equivalents
Financial Assets at Fair Value
CONSOLIDATION
2010 Financial assets
Cash and Cash Equivalents
Financial Assets at Fair Value
2009 Financial assets
Cash and Cash Equivalents
Financial Assets at Fair Value
$'000
Carrying Amount
191,320
31 '199
170,720
33,575
$'000
Carrying Amount
205,333
33,718
184,284
37,880
-1%
Profit
(1 ,913)
(312)
(1,707)
(336)
-1%
Profit
(2,053)
(337)
(1 ,843)
(379)
Equity
(1 ,913)
(312)
(1 ,707)
(336)
Equity
(2,053)
(337)
(1 ,843)
(379)
+1%
Profit
1,913
312
1,707
336
+1%
Profit
2,053
337
1,843
379
Equity
1,913
312
1,707
336
Equity
2,053
337
1,843
379

Sydney South West Area Health Service Notes to and forming part of the Financial Statements
for the Year ended 30 June 2010
Other price risk - TCorp Hour-Glass facilities
Exposure to 'other price risk' primarily arises through the investment in the TCorp Hour-Glass Investment Facilities, which are held for strategic rather than trading purposes. SSWAHS has no direct equity investments. SSWAHS holds units in the following Hour-Glass investment trusts:
Facility
Cash facility
Strategic Cash facility
Medium term growth facility
Long-term growth facility
Investment Sectors
Cash, money market instruments
Cash, money market and other interest rate instruments
Cash, money market instruments Australian and International bonds, listed property, Australian and International shares
Cash, money market instruments Australian and International bonds, listed property, Australian and International shares
Investment Horizon
Up to 1.5 years
1.5 years to 3 years
3 years to 7 years
7 years and over
2010 2009
$'000 $'000
125,172 121,154
3,629 5,395
13,830 15,044
18,002 19,548
The unit price of each facility is equal to the total fair value of net assets held by the facility divided by the total number of units on issue for that facility. Unit prices are calculated and published daily.
NSW TCorp is trustee for each of the above facilities is required to act in the best interest of the unit holders and to administer the trusts in accordance with the trust deeds. As trustee, TCorp has appointed external managers to manage the performance and risk of each facility in accordance with a mandate agreed by the parties. However, TCorp, acts as manager for part of the Cash and Strategic Cash Facilities and also manages the Australian Bond portfolio. A significant portion of the administration of the facilities is outsourced to an external custodian.
Investment in the Hour-Glass facilities limits the Health Service's exposure to risk, as it allows diversification across a pool of funds with
different investment horizons and a mix of investments.
NSW TCorp provides sensitivity analysis information for each of the Investment facilities, using historically based volatility information collected over a ten year period, quoted at two standard deviations (i.e. 95% probability). The Tcorp Hour Glass Investment facilities are designated at fair value through profit or loss and therefore any change in unit price impacts directly on profit (rather than equity).
A reasonably possible change is based on the percentage change in unit price (as advised by TCorp) multiplied by the redemption value as at 30 June each year for each facility (balance from Hour-Glass Statement).
Hour-Glass Investment - Cash facility
Hour-Glass Investment -Strategic cash facility
Hour-Glass Investment - Medium-term growth facility
Hour-Glass Investment - Long-term growth facility
Change in unit price
1%
1%
7%
15%
Impact on profit/loss
2010 2009 $'000 $'000
1,252 1,212
36 108
968 1,053
2,700 2,932

Sydney South West Area Health Service Notes to and forming part of the Financial Statements
for the Year ended 30 June 2010
e) Fair Value compared to Carrying Amount
Financial instruments are generally recognised at cost, with the exception of the TCorp Hour-Glass facilities, which are measured at fair value. As discussed, the value of the Hour-Glass Investments is based on SSWAHS's share of the value of the underlying assets of the facility, based on the market value. All of the Hour-Glass facilities are valued using 'redemption' pricing.
The amortised cost of financial instruments recognised in the Statement of Financial Position approximates the fair value because of the short term nature of many of the financial instruments. There are no financial instruments where the fair value differs from the carrying amount.
(f) Fair Value recognised in the Statement of Financial Position
SSWAHS uses the following hierarchy for disclosing the fair value of financial instruments by valuation technique:
Level 1 - derived from quoted prices in active markets for identical assets/liabilities. Level2- derived from inputs other than quoted prices that are observable directly or indirectly. Level 3 - derived from valuation techniques that include inputs for the asset/liability not based on observable market data (unobservable inputs).
TCorp Hour-Glass Investment Facility
Level1 $'000
0
Level2 $'000
160,633
Level3 $'000
0
2010 Total $'000
160,633
(The table above only includes financial assets as no financial liabilities were measured at fair value in the Statement of Financial Position).
There were no transfers between level 1 and 2 during the period ended 30 June 2010.

38. Post Balance Date Events
Sydney South West Area Health Service Notes to and forming part of the Financial Statements
for the Year ended 30 June 2010
a) On 20 April2010 the State of NSW and the Commonwealth agreed on national health reforms to establish Local Health Networks in NSW and to introduce national standards for timely access to emergency care and elective surgery.
Under the Agreement, NSW will remain responsible for system-wide planning, performance and purchasing of public hospital services and supporting the transition process for the Commonwealth to assume full funding and policy responsibility for general practice, primary health care and the national aged care system.
This agreement will result in structural and corporate changes including the establishment of these Local Health Network in 201 D-11. A professional Goveming Council will be constituted for each Local Health Network. It is expected that these reform will significantly change this reporting entity.
b) Effective from 19 July 2010, the Concord Warehouse and its inventory has been transferred to Health Support Service (HSS). SSWAHS will purchase the inventory from HSS.
END OF AUDITED FINANCIAL STATEMENTS