statutory authority - missouri department of … · with authority granted under sb 125 ... 2014...
TRANSCRIPT

MISSOURI STATE BOARD OF EDUCATION AGENDA ITEM: February 2015
REPORTS FROM PROVISIONAL AND UNACCREDITED PERFORMANCE DISTRICTS:
CARUTHERSVILLE 18, HAYTI R-II, AND CALHOUN R-VIII
STATUTORY AUTHORITY:
Sections 161.092, 162.081, 167.131, and
168.081 RSMo
Consent
Item
Action
Item
Report
Item
DEPARTMENT GOAL NO. 1:
All Missouri students will graduate college and career ready.
SUMMARY:
With authority granted under SB 125 (162.081 RSMo), the Department has the responsibility to
offer more supervision, assistance, and if necessary, intervention to prevent districts or schools
from falling below accredited levels. For districts already below accredited levels, additional
assistance and intervention are provided.
The Missouri School Improvement Program (MSIP) Plan for Support and Intervention
requires districts that are Provisionally Accredited, Unaccredited, or under state oversight to
participate in specific interventions. This presentation will focus on the development and
implementation of improvement plans from three (3) school districts that are accredited at the
provisional level: Caruthersville 18, Hayti R-II, and Calhoun R-VIII.
PRESENTER(S):
Jocelyn Strand, Coordinator of School Improvement, Office of Quality Schools; J.J. Bullington,
Superintendent, Caruthersville 18 School District; Jackie Johnson, Superintendent, Hayti R-II
School District; and Chris Small, Superintendent, Calhoun R-VIII School District, will assist
with the presentation and discussion of this agenda item.

CARUTHERSVILLE SCHOOL DISTRICT #18
COMMITTED TO EXCELLENCE, FOCUSED ON LEARNING
Missouri Department of Elementary and Secondary Education February 2015
Presentation to the State Board of
Education
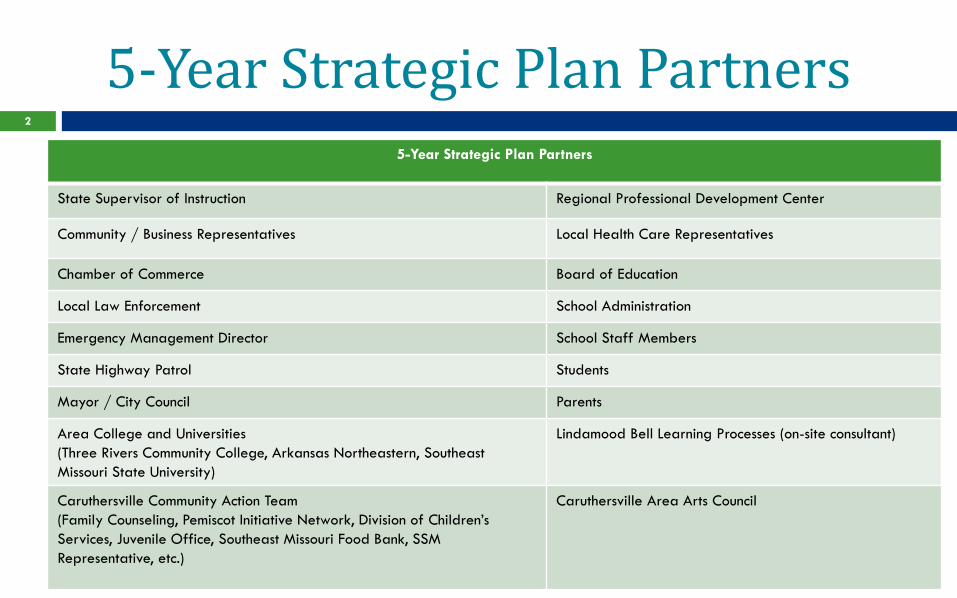
5-Year Strategic Plan Partners 2
5-Year Strategic Plan Partners
State Supervisor of Instruction Regional Professional Development Center
Community / Business Representatives Local Health Care Representatives
Chamber of Commerce Board of Education
Local Law Enforcement School Administration
Emergency Management Director School Staff Members
State Highway Patrol Students
Mayor / City Council Parents
Area College and Universities
(Three Rivers Community College, Arkansas Northeastern, Southeast
Missouri State University)
Lindamood Bell Learning Processes (on-site consultant)
Caruthersville Community Action Team
(Family Counseling, Pemiscot Initiative Network, Division of Children’s
Services, Juvenile Office, Southeast Missouri Food Bank, SSM
Representative, etc.)
Caruthersville Area Arts Council

3
STANDARD 2012 APR 2013 APR 2014 APR INCREASE / DECREASE
Academic Achievement 71.4 % 32.1 % 75 % + 42.9 %
40/56 18/56 42/56 + 24 points
Subgroup Achievement 60.7 % 28.6 % 53.6 % + 25.0 %
8.5/14 4/14 7.5/14 + 3.5 points
College and Career Ready 78.3 % 80 % 86.7 % + 6.7 %
23.5/30 24/30 26/30 + 2 points
Attendance 80.0 % 95 % 75 % - 25 %
Graduation Rate 75 % 100 % 100 %
TOTAL 73.2 % 61.1 % 80.7 % + 19.1 %
2012 (Draft) 2013 2014
APR Total Points 102.5 / 140 85.5 / 140 113.0 / 140
+ 27.5 points
Percent of Points 73.2 % 61.1 % 80.7 %
+ 19.60 %
2013 to 2014 Increase
The Data – Where Are We? Progress made over the past year.

4
Performance Targets
Improve academic achievement of all
students in English Language Arts in order
to demonstrate improvement in the
performance of students over time.
Measurement Tool
Top 10 by 20 projected status targets. To
reach >385.7 MPI points by 2020.
Annual Targets
To increase the percentage of students
scoring proficient or advanced by 3%
annually.
To increase MPI points annually in order to
attain 100% APR points.
English Language Arts Proficient or Advanced
2012 42.4 % 332.8 MPI
2013 40.8 % 331.6 MPI
2014 42.3 % 341.2 MPI
Target
2015
45.3 % 338.54 MPI
3 yr. avg. = 337.11
2 yr. avg. = 339.87
Status = Approaching = 9 pts.
Progress = On Track = 6 pts.
Possible Pts. = 16
Total Pts. = 15
Percent Earned = 93.75 %
Projected 2015 42% 316.23 MPI
3 yr. avg. = 329.68
2 yr. avg. = 328.75
Status: Approaching = 9 pts.
Progress: Floor = 0 pts.
Possible Pts. = 16
Total Pts. = 9
Percent Earned = 56%
Academic Achievement English Language Arts

5
Performance Targets
Improve academic achievement of all
students in Mathematics in order to
demonstrate improvement in the
performance of students over time.
Measurement Tool
Top 10 by 20 projected status targets.
To reach >392.8 MPI points by 2020.
Annual Targets
To increase the percentage of students
scoring proficient or advanced by 3%
annually.
To increase MPI points annually in order
to attain 100% APR points.
Mathematics Proficient or Advanced
2012 40.5 % 320.5 MPI
2013 36.7 % 309.6 MPI
2014 39.9 % 323.2 MPI
Target 2015 42.9 % 328.77 MPI
3 yr. avg. = 320.52
2 yr. avg. = 325.99
Status = Approaching 9 pts.
Progress = Exceeding = 12 pts.
Possible Pts. = 16
Total Pts. = 21
Percent Earned = 100%
Projected 2015 43.0 % 330.65 MPI
3 yr. avg. = 321.15
2 yr. avg. = 326.93
Status: Approaching = 9 pts.
Progress: Exceeding = 12 pts.
Possible Pts. = 16
Total Pts. = 21
Percent Earned = 100 %
Academic Achievement Mathematics

6
Performance Targets
Improve academic achievement of all
students in Science in order to
demonstrate improvement in the
performance of students over time.
Measurement Tool
Top 10 by 20 projected status targets.
To reach >352.8 MPI points by 2020.
Annual Targets
To increase the percentage of students
scoring proficient or advanced by 3%
annually.
To increase MPI points annually in order
to attain 100% APR points.
Science Proficient or Advanced
2012 27.7 % 277.5 MPI
2013 30.2 % 280.0 MPI
2014 36.9 % 298.0 MPI
Target 2015 39.9 % 322.70 MPI
3 yr. avg. = 300.23
2 yr. avg. = 310.35
Status = Approaching = 9 pts.
Progress = Exceeding = 12 pts.
Possible Pts. = 16
Total Pts. = 21
Percent Earned = 100 %
Projected 2015 51.0 % 340.98 MPI
3 yr. avg. = 306.33
2 yr. avg. = 319.49
Status = Approaching = 9 pts.
Progress = Exceeding = 12 pts.
Possible Pts. = 16
Total Pts. = 21
Percent Earned = 100 %
Academic Achievement Science
7
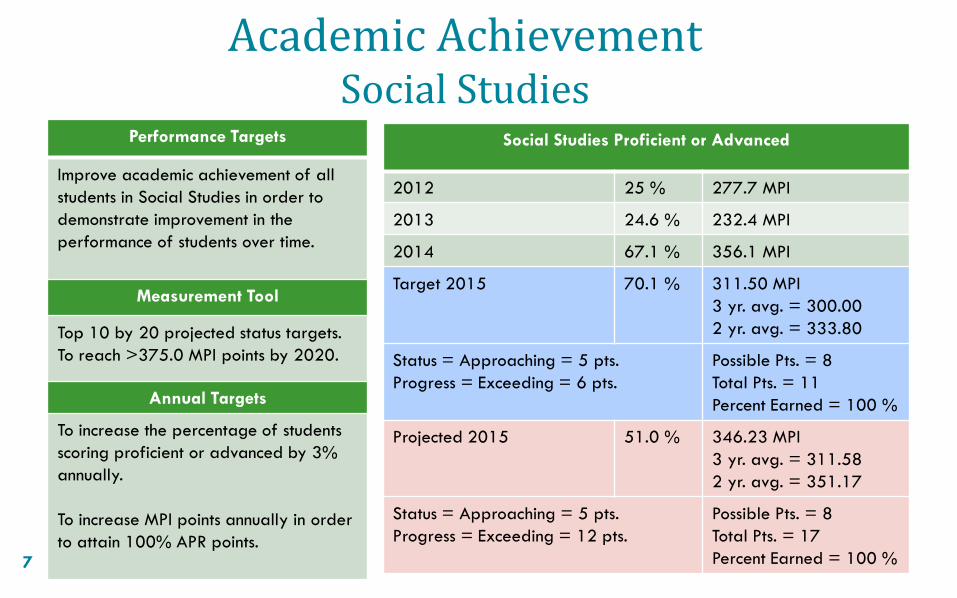
Performance Targets
Improve academic achievement of all
students in Social Studies in order to
demonstrate improvement in the
performance of students over time.
Measurement Tool
Top 10 by 20 projected status targets.
To reach >375.0 MPI points by 2020.
Annual Targets
To increase the percentage of students
scoring proficient or advanced by 3%
annually.
To increase MPI points annually in order
to attain 100% APR points.
Social Studies Proficient or Advanced
2012 25 % 277.7 MPI
2013 24.6 % 232.4 MPI
2014 67.1 % 356.1 MPI
Target 2015 70.1 % 311.50 MPI
3 yr. avg. = 300.00
2 yr. avg. = 333.80
Status = Approaching = 5 pts.
Progress = Exceeding = 6 pts.
Possible Pts. = 8
Total Pts. = 11
Percent Earned = 100 %
Projected 2015 51.0 % 346.23 MPI
3 yr. avg. = 311.58
2 yr. avg. = 351.17
Status = Approaching = 5 pts.
Progress = Exceeding = 12 pts.
Possible Pts. = 8
Total Pts. = 17
Percent Earned = 100 %
Academic Achievement Social Studies

Subgroup Achievement 8
2012 2013 2014 2015 3-Yr Avg 2-Yr Avg Points Percentage
English
Language
Arts
313.0 311.5 320.1 320.37 317.23 320.24 4 / 4 pts. 100%
Approaching Exceeding
2 pts. 3 pts.
Mathematics 305.2 292.7 305.8 324.82 309.44 315.31 4 / 4 pts. 100%
Approaching Exceeding
2 pts. 3 pts.
Science 251.7 258.9 259.8 340.98 286.56 300.39 3 / 4 75%
Floor Exceeding
0 pts. 3 pts.
Social
Studies
256.5 204.0 328.3 346.23 292.84 337.26 1.5 / 2 75%
Floor Exceeding
0 pts. 1.5 pts.

Career and College Readiness 9
Performance Targets
Career and College Readiness 1-3
(Assessments)
Measurement Tool
Top 10 by 20 projected status targets.
To reach >71.5 percent of graduates
scoring at or above the state standard.
Annual Targets
Increase by 3% annually until status met.
Career and College Readiness 1-3 Assessments
% of grads at or
Abv. State Standard
# of grads at or above
the State Standard
2012 50.7 % 34.50 / 68
2013 46.6 % 40.50 / 87
2014 55.6 % 30 / 54
Target 2015 58.6 %
(57.7 as of Jan. 22)
3 yr. avg. = 53.60
2 yr. avg. = 57.10
Status = Approaching = 6 pts.
Progress = Approaching = 2 pts.
Possible Pts. = 10
Total Pts. = 8
Percent Earned = 100 %

10
Performance Target
(Advanced Placement)
Career and College Readiness 4
Advanced Placement
Measurement Tool
Top 10 by 20 projected status targets.
To reach >47.8 percent of graduates
earning a qualifying score / grade.
Annual Targets
Increase by 3% annually until status met.
Career and College Readiness 4 Advanced Placement
% of grads earning
a qualifying score
# of grads earning a
qualifying score
2012 17.3 % 11.75 / 68
2013 27.9 % 24 / 87
2014 56.9 % 30.75 / 54
Target 2015 59.9 %
(48% as of Jan. 22)
3 yr. avg. = 48.23
2 yr. avg. = 58.40
Status = 2020 Target = 10 pts. Possible Pts. = 10
Total Pts. = 10
Percent Earned = 100 %
Business Law Class Mock Trial with Judge Keith Currie.
Brandi Brooks, SEMO Assistant Director of Admissions / New Student Programs, spoke with middle school students at a Career and College Readiness assembly.
11
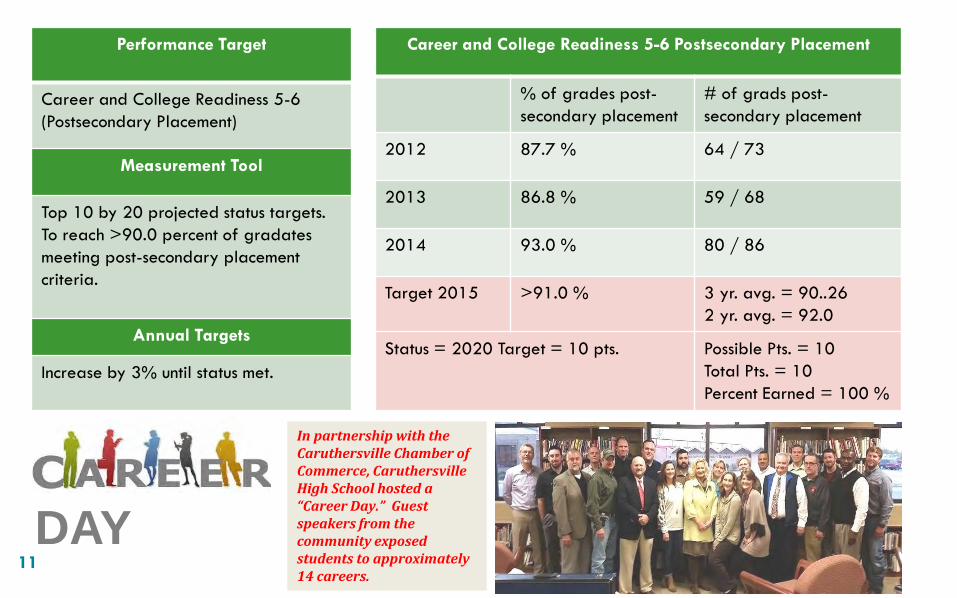
Performance Target
Career and College Readiness 5-6
(Postsecondary Placement)
Measurement Tool
Top 10 by 20 projected status targets.
To reach >90.0 percent of gradates
meeting post-secondary placement
criteria.
Annual Targets
Increase by 3% until status met.
Career and College Readiness 5-6 Postsecondary Placement
% of grades post-
secondary placement
# of grads post-
secondary placement
2012 87.7 % 64 / 73
2013 86.8 % 59 / 68
2014 93.0 % 80 / 86
Target 2015 >91.0 % 3 yr. avg. = 90..26
2 yr. avg. = 92.0
Status = 2020 Target = 10 pts. Possible Pts. = 10
Total Pts. = 10
Percent Earned = 100 %
DAY
In partnership with the Caruthersville Chamber of Commerce, Caruthersville High School hosted a “Career Day.” Guest speakers from the community exposed students to approximately 14 careers.

Attendance 12
Performance Targets
Attendance
Attain and maintain 90% of the
students enrolled in the district
achieving a 90% or higher attendance
rate. (3 year average)
Measurement Tool
Top 10 by 20 projected status
targets. To maintain ≥90 % of the
students with 90% attendance rate.
Annual Targets
90% of all students will maintain 90%
or higher attendance rate.
Attendance
2012 89.7 %
2013 88.6 %
2014 90.5 %
Target 2015
(On Track)
91.0 %
3-year average 90.03
2 year average = 90.75
Status = Target = 10 pts.
Progress = Approaching = 2 pts.
Possible Pts. = 10
Total Pts. = 12
Percent Earned = 100 %
Current (January 16, 2015) 88.26 %
3 year average = 89.12
2 year average = 89.38
Status = On Track = 7.5 pts.
Progress = Floor = 0 pts.
Possible Pts. = 10
Total Pts. = 7.5
Percent Earned = 75 %

Graduation Rate
Performance Targets
Graduation Rate
Attain and maintain a persistence to
graduation rate of 82% (on target) or
higher. To reach ≥92.0 % by 2020
(3 year average).
Measurement Tool
Top 10 by 20 projected status
targets.
Annual Performance Report
Monthly drop out projections
(data team).
Annual Targets
To increase the percentage of
graduates by 4% annually until a
three year average of >92.0 % is
attained and maintained.
13
4 – Year Graduation Rate
2012 76.8 %
2013 88.8 %
2014 73.0 %
Target 2015
(On Track)
85.0 %
3-year average 82.26
2 year average = 79.0
Status = On Track = 22.5 pts.
Progress = Floor = 0 pts.
Possible Pts. = 30
Total Pts. = 22.5
Percent Earned = 75%
Projected 2015 83.13 – 84.34 %
(3-year average 81.64 – 82.26)
Status = Approaching = 18 pts.
Progress = Floor = 0 pts.
Possible Pts. = 30
Total Pts. = 18
Percent Earned = 60 %

Key Strategies and Interventions
Key research-based strategies being utilized to improve academic achievement and teacher/leader growth and development.
Lindamood Bell Learning Processes
Renaissance Reading and Mathematics
Collaborative Work Groups (Data Driven)
Computer Literacy Curriculum (K-12)
Small Group Intervention (LMB, Summer School, After School)
Predictive, Benchmark and Formative Assessments
(Acuity Readiness, Acuity Diagnostic, STAR Reading,
STAR Math, USA Test Prep, LMB Assessment Battery)
Instructional Technology (Learning Tablets)
National Institute of School Leaders (MO-LEAD)
National SAM Project (School Administrator Manager)
14
LMS consultant observes whole group instruction from Florida.
15
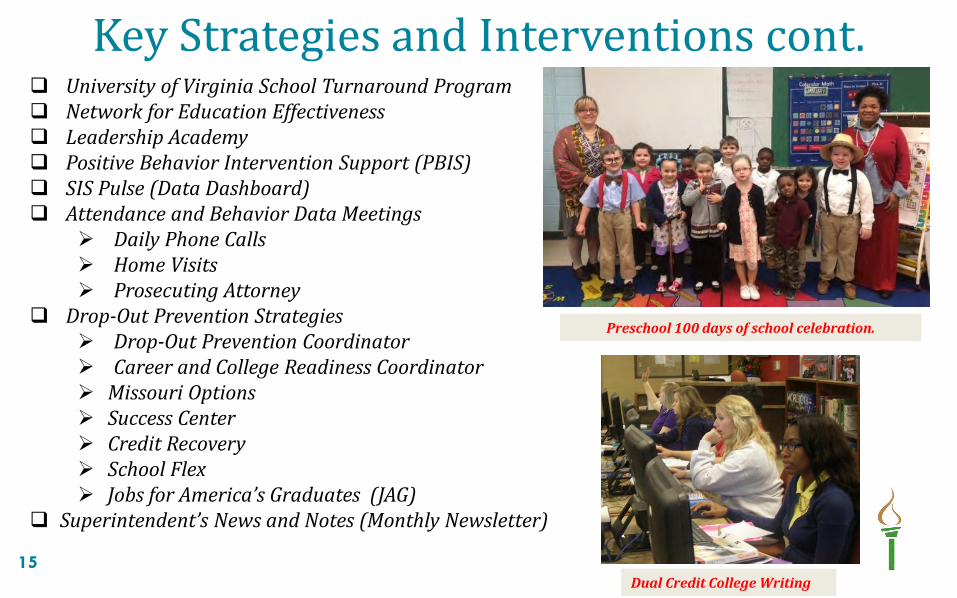
University of Virginia School Turnaround Program Network for Education Effectiveness Leadership Academy Positive Behavior Intervention Support (PBIS) SIS Pulse (Data Dashboard) Attendance and Behavior Data Meetings
Daily Phone Calls Home Visits Prosecuting Attorney
Drop-Out Prevention Strategies Drop-Out Prevention Coordinator Career and College Readiness Coordinator Missouri Options Success Center Credit Recovery School Flex Jobs for America’s Graduates (JAG)
Superintendent’s News and Notes (Monthly Newsletter)
Key Strategies and Interventions cont.
Preschool 100 days of school celebration.
Dual Credit College Writing
Questions/Discussion 16
The Department of Elementary and Secondary Education does not discriminate on the basis of race, color, religion, gender, national origin, age, or disability in its programs and activities. Inquiries related to Department programs and to the location of services, activities, and facilities that are accessible by persons with disabilities may be directed to the Jefferson State Office Building, Office of the General Counsel, Coordinator – Civil Rights Compliance (Title VI/Title IX/504/ADA/Age Act), 6th Floor, 205 Jefferson Street, P.O. Box 480, Jefferson City, MO 65102-0480; telephone number 573-526-4757 or TTY 800-735-2966; email [email protected].

HAYTI R-II SCHOOL DISTRICT
Missouri Department of Elementary and Secondary Education February 2015
Presentation to the State Board of
Education
Our Partners
SOUTHEAST RPDC
ACUITY
BUILD YOUR OWN CURRICULUM
USA TESTPREP
PEMISCOT COUNTY VOCATIONAL SCHOOL
JAG—JOBS FOR AMERICA’S GRADUATES
NEE – NETWORK FOR EDUCATOR EFFECTIVENESS
PIN – PEMISCOT INITIATIVE NETWORK
DARE PROGRAM – DRUG ABUSE, RESISTANCE EDUCATION
2

MSIP 5 STANDARDS Points Points PercentPossible Earned Earned
1. Academic Achievement ELA 16 15 93.80% Math 16 9 56.30% Science 16 0 0.00% Social Studies 8 0 0.00%TOTAL POINTS EARNED 56 24 42.90%2. Subgroup Achievement ELA 4 4 100.00% Math 4 2 50.00% Science 4 2 50.00% Social Studies 2 0 0.00%TOTAL POINTS EARNED 14 8 57.10%3. College/Career Ready3.1-3 10 2 20.00%3.4 10 8 80.00%3.5-6 10 4 40.00%TOTAL POINTS EARNED 30 14 46.70%4. Attendance 10 6 60.00%5. Graduation Rate 30 22.5 75.00%TOTAL 140 74.5 53.20%
The Data – Where We Are 3
MSIP 5 STANDARDS Points Points PercentPossible Earned Earned
1. Academic Achievement ELA 16 9 56.30% Math 16 15 93.80% Science 16 0 0.00% Social Studies 8 6 75.00%TOTAL POINTS EARNED 56 30 53.60%2. Subgroup Achievement ELA 4 2 50.00% Math 4 4 100.00% Science 4 0 0.00% Social Studies 2 1.5 75.00%TOTAL POINTS EARNED 14 7.5 53.60%3. College/Career Ready3.1-3 10 2 20.00%3.4 10 2 20.00%3.5-6 10 2 20.00%TOTAL POINTS EARNED 30 6 20.00%4. Attendance 10 7.5 75.00%5. Graduation Rate 30 22.5 75.00%TOTAL 140 73.5 52.50%
2012-2013 DISTRICT OVERALL 2013-2014 DISTRICT OVERALL

The Data – Where We Are 4
MSIP 5 STANDARDS Points Points PercentPossible Earned Earned
1. Academic Achievement ELA 16 12 75.00% Math 16 16 100.00% Science 16 6 37.50% Social Studies 8 6 75.00%TOTAL POINTS EARNED 56 40 71.40%2. Subgroup Achievement ELA 4 4 100.00% Math 4 4 100.00% Science 4 1 25.00% Social Studies 2 1.5 75.00%TOTAL POINTS EARNED 14 10.5 75.00%3. College/Career Ready3.1-3 10 2 20.00%3.4 10 2 20.00%3.5-6 10 2 20.00%TOTAL POINTS EARNED 30 6 20.00%4. Attendance 10 6 60.00%5. Graduation Rate 30 22.5 75.00%TOTAL 140 85 60.70%
MSIP 5 STANDARDS Points Points PercentPossible Earned Earned
1. Academic Achievement ELA 16 16 100.00% Math 16 15 93.80% Science 16 16 100.00% Social Studies 8 0 0.00%TOTAL POINTS EARNED 56 47 83.90%2. Subgroup Achievement ELA 4 4 100.00% Math 4 4 100.00% Science 4 3 75.00% Social Studies 2 0 0.00%TOTAL POINTS EARNED 14 11 78.60%3. College/Career Ready3.1-3 10 2 20.00%3.4 10 8 80.00%3.5-6 10 4 40.00%TOTAL POINTS EARNED 30 14 46.70%4. Attendance 10 10 100.00%5. Graduation Rate 30 22.5 75.00%TOTAL 140 104.5 74.61%
2012-2013 HIGH SCHOOL OVERALL 2013-2014 HIGH SCHOOL OVERALL

The Data – Where We Are 5
MSIP 5 STANDARDS Points Points PercentPossible Earned Earned
1. Academic Achievement ELA 16 9 56.30% Math 16 12 75.00% Science 16 9 56.30%TOTAL POINTS EARNED 48 30 62.50%2. Subgroup Achievement ELA 4 2 50.00% Math 4 3 75.00% Science 4 0 0.00%TOTAL POINTS EARNED 14 5 42.00%4. Attendance 10 7.5 75.00%TOTAL 70 45 64.30%
MSIP 5 STANDARDS Points Points PercentPossible Earned Earned
1. Academic Achievement ELA 16 9 56.30% Math 16 9 56.30% Science 16 0 0.00%TOTAL POINTS EARNED 48 18 37.50%2. Subgroup Achievement ELA 4 2 50.00% Math 4 2 50.00% Science 4 0 0.00%TOTAL POINTS EARNED 12 4 33.30%4. Attendance 10 7.5 75.00%TOTAL 70 29.5 42.10%
2012-2013 WALLACE MIDDLE OVERALL 2013-2014 WALLACE MIDDLE OVERALL

The Data – Where We Are 6
Possible Earned Earned1. Academic Achievement ELA 16 12 75.00% Math 16 12 75.00%TOTAL POINTS EARNED 32 24 75.00%2. Subgroup Achievement ELA 4 3 75.00% Math 4 3 75.00%TOTAL POINTS EARNED 8 6 75.00%4. Attendance 10 6 60.00%TOTAL 50 36 72.00%
MSIP 5 STANDARDS Points Points PercentPossible Earned Earned
1. Academic Achievement ELA 16 16 100.00% Math 16 12 75.00%TOTAL POINTS EARNED 32 28 87.50%2. Subgroup Achievement ELA 4 4 100.00% Math 4 3 75.00%TOTAL POINTS EARNED 8 7 87.50%4. Attendance 10 6 60.00%TOTAL 50 41 82.00%
2012-2013 MATHIS ELEM. OVERALL 2013-2014 MATHIS ELEM. OVERALL

The Data – Where We Are 7
2012-2013 2013-2014

Performance Targets – Where We Want to Be
Performance Targets Measurement Tool Annual Targets
ELA District Benchmark(Acuity, USA
Testprep), State MAP & EOC
testing, Formative assessments,
Data Team Meetings
2013-331.3
2014-330.9
2015-339.0 (projected target)
15 points = to last year
MATHEMATICS District Benchmark(Acuity, USA
Testprep), State MAP & EOC
testing, Formative assessments,
Data Team Meetings
2013-348.4
2014-310.5
2015-351.0 (projected target)
12 points = 3 pt higher
SCIENCE District Benchmark(Acuity, USA
Testprep), State MAP & EOC
testing, Formative assessments,
Data Team Meetings
2013-262.0
2014-295.0
2015-280.0 (projected target)
12 points = 12 pt higher
SOCIAL STUDIES District Benchmark(Acuity, USA
Testprep), State MAP & EOC
testing, Formative assessments,
Data Team Meetings
2013-262.6
2014-252.1
2015-282.0 (projected target)
6 points = 6 points higher
8

Performance Targets – Where We Want to Be
Performance Targets Measurement Tool Annual Targets
College and Career Readiness
3.1-3*
ACT, ASVAB, Compass – APR Data
2013-20% 2 out of 10 points
2014-20% 2 out of 10 points
2015-60% (projected target)
6 out of 10 pts = 40% higher
College and Career Readiness
3.4*
Dual Credit, AP, TSA 2013-20% 2 out of 10 points
2014-80% 8 out of 10 points
2015-80% (projected target)
College and Career Readiness
3.5-6*
Placement 2013-20% 2 out of 10 points
2014-40% 4 out of 10 points
2015-80% (projected target)
70% of Sr. placement
Attendance Rate SISK12 – DATA TRACKING 90% of students will attend 90%
of the time(weekly)
Graduation Rate Core Data – Tracking 2014-84.6%
2015-90.0% (projected target)
9

Key Strategies and Interventions
Non-Negotiables
Professional Learning Communities
Data Teams
Response to Intervention
Vertical Alignment of Curriculum
Instructional Coaches/Curriculum Coaches
Reading Coaches
NEE Teacher Evaluations/EdHub
Extended Learning Opportunities—Summer School
Benchmark/Readiness Assessments
Early Childhood Education (Preschool)
Positive Behavior Support
10

Questions/Discussion 11
The Department of Elementary and Secondary Education does not discriminate on the basis of race, color, religion, gender, national origin, age, or disability in its programs and activities. Inquiries related to Department programs and to the location of services, activities, and facilities that are accessible by persons with disabilities may be directed to the Jefferson State Office Building, Office of the General Counsel, Coordinator – Civil Rights Compliance (Title VI/Title IX/504/ADA/Age Act), 6th Floor, 205 Jefferson Street, P.O. Box 480, Jefferson City, MO 65102-0480; telephone number 573-526-4757 or TTY 800-735-2966; email [email protected].

CALHOUN R-VIII SCHOOL DISTRICT
Missouri Department of Elementary and Secondary Education February 2015
Presentation to the State Board of
Education

Calhoun Basic Demographic Data
135 Students K-12; 65 Students Early Childhood
89.1% Free and Reduced Lunch
Community Eligibility Provision Participant Serving Free Breakfast and Lunch To All Students
Assessed Value $10,312,630
Tax Levy $3.9926- No Debt Service
2

Our Partners
Regional School Improvement Team
DESE Area Supervisor
Internal Data Team
Curriculum Development Teams
Calhoun Community Development Group
Central Regional Professional Development Center
3

Cont’d.
Clinton Area Vocational/Technical School
Kaysinger Basin Regional Planning Commission
West Central Community Action Agency
Whiteman AFB Community Affairs Office
Henry County Library
State Fair Community College
Western MO Ed. Technology Consortium
4

The Data – Where We Are
Annual Performance Report (APR)
5
APR ELEMENTARY HIGH SCHOOL
2014 91.4% 50.0%
2013 72.9% 67.1%
2012 71.3% 64.7%
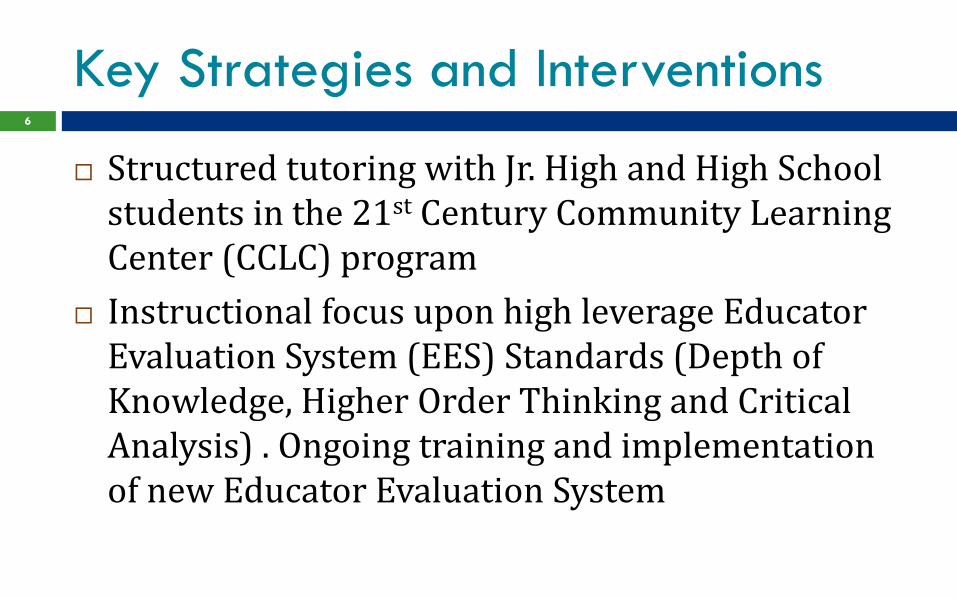
Key Strategies and Interventions
Structured tutoring with Jr. High and High School students in the 21st Century Community Learning Center (CCLC) program
Instructional focus upon high leverage Educator Evaluation System (EES) Standards (Depth of Knowledge, Higher Order Thinking and Critical Analysis) . Ongoing training and implementation of new Educator Evaluation System
6

Key Strategies and Interventions
Focused, job-embedded professional development activities with key faculty responsible for literacy and data analysis
Feedback to teachers using “Fierce Conversation” model
Implementation of instructional flexibility during school day, longer school day, and longer school year
7

Key Strategies and Interventions
Intense use and analysis of Educator Evaluation System data WITH fidelity
Targeted and focused use of literacy data with data team at monthly meetings to DRIVE instructional changes
8

Key Strategies and Interventions
Intense focus on developing all teachers’ skill sets in curriculum, instruction and assessment
Developing teachers’ competencies in the use of formative assessments that actually change instruction on a daily basis
Formation of attendance “rapid response force” to address chronic poor Attendance in grades 7-12.
9
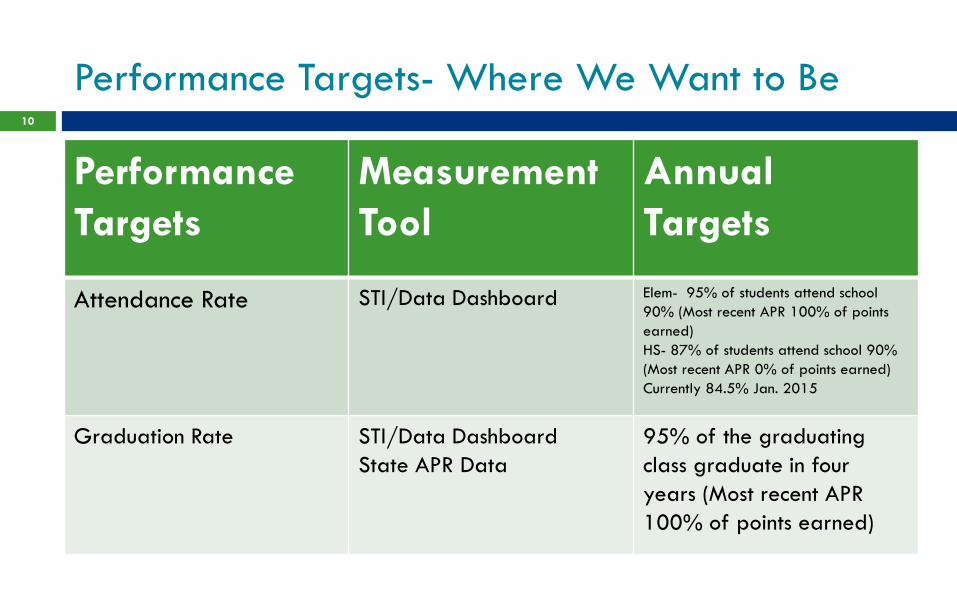
Performance Targets- Where We Want to Be
Performance
Targets
Measurement
Tool
Annual
Targets
Attendance Rate STI/Data Dashboard
Elem- 95% of students attend school
90% (Most recent APR 100% of points
earned)
HS- 87% of students attend school 90%
(Most recent APR 0% of points earned)
Currently 84.5% Jan. 2015
Graduation Rate STI/Data Dashboard
State APR Data
95% of the graduating
class graduate in four
years (Most recent APR
100% of points earned)
10

Where We Want to Be, cont.
Performance
Targets
Measurement
Tool
Annual
Targets Increased Student Academic
Achievement: English Language
Arts, Mathematics, Science, Social
Studies
District Benchmark Assessments- AR,
Dibels, Implementing Acuity,
Common Formative Assessments
ELA- 55% Proficiency Target
Mathematics- 45% Prof. Target
Science- 52% Prof. Target
Soc. Studies- 48.5% Prof. Target
CCR Standards:
CCR Assessments
Earned Dual Credit
Postsecondary Placement
ACT Results, APR Data, ACT Prep
Feedback, Data Team Analysis
75% of students placed on
Postsecondary Placement; 33% of Sr.
earning Dual Credit; CCR Assessments- At
least 40% of students at or above
national average
Increase all teachers review scores on
walk-through and formative evaluation
scores in identified “Power Standards”
utilizing the new EES
RPDC consultants joint evaluation and
feedback; data team analysis of local
EES score profiles
100% of teachers will score at least a
“4” on all walk-throughs and formative
evaluation visits. In addition, identified
“power standards” will see a 50%
increase directly resulting from evaluative
feedback
11

Where We Want to Be, Cont’d.
315 (2015)
330 (2016)
ELA- MPI
317 (2015)
335 (2016)
Math- MPI
12

Where We Want to Be Cont’d.
300 (2015)
325 (2016)
Social Studies
MPI 310 (2015)
330 (2016)
Science MPI
13
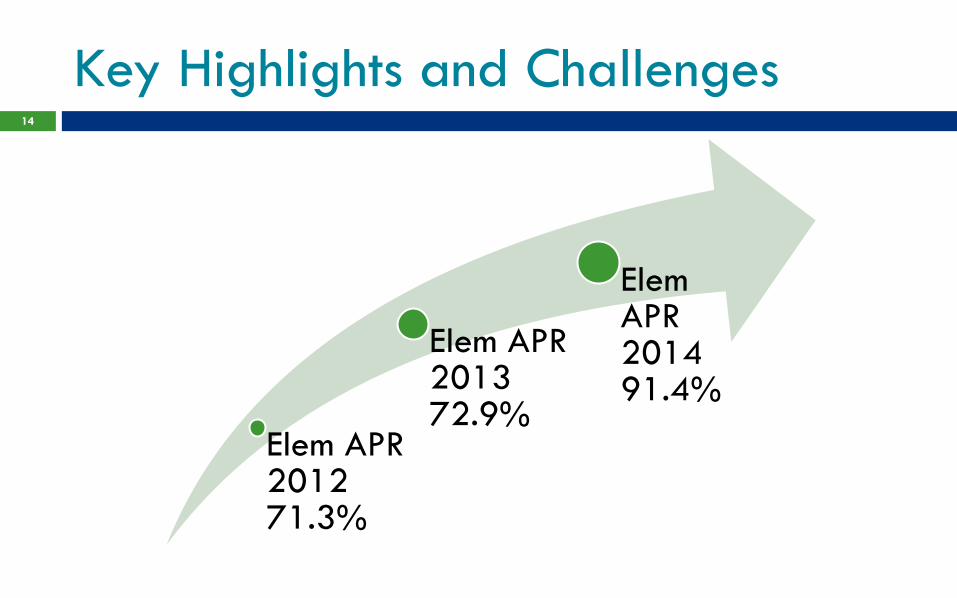
Key Highlights and Challenges
Elem APR 2012 71.3%
Elem APR 2013 72.9%
Elem APR 2014 91.4%
14

Key Highlights and Challenges
High School Low Student Engagement
High School Low Student Attendance
High School Low Student Performance
15

We are committed as individuals and collectively in our learning environment to take responsibility for where we are, chart a course that makes no excuses, monitor our journey toward our goals, and reach those goals for ALL students!
16

Questions/Discussion 17
The Department of Elementary and Secondary Education does not discriminate on the basis of race, color, religion, gender, national origin, age, or disability in its programs and activities. Inquiries related to Department programs and to the location of services, activities, and facilities that are accessible by persons with disabilities may be directed to the Jefferson State Office Building, Office of the General Counsel, Coordinator – Civil Rights Compliance (Title VI/Title IX/504/ADA/Age Act), 6th Floor, 205 Jefferson Street, P.O. Box 480, Jefferson City, MO 65102-0480; telephone number 573-526-4757 or TTY 800-735-2966; email [email protected].