statutory report_annual report_2014-15
DESCRIPTION
ÂTRANSCRIPT

Annual Report2014–15

2
The
Yea
r In
Rev
iew
Our
Co
unci
lO
ur P
eop
leO
ur P
erfo
rman
ceC
orp
. Go
vern
ance
Fina
ncia
lsR
efer
ence
sIn
tro
duc
tio
n

CITY OF BOROONDARA ANNUAL REPORT 2014–15CITY OF BOROONDARA ANNUAL REPORT 2014–15
3
The Year In R
eviewO
ur Co
uncilO
ur Peo
ple
Our P
erform
anceC
orp
. Go
vernanceFinancials
References
Introd
uction
Council Plan and Budget 2013–2017 structure
ThemesFive themes outline the key focus areas for Council’s services throughout the next four years.
Strategic Objectives
Each theme is supported by a strategic objective monitored by Strategic Indicators.
StrategiesEach strategic objective includes a number of Strategies for action.
CommitmentsEach strategy contains a number of Commitments describing actions to be undertaken in a fi nancial year.
Performance Measures
Delivery of the commitments is monitored by relevant performance measures and indicators and the result published in the Annual Report for that fi nancial year.
The Annual Plan 2014–15 defi nes the actions we will undertake during the fi nancial year to contribute to the successful delivery of the Council Plan.
Our Annual Report is divided into four parts:1 Report of operations2 Financial statements3 Performance statement4 Indexes
The report of operations contains information about our community, our Councillors, our organisation, and most importantly, how we performed throughout the year. The section on our performance is divided into the fi ve themes of our Council Plan, so you can easily link our performance to the original plan.
The fi nancial statements and performance statement provide the detailed information that fulfi ls Council’s fi nancial reporting requirements.
Indexes are included for ease of reference to the content of this report.
In addition to this report we have produced a companion document, Our Community, Our Story 2014–15 which provides the narrative behind the community highlights and challenges of the year.
Council has a number of roles including:
– taking into account the diverse needs of thelocal community in decision-making
– providing leadership by establishing strategic objectives and monitoring achievements
– ensuring that resources are managed ina responsible and accountable manner
– advocating the interests of the local communityto other communities and governments
– fostering community cohesion and encouraging active participation in civic life.
The City of Boroondara is committed to effective and sustainable forms of democratic and corporate governance as the key to ensuring that Counciland its administration meet the community’s priorities.The community has many opportunities to provide input into Council’s decision-making processes including community consultation, public forumssuch as ward meetings and the ability to make submissions to Special Committees of Council.
About this reportPurposeThe Annual Report 2014–15 details the performance of the City of Boroondara during the fi nancial year.
Our vision is for a vibrant and inclusive community with an outstanding quality of life.
The Council Plan 2013–17 outlines themes and strategies to achieve this vision for the four-year Council term. The diagram opposite depicts thestructure of the plan:
The City of Boroondara is constituted under the Local Government Act 1989 to provide leadership and good governance to the municipal district and the local community.

4
The
Yea
r In
Rev
iew
Our
Co
unci
lO
ur P
eop
leO
ur P
erfo
rman
ceC
orp
. Go
vern
ance
Fina
ncia
lsR
efer
ence
sIn
tro
duc
tio
n
Symbols in this report
DirectorateThe following symbols identify the directorate or executive management team that has responsibility for delivery of each commitment.
CEO’s offi ce City PlanningCommunications and Engagement
Community Development
Corporate ServicesEnvironment and Infrastructure
StatusCouncil’s progress against each commitment is illustrated by the following symbols:
Completed Commenced Deferred
OutcomeThe outcome of the progress against each strategic indicator is illustrated as a percentage depictedby the following symbol:
1000 Percentage indicators

CITY OF BOROONDARA ANNUAL REPORT 2014–15CITY OF BOROONDARA ANNUAL REPORT 2014–15
5
The Year In R
eviewO
ur Co
uncilO
ur Peo
ple
Our P
erform
anceC
orp
. Go
vernanceFinancials
References
Introd
uction
Introduction
About this report 3
Symbols in this report 4
Our purpose 6
Highlights of the year 8
The year in review
A message from the Mayor 12
A message from the CEO 14
Financial summary 16
Operations summary 18
Our Council
City profi le 22
Council offi ces 24
Council wards 24
Our Councillors 25
Our people
Organisational structure 30
Council staff 33
Equal Employment Opportunity Program 35
Other staff matters 35
Our performance
Planning and accountability 38
Council Plan 39
Theme 1: Strong and engaged communities 40
Theme 2: Sustainable environment 47
Theme 3: Enhanced amenity 50
Theme 4: Quality facilities and assets 54
Theme 5: Responsible management 58
Contents
Corporate governance
Governance, management and other information 64
Governance and management checklist 69
Statutory information 72
Financial statements 82
Performance statement 130
Glossary 140
Abbreviations 142
Index 143

The report of operations is our primary means of advising the Boroondara community about our operations and performance during the fi nancial year.
Our purposeThe City of Boroondara’s vision, mission and values state our long-term direction and purpose, describe how we achieve our goals and outline the set of principles and attitudes that underpin our service to the community.
VisionA vibrant and inclusive community with an outstanding quality of life.
MissionThe City of Boroondara will provide services, facilities, support and advocacy to enable our community to further its sense of place and connection.
6

CITY OF BOROONDARA ANNUAL REPORT 2014–15CITY OF BOROONDARA ANNUAL REPORT 2014–15
7
The Year In R
eviewO
ur Co
uncilO
ur Peo
ple
Our P
erform
anceC
orp
. Go
vernanceFinancials
References
Introd
uctionValues
Our Values How we deliver enhanced services to the community
Participation
Acting honestly and ethically on all occasions
Doing what we say we will do
Ensuring that our service is characterised by openness and transparency
Collaboration
Working inclusively with others to identify and meet their needs
Building and sustaining sound relationships
Encouraging effective engagement and participation
Accountability
Taking full responsibility for our own decisions and actions
Being professional, thorough and timely in our service delivery
Seeking, providing and responding to feedback
Innovation
Demonstrating foresight and creativity in meeting the challenges of the future
Nurturing an environment in which innovative thinking is sought, encouraged and valued
Continuously looking for improvements in our service delivery
Respect
Treating all customers, stakeholders and colleagues with equality and consideration
Caring about others and ensuring that they feel valued
Listening, clarifying and responding appropriately when we communicate with others
City profi le – The City of Boroondara includes the suburbs of
Ashburton, Balwyn, Balwyn North, Camberwell, Canterbury, Deepdene, Hawthorn, Hawthorn East, Kew and Kew East, and parts of Glen Iris, Surrey Hills and Mont Albert
– Boroondara has an estimated residential population of 172,612 people (as at 30 June 2014) with 24% of the population aged between 0 and 19 years and 34% aged 50 years and over
– 68% of Boroondara residents were born in Australia. Residents were born in more than 150 countriesand speak more than 120 languages
– A quarter of Boroondara’s employed residents work within the municipality and just under a quarter work in the City of Melbourne
– 45% of Boroondara households had an incomein the top 25% for Victoria (2011 Census).
Fast facts – 90 groups assisted by annual council
community grants
– 6,625 graffi ti removal requests completed
– 76,130 tonnes of waste collected
– 35,809 indigenous trees, shrubs, grasses and groundcovers planted during the year
– 191,261 calls answered by the contact centre
– 2.41 million library items borrowed
– 1,673 planning applications received
– 73,912 rateable properties
– 2.79 million visits to Boroondara’s leisure and aquatic centres.

8
The
Yea
r In
Rev
iew
Our
Co
unci
lO
ur P
eop
leO
ur P
erfo
rman
ceC
orp
. Go
vern
ance
Fina
ncia
lsR
efer
ence
sIn
tro
duc
tio
n
Highlights of the yearA summary of our achievements divided into the fi ve themes of our Council Plan:
Theme:
Strong and engaged Strong and engaged communitiescommunitiesStrategic objectives: – Our community has a say in matters of interest
to them in achieving Boroondara’s vision
– Community needs are identifi ed and responses planned accordingly
– Opportunities are provided to enable people in our community to be supported and involved.
Achievements: – Adopted the Cultural Diversity Plan 2014–18
– Delivered a Community Innovation Tournament
– Launched a community meal sharing program, the Casserole Club
– Celebrated the 150th Boroondara Farmers Market
– Adopted the Creating an Age-friendly Boroondara Strategy 2014–19
– Introduced the option of online applicationsand payments to the Boroondara Kindergarten Central Enrolment Scheme (BKCES)
– Published The Boroondara Pocket Guide – An Insider’s Guide to Melbourne’s East
– Delivered the Gallipoli and Beyond Project to commemorate the World War I centenary
– Developed the Children and Young People’s Strategy 2015–20
– Launched the 360 Boroondara YouthResource Centre.
Theme:
Sustainable environmentSustainable environmentStrategic objective: – Our natural and urban environment is improved
in a sustainable way.
Achievements: – Highly commended in two categories at the
Keep Australia Beautiful Victoria awards
– Launched a new sustainable living website, Living for our Future in Boroondara
– Prepared a Conservation Management Plan for Maranoa Gardens
– Implemented the fi rst year actions of the Biodiversity Asset Management Plan
– Developed a Waste Management Marketing and Education Plan
– Developed an assessment framework to prioritise stormwater harvesting and treatment opportunities.
Theme:
Enhanced amenityEnhanced amenityStrategic objective: – The character of our neighbourhood is protected
and improved.
Achievements: – Prepared an information sheet to help
residents to understand the Victorian Civiland Administrative Tribunal
– Implemented better controls to reduce the presence of charity bins on Council-controlled land
– Approved Amendment C108 (Neighbourhood Centres and Commercial Corridor Guidelines controls) from the Minister for Planning
– Automated Dial Before You Dig applications
– Completed long term paid car parking areas as outlined in the Camberwell Junction Parking Study.

CITY OF BOROONDARA ANNUAL REPORT 2014–15CITY OF BOROONDARA ANNUAL REPORT 2014–15
9
The Year In R
eviewO
ur Co
uncilO
ur Peo
ple
Our P
erform
anceC
orp
. Go
vernanceFinancials
References
Introd
uctionChallenges and
future outlookTheme:
Quality facilities and assetsQuality facilities and assetsStrategic objective: – The community’s current and future needs for
assets and facilities are proactively managed.
Achievements: – Installed the Gardiners Creek Trail pedestrian
bicycle bridge at HA Smith Reserve
– Completed renovation works at Markham Reserve
– Redeveloped the Ashburton Pool andRecreation Centre
– Completed construction of the Craig Family Centre Early Years facility
– Began construction on the redevelopment of the Boroondara Sports Complex
– Completed streetscape improvements at Mount Street Shopping Centre and Burwood Village.
Theme:
Responsible managementResponsible managementStrategic objectives: – Decision-making in the delivery of high quality
services by capable and professional people refl ects transparent, accountable and fair practices
– Sound fi nancial and risk management practicesare carried out.
Achievements: – Updated Council’s Meeting Procedure Local Law
to refl ect changes to Public Question Time
– Reviewed Council’s Risk Management Framework
– Implemented the SuperStream superannuation system in payroll
– Complied with the new Local Government Victoria Performance Reporting Framework
– Piloted a new Customer RelationshipManagement System
– Developed a Customer ExperienceImprovement Strategy
– Participated in a Healthy Habits Challenge for staff.
Challenges – Introduction of various state Government
planning reforms including new residential zones
– Installation of Council’s new phone system
– Proposed introduction of rate capping
– Implementation of the Local Government Performance Reporting Framework
– Introduction of a new Customer Relationship Management System
– Increasing growth in Boroondara’s ageing demographic
– Uncertainty of future government funding
– Retention of skilled staff
– Competitive retail environment placing signifi cant pressure on Boroondara’s shopping centres.
The future – Embrace new technology with the view
of enhancing productivity
– Implementation of the Boroondara Customer First Program to improve our service offerto the community
– Preserve neighbourhood character
– Replace Council’s document and record management system
– Improve more than 300 work processes throughout the organisation
– Undertake service planning for servicesprovided by Council.


11
The year in review
12 A message from the Mayor
14 Message from the CEO
16 Financial summary
18 Operations summary

12
The
Yea
r In
Rev
iew
Our
Co
unci
lO
ur P
eop
leO
ur P
erfo
rman
ceC
orp
. Go
vern
ance
Fina
ncia
lsR
efer
ence
sIn
tro
duc
tio
n
Boroondara is a vibrant, diverse and inclusive community with high-quality services and facilities. As such, the role of Council is varied as it delivers services that meet the needs of the community through all life stages.The Annual Report is an opportunity to monitor Council’s performance against its strategic objectives, and to ensure its resources are managed in a responsible manner. As both a representative and advocate forthe local community, Council encourages active participation, involvement and engagement in civic life.
This year, Council’s commitment to build a better City for today and for the future continued. We invested $42.9 million on the replacement of assets and a further $11.6 million on new and upgraded infrastructure. This included a total of $15.4 million for essential community infrastructure such as roads, drains and footpaths.
We made signifi cant progress on our major infrastructure projects. The $11.4 million Ashburton Pool and Recreation Centre redevelopment is now largely complete. Some of the new features include an expanded gymnasium, refurbished crèche and new wet and dry change rooms. Adjacent to the new facility is the Craig Family Centre which has undergone a $3.6 million upgrade. The renewed centre includes redeveloped early-years facilities – increasing the capacity from 40 to 66 spaces, the redevelopment of the early-years playground, and reinstatement of the Warner Reserve Playground. In light of our vision to support the community in making Boroondara a great place to live, work and play – it is wonderful to see these much-valued facilities open for everyone to enjoy.
This year saw the completion of many key projects. One example includes the Gallipoli and Beyond project to commemorate the centenary of the landing at Gallipoli Peninsular and the First World War. The project included a number of events which were well attended. A book, Boroondara Remembers – Stories of World War One, was launched as part of the project, which records the war stories of our Boroondara ANZACs and life on the ‘home front’. I was fortunate to chair a Q&A session as part of the commemoration suite of events. Additionally, Council was internationally recognised for its Principal Pedestrian Network Demonstration (PPND) in Camberwell. The project increased walking around Camberwell Junction and reduced levels of car use. The paper was presented at the world’s premier international walking conference, WALK21. We achieved signifi cant improvements to our City’s shopping centre precincts as part of the Shopping Centre Improvement Plan. These included the stage 1 works at the Camberwell Fresh Food Market, streetscape improvements at Burwood Village and Mount Street Shopping Centres, as well as various design concepts and a laneway strategy to improve our shopping centres. A lot of hard work has gone in to the delivery of all Council-supported projects this year and their success is testament to the active community participation in helping to make these visions a reality.
It is with great pleasure that I present you with the Annual Report 2014–15, which details the achievements and fi nancial performance of Council, and how it is meeting the strategic objectives as outlined in the Council Plan 2013–17. This report marks the third year of the current Council’s term, which commenced in October 2012.
A message from the Mayor

CITY OF BOROONDARA ANNUAL REPORT 2014–15CITY OF BOROONDARA ANNUAL REPORT 2014–15
13
The Year In R
eviewO
ur Co
uncilO
ur Peo
ple
Our P
erform
anceC
orp
. Go
vernanceFinancials
References
Introd
uction
Council is committed to engaging with the community on issues that affect them, throughout its decision-making processes. During the past year, Council’s Engagement and Research team assisted with 39 projects. Some of the key projects where Council consulted with the community include the Children and Young People’s Strategy, Growing and Sharing Local Food in Boroondara discussion paper, Balwyn Library Redevelopment, Men’s Shed at Balwyn North and the North East Community Hub. Community representatives also participated in an Innovation Tournament to help shape the digital future of Council, as part of Council’s broader Boroondara Customer First Program, which is about putting our customers at the centre of everything we do.
To ensure our process for community engagement remains relevant, the community was encouragedto have its say on our Community Engagement Policy so that the policy continues to support the community in shaping outcomes across Boroondara.
Overall, Council completed 93 per cent of its Annual Plan 2014–15 commitments with the remaining seven per cent underway. I would like to thank my fellow Councillors for their support and commitment to theCity of Boroondara. All of this would not be possible without the continued support and input of our residents, local businesses, community groups and Council offi cers to ensure Boroondara is a liveableCity with high-quality services and facilities nowand in the future.
Cr Coral RossMayor
14
The
Yea
r In
Rev
iew
Our
Co
unci
lO
ur P
eop
leO
ur P
erfo
rman
ceC
orp
. Go
vern
ance
Fina
ncia
lsR
efer
ence
sIn
tro
duc
tio
n
Our continued commitment to the Customer Experience Improvement Strategy and associated projects is starting to show results, with many staff participating in Process Improvement workshops across the organisation. The project is facilitatedby the Innovation and Business Transformation team working with staff across the organisation who interact with our community on a daily basis. The results of their work will be evident in our digital platform andthe manner in which we interact with our customers.
The introduction of a new Customer Relationship Management System (CRM) was piloted by Customer Service this year, and immediately improved our speedin processing customer service requests. This newsystem will be rolled out across the rest of the organisation in 2015–16.
Council is committed to community engagementand ensuring that opportunities exist for the community to have a say in matters of interest. The Community Satisfaction Survey is one way community members can share views with Council. Consistent with recent years, the 2015 survey results again rank Boroondara as one of the top performing councils across the state and metro area. As I have shared the survey outcomes with staff, we have actively considered the information that accompanies the results to inform service improvement opportunities and our communication and engagement with the community. While we are very pleased with the results, we will continue to engage with the community as we move towardsa more customer-focussed operating model.
There have been many signifi cant achievements across Council this year but we also faced some challenges.
In the lead up to the introduction of the Victorian Government’s Residential Zones we experienced a signifi cant increase in the number of planning applications lodged with Council. As a result, this year the Statutory Planning department processed a record number of applications. A total of 1,673 planning applications were determined for the year – 27 per cent above the long term average. This led to Boroondara having the highest number of active planning applications in Victoria. Statutory Planning’s effort to signifi cantly reduce the backlog within the target processing timeframe is highly commendable. We continue to receive a signifi cant number of applications for development in our City, which will continue to challenge us; however I am confi dentthat our staff will maintain a high quality of service.
We actively participated in the Victorian State Government’s reform agenda for Local Government and met all reporting requirements associatedwith the implementation of the Local Government Reporting Framework, which includes measures for services, fi nancial and sustainability capacity performance. This requirement beyond our already signifi cant level of reporting to the community and other levels of government placed some resourcing and technological pressures on the organisation, which we met within our current resources.
I am delighted to present Council’s Annual Report for the year 2014–15. The Annual Report provides us with an opportunity to detail our achievements and challenges for the year, as well as how we are meeting our objectives and commitments as stated in the Annual Plan 2014–15 and Budget 2014–15.
Message from the CEO

CITY OF BOROONDARA ANNUAL REPORT 2014–15CITY OF BOROONDARA ANNUAL REPORT 2014–15
15
The Year In R
eviewO
ur Co
uncilO
ur Peo
ple
Our P
erform
anceC
orp
. Go
vernanceFinancials
References
Introd
uction
At the end of 2014–15, Council’s fi nancial position remains sound. Council achieved a net surplus of $33.2 million. Sustaining a surplus net result is a critical fi nancial strategy that provides capacity to renew the $2.7 billion net community assets under Council’s control. Council aims to ensure that it is able to maintain its infrastructure assets at the expected levels, while at the same time continuing to deliver the services needed by the community. To bridge the infrastructure gap, Council invested $42.9 millionin renewal works during the 2014–15 year.
Throughout this report you will see evidence of a number of service and infrastructure initiatives that have been completed which provide outstanding community facilities and opportunities for the community to meet, learn and recreate. We also commenced construction and planning for the Boroondara Sports Complex and the planning for the redevelopment of the Balwyn Library which are substantial projects responding to community need. I am sure that the community will see great benefi ts in service offerings when these facilities, scheduled for completion in 2016–17, are operational.
I would like to take this opportunity to thank Council staff for their commitment and efforts to deliver Council’s diverse range of services, and particularly their enthusiasm to identify process improvements across the organisation. Thank you to the community for your support and input to deliver Council’s vision over the past year.
Phillip Storer
CEO

16
The
Yea
r In
Rev
iew
Our
Co
unci
lO
ur P
eop
leO
ur P
erfo
rman
ceC
orp
. Go
vern
ance
Fina
ncia
lsR
efer
ence
sIn
tro
duc
tio
n
Operating positionCouncil achieved a surplus of $30.12 million in 2014–15. This surplus compares favourably to the original budget surplus of $24.86 million. The favourable variance is due mainly to the payment in advance by Victorian Grants Commission of 50% of 2015–16 grants funding and higher than budgeted open space contributions.
The adjusted net surplus of Council – after removing disposals and replacements of fi xed assets and non-monetary asset contributions – is $33.28 million. Sustaining a surplus net result is a sound fi nancial strategy that provides capacity to renew the $2.72 billion net community assets under our control.
Net operating result ($ million)
0
5
10
15
20
25
30
23.2323.39
1.93
30.12
2014–152013–142012–132011–12
Note: 2011–12 result was due to the recognition of the unexpected $14.33 million call up of unfunded superannuation.
LiquidityCash has decreased by $29.20 million from the previous year because of a change in accounting standards requiring reclassifi cation of funds invested in term deposits greater than 90 days in the current year of $66.50 million. The working capital ratio, which assesses Council’s ability to meet current commitments, is calculated by measuring our current assets as a percentage of current liabilities. Our result of 191.42% indicates a satisfactory fi nancial position and is withinthe expected target band of 120% to 200%.
Working captial ratio %
0
50
100
150
200176.15
145.50
162.01
191.42
2014–152013–142012–132011–12
ObligationsCouncil ensures it maintains infrastructure assets at expected levels while continuing to deliver the services needed by the community. We invested $42.92 million in renewal works during 2014–15. This was funded from capital grants of $1.41 million and cash fl ow from operations of $41.51 million. At the end of 2014–15, Council’s debt ratio – measured by comparing interest-bearing loans and borrowings to rate revenue – was 17.49%. Our asset renewal ratio – measured by comparing asset renewal expenditure to depreciation – was 145%. This was mainly due to the renewal of the Ashburton Pool and Recreation Centre ($7.68 million), Craig Family Centre ($2.36 million), Boroondara Sports Complex ($2.95 million) and Camberwell Fresh Food Market ($1.23 million).
Council’s fi nancial position continues to remain sound. A summary of our performance is outlined below while detailed information is included within the fi nancial statements and performance statement sections of this report.
Financial summary
CITY OF BOROONDARA ANNUAL REPORT 2014–15CITY OF BOROONDARA ANNUAL REPORT 2014–15
17
The Year In R
eviewO
ur Co
uncilO
ur Peo
ple
Our P
erform
anceC
orp
. Go
vernanceFinancials
References
Introd
uction
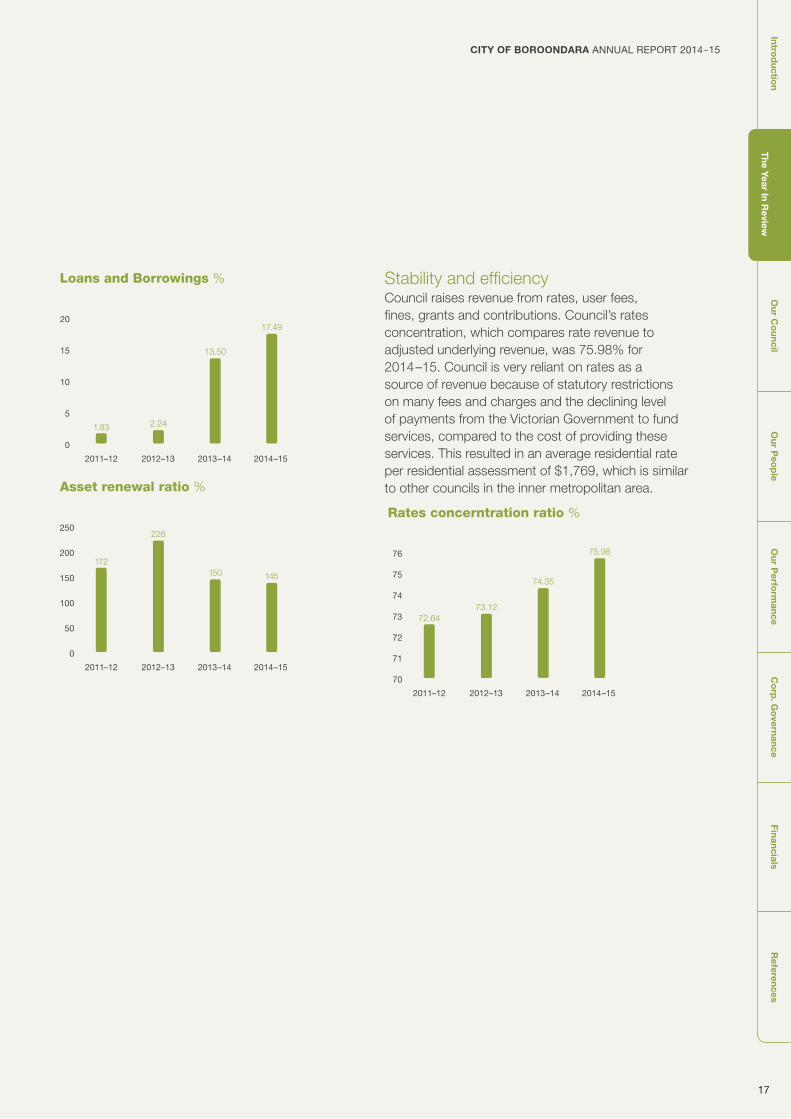
Loans and Borrowings %
0
10
5
15
20
13.50
2.241.83
17.49
2014–152013–142012–132011–12
Asset renewal ratio %
0
100
50
150
250
200
150
226
172
145
2014–152013–142012–132011–12
Stability and effi ciencyCouncil raises revenue from rates, user fees, fi nes, grants and contributions. Council’s rates concentration, which compares rate revenue to adjusted underlying revenue, was 75.98% for2014–15. Council is very reliant on rates as asource of revenue because of statutory restrictions on many fees and charges and the declining level of payments from the Victorian Government to fund services, compared to the cost of providing these services. This resulted in an average residential rate per residential assessment of $1,769, which is similar to other councils in the inner metropolitan area.
Rates concerntration ratio %
74.35
73.1272.64
75.98
2014–152013–142012–132011–12
70
73
72
71
74
76
75

18
The
Yea
r In
Rev
iew
Our
Co
unci
lO
ur P
eop
leO
ur P
erfo
rman
ceC
orp
. Go
vern
ance
Fina
ncia
lsR
efer
ence
sIn
tro
duc
tio
n
These services and community infrastructure support the wellbeing and prosperity of our community. More details about our services are in the our performance section on page 37.
Economic factorsIn 2014–15, interest rates reduced substantially and this allowed Council to review its borrowings portfolio to examine refi nancing options taking advantage of the lower market rates.
Our borrowing had been traditionally longer term over 20 years to ensure intergenerational equity for the building and refurbishment of larger community assets.
As a result of this review, a loan with a remaining period of 18 years at fi xed interest was convertedinto a four-year loan to be paid in full in 2018–19.This saved the community $9 million.
Major projects
Boroondara Sports ComplexConstruction began on a redeveloped Boroondara Sports Complex (BSC) in Balwyn. The project consolidates the BSC and the Balwyn Leisure Centre to provide a quality facility in an improved setting. The upgraded facility will include new gym and program rooms, basketball/netball court, crèche, a gymnastic space and car park improvements. The total estimated cost of the project is $13.5 million and is expected to be completed midway through 2016.
Ashburton Pool and Recreation CentreAfter 12 months of renovations, the $11.4 million upgrade of the Ashburton Pool and Recreation Centre was completed. The upgraded facility features an expanded gymnasium, refurbished crèche, new change rooms, new program rooms and consulting suites, a new front façade, entrance reception and administration area, and landscaping bordering the outdoor pool.
The project received a $3 million Victorian Government grant through the Better Pools Funding Program.
Craig Family CentreA $3.6 million redevelopment of the Craig Family Centre – next to the Ashburton Pool and Recreation Centre – was completed in June 2015. The project increased the capacity of the centre from 40 to 66 early-years places, and included a redeveloped playground and reinstatement of the Warner Reserve Playground. The Victorian Government contributed $588,000 towards the project.
Balwyn Library consultationIn December 2014, about 900 people provided their opinions on the redevelopment of the Balwyn Library. Feedback gathered during that initial period of consultation was used to develop a draft concept design that refl ects the community’s views.A signifi cant program of community engagementwill now be undertaken to gather feedback on the draft concept plans. The redevelopment will ensurethe local community has access to a contemporarylibrary with attractive and appealing spaces tomeet, read and study.
Council delivers a broad range of services ranging from familyand children’s services, traffi c regulation, open space, youth facilities, waste management and community building; to matters concerning business development, planning for appropriate development and ensuring accountability of Council’s budget.
Operations summary

CITY OF BOROONDARA ANNUAL REPORT 2014–15CITY OF BOROONDARA ANNUAL REPORT 2014–15
19
The Year In R
eviewO
ur Co
uncilO
ur Peo
ple
Our P
erform
anceC
orp
. Go
vernanceFinancials
References
Introd
uction
North-East Community HubIn 2014, the North Balwyn RSL Sub-Branch has agreed to negotiate a long-term lease with Council of 2 Centre Way, Balwyn North for a new community facility. The existing RSL building and adjacent Greythorn Early Childhood Centre and Maternal and Child Health Centre will be demolished. The North East Community Hub will include the North Balwyn RSL and its memorabilia, an expanded childcare centre, a relocated Maternal and Child Health Centre, health and counselling services, a library lounge for pick-up and drop-off of library materials, access to computers, programs for all ages and community meeting spaces. There will also be open space with a playground and a memorial. The hub will be designed in 2015–16, and constructed within three years.
Major achievements
Creating an Age-friendly Boroondara 2014–19Council developed a strategy to progress age-friendliness in Boroondara. The Creating an Age-friendly Boroondara Strategy 2014–19 contains actions and creates opportunities for health, participation and security in order to enhancequality of life.
Community satisfaction In early 2015, 500 Boroondara residents took part ina Victorian Government survey about community needs and perspectives. Results indicated that our community highly rates Council’s performance. Council’s overall performance index score was 73; one point below our 2014 result, 13 points higher than the state-wide average and six points higher than the metropolitan group average.
Casserole ClubCouncil is one of only three Victorian councils that chose to receive Victorian Government funding to trial a community meals sharing program, known as the Casserole Club. The Club connects people who cook additional portions of home-cooked food for older neighbours, who might not be able to cook regularly for themselves. Boroondara is piloting the program over six months.
Living for our Future goes onlineCouncil launched a sustainable living website forlocal residents, Living for our Future in Boroondara. The site is a one-stop hub for relevant and up-to-date resources, support and information on sustainability issues facing the Boroondara community.
Amendment C108 to the Boroondara Planning SchemeNeighbourhood Centres and Commercial Corridor Guidelines were approved by the Minister for Planning on 30 December 2014, and gazetted on 9 April 2015. The new planning controls provide for mandatory maximum building heights, mandatory streetwall heights and preferred minimum upper storey building setbacks. The approved planning provisions will guide appropriate developments and help protect the valued streetscape character of the neighbourhood centres and commercial corridors.
Long term fi nancial strategyCouncil prepared a Long Term Financial Strategyfor the 10-year period to 2024–25. This forms partof Council’s ongoing fi nancial planning to help Council adopt a budget within a longer term framework.It takes the themes, strategic objectives and strategies as specifi ed in the Council Plan and expresses them in fi nancial terms. The strategy provides the fi nancial component of the Strategic Resource Plan.
Organisational changesCouncil changed the structure of its organisation in August. Our Economic Development team moved from the City Planning Directorate to the Corporate Services Directorate and an Innovation Department was formed under the Environment and Infrastructure Directorate.

20
The
Yea
r In
Rev
iew
Our
Co
unci
lO
ur P
eop
leO
ur P
erfo
rman
ceC
orp
. Go
vern
ance
Fina
ncia
lsR
efer
ence
sIn
tro
duc
tio
n

CITY OF BOROONDARA ANNUAL REPORT 2014–15
21
The Year In R
eviewO
ur Co
uncilO
ur Peo
ple
Our P
erform
anceC
orp
. Go
vernanceFinancials
References
Introd
uction
21
Our Council
22 City profi le – Boroondara
24 Council offi ces
24 Council wards
25 Our Councillors

22
The
Yea
r In
Rev
iew
Our
Co
unci
lO
ur P
eop
leO
ur P
erfo
rman
ceC
orp
. Go
vern
ance
Fina
ncia
lsR
efer
ence
sIn
tro
duc
tio
n
HistoryThis area is the traditional lands of the people ofthe Eastern Kulin Language Group. After surveyingthe area in 1837, Robert Hoddle declared it the‘Parish of Boroondara’ and because the area was densely wooded, he took the word from the Woiwurrung language, translating it as ‘wherethe ground is thickly shaded’.
The fi rst local government body was the Boroondara District Road Board, formed in 1854, which encompassed the areas that were to become Hawthorn, Kew and Camberwell. With the amalgamation of these cities in June 1994, the Cityof Boroondara was created.
PopulationBoroondara has an estimated residential population of 172,612 people (as at 30 June 2014). Compared with metropolitan Melbourne overall, we have a lower proportion of children and people aged 30 to 39, but a larger proportion of people over 50 years. Within Boroondara, 24% of the population are aged between 0 and 19 years, and 34% are 50 years and over.Of all Victorian LGAs Boroondara has the second largest population of people aged 85 years and over and 3.7% of the population needs assistance with daily living tasks.
Where do we come from?While 68% of Boroondara residents were bornin Australia, we are becoming more culturally and linguistically diverse. Residents were born in morethan 150 countries and speak more than 120 languages. At the last Census, more than a quarterof the population was born overseas, with the majority coming from a country where English is not a main language. Between 2006 and 2011, there was a large increase in residents born in China and India, and in 2013–14, 61% of migrant settlers to Boroondarawere born in either China or India.
Education hubBy area, Boroondara has one of the highest concentrations of schools of all Victorian local government areas, with 57 secondary, primary and special education schools, including 13 combined primary and secondary schools, as well as Swinburne University, Swinburne TAFE, a University of Melbourne campus and two Universities of the Third Age.The City also has 10 neighbourhood and community centres where residents can complete a short course or obtain certifi ed or pre-accredited training in avariety of subjects.
The City of Boroondara includes the suburbs of Ashburton, Balwyn, Balwyn North, Camberwell, Canterbury, Deepdene, Hawthorn, Hawthorn East, Kew and Kew East, and parts of Glen Iris, Surrey Hills and Mont Albert.
City profi le – Boroondara
Population by age group (%)
BoroondaraGreater Melbourne
10.6 12
.6
13.1
11.6
16.4
16.1
12.0
15.3
14.1
14.0
13.2
12.0
9.8
9.1
5.9
5.6
3.74.
9
0
5
10
15
20
80+70−7960−6950−5940−4930−3920−2910−190−9

CITY OF BOROONDARA ANNUAL REPORT 2014–15CITY OF BOROONDARA ANNUAL REPORT 2014–15
23
The Year In R
eviewO
ur Co
uncilO
ur Peo
ple
Our P
erform
anceC
orp
. Go
vernanceFinancials
References
Introd
uction
Where do we work?A quarter of Boroondara’s employed residentswork within the City of Boroondara and just undera quarter work in the City of Melbourne. Income levels for individuals and households are higher than the metropolitan Melbourne average at the 2011 Censusand 45% of Boroondara households had an incomein the top 25% for Victoria. However, 15% of all Boroondara households are living on less than$600 a week.
Where do we shop?Boroondara has a strong retail/commercial sector with the main shopping strips located at Camberwell Junction, Kew Junction and Hawthorn’s Glenferrie Road. Boroondara has 50 strip shopping centres.
How do we live?At the 2011 Census, Boroondara had 65,164 dwellings, ranging from separate houses (62% of all dwellings) to medium and high density dwellings, which are more commonly found in Hawthorn and Hawthorn East. Housing affordability is a major issue with lower income earners facing rising rents. Average fi rst-home buyers experience diffi culties in affording a home in the City’s housing market, one of the most expensive in Victoria. About 1.3% of Boroondara’s housing is social housing (provided for non-profi t purposes), which includes community-based and public housing.
TransportThe City has extensive train, tram and bus transport routes, but still has areas without easy access to public transport and is reliant on private vehicles.Our sustainable transport pathways continue to expand, with over 57km of on-road cycling paths on arterial and local roads. The City also has 34km of shared paths across major trails, including the Gardiners Creek, Anniversary, Main Yarra and Koonung trails.
Our open spacesBoroondara has retained its green and leafy streets, parks and gardens due to water-wise and sustainable practices. The City is rich in its biodiversity and the array of fl ora and fauna; it has about 600 hectaresof open space. The majority of residents have access to public open space close to their home.
Like other municipalities, a challenge ahead will be to maintain the standard of our current environment, liveability and heritage amidst the impacts of climate change, water shortages, increased pollution, and increasing population densities and development.
For more information and statistics about the City of Boroondara, go to www.boroondara.vic.gov.au/AAB
Western Hwy
Eastern Fwy
Princes HwyP
Gippsland Hwy
Hum
e Hw
y
Calder Hwyy
Nepean Hwy
Maroondah Hwy
Princes H
wy
City of Boroondara
Metrapolitan Melbourne
A detailed map of the City and the ward boundaries is included on page 24.

24
The
Yea
r In
Rev
iew
Our
Co
unci
lO
ur P
eop
leO
ur P
erfo
rman
ceC
orp
. Go
vern
ance
Fina
ncia
lsR
efer
ence
sIn
tro
duc
tio
n
HIGH STREET
BARKERS ROAD
COTHAM ROAD
MONT ALBERT ROADBU
RK
E R
OA
D
WHITEHORSE ROAD
CANTERBURY ROAD
BELMORE ROAD
HARP ROAD
BULL
EEN
RO
AD
BA
LWY
N R
OA
D
GR
EY
TH
OR
N R
OA
DU
NIO
N R
OA
D
GLE
N IR
IS R
OA
D
TOORAK ROAD
RIVERSDALE ROAD
BURWOOD ROAD
ASQUITH STREET
EARL STREET
CHURCH STR
EET
STUDLEY PARK ROADS
UM
ME
RH
ILL
RO
AD
PR
INC
ES
S S
TR
EE
T
TO
OR
ON
GA
RO
AD
AU
BU
RN
RO
AD
EASTERN FREEWAY
HIG
HFI
ELD
RO
AD
WA
RR
IGA
L R
OA
D
CAMBERW
ELL ROAD
Cotham Ward
Maranoa Ward
Maling Ward
Junction Ward
Glenferrie Ward
Gardiner Ward Lynden Ward
Solway Ward
Bellevue Ward
Cr Jane Addis
Cr Philip Mallis
Cr Jim Parke
Cr Heinz Kreutz
Cr Judith Voce
Studley WardCr Phillip Healey
Cr Steve Hurd
Cr Jack Wegman
Cr Coral Ross
Cr Kevin Chow
Council offi ces
Website: www.boroondara.vic.gov.au Telephone: 9278 4444Email: [email protected]
City of Boroondara’s 10 Council wardsThe names of the wards were chosen to refl ect the communities they represent. Ward names have signifi cance for the areas covered, honouring signifi cant people and landmarks in Boroondara’s rich history.
Camberwell offi ce8 Inglesby Road, Camberwell
Hawthorn Arts Centre360 Burwood Road, Hawthorn
Kew LibraryCorner Cotham Road and Civic Drive, Kew
Postal addressPrivate Bag 1Camberwell VIC 3124

CITY OF BOROONDARA ANNUAL REPORT 2014–15CITY OF BOROONDARA ANNUAL REPORT 2014–15
25
The Year In R
eviewO
ur Co
uncilO
ur Peo
ple
Our P
erform
anceC
orp
. Go
vernanceFinancials
References
Introd
uction
Cr Coral RossGardiner Ward, including parts of Hawthorn, Hawthorn East, Camberwell and Glen Iris
First elected: March 2002Mayor: 2007–08, 2013–14 and 2014–15Mayor’s offi ce: 9278 4457
T 9835 7842M 0438 005 225E [email protected]
Cr Jim ParkeBellevue Ward, including most of Kew East and part of Balwyn North
First elected: October 2012
T 9835 7840M 0419 333 333E [email protected]
Cr Judith VoceCotham Ward, including parts of Kew, Kew East, Deepdene, parts of Balwyn and Balwyn North
First elected: March 1999 Re-elected: October 2012Mayor: March 2003–March 2004, March 2004–November 2004
T 9835 7841M 0409 887 097E [email protected]
Cr Steve HurdGlenferrie Ward, representing Hawthorn and Hawthorn West
First elected: October 2012
T 9835 7849M 0417 708 182E [email protected]
Our Councillors Council is responsible for the stewardship and corporate governance of the organisation. In October 2012, the Boroondara community elected this Council for a four-year-term. The city is divided into 10 wards, represented by one Councillor in each ward. The 10 Councillors are the elected representatives of all residents and ratepayers across the City. They are responsible for setting the strategic direction of the municipality, developing policy, identifying service standards and monitoring the performance of the organisation.

26
The
Yea
r In
Rev
iew
Our
Co
unci
lO
ur P
eop
leO
ur P
erfo
rman
ceC
orp
. Go
vern
ance
Fina
ncia
lsR
efer
ence
sIn
tro
duc
tio
n
Cr Jack WegmanJunction Ward, including parts of Hawthorn East, Camberwell and Canterbury
First elected: March 2002Mayor: 2004 –05, 2005–06, 2008–09, 2009–10 and 2012–13
T 9813 4749M 0438 011 665E [email protected]
Cr Heinz KreutzLynden Ward, including parts of Camberwell, Glen Iris and Canterbury
First elected: March 2002Mayor: 2011–12
T 9835 7844M 0438 006 656E [email protected]
Cr Jane AddisMaling Ward, including parts of Canterbury, Surrey Hills and Balwyn
First elected: October 2012
T 9835 7845M 0409 267 902E [email protected]
Cr Philip MallisMaranoa Ward, including parts of Balwyn, Balwyn North and Mont Albert
First elected: October 2012
T 9835 7846M 0418 564 410E [email protected]
Our Councillors (continued)
CITY OF BOROONDARA ANNUAL REPORT 2014–15CITY OF BOROONDARA ANNUAL REPORT 2014–15
27
The Year In R
eviewO
ur Co
uncilO
ur Peo
ple
Our P
erform
anceC
orp
. Go
vernanceFinancials
References
Introd
uction
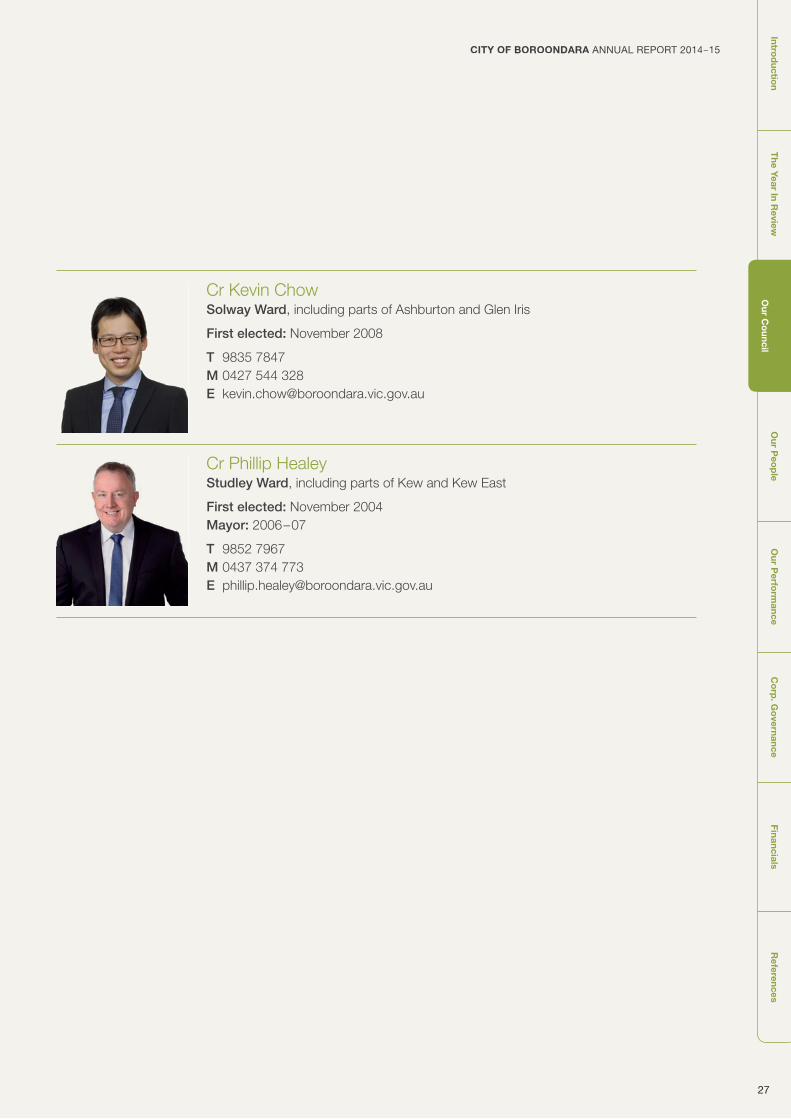
Cr Kevin ChowSolway Ward, including parts of Ashburton and Glen Iris
First elected: November 2008
T 9835 7847M 0427 544 328E [email protected]
Cr Phillip HealeyStudley Ward, including parts of Kew and Kew East
First elected: November 2004Mayor: 2006–07
T 9852 7967M 0437 374 773E [email protected]

28
The
Yea
r In
Rev
iew
Our
Co
unci
lO
ur P
eop
leO
ur P
erfo
rman
ceC
orp
. Go
vern
ance
Fina
ncia
lsR
efer
ence
sIn
tro
duc
tio
n

CITY OF BOROONDARA ANNUAL REPORT 2014–15
29
The Year In R
eviewO
ur Co
uncilO
ur Peo
ple
Our P
erform
anceC
orp
. Go
vernanceFinancials
References
Introd
uction
29
Our People
30 Organisational structure
33 Council staff
35 Equal Employment Opportunity Program
35 Other staff matters

30
The
Yea
r In
Rev
iew
Our
Co
unci
lO
ur P
eop
leO
ur P
erfo
rman
ceC
orp
. Go
vern
ance
Fina
ncia
lsR
efer
ence
sIn
tro
duc
tio
n
Phillip StorerChief Executive Offi cerT 9278 4455
Senior offi cers reporting directly to the Chief Executive Offi cer:
John LuppinoDirector City Planning T 9278 4800
Areas of responsibility: – Building services – Statutory planning – Local laws – Strategic planning.
Carolyn McCleanDirector Community DevelopmentT 9278 4600
Areas of responsibility: – Family, youth and recreation – Health, active ageing and disability – Library, arts and cultural services – Community planning and development.
Marilyn Kearney Director Corporate Services T 9278 4300
Areas of responsibility: – Finance and corporate planning – People, culture and development – Commercial and property services – Information technology – Economic development – Legal services.
Organisational structureCouncil is the governing body that appoints a Chief Executive Offi cer (CEO). The CEO has responsibility for the day-to-day management of the organisation. The CEO, four Directors and an Executive Manager form an Executive Leadership Team to lead the organisation.

CITY OF BOROONDARA ANNUAL REPORT 2014–15CITY OF BOROONDARA ANNUAL REPORT 2014–15
31
The Year In R
eviewO
ur Co
uncilO
ur Peo
ple
Our P
erform
anceC
orp
. Go
vernanceFinancials
References
Introd
uction
Senior offi cers reporting directly to the Chief Executive Offi cer:
Bruce DobsonDirector Environment and Infrastructure T 9278 4500
Areas of responsibility: – Traffi c and transport – Projects and strategy – Asset management – Infrastructure services – Parks and gardens – Environment and sustainable living – Innovation.
Deb GandertonExecutive Manager Communications and EngagementT 9278 4490
Areas of responsibility: – Communications – Engagement and research – Customer service.

32
The
Yea
r In
Rev
iew
Our
Co
unci
lO
ur P
eop
leO
ur P
erfo
rman
ceC
orp
. Go
vern
ance
Fina
ncia
lsR
efer
ence
sIn
tro
duc
tio
n
Executive Manager Communications and EngagementDEB GANDERTON
Communication StrategyANDREW BIRKS
Customer ServiceCOLEEN CARTWRIGHT
Community Engagement PHIL COYNE
Creative ServicesSCOTT ALEXANDER
Director Community DevelopmentCAROLYN McCLEAN
Health, Ageing and Disability ServicesNICK LUND
Community Planning and DevelopmentDR HELEN MOLNAR
Library, Arts and Cultural ServicesJENNY RUFFY
Family, Youthand RecreationKYLIE MUSSARED
People, Culture and DevelopmentLUCIA GIAGNORIO
Corporate SolicitorSALLY WANSBROUGH
Projects and StrategyCHARLES TURNER
Traffi c and TransportJIM HONDRAKIS
Director Environment and InfrastructureBRUCE DOBSON
Asset Management DAVID ELSON
Infrastructure ServicesGEORGE BATSAKIS(Acting Manager)
Environment and Sustainable LivingADAM HALL
Innovation LeaderROWENA MORROW
Parks and GardensMARK DORNAU
Director Corporate ServicesMARILYN KEARNEY
Finance and Corporate PlanningGREG HALL
Commercial and Property ServicesCHRIS HURLEY
Information TechnologyDAVID BELLCHAMBERS
Economic DevelopmentFIONA BANKS
Statutory PlanningSIMON MITCHELL
Building ServicesASANKA KODIKARA
Strategic PlanningZORAN JOVANOVSKI
Local LawsMICHAEL SOMERVILLE
Director City PlanningJOHN LUPPINO
The Senior Leadership Team (SLT) includes the Executive Leadership Team and all department managers. SLT has a broad skill set and gender, age, sector and geographical diversity, contributing to the strength of the administration. There are 22 department managers and other key areas of focus. The structure of SLT as at 30 June 2015.
Organisational structure (continued)
Chief Executive Offi cer PHILLIP STORER
GovernanceDAVID THOMPSON

CITY OF BOROONDARA ANNUAL REPORT 2014–15CITY OF BOROONDARA ANNUAL REPORT 2014–15
33
The Year In R
eviewO
ur Co
uncilO
ur Peo
ple
Our P
erform
anceC
orp
. Go
vernanceFinancials
References
Introd
uctionCouncil staff
A summary of full time equivalent (FTE) Council staff by organisational structure, employment type and gender.
Full Time Equivalent (FTE)
Employmenttype/gender CEO’s Offi ce City Planning
Community Development
Corporate Services
Environment and Infrastructure
Communications and Engagement
Permanent FT – F 6.0 46.0 105.7 48.6 35.0 13.0
Permanent FT – M 3.0 46.0 20.9 36.0 178.0 7.0
Permanent PT – F 0.8 18.8 119.5 21.2 9.9 7.0
Permanent PT – M 0.6 12.4 17.2 1.3 4.3 2.5
Casual – F 1.4 0.0 13.9 4.3 0.0 3.6
Casual – M 0.1 1.9 2.4 1.2 0.0 0.0
Total 11.9 125.1 279.6 112.6 227.2 33.1
Legend: FT – Full time PT – Part time F – Female M – Male
Staff by directorate (Number of employees)Permanent FT – FPermanent FT – M
Permanent PT – FPermanent PT – M
Casual – FCasual – M
CEO's Office
6.0
3.0
0.8
0.6
1.4
0.1
City Planning
46.0
46.0
18.8
12.4
0.0
1.9
CorporateServices
4.3
48.6
36.0
21.2
1.3 1.2
CommunityDevelopment
2.4
105.
7
20.9
119.
5
17.2
13.9
0
50
100
150
200
Environment andInfrastructure
0.0
0.0
35.0
9.9
178.
0
4.3
Communicationsand Engagement
13.0
7.0
7.0
0.0
2.5
3.6

34
The
Yea
r In
Rev
iew
Our
Co
unci
lO
ur P
eop
leO
ur P
erfo
rman
ceC
orp
. Go
vern
ance
Fina
ncia
lsR
efer
ence
sIn
tro
duc
tio
n
Employment classifi cation Female FTE Male FTE Total FTE
Band 1 14.1 8.6 22.7
Band 2 3.5 9.4 12.9
Band 3 55.7 41.8 97.5
Band 4 120.2 41.1 161.3
Band 5 79.4 27.0 106.4
Band 6 64.0 39.7 103.7
Band 7 18.2 12.9 31.1
Band 8 7.4 2.0 9.4
Band not applicable 92.1 152.4 244.5
Total 454.6 334.9 789.5
Staff by classification and gender (Number of employees)
0
50
100
150
200
300
250
Band 6Band 5Band 4Band 3Band 2Band 1
TotalFemaleMale
14.1
22.7
3.5 9.4
12.9
55.7
41.9
97.5 12
0.2
41.1
161.
3
79.4 10
6.4
27.0
64.0
39.7
103.
7
Band 7
18.2
12.9 31
.1
Band 8
7.4
9.4
8.6
2.0
Band N/A
92.1
244.
4
152.
4
Council staff (continued)
A summary of full time equivalent (FTE) staff categorisedby employment classifi cation and gender.

CITY OF BOROONDARA ANNUAL REPORT 2014–15CITY OF BOROONDARA ANNUAL REPORT 2014–15
35
The Year In R
eviewO
ur Co
uncilO
ur Peo
ple
Our P
erform
anceC
orp
. Go
vernanceFinancials
References
Introd
uctionEqual Employment
Opportunity Program Other staff matters
Council has an established Equal Employment Opportunity Program designed to eliminate discrimination and promote equal opportunity.The Program ensures there is no discrimination relating to the characteristics listed under the Equal Opportunity Act 2010 such as race, colour, sex, marital status, parenthood, physical or mental impairment, age, religious or political affi liation.Further objectives include ensuring the workplaceis free from bullying and harassment.
Indicators that measure the effectiveness of the Program and the results for the year are:
– Indicator: Percentage of new employees receiving Equal Employment Opportunity in the Workplace Policy on commencement. Target: 100%.Result: 100%
– Indicator: Existing employees receiving refresher equal opportunity training at least every two years. Training received in March 2013
– Indicator: Number of contact offi cers per number of council offi ce locations. Target: 1:1. Result: Four locations, seven contact offi cers
– Indicator: EEO Contact Offi cers receiving refresher contact offi cer training at least every two years. Training received August 2013.
The Equal Employment Opportunity Committee (EEO Contact offi cers) monitors the indicators and meets regularly to promote employee and management awareness, consider relevant issues and contribute to resolution and advice. The Committee met four times during the year and discussed issues regarding domestic violence, White Ribbon Day, age discrimination, bullying and harassment and cultural differences. The Committee featured in the January edition of Council’s Boroondara Magazine (staff newsletter). The article introduced the contact offi cers to staff and provided information about their role and location. Names and contact details of contact offi cers are published on the intranet and staff noticeboardsto ensure all staff can access support.
Local Area Workplace Agreements (LAWAs)Ten Local Area Workplace Agreements (LAWAs) and one Enterprise Agreement (EA) were negotiated during 2014–15. An intensive communications program was delivered to support staff throughout the bargaining process. A total of 660 staff voted on the agreements, with 97% of staff voting to support the fi nal collective agreement.
Leadership developmentLeadership roundtables were held in December and March to provide an opportunity for leaders to participate in strategic learning activities. They contributed ideas to organisational initiatives including the development of a mentoring program, revisionof the Performance Review and Enhancement Program and working with Swinburne Universityon a collaboration project.
Health and wellbeingCouncil’s health and wellbeing program offered staff a range of activities to get fi t, stay in shape and enjoy life.
During 2014–15, as part of the LifeBalance program,a Healthy Habits Challenge was conducted to promote physical health at work and home. More than 140 staff formed 29 teams for the six-week challenge. Staff took on a new healthy habit each week to improve their health and wellbeing.
The LifeBalance program included the following events throughout the year:
– Pilates and yoga
– Gym membership benefi ts
– Massage and refl exology
– Superannuation and private healthcover consultations
– Put a spring in your step
– STEPtember
– Personal self defence sessions
– Your brain matters seminar
– Men’s Formula Health Checks
– Mental health seminar
– Holiday eating seminar
– Boot Camp sessions
– Time management information session.


37
Our performance
38 Planning and accountability
39 Council Plan
40 Theme 1: Strong and engaged communities
47 Theme 2: Sustainable environment
50 Theme 3: Enhanced amenity
54 Theme 4: Quality facilities and assets
58 Theme 5: Responsible management

38
The
Yea
r In
Rev
iew
Our
Co
unci
lO
ur P
eop
leO
ur P
erfo
rman
ceC
orp
. Go
vern
ance
Fina
ncia
lsR
efer
ence
sIn
tro
duc
tio
n
Planning and accountabilityCouncil’s short, medium and long term plans are infl uenced by community feedback, research and government policy.
Our planning and reporting framework ensures our strategies and fi nancial resources are aligned to deliver the Council Plan 2013–17.
Our ongoing monitoring and reporting of performance through monthly, quarterly, and annual reports ensures we are accountable, transparent and comply with legislation.
Planning Reporting
External environment
Adopted strategiesand plans
Ongoing Services
Long term vision and plan Our Boroondara –
Our City our Future
Community engagement and research
Annual Plan and Annual Budget
PREPBi-annual reviews
Quarterly reportingto ELT
Service profi les
Annual strategies and plans reporting
Monthly Report
Quarterly PerformanceReport
Annual Report
Department business plans and service plans (PREP)
Performance Review and Enhancement Program
Outcome: Community Wellbeing
Strategic Resource Plan/LTFS
Council PlanCouncil Plan
Strategic objectives Strategic indicators

CITY OF BOROONDARA ANNUAL REPORT 2014–15CITY OF BOROONDARA ANNUAL REPORT 2014–15
39
The Year In R
eviewO
ur Co
uncilO
ur Peo
ple
Our P
erform
anceC
orp
. Go
vernanceFinancials
References
Introd
uctionCouncil Plan
Boroondara’s Council Plan outlines its vision and strategic plan for the Council term. The plan commits to long-term planning in building capacity in many areas, continuing to revitalise our City, focusingon our community services and tangible infrastructure and asset renewal projects.
The Annual Plan 2014–15 outlines Council’s commitments in support of the strategic objectives and other adopted strategies and plans.
Themes Strategic objectives
Strong and engaged communities
– Our community has a say in matters of interest to them in achievingBoroondara’s vision
– Community needs are identifi ed and responses planned accordingly
– Opportunities are provided to enable people in our community to besupported and involved.
Sustainable environment
– Our natural and urban environment is improved in a sustainable way.
Enhanced amenity
– The character of our neighbourhoods is protected and improved.
Quality facilitiesand assets
– The community’s current and future needs for assets and facilitiesare proactively managed.
Responsible management
– Decision-making in the delivery of high quality services by capableand professional people refl ects transparent, accountable and fair practices
– Sound fi nancial and risk management practices are carried out.
The Council Plan outlines Themes which are informed by the Our Boroondara – Our City Our Future document as key focus areas for the four-year Council term and these themes are supported by Council’s strategic objectives. The strategic objectives describe how Council’s vision and mission are achieved andare monitored by strategic indicators.
How we are measuredOur performance is reported against each theme in four ways:
1. Results of strategic indicators in the Council Plan
2. Progress of major initiatives in the Budget
3. Performance of services funded in the Budget
4. Results of prescribed service performance indicators and measures.

Results of strategic indicators in the Council Plan:
Strategic indicator2013–14 Result
2014–15 Target
2014–15 Result
2015–16 Target
Strategic objective
Our community has a say in matters of interest to them in achieving Boroondara’s vision.
Percentile ranking of community satisfaction with consultation and engagement measured through the annual Victorian Government Community Satisfaction Survey.
63 64 621000
64
The result of 62 is within the margin of error (+/- 4.4%) for results received in 2013 (62), 2014 (63), so may not indicate a change in community perception. The breakdown of responses by segments indicates that there is no demographic group (by age or region within the municipality)where the variation is signifi cant (greater than +/- 4 index points).
Strategic objective
Community needs are identifi ed and responses planned accordingly.
Applicants’ satisfaction with annual grants information and procedures.
90% 90% 90%1000
90%
Strategic objective
Opportunities are provided to enable people in our community to be supported and involved.
Number of members of the BoroondaraBusiness Network.
1,780 1,800 1,9101000
1,850
Percentage of users satisfi ed with trainingand support initiatives for local business.
80% 80% 80%1000
80%
Number of young people attendingYouth Services programs or services.
2,357 3,000 3,6611000
3,000
Proportion of infants born that receiveprimary immunisations.
92% 90% 92%1000
90%
Participant satisfaction with BoroondaraMaternal and Child Health service.
94% 97% 99%1000
95%
Proportion of registered premises that are inspected annually as required by the Food Act 1984 and the Public Health and Wellbeing Act 2008.
100% 100% 100%1000
100%
Percentage of clients satisfi ed with Homeand Community Care (HACC) services.
98% 90% 95%1000
92%
Percentage satisfaction of hire facilitiesfor events at the Kew Court House.
95% 95% 100%1000
90%
Percentage of Boroondara residents who are active borrowers.
32% 32% 30%1000
30%
Increased tendency for families to use only one library membership card rather than individual member cards. This result is lower than anticipated statistics. This strategic indicator does not capture borrowers’ use of other library services, such as programs, activities and use of the Library’s database and hardware. This fi gure is calculated from the residential membership categories active in last 36 months.
Results of strategic indicators in the Council Plan:
Strategic indicator2013–14 Result
2014–15 Target
2014–15 Result
2015–16 Target
Strategic objective
Our community has a say in matters of interest to them in achieving Boroondara’s vision.
Percentile ranking of community satisfaction withconsultation and engagement measured throughthe annual Victorian Government CommunitySatisfaction Survey.
63 64 621000
64
The result of 62 is within the margin of error (+/- 4.4%) for results received in 2013 (62), 2014 (63), so may not indicate a change in community perception. The breakdown of responses by segments indicates that there is no demographic group (by age or region within the municipality)where the variation is signifi cant (greater than +/- 4 index points).
Strategic objective
Community needs are identifi ed and responses planned accordingly.
Applicants’ satisfaction with annual grantsinformation and procedures.
90% 90% 90%1000
90%
Strategic objective
Opportunities are provided to enable people in our community to be supported and involved.
Number of members of the BoroondaraBusiness Network.
1,780 1,800 1,9101000
1,850
Percentage of users satisfi ed with trainingand support initiatives for local business.
80% 80% 80%1000
80%
Number of young people attendingYouth Services programs or services.
2,357 3,000 3,6611000
3,000
Proportion of infants born that receiveprimary immunisations.
92% 90% 92%1000
90%
Participant satisfaction with BoroondaraMaternal and Child Health service.
94% 97% 99%1000
95%
Proportion of registered premises that are inspectedannually as required by the Food Act 1984 and the Public Health and Wellbeing Act 2008.
100% 100% 100%1000
100%
Percentage of clients satisfi ed with Homeand Community Care (HACC) services.
98% 90% 95%1000
92%
Percentage satisfaction of hire facilitiesfor events at the Kew Court House.
95% 95% 100%1000
90%
Percentage of Boroondara residents who are active borrowers.
32% 32% 30%1000
30%
Increased tendency for families to use only one library membership card rather than individual member cards. This result is lower than anticipated statistics. This strategic indicator does not capture borrowers’ use of other library services, such as programs, activities and use of the Library’s database and hardware. This fi gure is calculated from the residential membership categories active in last 36 months.
40
The
Yea
r In
Rev
iew
Our
Co
unci
lO
ur P
eop
leO
ur P
erfo
rman
ceC
orp
. Go
vern
ance
Fina
ncia
lsR
efer
ence
sIn
tro
duc
tio
n
Theme 1:Strong and engaged communities

CITY OF BOROONDARA ANNUAL REPORT 2014–15
Strategic indicator2013–14 Result
2014–15 Target
2014–15 Result
2015–16 Target
Number of community events programmed by Arts and Culture.
65 50 1191000
55
The number of events exceeded target due to the fi rst year of programming at the Hawthorn Arts Centre, the start of a dedicated community cultural development program, and the one-off Gallipoli and Beyond project to mark the centenary of the Gallipoli landing and World War One. With this in mind, the 2015–16 target is expected to be lower.
Progress of major initiatives in the Budget:
Major initiative Responsible Directorate Status
Continue to improve Council’s online, mobile and digital service offer by implementing priority Digital Plan 2014–17 actions including web chat, snap send solve premium service, improved navigation and information architecture to keep in step with community expectations.
Continue to enrich the arts and cultural lifeof the Boroondara community by implementation of the second year actions from the HawthornArts Centre Business Plan.
Performance of services funded in the Budget:
Service category Description Net CostActual
BudgetVariance
$’000
Communicationsand Engagement
– leads a customer responsiveness culture across Council – enhances and protect City of Boroondara’s reputation – develops integrated communication plans for key initiatives linked
to the Council Plan– delivers advocacy campaigns in collaboration with the responsible
Director, CEO and Councillors – undertakes a corporate research program to inform improved
service outcomes – creates and maintains a broad range of information sources to assist
customer responsiveness – provides an in-house print and design service – provides an in-house writing, editing and digital media service – provides translation service and supports multilingual communications.
$2,500$2,591
($91)
Library Services – provides a large range of relevant, contemporary library collectionsand services: in libraries, online and via home library services
– provides welcoming community spaces for individual and group study, refl ection, activity and discovery
– promotes, advocating for and supporting literacy development, reader development, lifelong learning, creative and intellectual development
– provides family, children and adult library programs and activities.
$5,932$5,959
($27)
CITY OF BOROONDARA ANNUAL REPORT 2014–15
Strategic indicator2013–14 Result
2014–15 Target
2014–15 Result
2015–16 Target
Number of community events programmedby Arts and Culture.
65 50 1191000
55
The number of events exceeded target due to the fi rst year of programming at the Hawthorn Arts Centre, the start of a dedicated community cultural development program, and the one-off Gallipoli and Beyond project to mark the centenary of the Gallipoli landing and World War One. With this in mind, the 2015–16 target is expected to be lower.
Progress of major initiatives in the Budget:
Major initiative Responsible Directorate Status
Continue to improve Council’s online, mobile anddigital service offer by implementing priority DigitalPlan 2014–17 actions including web chat, snapsend solve premium service, improved navigationand information architecture to keep in step withcommunity expectations.
Continue to enrich the arts and cultural lifeof the Boroondara community by implementationof the second year actions from the HawthornArts Centre Business Plan.
Performance of services funded in the Budget:
Service category Description Net CostActual
BudgetVariance
$’000
Communicationsand Engagement
– leads a customer responsiveness culture across Council – enhances and protect City of Boroondara’s reputation – develops integrated communication plans for key initiatives linked
to the Council Plan– delivers advocacy campaigns in collaboration with the responsible
Director, CEO and Councillors– undertakes a corporate research program to inform improved
service outcomes– creates and maintains a broad range of information sources to assist
customer responsiveness– provides an in-house print and design service– provides an in-house writing, editing and digital media service – provides translation service and supports multilingual communications.
$2,500$2,591
($91)
Library Services – provides a large range of relevant, contemporary library collectionsand services: in libraries, online and via home library services
– provides welcoming community spaces for individual and group study, refl ection, activity and discovery
– promotes, advocating for and supporting literacy development, reader development, lifelong learning, creative and intellectual development
– provides family, children and adult library programs and activities.
$5,932$5,959
($27)
41
The Year In R
eviewO
ur Co
uncilO
ur Peo
ple
Our P
erform
anceC
orp
. Go
vernanceFinancials
References
Introd
uction

Progress of major initiatives in the Budget:
Service category Description Net CostActual
BudgetVariance
$’000
Community Planning and Development
– actively works within the community on key community development activities– facilitates community connectedness, strengthening community capacity and
responding to identifi ed needs through the delivery of a range of programs, partnerships and networking opportunities for Boroondara’s community
– develops policies, strategies and plans that address community priorities– monitors, forecasts and analyses community change and wellbeing– undertakes extensive community research on behalf of Council departments
and the community– prepares Council submissions in response to Australian and Victorian
government enquiries and advocates on social issues impactingon the community
– manages the Boroondara Community Grants Program of annual and operational triennial grants
– promotes, supports and assists the development of volunteering and civic participation through the Boroondara Volunteer Resource Centre.
$2,852$2,883
($31)
Family andYouth Services
– operates Boroondara Maternal and Child Health, Kindergarten Central Enrolment Scheme and Kew Occasional Child Care
– supports the inclusion of children into kindergarten and long day careservices through the provision of the Preschool Field Offi cer and inclusion support programs
– facilitates long day care, occasional care and kindergarten services throughthe provision of 43 buildings leased to the community and volunteer committees of management
– advocates on behalf of young people, children and their families – provides support and information, activities and programs to young people
and their families – facilitates training and support for service providers and voluntary committees
of management for early years and youth services – undertakes strategic planning and policy development to facilitate access
to active participation opportunities for the Boroondara community– facilitates the development of integrated and coordinated services for children,
young people and their families – facilitates community support programs through the provision of annual funding
in a deed of agreement with Camcare.
$3,150$3,192
($42)
Health,Active Ageingand Disability Services
– coordinates public health services including immunisationand environmental health
– provides home support services via the Active Service Modelapproach including home, personal and respite care, food servicesand property maintenance
– provides volunteer and community transport, and social support(including events and planned activity groups)
– coordinates emergency management (recovery) across the municipality – manages Canterbury Memorial Home Units (23 independent living units)– undertakes strategy and development with a focus on positive ageing
and disability (including Metroaccess).
$3,955$4,513($558)
Progress of major initiatives in the Budget:
Service category Description Net CostActual
BudgetVariance
$’000
CommunityPlanning andDevelopment
– actively works within the community on key community development activities– facilitates community connectedness, strengthening community capacity and
responding to identifi ed needs through the delivery of a range of programs, partnerships and networking opportunities for Boroondara’s community
– develops policies, strategies and plans that address community priorities– monitors, forecasts and analyses community change and wellbeing– undertakes extensive community research on behalf of Council departments
and the community– prepares Council submissions in response to Australian and Victorian
government enquiries and advocates on social issues impactingon the community
– manages the Boroondara Community Grants Program of annual and operational triennial grants
– promotes, supports and assists the development of volunteering and civic participation through the Boroondara Volunteer Resource Centre.
$2,852$2,883
($31)
Family andYouth Services
– operates Boroondara Maternal and Child Health, Kindergarten Central Enrolment Scheme and Kew Occasional Child Care
– supports the inclusion of children into kindergarten and long day careservices through the provision of the Preschool Field Offi cer and inclusion support programs
– facilitates long day care, occasional care and kindergarten services throughthe provision of 43 buildings leased to the community and volunteercommittees of management
– advocates on behalf of young people, children and their families – provides support and information, activities and programs to young people
and their families– facilitates training and support for service providers and voluntary committees
of management for early years and youth services– undertakes strategic planning and policy development to facilitate access
to active participation opportunities for the Boroondara community– facilitates the development of integrated and coordinated services for children,
young people and their families– facilitates community support programs through the provision of annual funding
in a deed of agreement with Camcare.
$3,150$3,192
($42)
Health,Active Ageingand Disability Services
– coordinates public health services including immunisationand environmental health
– provides home support services via the Active Service Modelapproach including home, personal and respite care, food servicesand property maintenance
– provides volunteer and community transport, and social support(including events and planned activity groups)
– coordinates emergency management (recovery) across the municipality – manages Canterbury Memorial Home Units (23 independent living units)– undertakes strategy and development with a focus on positive ageing
and disability (including Metroaccess).
$3,955$4,513($558)
42
The
Yea
r In
Rev
iew
Our
Co
unci
lO
ur P
eop
leO
ur P
erfo
rman
ceC
orp
. Go
vern
ance
Fina
ncia
lsR
efer
ence
sIn
tro
duc
tio
n

CITY OF BOROONDARA ANNUAL REPORT 2014–15
Performance of services funded in the Budget:
Service category Description Net CostActual
BudgetVariance
$’000
Arts and Culture – produces arts and cultural programs and events for the community – programs and manages arts and cultural facilities at the Town Hall Gallery,
Kew Court House and Hawthorn Arts Centre – provides funding support for community arts and culture groups.
$1,910$1,785
$125
Economic Development
– strengthens the viability of local businesses, including strip shopping centres– facilitates the Boroondara Business Network, the Boroondara Farmers Market
and the Hawthorn Craft Market– supports new and established businesses, through training
and mentor services– facilitates regular networking opportunities for the local business community.
$603$626($23)
Results of other service performance indicators and measures:
Service/indicator/measure Result Material variations
Libraries
Utilisation
Library collection usage
(Number of library collection item loans / Number of library collection items)
5 Boroondara Library Service (BLS) has 500,619 items and it is the largest public library collection for loan in the state. In size, it is second only to the reference collection at the State Library of Victoria. During the year, 2,414,142 library collection item loans were issued.
Resource standard
Standard of library collection
(Number of library collection items purchased in the last 5 years / Numberof library collection items)
48% The Boroondara Library Service collection is current and also retains a depth of collection that meets the needs of its community. Due to the size of the BLS collection, the impact of collection development purchasing over the 5 year period is lower than the collections of other library services, resulting in a lower percentage outcome.
Service cost
Cost of library service
(Direct cost to Council of the library service / Number of visits)
$7 The result is related to the expanded Boroondara libraries located in Ashburton and Camberwell to meet community demand for the delivery of the library service includinglibrary programs.
Participation
Active library members
(Percentage of active library members / Municipal population)
23% This result does not measure active library members which is due to the increased tendency for families to use only one card rather than individual member cards.
CITY OF BOROONDARA ANNUAL REPORT 2014–15
Performance of services funded in the Budget:
Service category Description Net CostActual
BudgetVariance
$’000
Arts and Culture – produces arts and cultural programs and events for the community– programs and manages arts and cultural facilities at the Town Hall Gallery,
Kew Court House and Hawthorn Arts Centre – provides funding support for community arts and culture groups.
$1,910$1,785
$125
EconomicDevelopment
– strengthens the viability of local businesses, including strip shopping centres– facilitates the Boroondara Business Network, the Boroondara Farmers Market
and the Hawthorn Craft Market– supports new and established businesses, through training
and mentor services– facilitates regular networking opportunities for the local business community.
$603$626($23)
Results of other service performance indicators and measures:
Service/indicator/measure Result Material variations
Libraries
Utilisation
Library collection usage
(Number of library collection item loans / Number of library collection items)
5 Boroondara Library Service (BLS) has 500,619 items andit is the largest public library collection for loan in the state.In size, it is second only to the reference collection at theState Library of Victoria. During the year, 2,414,142 librarycollection item loans were issued.
Resource standard
Standard of library collection
(Number of library collection itemspurchased in the last 5 years / Numberof library collection items)
48% The Boroondara Library Service collection is current andalso retains a depth of collection that meets the needs of its community. Due to the size of the BLS collection, theimpact of collection development purchasing over the 5 yearperiod is lower than the collections of other library services,resulting in a lower percentage outcome.
Service cost
Cost of library service
(Direct cost to Council of the libraryservice / Number of visits)
$7 The result is related to the expanded Boroondara librarieslocated in Ashburton and Camberwell to meet communitydemand for the delivery of the library service includinglibrary programs.
Participation
Active library members
(Percentage of active library members / Municipal population)
23% This result does not measure active library members whichis due to the increased tendency for families to use only onecard rather than individual member cards.
43
The Year In R
eviewO
ur Co
uncilO
ur Peo
ple
Our P
erform
anceC
orp
. Go
vernanceFinancials
References
Introd
uction

Service/indicator/measure Result Material variations
Maternal and Child Health (MCH)
Satisfaction
Participation in fi rst MCH home visit
(Number of fi rst MCH home visits / Number of birth notifi cations received)
104% Results higher than 100% are due to a small percentage of parents who reside outside of the municipality but stay with extended family for a short period of time after the birth of their baby (e.g cultural confi nement). Council does not receive the birth notifi cation however does conduct the fi rst home visit if the child is presently staying in the municipality.
Service standard
Infant enrolments in MCH service
(Number of infants enrolled in the MCH service (from birth notifi cations received) / Number of birth notifi cations received
100% Boroondara MCH continues to have a 100% infant enrolment, as also noted in previous years.
Service cost
Cost of the MCH service
(Cost to council of the MCH service / Hours worked by MCH nurses)
N/A This measure is not required to be reported until the fi nancial year beginning 1 July 2015.
Participation
Participation in the MCH service
(Number of children who attend the MCH service at least once (in the year) / Number of children enrolled in theMCH service
83% Annual result includes children who were not due fora Key Ages and Stages visit this fi nancial year.
Participation in MCH service byAboriginal children
(Number of Aboriginal children who attend the MCH service at least once (in the year) / Number of Aboriginal children enrolled in the MCH service
87% These children are aged between 0–3.5 years. MCH is not a compulsory service and participation in this service for all participants decreases as they grow older. Therefore this is an excellent participation rate.
Food safety
Timeliness
Time taken to action food complaints
(Number of days between receipt and fi rst response action for all food complaints / Number of food complaints)
N/A This measure is not required to be reported until the fi nancial year beginning 1 July 2015.
Service standard
Food safety assessments
(Number of registered class 1 food premises and class 2 food premises that receive an annual food safety assessment in accordance with the Food Act 1984 / Number of registered class 1 food premises and class 2 food premises that require an annual food safety assessment in accordance with the Food Act 1984)
100% The Victorian Food Act 1984 requires that all businesses requiring registration under this Act are inspected for compliance at least once every calendar year.
Service/indicator/measure Result Material variations
Maternal and Child Health (MCH)
Satisfaction
Participation in fi rst MCH home visit
(Number of fi rst MCH home visits / Number of birth notifi cations received)
104% Results higher than 100% are due to a small percentageof parents who reside outside of the municipality but staywith extended family for a short period of time after the birthof their baby (e.g cultural confi nement). Council does not receive the birth notifi cation however does conduct the fi rst home visit if the child is presently staying in the municipality.
Service standard
Infant enrolments in MCH service
(Number of infants enrolled in the MCHservice (from birth notifi cations received) / Number of birth notifi cations received
100% Boroondara MCH continues to have a 100% infantenrolment, as also noted in previous years.
Service cost
Cost of the MCH service
(Cost to council of the MCH service / Hours worked by MCH nurses)
N/A This measure is not required to be reported until the fi nancialyear beginning 1 July 2015.
Participation
Participation in the MCH service
(Number of children who attend theMCH service at least once (in the year) / Number of children enrolled in theMCH service
83% Annual result includes children who were not due fora Key Ages and Stages visit this fi nancial year.
Participation in MCH service byAboriginal children
(Number of Aboriginal children whoattend the MCH service at least once (inthe year) / Number of Aboriginal childrenenrolled in the MCH service
87% These children are aged between 0–3.5 years. MCH is nota compulsory service and participation in this service for allparticipants decreases as they grow older. Therefore this isan excellent participation rate.
Food safety
Timeliness
Time taken to action food complaints
(Number of days between receiptand fi rst response action for all food complaints / Number of food complaints)
N/A This measure is not required to be reported until the fi nancialyear beginning 1 July 2015.
Service standard
Food safety assessments
(Number of registered class 1 foodpremises and class 2 food premises thatreceive an annual food safety assessmentin accordance with the Food Act 1984/ Number of registered class 1 foodpremises and class 2 food premises thatrequire an annual food safety assessment in accordance with the Food Act 1984)
100% The Victorian Food Act 1984 requires that all businessesrequiring registration under this Act are inspected for compliance at least once every calendar year.
44
The
Yea
r In
Rev
iew
Our
Co
unci
lO
ur P
eop
leO
ur P
erfo
rman
ceC
orp
. Go
vern
ance
Fina
ncia
lsR
efer
ence
sIn
tro
duc
tio
n

CITY OF BOROONDARA ANNUAL REPORT 2014–15
Service/indicator/measure Result Material variations
Service cost
Cost of food safety service
(Direct cost of the food safety service / Number of food premises registeredor notifi ed in accordance with theFood Act 1984)
$601 The City of Boroondara Food Safety service is provided as part of a larger public and environmental health service and it is estimated that offi cers spent 65% of their time on food safety related activities.
Health and safety
Critical and major non-compliance notifi cations
(Number of critical non-compliance notifi cations and major non-compliance notifi cations about a food premises followed up / Number of criticalnon-compliance notifi cations andmajor non-compliance notifi cationsabout food premises)
91% Council has a risk management strategy in place to ensure that all food premises are inspected annually and that any critical or major non-compliance is appropriately addressed. The time frame given to food business proprietors toaddress non-compliance varies depending on the issue identifi ed and operates on a time series that does not necessarily fi t within a fi nancial year. There are many circumstances where a food business is inspected in one fi nancial year and, based on food safety risk, a follow up inspection is scheduled within the next fi nancial year.Council is compliant with the requirements as set out bythe Food Act 1984.
Home and Community Care (HACC)
Timeliness
Time taken to commencethe HACC service
(Number of days between the referral of a new client and commencement of HACC service / Number of new clients who have received a HACC service)
N/A This measure is not required to be reported until thefi nancial year beginning 1 July 2015.
Service standard
Compliance with Community Care Common Standards
(Number of Community Care Common Standards expected outcomes met / Number expected outcomes under the Community Care Common Standards)
94% Our Home and Community Care (HACC) program is subjected to an independent audit commissioned bythe Australian Government Department of Health andAgeing every three years. The last audit was conductedin December 2013. A total of 18 standards wereassessed with Council achieving an exceptional resultof 17 out of 18. All recommended and suggested improvements have been implemented and, as such, Council expects to achieve 100% at the next audit.
Service cost
Cost of domestic care service
(Number of people that received a HACC service / Municipal target population for HACC services)
N/A This measure is not required to be reported until thefi nancial year beginning 1 July 2015.
Cost of personal care service
(Cost of the personal care service / Hours of personal care service delivered)
N/A This measure is not required to be reported until thefi nancial year beginning 1 July 2015.
CITY OF BOROONDARA ANNUAL REPORT 2014–15
Service/indicator/measure Result Material variations
Service cost
Cost of food safety service
(Direct cost of the food safety service / Number of food premises registeredor notifi ed in accordance with theFood Act 1984)
$601 The City of Boroondara Food Safety service is provided aspart of a larger public and environmental health service andit is estimated that offi cers spent 65% of their time on foodsafety related activities.
Health and safety
Critical and major non-compliancenotifi cations
(Number of critical non-compliancenotifi cations and major non-compliance notifi cations about a food premisesfollowed up / Number of criticalnon-compliance notifi cations andmajor non-compliance notifi cationsabout food premises)
91% Council has a risk management strategy in place to ensure that all food premises are inspected annually and that anycritical or major non-compliance is appropriately addressed.The time frame given to food business proprietors toaddress non-compliance varies depending on the issueidentifi ed and operates on a time series that does not necessarily fi t within a fi nancial year. There are manycircumstances where a food business is inspected in onefi nancial year and, based on food safety risk, a follow upinspection is scheduled within the next fi nancial year.Council is compliant with the requirements as set out bythe Food Act 1984.
Home and Community Care (HACC)
Timeliness
Time taken to commencethe HACC service
(Number of days between the referral of anew client and commencement of HACCservice / Number of new clients who havereceived a HACC service)
N/A This measure is not required to be reported until thefi nancial year beginning 1 July 2015.
Service standard
Compliance with Community Care Common Standards
(Number of Community Care CommonStandards expected outcomes met / Number expected outcomes under theCommunity Care Common Standards)
94% Our Home and Community Care (HACC) program issubjected to an independent audit commissioned bythe Australian Government Department of Health andAgeing every three years. The last audit was conductedin December 2013. A total of 18 standards wereassessed with Council achieving an exceptional resultof 17 out of 18. All recommended and suggestedimprovements have been implemented and, as such,Council expects to achieve 100% at the next audit.
Service cost
Cost of domestic care service
(Number of people that received a HACCservice / Municipal target population forHACC services)
N/A This measure is not required to be reported until thefi nancial year beginning 1 July 2015.
Cost of personal care service
(Cost of the personal care service / Hoursof personal care service delivered)
N/A This measure is not required to be reported until thefi nancial year beginning 1 July 2015.
45
The Year In R
eviewO
ur Co
uncilO
ur Peo
ple
Our P
erform
anceC
orp
. Go
vernanceFinancials
References
Introd
uction

Service/indicator/measure Result Material variations
Cost of respite care service
(Cost of the respite care service /Hours of respite care service delivered)
N/A This measure is not required to be reported until the fi nancial year beginning 1 July 2015.
Participation
Participation in HACC service
(Number of people that receiveda HACC service / Municipal target population for HACC services)
25% It should be noted that not all people over the age of 65 within the target population will be eligible for HACC services. Additionally, residents within the target population may be accessing other non-Government funded aged care related services to assist them to remain living in their own homes. This indicator only measures the provision of domestic assistance, personal care and respite care. The City of Boroondara also provides other HACC services, including food services, planned activity groups and home maintenance. The total number of eligible residents provided with HACC services during the year was 3,689 or 41 per cent of the municipal target population for HACC services. Of the total number of City of Boroondara residents who received HACC services, 2,303 received domestic assistance and/or personal care and/or respite care.
Participation in HACC service by Culturally and Linguistically Diverse (CALD) people
(Number of CALD people who receive a HACC service / Municipal target population in relation to CALD peoplefor HACC services)
23% It should be noted that not all people over the age of 65 within the target population will be eligible for HACC services. Additionally, residents within the target population may be accessing other non-Government funded agedcare related services to assist them to remain living in their own homes. This indicator only measures the provisionof domestic assistance, personal care and respite care.The City of Boroondara also provides other HACCservices, including food services, planned activity groups and home maintenance.
Service/indicator/measure Result Material variations
Cost of respite care service
(Cost of the respite care service /Hours of respite care service delivered)
N/A This measure is not required to be reported until the fi nancialyear beginning 1 July 2015.
Participation
Participation in HACC service
(Number of people that receiveda HACC service / Municipal targetpopulation for HACC services)
25% It should be noted that not all people over the age of 65 within the target population will be eligible for HACCservices. Additionally, residents within the target populationmay be accessing other non-Government funded agedcare related services to assist them to remain living in theirown homes. This indicator only measures the provision of domestic assistance, personal care and respite care. TheCity of Boroondara also provides other HACC services,including food services, planned activity groups andhome maintenance. The total number of eligible residentsprovided with HACC services during the year was 3,689or 41 per cent of the municipal target population for HACCservices. Of the total number of City of Boroondara residentswho received HACC services, 2,303 received domesticassistance and/or personal care and/or respite care.
Participation in HACC service byCulturally and Linguistically Diverse(CALD) people
(Number of CALD people who receivea HACC service / Municipal targetpopulation in relation to CALD peoplefor HACC services)
23% It should be noted that not all people over the age of 65 within the target population will be eligible for HACCservices. Additionally, residents within the target populationmay be accessing other non-Government funded agedcare related services to assist them to remain living in theirown homes. This indicator only measures the provisionof domestic assistance, personal care and respite care.The City of Boroondara also provides other HACCservices, including food services, planned activity groupsand home maintenance.
46
The
Yea
r In
Rev
iew
Our
Co
unci
lO
ur P
eop
leO
ur P
erfo
rman
ceC
orp
. Go
vern
ance
Fina
ncia
lsR
efer
ence
sIn
tro
duc
tio
n

CITY OF BOROONDARA ANNUAL REPORT 2014–15CITY OF BOROONDARA ANNUAL REPORT 2014–15
47
The Year In R
eviewO
ur Co
uncilO
ur Peo
ple
Our P
erform
anceC
orp
. Go
vernanceFinancials
References
Introd
uction
Results of strategic indicators in the Council Plan:
Strategic indicator2013–14 Result
2014–15 Target
2014–15 Result
2015–16 Target
Strategic objective
Our natural and urban environment is improved in a sustainable way.
Tonnes of CO2 emissions from energy usedin all Council owned and operated buildings,street lighting, Council fl eet, taxi and air travel.
Note: *Information is reported with a one year lag.
23,866tCO2e*
Less than 24,000tCO2e
23,604tCO2e
1000
Less than 23,500tCO2e
Waste diversion from landfi ll, calculated as the proportion of the overall kerbside waste stream that is recycled (includes paper, bottles and green waste) instead of being disposed to landfi ll.
53% 53% 50%1000
48%
The reduction in recycling material is mainly attributed to a reduced number of hard copy newspapers being sold due to the availability of online newspapers. Furthermore, glass and plastic bottles have lighter weights hence tonnages are less. This is a trend in the sector as a whole.
Customer Satisfaction Survey measures user satisfaction with a range of parks in Boroondara, benchmarked with 17 other councils.
85% 82% 80%1000
83%
The sample size has a margin of error of <+/- 2% at a 95% confi dence level. There is no statistically signifi cant difference between the actualand the target.
Progress of major initiatives in the Budget:
Major Initiative Responsible Directorate Status
Contribute to future waterway health and more resilient green spaces by assessing the feasibility and relative priority of opportunities for water sensitive urban design (WSUD) infrastructure across the municipality.
Improve biodiversity outcomes through implementing year one of the revegetation of future biodiversity zones outlined in the Biodiversity Asset Management Plan.
Theme 2:Sustainable environment
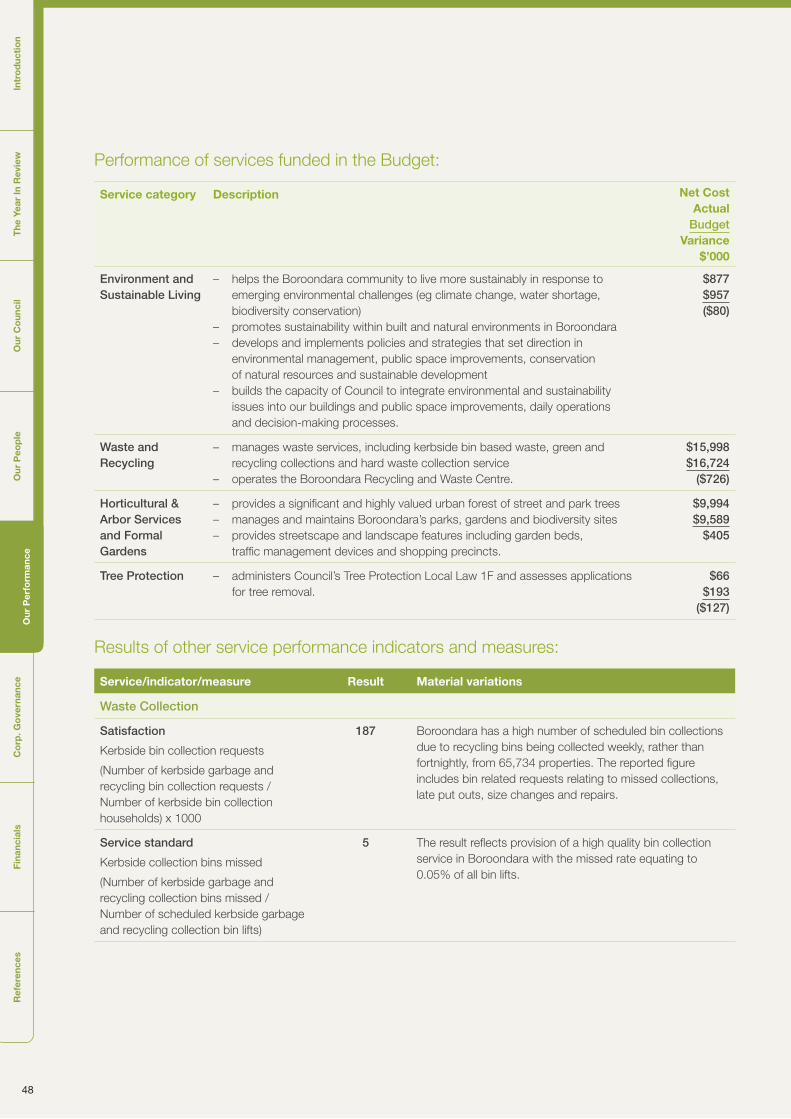
48
The
Yea
r In
Rev
iew
Our
Co
unci
lO
ur P
eop
leO
ur P
erfo
rman
ceC
orp
. Go
vern
ance
Fina
ncia
lsR
efer
ence
sIn
tro
duc
tio
n
Performance of services funded in the Budget:
Service category Description Net CostActual
BudgetVariance
$’000
Environment and Sustainable Living
– helps the Boroondara community to live more sustainably in response to emerging environmental challenges (eg climate change, water shortage, biodiversity conservation)
– promotes sustainability within built and natural environments in Boroondara – develops and implements policies and strategies that set direction in
environmental management, public space improvements, conservationof natural resources and sustainable development
– builds the capacity of Council to integrate environmental and sustainability issues into our buildings and public space improvements, daily operationsand decision-making processes.
$877$957($80)
Waste and Recycling
– manages waste services, including kerbside bin based waste, green and recycling collections and hard waste collection service
– operates the Boroondara Recycling and Waste Centre.
$15,998$16,724
($726)
Horticultural & Arbor Services and Formal Gardens
– provides a signifi cant and highly valued urban forest of street and park trees – manages and maintains Boroondara’s parks, gardens and biodiversity sites– provides streetscape and landscape features including garden beds,
traffi c management devices and shopping precincts.
$9,994$9,589
$405
Tree Protection – administers Council’s Tree Protection Local Law 1F and assesses applications for tree removal.
$66$193
($127)
Results of other service performance indicators and measures:
Service/indicator/measure Result Material variations
Waste Collection
Satisfaction
Kerbside bin collection requests
(Number of kerbside garbage and recycling bin collection requests / Number of kerbside bin collection households) x 1000
187 Boroondara has a high number of scheduled bin collections due to recycling bins being collected weekly, rather than fortnightly, from 65,734 properties. The reported fi gure includes bin related requests relating to missed collections, late put outs, size changes and repairs.
Service standard
Kerbside collection bins missed
(Number of kerbside garbage and recycling collection bins missed /Number of scheduled kerbside garbage and recycling collection bin lifts)
5 The result refl ects provision of a high quality bin collection service in Boroondara with the missed rate equating to 0.05% of all bin lifts.

CITY OF BOROONDARA ANNUAL REPORT 2014–15CITY OF BOROONDARA ANNUAL REPORT 2014–15
49
The Year In R
eviewO
ur Co
uncilO
ur Peo
ple
Our P
erform
anceC
orp
. Go
vernanceFinancials
References
Introd
uction
Service/indicator/measure Result Material variations
Service cost
Cost of kerbside garbage bincollection service
(Direct cost of the kerbside garbage bin collection service / Number of kerbside garbage collection bins)
$108 The reported result is calculated with reference to all direct costs of the weekly kerbside garbage collection service relative to the number of bins.
Cost of kerbside recyclables bin collection service
(Direct cost of the kerbside recyclables bin collection service / Number of kerbside recyclables collection bins)
$26 Boroondara provides a weekly, rather than fortnightly, recyclables collection service for its community. The cost of the service if partly offset by income received for the recyclables collected
Council awarded a new contract for the recyclables service in June 2015, ensuring the community will continue to receive a high quality service at best value.
Waste diversion
Kerbside collection waste divertedfrom landfi ll
(Weight of recyclables and green organics collected from kerbside bins / Weight of garbage, recyclables and green organics collected from kerbside bins)
47% Council maintains a strong focus on reducing the amount of waste going to landfi ll. A decrease in consumption and associated disposal of paper in recycling bins, along with lighter weight glass and plastics, is resulting in lower weights overall being collected in recycling bins, hereby impactingon the reported result.

50
The
Yea
r In
Rev
iew
Our
Co
unci
lO
ur P
eop
leO
ur P
erfo
rman
ceC
orp
. Go
vern
ance
Fina
ncia
lsR
efer
ence
sIn
tro
duc
tio
n
Results of strategic indicators in the Council Plan:
Strategic indicator2013–14 Result
2014–15 Target
2014–15 Result
2015–16 Target
Strategic objective
The character of our neighbourhood is protected and improved.
Percentage of building permits approvedwithin 30 days.
99% 95% 93%1000
95%
The Senior Building Surveyor position was vacant since July 2014 and was fi lled in April 2015. This position is primarily responsible for assessing building permit applications and as a result the target in the second quarter was not met, affecting the overall annual result. The results for last two quarters were 100%.
Percentage of planning applications processed within 60 days.
85% 80% 76%1000
75%
The end of year result was below the target largely due to the processing of record numbers of applications during the year. The percentage of planning applications processed within 60 days during the last quarter was 81%. The fi gure excludes applications to amend permits.
Percentage of graffi ti removed from Council owned assets within 48 hours of notifi cation.
96% 93% 93%1000
95%
Progress of major initiatives in the Budget:
Major initiative Responsible Directorate Status
Maintain and enhance valued neighbourhood character by undertaking consultation and further consideration of the residential controls proposed under Planning Scheme Amendment C190.
Maintain and enhance valued neighbourhood character by undertaking consultation and further consideration of the residential controls proposed under Planning Scheme Amendment C190.
Performance of services funded in the Budget:
Service category Description Net CostActual
BudgetVariance
$’000
Traffi c andTransport
– develops, assesses and implements engineering solutions that addressthe amenity of residential and commercial areas
– implements parking and traffi c management strategies – assesses traffi c and parking implications of planning permit
and rezoning applications– assesses lane and parking bay occupation applications, street party
applications and road closure applications– investigates black spot accident locations and development of treatment
solutions to address any safety issues – coordinates and implements sustainable transport initiatives including
Car Share, TravelSmart programs and green travel plans, and improvementsto the City’s bicycle and pedestrian network.
$644
$1,310($666)
Theme 3:Enhanced amenity

CITY OF BOROONDARA ANNUAL REPORT 2014–15CITY OF BOROONDARA ANNUAL REPORT 2014–15
51
The Year In R
eviewO
ur Co
uncilO
ur Peo
ple
Our P
erform
anceC
orp
. Go
vernanceFinancials
References
Introd
uction
Service category Description Net CostActual
BudgetVariance
$’000
Landscape Architecture
– provides landscape design and urban design services to promote use,function and enjoyment of outdoor spaces by the community.
$501$525($24)
Strategic Planning – advocates for and prepares land use policy and standards withinthe context of Victorian state policy
– promotes sustainable design and development and heritage conservation– manages the Municipal Strategic Statement– develops policies and plans to guide land use and development.
$1,653$1,807($154)
Building Services – assesses building permit applications, conducting mandatory inspectionsand issuing occupancy permits/fi nal certifi cates for buildings and structures
– encourages desirable building design outcomes for amenity protectionand to maintain consistent streetscapes
– provides property hazard and building permit history information to designers, solicitors, private building surveyors and ratepayers
– conducts property safety inspections including fi re safety audits on high risk buildings and pool and spa safety barrier compliance inspections to ensurea safer built environment
– administers and enforces the Building Act and Regulations including investigation of illegal and dangerous buildings to ensure publicand occupant safety.
$475$689
($214)
Statutory Planning – processes and assesses planning applications in accordance with thePlanning and Environment Act 1987, the Boroondara Planning Schemeand Council policies
– provides advice about development and land use proposals as wellas providing information to assist the community in its understandingof these proposals
– investigates non-compliances with planning permits and the Boroondara Planning Scheme and takes appropriate enforcement action when necessary
– defends Council planning decisions at the Victorian Civiland Administrative Tribunal
– assesses applications to subdivide land or buildings underthe Subdivision Act 1988.
$4,325$4,201
$124
Local Laws – delivers proactive patrol programs to maintain and promote safetyand harmony within the community
– delivers administrative and fi eld services in parking, amenityand animal management
– processes and issues permits relating to traders, tradespersons, disabled parking, residential parking, animal registrations, excess animals, commercial waste bins, street furniture and other uses of Council controlled land
– delivers educational programs in responsible pet ownership, road safety, amenity regulation and fi re prevention
– develops, implement and review appropriate local laws to achieve a safeand liveable environment
– delivers the School Crossing Supervision Program through the provision of supervision at school crossings and the overall management and administration of the program.
($5,703)($5,110)
($593)

52
The
Yea
r In
Rev
iew
Our
Co
unci
lO
ur P
eop
leO
ur P
erfo
rman
ceC
orp
. Go
vern
ance
Fina
ncia
lsR
efer
ence
sIn
tro
duc
tio
n
Results of other service performance indicators and measures:
Service/indicator/measure Result Material variations
Statutory Planning
Timeliness
Time taken to decide planning applications
(The median number of days between receipt of a planning application anda decision on the application)
86 The median number of days for processing planning applications includes time taken by applicants to respond to requests for further information and to complete public notifi cation. The average net number of days to process a planning application is 43 for the year. This measure does not evidence the effi ciency in dealing with planning applications because it includes processing steps over which Council does not have controls.
Service standard
Planning applications decided within60 days
(Number of planning application decisions made within 60 days / Number of planning application decisions made)
69% The end of year result was impacted by the processing of record numbers of applications during the year. The number of planning applications processed exceeded the long term average by 27%.
Service cost
Cost of statutory planning service
(Direct cost of the statutory planning service / Number of planningapplications received)
$3,388 The cost of the Statutory Planning service has been impacted by the need for additional resources to processthe signifi cant increase in application numbers received leading up to the introduction of new residential zonesin Boroondara.
Delays in planning approval of the zones by the previous Planning Minister combined with the transitional provisions introduced caused a signifi cant spike in planning applications attempting to subvert the outcomesthe zones were intended to achieve.
Decision making
Planning decisions upheld at VCAT
(Number of VCAT decisions that did not set aside council’s decision in relation to a planning application / Number of VCAT council decisions in relation to planning applications)
58% The fi gure excludes withdrawal of appeals by appellantsand consent orders based on amended plans negotiatedby Council.

CITY OF BOROONDARA ANNUAL REPORT 2014–15CITY OF BOROONDARA ANNUAL REPORT 2014–15
53
The Year In R
eviewO
ur Co
uncilO
ur Peo
ple
Our P
erform
anceC
orp
. Go
vernanceFinancials
References
Introd
uction
Service/indicator/measure Result Material variations
Animal management
Timeliness
Time taken to action animalmanagement requests
(Number of days between receipt and fi rst response action for all management related requests)
3 High priority animal management requests such as dog attacks and stray animal pickups are responded to within24 hours of receipt of the request.
Service standard
Animals reclaimed
(Number of animals reclaimed / Number of animals collected)
71% The majority of reclaimed animals was dogs while cats represented 82% of the unclaimed animals. From Council’s experience this outcome is likely to refl ect the numberof un-owned cats that exist within the community.
Service cost
Cost of animal management service
(Direct cost of the animal management service / Number of registered animals)
$53 Council provides an extensive animal managementservice to the residents and the 19,380 registered animals. The fi gure includes resources, pound costs, legal costs and administrative costs relating to the provision of animal management service.
Health and safety
Animal management prosecutions
(Number of successful animal management prosecutions)
23 Council actively promotes compliance and responsible pet ownership. As part of our educative approach, maintaining accountability and regard for public interest and safety, Council pursues matters through the Magistrates’Court as may be appropriate.

54
The
Yea
r In
Rev
iew
Our
Co
unci
lO
ur P
eop
leO
ur P
erfo
rman
ceC
orp
. Go
vern
ance
Fina
ncia
lsR
efer
ence
sIn
tro
duc
tio
n
Results of strategic indicators in the Council Plan:
Strategic indicator2013–14 Result
2014–15 Target
2014–15 Result
2015–16 Target
Strategic objective
The character of our neighbourhood is protected and improved.
Percentage completion of six monthly defect inspections on Council roads and footpathsin higher risk locations.
100% 99% 100%1000
99%
Percentage of capital projects completed at the conclusion of the fi nancial year (based on number of projects).
95% 90% 93%1000
90%
Percentage of adopted capital projects completed at the conclusion of the fi nancial year (based on the most recent amended budget).
90% 90% 93%1000
90%
Number of proactive strip shopping centre maintenance inspections completed.
191 150 1621000
150
Percentage of users satisfi ed with the Boroondara leisure and aquatic centres.
87% 85% 87%1000
85%
Progress of major initiatives in the Budget:
Major initiative Responsible directorate Status
Support an increase of early years programs by commencing the construction of the Craig Family Centre Early Years facility.
Commence development of an exciting new public space for the community adjacent to the Hawthorn Arts Centre at 350 Burwood Road, Hawthorn.
Enhance access to leisure and recreation facilities by completion of the Ashburton Pool and Recreation Centre Renewal Project.
14.2 Provide improved health and gymnasium facilities for local residents by commencing construction on expanded facilities at the Boroondara Sports Complex.
Theme 4:Quality facilities and assets

CITY OF BOROONDARA ANNUAL REPORT 2014–15CITY OF BOROONDARA ANNUAL REPORT 2014–15
55
The Year In R
eviewO
ur Co
uncilO
ur Peo
ple
Our P
erform
anceC
orp
. Go
vernanceFinancials
References
Introd
uction
Performance of services funded in the Budget:
Service category Description Net CostActual
BudgetVariance
$’000
Asset Management
– provides proactive inspections on Council assets to ensure service standards are maintained
– provides a corporate Asset Management system to support the ongoing management and renewal of the community’s assets
– develops and updates the fi ve-year renewal program for assets– develops the fi nancial forecast for assets for Council’s long-term
fi nancial strategy– promotes occupational health and safety on Council worksites– manages permits relating to the asset protection local law
and stormwater drainage– implements the Street Lighting Policy– implements strategies and engineering solutions for drainage issues,
planning and subdivision permit referrals and development approvals.
$2,651$3,100($449)
Projectsand Strategy
– develops, manages, reports and delivers the approved Environmentand Infrastructure Capital Works and Building Renewal Programs ensuringbest value for money
– provides project management and technical advice on Council’s projectsand infrastructure assets
– manages the capital works programs and reporting to successfully deliver projects on time and within budget
– investigates and develops strategic solutions for major stormwater issues, Council buildings and infrastructure assets
– encourages and develops innovative design into quality outcomes.
$4,108$4,376($268)
Asset Maintenance
– maintains the City’s infrastructure including buildings, footpaths and roads, shopping centres, drains, street furniture and signs.
$9,477$9,803
($326)
Leisure and Sport – operates the Kew Traffi c School – facilitates recreation and sport activities through the provision of 75 leased
facilities to sporting clubs and committees of management – facilitates training and support for service providers and voluntary committees
of management for sporting activities – manages the contracts for Boroondara Leisure and Aquatic Centres,
the Boroondara Tennis Centre and Junction Skate and BMX Park .
($541)($650)$109
Sportsgroundand Park Assets
– works with over 300 sports clubs, across 23 sports codes at over100 sports facilities/grounds
– manages and maintains built assets including playgrounds, barbeques, drinking fountains, park furniture, bins, fences and signs
– manages and maintains the Freeway Golf Course.
$2,327$2,395
($68)

56
The
Yea
r In
Rev
iew
Our
Co
unci
lO
ur P
eop
leO
ur P
erfo
rman
ceC
orp
. Go
vern
ance
Fina
ncia
lsR
efer
ence
sIn
tro
duc
tio
n
Results of other service performance indicators and measures:
Service/indicator/measure Result Material variations
Roads
Satisfaction
Sealed local road requests
(Number of sealed local road requests / Kilometres of sealed local roads) x 100
55 The reported result is based on the number of requests logged in Council’s Customer Request System and includes all requests relates to the 581km of local roads thatCouncil manages.
Condition
Sealed local roads below theintervention level
(Number of kilometres of sealed local roads below the renewal interventionlevel set by Council / Kilometres ofsealed local roads)
99% Council maintains strong focus on asset renewal, including local roads. Risk and condition inspection and assessments are regularly undertaken. The reported result is based on the road pavement condition index calculated from Council’s Pavement Management System.
Service cost
Cost of sealed local road reconstruction
(Direct cost of sealed local road reconstruction / Square metres of sealed local roads reconstructed)
$89 Council’s asset renewal processes determine which local roads will be reinstated each year. The works are undertaken by contractors following a competitive procurement process. Individual road reconstruction costs can vary depending on the extent of reconstruction specifi ed for each project.
Cost of sealed local road resealing
(Direct cost of sealed local roadresealing / Square metres of sealedlocal roads resealed)
$37 Council uses a variety of treatments as appropriate for the resurfacing or resealing of its roads including slurry seals, rejuvenation treatments and asphalt overlays, each of which vary in cost. The typical road profi le of many of Boroondara’s old roads contribute to the additional costs of undertaking road resurfacing works.
Satisfaction
Satisfaction with sealed local roads
(Community satisfaction rating out of 100 with how Council has performed on the condition of sealed local roads)
74% Community satisfaction on the condition of local sealed roads is a signifi cant 19 points higher than the State-wide average and fi ve points higher than the metropolitan group average.
Aquatic facilities
Satisfaction
User satisfaction with aquatic facilities.
(Defi ned as the satisfaction of users with the aquatic facility)
87% User satisfaction levels are captured by the CERM Performance Indicator Customer Service Quality survey which is administered by the Division of Business atthe University of South Australia. Three separate setsof performance indicators are used to inform results:Customer Service Quality, Customer Benefi ts and Operational Management. This is the only national benchmark for public sports and leisure facilities,run annually to ensure currency and relevance.

CITY OF BOROONDARA ANNUAL REPORT 2014–15CITY OF BOROONDARA ANNUAL REPORT 2014–15
57
The Year In R
eviewO
ur Co
uncilO
ur Peo
ple
Our P
erform
anceC
orp
. Go
vernanceFinancials
References
Introd
uction
Service/indicator/measure Result Material variations
Service standard
Health inspections of aquatic facilities
(Number of authorised offi cer inspections of Council aquatic facilities / Numberof Council aquatic facilities)
0.25 YMCA must ensure compliance with all relevant Statutory or Regulatory requirements while managing and operating Council’s aquatic facilities. This includes ensuring aquatic areas are maintained and managed in accordance with Public Health and Wellbeing Regulations (Part 6 – Aquatic Facilities). Documented water quality testing, including microbiological testing, is frequently undertaken (A daily, weekly, monthly and quarterly testing regime is in place).Key Performance Indicator reports are provided to Council by YMCA on a monthly basis which include water quality test outcomes. Centre duty managers monitor and signoff on the daily testing undertaken.
Reportable safety incidentsat aquatic facilities
(Total number of WorkSafe reportable aquatic facility safety incidents)
3 There are four aquatic and leisure centres operating which on average equates to less than one incident per centre.
Service cost
Cost of indoor aquatic facilities
(Direct cost of indoor aquatic facilitiesless income received / Number of visitsto outdoor aquatic facilities)
-$0.57 Council has four aquatic facilities (Ashburton Pool and Recreation Centre, Boroondara Sports Complex, Hawthorn Aquatic & Leisure Centre, Kew Recreation Centre) whichare managed and operated by YMCA under contract.
Cost of indoor aquatic facilities
(Direct cost of outdoor aquatic facilities less income received / Number of visitsto outdoor aquatic facilities)
N/A Not applicable to Boroondara. As per the LGV defi nition, Boroondara has no outdoor aquatic facilities.
Utilisation
Utilisation of aquatic facilities
(Number of visits to aquatic facilities / Municipal population)
15 Total visitations were higher in 2014–15 than previous years due to Hawthorn Aquatic and Leisure Centre being back in operation for a full year after a total redevelopment (this facility was closed for most of the previous two year period).

58
The
Yea
r In
Rev
iew
Our
Co
unci
lO
ur P
eop
leO
ur P
erfo
rman
ceC
orp
. Go
vern
ance
Fina
ncia
lsR
efer
ence
sIn
tro
duc
tio
n
Results of strategic indicators in the Council Plan:
Strategic indicator2013–14 Result
2014–15 Target
2014–15 Result
2015–16 Target
Strategic objective
Decision-making in the delivery of high quality services by capable and professional people refl ects transparent, accountable and fair behaviours.
Percentage of Freedom of Information requests responded to within prescribed timeframes.
100% 100% 100%1000
100%
Percentage of electronic document management system action requests completed within service charter timeframes.
95% 92% 93%1000
92%
Average time callers wait before their callis answered.
29 seconds < 35 seconds 37 seconds1000
< 35 seconds
The call wait time was due to the high volumes of customer contacts that were handled during the third quarter. Industry target 60 seconds.
WorkCover employer performance rating. 0.53 Less than 1 (better than
industry average)
0.72 (better than industry
average) 1000
Less than 1(better than
industryaverage)
Strategic objective
Sound fi nancial and risk management practices are carried out.
Adjusted Working Capital Ratio – measuresthe ability to pay existing liabilities in the next12 months.
1.67 to 1 > 1.20 to 1 1.80 to 11000
> 1.20 to 1
Indebtedness – measures total borrowings asa percentage of rates and charges revenue.
41% 36.7% 37.4%1000
33.11%
The annual target was based on Council’s loan borrowings strategy prior to Council resolving to retire some debt over a shorter term with lower interest rate costs. As a result Council refi nanced an existing loan in 2014–15 and plans to repay the outstanding balance in full by 2018–19.
Renewal gap – comparison of the rate of spending on existing assets through renewing, restoring and replacing existing assets with depreciation.
1.72 1.52 1.761000
1.49
Percentage completion of Audit Committeeannual plan.
100% 95% 100%1000
95%
Progress of major initiatives in the Budget:
Major initiative Responsible directorate Status
Develop a customer experience improvement strategy to ensure delivery of value and serviceto ratepayers.
Enhance responsiveness to our residents through upgrading Council’s Document Management System and introduction of a Customer Relationship Management System (CRM).
Theme 5:Responsible management

CITY OF BOROONDARA ANNUAL REPORT 2014–15CITY OF BOROONDARA ANNUAL REPORT 2014–15
59
The Year In R
eviewO
ur Co
uncilO
ur Peo
ple
Our P
erform
anceC
orp
. Go
vernanceFinancials
References
Introd
uction
Performance of services funded in the Budget:
Service category Description Net CostActual
BudgetVariance
$’000
Councillors, Chief Executive Offi cer, Executive Management and support staff
This area includes the Mayor, Councillors, Chief Executive Offi cer and Executive Management team and associated support.
$2,436$2,339
$97
Governance – provides counsel to Council, Councillors, the Chief Executive Offi cerand the Executive Management Group
– develops and implements strategies and policies– manages Freedom of Information, Information Privacy, protected disclosures
and internal ombudsman functions– maintains statutory registers, authorisations and delegations– administer the conduct of Council elections– provides administrative and secretarial support to the elected Councillors
and Council committees– provides stewarding and catering services to the Camberwell function rooms– coordinates civic events and citizenship ceremonies.
$1,722$1,846($124)
Innovation – encourages thinking differently about the problems and opportunitiesthe community faces to create new ways of working together
– promotes innovation in our work through activities such as an online ideas portal called iThink, innovation challenges and other events.
$356$262$94
Business Development
– develops and delivers the annual planning cycle for the Council Planand Budget
– coordinates departmental business planning for the organisationand manage the planning system
– produces the annual Budget and Long Term Financial Strategy and manages Council’s budgeting/forecasting and fi nancial reporting systems
– manages Council’s reporting system and conducts performance reporting, including the Quarterly Performance Report, Monthly Performance Report, Annual Report and the Best Value Report
– coordinates fi nancial analysis and business cases for projects andprovides advice on the pricing of services as well as National Competition Policy compliance
– provides external grant application support for signifi cant projectfunding opportunities
– provides internal audit services to Council – conducts process improvement reviews and implementation across
all Council departments.
$1,082$1,394($312)

60
The
Yea
r In
Rev
iew
Our
Co
unci
lO
ur P
eop
leO
ur P
erfo
rman
ceC
orp
. Go
vern
ance
Fina
ncia
lsR
efer
ence
sIn
tro
duc
tio
n
Service category Description Net CostActual
BudgetVariance
$’000
People, Culture and Development
• delivers the functions of occupational health and safety, risk management, human resources and organisation development and learning
• provides specialist advice, service and policy development related to human resources and organisation development
• coordinates recruitment, industrial relations, remuneration, award/agreement interpretation and work evaluation
• manages enterprise business risk including occupational health and safety, WorkCover, risk management and insurance including Council’s Disaster Recovery and Business Continuity Plans
• facilitates and coordinates staff members’ professional, leadership and cultural development programs and the Health and Wellbeing Program
• coordinates Council’s employee performance management system.
$4,623$4,084
$539
Corporate Solicitor
• monitors and reports on legislative changes and impacts forCouncil operations
• provides advice on legal and regulatory matters and ad hoc legal advice within the organisation
• delivers training programs to develop Council offi cers’ knowledgeof relevant legal issues.
$177$246($69)
Customer service • delivers customer phone, online, reception and cashiering customerand engagement services.
$1,640$1,658
($18)
Financial Services • coordinates Audit Committee and external audit • manages procurement and conducts of all public tenders • manages fi nancial accounting, accounts payable and receivable
and payroll services • manages rates and property services, including Council databases
and communication of the rate payment options available to residents • administers the purchasing system and purchasing card systems
including training • coordinates fl eet management• coordinates the Building and Property Working Group and handles leasing
and administration of Council’s property holdings including the Camberwell Fresh Food Market.
$2,854$2,810
$44
Information Technology
• coordinates improvements to service delivery to the communityand within Council through the use of technology
• ensures effectiveness and reliability of computingand communication systems
• manages Council’s corporate information and archival services.
$7,387$7,411
($24)

CITY OF BOROONDARA ANNUAL REPORT 2014–15CITY OF BOROONDARA ANNUAL REPORT 2014–15
61
The Year In R
eviewO
ur Co
uncilO
ur Peo
ple
Our P
erform
anceC
orp
. Go
vernanceFinancials
References
Introd
uction
Results of other service performance indicators and measures:
Service/indicator/measure Result Material variations
Governance
Transparency
Council decisions made at meetings closed to the public
(Number of council resolutions made at ordinary or special meetings of council, or at meetings of a special committee consisting only of councillors closed to the public / Number of council resolutions made at ordinary or special meetings of council or at meetings of a special committee consisting only of councillors)
7% The result demonstrates Council’s commitment to openand transparent decision making. During 2014–15, 18 of 26 confi dential resolutions were related to contractual matters. Council formed the view that the premature disclosure of this information was prejudicial to the interests of Council and other persons.
Consultation and engagement
Satisfaction with communityconsultation and engagement
(Community satisfaction ratingout of 100 with how council has performed on communityconsultation and engagement)
62 Victorian Government Community Satisfaction Survey results indicated that our community highly rates Council’s performance. Boroondara’s 2015 result is one point belowour 2014 result, six points higher than the state-wide average and four points higher than the metropolitan group average.
Attendance
Councillor attendance at council meetings
(The sum of the number of councillors who attended each ordinary and special council meeting / (Number of ordinary and special council meetings) x (Number of councillors elected at the last council general election)
85% Councillor attendance is affected by a number of factors including the frequency of meetings, leave of absence granted to Councillors and the well-being of Councillors.
Service cost
Cost of governance
(Direct cost of the governance service / Number of councillors elected a the last council general election)
$50,949 Cost of governance includes operating expenses directly related to the activities of the elected councillors including expenses such as allowances, training and professional development, conferences and seminars, membershipsof professional bodies and other incidental expenses.
Satisfaction
Satisfaction with council decisions
(Community satisfaction rating outof 100 with the performance of councilin making decisions in the interest ofthe community)
62 Boroondara’s satisfaction with council decisions is one point below our 2014 result, however it is seven points higherthan the state-wide average and three points higher thanthe metropolitan group average.


63
Corporate Governance
64 Governance, management and other information
69 Governance and management checklist
72 Statutory information

64
The
Yea
r In
Rev
iew
Our
Co
unci
lO
ur P
eop
leO
ur P
erfo
rman
ceC
orp
. Go
vern
ance
Fina
ncia
lsR
efer
ence
sIn
tro
duc
tio
n
Governance, managementand other information
GovernanceCouncil provides leadership and good governanceto the municipal district and the local community.
Council’s roles include:
– taking into account the diverse needs of the local community in decision-making
– providing leadership by establishing strategic objectives and monitoring achievements
– ensuring resources are managed in a responsible and accountable manner
– advocating the interests of the local communityto other communities and governments
– fostering community cohesion and encouraging active participation in civic life.
We have strong relationships with other tiers of government; neighbouring councils and organisations such as electricity and water distributors.
Formal decision-making processes are conducted through Council meetings and Special Committees. Council delegates the majority of its decision-making to staff, in accordance with adopted Council policies.
Council meetingsCouncil meetings are open to the public and usuallyheld on the fourth Monday of each month. Membersof the community are welcome to attend and observe these meetings, and submit a question to the Council.
In 2014–15, Council held 13 ordinary Council meetings and three Special Council meetings.
Councillor attendance at Council meetings and Special Council meetings during 2014–15:
CouncillorsSpecial Council
MeetingCouncilMeeting Total
Cr Coral Ross (Mayor) 3 13 16
Cr Jane Addis 3 13 16
Cr Kevin Chow1 3 10 13
Cr Phillip Healey2 3 11 14
Cr Steve Hurd 3 12 15
Cr Heinz Kreutz3 2 11 13
Cr Philip Mallis 3 12 15
Cr Jim Parke 3 12 15
Cr Judith Voce4 3 12 15
Cr Jack Wegman5 2 11 13
1 Cr Chow received a leave of absence for three Ordinary meetings on 10 and 17 November and 22 June 2015.2 Cr Healey received a leave of absence for one Ordinary meeting on 22 September 2014.3 Cr Kreutz received a leave of absence for one Ordinary meeting and one special meeting on 11 May 2015 and 25 May 2015.4 Cr Voce received a leave of absence for one Ordinary meeting on 22 September 2014.5 Cr Wegman received a leave of absence for one Ordinary meeting and one special meeting on 11 May 2015 and 25 May 2015.
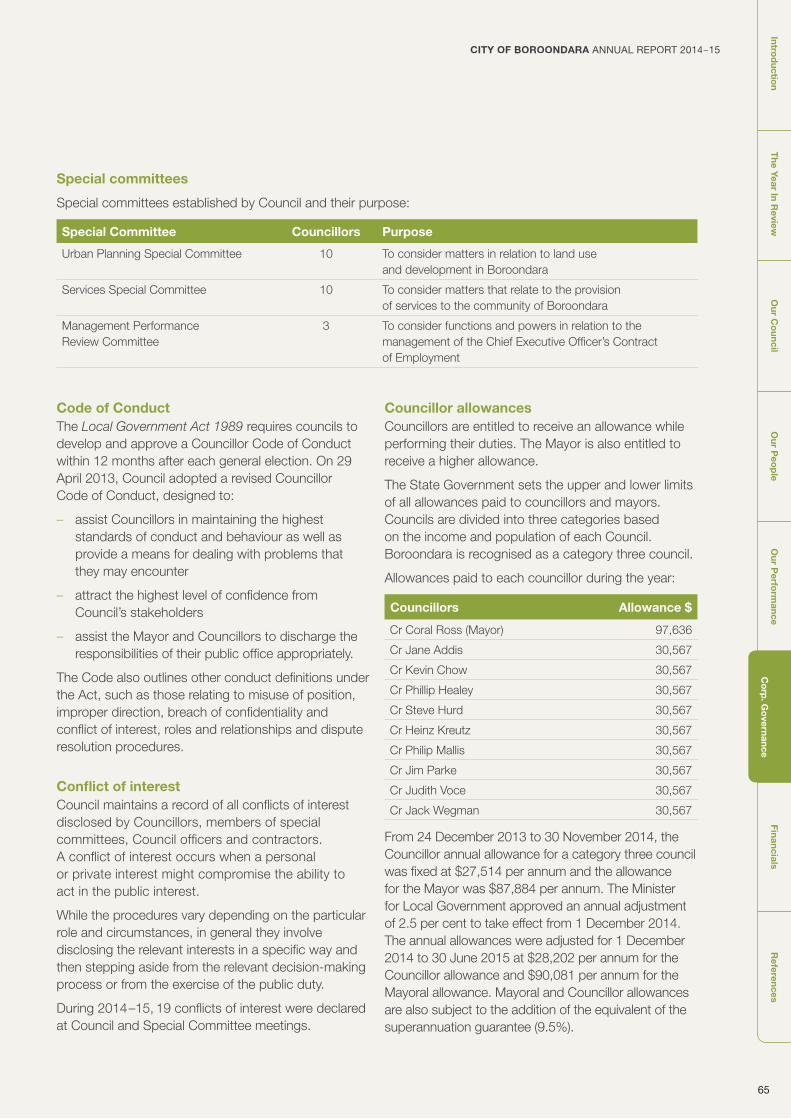
CITY OF BOROONDARA ANNUAL REPORT 2014–15CITY OF BOROONDARA ANNUAL REPORT 2014–15
65
The Year In R
eviewO
ur Co
uncilO
ur Peo
ple
Our P
erform
anceC
orp
. Go
vernanceFinancials
References
Introd
uction
Special committees
Special committees established by Council and their purpose:
Special Committee Councillors Purpose
Urban Planning Special Committee 10 To consider matters in relation to land useand development in Boroondara
Services Special Committee 10 To consider matters that relate to the provisionof services to the community of Boroondara
Management PerformanceReview Committee
3 To consider functions and powers in relation to the management of the Chief Executive Offi cer’s Contractof Employment
Code of ConductThe Local Government Act 1989 requires councils to develop and approve a Councillor Code of Conduct within 12 months after each general election. On 29 April 2013, Council adopted a revised CouncillorCode of Conduct, designed to:
– assist Councillors in maintaining the highest standards of conduct and behaviour as well as provide a means for dealing with problems that they may encounter
– attract the highest level of confi dence from Council’s stakeholders
– assist the Mayor and Councillors to discharge the responsibilities of their public offi ce appropriately.
The Code also outlines other conduct defi nitions under the Act, such as those relating to misuse of position, improper direction, breach of confi dentiality and confl ict of interest, roles and relationships and dispute resolution procedures.
Confl ict of interestCouncil maintains a record of all confl icts of interest disclosed by Councillors, members of special committees, Council offi cers and contractors.A confl ict of interest occurs when a personalor private interest might compromise the ability toact in the public interest.
While the procedures vary depending on the particular role and circumstances, in general they involve disclosing the relevant interests in a specifi c way and then stepping aside from the relevant decision-making process or from the exercise of the public duty.
During 2014–15, 19 confl icts of interest were declared at Council and Special Committee meetings.
Councillor allowancesCouncillors are entitled to receive an allowance while performing their duties. The Mayor is also entitled to receive a higher allowance.
The State Government sets the upper and lower limits of all allowances paid to councillors and mayors. Councils are divided into three categories based on the income and population of each Council. Boroondara is recognised as a category three council.
Allowances paid to each councillor during the year:
Councillors Allowance $
Cr Coral Ross (Mayor) 97,636
Cr Jane Addis 30,567
Cr Kevin Chow 30,567
Cr Phillip Healey 30,567
Cr Steve Hurd 30,567
Cr Heinz Kreutz 30,567
Cr Philip Mallis 30,567
Cr Jim Parke 30,567
Cr Judith Voce 30,567
Cr Jack Wegman 30,567
From 24 December 2013 to 30 November 2014, the Councillor annual allowance for a category three council was fi xed at $27,514 per annum and the allowance for the Mayor was $87,884 per annum. The Minister for Local Government approved an annual adjustment of 2.5 per cent to take effect from 1 December 2014. The annual allowances were adjusted for 1 December 2014 to 30 June 2015 at $28,202 per annum for the Councillor allowance and $90,081 per annum for the Mayoral allowance. Mayoral and Councillor allowances are also subject to the addition of the equivalent of the superannuation guarantee (9.5%).

66
The
Yea
r In
Rev
iew
Our
Co
unci
lO
ur P
eop
leO
ur P
erfo
rman
ceC
orp
. Go
vern
ance
Fina
ncia
lsR
efer
ence
sIn
tro
duc
tio
n
Councillor expensesCouncillors are reimbursed for expenses incurred while performing their duties.
Expenses for 2014–15 year are set out below:
CouncillorsCommunications
$
Transport &parking
$
Travel, vehicle & accommodation
$
Professional Development
$
Otherexpenses
$Total
$
Cr Coral Ross (Mayor) 3,248 1,018 4,796 1,609 1,474 12,145
Cr Jane Addis 1,899 0 918 0 61 2,878
Cr Kevin Chow 2,295 60 0 0 0 2,355
Cr Phillip Healey 1,858 12 0 187 46 2,103
Cr Steve Hurd 2,619 407 2,918 1,190 5,773 12,907
Cr Heinz Kreutz 3,053 181 242 1,153 0 4,629
Cr Philip Mallis 1,955 0 11 100 144 2,210
Cr Jim Parke 994 1,112 0 2,300 612 5,018
Cr Judith Voce 1,899 506 3,392 1,144 1,119 8,060
Cr Jack Wegman 3,405 0 0 0 476 3,881
Other expensesOther expenses include levies and charges and general administration.
Fleet charges and fuelThe Councillor Support and Resources Policy provides that a fully maintained vehicle shall be available to the Mayor and relevant fl eet and fuel expenses are attributed to the Mayor of the day. Total fl eet charges and fuel costs for Mayor Coral Ross are $10,792.

CITY OF BOROONDARA ANNUAL REPORT 2014–15CITY OF BOROONDARA ANNUAL REPORT 2014–15
67
The Year In R
eviewO
ur Co
uncilO
ur Peo
ple
Our P
erform
anceC
orp
. Go
vernanceFinancials
References
Introd
uction
ManagementCouncil has implemented statutory and better practice items to strengthen its management framework. Strong governance and management frameworks lead to better decision making by Council. The Act requires Council to undertake an assessment against a governance and management checklist. Council’s Governance and Management Checklist results are set out in the section below. The following items have been highlighted as important components of the management framework:
Audit CommitteeThe Audit Committee oversees and monitors the effectiveness of Council in carrying out its responsibilities for accountable fi nancial management, good corporate governance, maintaining an effective system of internal control and risk management and fostering anethical environment.
Memberships during 2014–15:
Independent members
Mr Alex Klos November 2014 – current
Mr Andrew Dix May 2015 – current
Ms Claire Filson May 2015 – current
Mr David Ashmore October 2008 – October 2014
Mr Todd Davies May 2012 – May 2015
Ms Beverley Excell May 2013 – May 2015
Councillor members
Cr Phillip Healey November 2014 – Current
Cr Jim Parke November 2012 – Current
Cr Judith Voce November 2012 – Current
Cr Kevin Chow November 2013 – August 2014
The Committee has three independent members and three Councillors. Independent members are Mr Andrew Dix (Chair), Mr Alex Close and Ms Claire Filson. Independent members are appointed for a two year term, with a maximum of three terms. The chairis elected from the independent members.
The Audit Committee meets four times a year.The internal auditors, Chief Executive Offi cer, Director Corporate Services and Manager Commercial and Property Services attend all Audit Committee meetings. Other management representatives attend as required to present reports. The external auditors attend in May and August each year to present the audit plan and independent audit report. Recommendations from each Audit Committee meeting are subsequently reportedto, and considered by Council.
Internal auditCouncil’s internal audit provides independent and objective assurance that the appropriate processes and controls are in place across Council. The department is jointly resourced by an in-house Internal Auditor and an external provider, Crowe Horwath. A risk based three-year Strategic Internal Audit Plan (SIAP) is prepared which considers Council’s risk framework, the Council Plan, the impact of any change on operations, systems or the business environment, prior audit coverage and outcomes and management input. The SIAP is reviewed and approved by theAudit Committee annually.
Internal Auditors attend each Audit Committee meeting to report on the status of the internal audit plan, provide an update on the implementationof audit recommendations and to present fi ndingsof completed reviews. The responsible Directorand Manager for each area reviewed are requiredto attend the Audit Committee meeting to respondto questions in relation to the review.
All audit issues identifi ed in internal audit reports are risk rated. Recommendations are assigned to the responsible Manager and tracked in Council’s performance management system. Managersprovide status updates quarterly which are reviewed by the Internal Auditor and reported to the Executive Leadership Team and the Audit Committee. TheAudit Committee monitors all recommendationsuntil completion.

68
The
Yea
r In
Rev
iew
Our
Co
unci
lO
ur P
eop
leO
ur P
erfo
rman
ceC
orp
. Go
vern
ance
Fina
ncia
lsR
efer
ence
sIn
tro
duc
tio
n
Quality assurance is measured through client satisfaction surveys for each review, the annualAudit Committee self assessment, completion ofthe internal audit plan and benchmarking againstother internal audit functions.
The following were completed as part of theinternal audit plan for 2014–15:
– Major Projects Management – Ashburton Pooland Recreation Centre
– Information Technology Disaster Recovery Planning
– Risk Management
– Fleet Management
– Purchasing
– Accounts Payable
– Continuous Monitoring – data analysisof fi nancial transactions
– Assurance Mapping
– Strategic Internal Audit Plan 2015–18.
External auditCouncil is audited externally by the Victorian Auditor General’s Offi ce (VAGO). VAGO may appoint a representative to conduct the annual external audit. For 2014–15, the annual external audit of Council’s Financial and Standard Statements, and Performance Statement was conducted by RMS Bird Cameron,the VAGO representative.
Risk managementCouncil has a Risk Management Frameworkand Policy in line with current best practice inthe management of business enterprise risksand current AS/NZS ISO 31000:2009 guidelines.
The Risk Management Framework and Policy addresses:
– risk management culture and branding
– communication and training
– best practice in risk management
– responsibilities of and to internaland external stakeholders
– risk registers and risk management software development
– the Council planning cycle, budget cycleand annual audit cycle
– a performance measurement system todetermine the effectiveness of the framework.

CITY OF BOROONDARA ANNUAL REPORT 2014–15CITY OF BOROONDARA ANNUAL REPORT 2014–15
69
The Year In R
eviewO
ur Co
uncilO
ur Peo
ple
Our P
erform
anceC
orp
. Go
vernanceFinancials
References
Introd
uction
Results of Council’s assessment against the prescribed governanceand management checklist:
Governance and management items Assessment Outcome
1 Community engagement policy
(policy outlining Council’s commitment to engagingwith the community on matters of public interest)
Policy
Date of operationof current policy
YES
04/10/2010
2 Community engagement guidelines
(guidelines to assist staff to determine whenand how to engage with the community)
Guidelines
Date of operationof current guidelines
YES
25/06/2015
3 Strategic Resource Plan
(plan under section 126 of the Act outliningthe fi nancial and non-fi nancial resources requiredfor at least the next 4 fi nancial years)
Adopted in accordancewith section 126 of the Act
Date of adoption
YES
22/06/2014
4 Annual budget
(plan under section 130 of the Act setting out theservices to be provided and initiatives to be undertaken over the next 12 months and the funding and other resources required)
Adopted in accordancewith section 130 of the Act
Date of adoption
YES
22/06/2014
5 Asset management plans
(plans that set out the asset maintenance andrenewal needs for key infrastructure asset classesfor at least the next 10 years)
Plans
Date of operation of current plans
Asset Management Planfor Building and Other structures
Asset Management Planfor Drainage
Asset Management Planfor Footpaths
Asset Management Planfor Roads and Kerb and Channel
Road Management Plan 2013
YES
December2003
December2009
February2003
June2007
22/07/2013
6 Rating strategy
(strategy setting out the rating structure of councilto levy rates and charges)
Strategy
Date of operationof current strategy
YES
17/11/2014
7 Risk policy
(policy outlining Council’s commitment and approachto minimising the risks to Council’s operations)
Policy
Date of operationof current policy
YES
15/10/2012
8 Fraud policy
(policy outlining Council’s commitment and approachto minimising the risk of fraud)
Policy
Date of operationof current policy
YES
22/06/2015
9 Municipal emergency management plan
(plan under section 20 of the Emergency Management Act 1986 for emergency prevention, response and recovery)
Prepared and maintained in accordance with section 20of the Emergency Management Act 1986
Date of preparation
YES
25/08/2014
Governance andmanagement checklist
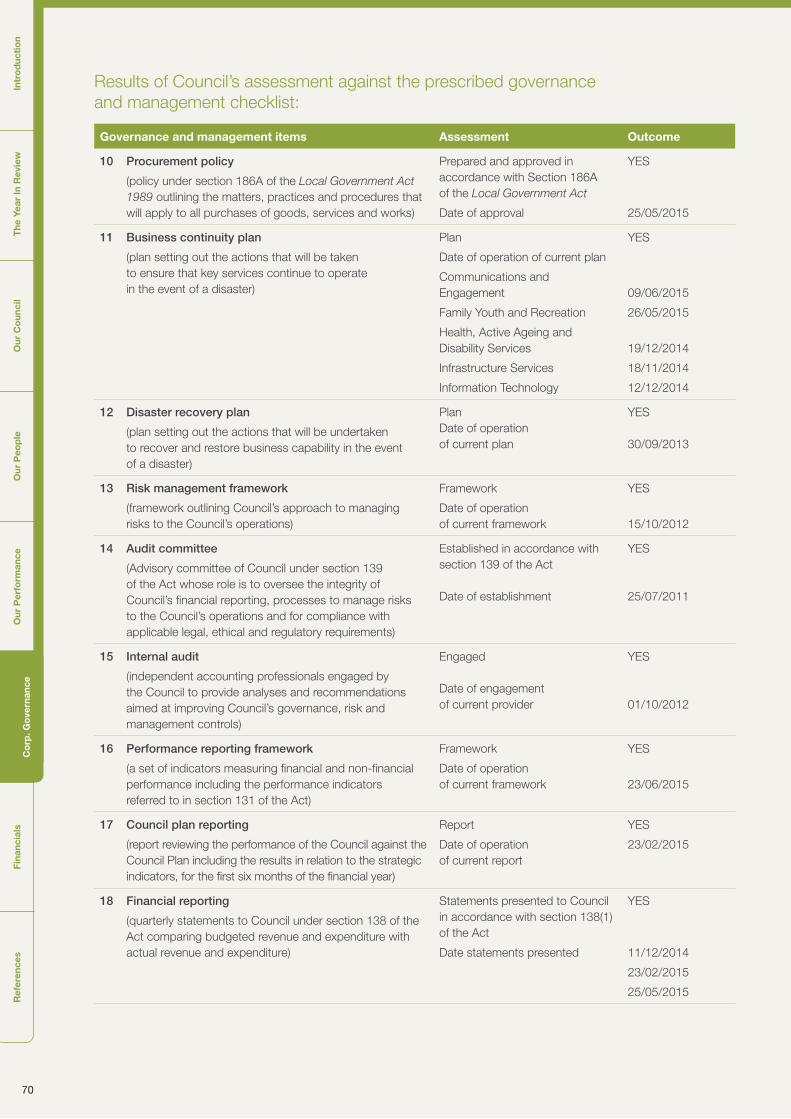
70
The
Yea
r In
Rev
iew
Our
Co
unci
lO
ur P
eop
leO
ur P
erfo
rman
ceC
orp
. Go
vern
ance
Fina
ncia
lsR
efer
ence
sIn
tro
duc
tio
n
Results of Council’s assessment against the prescribed governanceand management checklist:
Governance and management items Assessment Outcome
10 Procurement policy
(policy under section 186A of the Local Government Act 1989 outlining the matters, practices and procedures that will apply to all purchases of goods, services and works)
Prepared and approved in accordance with Section 186Aof the Local Government Act
Date of approval
YES
25/05/2015
11 Business continuity plan
(plan setting out the actions that will be takento ensure that key services continue to operatein the event of a disaster)
Plan
Date of operation of current plan
Communications and Engagement
Family Youth and Recreation
Health, Active Ageing and Disability Services
Infrastructure Services
Information Technology
YES
09/06/2015
26/05/2015
19/12/2014
18/11/2014
12/12/2014
12 Disaster recovery plan
(plan setting out the actions that will be undertakento recover and restore business capability in the eventof a disaster)
PlanDate of operationof current plan
YES
30/09/2013
13 Risk management framework
(framework outlining Council’s approach to managingrisks to the Council’s operations)
Framework
Date of operationof current framework
YES
15/10/2012
14 Audit committee
(Advisory committee of Council under section 139of the Act whose role is to oversee the integrity of Council’s fi nancial reporting, processes to manage risks to the Council’s operations and for compliance with applicable legal, ethical and regulatory requirements)
Established in accordance with section 139 of the Act
Date of establishment
YES
25/07/2011
15 Internal audit
(independent accounting professionals engaged bythe Council to provide analyses and recommendations aimed at improving Council’s governance, risk and management controls)
Engaged
Date of engagementof current provider
YES
01/10/2012
16 Performance reporting framework
(a set of indicators measuring fi nancial and non-fi nancial performance including the performance indicatorsreferred to in section 131 of the Act)
Framework
Date of operationof current framework
YES
23/06/2015
17 Council plan reporting
(report reviewing the performance of the Council against the Council Plan including the results in relation to the strategic indicators, for the fi rst six months of the fi nancial year)
Report
Date of operationof current report
YES
23/02/2015
18 Financial reporting
(quarterly statements to Council under section 138 of the Act comparing budgeted revenue and expenditure with actual revenue and expenditure)
Statements presented to Council in accordance with section 138(1) of the Act
Date statements presented
YES
11/12/2014
23/02/2015
25/05/2015

CITY OF BOROONDARA ANNUAL REPORT 2014–15CITY OF BOROONDARA ANNUAL REPORT 2014–15
71
The Year In R
eviewO
ur Co
uncilO
ur Peo
ple
Our P
erform
anceC
orp
. Go
vernanceFinancials
References
Introd
uction
Governance and management items Assessment Outcome
19 Risk reporting
(six-monthly reports of strategic risks to Council’s operations, their likelihood and consequences ofoccurring and risk minimisation strategies)
Reports
Date of reports
YES
26/11/2014
20/05/2015
20 Performance reporting
(six-monthly reports of indicators measuring the results against fi nancial and non-fi nancial performance, including the performance indicators referred to in section 131 of the Act)
Reports
Date of reports
YES
17/02/2015
21 Annual report
(annual report under sections 131, 132 and 133 of theAct to the community containing a report of operations and audited fi nancial and performance statements)
Considered at a meeting of Council in accordance with section 134 of the Act
Date of consideration
YES
27/10/2014
22 Councillor Code of Conduct
(Code under section 76C of the Act setting out the conduct principles and the dispute resolution processto be followed by all Councillors)
Reviewed in accordance with section 76C of the Act
Date reviewed
YES
29/04/2013
23 Delegations
(a document setting out the powers, duties and functions of Council and the Chief Executive Offi cer that have been delegated to members of staff)
Reviewed in accordance with section 98(6) of the Act
Date reviewed
Council to CEO
Council to Staff
Council to Committees
YES
27/05/2013
27/05/2013
23/09/2013
24 Meeting procedures
(a local law governing the conduct of meetingsof Council and special committees)
Meeting procedures local law made in accordance with section 91(1) of the Act
Date local law made
The Meeting Procedure Local Law was originally adopted by Council on 26 March 2007 and commenced on 6 April 2007.
It has been amended by:
– The Meeting Procedure (Amendments 2011) Local Law
– The Meeting Procedure (Further Amendments 2014) Local Law
– The Meeting Procedure (Additional Amendments 2014) Local Law.
YES
26/07/2007
25/07/2011
24/03/2014
27/04/2015
I certify that this information presents fairly the status of Council’s governance and management arrangements.
Cr Coral Ross
MayorDated:
Phillip Storer
Chief Executive Offi cerDated:

72
The
Yea
r In
Rev
iew
Our
Co
unci
lO
ur P
eop
leO
ur P
erfo
rman
ceC
orp
. Go
vern
ance
Fina
ncia
lsR
efer
ence
sIn
tro
duc
tio
n
Statutory informationThe following information is provided in accordance with legislativeand other requirements applying to Council:
Documents available for public inspectionDocuments available for inspection or copies ofthe documents can be obtained for the purposesof section 222 of the Local Government Act 1989at 8 Inglesby Road, Camberwell:
– details of current allowances fi xed for theMayor and Councillors
– details of senior offi cers’ total salary packagesfor the current fi nancial year and the previous year
– details of overseas or interstate travel (with the exception of interstate travel by land for less than three days) undertaken in an offi cial capacity by Councillors or any member of Council staff in the previous 12 months
– names of Council offi cers who were requiredto submit a return of interest during the fi nancial year and the dates the returns were submitted
– names of Councillors who submitted returnsof interest during the fi nancial year and the dates the returns were submitted
– agendas for and minutes of ordinary and special meetings held in the previous 12 months exceptif the minutes relate to parts of meetings which have been closed to members of the public
– a list of all special committees established by Council and the purpose for which each committee was established
– a list of all special committees establishedby the Council which were abolished or ceasedto function during the fi nancial year
– minutes of meetings of special committees heldin the previous 12 months except if the minutes relate to parts of meetings which have beenclosed to members of the public
– a register of delegations
– submissions received in accordance with Section 223 of the Act during the previous 12 months
– agreements to establish regional libraries
– details of all property, fi nance and operating leases involving land, buildings, plant, computer equipment or vehicles entered into by the Council as lessor or lessee, including the name of the other party to the lease and the terms and the valueof the lease
– a register of authorised offi cers
– a list of donations and grants made by theCouncil during the fi nancial year
– a list of the names of the organisations of which the Council was a member during the fi nancial year and details of all membership fees and other amounts and services provided during that yearto each organisation by the Council
– a list of contracts valued at $150,000 or more which the Council entered into during the fi nancial year without fi rst engaging in a competitive process.
Best valueCouncil incorporates Best Value Principles through regular business planning and performancemonitoring processes.
Our commitment to continuous improvement and innovation is supported by our Boroondara Customer First Program. The program focusses on three areas: people, projects and process improvement. The People stream involves a culture change program, involving staff in new ways of working. The Project stream involves improving document and records systems, customer relationship systems and online services, and developing a customer engagement strategy and a new Business Classfi cation Scheme. The Process Improvement stream examines more than 300 work processes with a view to improving them.

CITY OF BOROONDARA ANNUAL REPORT 2014–15CITY OF BOROONDARA ANNUAL REPORT 2014–15
73
The Year In R
eviewO
ur Co
uncilO
ur Peo
ple
Our P
erform
anceC
orp
. Go
vernanceFinancials
References
Introd
uction
Carers recognitionCouncil has taken all practicable measures tocomply with its responsibilities described in theCarers Recognition Act 2012 by:
– promoting the principles of the Act to people(and families) in a caring relationship
– informing staff of the requirements of theAct at staff meetings
– defi ning the carer role and relationship to allstaff including Home Support Staff
– undertaking necessary changes to the Assessment and Care Planning process to include the carer
– reviewing all necessary policies and practice instructions to include the recognition of the carer and the care relationship
– where required, collecting individual information about the carers to meet their own needs
– ensuring that Intake and information about services is delivered in a timely manner, taking carer stress and fatigue into account, when looking at priorityof access to services
– involving carers in all review processes with the clients, as well as seeking their specifi c feedback through Council surveys.
Disability action planIn accordance with section 38 of the Disability Act 2006, Council has prepared an Access and Inclusion Plan 2013–17 and implemented the following actions during 2014–15:
– Worked with rooming house operators, Council and community support services to increase the utilisation of Home and Community Care servicesby tenants with a disability
– Engaged with culturally diverse communities in Boroondara to identify specifi c issues and barriers for people with a disability
– Developed a community awareness and information resource on the availability of accessible health services in Boroondara.
– Convened the Good Access = Good Business internal working group to inform the community on how to report access issues and barriers in the built environment through Council’s community feedback channels
– Informed and engaged sports clubs about access and inclusion issues through regular input in the Sidelines/Boundaries newsletter and the Boroondara Sports Forum
– Developed partnerships between festival committees and disability organisations to provide advice on access and inclusion in festival planning.
Domestic Animal Management PlanIn accordance with the Domestic Animals Act 1994, Council prepares a Domestic Animal Management Plan every four years. The Domestic Animal Management Plan 2012–16 was adopted by Council in June 2013. The second year actions of the Plan were completed during the year. We developed and implemented educational park patrols using portable signage to raise awareness of the responsibilities of pet owners. Online payment options for registration were also enhanced and we investigated the viability of local veterinary practices acting as authorised registration agents.
Food Act ministerial directionsIn accordance with section 7E of the Food Act 1984, Council is required to publish a summary of any Ministerial Directions received during the fi nancial year in its annual report. Council did not receive any Ministerial Directions during the fi nancial year.

74
The
Yea
r In
Rev
iew
Our
Co
unci
lO
ur P
eop
leO
ur P
erfo
rman
ceC
orp
. Go
vern
ance
Fina
ncia
lsR
efer
ence
sIn
tro
duc
tio
n
Freedom of InformationAccess to documents may be obtained through written request to the Freedom of Information Offi cer, as detailed in section 17 of the Freedom of Information Act 1982 and in summary as follows:
– it should be in writing
– it should identify as clearly as possible which document is being requested
– it should be accompanied by the appropriate application fee (the fee may be waived in certain circumstances).
Requests for documents in the possessionof Council should be addressed to the Freedomof Information Offi cer. Requests can also be lodged online or by email. Access charges may also apply once documents have been processed and adecision on access is made (e.g. photocopyingand search and retrieval charges).
More information regarding Freedom of Information can be found at www.foi.vic.gov.au and on theCity of Boroondara website.
Protected Disclosure ProceduresThe Protected Disclosure Act 2012 aims to ensure openness and accountability in government by encouraging people to disclose improper conduct within the public sector and provide protection for people who make disclosures. Procedures on how to make a disclosure are available on Council’s website.
During 2014–15, one disclosure under Section 13 was notifi ed by Council to the Independent Broad-based Anti-corruption Commission (IBAC).
Road Management Act ministerial directionIn accordance with section 22 of the Road Management Act 2004, Council must publisha copy or summary of any ministerial directionin its annual report. Council did not receive anyMinisterial Directions during the fi nancial year.
Charter of Human Rightsand Responsibilities commitmentThe Victorian Charter of Human Rights and Responsibilities Act 2006 is a law that protects the human rights of all people in Victoria. The Charter requires all public authorities and their employeesto act compatibly with human rights in the deliveryof services and when making decisions.
The City of Boroondara recognises and respects that everyone has the same human rights entitlement to allow them to participate in, and contribute to, society and our community. We recognise that all persons have equal rights in the provision of, and access to, Council services and facilities. We also recognisethat, at times, such rights may be limited, insofar asto strike a balance between individual rights andthe protection of public interest.
The Charter complements other laws such as Equal Opportunity legislation and protects basic rights such as freedom of speech, freedom from forced work and freedom from degrading treatment which previously had no legal protection. The Charter lists 20 rights that help all people to live with freedom, respect, equality and dignity.
Council has developed a Human Rights Compatibility Assessment Tool to assist staff reviewing decisions or policies. It specifi es that Council must observe the rights set out in the Charter when making decisions, creating local laws, setting policies or providing services. The assessment tool is designed to help staff undertake a thorough and methodical assessment of any proposed policy, plan, procedure or decision and to identify whether it has an impact on any of the rights protected in the Charter.
During 2014–15, no Charter of Human Rights-related complaints were made to Council.

CITY OF BOROONDARA ANNUAL REPORT 2014–15CITY OF BOROONDARA ANNUAL REPORT 2014–15
75
The Year In R
eviewO
ur Co
uncilO
ur Peo
ple
Our P
erform
anceC
orp
. Go
vernanceFinancials
References
Introd
uction
Information on privacy commitmentand complaints received Council is committed to protecting the personal privacy of residents and ratepayers. Council willonly collect, use or disclose personal information where it is necessary to perform Council functionsor where authorised or required by law. Councilhas an Information Privacy Policy that is availableon Council’s website.
During 2014–15, no complaints were maderegarding breaches of customer privacy and lossesof customer data referred to the Commissionerfor Privacy and Data Protection.
Legislation impacting council Council has responsibilities under a wide rangeof Victorian and Commonwealth legislation. Some of the key Acts and Regulations that affect Council are:
– Building Act 1993
– Domestic Animals Act 1994
– Environment Protection Act 1970
– Food Act 1984
– Freedom of Information Act 1982
– Information Privacy Act 2000
– Infringements Act 2006
– Land Acquisition and Compensation Act 1986
– Local Government Act 1989
– Occupational Health and Safety Act 2004
– Planning and Environment Act 1987
– Protected Disclosure Act 2012
– Public Health and Wellbeing Act 2008
– Road Management Act 2004
– Road Safety Act 1986
– Sentencing Act 1991
– Subdivision Act 1988
– Valuation of Land Act 1960.
Local Laws Council’s Local Laws are listed below. More information can be found on Council’s website.
Amenity Local Law
– Protection of Council Assets and Control of Building Sites Local Law 2011
– Smoke Free Areas Local Law 2012
– Street numbering Local Law
– Tree Protection Local Law
– Consolidated Meeting Procedure Local Law.
National Competition PolicyThe City of Boroondara has undertaken a review under the National Competition Policy guidelines. This policy covers compliance with trade practices, local laws and competitive neutrality.

76
The
Yea
r In
Rev
iew
Our
Co
unci
lO
ur P
eop
leO
ur P
erfo
rman
ceC
orp
. Go
vern
ance
Fina
ncia
lsR
efer
ence
sIn
tro
duc
tio
n
Victorian local government indicatorsThe Victorian Government requires all Victorian councils to measure and report annually against11 Victorian Local Government Indicators (VLGIs). These indicators provide information regardingexpenditure, cost of services and infrastructure provision, customer satisfaction and governance.
Indicator Calculation 2014–15 2013–14
1. Average rates andcharges per assessment
Total rates and charges receivable atbeginning of year/Number of assessmentin the adopted budget
$2,070.30 $1,977.60
2. Average residential ratesand charges per assessment
Rates and charges declared for residential assessments receivable at beginning of year/Number of residential assessments in the adopted budget
$2,076.18 $1,980.04
3. Average liabilitiesper assessment
Total liabilities/Number of assessmentsin the adopted budget
$ $1,366.04 $1,285.51
4. Operating resultper assessment
Net surplus/Number of assessmentsin the adopted budget
$413.40 $321.46
5. Average operating expenditure per assessment
Operating expenditure/Number of assessments in adopted budget
$2,441.97 $2,361.13
6. Community satisfaction ratingfor overall performance
Result from the Annual Local Government Community Satisfaction Survey
73 74
7. Average capital expenditureper assessment
Capital expenditure/Number of assessmentsin the adopted budget
$749.19 $786.17
8. Renewal gap Capital renewal/Average annual asset consumption
1.15 1.15
9. Renewal and maintenance gap Capital renewal and maintenance/Average annual asset consumption plus planned maintenance
1.10 1.09
10. Community satisfaction rating for Council’s advocacy and community representationon key local issues
Result from the Annual Local Government Community Satisfaction Survey
62 61
11. Community satisfaction ratingfor Council’s engagementin decision making on keylocal issues
Result from the Annual Local Government Community Satisfaction Survey
62 63


79
Financials
79
Financials

8080
Our
Peo
ple
Our
Per
form
ance
Co
rp. G
ove
rnan
ceFi
nanc
ials
Ref
eren
ces
Intr
od
ucti
on
The
Yea
r In
Rev
iew
Our
Co
unci
l
Financial Report
Comprehensive Income Statement 82
Balance Sheet 83
Statement of Changes in Equity 84
Statement of Cash Flows 85
Statement of Capital Works 86
Notes to the Financial Report
Introduction 87
Note 1 Signifi cant accounting policies 88
Note 2 Budget comparison 92
Note 3 Rates and charges 96
Note 4 Statutory fees and fi nes 96
Note 5 User fees 96
Note 6 Grants 97
Note 7 Contributions 98
Note 8 Profi t/(loss) on disposal of assets 98
Note 9 Other income 99
Note 10 Employee costs 99
Note 10 Superannuation 99
Note 11 Materials and services 100
Note 12 Bad and doubtful debts 100
Note 13 Depreciation and amortisation 100
Note 14 Borrowing costs 101
Note 15 Other expenses 101
Note 16 Investments in associates 101
Note 17 Cash and cash equivalents 102
Note 18 Trade and other receivables 102
Note 19 Financial assets 103
Note 20 Inventories 103
Note 21 Non-current assets classifi ed as held for sale 103
Note 22 Other assets 103
Note 23 Property, infrastructure, plant and equipment 104
Note 24 Investment property 109
Note 25 Intangible assets 109
Note 26 Trade and other payables 110
Note 27 Trust funds and deposits 110
Note 28 Provisions 111
Note 29 Interest-bearing loans and borrowings 112
Note 30 Reserves 113
Table of contents

8181
Our P
eop
leO
ur Perfo
rmance
Co
rp. G
overnance
FinancialsR
eferencesIntro
ductio
nT
he Year In Review
Our C
ouncil
Note 31 Reconciliation of cash fl ows from operating activities to surplus 115
Note 32 Reconciliation of cash and cash equivalents 115
Note 33 Financing arrangements 115
Note 34 Commitments 116
Note 35 Operating leases 117
Note 36 Contingent liabilities and contingent assets 118
Note 37 Financial instruments 120
Note 38 Related party transactions 121
Note 39 Events occurring after balance date 123
Certifi cation of the Financial Statements 124
Auditor General’s Report on the Financial Statements 125
Performance Statement
Sustainable Capacity Indicators 131
Service Performance Indicators 132
Financial Performance Indicators 134
Certifi cation of the Performance Statement 136
Auditor General’s Report on the Performance Statements 137

8282
Our
Peo
ple
Our
Per
form
ance
Co
rp. G
ove
rnan
ceFi
nanc
ials
Ref
eren
ces
Intr
od
ucti
on
The
Yea
r In
Rev
iew
Our
Co
unci
l
Financial Report
Comprehensive Income StatementFor the year ended 30 June 2014
Note2015$’000
2014$’000
Income
Rates and charges 3 152,040 144,133
Statutory fees and fi nes 4 11,847 11,406
User fees 5 12,324 11,928
Grants – operating 6 16,231 11,983
Grants – capital 6 2,280 4,115
Contributions – monetary 7 5,587 4,033
Contributions – non-monetary assets 7 13 1,090
Other income 9 7,643 7,275
Net loss on disposal of property, infrastructure, plant and equipment 8 (3,187) (4,274)
Share of net losses of associates and joint ventures 16 (4,668) (2,100)
Total revenue 200,110 189,589
Expenses
Employee costs 10 (73,573) (69,842)
Materials and services 11 (51,074) (52,019)
Bad and doubtful debts 12 (853) (876)
Depreciation and amortisation 13 (29,638) (28,646)
Borrowing costs 14 (4,429) (3,579)
Other expenses 15 (10,434) (11,396)
Total expenses (170,001) (166,358)
Surplus for the year 30,109 23,231
Other comprehensive income
Items that will not be reclassifi ed to surplus or defi cit in future periods
Net asset revaluation increments 23 – 225,262
Share of other comprehensive income of associates and joint ventures accounted for by the equity method
16 – 114
Comprehensive result 30,109 248,607
The above comprehensive income statement should be read in conjunction with the accompanying notes.

8383
Our P
eop
leO
ur Perfo
rmance
Co
rp. G
overnance
FinancialsR
eferencesIntro
ductio
nT
he Year In Review
Our C
ouncil
Balance SheetAs at 30 June 2015
Note2015$’000
2014$’000
Assets
Current assets
Cash and cash equivalents 17 10,709 39,910
Trade and other receivables 18 10,274 11,782
Other fi nancial assets 19 66,500 15,000
Inventories 20 23 35
Other assets 22 1,059 851
Total current assets 88,565 67,578
Non-current assets
Trade and other receivables 18 60 110
Financial assets 19 4 4
Investments in associates accounted for using the equity method 16 – 3,404
Property, infrastructure, plant and equipment 23 2,721,187 2,703,352
Investment property 24 9,191 7,757
Intangible assets 25 345 255
Total non-current assets 2,730,787 2,714,882
Total assets 2,819,352 2,782,460
Liabilities
Current liabilities
Trade and other payables 26 24,397 17,978
Trust funds and deposits 27 3,038 3,179
Provisions 28 14,968 13,967
Interest-bearing loans and borrowings 29 3,864 3,240
Total current liabilities 46,267 38,364
Non-current liabilities
Provisions 28 2,003 1,910
Provision for investments in associates and joint ventures 16 1,264 –
Interest-bearing loans and borrowings 29 52,997 55,474
Total non-current liabilities 56,264 57,384
Total liabilities 102,531 95,748
Net assets 2,716,821 2,686,712
Equity
Accumulated surplus 803,493 776,453
Reserves 30(c) 1,913,328 1,910,259
Total equity 2,716,821 2,686,712
The above balance sheet should be read in conjunction with the accompanying notes.

8484
Our
Peo
ple
Our
Per
form
ance
Co
rp. G
ove
rnan
ceFi
nanc
ials
Ref
eren
ces
Intr
od
ucti
on
The
Yea
r In
Rev
iew
Our
Co
unci
l
Statement of Changes in Equity ended 30 June 2015
2015 Note
Total2015$’000
AccumulatedSurplus
2015$’000
Asset Revaluation
Reserve2015$’000
OtherReserves
2015$’000
Balance at beginning of the fi nancial year 2,686,712 776,453 1,908,058 2,201
Surplus for the year 30,109 30,109 – –
Net asset revaluation increment(decrement) 30(a) – – – –
Transfers to other reserves 30(b) – (3,069) – 3,069
Transfers from other reserves 30(b) – – – –
Balance at end of the fi nancial year 2,716,821 803,493 1,908,058 5,270
2014
Total2014$’000
AccumulatedSurplus
2014$’000
Asset Revaluation
Reserve2014$’000
OtherReserves
2014$’000
Balance at beginning of the fi nancial year 2,438,105 751,016 1,686,837 252
Surplus for the year 23,231 23,231 – –
Net asset revaluation increment 30(a) 225,376 – 225,376 –
Transfers to other reserves 30(b) – (2,080) – 2,080
Transfers from other reserves 30(b) – 4,286 (4,155) (131)
Balance at end of the fi nancial year 2,686,712 776,453 1,908,058 2,201
The above statement of changes in equity should be read in conjunction with the accompanying notes.
8484
Our
Peo
ple
Our
Per
form
ance
Co
rp. G
ove
rnan
ceFi
nanc
ials
Ref
eren
ces
Intr
od
ucti
on
The
Yea
r In
Rev
iew
Our
Co
unci
l
Statement of Changes in Equity ended 30 June 2015
2015 Note
Total2015
$’000
AccumulatedSurplus
2015$’000
Asset Revaluation
Reserve2015$’000
OtherReserves
2015$’000
Balance at beginning of the fi nancial year 2,686,712 776,453 1,908,058 2,201
Surplus for the year 30,109 30,109 – –
Net asset revaluation increment(decrement) 30(a) – – – –
Transfers to other reserves 30(b) – (3,069) – 3,069
Transfers from other reserves 30(b) – – – –
Balance at end of the fi nancial year 2,716,821 803,493 1,908,058 5,270
2014
Total2014
$’000
AccumulatedSurplus
2014$’000
Asset Revaluation
Reserve2014$’000
OtherReserves
2014$’000
Balance at beginning of the fi nancial year 2,438,105 751,016 1,686,837 252
Surplus for the year 23,231 23,231 – –
Net asset revaluation increment 30(a) 225,376 – 225,376 –
Transfers to other reserves 30(b) – (2,080) – 2,080
Transfers from other reserves 30(b) – 4,286 (4,155) (131)
Balance at end of the fi nancial year 2,686,712 776,453 1,908,058 2,201
The above statement of changes in equity should be read in conjunction with the accompanying notes.

8585
Our P
eop
leO
ur Perfo
rmance
Co
rp. G
overnance
FinancialsR
eferencesIntro
ductio
nT
he Year In Review
Our C
ouncil
Statement of Cash FlowsFor the year ended 30 June 2015
Note
2015Infl ows/
(Outfl ows)$’000
2014Infl ows/
(Outfl ows)$’000
Cash fl ows from operating activities
Rates and charges 152,075 143,390
Statutory fees and fi nes 10,550 10,840
User charges 13,653 11,099
Grants – operating 16,628 12,677
Grants – capital 4,104 4,262
Contributions monetary 5,815 4,243
Interest received 2,336 2,268
Trust funds and deposits taken 17,795 17,246
Other receipts 5,291 5,246
Net GST refund 9,222 10,060
Employee costs (72,019) (82,349)
Materials and services (55,546) (60,339)
Trust funds and deposits repaid (17,936) (17,512)
Other payments (11,502) (11,397)
Net cash provided by operating activities 31 80,466 49,734
Cash fl ows from investing activities
Payments for property, infrastructure, plant and equipment (51,741) (56,784)
Proceeds from sale of property, infrastructure, plant and equipment – 1,806
Payments for investments (66,500) (15,000)
Proceeds from sale of investments 15,000 3,000
Payments of loans and advances 50 50
Net cash used in investing activities (103,191) (66,928)
Cash fl ows from fi nancing activities
Finance costs (4,623) (3,630)
Proceeds from borrowings 21,160 20,830
Repayments of borrowings (23,013) (15,874)
Net cash provided by fi nancing activities (6,476) 1,326
Net decrease in cash and cash equivalents (29,201) (15,868)
Cash and cash equivalents at the beginning of the fi nancial year 39,910 55,778
Cash and cash equivalents at the end of the fi nancial year 17 10,709 39,910
Financing arrangements 33
Restrictions on cash assets 17
The above cash fl ow statement should be read in conjunction with the accompanying notes.

8686
Our
Peo
ple
Our
Per
form
ance
Co
rp. G
ove
rnan
ceFi
nanc
ials
Ref
eren
ces
Intr
od
ucti
on
The
Yea
r In
Rev
iew
Our
Co
unci
l
Statement of Capital WorksFor the year ended 30 June 2015
2015$’000
2014$’000
Property
Land – 635
Land improvements 28 –
Total land 28 635
Buildings 26,632 26,944
Building improvements 4,614 3,132
Total buildings 31,246 30,076
Total property 31,274 30,711
Plant and equipment
Plant, machinery and equipment 1,079 1,954
Fixtures, fi ttings and furniture 264 327
Computers and telecommunications 1,079 1,171
Library books 1,081 1,321
Total plant and equipment 3,503 4,773
Infrastructure 8,171 7,937
Roads 754 807
Bridges 1,802 2,824
Footpaths and cycleways 3,506 3,802
Drainage 1,454 1,939
Recreational, leisure and community facilities 3,165 2,496
Parks, open space and streetscapes 551 1,081
Off street car parks 386 444
Other infrastructure 19,789 21,330
Total infrastructure
Total capital works expenditure 54,566 56,814
Represented by:
New asset expenditure 2,557 7,298
Asset renewal expenditure 42,924 42,882
Asset expansion expenditure 3,273 –
Asset upgrade expenditure 5,812 6,634
Total capital works expenditure 54,566 56,814
The above statement of capital works should be read in conjunction with the accompanying notes.

8787
Our P
eop
leO
ur Perfo
rmance
Co
rp. G
overnance
FinancialsR
eferencesIntro
ductio
nT
he Year In Review
Our C
ouncil
Introduction The City of Boroondara was established by an Order of the Governor
in Council on 22 June 1994 and is a body corporate. The Council’s main offi ce is located at 8 Inglesby Road, Camberwell.
Statement of compliance These fi nancial statements are a general purpose fi nancial report
that consists of a Comprehensive Income Statement, Balance Sheet, Statement of Changes in Equity, Statement of Cash Flows, Statement of Capital Works and notes accompanying these fi nancial statements. The general purpose fi nancial report complies with Australian Accounting Standards, other authoritative pronouncements of the Australian Accounting Standards Board,the Local Government Act 1989, and the Local Government (Planning and Reporting) Regulations 2014.
Note 1 – Signifi cant accounting policies
(a) Basis of accounting
The accrual basis of accounting has been used in the preparation of these fi nancial statements, whereby assets, liabilities, equity, income and expenses are recognised in the reporting period to which they relate, regardless of when cash is received or paid.
Judgements, estimates and assumptions are required to be made about the carrying values of assets and liabilities that are not readily apparent from other sources. The estimates and associated judgements are based on professional judgement derived from historical experience and various other factors that are believed to be reasonable under the circumstances. Actual results may differ from these estimates.
Revisions to accounting estimates are recognised in the periodin which the estimate is revised and also in future periods that are affected by the revision. Judgements and assumptions made by management in the application of AAS’s that have signifi canteffects on the fi nancial statements and estimates relate to:
– the fair value of land, buildings, infrastructure, plant and equipment (refer to note 1 (m))
– the determination of depreciation for buildings, infrastructure,plant and equipment (refer to note 1(n))
– the determination of employee provisions (refer to note 1(t)).
Unless otherwise stated, all accounting policies are consistent with those applied in the prior year. Where appropriate, comparative fi gures have been amended to accord with current presentation, and disclosure has been made of any material changes to comparatives.
(b) Changes in accounting policies
Council has considered the requirements of AASB 11 for the fi rst time. AASB 11 Joint Arrangements changes the classifi cation of joint arrangements into joint operations or joint ventures. The classifi cation depends on the contractual rights and obligations of each investor rather than the legal structure of the joint arrangement. Depending on the classifi cation, the accounting treatment for the two types of joint arrangements will be different.
Council has reviewed its existing contractual arrangements with Regional Landfi ll Clayton South Joint Venture (Clayton Landfi ll) to ensure they are aligned with the new classifi cations under AASB 11. It has concluded that the existing joint arrangement is a joint operation. Instead of accounting for assets, liabilities, revenues and expenses relating to Council’s interest in Clayton Landfi ll, Council continues to account for Clayton Landfi ll under the equity method on the basis that Clayton Landfi ll operating results, assets and liabilities are not material individually or in aggregate. Details of joint operation are set out in note 16.
(c) Principles of consolidation
Council had no Entities consolidated at reporting date.
(d) Committees of management
All entities controlled by Council that have material revenues, expenses, assets or liabilities, such as committees of management, have been included in this fi nancial report. Any transactions between these entities and Council have been eliminated in full.
(e) Accounting for investments in associatesand joint arrangements
Associates
Associates are all entities over which Council has signifi cant infl uence but not control or joint control. Investments in associates are accounted for using the equity method of accounting, after initially being recognised at cost.
Joint arrangements
Investments in joint arrangements are classifi ed as either joint operations or joint ventures depending on the contractual rightsand obligations each investor has, rather than the legal structureof the joint arrangement.
(i) Joint operations
Council recognises its direct right to the, and its share of jointlyheld assets, liabilities, revenues and expenses of joint operations. These have been incorporated in the fi nancial statements underthe appropriate headings.
(ii) Joint ventures
Interests in joint ventures are accounted for using the equitymethod. Under this method, the interests are initially recognisedin the consolidated balance sheet at cost and adjusted thereafterto recognise Council’s share of the post-acquisition profi ts orlosses and movements in other comprehensive income in profi tor loss and other comprehensive income respectively.
Council interest in joint operations are accounted for using theequity method (refer to note 1b). Under this method, the interest is initially recognised in the balance sheet at cost and adjusted thereafter to recognise Council’s share of the net assets of the entities. The Council’s share of the fi nancial result of the entitiesis recognised in the Comprehensive Income Statement.
(f) Revenue recognition
Income is recognised when the Council obtains control of the contribution or the right to receive the contribution, it is probablethat the economic benefi ts comprising the contribution will fl owto the Council and the amount of the contribution can bemeasured reliably.
Rates and charges
Annual rates and charges are recognised as revenues whenCouncil issues annual rates notices. Supplementary rates are recognised when a valuation and reassessment is completedand a supplementary rates notice issued.
Statutory fees and fi nes
Statutory fees and fi nes (including parking fees and fi nes) are recognised as revenue when the service has been provided, the payment is received, or when the penalty has been applied, whichever fi rst occurs.
Notes to the Financial Report
8787
Our P
eop
leO
ur Perfo
rmance
Co
rp. G
overnance
FinancialsR
eferencesIntro
ductio
nT
he Year In Review
Our C
ouncil
Introduction The City of Boroondara was established by an Order of the Governor
in Council on 22 June 1994 and is a body corporate. The Council’s main offi ce is located at 8 Inglesby Road, Camberwell.
Statement of compliance These fi nancial statements are a general purpose fi nancial report
that consists of a Comprehensive Income Statement, BalanceSheet, Statement of Changes in Equity, Statement of CashFlows, Statement of Capital Works and notes accompanyingthese fi nancial statements. The general purpose fi nancial reportcomplies with Australian Accounting Standards, other authoritativepronouncements of the Australian Accounting Standards Board,the Local Government Act 1989, and the Local Government (Planning and Reporting) Regulations 2014.
Note 1 – Signifi cant accounting policies
(a) Basis of accounting
The accrual basis of accounting has been used in the preparation of these fi nancial statements, whereby assets, liabilities, equity, incomeand expenses are recognised in the reporting period to which theyrelate, regardless of when cash is received or paid.
Judgements, estimates and assumptions are required to be madeabout the carrying values of assets and liabilities that are not readily apparent from other sources. The estimates and associated judgements are based on professional judgement derived from historical experience and various other factors that are believed tobe reasonable under the circumstances. Actual results may differ from these estimates.
Revisions to accounting estimates are recognised in the periodin which the estimate is revised and also in future periods that are affected by the revision. Judgements and assumptions made by management in the application of AAS’s that have signifi canteffects on the fi nancial statements and estimates relate to:
– the fair value of land, buildings, infrastructure, plant and equipment (refer to note 1 (m))
– the determination of depreciation for buildings, infrastructure,plant and equipment (refer to note 1(n))
– the determination of employee provisions (refer to note 1(t)).
Unless otherwise stated, all accounting policies are consistent withthose applied in the prior year. Where appropriate, comparativefi gures have been amended to accord with current presentation, and disclosure has been made of any material changes to comparatives.
(b) Changes in accounting policies
Council has considered the requirements of AASB 11 for the fi rsttime. AASB 11 Joint Arrangements changes the classifi cation of joint arrangements into joint operations or joint ventures. Theclassifi cation depends on the contractual rights and obligations of each investor rather than the legal structure of the joint arrangement.Depending on the classifi cation, the accounting treatment for the two types of joint arrangements will be different.
Council has reviewed its existing contractual arrangements with Regional Landfi ll Clayton South Joint Venture (Clayton Landfi ll) to ensure they are aligned with the new classifi cations under AASB 11. It has concluded that the existing joint arrangement is a jointoperation. Instead of accounting for assets, liabilities, revenues andexpenses relating to Council’s interest in Clayton Landfi ll, Councilcontinues to account for Clayton Landfi ll under the equity method onthe basis that Clayton Landfi ll operating results, assets and liabilities are not material individually or in aggregate. Details of joint operationare set out in note 16.
(c) Principles of consolidation
Council had no Entities consolidated at reporting date.
(d) Committees of management
All entities controlled by Council that have material revenues,expenses, assets or liabilities, such as committees of management,have been included in this fi nancial report. Any transactions betweenthese entities and Council have been eliminated in full.
(e) Accounting for investments in associatesand joint arrangements
Associates
Associates are all entities over which Council has signifi cant infl uence but not control or joint control. Investments in associates are accounted for using the equity method of accounting, afterinitially being recognised at cost.
Joint arrangements
Investments in joint arrangements are classifi ed as either joint operations or joint ventures depending on the contractual rightsand obligations each investor has, rather than the legal structureof the joint arrangement.
(i) Joint operations
Council recognises its direct right to the, and its share of jointlyheld assets, liabilities, revenues and expenses of joint operations.These have been incorporated in the fi nancial statements underthe appropriate headings.
(ii) Joint ventures
Interests in joint ventures are accounted for using the equitymethod. Under this method, the interests are initially recognisedin the consolidated balance sheet at cost and adjusted thereafterto recognise Council’s share of the post-acquisition profi ts orlosses and movements in other comprehensive income in profi tor loss and other comprehensive income respectively.
Council interest in joint operations are accounted for using theequity method (refer to note 1b). Under this method, the interest is initially recognised in the balance sheet at cost and adjustedthereafter to recognise Council’s share of the net assets of theentities. The Council’s share of the fi nancial result of the entitiesis recognised in the Comprehensive Income Statement.
(f) Revenue recognition
Income is recognised when the Council obtains control of thecontribution or the right to receive the contribution, it is probablethat the economic benefi ts comprising the contribution will fl owto the Council and the amount of the contribution can bemeasured reliably.
Rates and charges
Annual rates and charges are recognised as revenues whenCouncil issues annual rates notices. Supplementary rates arerecognised when a valuation and reassessment is completedand a supplementary rates notice issued.
Statutory fees and fi nes
Statutory fees and fi nes (including parking fees and fi nes) are recognised as revenue when the service has been provided, the payment is received, or when the penalty has been applied,whichever fi rst occurs.
Notes to the Financial Report

8888
Our
Peo
ple
Our
Per
form
ance
Co
rp. G
ove
rnan
ceFi
nanc
ials
Ref
eren
ces
Intr
od
ucti
on
The
Yea
r In
Rev
iew
Our
Co
unci
l
Note 1 – Signifi cant accounting policies (cont.) User fees
User fees are recognised as revenue when the service has been provided or the payment is received, whichever fi rst occurs.
Grants
Grant income is recognised when Council obtains control of the contribution. This is normally obtained upon their receipt (or acquittal) or upon earlier notifi cation that a grant has been secured, and are valued at their fair value at the date of transfer.
Where grants or contributions recognised as revenues during the fi nancial year were obtained on condition that they be expended in a particular manner or used over a particular period and those conditions were undischarged at balance date, the unused grant or contribution is disclosed in note 6. The note also discloses the amount of unused grant or contribution from prior years that was expended on Council’s operations during the current year.
Contributions
Monetary and non-monetary contributions are recognised as revenue when Council obtains control over the contributed asset.
Sale of property, infrastructure, plant and equipment
The profi t or loss on sale of an asset is determined when controlof the asset has irrevocably passed to the buyer.
Interest
Interest is recognised as it is earned.
Dividends
Dividend revenue is recognised when the Council’s right to receive payment is established.
Other income
Other income is measured at the fair value of the consideration received or receivable and is recognised when Council gains control over the right to receive the income.
(g) Fair value measurement
Council measures certain assets and liabilities at fair value where required or permitted by Australian Accounting Standards. AASB 13 Fair value measurement, aims to improve consistency and reduce complexity by providing a defi nition of fair value and a single source of fair value measurement and disclosure requirements for use across Australian Accounting Standards.
AASB 13 defi nes fair value as the price that would be received to sell an asset or paid to transfer a liability in an orderly transaction between market participants at the measurement date. Fair value under AASB 13 is an exit price regardless of whether that price is directly observable or estimated using another valuation technique.
All assets and liabilities for which fair value is measured or disclosed in the fi nancial statements are categorised within a fair value hierarchy, described as follows, based on the lowest level input that is signifi cant to the fair value measurement as a whole:
Level 1 — Quoted (unadjusted) market prices in active markets for identical assets or liabilities
Level 2 — Valuation techniques for which the lowest level input that is signifi cant to the fair value measurement is directly or indirectly observable; and
Level 3 — Valuation techniques for which the lowest level input that is signifi cant to the fair value measurement is unobservable.
For the purpose of fair value disclosures, Council has determined classes of assets and liabilities on the basis of the nature, characteristics and risks of the asset or liability and the level of the fair value hierarchy as explained above.
In addition, Council determines whether transfers have occurred between levels in the hierarchy by re-assessing categorisation (based on the lowest level input that is signifi cant to the fair value measurement as a whole) at the end of each reporting period.
(h) Cash and cash equivalents
Cash and cash equivalents include cash on hand, deposits at call, and other highly liquid investments with original maturities of 90 days or less, net of outstanding bank overdrafts.
(i) Trade and other receivables
Receivables are carried at amortised cost using the effective interest rate method. A provision for doubtful debts is recognised when there is objective evidence that an impairment has occurred.
(j) Other fi nancial assets
Other fi nancial assets are valued at fair value, being market value, at balance date. Term deposits are measured at amortised cost. Any unrealised gains and losses on holdings at balance date are recognised as either a revenue or expense.
(k) Inventories
Inventories held for distribution are measured at cost adjusted when applicable for any loss of service potential. Inventories are measured at the lower of cost and net realisable value.
All other inventories, including land held for sale, are measured at the lower of cost and net realisable value. Where Inventories are acquired for no cost or nominal consideration, they are measuredat current replacement cost at the date of acquisition.
(l) Non-current assets classifi ed as held for sale
A non-current asset classifi ed as held for sale (including disposal groups) is measured at the lower of its carrying amount and fair value less costs to sell, and are not subject to depreciation. Non-current assets, disposal groups and related liabilities and assets are treated as current and classifi ed as held for sale if their carrying amount will be recovered through a sale transaction rather than through continuing use. This condition is regarded as met only when the sale is highly probable and the asset’s sale (or disposal group sale) is expected to be completed within 12 months from the dateof classifi cation.
(m) Recognition and measurement of property, plant and equipment, infrastructure, intangibles
Acquisition
The purchase method of accounting is used for all acquisitionsof assets, being the fair value of assets provided as considerationat the date of acquisition plus any incidental costs attributable tothe acquisition. Fair value is the amount for which the asset couldbe exchanged between knowledgeable willing parties in an arm’s length transaction.
Where assets are constructed by Council, cost includes all materials used in construction, direct labour, borrowing costs incurred during construction, and an appropriate share of directly attributable variable and fi xed overheads.
In accordance with Council’s policy, the threshold limits detailedin Note 1 n have applied when recognising assets within an applicable asset class and unless otherwise stated are consistent with the prior year.
Revaluation
Subsequent to the initial recognition of assets, non-current physical assets, other than plant and equipment, are measured at their fair value, being the amount for which the assets could be exchanged between subsequent to the initial recognition of assets, non-current physical assets, other than plant and equipment, are measured at their fair value, being the price that would be received to sell an asset or paid to transfer a liability in an orderly transaction between market participants at the measurement date.
Notes to the Financial Report
8888
Our
Peo
ple
Our
Per
form
ance
Co
rp. G
ove
rnan
ceFi
nanc
ials
Ref
eren
ces
Intr
od
ucti
on
The
Yea
r In
Rev
iew
Our
Co
unci
l
Note 1 – Signifi cant accounting policies (cont.) User fees
User fees are recognised as revenue when the service has been provided or the payment is received, whichever fi rst occurs.
Grants
Grant income is recognised when Council obtains control of the contribution. This is normally obtained upon their receipt (or acquittal)or upon earlier notifi cation that a grant has been secured, and are valued at their fair value at the date of transfer.
Where grants or contributions recognised as revenues during thefi nancial year were obtained on condition that they be expendedin a particular manner or used over a particular period and thoseconditions were undischarged at balance date, the unused grantor contribution is disclosed in note 6. The note also discloses theamount of unused grant or contribution from prior years that wasexpended on Council’s operations during the current year.
Contributions
Monetary and non-monetary contributions are recognised asrevenue when Council obtains control over the contributed asset.
Sale of property, infrastructure, plant and equipment
The profi t or loss on sale of an asset is determined when controlof the asset has irrevocably passed to the buyer.
Interest
Interest is recognised as it is earned.
Dividends
Dividend revenue is recognised when the Council’s right to receive payment is established.
Other income
Other income is measured at the fair value of the considerationreceived or receivable and is recognised when Council gains control over the right to receive the income.
(g) Fair value measurement
Council measures certain assets and liabilities at fair value where required or permitted by Australian Accounting Standards. AASB 13 Fair value measurement, aims to improve consistency and reduce complexity by providing a defi nition of fair value and a single source of fair value measurement and disclosure requirements for useacross Australian Accounting Standards.
AASB 13 defi nes fair value as the price that would be received to sell an asset or paid to transfer a liability in an orderly transaction between market participants at the measurement date. Fair valueunder AASB 13 is an exit price regardless of whether that price isdirectly observable or estimated using another valuation technique.
All assets and liabilities for which fair value is measured or disclosed in the fi nancial statements are categorised within a fair valuehierarchy, described as follows, based on the lowest level input thatis signifi cant to the fair value measurement as a whole:
Level 1 — Quoted (unadjusted) market prices in active markets foridentical assets or liabilities
Level 2 — Valuation techniques for which the lowest level input thatis signifi cant to the fair value measurement is directly or indirectlyobservable; and
Level 3 — Valuation techniques for which the lowest level input thatis signifi cant to the fair value measurement is unobservable.
For the purpose of fair value disclosures, Council has determined classes of assets and liabilities on the basis of the nature, characteristics and risks of the asset or liability and the level of thefair value hierarchy as explained above.
In addition, Council determines whether transfers have occurred between levels in the hierarchy by re-assessing categorisation(based on the lowest level input that is signifi cant to the fair value measurement as a whole) at the end of each reporting period.
(h) Cash and cash equivalents
Cash and cash equivalents include cash on hand, deposits at call,and other highly liquid investments with original maturities of 90 daysor less, net of outstanding bank overdrafts.
(i) Trade and other receivables
Receivables are carried at amortised cost using the effective interestrate method. A provision for doubtful debts is recognised when thereis objective evidence that an impairment has occurred.
(j) Other fi nancial assets
Other fi nancial assets are valued at fair value, being market value,at balance date. Term deposits are measured at amortised cost.Any unrealised gains and losses on holdings at balance date are recognised as either a revenue or expense.
(k) Inventories
Inventories held for distribution are measured at cost adjusted when applicable for any loss of service potential. Inventories are measuredat the lower of cost and net realisable value.
All other inventories, including land held for sale, are measured atthe lower of cost and net realisable value. Where Inventories areacquired for no cost or nominal consideration, they are measuredat current replacement cost at the date of acquisition.
(l) Non-current assets classifi ed as held for sale
A non-current asset classifi ed as held for sale (including disposalgroups) is measured at the lower of its carrying amount and fairvalue less costs to sell, and are not subject to depreciation. Non-current assets, disposal groups and related liabilities and assetsare treated as current and classifi ed as held for sale if their carryingamount will be recovered through a sale transaction rather thanthrough continuing use. This condition is regarded as met only whenthe sale is highly probable and the asset’s sale (or disposal group sale) is expected to be completed within 12 months from the dateof classifi cation.
(m) Recognition and measurement of property, plant and equipment, infrastructure, intangibles
Acquisition
The purchase method of accounting is used for all acquisitionsof assets, being the fair value of assets provided as considerationat the date of acquisition plus any incidental costs attributable tothe acquisition. Fair value is the amount for which the asset couldbe exchanged between knowledgeable willing parties in an arm’s length transaction.
Where assets are constructed by Council, cost includes all materialsused in construction, direct labour, borrowing costs incurred duringconstruction, and an appropriate share of directly attributablevariable and fi xed overheads.
In accordance with Council’s policy, the threshold limits detailedin Note 1 n have applied when recognising assets within anapplicable asset class and unless otherwise stated are consistentwith the prior year.
Revaluation
Subsequent to the initial recognition of assets, non-current physical assets, other than plant and equipment, are measured at their fairvalue, being the amount for which the assets could be exchangedbetween subsequent to the initial recognition of assets, non-currentphysical assets, other than plant and equipment, are measured at their fair value, being the price that would be received to sell anasset or paid to transfer a liability in an orderly transaction betweenmarket participants at the measurement date.
Notes to the Financial Report

8989
Our P
eop
leO
ur Perfo
rmance
Co
rp. G
overnance
FinancialsR
eferencesIntro
ductio
nT
he Year In Review
Our C
ouncil
Note 1 – Signifi cant accounting policies (cont.) At balance date, the Council reviewed the carrying value of the
individual classes of assets measured at fair value to ensure that each asset materially approximated its fair value. Where the carrying value materially differed from the fair value at balance date, the class of asset was revalued.
Fair value valuations are determined in accordance with a valuation hierarchy. Changes to the valuation hierarchy will only occur if an external change in the restrictions or limitations of use on an asset result in changes to the permissible or practical highest and best use of the asset. Further details regarding the fair value hierarchy are disclosed at Note 23 – Property, infrastructure, plant and equipment.
In addition, Council undertakes a formal revaluation of land, buildings, and infrastructure assets on a regular basis ranging from2 to 5 years. The valuation is performed either by experienced council offi cers or independent experts.
Where the assets are revalued, the revaluation increments are credited directly to the asset revaluation reserve except to the extent that an increment reverses a prior year decrement for that class of asset that had been recognised as an expense in which case the increment is recognised as revenue up to the amount of the expense. Revaluation decrements are recognised as an expense except where prior increments are included in the asset revaluation reserve for that class of asset in which case the decrement is taken to the reserve to the extent of the remaining increments. Within the same class of assets, revaluation increments and decrements within the year are offset.
(m) Recognition and measurement of property, plant and equipment, infrastructure, intangibles (cont.)
Land under roads
Council recognises land under roads it controls on a cost basis.
(n) Depreciation and amortisation of property, infrastructure, plant and equipment and intangibles
Buildings, land improvements, plant and equipment, infrastructure, and other assets having limited useful lives are systematically depreciated over their useful lives to the Council in a manner which refl ects consumption of the service potential embodied in those assets. Estimates of remaining useful lives and residual values are made on a regular basis with major asset classes reassessed annually. Depreciation rates and methods are reviewed annually.
Where assets have separate identifi able components that are subject to regular replacement, these components are assigned distinct useful lives and residual values and a separate depreciation rate is determined for each component.
Road earthworks are not depreciated on the basis that they are assessed as not having a limited useful life.
Straight line depreciation is charged based on the residual useful life as determined each year.
Depreciation periods used are listed below and are consistent with the prior year unless otherwise stated.
Asset recognition thresholds and depreciation periods
Depreciationperiod Years
Threshold$’000
Property
Land N/A –
Buildings
Buildings 2–55 2
Plant and Equipment
Plant, machinery and equipment 5–30 0.5
Arts and heritage 100 0.5
Fixtures, fi ttings and furniture 10 1
Computers and telecommunications
3–5 1
Library books 6 –
Infrastructure
Road pavements and seals 20–100 7
Road substructure 100–150 7
Road kerb, channel and minor culverts
75 7
Bridges deck 50–130 7
Bridges substructure 50–130 7
Footpaths and cycle ways 20–85 7
Drainage 20–100 7
Recreational, leisure and community facilities
15–80 1
Parks, open space and streetscapes
15–100 1
Off street car parks 30–100 7
Intangible assets
Intangible assets 3 1
(o) Repairs and maintenance
Routine maintenance, repair costs, and minor renewal costs are expensed as incurred. Where the repair relates to the replacement of a component of an asset and the cost exceeds the capitalisation threshold the cost is capitalised and depreciated. The carrying value of the replaced asset is expensed.
(p) Investment property
Investment property, comprising fresh food market stalls and a commercial shop is held to generate long-term rental yields. All tenant leases are on an arms length basis. Investment property is measured at cost, including transaction costs. Costs incurred subsequent to initial acquisition are capitalised when it is probable that future economic benefi t in excess of the originally assessed performance of the asset will fl ow to the Council. Investment property is depreciated on a straight-line basis as per the useful lives disclosed in note 1(n). Rental income from the leasing of investment properties is recognised in the Comprehensive Income Statement on a straight line basis over the lease term. AASB 140 paragraph 53 states that if an entity determines that the fair value of an investment property is not reliably determinable on a continuing basis, the entity shall measure that investment property using the cost model in AASB 116.
8989
Our P
eop
leO
ur Perfo
rmance
Co
rp. G
overnance
FinancialsR
eferencesIntro
ductio
nT
he Year In Review
Our C
ouncil
Note 1 – Signifi cant accounting policies (cont.) At balance date, the Council reviewed the carrying value of the
individual classes of assets measured at fair value to ensure that each asset materially approximated its fair value. Where the carryingvalue materially differed from the fair value at balance date, the classof asset was revalued.
Fair value valuations are determined in accordance with a valuation hierarchy. Changes to the valuation hierarchy will only occur if anexternal change in the restrictions or limitations of use on an assetresult in changes to the permissible or practical highest and best use of the asset. Further details regarding the fair value hierarchy are disclosed at Note 23 – Property, infrastructure, plant and equipment.
In addition, Council undertakes a formal revaluation of land, buildings, and infrastructure assets on a regular basis ranging from2 to 5 years. The valuation is performed either by experiencedcouncil offi cers or independent experts.
Where the assets are revalued, the revaluation increments are credited directly to the asset revaluation reserve except to the extent that an increment reverses a prior year decrement for that classof asset that had been recognised as an expense in which casethe increment is recognised as revenue up to the amount of theexpense. Revaluation decrements are recognised as an expenseexcept where prior increments are included in the asset revaluation reserve for that class of asset in which case the decrement is taken to the reserve to the extent of the remaining increments. Within thesame class of assets, revaluation increments and decrements withinthe year are offset.
(m) Recognition and measurement of property, plant andequipment, infrastructure, intangibles (cont.)
Land under roads
Council recognises land under roads it controls on a cost basis.
(n) Depreciation and amortisation of property, infrastructure, plant and equipment and intangibles
Buildings, land improvements, plant and equipment, infrastructure,and other assets having limited useful lives are systematicallydepreciated over their useful lives to the Council in a manner whichrefl ects consumption of the service potential embodied in those assets. Estimates of remaining useful lives and residual valuesare made on a regular basis with major asset classes reassessed annually. Depreciation rates and methods are reviewed annually.
Where assets have separate identifi able components that are subject to regular replacement, these components are assigneddistinct useful lives and residual values and a separate depreciationrate is determined for each component.
Road earthworks are not depreciated on the basis that they are assessed as not having a limited useful life.
Straight line depreciation is charged based on the residual useful lifeas determined each year.
Depreciation periods used are listed below and are consistent with the prior year unless otherwise stated.
Asset recognition thresholdsand depreciation periods
Depreciationperiod Years
Threshold$’000
Property
Land N/A –
Buildings
Buildings 2–55 2
Plant and Equipment
Plant, machinery and equipment 5–30 0.5
Arts and heritage 100 0.5
Fixtures, fi ttings and furniture 10 1
Computers andtelecommunications
3–5 1
Library books 6 –
Infrastructure
Road pavements and seals 20–100 7
Road substructure 100–150 7
Road kerb, channel and minorculverts
75 7
Bridges deck 50–130 7
Bridges substructure 50–130 7
Footpaths and cycle ways 20–85 7
Drainage 20–100 7
Recreational, leisure andcommunity facilities
15–80 1
Parks, open space andstreetscapes
15–100 1
Off street car parks 30–100 7
Intangible assets
Intangible assets 3 1
(o) Repairs and maintenance
Routine maintenance, repair costs, and minor renewal costs are expensed as incurred. Where the repair relates to the replacementof a component of an asset and the cost exceeds the capitalisationthreshold the cost is capitalised and depreciated. The carrying valueof the replaced asset is expensed.
(p) Investment property
Investment property, comprising fresh food market stalls and a commercial shop is held to generate long-term rental yields. Alltenant leases are on an arms length basis. Investment propertyis measured at cost, including transaction costs. Costs incurredsubsequent to initial acquisition are capitalised when it is probablethat future economic benefi t in excess of the originally assessedperformance of the asset will fl ow to the Council. Investmentproperty is depreciated on a straight-line basis as per the useful lives disclosed in note 1(n). Rental income from the leasing of investmentproperties is recognised in the Comprehensive Income Statement on a straight line basis over the lease term. AASB 140 paragraph 53states that if an entity determines that the fair value of an investmentproperty is not reliably determinable on a continuing basis, the entityshall measure that investment property using the cost model inAASB 116.

9090
Our
Peo
ple
Our
Per
form
ance
Co
rp. G
ove
rnan
ceFi
nanc
ials
Ref
eren
ces
Intr
od
ucti
on
The
Yea
r In
Rev
iew
Our
Co
unci
l
Note 1 – Signifi cant accounting policies (cont.)
(q) Impairment of assets
At each reporting date, the Council reviews the carrying value of its assets to determine whether there is any indication that these assets have been impaired. If such an indication exists, the recoverable amount of the asset, being the higher of the asset’s fair value less costs to sell and value in use, is compared to the assets carrying value. Any excess of the assets carrying value over its recoverable amount is expensed to the comprehensive income statement, unless the asset is carried at the revalued amount in which case, the impairment loss is recognised directly against the revaluation surplus in respect of the same class of asset to the extent that the impairment loss does not exceed the amount in the revaluation surplus for that same class of asset.
(r) Trust funds and deposits
Amounts received as deposits and retention amounts controlled by Council are recognised as trust funds until they are returned, transferred in accordance with the purpose of the receipt, or forfeited (refer to note 27).
(s) Borrowings
Borrowings are initially measured at fair value, being the cost of the interest bearing liabilities, net of transaction costs. The measurement basis subsequent to initial recognition depends on whether the Council has categorised its interest-bearing liabilities as either fi nancial liabilities designated at fair value through the profi t and loss, or fi nancial liabilities at amortised cost. Any difference between the initial recognised amount and the redemption value is recognised in net result over the period of the borrowing using the effective interest method.
The classifi cation depends on the nature and purpose of the interest bearing liabilities. The Council determines the classifi cation of its interest bearing liabilities at initial recognition.
Borrowing costs
Borrowing costs are recognised as an expense in the period in which they are incurred, except where they are capitalised as part of a qualifying asset constructed by Council. Except where specific borrowings are obtained for the purpose of specific asset acquisition, the weighted average interest rate applicable to borrowings at balance date, excluding borrowings associated with superannuation, is used to determine the borrowing costs to be capitalised.
Borrowing costs include interest on bank overdrafts, interest on borrowings, and fi nance lease charges.
(t) Employee costs and benefi ts
The calculation of employee costs and benefi ts includes all relevant on-costs and are calculated as follows at reporting date.
Wages and salaries and annual leave
Liabilities for wages and salaries, including non-monetary benefi ts, annual leave and accumulated sick leave expected to be wholly settled within 12 months of the reporting date are recognised in the provision for employee benefi ts in respect of employee services up to the reporting date, classifi ed as current liabilities and measuredat their nominal values.
Liabilities that are not expected to be wholly settled within 12 months of the reporting date are recognised in the provision for employee benefi ts as current liabilities, measured at present value of the amounts expected to be paid when the liabilities are settled using the remuneration rate expected to apply at the time of settlement.
(t) Employee costs and benefi ts (cont.)
Long service leave
Liability for long service leave (LSL) is recognised in the provision for employee benefi ts.
Current liability – unconditional LSL is disclosed as a current liability even when the Council does not expect to settle the liability within 12 months because it will not have the unconditional right to defer settlement of the entitlement should an employee take leave within 12 months.
The components of this current liability are measured at :
– present value – component that is not expected to be wholly settled within 12 months.
– nominal value – component that is expected to be wholly settled within 12 months.
Classifi cation of employee costs
Non-current liability – conditional LSL that has been accrued, where an employee is yet to reach a qualifying term of employment, is disclosed as a non-current liability. There is an unconditional right to defer settlement of the entitlement until the employee has completed the requisite years of service.
This non-current LSL liability is measured at present value.
(u) Leases
Finance leases
Leases of assets where substantially all the risks and rewards incidental to ownership of the asset, are transferred to the Council are classifi ed as fi nance leases. Finance leases are capitalised, recording an asset and a liability at the lower of the fair value of the asset and the present value of the minimum lease payments, including any guaranteed residual value. Lease payments are allocated between the reduction of the lease liability and the interest expense. Leased assets are depreciated on a straight line basis over their estimated useful lives to the Council where it is likely that the Council will obtain ownership of the asset or over the term of the lease, whichever is the shorter. Council had no fi nance leases at reporting date.
Operating leases
Lease payments for operating leases are required by the accounting standard to be recognised on a straight line basis, rather than expensed in the years in which they are incurred.
Leasehold improvements
Leasehold improvements are recognised at cost and are amortised over the unexpired period of the lease or the estimated useful life of the improvement, whichever is the shorter. Council does not have any leasehold improvements at reporting date.
Notes to the Financial Report
9090
Our
Peo
ple
Our
Per
form
ance
Co
rp. G
ove
rnan
ceFi
nanc
ials
Ref
eren
ces
Intr
od
ucti
on
The
Yea
r In
Rev
iew
Our
Co
unci
l
Note 1 – Signifi cant accounting policies (cont.)
(q) Impairment of assets
At each reporting date, the Council reviews the carrying value of its assets to determine whether there is any indication that these assetshave been impaired. If such an indication exists, the recoverable amount of the asset, being the higher of the asset’s fair value lesscosts to sell and value in use, is compared to the assets carryingvalue. Any excess of the assets carrying value over its recoverable amount is expensed to the comprehensive income statement,unless the asset is carried at the revalued amount in which case,the impairment loss is recognised directly against the revaluationsurplus in respect of the same class of asset to the extent that theimpairment loss does not exceed the amount in the revaluationsurplus for that same class of asset.
(r) Trust funds and deposits
Amounts received as deposits and retention amounts controlled by Council are recognised as trust funds until they are returned, transferred in accordance with the purpose of the receipt, orforfeited (refer to note 27).
(s) Borrowings
Borrowings are initially measured at fair value, being the cost of theinterest bearing liabilities, net of transaction costs. The measurement basis subsequent to initial recognition depends on whether theCouncil has categorised its interest-bearing liabilities as eitherfi nancial liabilities designated at fair value through the profi t and loss,or fi nancial liabilities at amortised cost. Any difference between theinitial recognised amount and the redemption value is recognised innet result over the period of the borrowing using the effective interest method.
The classifi cation depends on the nature and purpose of the interest bearing liabilities. The Council determines the classifi cation of its interest bearing liabilities at initial recognition.
Borrowing costs
Borrowing costs are recognised as an expense in the period inwhich they are incurred, except where they are capitalised as part of a qualifying asset constructed by Council. Except wherespecific borrowings are obtained for the purpose of specific asset acquisition, the weighted average interest rate applicable to borrowings at balance date, excluding borrowings associatedwith superannuation, is used to determine the borrowing coststo be capitalised.
Borrowing costs include interest on bank overdrafts, interest onborrowings, and fi nance lease charges.
(t) Employee costs and benefi ts
The calculation of employee costs and benefi ts includes all relevanton-costs and are calculated as follows at reporting date.
Wages and salaries and annual leave
Liabilities for wages and salaries, including non-monetary benefi ts, annual leave and accumulated sick leave expected to be whollysettled within 12 months of the reporting date are recognised in theprovision for employee benefi ts in respect of employee services upto the reporting date, classifi ed as current liabilities and measuredat their nominal values.
Liabilities that are not expected to be wholly settled within 12 months of the reporting date are recognised in the provision for employeebenefi ts as current liabilities, measured at present value of the amounts expected to be paid when the liabilities are settled using the remuneration rate expected to apply at the time of settlement.
(t) Employee costs and benefi ts (cont.)
Long service leave
Liability for long service leave (LSL) is recognised in the provision foremployee benefi ts.
Current liability – unconditional LSL is disclosed as a current liabilityeven when the Council does not expect to settle the liability within12 months because it will not have the unconditional right to defersettlement of the entitlement should an employee take leave within12 months.
The components of this current liability are measured at :
– present value – component that is not expected to be whollysettled within 12 months.
– nominal value – component that is expected to be wholly settled within 12 months.
Classifi cation of employee costs
Non-current liability – conditional LSL that has been accrued, wherean employee is yet to reach a qualifying term of employment, isdisclosed as a non-current liability. There is an unconditional right todefer settlement of the entitlement until the employee has completedthe requisite years of service.
This non-current LSL liability is measured at present value.
(u) Leases
Finance leases
Leases of assets where substantially all the risks and rewardsincidental to ownership of the asset, are transferred to the Council areclassifi ed as fi nance leases. Finance leases are capitalised, recording an asset and a liability at the lower of the fair value of the asset andthe present value of the minimum lease payments, including anyguaranteed residual value. Lease payments are allocated between the reduction of the lease liability and the interest expense. Leasedassets are depreciated on a straight line basis over their estimateduseful lives to the Council where it is likely that the Council will obtain ownership of the asset or over the term of the lease, whichever is theshorter. Council had no fi nance leases at reporting date.
Operating leases
Lease payments for operating leases are required by the accountingstandard to be recognised on a straight line basis, rather thanexpensed in the years in which they are incurred.
Leasehold improvements
Leasehold improvements are recognised at cost and are amortisedover the unexpired period of the lease or the estimated useful life of the improvement, whichever is the shorter. Council does not haveany leasehold improvements at reporting date.
Notes to the Financial Report

9191
Our P
eop
leO
ur Perfo
rmance
Co
rp. G
overnance
FinancialsR
eferencesIntro
ductio
nT
he Year In Review
Our C
ouncil
Note 1 – Signifi cant accounting policies (cont.)
(v) Goods and Services Tax (GST)
Revenues, expenses and assets are recognised net of the amount of GST, except where the amount of GST incurred is not recoverable from the Australian Tax Offi ce. In these circumstances the GST is recognised as part of the cost of acquisition of the asset or as part of an item of the expense. Receivables and payables in the balance sheet are shown inclusive of GST.
Cash fl ows are presented in the Statement of Cash fl ows on a gross basis, except for the GST component of investing and fi nancing activities, which are disclosed as operating cash fl ows.
(w) Financial guarantees
Financial guarantee contracts are not recognised as a liability in the balance sheet unless the lender has exercised their right to call on the guarantee or Council has other reasons to believe that it is probably that that right will be exercised. Details of guarantees that Council has provided, that are not recognised in the balance sheet are disclosed in Contingent Liabilities and Contingent Assets Note.
(x) Contingent assets and contingent liabilitiesand commitments
Contingent assets and contingent liabilities are not recognised in the Balance Sheet, but are disclosed by way of a note and, if quantifi able, are measured at nominal value. Contingent assets and liabilities are presented inclusive of GST receivable or payable respectively.
Commitments are not recognised in the Balance Sheet. Commitments are disclosed at their nominal value by wayof note and presented inclusive of the GST payable.
(y) Pending accounting standards
Certain new AAS’s have been issued that are not mandatory for the 30 June 2015 reporting period. Council has assessed these pending standards and has identifi ed that no material impact will fl ow from the application of these standards in future reporting periods.
(z) Rounding
Unless otherwise stated, amounts in the fi nancial report have been rounded to the nearest thousand dollars. Figures in the fi nancial statements may not equate due to rounding.
9191
Our P
eop
leO
ur Perfo
rmance
Co
rp. G
overnance
FinancialsR
eferencesIntro
ductio
nT
he Year In Review
Our C
ouncil
Note 1 – Signifi cant accounting policies (cont.)
(v) Goods and Services Tax (GST)
Revenues, expenses and assets are recognised net of the amountof GST, except where the amount of GST incurred is not recoverable from the Australian Tax Offi ce. In these circumstances the GST is recognised as part of the cost of acquisition of the asset or as part of an item of the expense. Receivables and payables in the balancesheet are shown inclusive of GST.
Cash fl ows are presented in the Statement of Cash fl ows on a gross basis, except for the GST component of investing and fi nancingactivities, which are disclosed as operating cash fl ows.
(w) Financial guarantees
Financial guarantee contracts are not recognised as a liability in the balance sheet unless the lender has exercised their right to callon the guarantee or Council has other reasons to believe that it isprobably that that right will be exercised. Details of guarantees thatCouncil has provided, that are not recognised in the balance sheetare disclosed in Contingent Liabilities and Contingent Assets Note.
(x) Contingent assets and contingent liabilitiesand commitments
Contingent assets and contingent liabilities are not recognised in the Balance Sheet, but are disclosed by way of a note and, if quantifi able,are measured at nominal value. Contingent assets and liabilities arepresented inclusive of GST receivable or payable respectively.
Commitments are not recognised in the Balance Sheet.Commitments are disclosed at their nominal value by wayof note and presented inclusive of the GST payable.
(y) Pending accounting standards
Certain new AAS’s have been issued that are not mandatory for the30 June 2015 reporting period. Council has assessed these pendingstandards and has identifi ed that no material impact will fl ow fromthe application of these standards in future reporting periods.
(z) Rounding
Unless otherwise stated, amounts in the fi nancial report have beenrounded to the nearest thousand dollars. Figures in the fi nancialstatements may not equate due to rounding.

9292
Our
Peo
ple
Our
Per
form
ance
Co
rp. G
ove
rnan
ceFi
nanc
ials
Ref
eren
ces
Intr
od
ucti
on
The
Yea
r In
Rev
iew
Our
Co
unci
l
Notes to the Financial Report
Note 2 Budget comparison
The budget comparison notes compare Council’s fi nancial plan, expressed through its annual budget, with actual performance. The Local Government (Planning and Reporting) Regulations 2014 requires explanation of any material variances. Council has adopted a materiality threshold of greater than 10 percent or $1,000,000 where further explanation is warranted. Explanationshave not been provided for variations below the materiality threshold unless the variance is considered to be material becauseof its nature.
The budget fi gures detailed below are those adopted by Council on 23 June 2014. The Budget was based on assumptions that were relevant at the time of adoption of the Budget. Council sets guidelines and parameters for revenue and expense targets in this budget in order to meet Council’s business plan and fi nancial performance targets for both the short and long-term. The budget did not refl ect any changes to equity resulting from asset revaluations, as their impacts were not considered predictable.
These notes are prepared to meet the requirements of the Local Government Act 1989 and the Local Government (Planningand Reporting) Regulations 2014.
(a) Income and Expenditure
Ref
Budget2015$'000
Actual2015$'000
Variance2015$'000
Variance2015
%
Income
Rates and charges 151,380 152,040 660 0.4
Statutory fees and fi nes 11,198 11,847 649 5.5
User fees 12,284 12,324 40 0.3
Grants – recurrent operating 1 13,546 16,231 2,685 16.5
Grants – recurrent capital 426 399 (27) (6.8)
Grants – non recurrent capital 2 1,405 1,881 476 25.3
Contributions – monetary 3 1,565 5,587 4,022 72.0
Contributions – non monetary – 13 13 100.0
Other income 4 6,102 7,643 1,541 20.2
Net loss on disposal of property, infrastructure, plant and equipment
(3,313) (3,187) 126 (4.0)
Share of net losses of associates and joint ventures
5 – (4,668) (4,668) 100.0
Total income 194,593 200,110 5,517 2.8
Expenses
Employee costs 73,121 73,573 452 0.6
Materials and services 51,126 51,074 (52) (0.1)
Bad and doubtful debts 6 1,175 853 (322) (37.7)
Depreciation and amortisation 29,768 29,638 (130) (0.4)
Borrowing costs 7 3,421 4,429 1,008 22.8
Other expenses 11,124 10,434 (690) (6.6)
Total expenses 169,735 170,001 266 0.2
Surplus for the year 24,858 30,109 5,251 17.4
9292
Our
Peo
ple
Our
Per
form
ance
Co
rp. G
ove
rnan
ceFi
nanc
ials
Ref
eren
ces
Intr
od
ucti
on
The
Yea
r In
Rev
iew
Our
Co
unci
l
Notes to the Financial Report
Note 2 Budget comparison
The budget comparison notes compare Council’s fi nancial plan, expressed through its annual budget, with actual performance. The Local Government (Planning and Reporting) Regulations 2014 requires explanation of any material variances. Council hasadopted a materiality threshold of greater than 10 percent or $1,000,000 where further explanation is warranted. Explanationshave not been provided for variations below the materiality threshold unless the variance is considered to be material becauseof its nature.
The budget fi gures detailed below are those adopted by Council on 23 June 2014. The Budget was based on assumptions that were relevant at the time of adoption of the Budget. Council sets guidelines and parameters for revenue and expense targets in thisbudget in order to meet Council’s business plan and fi nancial performance targets for both the short and long-term. The budget didnot refl ect any changes to equity resulting from asset revaluations, as their impacts were not considered predictable.
These notes are prepared to meet the requirements of the Local Government Act 1989 and the Local Government (Planningand Reporting) Regulations 2014.
(a) Income and Expenditure
Ref
Budget2015$'000
Actual2015$'000
Variance2015$'000
Variance2015
%
Income
Rates and charges 151,380 152,040 660 0.4
Statutory fees and fi nes 11,198 11,847 649 5.5
User fees 12,284 12,324 40 0.3
Grants – recurrent operating 1 13,546 16,231 2,685 16.5
Grants – recurrent capital 426 399 (27) (6.8)
Grants – non recurrent capital 2 1,405 1,881 476 25.3
Contributions – monetary 3 1,565 5,587 4,022 72.0
Contributions – non monetary – 13 13 100.0
Other income 4 6,102 7,643 1,541 20.2
Net loss on disposal of property, infrastructure, plant and equipment
(3,313) (3,187) 126 (4.0)
Share of net losses of associates and joint ventures
5 – (4,668) (4,668) 100.0
Total income 194,593 200,110 5,517 2.8
Expenses
Employee costs 73,121 73,573 452 0.6
Materials and services 51,126 51,074 (52) (0.1)
Bad and doubtful debts 6 1,175 853 (322) (37.7)
Depreciation and amortisation 29,768 29,638 (130) (0.4)
Borrowing costs 7 3,421 4,429 1,008 22.8
Other expenses 11,124 10,434 (690) (6.6)
Total expenses 169,735 170,001 266 0.2
Surplus for the year 24,858 30,109 5,251 17.4

9393
Our P
eop
leO
ur Perfo
rmance
Co
rp. G
overnance
FinancialsR
eferencesIntro
ductio
nT
he Year In Review
Our C
ouncil
(i) Explanation of material variations
Variance Ref Item Explanation
1 Grants – recurrent operating The early receipt of the 2015–16 Victoria Grants Commission grant allocation of $2.17 million (50%) which resulted in higher than budgeted recurrent operating grants.
2 Grants – non recurrent capital Grants-non recurrent capital variance is due to unbudgeted funding for various projects including Glenferrie Oval water management plan design and Eric Raven multi purpose synthetic facility.
3 Contributions – monetary Developer open space contributions are difficult to predict from one year to the next. The 2014–15 contributions were higher than expected due to an increase in the number of developments and hence higher contributions were received. The annual budget is based on the historical level of income received over the prior five year period.
4 Other income Other income is above budget due to an increased number of term deposits, resulting in higher interest on investments of $580,000. Road footpath occupation was $623,000 above budget due to increased development activity. Reimbursement of materials and costs of $298,000 was higher partially due to reimbursement for overcharged copier costs.
5 Share of net losses of associates and joint ventures
No budget was set for investment in associates due to informationnot being available when the budget was set.
6 Bad and doubtful debts Bad and doubtful debts is lower than budget due to State government improved collection processes for parking fines.
7 Finance costs Borrowing costs were higher than budget due to refinancing including break costs of a 20 year loan to a four year loan; withthe resultant long term future interest savings.
9393
Our P
eop
leO
ur Perfo
rmance
Co
rp. G
overnance
FinancialsR
eferencesIntro
ductio
nT
he Year In Review
Our C
ouncil
(i) Explanation of material variations
Variance Ref Item Explanation
1 Grants – recurrent operating The early receipt of the 2015–16 Victoria Grants Commission grantallocation of $2.17 million (50%) which resulted in higher than budgeted recurrent operating grants.
2 Grants – non recurrent capital Grants-non recurrent capital variance is due to unbudgeted funding for various projects including Glenferrie Oval water management plandesign and Eric Raven multi purpose synthetic facility.
3 Contributions – monetary Developer open space contributions are difficult to predict from one year to the next. The 2014–15 contributions were higher than expected due to an increase in the number of developments and hence higher contributions were received. The annual budget is based on the historical level of income received over the prior five year period.
4 Other income Other income is above budget due to an increased number of term deposits, resulting in higher interest on investments of $580,000. Road footpath occupation was $623,000 above budget due toincreased development activity. Reimbursement of materials and costs of $298,000 was higher partially due to reimbursement for overcharged copier costs.
5 Share of net losses of associatesand joint ventures
No budget was set for investment in associates due to informationnot being available when the budget was set.
6 Bad and doubtful debts Bad and doubtful debts is lower than budget due to Stategovernment improved collection processes for parking fines.
7 Finance costs Borrowing costs were higher than budget due to refinancingincluding break costs of a 20 year loan to a four year loan; withthe resultant long term future interest savings.

9494
Our
Peo
ple
Our
Per
form
ance
Co
rp. G
ove
rnan
ceFi
nanc
ials
Ref
eren
ces
Intr
od
ucti
on
The
Yea
r In
Rev
iew
Our
Co
unci
l
Notes to the Financial Report
Note 2 Budget comparison (cont.)
(b) Capital works
Ref
Budget2015$'000
Actual2015$'000
Variance2015$'000
Variance2015
%
Property
Land – – –
Land improvements 28 28 –
Total land 28 28 –
Buildings 1 29,233 26,632 (2,601) (8.9)
Building improvements 4,951 4,614 (337) (6.8)
Total buildings 34,184 31,246 (2,938) (8.6)
Total property 34,212 31,274 (2,938) (8.6)
Plant and equipment
Plant, machinery and equipment 2 859 1,079 220 25.6
Fixtures, fi ttings and furniture 3 163 264 101 62.0
Computers and telecommunications
4 1,702 1,079 (623) (36.6)
Library books 1,090 1,081 (9) (0.8)
Total Plant and equipment 3,814 3,503 (311) (8.2)
Infrastructure
Roads 8,228 8,171 (57) (0.7)
Bridges 5 302 754 452 149.7
Footpaths and cycleways 6 3,427 1,802 (1,625) (47.4)
Drainage 7 4,369 3,506 (863) (19.8)
Recreational, leisure and community facilities
8 1,132 1,454 322 28.4
Parks, open space and streetscapes
9 2,786 3,165 379 13.6
Off street car parks 10 649 551 (98) (15.1)
Other infrastructure 11 70 386 316 451.4
Total infrastructure 20,963 19,789 (1,174) (5.6)
Total capital works expenditure 58,989 54,566 (4,423) (7.5)
Represented by:
New asset expenditure 2,985 2,557 (428) (14.3)
Asset renewal expenditure 45,094 42,924 (2,170) (4.8)
Asset expansion expenditure 3,936 3,273 (663) (16.8)
Asset upgrade expenditure 6,974 5,812 (1,162) (16.7)
Total capital works expenditure 58,989 54,566 (4,423) (7.5)
9494
Our
Peo
ple
Our
Per
form
ance
Co
rp. G
ove
rnan
ceFi
nanc
ials
Ref
eren
ces
Intr
od
ucti
on
The
Yea
r In
Rev
iew
Our
Co
unci
l
Notes to the Financial Report
Note 2 Budget comparison (cont.)
(b) Capital works
Ref
Budget2015$'000
Actual2015$'000
Variance2015$'000
Variance2015
%
Property
Land – – –
Land improvements 28 28 –
Total land 28 28 –
Buildings 1 29,233 26,632 (2,601) (8.9)
Building improvements 4,951 4,614 (337) (6.8)
Total buildings 34,184 31,246 (2,938) (8.6)
Total property 34,212 31,274 (2,938) (8.6)
Plant and equipment
Plant, machinery and equipment 2 859 1,079 220 25.6
Fixtures, fi ttings and furniture 3 163 264 101 62.0
Computers andtelecommunications
4 1,702 1,079 (623) (36.6)
Library books 1,090 1,081 (9) (0.8)
Total Plant and equipment 3,814 3,503 (311) (8.2)
Infrastructure
Roads 8,228 8,171 (57) (0.7)
Bridges 5 302 754 452 149.7
Footpaths and cycleways 6 3,427 1,802 (1,625) (47.4)
Drainage 7 4,369 3,506 (863) (19.8)
Recreational, leisure andcommunity facilities
8 1,132 1,454 322 28.4
Parks, open space andstreetscapes
9 2,786 3,165 379 13.6
Off street car parks 10 649 551 (98) (15.1)
Other infrastructure 11 70 386 316 451.4
Total infrastructure 20,963 19,789 (1,174) (5.6)
Total capital works expenditure 58,989 54,566 (4,423) (7.5)
Represented by:
New asset expenditure 2,985 2,557 (428) (14.3)
Asset renewal expenditure 45,094 42,924 (2,170) (4.8)
Asset expansion expenditure 3,936 3,273 (663) (16.8)
Asset upgrade expenditure 6,974 5,812 (1,162) (16.7)
Total capital works expenditure 58,989 54,566 (4,423) (7.5)

9595
Our P
eop
leO
ur Perfo
rmance
Co
rp. G
overnance
FinancialsR
eferencesIntro
ductio
nT
he Year In Review
Our C
ouncil
(i) Explanation of material variations
Variance Ref Item Explanation
1 Buildings Buildings variance is primarily due to major projects including Ashburton Pool & Recreation Centre and Boroondara Sports Complex. The building construction contract for the works at Boroondara Sports Complex was awarded on 9 February 2015and works will be completed in April 2016 as per theoriginal project program.
2 Plant, machinery and equipment Plant, machinery and equipment is higher than budgetdue to additional equipment requirements at the Leisureand Aquatic Centres.
3 Fixtures, fittings and furniture Fixtures, fittings and furniture are higher than budget due to the relocation of a number of functions within Council offices to facilitate an organisational restructure. In addition an increased focus on occupational health and safety requirements was implemented.
4 Computers and telecommunications Capital expenditure relating to computers and telecommunications was below budget by $623,000 due to negotiations which allowed Council to make the first payment on a new Electronic Document Management System in 2015–16.
5 Bridges Bridges variance is due to the reclassification between assetclasses of footpaths & cycleways and bridges of $600,000 relatingto Gardiners Creek Trail – bicycle and pedestrian bridge project.
6 Footpaths and cycleways Capital expenditure relating to footpaths & cycleways was below budget by $1.02 million due to a delay in a number of projects: Bicycle Strategy Implementation, Kew Junction / Glenferrie Precinct Walkability Improvements and Victoria Park Concept Masterplan Implementation – Stage 3. There was also a reclassification between footpaths and cycleways and bridges of $600,000 for Gardiners Creek Trail – bicycle and pedestrian bridge.
7 Drainage Capital expenditure relating to drainage was below budget by $863,000 due to delays in a number of projects including: Relining at High Street between Parkhill & Belford Roads in Kew, Coolongata Road, Glyndon Road, Fairmont Avenue in Camberwell and relining at Lower Riversdale Road, Camberwell which are all expected to be completed in 2015–16.
8 Recreational, leisure and community facilities
Variance is due to the reclassification of asset classes from building to recreational, leisure and community facilities for the Victoria Parks Gates Restoration.
9 Parks, open space and streetscapes
Parks, open space and streetscapes variance is due to grantfunding received late 2013–14 and subsequently project completed in 2014–15.
10 Off street car parks Primarily due to savings generated by the design componentof the Junction West Precinct – The Well.
11 Other infrastructure This variance is due to reclassification of the works between asset classes, from footpaths & cycleways to other infrastructure for the Victoria Park Concept Masterplan project. Other minor projects have been reclassified from buildings to other infrastructure.
9595
Our P
eop
leO
ur Perfo
rmance
Co
rp. G
overnance
FinancialsR
eferencesIntro
ductio
nT
he Year In Review
Our C
ouncil
(i) Explanation of material variations
Variance Ref Item Explanation
1 Buildings Buildings variance is primarily due to major projects including Ashburton Pool & Recreation Centre and Boroondara Sports Complex. The building construction contract for the works at Boroondara Sports Complex was awarded on 9 February 2015and works will be completed in April 2016 as per theoriginal project program.
2 Plant, machinery and equipment Plant, machinery and equipment is higher than budgetdue to additional equipment requirements at the Leisureand Aquatic Centres.
3 Fixtures, fittings and furniture Fixtures, fittings and furniture are higher than budget due to the relocation of a number of functions within Council offices to facilitate an organisational restructure. In addition an increased focus on occupational health and safety requirements was implemented.
4 Computers and telecommunications Capital expenditure relating to computers and telecommunications was below budget by $623,000 due to negotiations which allowedCouncil to make the first payment on a new Electronic DocumentManagement System in 2015–16.
5 Bridges Bridges variance is due to the reclassification between assetclasses of footpaths & cycleways and bridges of $600,000 relatingto Gardiners Creek Trail – bicycle and pedestrian bridge project.
6 Footpaths and cycleways Capital expenditure relating to footpaths & cycleways was below budget by $1.02 million due to a delay in a number of projects: Bicycle Strategy Implementation, Kew Junction / Glenferrie PrecinctWalkability Improvements and Victoria Park Concept MasterplanImplementation – Stage 3. There was also a reclassification betweenfootpaths and cycleways and bridges of $600,000 for Gardiners Creek Trail – bicycle and pedestrian bridge.
7 Drainage Capital expenditure relating to drainage was below budget by $863,000 due to delays in a number of projects including: Relining at High Street between Parkhill & Belford Roads in Kew, CoolongataRoad, Glyndon Road, Fairmont Avenue in Camberwell and relining at Lower Riversdale Road, Camberwell which are all expected to becompleted in 2015–16.
8 Recreational, leisure andcommunity facilities
Variance is due to the reclassification of asset classes from building to recreational, leisure and community facilities for the Victoria ParksGates Restoration.
9 Parks, open space and streetscapes
Parks, open space and streetscapes variance is due to grantfunding received late 2013–14 and subsequently project completed in 2014–15.
10 Off street car parks Primarily due to savings generated by the design componentof the Junction West Precinct – The Well.
11 Other infrastructure This variance is due to reclassification of the works between assetclasses, from footpaths & cycleways to other infrastructure for the Victoria Park Concept Masterplan project. Other minor projects havebeen reclassified from buildings to other infrastructure.

9696
Our
Peo
ple
Our
Per
form
ance
Co
rp. G
ove
rnan
ceFi
nanc
ials
Ref
eren
ces
Intr
od
ucti
on
The
Yea
r In
Rev
iew
Our
Co
unci
l
2015$’000
2014$’000
Note 3 Rates and charges
Council uses Capital Improved Value (CIV) as the basis of valuation of all properties within the municipal district. The CIV of a property is the value of the land and all improvements. The valuation base used to calculate general rates for 2014–15 was $81.45 million (2013–14: $73.25 million). The 2014–15 rate in the CIV dollar was 0.001615 (2013–14: 0.001693).
General rates 129,107 121,878
Cultural and recreational 51 52
Supplementary rates and rate adjustments 1,535 1,241
Waste management charge 20,093 19,743
Special rates and charges 1,254 1,219
Total rates and charges 152,040 144,133
The date of the latest general revaluation of land for rating purposes within the municipal district was 1 January 2014 and the valuation will be fi rst applied in the rating year commencing 1 July 2014.
Note 4 Statutory fees and fi nes
Infringements and costs 8,729 7,728
Court recoveries 627 691
Town planning fees 1,376 1,749
Land information certifi cates 155 147
Permits 960 1,091
Total statutory fees and fi nes 11,847 11,406
Note 5 User fees
Aged and health services fees 2,085 2,082
Building services 1,126 1,074
Road occupancy, traffi c and drainage 781 722
Child care/children's program fees 373 435
Parking 1,582 1,398
Leisure centre and recreation fees 2,843 2,758
Registrations and other permits 999 985
Waste management services 1,478 1,360
Other fees and charges 1,057 1,114
Total user fees 12,324 11,928
Notes to the Financial Report
9696
Our
Peo
ple
Our
Per
form
ance
Co
rp. G
ove
rnan
ceFi
nanc
ials
Ref
eren
ces
Intr
od
ucti
on
The
Yea
r In
Rev
iew
Our
Co
unci
l
2015$’000
2014$’000
Note 3 Rates and charges
Council uses Capital Improved Value (CIV) as the basis of valuation of all propertieswithin the municipal district. The CIV of a property is the value of the land and all improvements. The valuation base used to calculate general rates for 2014–15 was $81.45 million (2013–14: $73.25 million). The 2014–15 rate in the CIV dollar was 0.001615 (2013–14: 0.001693).
General rates 129,107 121,878
Cultural and recreational 51 52
Supplementary rates and rate adjustments 1,535 1,241
Waste management charge 20,093 19,743
Special rates and charges 1,254 1,219
Total rates and charges 152,040 144,133
The date of the latest general revaluation of land for rating purposes within the municipaldistrict was 1 January 2014 and the valuation will be fi rst applied in the rating yearcommencing 1 July 2014.
Note 4 Statutory fees and fi nes
Infringements and costs 8,729 7,728
Court recoveries 627 691
Town planning fees 1,376 1,749
Land information certifi cates 155 147
Permits 960 1,091
Total statutory fees and fi nes 11,847 11,406
Note 5 User fees
Aged and health services fees 2,085 2,082
Building services 1,126 1,074
Road occupancy, traffi c and drainage 781 722
Child care/children's program fees 373 435
Parking 1,582 1,398
Leisure centre and recreation fees 2,843 2,758
Registrations and other permits 999 985
Waste management services 1,478 1,360
Other fees and charges 1,057 1,114
Total user fees 12,324 11,928
Notes to the Financial Report
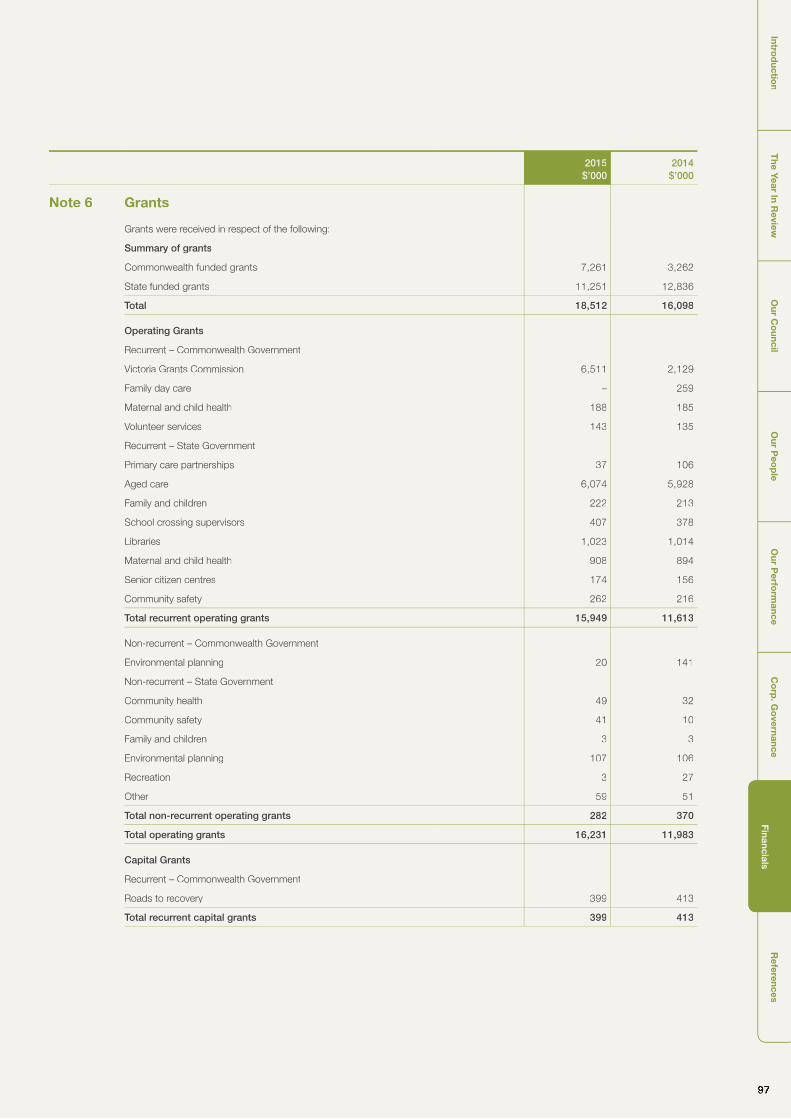
9797
Our P
eop
leO
ur Perfo
rmance
Co
rp. G
overnance
FinancialsR
eferencesIntro
ductio
nT
he Year In Review
Our C
ouncil
2015$’000
2014$’000
Note 6 Grants
Grants were received in respect of the following:
Summary of grants
Commonwealth funded grants 7,261 3,262
State funded grants 11,251 12,836
Total 18,512 16,098
Operating Grants
Recurrent – Commonwealth Government
Victoria Grants Commission 6,511 2,129
Family day care – 259
Maternal and child health 188 185
Volunteer services 143 135
Recurrent – State Government
Primary care partnerships 37 106
Aged care 6,074 5,928
Family and children 222 213
School crossing supervisors 407 378
Libraries 1,023 1,014
Maternal and child health 908 894
Senior citizen centres 174 156
Community safety 262 216
Total recurrent operating grants 15,949 11,613
Non-recurrent – Commonwealth Government
Environmental planning 20 141
Non-recurrent – State Government
Community health 49 32
Community safety 41 10
Family and children 3 3
Environmental planning 107 106
Recreation 3 27
Other 59 51
Total non-recurrent operating grants 282 370
Total operating grants 16,231 11,983
Capital Grants
Recurrent – Commonwealth Government
Roads to recovery 399 413
Total recurrent capital grants 399 413

9898
Our
Peo
ple
Our
Per
form
ance
Co
rp. G
ove
rnan
ceFi
nanc
ials
Ref
eren
ces
Intr
od
ucti
on
The
Yea
r In
Rev
iew
Our
Co
unci
l
2015$’000
2014$’000
Note 6 Grants (cont.)
Non-recurrent – State Government
Buildings 900 1,224
Plant, machinery and equipment 50 70
Drainage – 2
Footpaths and cycleways – 152
Environment 299 29
Streetscapes and transport 30 545
Bridges 439 1,225
Community safety 49 369
Sport and recreation 114 86
Total non-recurrent capital grants 1,881 3,702
Total capital grants 2,280 4,115
Conditions on grants
Grants recognised as revenue during the year that were obtained on condition that they be expended in a specifi ed manner that had not occurred at balance date were:
433 1,464
Grants which were recognised as revenue in prior years and were expended during the current year in the manner specifi ed by the grantor were:
1,343 749
Net increase (decrease) in restricted assets resulting from grant revenues for the year:
(910) 1,464
Note 7 Contributions
Monetary 5,587 4,033
Non-monetary 13 1,090
Total contributions 5,600 5,123
Contributions of non-monetary asset were received in relation to the following asset
Recreational, leisure & community facilities – 627
Land – 397
Land under roads – 66
Other 13 –
Note 8 Net gain/(loss) on disposal of property, infrastructure, plant and equipment
Proceeds of sale – 1,806
Written down value of assets sold, replaced and disposed (3,187) (6,000)
Selling costs – (80)
Total net gain/(loss) on disposal of property, infrastructure, plant and equipment
(3,187) (4,274)
Notes to the Financial Report
9898
Our
Peo
ple
Our
Per
form
ance
Co
rp. G
ove
rnan
ceFi
nanc
ials
Ref
eren
ces
Intr
od
ucti
on
The
Yea
r In
Rev
iew
Our
Co
unci
l
2015$’000
2014$’000
Note 6 Grants (cont.)
Non-recurrent – State Government
Buildings 900 1,224
Plant, machinery and equipment 50 70
Drainage – 2
Footpaths and cycleways – 152
Environment 299 29
Streetscapes and transport 30 545
Bridges 439 1,225
Community safety 49 369
Sport and recreation 114 86
Total non-recurrent capital grants 1,881 3,702
Total capital grants 2,280 4,115
Conditions on grants
Grants recognised as revenue during the year that were obtained on condition that they be expended in a specifi ed manner that had not occurred at balance date were:
433 1,464
Grants which were recognised as revenue in prior years and wereexpended during the current year in the manner specifi ed by thegrantor were:
1,343 749
Net increase (decrease) in restricted assets resulting from grantrevenues for the year:
(910) 1,464
Note 7 Contributions
Monetary 5,587 4,033
Non-monetary 13 1,090
Total contributions 5,600 5,123
Contributions of non-monetary asset were received in relation to thefollowing asset
Recreational, leisure & community facilities – 627
Land – 397
Land under roads – 66
Other 13 –
Note 8 Net gain/(loss) on disposal of property, infrastructure,plant and equipment
Proceeds of sale – 1,806
Written down value of assets sold, replaced and disposed (3,187) (6,000)
Selling costs – (80)
Total net gain/(loss) on disposal of property, infrastructure, plant and equipment
(3,187) (4,274)
Notes to the Financial Report

9999
Our P
eop
leO
ur Perfo
rmance
Co
rp. G
overnance
FinancialsR
eferencesIntro
ductio
nT
he Year In Review
Our C
ouncil
2015$’000
2014$’000
Note 9 Other income
Interest 2,560 2,287
Investment property rental 154 145
Other rental income 2,260 2,216
Reimbursements 1,110 1,145
Right-of-way sales 451 446
Traffi c and drainage 973 657
Other income 135 379
Total other income 7,643 7,275
Note 10 (a) Employee Costs
Wages and salaries 57,925 54,776
WorkCover 667 948
Casual staff 2,554 2,503
Annual leave and long service leave 5,951 5,858
Superannuation 5,764 5,221
Fringe benefi ts tax 509 482
Other 203 54
Total employee costs 73,573 69,842
Note 10 (b) Superannuation
Superannuation
Council made contributions to the following funds:
Defi ned benefi t fund
Employer contributions to Local Authorities Superannuation Fund (Vision Super) 623 641
623 641
Employer contributions payable at reporting date. – 5
Accumulation funds
Employer contributions to Local Authorities Superannuation Fund (Vision Super) 3,493 3,301
Employer contributions – other funds 1,511 1,249
5,004 4,550
Employer contributions payable at reporting date. 137 25
City of Boroondara makes the majority of its employer superannuation contributions in respect of its employeesto the Local Authorities Superannuation Fund (the Fund). This Fund has two categories of membership, accumulationand defi ned benefi t, each of which is funded differently. Obligations for contributions to the Fund are recognised as anexpense in Comprehensive Income Statement when they are made or due.

100100
Our
Peo
ple
Our
Per
form
ance
Co
rp. G
ove
rnan
ceFi
nanc
ials
Ref
eren
ces
Intr
od
ucti
on
The
Yea
r In
Rev
iew
Our
Co
unci
l
2015$’000
2014$’000
Note 10 (b) Superannuation (cont.)
Accumulation
The Fund’s accumulation categories, Vision MySuper/Vision Super Saver, receives both employer and employee contributions on a progressive basis. Employer contributions are normally based on a fi xed percentage of employee earnings (for the year ended 30 June 2015, this was 9.5% required under Superannuation Guarantee legislation (for 2013–14, this was 9.25%).
Defi ned Benefi t
City of Boroondara does not use defi ned benefi t accounting for its defi ned benefi t obligations under the Fund’s Defi ned Benefi t category. This is because the Fund’s Defi ned Benefi t category is a pooled multi-employer sponsored plan.
There is no proportional split of the defi ned benefi t liabilities, assets or costs between the participating employers as the defi ned benefi t obligation is a fl oating obligation between the participating employers and the only time that the aggregate obligation is allocated to specifi c employers is when a call is made. As a result, the level of participation of City of Boroondara in the Fund cannot be measured as a percentage compared with other participating employers. Therefore, the Actuary is unable to allocate benefi t liabilities, assets and costs between employers for the purposes of AASB 119.
Refer to note 30 and 36 for more details.
Note 11 Materials and services
Contract payments and trade services 24,775 24,880
Building maintenance 3,113 3,007
General maintenance 1,621 2,398
Utilities 3,716 3,741
Offi ce and administration 4,774 4,962
Information technology 2,408 2,130
Insurance 1,591 1,582
Consultants 5,279 5,241
Plant and equipment maintenance 1,852 2,253
Financial and legal 1,829 1,676
Other 116 149
Total materials and services 51,074 52,019
Note 12 Bad and doubtful debts
Parking fi ne and local laws debtors 804 836
Other debtors 49 40
Total bad and doubtful debts 853 876
Note 13 Depreciation and amortisation
Property 10,498 9,894
Plant and equipment 4,444 3,879
Infrastructure 14,341 14,563
Intangible assets 242 243
Investment property 113 67
Total depreciation and amortisation 29,638 28,646
Refer to note 23 for a more detailed breakdown of depreciation and amortisation charges
Notes to the Financial Report
100100
Our
Peo
ple
Our
Per
form
ance
Co
rp. G
ove
rnan
ceFi
nanc
ials
Ref
eren
ces
Intr
od
ucti
on
The
Yea
r In
Rev
iew
Our
Co
unci
l
2015$’000
2014$’000
Note 10 (b) Superannuation (cont.)
Accumulation
The Fund’s accumulation categories, Vision MySuper/Vision Super Saver, receives both employer and employee contributions on a progressive basis. Employer contributions are normally based on a fi xed percentage of employee earnings (for the year ended 30 June2015, this was 9.5% required under Superannuation Guarantee legislation (for 2013–14, this was 9.25%).
Defi ned Benefi t
City of Boroondara does not use defi ned benefi t accounting for its defi ned benefi tobligations under the Fund’s Defi ned Benefi t category. This is because the Fund’s Defi ned Benefi t category is a pooled multi-employer sponsored plan.
There is no proportional split of the defi ned benefi t liabilities, assets or costs between theparticipating employers as the defi ned benefi t obligation is a fl oating obligation between the participating employers and the only time that the aggregate obligation is allocatedto specifi c employers is when a call is made. As a result, the level of participation of City of Boroondara in the Fund cannot be measured as a percentage compared with otherparticipating employers. Therefore, the Actuary is unable to allocate benefi t liabilities, assets and costs between employers for the purposes of AASB 119.
Refer to note 30 and 36 for more details.
Note 11 Materials and services
Contract payments and trade services 24,775 24,880
Building maintenance 3,113 3,007
General maintenance 1,621 2,398
Utilities 3,716 3,741
Offi ce and administration 4,774 4,962
Information technology 2,408 2,130
Insurance 1,591 1,582
Consultants 5,279 5,241
Plant and equipment maintenance 1,852 2,253
Financial and legal 1,829 1,676
Other 116 149
Total materials and services 51,074 52,019
Note 12 Bad and doubtful debts
Parking fi ne and local laws debtors 804 836
Other debtors 49 40
Total bad and doubtful debts 853 876
Note 13 Depreciation and amortisation
Property 10,498 9,894
Plant and equipment 4,444 3,879
Infrastructure 14,341 14,563
Intangible assets 242 243
Investment property 113 67
Total depreciation and amortisation 29,638 28,646
Refer to note 23 for a more detailed breakdown of depreciation and amortisation charges
Notes to the Financial Report

101101
Our P
eop
leO
ur Perfo
rmance
Co
rp. G
overnance
FinancialsR
eferencesIntro
ductio
nT
he Year In Review
Our C
ouncil
2015$’000
2014$’000
Note 14 Borrowing costs
Interest on borrowings 4,429 3,579
Total borrowing costs 4,429 3,579
Note 15 Other expenses
Auditors' remuneration – VAGO – audit of the fi nancial statements, performance statement and grant acquittals
61 62
Auditors' remuneration – Internal 69 84
Councillors' allowances 373 362
Operating lease rentals 4,953 5,054
Community grants and contributions 2,526 2,539
Training and professional development 952 1,036
Special rate scheme expenditure 1,254 1,223
Other expenditure 246 1,036
Total other expenses 10,434 11,396
Note 16 Investments in associates
Background
The City of Boroondara has entered into a joint venture arrangement called South Eastern Regional Landfi ll, which has developed a refuse tip for a number of municipalities.The Council has a 35.22% interest in the assets, liabilities, revenues and expenses of the joint venture. The remaining joint venture partners include City of Glen Eira, City of Monash, City of Whitehorse and City of Stonnington.
Council's share of accumulated surplus(defi cit)
Council's share of accumulated surplus(defi cit) at start of year 1,764 3,532
Surplus(defi cit) for year (4,668) (1,768)
Council's share of accumulated surplus(defi cit) at end of year (2,904) 1,764
Council's share of reserves
Council's share of reserves at start of year – 218
Transfers to (from) reserves – (218)
Council's share of reserves at end of year – –
Movement in carrying value of specifi c investment
Carrying value of investment at start of year 3,404 5,390
Share of surplus(defi cit) for year (4,668) (1,768)
Share of asset revaluation – 114
Share of movement in retained earnings – (332)
Carrying value of investment at end of year (1,264) 3,404
Council's share of expenditure commitments
Capital commitments 32 101
32 101
101101
Our P
eop
leO
ur Perfo
rmance
Co
rp. G
overnance
FinancialsR
eferencesIntro
ductio
nT
he Year In Review
Our C
ouncil
2015$’000
2014$’000
Note 14 Borrowing costs
Interest on borrowings 4,429 3,579
Total borrowing costs 4,429 3,579
Note 15 Other expenses
Auditors' remuneration – VAGO – audit of the fi nancial statements, performance statement and grant acquittals
61 62
Auditors' remuneration – Internal 69 84
Councillors' allowances 373 362
Operating lease rentals 4,953 5,054
Community grants and contributions 2,526 2,539
Training and professional development 952 1,036
Special rate scheme expenditure 1,254 1,223
Other expenditure 246 1,036
Total other expenses 10,434 11,396
Note 16 Investments in associates
Background
The City of Boroondara has entered into a joint venture arrangement called South EasternRegional Landfi ll, which has developed a refuse tip for a number of municipalities.The Council has a 35.22% interest in the assets, liabilities, revenues and expenses of thejoint venture. The remaining joint venture partners include City of Glen Eira, City of Monash, City of Whitehorse and City of Stonnington.
Council's share of accumulated surplus(defi cit)
Council's share of accumulated surplus(defi cit) at start of year 1,764 3,532
Surplus(defi cit) for year (4,668) (1,768)
Council's share of accumulated surplus(defi cit) at end of year (2,904) 1,764
Council's share of reserves
Council's share of reserves at start of year – 218
Transfers to (from) reserves – (218)
Council's share of reserves at end of year – –
Movement in carrying value of specifi c investment
Carrying value of investment at start of year 3,404 5,390
Share of surplus(defi cit) for year (4,668) (1,768)
Share of asset revaluation – 114
Share of movement in retained earnings – (332)
Carrying value of investment at end of year (1,264) 3,404
Council's share of expenditure commitments
Capital commitments 32 101
32 101

102102
Our
Peo
ple
Our
Per
form
ance
Co
rp. G
ove
rnan
ceFi
nanc
ials
Ref
eren
ces
Intr
od
ucti
on
The
Yea
r In
Rev
iew
Our
Co
unci
l
2015$’000
2014$’000
Note 16 Investments in associates (cont.)
The landfi ll is scheduled to close in December 2015 and as a result an increase in the post closure provision of $12.89 million was recognised following a review of post closure expenses. The provision includes capping and gas infrastructure capital works that will be required during 2015–16 and 2016–17 ($7.80 million) and additional After care costs for the site for the next 30 years until 2045.
At balance date the landfi ll itself retains suffi cient liquidity to fund the post closure capital works and the post closure After Care expenses for the medium term. It is however likely that Council funds will be required to be expended in support of the entity in the longer term.
Note 17 Cash and cash equivalents
Cash on hand 9 9
Cash at bank 9,378 13,569
Term deposits 1,322 26,332
10,709 39,910
Councils cash and cash equivalents are subject to external restrictions that limit amounts available for discretionary use. These include:
– Trust funds and deposits (Note 27) 3,038 3,179
Total restricted funds 3,038 3,179
Total unrestricted cash and cash equivalents 7,671 36,731
Intended allocations
Although not externally restricted the following amounts have been allocated for specifi c future purposes by Council:
– Cash held to fund carried forward capital works 3,966 5,282
– Cash held to fund carried forward priority projects 1,166 1,252
– Reserves 5,270 2,201
10,402 8,735
Total funds subject to intended allocations Refer to note 19
Note 18 Trade and other receivables
Current
Rates debtors 3,369 3,404
Parking infringement debtors 5,318 4,854
Provision for doubtful debts – parking infringements (1,150) (1,149)
Loans and advances to community organisations 50 50
Other debtors 1,612 3,966
Provision for doubtful debts – other debtors (64) (45)
Net GST receivable 1,139 702
10,274 11,782
Non-current
Loans and advances to community organisations 60 110
60 110
Total trade and other receivables 10,334 11,892
Notes to the Financial Report
102102
Our
Peo
ple
Our
Per
form
ance
Co
rp. G
ove
rnan
ceFi
nanc
ials
Ref
eren
ces
Intr
od
ucti
on
The
Yea
r In
Rev
iew
Our
Co
unci
l
2015$’000
2014$’000
Note 16 Investments in associates (cont.)
The landfi ll is scheduled to close in December 2015 and as a result an increase in the post closure provision of $12.89 million was recognised following a review of post closure expenses. The provision includes capping and gas infrastructure capital works that will be required during 2015–16 and 2016–17 ($7.80 million) and additional After care costs for the site for the next 30 years until 2045.
At balance date the landfi ll itself retains suffi cient liquidity to fund the post closure capital works and the post closure After Care expenses for the medium term. It is however likelythat Council funds will be required to be expended in support of the entity in the longer term.
Note 17 Cash and cash equivalents
Cash on hand 9 9
Cash at bank 9,378 13,569
Term deposits 1,322 26,332
10,709 39,910
Councils cash and cash equivalents are subject to external restrictions that limit amountsavailable for discretionary use. These include:
– Trust funds and deposits (Note 27) 3,038 3,179
Total restricted funds 3,038 3,179
Total unrestricted cash and cash equivalents 7,671 36,731
Intended allocations
Although not externally restricted the following amounts have been allocated for specifi cfuture purposes by Council:
– Cash held to fund carried forward capital works 3,966 5,282
– Cash held to fund carried forward priority projects 1,166 1,252
– Reserves 5,270 2,201
10,402 8,735
Total funds subject to intended allocations Refer to note 19
Note 18 Trade and other receivables
Current
Rates debtors 3,369 3,404
Parking infringement debtors 5,318 4,854
Provision for doubtful debts – parking infringements (1,150) (1,149)
Loans and advances to community organisations 50 50
Other debtors 1,612 3,966
Provision for doubtful debts – other debtors (64) (45)
Net GST receivable 1,139 702
10,274 11,782
Non-current
Loans and advances to community organisations 60 110
60 110
Total trade and other receivables 10,334 11,892
Notes to the Financial Report
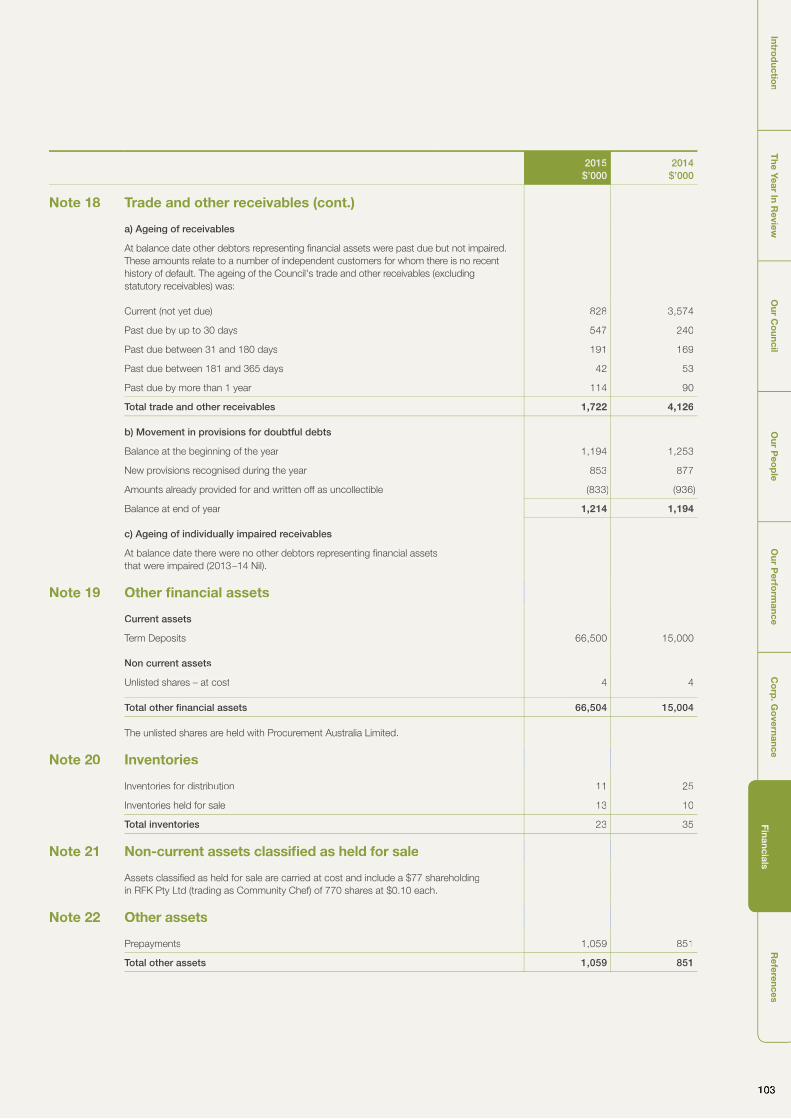
103103
Our P
eop
leO
ur Perfo
rmance
Co
rp. G
overnance
FinancialsR
eferencesIntro
ductio
nT
he Year In Review
Our C
ouncil
2015$’000
2014$’000
Note 18 Trade and other receivables (cont.)
a) Ageing of receivables
At balance date other debtors representing fi nancial assets were past due but not impaired. These amounts relate to a number of independent customers for whom there is no recent history of default. The ageing of the Council's trade and other receivables (excluding statutory receivables) was:
Current (not yet due) 828 3,574
Past due by up to 30 days 547 240
Past due between 31 and 180 days 191 169
Past due between 181 and 365 days 42 53
Past due by more than 1 year 114 90
Total trade and other receivables 1,722 4,126
b) Movement in provisions for doubtful debts
Balance at the beginning of the year 1,194 1,253
New provisions recognised during the year 853 877
Amounts already provided for and written off as uncollectible (833) (936)
Balance at end of year 1,214 1,194
c) Ageing of individually impaired receivables
At balance date there were no other debtors representing fi nancial assetsthat were impaired (2013–14 Nil).
Note 19 Other fi nancial assets
Current assets
Term Deposits 66,500 15,000
Non current assets
Unlisted shares – at cost 4 4
Total other fi nancial assets 66,504 15,004
The unlisted shares are held with Procurement Australia Limited.
Note 20 Inventories
Inventories for distribution 11 25
Inventories held for sale 13 10
Total inventories 23 35
Note 21 Non-current assets classifi ed as held for sale
Assets classifi ed as held for sale are carried at cost and include a $77 shareholdingin RFK Pty Ltd (trading as Community Chef) of 770 shares at $0.10 each.
Note 22 Other assets
Prepayments 1,059 851
Total other assets 1,059 851
103103
Our P
eop
leO
ur Perfo
rmance
Co
rp. G
overnance
FinancialsR
eferencesIntro
ductio
nT
he Year In Review
Our C
ouncil
2015$’000
2014$’000
Note 18 Trade and other receivables (cont.)
a) Ageing of receivables
At balance date other debtors representing fi nancial assets were past due but not impaired.These amounts relate to a number of independent customers for whom there is no recent history of default. The ageing of the Council's trade and other receivables (excluding statutory receivables) was:
Current (not yet due) 828 3,574
Past due by up to 30 days 547 240
Past due between 31 and 180 days 191 169
Past due between 181 and 365 days 42 53
Past due by more than 1 year 114 90
Total trade and other receivables 1,722 4,126
b) Movement in provisions for doubtful debts
Balance at the beginning of the year 1,194 1,253
New provisions recognised during the year 853 877
Amounts already provided for and written off as uncollectible (833) (936)
Balance at end of year 1,214 1,194
c) Ageing of individually impaired receivables
At balance date there were no other debtors representing fi nancial assetsthat were impaired (2013–14 Nil).
Note 19 Other fi nancial assets
Current assets
Term Deposits 66,500 15,000
Non current assets
Unlisted shares – at cost 4 4
Total other fi nancial assets 66,504 15,004
The unlisted shares are held with Procurement Australia Limited.
Note 20 Inventories
Inventories for distribution 11 25
Inventories held for sale 13 10
Total inventories 23 35
Note 21 Non-current assets classifi ed as held for sale
Assets classifi ed as held for sale are carried at cost and include a $77 shareholdingin RFK Pty Ltd (trading as Community Chef) of 770 shares at $0.10 each.
Note 22 Other assets
Prepayments 1,059 851
Total other assets 1,059 851

104104
Our
Peo
ple
Our
Per
form
ance
Co
rp. G
ove
rnan
ceFi
nanc
ials
Ref
eren
ces
Intr
od
ucti
on
The
Yea
r In
Rev
iew
Our
Co
unci
l
Notes to the Financial Report
LAND AND BUILDINGS
Land – specialised
$’000
Land – non specialised
$’000
Total Land$’000
Buildings – non
specialised$’000
TotalBuildings
$’000
Work in Progress
$’000
TOTAL PROPERTY
$’000
Opening balance at 1 July 2014
At fair value 1,666,858 258,775 1,925,633 374,647 374,647 8,562 2,308,842
Accumulated depreciation – – – (143,362) (143,362) – (143,362)
1,666,858 258,775 1,925,633 231,285 231,285 8,562 2,165,480
Movements in fair value
Acquisition of assets at fair value 3 – 3 21,082 21,082 5,900 26,985
Revaluation increments/decrements – – – – – – –
Fair value of assets disposed – – – (1,293) (1,293) – (1,293)
Impairment losses recognised in operating result
– – – – – – –
Transfers in (out) – – – – – – –
3 – 3 19,789 19,789 5,900 25,692
Movements in accumulated depreciation
Depreciation and amortisation – – – (10,498) (10,498) – (10,498)
Accumulated depreciationof disposals – – –
683 683 –
683
Impairment losses recognisedin operating result – – – – – – –
– – – (9,815) (9,815) – (9,815)
Closing balance at 30 June 2015
At fair value 1,666,861 258,775 1,925,636 394,436 394,436 14,462 2,334,534
Accumulated depreciation – – – (153,177) (153,177) – (153,177)
1,666,861 258,775 1,925,636 241,259 241,259 14,462 2,181,357
Note 23 Property, infrastructure plant and equipment (cont.)
104104
Our
Peo
ple
Our
Per
form
ance
Co
rp. G
ove
rnan
ceFi
nanc
ials
Ref
eren
ces
Intr
od
ucti
on
The
Yea
r In
Rev
iew
Our
Co
unci
l
Notes to the Financial Report
LAND AND BUILDINGS
Land – specialised
$’000
Land – nonspecialised
$’000
Total Land$’000
Buildings– non
specialised$’000
TotalBuildings
$’000
Work inProgress
$’000
TOTALPROPERTY
$’000
Opening balance at 1 July 2014
At fair value 1,666,858 258,775 1,925,633 374,647 374,647 8,562 2,308,842
Accumulated depreciation – – – (143,362) (143,362) – (143,362)
1,666,858 258,775 1,925,633 231,285 231,285 8,562 2,165,480
Movements in fair value
Acquisition of assets at fair value 3 – 3 21,082 21,082 5,900 26,985
Revaluation increments/decrements – – – – – – –
Fair value of assets disposed – – – (1,293) (1,293) – (1,293)
Impairment losses recognised in operating result
– – – – – – –
Transfers in (out) – – – – – – –
3 – 3 19,789 19,789 5,900 25,692
Movements in accumulateddepreciation
Depreciation and amortisation – – – (10,498) (10,498) – (10,498)
Accumulated depreciationof disposals – – – 683 683 – 683
Impairment losses recognisedin operating result – – – – – – –
– – – (9,815) (9,815) – (9,815)
Closing balance at 30 June 2015
At fair value 1,666,861 258,775 1,925,636 394,436 394,436 14,462 2,334,534
Accumulated depreciation – – – (153,177) (153,177) – (153,177)
1,666,861 258,775 1,925,636 241,259 241,259 14,462 2,181,357
Note 23 Property, infrastructure plant and equipment (cont.)

105105
Our P
eop
leO
ur Perfo
rmance
Co
rp. G
overnance
FinancialsR
eferencesIntro
ductio
nT
he Year In Review
Our C
ouncil
PLANT AND EQUIPMENT
Plant, machinery and equipment
$’000
Fixtures fi ttings and furniture
$’000
Computers and telecommunication
$’000Library books
$’000
TOTAL PLANT AND EQUIPMENT
$’000
Opening balance at 1 July 2014
At fair value 29,652 7,254 10,947 5,340 53,193
Accumulated depreciation (15,569) (4,433) (9,322) (3,401) (32,725)
14,083 2,821 1,625 1,939 20,468
Movements in fair value
Acquisition of assets at fair value 2,611 621 798 1,109 5,139
Revaluation increments/decrements – – – – –
Fair value of assets disposed (127) (523) (6,982) (1,303) (8,935)
2,484 98 (6,184) (194) (3,796)
Movements in accumulated depreciation
Depreciation and amortisation (2,377) (426) (782) (859) (4,444)
Accumulated depreciation of disposals 113 502 6,909 830 8,354
Impairment losses recognisedin operating result
– – – – –
(2,264) 76 6,127 (29) 3,911
Closing balance at 30 June 2015
At fair value 32,136 7,352 4,763 5,146 49,397
Accumulated depreciation (17,833) (4,357) (3,195) (3,430) (28,815)
14,303 2,995 1,568 1,717 20,582
Note 23 Property, infrastructure plant and equipment (cont.)
105105
Our P
eop
leO
ur Perfo
rmance
Co
rp. G
overnance
FinancialsR
eferencesIntro
ductio
nT
he Year In Review
Our C
ouncil
PLANT AND EQUIPMENT
Plant, machineryand equipment
$’000
Fixtures fi ttingsand furniture
$’000
Computers and telecommunication
$’000Library books
$’000
TOTAL PLANT AND EQUIPMENT
$’000
Opening balance at 1 July 2014
At fair value 29,652 7,254 10,947 5,340 53,193
Accumulated depreciation (15,569) (4,433) (9,322) (3,401) (32,725)
14,083 2,821 1,625 1,939 20,468
Movements in fair value
Acquisition of assets at fair value 2,611 621 798 1,109 5,139
Revaluation increments/decrements – – – – –
Fair value of assets disposed (127) (523) (6,982) (1,303) (8,935)
2,484 98 (6,184) (194) (3,796)
Movements in accumulateddepreciation
Depreciation and amortisation (2,377) (426) (782) (859) (4,444)
Accumulated depreciation of disposals 113 502 6,909 830 8,354
Impairment losses recognisedin operating result – – – – –
(2,264) 76 6,127 (29) 3,911
Closing balance at 30 June 2015
At fair value 32,136 7,352 4,763 5,146 49,397
Accumulated depreciation (17,833) (4,357) (3,195) (3,430) (28,815)
14,303 2,995 1,568 1,717 20,582
Note 23 Property, infrastructure plant and equipment (cont.)

106106
Our
Peo
ple
Our
Per
form
ance
Co
rp. G
ove
rnan
ceFi
nanc
ials
Ref
eren
ces
Intr
od
ucti
on
The
Yea
r In
Rev
iew
Our
Co
unci
l
Notes to the Financial Report
INFRASTRUCTURERoads$’000
Bridges$’000
Footpaths and
cycleways$’000
Drainage$’000
Recreational,leisure and Community
$’000
Parks openspaces and
streetscapes$’000
Off streetcar parks
$’000
Work inProgress
$’000
TOTAL INFRASTRUCTURE
$’000
Opening balance at 1 July 2014
At fair value 554,455 11,932 144,565 191,044 38,501 30,289 31,771 15,295 1,017,852
Accumulated depreciation
(313,881) (7,358) (77,002) (75,810) (9,927) (5,625) (10,845) – (500,448)
240,574 4,574 67,563 115,234 28,574 24,664 20,926 15,295 517,404
Movements infair value
Acquisition of assets at fair value
9,801 1,921 2,922 3,989 2,227 1,444 744 – 23,048
Revaluation increments/decrements
– – – – – – – – –
Fair value ofassets disposed
(4,325) – (1,451) (231) – (76) (20) – (6,103)
Transfers in (out) – – – – – – – (4,890) (4,890)
5,476 1,921 1,471 3,758 2,227 1,368 724 (4,890) 12,055
Movements in accumulateddepreciation
Depreciationand amortisation
(6,650) (148) (1,738) (2,318) (1,701) (883) (903) – (14,341)
Accumulated depreciationof disposals
3,167 – 731 210 – 7 14 – 4,129
(3,483) (148) (1,007) (2,108) (1,701) (876) (889) – (10,212)
Closing balance at 30 June 2015
At fair value 559,931 13,853 146,036 194,802 40,728 31,657 32,495 10,405 1,029,907
Accumulated depreciation
(317,364) (7,506) (78,009) (77,918) (11,628) (6,501) (11,733) – (510,659)
242,567 6,347 68,027 116,884 29,100 25,156 20,762 10,405 519,248
Total property, infrastructure, plant and equipment 2,721,187
Note 23 Property, infrastructure plant and equipment (cont.)
106106
Our
Peo
ple
Our
Per
form
ance
Co
rp. G
ove
rnan
ceFi
nanc
ials
Ref
eren
ces
Intr
od
ucti
on
The
Yea
r In
Rev
iew
Our
Co
unci
l
Notes to the Financial Report
INFRASTRUCTURERoads$’000
Bridges$’000
Footpathsand
cycleways$’000
Drainage$’000
Recreational,leisure andCommunity
$’000
Parks openspaces and
streetscapes$’000
Off streetcar parks
$’000
Work inProgress
$’000
TOTALINFRASTRUCTURE
$’000
Opening balance at1 July 2014
At fair value 554,455 11,932 144,565 191,044 38,501 30,289 31,771 15,295 1,017,852
Accumulateddepreciation
(313,881) (7,358) (77,002) (75,810) (9,927) (5,625) (10,845) – (500,448)
240,574 4,574 67,563 115,234 28,574 24,664 20,926 15,295 517,404
Movements infair value
Acquisition of assetsat fair value
9,801 1,921 2,922 3,989 2,227 1,444 744 – 23,048
Revaluationincrements/decrements
– – – – – – – – –
Fair value ofassets disposed
(4,325) – (1,451) (231) – (76) (20) – (6,103)
Transfers in (out) – – – – – – – (4,890) (4,890)
5,476 1,921 1,471 3,758 2,227 1,368 724 (4,890) 12,055
Movements inaccumulateddepreciation
Depreciationand amortisation
(6,650) (148) (1,738) (2,318) (1,701) (883) (903) – (14,341)
Accumulateddepreciationof disposals
3,167 – 731 210 – 7 14 – 4,129
(3,483) (148) (1,007) (2,108) (1,701) (876) (889) – (10,212)
Closing balance at30 June 2015
At fair value 559,931 13,853 146,036 194,802 40,728 31,657 32,495 10,405 1,029,907
Accumulateddepreciation
(317,364) (7,506) (78,009) (77,918) (11,628) (6,501) (11,733) – (510,659)
242,567 6,347 68,027 116,884 29,100 25,156 20,762 10,405 519,248
Total property, infrastructure, plantand equipment 2,721,187
Note 23 Property, infrastructure plant and equipment (cont.)

107107
Our P
eop
leO
ur Perfo
rmance
Co
rp. G
overnance
FinancialsR
eferencesIntro
ductio
nT
he Year In Review
Our C
ouncil
Note 23 Property, infrastructure, plant and equipment (cont.)
Valuation of land and buildings
Valuation of land and buildings were undertaken by a qualifi ed independent valuer Patel Dore Valuers Pty Ltd. The valuation of land and buildings is at fair value, being market value based on highest and best use permitted by relevant land planning provisions. Where land use is restricted through existing planning provisions the valuation is reduced to refl ect this limitation. This adjustmentis an unobservable input in the valuation. The adjustment has no impact on the comprehensive income statement.
Specialised land is valued at fair value using site values adjusted for englobo (undeveloped and/or unserviced) characteristics, access rights and private interests of other parties and entitlements of infrastructure assets and services. This adjustment is an unobservable input in the valuation. The adjustment has no impact on the comprehensive income statement.
Any signifi cant movements in the unobservable inputs for land and land under roads will have a signifi cant impact on the fair value of these assets.
Details of the Council’s land and buildings and information about the fair value hierarchy as at 30 June 2015 are as follows:
Level 1 Level 2 Level 3
Land 258,775
Specialised land 1,665,448
Specialised land – Land under roads 1,413
Land improvements
Heritage buildings
Buildings 241,259
Building improvements
Total 500,034 1,666,861
Valuation of infrastructure
Valuation of infrastructure assets has been determined by David Elson, Manager Asset Planning, Bachelor Civil Engineering (Hons), Grad Dip Municipal Engineering.
The valuation is at fair value based on replacement cost less accumulated depreciation as at the date of valuation.
Details of the Council’s infrastructure and information about the fair value hierarchy as at 30 June 2015 are as follows:
Level 1 Level 2 Level 3
Roads 242,567
Bridges 6,347
Footpaths and cycleways 68,028
Drainage 116,884
Recreational, leisure and community facilities 29,100
Parks, open spaces and streetscapes 25,156
Off street car parks 20,761
Total – – 508,843
Refer to note 1 (g) for defi nitions.
107107
Our P
eop
leO
ur Perfo
rmance
Co
rp. G
overnance
FinancialsR
eferencesIntro
ductio
nT
he Year In Review
Our C
ouncil
Note 23 Property, infrastructure, plant and equipment (cont.)
Valuation of land and buildings
Valuation of land and buildings were undertaken by a qualifi ed independent valuer Patel Dore Valuers Pty Ltd. The valuation of land and buildings is at fair value, being market value based on highest and best use permitted by relevant land planning provisions.Where land use is restricted through existing planning provisions the valuation is reduced to refl ect this limitation. This adjustmentis an unobservable input in the valuation. The adjustment has no impact on the comprehensive income statement.
Specialised land is valued at fair value using site values adjusted for englobo (undeveloped and/or unserviced) characteristics, access rights and private interests of other parties and entitlements of infrastructure assets and services. This adjustment is anunobservable input in the valuation. The adjustment has no impact on the comprehensive income statement.
Any signifi cant movements in the unobservable inputs for land and land under roads will have a signifi cant impact on the fair valueof these assets.
Details of the Council’s land and buildings and information about the fair value hierarchy as at 30 June 2015 are as follows:
Level 1 Level 2 Level 3
Land 258,775
Specialised land 1,665,448
Specialised land – Land under roads 1,413
Land improvements
Heritage buildings
Buildings 241,259
Building improvements
Total 500,034 1,666,861
Valuation of infrastructure
Valuation of infrastructure assets has been determined by David Elson, Manager Asset Planning, Bachelor Civil Engineering (Hons),Grad Dip Municipal Engineering.
The valuation is at fair value based on replacement cost less accumulated depreciation as at the date of valuation.
Details of the Council’s infrastructure and information about the fair value hierarchy as at 30 June 2015 are as follows:
Level 1 Level 2 Level 3
Roads 242,567
Bridges 6,347
Footpaths and cycleways 68,028
Drainage 116,884
Recreational, leisure and community facilities 29,100
Parks, open spaces and streetscapes 25,156
Off street car parks 20,761
Total – – 508,843
Refer to note 1 (g) for defi nitions.

108108
Our
Peo
ple
Our
Per
form
ance
Co
rp. G
ove
rnan
ceFi
nanc
ials
Ref
eren
ces
Intr
od
ucti
on
The
Yea
r In
Rev
iew
Our
Co
unci
l
Note 23 Property, infrastructure, plant and equipment (cont.)
Description of signifi cant unobservable inputs into level 3 valuations
Specialised land and land under roads is valued using a market based direct comparison technique. Signifi cant unobservable inputs include the extent and impact of restriction of use and the market cost of land per square metre. The extent and impactof restrictions on use varies and results in a reduction to surrounding land values between 5% and 95%. The market value of land varies signifi cantly depending on the location of the land and the current market conditions. Currently land values range between $27 and $7,852 per square metre.
Specialised buildings are valued using a depreciated replacement cost technique. Signifi cant unobservable inputs include the current replacement cost and remaining useful lives of buildings. Current replacement costs are calculated on a square metre basis and ranges from $18 to $4,308 per square metre. The remaining useful lives of buildings are determined on the basis of the current condition of buildings and vary from 25 years to 55 years. Replacement cost is sensitive to changes in market conditions, with any increase or decrease in cost fl owing through to the valuation. Useful lives of buildings are sensitive to changes in expectations or requirements that could either shorten or extend the useful lives of buildings.
Infrastructure assets are valued based on the depreciated replacement cost. Signifi cant unobservable inputs include the current replacement cost and remaining useful lives of infrastructure. The remaining useful lives of infrastructure assets are determined on the basis of the current condition of the asset and vary from 5 years to 150 years. Replacement cost is sensitive to changes in market conditions, with any increase or decrease in cost fl owing through to the valuation. Useful lives of infrastructure are sensitive to changes in use, expectations or requirements that could either shorten or extend the useful lives of infrastructure assets.
2015$’000
2014$’000
Reconciliation of specialised land
Land under roads 1,413 1,413
Parks and reserves 726,435 726,435
Other 939,013 939,320
Total specialised land 1,666,861 1,667,168
Notes to the Financial Report
108108
Our
Peo
ple
Our
Per
form
ance
Co
rp. G
ove
rnan
ceFi
nanc
ials
Ref
eren
ces
Intr
od
ucti
on
The
Yea
r In
Rev
iew
Our
Co
unci
l
Note 23 Property, infrastructure, plant and equipment (cont.)
Description of signifi cant unobservable inputs into level 3 valuations
Specialised land and land under roads is valued using a market based direct comparison technique. Signifi cant unobservable inputs include the extent and impact of restriction of use and the market cost of land per square metre. The extent and impactof restrictions on use varies and results in a reduction to surrounding land values between 5% and 95%. The market value of landvaries signifi cantly depending on the location of the land and the current market conditions. Currently land values range between$27 and $7,852 per square metre.
Specialised buildings are valued using a depreciated replacement cost technique. Signifi cant unobservable inputs include the current replacement cost and remaining useful lives of buildings. Current replacement costs are calculated on a square metre basisand ranges from $18 to $4,308 per square metre. The remaining useful lives of buildings are determined on the basis of the currentcondition of buildings and vary from 25 years to 55 years. Replacement cost is sensitive to changes in market conditions, with anyincrease or decrease in cost fl owing through to the valuation. Useful lives of buildings are sensitive to changes in expectations or requirements that could either shorten or extend the useful lives of buildings.
Infrastructure assets are valued based on the depreciated replacement cost. Signifi cant unobservable inputs include the currentreplacement cost and remaining useful lives of infrastructure. The remaining useful lives of infrastructure assets are determinedon the basis of the current condition of the asset and vary from 5 years to 150 years. Replacement cost is sensitive to changes inmarket conditions, with any increase or decrease in cost fl owing through to the valuation. Useful lives of infrastructure are sensitive to changes in use, expectations or requirements that could either shorten or extend the useful lives of infrastructure assets.
2015$’000
2014$’000
Reconciliation of specialised land
Land under roads 1,413 1,413
Parks and reserves 726,435 726,435
Other 939,013 939,320
Total specialised land 1,666,861 1,667,168
Notes to the Financial Report

109109
Our P
eop
leO
ur Perfo
rmance
Co
rp. G
overnance
FinancialsR
eferencesIntro
ductio
nT
he Year In Review
Our C
ouncil
2015$’000
2014$’000
Note 24 Investment property
Investment property is carried at cost and is depreciatedon a straight-line basis.
Gross carrying amount
Balance at beginning of fi nancial year 8,419 8,006
Additions 1,571 413
Disposals (35) –
Balance at end of the year 9,955 8,419
Accumulated amortisation and impairment
Balance at beginning of the year (662) (595)
Amortisation expense (102) (67)
Transfer to non-current assets held for sale – –
Balance at end of fi nancial year (764) (662)
Net book value 9,191 7,757
Investment property is carried at cost and is depreciated on a straight line basis.
Note 25 Intangible assets
Software 345 255
Total intangible assets 345 255
Software$’000
Gross carrying amount
Balance at 1 July 2013 5,010
Additions from internal developments 252
Balance at 1 July 2014 5,262
Additions from internal developments 331
Disposals (3,617)
Balance at 30 June 2015 1,976
Accumulated amortisation and impairment
Balance at 1 July 2013 (4,764)
Amortisation expense (243)
Balance at 1 July 2014 (5,007)
Amortisation expense 3,376
Balance at 30 June 2015 (1,631)
Net book value at 30 June 2014 255
Net book value at 30 June 2015 345

110110
Our
Peo
ple
Our
Per
form
ance
Co
rp. G
ove
rnan
ceFi
nanc
ials
Ref
eren
ces
Intr
od
ucti
on
The
Yea
r In
Rev
iew
Our
Co
unci
l
Note2015$’000
2014$’000
Note 26 Trade and other payables
Trade payables 21,052 13,903
Other payables 377 277
Accrued expenses 2,874 3,744
Prepaid income 94 54
24,397 17,978
Note 27 Trust funds and deposits
Refundable deposits 27(a) 2,516 2,650
Fire services levy 27(b) 321 331
Refundable contract deposits and retention monies 27(c) 13 7
Balwyn Rotary Sunday Market trust funds 27(d) 119 122
Sportsgrounds trust funds 27(e) 69 69
3,038 3,179
Purpose and restrictions of trust funds and deposits
Ref. Purpose: Nature of any restrictions:
27(a) Refundable deposits Deposits are taken by council as a form of surety in a number of circumstances, including in relation to building works, tender deposits, contract deposits and the use of civic facilities.
27(b) Fire Services Levy Council is the collection agent for fi re services levy on behalf of the State Government. Council remits amounts received on a quarterly basis. Amounts disclosed here will be remitted to the state government in line withthat process.
27(c) Retention Amounts Council has a contractual right to retain certain amounts until a contractor has met certain requirements or a related warrant or defect period has elapsed. Subject to the satisfactory completion of the contractual obligations, or the elapsing of time, these amounts will be paidto the relevant contractor in line with Council’s contractual obligations.
27(d) Trust funds held on behalf of the operation of theBalwyn Rotary Sunday Market.
Profi ts and losses are transferred each month when they exceed $5,000.
27(e) Trust funds collected from cessation of sportsground committees.
Expenditure is restricted to the relevant sportsground.
Notes to the Financial Report
110110
Our
Peo
ple
Our
Per
form
ance
Co
rp. G
ove
rnan
ceFi
nanc
ials
Ref
eren
ces
Intr
od
ucti
on
The
Yea
r In
Rev
iew
Our
Co
unci
l
Note2015$’000
2014$’000
Note 26 Trade and other payables
Trade payables 21,052 13,903
Other payables 377 277
Accrued expenses 2,874 3,744
Prepaid income 94 54
24,397 17,978
Note 27 Trust funds and deposits
Refundable deposits 27(a) 2,516 2,650
Fire services levy 27(b) 321 331
Refundable contract deposits and retention monies 27(c) 13 7
Balwyn Rotary Sunday Market trust funds 27(d) 119 122
Sportsgrounds trust funds 27(e) 69 69
3,038 3,179
Purpose and restrictions of trust funds and deposits
Ref. Purpose: Nature of any restrictions:
27(a) Refundable deposits Deposits are taken by council as a form of surety in a number of circumstances, including in relation to building works, tender deposits, contract deposits and the use of civic facilities.
27(b) Fire Services Levy Council is the collection agent for fi re services levy on behalf of the State Government. Council remits amountsreceived on a quarterly basis. Amounts disclosed herewill be remitted to the state government in line withthat process.
27(c) Retention Amounts Council has a contractual right to retain certain amountsuntil a contractor has met certain requirements or arelated warrant or defect period has elapsed. Subject tothe satisfactory completion of the contractual obligations,or the elapsing of time, these amounts will be paidto the relevant contractor in line with Council’s contractual obligations.
27(d) Trust funds held on behalf of the operation of theBalwyn Rotary Sunday Market.
Profi ts and losses are transferred each month when theyexceed $5,000.
27(e) Trust funds collected from cessation of sportsgroundcommittees.
Expenditure is restricted to the relevant sportsground.
Notes to the Financial Report

111111
Our P
eop
leO
ur Perfo
rmance
Co
rp. G
overnance
FinancialsR
eferencesIntro
ductio
nT
he Year In Review
Our C
ouncil
Annual leave$ ‘000
Long service leave
$ ‘000Other$ ‘000
Total$ ‘000
Note 28 Provisions2015
Balance at beginning of the fi nancial year 4,599 11,025 253 15,877
Additional provisions 5,101 2,308 1,479 8,888
Amounts used (5,102) (2,247) (1,442) (8,791)
Increase in the discounted amount arising because of time and the effect of any changein the discount rate
258 738 – 996
Balance at the end of the fi nancial year 4,856 11,824 290 16,970
2014
Balance at beginning of the fi nancial year 4,156 9,941 253 14,350
Additional provisions 5,087 2,331 1,606 9,024
Amounts used (4,654) (1,247) (1,606) (7,507)
Increase in the discounted amount arising because of time and the effect of any changein the discount rate
10 – – 10
Balance at the end of the fi nancial year 4,599 11,025 253 15,877
2015$’000
2014$’000
(a) Employee benefi ts
Current provisions expected to be settled within 12 months
Annual leave 3,837 3,643
Long service leave 8,701 8,119
Other 290 253
12,828 12,015
Current provisions expected to be settled after 12 months
Annual leave 1,019 956
Long service leave 1,120 996
2,139 1,952
Total current provisions 14,968 13,967
Non-current
Long service leave 2,003 1,910
Total non-current provisions 2,003 1,910
Aggregate carrying amount of employee provisions:
Current 14,968 13,967
Non-current 2,003 1,910
Total aggregate carrying amount of employee provisions 16,970 15,877
The following assumptions were adopted in measuring the present value of employee benefi ts:
Weighted average increase in employee costs 3.50% 3.50%
Weighted average discount rates 2.57% 2.96%
Weighted average settlement period (years) 7 7
111111
Our P
eop
leO
ur Perfo
rmance
Co
rp. G
overnance
FinancialsR
eferencesIntro
ductio
nT
he Year In Review
Our C
ouncil
Annual leave$ ‘000
Long serviceleave
$ ‘000Other$ ‘000
Total$ ‘000
Note 28 Provisions2015
Balance at beginning of the fi nancial year 4,599 11,025 253 15,877
Additional provisions 5,101 2,308 1,479 8,888
Amounts used (5,102) (2,247) (1,442) (8,791)
Increase in the discounted amount arisingbecause of time and the effect of any changein the discount rate
258 738 – 996
Balance at the end of the fi nancial year 4,856 11,824 290 16,970
2014
Balance at beginning of the fi nancial year 4,156 9,941 253 14,350
Additional provisions 5,087 2,331 1,606 9,024
Amounts used (4,654) (1,247) (1,606) (7,507)
Increase in the discounted amount arisingbecause of time and the effect of any changein the discount rate
10 – – 10
Balance at the end of the fi nancial year 4,599 11,025 253 15,877
2015$’000
2014$’000
(a) Employee benefi ts
Current provisions expected to be settled within 12 months
Annual leave 3,837 3,643
Long service leave 8,701 8,119
Other 290 253
12,828 12,015
Current provisions expected to be settled after 12 months
Annual leave 1,019 956
Long service leave 1,120 996
2,139 1,952
Total current provisions 14,968 13,967
Non-current
Long service leave 2,003 1,910
Total non-current provisions 2,003 1,910
Aggregate carrying amount of employee provisions:
Current 14,968 13,967
Non-current 2,003 1,910
Total aggregate carrying amount of employee provisions 16,970 15,877
The following assumptions were adopted in measuring the presentvalue of employee benefi ts:
Weighted average increase in employee costs 3.50% 3.50%
Weighted average discount rates 2.57% 2.96%
Weighted average settlement period (years) 7 7

112112
Our
Peo
ple
Our
Per
form
ance
Co
rp. G
ove
rnan
ceFi
nanc
ials
Ref
eren
ces
Intr
od
ucti
on
The
Yea
r In
Rev
iew
Our
Co
unci
l
2015$’000
2014$’000
Note 28 Provisions (cont.)(b) Other
Provision for rostered days off
Current 290 253
290 253
Note 29 Interest-bearing loans and borrowingsCurrent
Borrowings – secured 3,864 3,240
Non-current
Borrowings – secured 52,997 55,474
Total 56,861 58,714
Borrowings are secured over the General Rates of Council as per section 148 of the Local Government Act 1989.
a) The maturity profi le for Council’s borrowings is:
Not later than one year 3,864 3,240
Later than one year and not later than fi ve years 28,212 12,933
Later than fi ve years 24,785 42,541
56,861 58,714
b) Aggregate carrying amount of interest-bearing loans and borrowings:
Current 3,864 3,240
Non-current 52,997 55,474
56,861 58,714
Notes to the Financial Report
112112
Our
Peo
ple
Our
Per
form
ance
Co
rp. G
ove
rnan
ceFi
nanc
ials
Ref
eren
ces
Intr
od
ucti
on
The
Yea
r In
Rev
iew
Our
Co
unci
l
2015$’000
2014$’000
Note 28 Provisions (cont.)(b) Other
Provision for rostered days off
Current 290 253
290 253
Note 29 Interest-bearing loans and borrowingsCurrent
Borrowings – secured 3,864 3,240
Non-current
Borrowings – secured 52,997 55,474
Total 56,861 58,714
Borrowings are secured over the General Rates of Councilas per section 148 of the Local Government Act 1989.
a) The maturity profi le for Council’s borrowings is:
Not later than one year 3,864 3,240
Later than one year and not later than fi ve years 28,212 12,933
Later than fi ve years 24,785 42,541
56,861 58,714
b) Aggregate carrying amount of interest-bearing loans and borrowings:
Current 3,864 3,240
Non-current 52,997 55,474
56,861 58,714
Notes to the Financial Report

113113
Our P
eop
leO
ur Perfo
rmance
Co
rp. G
overnance
FinancialsR
eferencesIntro
ductio
nT
he Year In Review
Our C
ouncil
Balance at beginning
of reporting period$’000
Increment (decrement)
$’000
Reversal of previous
revaluations for assets disposed
$’000
Balance atend of
reporting period$’000
Note 30 Reserves(a) Asset revaluation reserves
2015
Property
Land 1,610,712 – – 1,610,712
Buildings and other structures 42,510 – – 42,510
1,653,222 – – 1,653,222
Infrastructure
Roads 156,080 – – 156,080
Bridges 4,119 – – 4,119
Footpaths and cycleways 44,143 – – 44,143
Drainage 38,431 – – 38,431
Carparks and access roads 9,345 – – 9,345
252,118 – – 252,118
Sub-total property and infrastructure 1,905,340 – – 1,905,340
Investments in associates
Clayton Landfi ll 2,718 – – 2,718
2,718 – – 2,718
Total asset revaluation reserves 1,908,058 – – 1,908,058
2014
Property
Land 1,409,002 206,017 (4,307) 1,610,712
Buildings and other structures 28,608 13,750 152 42,510
1,437,610 219,767 (4,155) 1,653,222
Infrastructure
Roads 155,976 104 – 156,080
Bridges 4,483 (364) – 4,119
Footpaths and cycleways 40,061 4,082 – 44,143
Drainage 39,173 (742) – 38,431
Carparks and access roads 6,930 2,415 – 9,345
246,623 5,495 – 252,118
Sub-total property and infrastructure 1,684,233 225,262 (4,155) 1,905,340
Investments in associates
Clayton Landfi ll 2,604 114 – 2,718
2604 114 – 2718
Total asset revaluation reserves 1,686,837 225,376 (4,155) 1,908,058
The asset revaluation reserve is used to record the increased (net) value of Council’s assets over time. 113113
Our P
eop
leO
ur Perfo
rmance
Co
rp. G
overnance
FinancialsR
eferencesIntro
ductio
nT
he Year In Review
Our C
ouncil
Balance at beginning
of reportingperiod$’000
Increment(decrement)
$’000
Reversalof previous
revaluations for assetsdisposed
$’000
Balance atend of
reportingperiod$’000
Note 30 Reserves(a) Asset revaluation reserves
2015
Property
Land 1,610,712 – – 1,610,712
Buildings and other structures 42,510 – – 42,510
1,653,222 – – 1,653,222
Infrastructure
Roads 156,080 – – 156,080
Bridges 4,119 – – 4,119
Footpaths and cycleways 44,143 – – 44,143
Drainage 38,431 – – 38,431
Carparks and access roads 9,345 – – 9,345
252,118 – – 252,118
Sub-total property and infrastructure 1,905,340 – – 1,905,340
Investments in associates
Clayton Landfi ll 2,718 – – 2,718
2,718 – – 2,718
Total asset revaluation reserves 1,908,058 – – 1,908,058
2014
Property
Land 1,409,002 206,017 (4,307) 1,610,712
Buildings and other structures 28,608 13,750 152 42,510
1,437,610 219,767 (4,155) 1,653,222
Infrastructure
Roads 155,976 104 – 156,080
Bridges 4,483 (364) – 4,119
Footpaths and cycleways 40,061 4,082 – 44,143
Drainage 39,173 (742) – 38,431
Carparks and access roads 6,930 2,415 – 9,345
246,623 5,495 – 252,118
Sub-total property and infrastructure 1,684,233 225,262 (4,155) 1,905,340
Investments in associates
Clayton Landfi ll 2,604 114 – 2,718
2604 114 – 2718
Total asset revaluation reserves 1,686,837 225,376 (4,155) 1,908,058
The asset revaluation reserve is used to record the increased (net) value of Council’s assets over time.

114114
Our
Peo
ple
Our
Per
form
ance
Co
rp. G
ove
rnan
ceFi
nanc
ials
Ref
eren
ces
Intr
od
ucti
on
The
Yea
r In
Rev
iew
Our
Co
unci
l
Note 30 Reserves (cont.)
Balance at beginning
of reporting period$’000
Transfer from accumulated
surplus$’000
Transfer to accumulated
surplus$’000
Balance at end of reporting
period$’000
(b) Other reserves
2015
Drainage Contributions Reserve 144 89 – 233
Strategic Acquisition Fund 434 – – 434
Defi ned Benefi t Future Call Up Fund 1,000 1,000 – 2,000
Open Space Development Fund 623 1,980 – 2,603
Total other reserves 2,201 3,069 – 5,270
2014
Drainage Contributions Reserve 252 23 (131) 144
Strategic Acquisition Fund – 434 – 434
Defi ned Benefi t Future Call Up Fund – 1,000 – 1,000
Open Space Development Fund – 623 – 623
Total other reserves 252 2,080 (131) 2,201
The drainage contributions reserve represents non refundable contributions that are sought from developers to upgrade drainage as a result of development in the municipality. The Strategic Acquisition Fund will be available for the purpose of acquiring new strategic assets where they are required for the provision of community services or for additional public open space.The Open Space Development Fund allows for the acquisition of land within the municipality for conversion to public open space as it becomes available.The Defi ned Benefi t Future Call Up Fund has been created for use should a shortfall in the defi ned benefi t superannuation fund be called by the Local Government Defi ned Benefi t Superannuation Fund trustee.
2015$’000
2014 $’000
(c) Total reserves
Asset Revaluation Reserves 1,908,058 1,908,058
Drainage Contribution Reserve 233 144
Strategic Acquisition Fund 434 434
Defi ned Benefi t Future Call Up Fund 2,000 1,000
Open Space Development Fund 2,603 623
Total reserves 1,913,328 1,910,259
Notes to the Financial Report
114114
Our
Peo
ple
Our
Per
form
ance
Co
rp. G
ove
rnan
ceFi
nanc
ials
Ref
eren
ces
Intr
od
ucti
on
The
Yea
r In
Rev
iew
Our
Co
unci
l
Note 30 Reserves (cont.)
Balance atbeginning
of reportingperiod$’000
Transfer from accumulated
surplus$’000
Transfer to accumulated
surplus$’000
Balance at end of reporting
period$’000
(b) Other reserves
2015
Drainage Contributions Reserve 144 89 – 233
Strategic Acquisition Fund 434 – – 434
Defi ned Benefi t Future Call Up Fund 1,000 1,000 – 2,000
Open Space Development Fund 623 1,980 – 2,603
Total other reserves 2,201 3,069 – 5,270
2014
Drainage Contributions Reserve 252 23 (131) 144
Strategic Acquisition Fund – 434 – 434
Defi ned Benefi t Future Call Up Fund – 1,000 – 1,000
Open Space Development Fund – 623 – 623
Total other reserves 252 2,080 (131) 2,201
The drainage contributions reserve represents non refundable contributions that are sought from developers to upgrade drainageas a result of development in the municipality.The Strategic Acquisition Fund will be available for the purpose of acquiring new strategic assets where they are required for the provision of community services or for additional public open space.The Open Space Development Fund allows for the acquisition of land within the municipality for conversion to public open spaceas it becomes available.The Defi ned Benefi t Future Call Up Fund has been created for use should a shortfall in the defi ned benefi t superannuation fund be called by the Local Government Defi ned Benefi t Superannuation Fund trustee.
2015$’000
2014 $’000
(c) Total reserves
Asset Revaluation Reserves 1,908,058 1,908,058
Drainage Contribution Reserve 233 144
Strategic Acquisition Fund 434 434
Defi ned Benefi t Future Call Up Fund 2,000 1,000
Open Space Development Fund 2,603 623
Total reserves 1,913,328 1,910,259
Notes to the Financial Report

115115
Our P
eop
leO
ur Perfo
rmance
Co
rp. G
overnance
FinancialsR
eferencesIntro
ductio
nT
he Year In Review
Our C
ouncil
Note2015$’000
2014$’000
Note 31 Reconciliation of cash fl ows from operating activities to surplus
Surplus for the period 30,109 23,231
Depreciation/amortisation 13 29,638 28,646
Profi t /loss on disposal of property, infrastructure, plant and equipment 8 3,187 4,195
Share of joint venture losses net of distributions 16 4,668 2,100
Works in progress not capitalised (expensed) 2,396 2,484
Contributions of non-monetary assets 7 (13) (1,090)
Finance costs 4,429 3,630
Change in assets and liabilities:
(Increase)/decrease in trade and other receivables 1,508 (1,250)
(Increase)/decrease in prepayments (208) 259
(Increase)/decrease in inventories 12 3
Increase/(decrease) in trust funds and deposits (141) 65
Increase/(decrease) in trade and other payables 3,747 425
Increase/(decrease) in unfunded superannuation liability – (14,324)
Increase/(decrease) in other liabilities 40 (166)
Increase/(decrease) in provisions 1,094 1,526
Net cash provided by operating activities 80,466 49,734
Note 32 Reconciliation of cash and cash equivalents
Cash and cash equivalents 17 10,709 39,910
10,709 39,910
Note 33 Financing arrangements
Council does not have a bank overdraft facility.
Used borrowing facilities at reporting date 56,861 58,714
115115
Our P
eop
leO
ur Perfo
rmance
Co
rp. G
overnance
FinancialsR
eferencesIntro
ductio
nT
he Year In Review
Our C
ouncil
Note2015$’000
2014$’000
Note 31 Reconciliation of cash fl ows from operatingactivities to surplus
Surplus for the period 30,109 23,231
Depreciation/amortisation 13 29,638 28,646
Profi t /loss on disposal of property, infrastructure, plant and equipment 8 3,187 4,195
Share of joint venture losses net of distributions 16 4,668 2,100
Works in progress not capitalised (expensed) 2,396 2,484
Contributions of non-monetary assets 7 (13) (1,090)
Finance costs 4,429 3,630
Change in assets and liabilities:
(Increase)/decrease in trade and other receivables 1,508 (1,250)
(Increase)/decrease in prepayments (208) 259
(Increase)/decrease in inventories 12 3
Increase/(decrease) in trust funds and deposits (141) 65
Increase/(decrease) in trade and other payables 3,747 425
Increase/(decrease) in unfunded superannuation liability – (14,324)
Increase/(decrease) in other liabilities 40 (166)
Increase/(decrease) in provisions 1,094 1,526
Net cash provided by operating activities 80,466 49,734
Note 32 Reconciliation of cash and cash equivalents
Cash and cash equivalents 17 10,709 39,910
10,709 39,910
Note 33 Financing arrangements
Council does not have a bank overdraft facility.
Used borrowing facilities at reporting date 56,861 58,714

116116
Our
Peo
ple
Our
Per
form
ance
Co
rp. G
ove
rnan
ceFi
nanc
ials
Ref
eren
ces
Intr
od
ucti
on
The
Yea
r In
Rev
iew
Our
Co
unci
l
Notes to the Financial Report
Not later than 1 year$’000
GST Incl.
Later than 1 year and not
later than 2 years$’000
GST Incl.
Later than 2 years and not
later than 5 years$’000
GST Incl.
Later than 5 years$’000
GST Incl.
Total$’000
GST Incl.
Note 34 Commitments
The Council has entered intothe following commitments:
30 June 2015
Operating
Recycling 3,300 2,658 6,159 4,790 16,907
Garbage collection 1,544 1,540 985 – 4,069
Open space management 2,553 1,076 1,647 337 5,613
Consultancies 2,657 2,443 1,931 – 7,031
Home care services 22 22 50 – 94
Cleaning contracts for council buildings 859 – – – 859
Meals for delivery 13 – – – 13
Information systems and technology 1,898 1,138 764 – 3,800
Other 2,342 249 3 – 2,594
Total operating commitments 15,188 9,126 11,539 5,127 40,980
Capital
Buildings 10,440 121 111 – 10,672
Roads 6,482 6,464 1,126 – 14,072
Drainage 3,805 3,200 970 – 7,975
Other 3,063 1,208 1,259 – 5,530
Total capital commitments 23,790 10,993 3,466 – 38,249
Total commitments after 30 June 2015 38,978 20,119 15,004 5,127 79,229
116116
Our
Peo
ple
Our
Per
form
ance
Co
rp. G
ove
rnan
ceFi
nanc
ials
Ref
eren
ces
Intr
od
ucti
on
The
Yea
r In
Rev
iew
Our
Co
unci
l
Notes to the Financial Report
Not later than1 year$’000
GST Incl.
Later than 1 year and not
later than 2years$’000
GST Incl.
Later than 2 years and not
later than 5years$’000
GST Incl.
Later than 5 years$’000
GST Incl.
Total$’000
GST Incl.
Note 34 Commitments
The Council has entered intothe following commitments:
30 June 2015
Operating
Recycling 3,300 2,658 6,159 4,790 16,907
Garbage collection 1,544 1,540 985 – 4,069
Open space management 2,553 1,076 1,647 337 5,613
Consultancies 2,657 2,443 1,931 – 7,031
Home care services 22 22 50 – 94
Cleaning contracts for council buildings 859 – – – 859
Meals for delivery 13 – – – 13
Information systems and technology 1,898 1,138 764 – 3,800
Other 2,342 249 3 – 2,594
Total operating commitments 15,188 9,126 11,539 5,127 40,980
Capital
Buildings 10,440 121 111 – 10,672
Roads 6,482 6,464 1,126 – 14,072
Drainage 3,805 3,200 970 – 7,975
Other 3,063 1,208 1,259 – 5,530
Total capital commitments 23,790 10,993 3,466 – 38,249
Total commitments after 30 June 2015 38,978 20,119 15,004 5,127 79,229
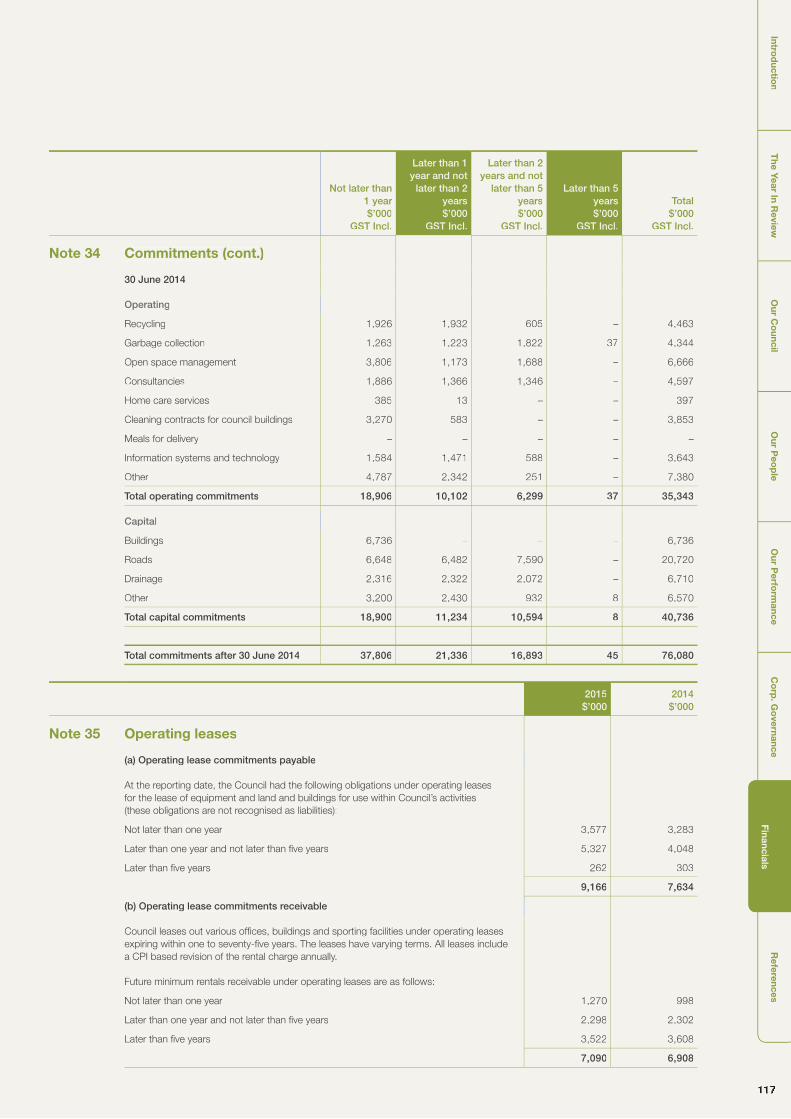
117117
Our P
eop
leO
ur Perfo
rmance
Co
rp. G
overnance
FinancialsR
eferencesIntro
ductio
nT
he Year In Review
Our C
ouncil
Not later than 1 year$’000
GST Incl.
Later than 1 year and not
later than 2 years$’000
GST Incl.
Later than 2 years and not
later than 5 years$’000
GST Incl.
Later than 5 years$’000
GST Incl.
Total$’000
GST Incl.
Note 34 Commitments (cont.)
30 June 2014
Operating
Recycling 1,926 1,932 605 – 4,463
Garbage collection 1,263 1,223 1,822 37 4,344
Open space management 3,806 1,173 1,688 – 6,666
Consultancies 1,886 1,366 1,346 – 4,597
Home care services 385 13 – – 397
Cleaning contracts for council buildings 3,270 583 – – 3,853
Meals for delivery – – – – –
Information systems and technology 1,584 1,471 588 – 3,643
Other 4,787 2,342 251 – 7,380
Total operating commitments 18,906 10,102 6,299 37 35,343
Capital
Buildings 6,736 – – – 6,736
Roads 6,648 6,482 7,590 – 20,720
Drainage 2,316 2,322 2,072 – 6,710
Other 3,200 2,430 932 8 6,570
Total capital commitments 18,900 11,234 10,594 8 40,736
Total commitments after 30 June 2014 37,806 21,336 16,893 45 76,080
2015$’000
2014$’000
Note 35 Operating leases
(a) Operating lease commitments payable
At the reporting date, the Council had the following obligations under operating leasesfor the lease of equipment and land and buildings for use within Council’s activities(these obligations are not recognised as liabilities):
Not later than one year 3,577 3,283
Later than one year and not later than fi ve years 5,327 4,048
Later than fi ve years 262 303
9,166 7,634
(b) Operating lease commitments receivable
Council leases out various offi ces, buildings and sporting facilities under operating leases expiring within one to seventy-fi ve years. The leases have varying terms. All leases include a CPI based revision of the rental charge annually.
Future minimum rentals receivable under operating leases are as follows:
Not later than one year 1,270 998
Later than one year and not later than fi ve years 2,298 2,302
Later than fi ve years 3,522 3,608
7,090 6,908
117117
Our P
eop
leO
ur Perfo
rmance
Co
rp. G
overnance
FinancialsR
eferencesIntro
ductio
nT
he Year In Review
Our C
ouncil
Not later than1 year$’000
GST Incl.
Later than 1year and not
later than 2years$’000
GST Incl.
Later than 2 years and not
later than 5years$’000
GST Incl.
Later than 5years$’000
GST Incl.
Total$’000
GST Incl.
Note 34 Commitments (cont.)
30 June 2014
Operating
Recycling 1,926 1,932 605 – 4,463
Garbage collection 1,263 1,223 1,822 37 4,344
Open space management 3,806 1,173 1,688 – 6,666
Consultancies 1,886 1,366 1,346 – 4,597
Home care services 385 13 – – 397
Cleaning contracts for council buildings 3,270 583 – – 3,853
Meals for delivery – – – – –
Information systems and technology 1,584 1,471 588 – 3,643
Other 4,787 2,342 251 – 7,380
Total operating commitments 18,906 10,102 6,299 37 35,343
Capital
Buildings 6,736 – – – 6,736
Roads 6,648 6,482 7,590 – 20,720
Drainage 2,316 2,322 2,072 – 6,710
Other 3,200 2,430 932 8 6,570
Total capital commitments 18,900 11,234 10,594 8 40,736
Total commitments after 30 June 2014 37,806 21,336 16,893 45 76,080
2015$’000
2014$’000
Note 35 Operating leases
(a) Operating lease commitments payable
At the reporting date, the Council had the following obligations under operating leasesfor the lease of equipment and land and buildings for use within Council’s activities(these obligations are not recognised as liabilities):
Not later than one year 3,577 3,283
Later than one year and not later than fi ve years 5,327 4,048
Later than fi ve years 262 303
9,166 7,634
(b) Operating lease commitments receivable
Council leases out various offi ces, buildings and sporting facilities under operating leases expiring within one to seventy-fi ve years. The leases have varying terms. All leases include a CPI based revision of the rental charge annually.
Future minimum rentals receivable under operating leases are as follows:
Not later than one year 1,270 998
Later than one year and not later than fi ve years 2,298 2,302
Later than fi ve years 3,522 3,608
7,090 6,908

118118
Our
Peo
ple
Our
Per
form
ance
Co
rp. G
ove
rnan
ceFi
nanc
ials
Ref
eren
ces
Intr
od
ucti
on
The
Yea
r In
Rev
iew
Our
Co
unci
l
Notes to the Financial Report
Note 36 Contingent liabilities and contingent assets
Contingent liabilities
(a) Council is a party to an agreement signed under Section 173 of the Planning and Environmental Act in relation to proposed developments in Station Street Camberwell. This agreement was signed on 5 March 1996 pursuant to Planning Permit BOR/9941 and originally imposed certain planning conditions upon the owners of the land, including a limit on future fl oor area. The agreement also provided that Council would undertake the demolition, removal and relocation of the Public Transport Corporation substation and equipment situated in the Council car park to the west of the subject site and to construct car parking on this land. In the 2013–14 fi nancial year, the Victorian Civil and Administrative Tribunal (VCAT) ruled that the originally proposed developments can proceed. There have been several previous VCAT and Supreme Court proceedings (to which Council was a party) in relation to the developments in Station Street Camberwell and the Section 173 Agreement. All previous VCAT and Supreme Court Cases have been fi nalised, however, Council will likely be liable for costs associated with these proceedings. As of 30 June 2015, the nature timing and quantum of costs associated with these proceedings have not been reliably determined. The nature, timing and costs associated with honouring the terms of the Section 173 Agreement have also not been reliably determined.
(b) Council is presently involved in a number of confi dential legal matters, which are being conducted through Council’s solicitors. The estimated potential fi nancial effect of these matters is unknown at reporting date. The estimate of the fi nancial liability at reporting date representing Council’s maximum exposure under its public liability insurance policy for trips and falls on road reserves and footpaths total $227,000 (2013–14 $198,500). This amount is contingent on the outcome of the resolution of these claims.
(c) At balance date the Clayton landfi ll itself retains suffi cient liquidity to fund the post closure capital works and the post closure After Care expenses for the medium term. It is however likely that Council funds will be required to be expended in support of the entity in the longer term. The costs associated have not been reliably determined.
(d) Council has obligations under a defi ned benefi t superannuation scheme that may result in the need to make additional contributions to the scheme to ensure that the liabilities of the fund are covered by the assets of the fund. As a result of the volatility in fi nancial markets the likelihood of making such contributions in future periods exists. At this point in time it is not known if additional contributions will be required, their timing or potential amount.
Funding arrangements
City of Boroondara makes employer contributions to the defi ned benefi t category of the Fund at rates determined bythe Trustee on the advice of the Fund’s Actuary.
The Fund’s latest actuarial investigation was held as at 30 June 2014 and it was determined that the vested benefi t index (VBI)of the defi ned benefi t category of which City of Boroondara is a contributing employer was 103.4%. To determine the VBI, the fund Actuary used the following long-term assumptions:
Net investment returns 7.5% pa
Salary information 4.25% pa
Price infl ation (CPI) 2.75% pa
Vision Super has advised that the VBI at 30 June 2015 was 105.8%.
The VBI is to be used as the primary funding indicator. Because the VBI was above 100%, the actuarial investigation determined the defi ned benefi t category was in a satisfactory fi nancial position and that no change was necessary to the defi ned benefi t category’s funding arrangements from prior years.
Employer contributions
On the basis of the results of the most recent full actuarial investigation conducted by the Fund’s Actuary as at 30 June 2014, City of Boroondara makes employer contributions to the Fund’s Defi ned Benefi t category at rates determined by the Fund’s Trustee. For the year ended 30 June 2015, this rate was 9.5% of members’ salaries. This rate will increase in line with any increase to the Superannuation Guarantee (SG) contribution rate.
In addition, City of Boroondara reimburses the Fund to cover the excess of the benefi ts paid as a consequence of retrenchment above the funded resignation or retirement benefi t.
Funding calls
If the defi ned benefi t category is in an unsatisfactory fi nancial position at actuarial investigation or the defi ned benefi t category’s VBI is below its shortfall limit at any time other than the date of the actuarial investigation, the defi ned benefi t category has a shortfall for the purposes of SPS 160 and the Fund is required to put a plan in place so that the shortfall is fully funded within three years of the shortfall occurring. The Fund monitors its VBI on a quarterly basis and the Fund has set its shortfall limit at 97%.
In the event that the Fund Actuary determines that there is a shortfall based on the above requirement, the Fund’s participating employers (including City of Boroondara) are required to make an employer contribution to cover the shortfall.
118118
Our
Peo
ple
Our
Per
form
ance
Co
rp. G
ove
rnan
ceFi
nanc
ials
Ref
eren
ces
Intr
od
ucti
on
The
Yea
r In
Rev
iew
Our
Co
unci
l
Notes to the Financial Report
Note 36 Contingent liabilities and contingent assets
Contingent liabilities
(a) Council is a party to an agreement signed under Section 173 of the Planning and Environmental Act in relation to proposedtdevelopments in Station Street Camberwell. This agreement was signed on 5 March 1996 pursuant to Planning PermitBOR/9941 and originally imposed certain planning conditions upon the owners of the land, including a limit on future fl oorarea. The agreement also provided that Council would undertake the demolition, removal and relocation of the Public TransportCorporation substation and equipment situated in the Council car park to the west of the subject site and to construct carparking on this land. In the 2013–14 fi nancial year, the Victorian Civil and Administrative Tribunal (VCAT) ruled that the originallyproposed developments can proceed. There have been several previous VCAT and Supreme Court proceedings (to which Council was a party) in relation to the developments in Station Street Camberwell and the Section 173 Agreement. All previousVCAT and Supreme Court Cases have been fi nalised, however, Council will likely be liable for costs associated with these proceedings. As of 30 June 2015, the nature timing and quantum of costs associated with these proceedings have not been reliably determined. The nature, timing and costs associated with honouring the terms of the Section 173 Agreement have alsonot been reliably determined.
(b) Council is presently involved in a number of confi dential legal matters, which are being conducted through Council’s solicitors. Theestimated potential fi nancial effect of these matters is unknown at reporting date. The estimate of the fi nancial liability at reportingdate representing Council’s maximum exposure under its public liability insurance policy for trips and falls on road reserves andfootpaths total $227,000 (2013–14 $198,500). This amount is contingent on the outcome of the resolution of these claims.
(c) At balance date the Clayton landfi ll itself retains suffi cient liquidity to fund the post closure capital works and the post closureAfter Care expenses for the medium term. It is however likely that Council funds will be required to be expended in support of the entity in the longer term. The costs associated have not been reliably determined.
(d) Council has obligations under a defi ned benefi t superannuation scheme that may result in the need to make additional contributions to the scheme to ensure that the liabilities of the fund are covered by the assets of the fund. As a result of thevolatility in fi nancial markets the likelihood of making such contributions in future periods exists. At this point in time it is notknown if additional contributions will be required, their timing or potential amount.
Funding arrangements
City of Boroondara makes employer contributions to the defi ned benefi t category of the Fund at rates determined bythe Trustee on the advice of the Fund’s Actuary.
The Fund’s latest actuarial investigation was held as at 30 June 2014 and it was determined that the vested benefi t index (VBI)of the defi ned benefi t category of which City of Boroondara is a contributing employer was 103.4%. To determine the VBI, the fundActuary used the following long-term assumptions:
Net investment returns 7.5% pa
Salary information 4.25% pa
Price infl ation (CPI) 2.75% pa
Vision Super has advised that the VBI at 30 June 2015 was 105.8%.
The VBI is to be used as the primary funding indicator. Because the VBI was above 100%, the actuarial investigation determinedthe defi ned benefi t category was in a satisfactory fi nancial position and that no change was necessary to the defi ned benefi t category’s funding arrangements from prior years.
Employer contributions
On the basis of the results of the most recent full actuarial investigation conducted by the Fund’s Actuary as at 30 June 2014, City of Boroondara makes employer contributions to the Fund’s Defi ned Benefi t category at rates determined by the Fund’sTrustee. For the year ended 30 June 2015, this rate was 9.5% of members’ salaries. This rate will increase in line with any increase to the Superannuation Guarantee (SG) contribution rate.
In addition, City of Boroondara reimburses the Fund to cover the excess of the benefi ts paid as a consequence of retrenchment above the funded resignation or retirement benefi t.
Funding calls
If the defi ned benefi t category is in an unsatisfactory fi nancial position at actuarial investigation or the defi ned benefi t category’s VBIis below its shortfall limit at any time other than the date of the actuarial investigation, the defi ned benefi t category has a shortfall forthe purposes of SPS 160 and the Fund is required to put a plan in place so that the shortfall is fully funded within three years of theshortfall occurring. The Fund monitors its VBI on a quarterly basis and the Fund has set its shortfall limit at 97%.
In the event that the Fund Actuary determines that there is a shortfall based on the above requirement, the Fund’s participatingemployers (including City of Boroondara) are required to make an employer contribution to cover the shortfall.

119119
Our P
eop
leO
ur Perfo
rmance
Co
rp. G
overnance
FinancialsR
eferencesIntro
ductio
nT
he Year In Review
Our C
ouncil
Using the agreed methodology, the shortfall amount is apportioned between the participating employers based on the pre–1 July 1993 and post–30 June 1993 service liabilities of the Fund’s defi ned benefi t category, together with the employer’s payroll at 30 June 1993 and at the date the shortfall has been calculated.
Due to the nature of the contractual obligations between the participating employers and the Fund, and that the Fund includes lifetime pensioners and their reversionary benefi ciaries, it is unlikely that the Fund will be wound up.
If there is a surplus in the Fund, the surplus cannot be returned to the participating employers.
In the event that a participating employer is wound-up, the defi ned benefi t obligations of that employer will be transferred to that employer’s successor.
Latest actuarial investigation surplus amounts
The Fund’s latest actuarial investigation as at 30 June 2014 identifi ed the following in the defi ned benefi t category of whichCity of Boroondara is a contributing employer:
• A VBI surplus of $77.1 million; and
A total service liability surplus of $236 million.
The VBI surplus means that the market value of the fund’s assets supporting the defi ned benefi t obligations exceed the vested benefi ts that the defi ned benefi t members would have been entitled to if they had all exited on 30 June 2014.
The total service liability surplus means that the current value of the assets in the Fund’s defi ned benefi t category plus expected future contributions exceeds the value of expected future benefi ts and expenses.
City of Boroondara was notifi ed of the results of the actuarial investigation during January 2015.
Superannuation contributions
Contributions by City of Boroondara (excluding any unfunded liability payments) to the above superannuation plans for the fi nancial year ended 30 June 2015 are detailed below:
Scheme Type of scheme Rate2015$’000
2014$’000
Vision super Defi ned benefi ts 9.50% 623 641
Vision super Accumulated plan 9.50% 3493 3301
Other superannuation funds Accumulated plan 9.50% 1511 1249
In addition to the above contributions, City of Boroondara has paid unfunded liability payments to Vision Super totalling nil amount paid during the 2014–15 year ($14.324 million amount paid during the 2013–14 year).
There were ($nil) contributions outstanding and ($nil) loans issued from or to the above schemes as at 30 June 2015.
The expected contributions to be paid to the defi ned benefi t category of Vision Super for the year ending 30 June 2016is $640,000.
In addition to the above contributions, City of Boroondara has paid unfunded liability payments to Vision Super totalling nil amount paid during the 2014–15 year ($14.324 million amount paid during the 2013–14 year).
Guarantees for loans to other entities
During the previous four fi nancial years, Council has resolved to act as a guarantor on loan facilities to various sporting clubs.The purpose of the loan funds was to assist with the cost of resurfacing of tennis courts and hockey subsurface to ‘drought proof’ the clubs. As at 30 June 2015, Council’s maximum potential exposure is as follows:
Community organisation
Amount outstanding 30 Jun 2015
Year loan commenced
Burwood Tennis Club $49,650 2007–08
$49,650
As at 30 June 2015, the above sporting club has not defaulted on the required loan repayments and therefore no allowance for this contingency is required in the fi nancial report.
Contingent assets
As of 30 June 2015, there are no potential contingent assets.
119119
Our P
eop
leO
ur Perfo
rmance
Co
rp. G
overnance
FinancialsR
eferencesIntro
ductio
nT
he Year In Review
Our C
ouncil
Using the agreed methodology, the shortfall amount is apportioned between the participating employers based on the pre–1 July 1993 and post–30 June 1993 service liabilities of the Fund’s defi ned benefi t category, together with the employer’s payroll at 30June 1993 and at the date the shortfall has been calculated.
Due to the nature of the contractual obligations between the participating employers and the Fund, and that the Fund includeslifetime pensioners and their reversionary benefi ciaries, it is unlikely that the Fund will be wound up.
If there is a surplus in the Fund, the surplus cannot be returned to the participating employers.
In the event that a participating employer is wound-up, the defi ned benefi t obligations of that employer will be transferred to that employer’s successor.
Latest actuarial investigation surplus amounts
The Fund’s latest actuarial investigation as at 30 June 2014 identifi ed the following in the defi ned benefi t category of whichCity of Boroondara is a contributing employer:
• A VBI surplus of $77.1 million; and
A total service liability surplus of $236 million.
The VBI surplus means that the market value of the fund’s assets supporting the defi ned benefi t obligations exceed the vested benefi ts that the defi ned benefi t members would have been entitled to if they had all exited on 30 June 2014.
The total service liability surplus means that the current value of the assets in the Fund’s defi ned benefi t category plus expectedfuture contributions exceeds the value of expected future benefi ts and expenses.
City of Boroondara was notifi ed of the results of the actuarial investigation during January 2015.
Superannuation contributions
Contributions by City of Boroondara (excluding any unfunded liability payments) to the above superannuation plans for the fi nancialyear ended 30 June 2015 are detailed below:
Scheme Type of scheme Rate2015$’000
2014$’000
Vision super Defi ned benefi ts 9.50% 623 641
Vision super Accumulated plan 9.50% 3493 3301
Other superannuation funds Accumulated plan 9.50% 1511 1249
In addition to the above contributions, City of Boroondara has paid unfunded liability payments to Vision Super totalling nil amountpaid during the 2014–15 year ($14.324 million amount paid during the 2013–14 year).
There were ($nil) contributions outstanding and ($nil) loans issued from or to the above schemes as at 30 June 2015.
The expected contributions to be paid to the defi ned benefi t category of Vision Super for the year ending 30 June 2016is $640,000.
In addition to the above contributions, City of Boroondara has paid unfunded liability payments to Vision Super totalling nil amountpaid during the 2014–15 year ($14.324 million amount paid during the 2013–14 year).
Guarantees for loans to other entities
During the previous four fi nancial years, Council has resolved to act as a guarantor on loan facilities to various sporting clubs.The purpose of the loan funds was to assist with the cost of resurfacing of tennis courts and hockey subsurface to ‘drought proof’the clubs. As at 30 June 2015, Council’s maximum potential exposure is as follows:
Community organisation
Amountoutstanding30 Jun 2015
Year loancommenced
Burwood Tennis Club $49,650 2007–08
$49,650
As at 30 June 2015, the above sporting club has not defaulted on the required loan repayments and therefore no allowance for thiscontingency is required in the fi nancial report.
Contingent assets
As of 30 June 2015, there are no potential contingent assets.

120120
Our
Peo
ple
Our
Per
form
ance
Co
rp. G
ove
rnan
ceFi
nanc
ials
Ref
eren
ces
Intr
od
ucti
on
The
Yea
r In
Rev
iew
Our
Co
unci
l
Notes to the Financial Report
Note 37 Financial instruments
(a) Objectives and policies
The Council’s principal fi nancial instruments comprise cash assets, term deposits, receivables (excluding statutory receivables), payables (excluding statutory payables) and bank borrowings. ‘Details of the signifi cant accounting policies and methods adopted, including the criteria for recognition, the basis of measurement and the basis on which income and expenses are recognised, in respect of each class of fi nancial asset, fi nancial liability and equity instrument is disclosed in note 1 of the fi nancial statements. ‘Risk management is carried out by senior management under policies approved by the Council. These policies include identifi cation and analysis of the risk exposure to Council and appropriate procedures, controls and risk minimisation.
(b) Market risk
Market risk is the risk that the fair value or future cash fl ows of our fi nancial instruments will fl uctuate because of changes in market prices. The Council’s exposures to market risk is primarily through interest rate risk with only insignifi cant exposure to other price risks and no exposure to foreign currency risk.
Interest rate risk
Interest rate risk refers to the risk that the value of a fi nancial instrument or cash fl ows associated with the instrument will fl uctuate due to changes in market interest rates. Our interest rate liability risk arises primarily from long term loans and borrowings at fi xed rates which exposes us to fair value interest rate risk. Cash fl ow interest rate risk is the risk that the future cash fl ows of a fi nancial instrument will fl uctuate because of changes in market interest rates. Council has minimal exposure to cash fl ow interest rate risk through its cash and deposits that are at fl oating rate.
Investment of surplus funds is made with approved fi nancial institutions under the Local Government Act 1989.We manage interest rate risk by adopting an investment policy that ensures:
– diversifi cation of investment product
– monitoring of return on investment
– benchmarking of returns and comparison with budget.
There has been no signifi cant change in the Council’s exposure, or its objectives, policies and processes for managing interest rate risk or the methods used to measure this risk from the previous reporting period.
Interest rate movements have not been suffi ciently signifi cant during the year to have an impact on the Council’s year end result.
(c) Credit risk
Credit risk is the risk that a contracting entity will not complete its obligations under a fi nancial instrument and cause us to makea fi nancial loss. We have exposure to credit risk on all fi nancial assets included in our balance sheet. To help manage this risk:
– We may require collateral where appropriate
– We only invest surplus funds with fi nancial institutions which have a recognised credit rating specifi ed in our investment policy.
Receivables consist of a large number of customers, spread across the ratepayer, business and government sectors.Credit risk associated with the Council's fi nancial assets is minimal because the main debtor is secured by a charge overthe rateable property.
There are no material fi nancial assets which are individually determined to be impaired.
We may also be subject to credit risk for transactions which are not included in the balance sheet, such as when we providea guarantee for another party. Details of our contingent liabilities are disclosed in note 36.
The maximum exposure to credit risk at the reporting date to recognised fi nancial assets is the carrying amount, net of any provisions for impairment of those assets, as disclosed in the balance sheet and notes to the fi nancial statements. Council does not hold any collateral.
(d) Liquidity risk
Liquidity risk includes the risk that, as a result of our operational liquidity requirements or we will not have suffi cient funds to settlea transaction when required, we will be forced to sell a fi nancial asset at below value or may be unable to settle or recover a fi nancial asset.
To help reduce these risks Council:
– have a liquidity policy which targets a minimum and average level of cash and cash equivalents to be maintained;
– have readily accessible standby facilities and other funding arrangements in place;
– have a liquidity portfolio structure that requires surplus funds to be invested within various bands of liquid instruments;
– monitor budget to actual performance on a regular basis; and
– set limits on borrowings relating to the percentage of loans to rate revenue and percentage of loan principal repaymentsto rate revenue.
120120
Our
Peo
ple
Our
Per
form
ance
Co
rp. G
ove
rnan
ceFi
nanc
ials
Ref
eren
ces
Intr
od
ucti
on
The
Yea
r In
Rev
iew
Our
Co
unci
l
Notes to the Financial Report
Note 37 Financial instruments
(a) Objectives and policies
The Council’s principal fi nancial instruments comprise cash assets, term deposits, receivables (excluding statutory receivables), payables (excluding statutory payables) and bank borrowings. ‘Details of the signifi cant accounting policies and methods adopted, including the criteria for recognition, the basis of measurement and the basis on which income and expenses are recognised, inrespect of each class of fi nancial asset, fi nancial liability and equity instrument is disclosed in note 1 of the fi nancial statements.‘Risk management is carried out by senior management under policies approved by the Council. These policies includeidentifi cation and analysis of the risk exposure to Council and appropriate procedures, controls and risk minimisation.
(b) Market risk
Market risk is the risk that the fair value or future cash fl ows of our fi nancial instruments will fl uctuate because of changes in market prices. The Council’s exposures to market risk is primarily through interest rate risk with only insignifi cant exposure to other price risks and no exposure to foreign currency risk.
Interest rate risk
Interest rate risk refers to the risk that the value of a fi nancial instrument or cash fl ows associated with the instrument will fl uctuate due to changes in market interest rates. Our interest rate liability risk arises primarily from long term loans and borrowings at fi xedrates which exposes us to fair value interest rate risk. Cash fl ow interest rate risk is the risk that the future cash fl ows of a fi nancial instrument will fl uctuate because of changes in market interest rates. Council has minimal exposure to cash fl ow interest rate risk through its cash and deposits that are at fl oating rate.
Investment of surplus funds is made with approved fi nancial institutions under the Local Government Act 1989.We manage interest rate risk by adopting an investment policy that ensures:
– diversifi cation of investment product
– monitoring of return on investment
– benchmarking of returns and comparison with budget.
There has been no signifi cant change in the Council’s exposure, or its objectives, policies and processes for managing interest raterisk or the methods used to measure this risk from the previous reporting period.
Interest rate movements have not been suffi ciently signifi cant during the year to have an impact on the Council’s year end result.
(c) Credit risk
Credit risk is the risk that a contracting entity will not complete its obligations under a fi nancial instrument and cause us to makea fi nancial loss. We have exposure to credit risk on all fi nancial assets included in our balance sheet. To help manage this risk:
– We may require collateral where appropriate
– We only invest surplus funds with fi nancial institutions which have a recognised credit rating specifi ed in our investment policy.
Receivables consist of a large number of customers, spread across the ratepayer, business and government sectors.Credit risk associated with the Council's fi nancial assets is minimal because the main debtor is secured by a charge overthe rateable property.
There are no material fi nancial assets which are individually determined to be impaired.
We may also be subject to credit risk for transactions which are not included in the balance sheet, such as when we providea guarantee for another party. Details of our contingent liabilities are disclosed in note 36.
The maximum exposure to credit risk at the reporting date to recognised fi nancial assets is the carrying amount, net of anyprovisions for impairment of those assets, as disclosed in the balance sheet and notes to the fi nancial statements. Council doesnot hold any collateral.
(d) Liquidity risk
Liquidity risk includes the risk that, as a result of our operational liquidity requirements or we will not have suffi cient funds to settlea transaction when required, we will be forced to sell a fi nancial asset at below value or may be unable to settle or recover a fi nancial asset.
To help reduce these risks Council:
– have a liquidity policy which targets a minimum and average level of cash and cash equivalents to be maintained;
– have readily accessible standby facilities and other funding arrangements in place;
– have a liquidity portfolio structure that requires surplus funds to be invested within various bands of liquid instruments;
– monitor budget to actual performance on a regular basis; and
– set limits on borrowings relating to the percentage of loans to rate revenue and percentage of loan principal repaymentsto rate revenue.

121121
Our P
eop
leO
ur Perfo
rmance
Co
rp. G
overnance
FinancialsR
eferencesIntro
ductio
nT
he Year In Review
Our C
ouncil
Note 37 Financial instruments (cont.)
The Council’s maximum exposure to liquidity risk is the carrying amounts of fi nancial liabilities as disclosed in the face of the balance sheet and the amounts related to fi nancial guarantees disclosed in note 36, and is deemed insignifi cant based on prior periods’ data and current assessment of risk.
There has been no signifi cant change in Council’s exposure, or its objectives, policies and processes for managing liquidity riskor the methods used to measure this risk from the previous reporting period.
With the exception of borrowings, all fi nancial liabilities are expected to be settled within normal terms of trade.Details of the maturity profi le for borrowings are disclosed at note 29.
Unless otherwise stated, the carrying amounts of fi nancial instruments refl ect their fair value.
e) Fair value
Unless otherwise stated, the carrying amount of fi nancial instruments refl ect their fair value
Fair value hierarchy
Council's fi nancial assets and liabilities are not valued in accordance with the fair value hierarchy, Council's fi nancial assetsand liabilities are measured at amortised cost.
(f) Sensitivity disclosure analysis
Taking into account past performance, future expectations, economic forecasts, and management's knowledge and experienceof the fi nancial markets, Council believes the following movements are 'reasonably possible' over the next 12 months:
– A parallel shift of + 1% and -1% in market interest rates (AUD) from year-end rates of 2.94%.
These movements will not have a material impact on the valuation of Council's fi nancial assets and liabilities, nor will they havea material impact on the results of Council's operations.
Note 38 Related party transactions
(i) Responsible persons
Names of persons holding the position of a Responsible Person at the Council at any time during the year are:
Councillors Councillor Coral Ross (Mayor)
Councillor Jack Wegman
Councillor Heinz Kreutz
Councillor Jane Addis
Councillor Kevin Chow
Councillor Phillip Healey
Councillor Steve Hurd
Councillor Philip Mallis
Councillor Jim Parke
Councillor Judith Voce
Chief Executive Offi cer Phillip Storer
121121
Our P
eop
leO
ur Perfo
rmance
Co
rp. G
overnance
FinancialsR
eferencesIntro
ductio
nT
he Year In Review
Our C
ouncil
Note 37 Financial instruments (cont.)
The Council’s maximum exposure to liquidity risk is the carrying amounts of fi nancial liabilities as disclosed in the face of the balance sheet and the amounts related to fi nancial guarantees disclosed in note 36, and is deemed insignifi cant based on priorperiods’ data and current assessment of risk.
There has been no signifi cant change in Council’s exposure, or its objectives, policies and processes for managing liquidity riskor the methods used to measure this risk from the previous reporting period.
With the exception of borrowings, all fi nancial liabilities are expected to be settled within normal terms of trade.Details of the maturity profi le for borrowings are disclosed at note 29.
Unless otherwise stated, the carrying amounts of fi nancial instruments refl ect their fair value.
e) Fair value
Unless otherwise stated, the carrying amount of fi nancial instruments refl ect their fair value
Fair value hierarchy
Council's fi nancial assets and liabilities are not valued in accordance with the fair value hierarchy, Council's fi nancial assetsand liabilities are measured at amortised cost.
(f) Sensitivity disclosure analysis
Taking into account past performance, future expectations, economic forecasts, and management's knowledge and experienceof the fi nancial markets, Council believes the following movements are 'reasonably possible' over the next 12 months:
– A parallel shift of + 1% and -1% in market interest rates (AUD) from year-end rates of 2.94%.
These movements will not have a material impact on the valuation of Council's fi nancial assets and liabilities, nor will they havea material impact on the results of Council's operations.
Note 38 Related party transactions
(i) Responsible persons
Names of persons holding the position of a Responsible Person at the Council at any timeduring the year are:
Councillors Councillor Coral Ross (Mayor)
Councillor Jack Wegman
Councillor Heinz Kreutz
Councillor Jane Addis
Councillor Kevin Chow
Councillor Phillip Healey
Councillor Steve Hurd
Councillor Philip Mallis
Councillor Jim Parke
Councillor Judith Voce
Chief Executive Offi cer Phillip Storer

122122
Our
Peo
ple
Our
Per
form
ance
Co
rp. G
ove
rnan
ceFi
nanc
ials
Ref
eren
ces
Intr
od
ucti
on
The
Yea
r In
Rev
iew
Our
Co
unci
l
Notes to the Financial Report
Note 38 Related party transactions (cont.)
(ii) Remuneration of responsible persons
The numbers of Responsible Offi cers, whose total remuneration from Council and any related entities fall within the following bands:
2015No.
2014No.
$1 – $9,999 – –
$10,000 – $19,999 – –
$20,000 – $29,999 – 8
$30,000 – $39,999 9 –
$40,000 – $49,999 – –
$50,000 – $59,999 – 1
$60,000 – $69,999 – 1
$90,000 – $99,999 1 –
$370,000 – $379,999 – 1
$380,000 – $389,999 1 –
11 11
$’000 $’000
Total remuneration for the reporting year for Responsible Persons included above amounted to:
763 718
(iii) Senior offi cers remuneration
A Senior Offi cer other than a Responsible Person, is an offi cer of Council who:
a) has management responsibilities and reports directly to the Chief Executive; or
b) whose total annual remuneration exceeds $136,000 (2013–14: $133,000)
The number of Senior Offi cers, other than the Responsible Persons,are shown below in their relevant income bands:
2015No.
2014No.
Income range:
$133,000 – $139,999 – 5
$140,000 – $149,999 2 –
$150,000 – $159,999 1 1
$160,000 – $169,999 2 5
$170,000 – $179,999 8 5
$180,000 – $189,999 2 3
$190,000 – $199,999 2 4
$200,000 – $219,999 4 –
$230,000 – $239,999 1 1
$250,000 – $259,999 – –
$260,000 – $269,999 – –
$270,000 – $279,999 – 3
$280,000 – $289,999 4 –
26 27
$’000 $’000
Total remuneration for the reporting year to Senior Offi cers included above amounted to 5,107 4,921
122122
Our
Peo
ple
Our
Per
form
ance
Co
rp. G
ove
rnan
ceFi
nanc
ials
Ref
eren
ces
Intr
od
ucti
on
The
Yea
r In
Rev
iew
Our
Co
unci
l
Notes to the Financial Report
Note 38 Related party transactions (cont.)
(ii) Remuneration of responsible persons
The numbers of Responsible Offi cers, whose total remunerationfrom Council and any related entities fall within the following bands:
2015No.
2014No.
$1 – $9,999 – –
$10,000 – $19,999 – –
$20,000 – $29,999 – 8
$30,000 – $39,999 9 –
$40,000 – $49,999 – –
$50,000 – $59,999 – 1
$60,000 – $69,999 – 1
$90,000 – $99,999 1 –
$370,000 – $379,999 – 1
$380,000 – $389,999 1 –
11 11
$’000 $’000
Total remuneration for the reporting year for Responsible Persons included above amounted to:
763 718
(iii) Senior offi cers remuneration
A Senior Offi cer other than a Responsible Person, is an offi cer of Council who:
a) has management responsibilities and reports directly to the Chief Executive; or
b) whose total annual remuneration exceeds $136,000 (2013–14: $133,000)
The number of Senior Offi cers, other than the Responsible Persons,are shown below in their relevant income bands:
2015No.
2014No.
Income range:
$133,000 – $139,999 – 5
$140,000 – $149,999 2 –
$150,000 – $159,999 1 1
$160,000 – $169,999 2 5
$170,000 – $179,999 8 5
$180,000 – $189,999 2 3
$190,000 – $199,999 2 4
$200,000 – $219,999 4 –
$230,000 – $239,999 1 1
$250,000 – $259,999 – –
$260,000 – $269,999 – –
$270,000 – $279,999 – 3
$280,000 – $289,999 4 –
26 27
$’000 $’000
Total remuneration for the reporting year to Senior Offi cers included above amounted to 5,107 4,921
123123
Our P
eop
leO
ur Perfo
rmance
Co
rp. G
overnance
FinancialsR
eferencesIntro
ductio
nT
he Year In Review
Our C
ouncil
Note 38 Related party transactions (cont.)
(iv) Responsible persons retirement benefi ts
The aggregate amount paid during the reporting period by Council in connection with the retirement of responsible personswas $0 (2013–14 – Nil).
(v) Loans to responsible persons
The aggregate amount of loans in existence at balance date that have been made, guaranteed or secured by the councilto a responsible person of the council, or a related party of a responsible person was none.
(vi) Other transactions
During the year, a number of transactions were entered into that require additional disclosures in this note. All transactions listed below occurred under normal commercial terms and conditions.
(a) Metropolitan Waste Management Board & Sustainability Victoria
Councillor Heinz Kreutz was the Chairman of the Metropolitan Waste Management Group Board (MWMG). For the year ended30 June 2015, Council paid MWMG $1,340 (GST exclusive) for training and consultancy services.
(b) Municipal Association Victoria
Councillor Coral Ross Mayor became Vice President (Metropolitan) on the Municipal Association Victoria (MAV) Board in April 2015. For the year ended 30 June 2015, Council paid MAV $122,451 (excluding GST) for a membership subscription, insurance and other professional services.
Note 39 Events occurring after balance date
There are no events occurring after balance date for the 2014–15 fi nancial year.
123123
Our P
eop
leO
ur Perfo
rmance
Co
rp. G
overnance
FinancialsR
eferencesIntro
ductio
nT
he Year In Review
Our C
ouncil
Note 38 Related party transactions (cont.)
(iv) Responsible persons retirement benefi ts
The aggregate amount paid during the reporting period by Council in connection with the retirement of responsible personswas $0 (2013–14 – Nil).
(v) Loans to responsible persons
The aggregate amount of loans in existence at balance date that have been made, guaranteed or secured by the councilto a responsible person of the council, or a related party of a responsible person was none.
(vi) Other transactions
During the year, a number of transactions were entered into that require additional disclosures in this note. All transactions listedbelow occurred under normal commercial terms and conditions.
(a) Metropolitan Waste Management Board & Sustainability Victoria
Councillor Heinz Kreutz was the Chairman of the Metropolitan Waste Management Group Board (MWMG). For the year ended30 June 2015, Council paid MWMG $1,340 (GST exclusive) for training and consultancy services.
(b) Municipal Association Victoria
Councillor Coral Ross Mayor became Vice President (Metropolitan) on the Municipal Association Victoria (MAV) Board in April 2015.For the year ended 30 June 2015, Council paid MAV $122,451 (excluding GST) for a membership subscription, insurance andother professional services.
Note 39 Events occurring after balance date
There are no events occurring after balance date for the 2014–15 fi nancial year.

124124
Our
Peo
ple
Our
Per
form
ance
Co
rp. G
ove
rnan
ceFi
nanc
ials
Ref
eren
ces
Intr
od
ucti
on
The
Yea
r In
Rev
iew
Our
Co
unci
l
Certifi cation of the Financial Statements
124124
Our
Peo
ple
Our
Per
form
ance
Co
rp. G
ove
rnan
ceFi
nanc
ials
Ref
eren
ces
Intr
od
ucti
on
The
Yea
r In
Rev
iew
Our
Co
unci
l
Certifi cation of the Financial Statements

125125
Our P
eop
leO
ur Perfo
rmance
Co
rp. G
overnance
FinancialsR
eferencesIntro
ductio
nT
he Year In Review
Our C
ouncil
Auditor General’s Report on theFinancial Statements
125125
Our P
eop
leO
ur Perfo
rmance
Co
rp. G
overnance
FinancialsR
eferencesIntro
ductio
nT
he Year In Review
Our C
ouncil
Auditor General’s Report on theFinancial Statements

126126
Our
Peo
ple
Our
Per
form
ance
Co
rp. G
ove
rnan
ceFi
nanc
ials
Ref
eren
ces
Intr
od
ucti
on
The
Yea
r In
Rev
iew
Our
Co
unci
l
Auditor General’s Report on theFinancial Statements
126126
Our
Peo
ple
Our
Per
form
ance
Co
rp. G
ove
rnan
ceFi
nanc
ials
Ref
eren
ces
Intr
od
ucti
on
The
Yea
r In
Rev
iew
Our
Co
unci
l
Auditor General’s Report on theFinancial Statements

127127
Our P
eop
leO
ur Perfo
rmance
Co
rp. G
overnance
FinancialsR
eferencesIntro
ductio
nT
he Year In Review
Our C
ouncil
127127
Our P
eop
leO
ur Perfo
rmance
Co
rp. G
overnance
FinancialsR
eferencesIntro
ductio
nT
he Year In Review
Our C
ouncil


129
Performance Statement
129
Performance Statement

130130
Our
Peo
ple
Our
Per
form
ance
Co
rp. G
ove
rnan
ceFi
nanc
ials
Ref
eren
ces
Intr
od
ucti
on
The
Yea
r In
Rev
iew
Our
Co
unci
l
Performance statement
For the year ended 30 June 2015
Description of municipalityThe City of Boroondara (the Council) is located in the inner eastern suburbs of Melbourne, between 5 and 10 kilometres east of the Melbourne Central Business District and covers an area of 60 square kilometres. The Council includes the suburbs of Ashburton, Balwyn, Balwyn North, Camberwell, Canterbury, Deepdene, Hawthorn, Hawthorn East, Kew and Kew East, and parts of Glen Iris, Surrey Hills and Mont Albert.
Boroondara is one of the most populous local governments in Victoria and has an estimated residential population of 172,612 people (as at 30 June 2014) which is expected to grow to 190,228 over the next 10 years. While 68% of Boroondara residents were born in Australia, we are becoming more culturally and linguistically diverse. At the last Census, over a quarter of the population was born overseas, with the majority coming from a country where English is not a main language.
Compared with metropolitan Melbourne overall, we have a lower proportion of children and 30 to 39 year olds, but a larger proportion of people aged over 50 years. We have the second largest population of people aged 85 years and over, with 3.7% of the population needing assistancewith daily living tasks.
By area, Boroondara has one of the highest concentrations of schools of all Victorian local government areas, with 57 secondary, primary andspecial education schools, including 13 combined primary and secondary schools, as well as Swinburne University, Swinburne TAFE, a Universityof Melbourne campus and two Universities of the Third Age.
130130
Our
Peo
ple
Our
Per
form
ance
Co
rp. G
ove
rnan
ceFi
nanc
ials
Ref
eren
ces
Intr
od
ucti
on
The
Yea
r In
Rev
iew
Our
Co
unci
l
Performance statement
For the year ended 30 June 2015
Description of municipalityThe City of Boroondara (the Council) is located in the inner eastern suburbs of Melbourne, between 5 and 10 kilometres east of the Melbourne Central Business District and covers an area of 60 square kilometres. The Council includes the suburbs of Ashburton, Balwyn, Balwyn North,Camberwell, Canterbury, Deepdene, Hawthorn, Hawthorn East, Kew and Kew East, and parts of Glen Iris, Surrey Hills and Mont Albert.
Boroondara is one of the most populous local governments in Victoria and has an estimated residential population of 172,612 people (as at 30 June2014) which is expected to grow to 190,228 over the next 10 years. While 68% of Boroondara residents were born in Australia, we are becoming more culturally and linguistically diverse. At the last Census, over a quarter of the population was born overseas, with the majority coming from acountry where English is not a main language.
Compared with metropolitan Melbourne overall, we have a lower proportion of children and 30 to 39 year olds, but a larger proportion of peopleaged over 50 years. We have the second largest population of people aged 85 years and over, with 3.7% of the population needing assistancewith daily living tasks.
By area, Boroondara has one of the highest concentrations of schools of all Victorian local government areas, with 57 secondary, primary andspecial education schools, including 13 combined primary and secondary schools, as well as Swinburne University, Swinburne TAFE, a Universityof Melbourne campus and two Universities of the Third Age.

131131
Our P
eop
leO
ur Perfo
rmance
Co
rp. G
overnance
FinancialsR
eferencesIntro
ductio
nT
he Year In Review
Our C
ouncil
Sustainable capacity indicators
For the year ended 30 June 2015
Dimension/Indicator/measureResults
2014–15 Material Variations
Own-source revenueOwn-source revenue per head of municipal population(Own-source revenue/Municipal population)
$1,020
Recurrent grantsRecurrent grants per head of municipal population(Recurrent grants/Municipal population)
$95
PopulationExpenses per head of municipal population(Total expenses/Municipal population)
$985
Infrastructure per head of municipal population(Value of infrastructure/Municipal population)
$4,609
Population density per length of road(Municipal population/Kilometres of local roads)
$297
DisadvantageRelative Socio-economic disadvantage(Index of Relative Socio-economic Disadvantage by decile)
10
Defi nitions“adjusted underlying revenue” means total income other than –
(a) non-recurrent grants used to fund capital expenditure; and
(b) non-monetary asset contributions; and
(c) contributions to fund capital expenditure from sources other than those referred to in paragraphs (a) and (b)
“infrastructure” means non-current property, plant and equipment excluding land.
“local road” means a sealed or unsealed road for which the council is the responsible road authority under the Road Management Act 2004.
“population” means the resident population estimated by council.
“own-source revenue”means adjusted underlying revenue other than revenue that is not under the control of council (including government grants).
“ relative socio-economic disadvantage”, in relation to a municipality, means the relative socio-economic disadvantage, expressed as a decile for the relevant fi nancial year, of the area in which the municipality is located according to the index of Relative Socio-Economic Disadvantage (Catalogue Number 2033.0.55.001) of SEIFA.
“SEIFA” means the Socio-Economic Indexes for Areas published from time to time by the Australian Bureau of Statistics on its internet website.
“unrestricted cash” means all cash and cash equivalents other than restricted cash.
131131
Our P
eop
leO
ur Perfo
rmance
Co
rp. G
overnance
FinancialsR
eferencesIntro
ductio
nT
he Year In Review
Our C
ouncil
Sustainable capacity indicators
For the year ended 30 June 2015
Dimension/Indicator/measureResults
2014–15 Material Variations
Own-source revenueOwn-source revenue per head of municipal population(Own-source revenue/Municipal population)
$1,020
Recurrent grantsRecurrent grants per head of municipal population(Recurrent grants/Municipal population)
$95
PopulationExpenses per head of municipal population(Total expenses/Municipal population)
$985
Infrastructure per head of municipal population(Value of infrastructure/Municipal population)
$4,609
Population density per length of road(Municipal population/Kilometres of local roads)
$297
DisadvantageRelative Socio-economic disadvantage(Index of Relative Socio-economic Disadvantage by decile)
10
Defi nitions“adjusted underlying revenue” means total income other than –
(a) non-recurrent grants used to fund capital expenditure; and
(b) non-monetary asset contributions; and
(c) contributions to fund capital expenditure from sources other than those referred to in paragraphs (a) and (b)
“infrastructure” means non-current property, plant and equipment excluding land.
“local road” means a sealed or unsealed road for which the council is the responsible road authority under the Road Management Act 2004.
“population” means the resident population estimated by council.
“own-source revenue”means adjusted underlying revenue other than revenue that is not under the control of council (including government grants).
“ relative socio-economic disadvantage”, in relation to a municipality, means the relative socio-economic disadvantage, expressed as a decile for therelevant fi nancial year, of the area in which the municipality is located according to the index of Relative Socio-Economic Disadvantage (Catalogue Number 2033.0.55.001) of SEIFA.
“SEIFA” means the Socio-Economic Indexes for Areas published from time to time by the Australian Bureau of Statistics on its internet website.
“unrestricted cash” means all cash and cash equivalents other than restricted cash.
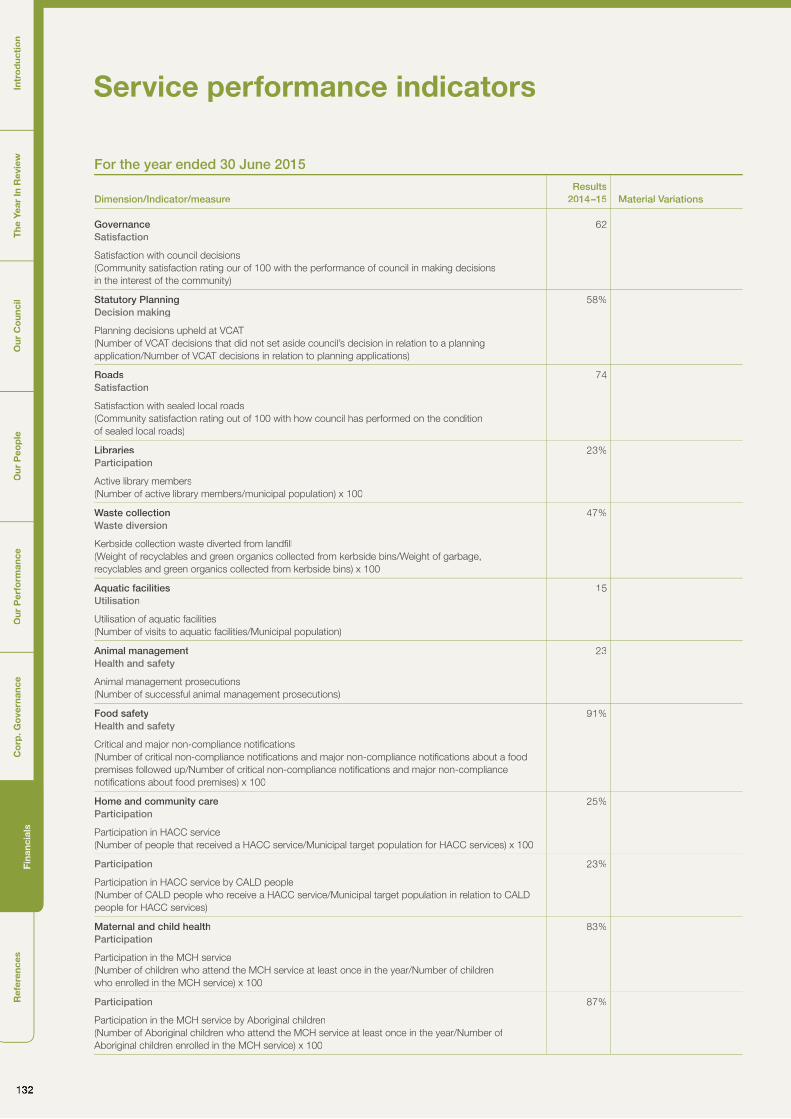
132132
Our
Peo
ple
Our
Per
form
ance
Co
rp. G
ove
rnan
ceFi
nanc
ials
Ref
eren
ces
Intr
od
ucti
on
The
Yea
r In
Rev
iew
Our
Co
unci
l
Service performance indicators
For the year ended 30 June 2015
Dimension/Indicator/measureResults
2014–15 Material Variations
GovernanceSatisfaction
Satisfaction with council decisions(Community satisfaction rating our of 100 with the performance of council in making decisionsin the interest of the community)
62
Statutory PlanningDecision making
Planning decisions upheld at VCAT(Number of VCAT decisions that did not set aside council’s decision in relation to a planning application/Number of VCAT decisions in relation to planning applications)
58%
RoadsSatisfaction
Satisfaction with sealed local roads(Community satisfaction rating out of 100 with how council has performed on the conditionof sealed local roads)
74
LibrariesParticipation
Active library members(Number of active library members/municipal population) x 100
23%
Waste collectionWaste diversion
Kerbside collection waste diverted from landfi ll(Weight of recyclables and green organics collected from kerbside bins/Weight of garbage,recyclables and green organics collected from kerbside bins) x 100
47%
Aquatic facilitiesUtilisation
Utilisation of aquatic facilities(Number of visits to aquatic facilities/Municipal population)
15
Animal managementHealth and safety
Animal management prosecutions(Number of successful animal management prosecutions)
23
Food safetyHealth and safety
Critical and major non-compliance notifi cations(Number of critical non-compliance notifi cations and major non-compliance notifi cations about a food premises followed up/Number of critical non-compliance notifi cations and major non-compliance notifi cations about food premises) x 100
91%
Home and community careParticipation
Participation in HACC service(Number of people that received a HACC service/Municipal target population for HACC services) x 100
25%
Participation
Participation in HACC service by CALD people(Number of CALD people who receive a HACC service/Municipal target population in relation to CALD people for HACC services)
23%
Maternal and child healthParticipation
Participation in the MCH service(Number of children who attend the MCH service at least once in the year/Number of childrenwho enrolled in the MCH service) x 100
83%
Participation
Participation in the MCH service by Aboriginal children(Number of Aboriginal children who attend the MCH service at least once in the year/Number of Aboriginal children enrolled in the MCH service) x 100
87%
132132
Our
Peo
ple
Our
Per
form
ance
Co
rp. G
ove
rnan
ceFi
nanc
ials
Ref
eren
ces
Intr
od
ucti
on
The
Yea
r In
Rev
iew
Our
Co
unci
l
Service performance indicators
For the year ended 30 June 2015
Dimension/Indicator/measureResults
2014–15 Material Variations
GovernanceSatisfaction
Satisfaction with council decisions(Community satisfaction rating our of 100 with the performance of council in making decisionsin the interest of the community)
62
Statutory PlanningDecision making
Planning decisions upheld at VCAT(Number of VCAT decisions that did not set aside council’s decision in relation to a planningapplication/Number of VCAT decisions in relation to planning applications)
58%
RoadsSatisfaction
Satisfaction with sealed local roads(Community satisfaction rating out of 100 with how council has performed on the conditionof sealed local roads)
74
LibrariesParticipation
Active library members(Number of active library members/municipal population) x 100
23%
Waste collectionWaste diversion
Kerbside collection waste diverted from landfi ll(Weight of recyclables and green organics collected from kerbside bins/Weight of garbage,recyclables and green organics collected from kerbside bins) x 100
47%
Aquatic facilitiesUtilisation
Utilisation of aquatic facilities(Number of visits to aquatic facilities/Municipal population)
15
Animal managementHealth and safety
Animal management prosecutions(Number of successful animal management prosecutions)
23
Food safetyHealth and safety
Critical and major non-compliance notifi cations(Number of critical non-compliance notifi cations and major non-compliance notifi cations about a foodpremises followed up/Number of critical non-compliance notifi cations and major non-compliance notifi cations about food premises) x 100
91%
Home and community careParticipation
Participation in HACC service(Number of people that received a HACC service/Municipal target population for HACC services) x 100
25%
Participation
Participation in HACC service by CALD people(Number of CALD people who receive a HACC service/Municipal target population in relation to CALDpeople for HACC services)
23%
Maternal and child healthParticipation
Participation in the MCH service(Number of children who attend the MCH service at least once in the year/Number of childrenwho enrolled in the MCH service) x 100
83%
Participation
Participation in the MCH service by Aboriginal children(Number of Aboriginal children who attend the MCH service at least once in the year/Number of Aboriginal children enrolled in the MCH service) x 100
87%
133133
Our P
eop
leO
ur Perfo
rmance
Co
rp. G
overnance
FinancialsR
eferencesIntro
ductio
nT
he Year In Review
Our C
ouncil
Defi nitions“Aboriginal child” means a child who is an Aboriginal person.
“Aboriginal person” has the same meaning as in the Aboriginal Heritage Act 2006.
“active library member” means a member of a library who has borrowed a book from the library.
“annual report” means an annual report prepared by a council under sections 131, 132 and 133 of the Act.
“ class 1 food premises” means food premises, within the meaning of the Food Act 1984, that have been declared as class 1 food premisesunder section 19C of that Act.
“ class 2 food premises” means food premises, within the meaning of the Food Act 1984, that have been declared as class 2 food premisesunder section 19C of that Act.
“ Community Care Common Standards” means the Community Care Common Standards for the delivery of HACC services, published fromtime to time by the Commonwealth.
“ critical non-compliance outcome notifi cation” means a notifi cation received by council under section 19N(3) or (4) of the Food Act 1984,or advice given to council by an authorised offi cer under that Act, of a defi ciency that poses an immediate serious threat to public health.
“food premises” has the same meaning as the Food Act 1984.
“ HACC program” means the Home and Community Care program established under the Agreement entered into for the purposeof the Home and Community Care Act 1985 of the Commonwealth.
“HACC service” means home help, personal care or community respite provided under the HACC program.
“local road” means a sealed or unsealed road for which the council is the responsible road authority under the Road Management Act 2004.
“ major non-compliance outcome notifi cation” means a notifi cation received by council under section 19N(3) or (4) or the Food Act 1984,or advice given to council by an authorised offi cer under that Act, of a defi ciency that does not pose an immediate serious threat to public healthbut may do so if no remedial action is taken.
“ MCH” means the Maternal and Child Health Service provided by a council to support the health and development of children withinthe municipality from birth until school age.
“population” means the resident population estimated by council.
“ target population” has the same meaning as in the Agreement entered into for the purposes of the Home and Community Care Act 1985of the Commonwealth.
“ WorkSafe reportable aquatic facility safety incident” means an incident relating to a council aquatic facility that is required to be notifi edto the Victorian WorkCover Authority under Part 5 of the Occupational Health and Safety Act 2004.

134134
Our
Peo
ple
Our
Per
form
ance
Co
rp. G
ove
rnan
ceFi
nanc
ials
Ref
eren
ces
Intr
od
ucti
on
The
Yea
r In
Rev
iew
Our
Co
unci
l
For the year ended 30 June 2015
Dimension/Indicator/measureResults
2014–15
Forecasts
Material Variations2016 2017 2018 2019
Operating positionAdjusted underlying result
Adjusted underlying surplus (or defi cit(Adjusted underlying surplus (defi cit)/Adjusted underlying revenue) x 100”
12% 12% 13% 13% 14%
LiquidityWorking capital
Current assets compared tocurrent liabilities (Current assets/Current liabilities) x 100
191% 181% 196% 152% 172%
Unrestricted cashUnrestricted cash compared tocurrent liabilities (Unrestricted cash/Current liabilities) x 100
145% 134% 149% 116% 120%
ObligationsLoans and borrowings
Loans and borrowings compared to rates(Interest bearing loans and borrowings/Rate revenue) x 100
38% 33% 30% 26% 15% A debt repayment of $17.02 million is scheduled to be repaid in 2018–19.
Loans and borrowingsLoans and borrowings repayments compared to rates (Interest and principal repayments on interest bearing loans and borrowings/Rate revenue) x 100
18% 4% 4% 4% 11% A 20 year loan was refi nanced in 2014–15and will be repaid in fullin 2018–19.
IndebtednessNon-current liabilities compared to own source revenue (Non-current liabilities/Own source revenue) x 100
32% 27% 24% 14% 13% Reduction in 2017–18 due to the movement of a loan to current liabilities in preparation for full payment in 2018–19.
Asset renewalAsset renewal compared to depreciation (Asset renewal expenses/Asset depreciation) x 100
145% 150% 110% 116% 127%Based on Asset Renewal budgets and the timing of two major projects.
StabilityRates concentration
Rates compared to adjusted underlying revenue (Rate revenue/Adjusted underlying revenue) x 100
78% 79% 78% 78% 78%
Rates effortRates compared to property values (Rate revenue/Capital improved value of rateable properties in the municipality) x 100
0.2% 0.2% 0.2% 0.2% 0.2% Does not include the effect of the biannual property revaluation which may reduce 2017 through 2019 forecast.
Effi ciencyExpenditure levelExpenses per property assessment (Total expenses/Number of property assessments)
$2,300 $2,411 $2,470 $2,537 $2,574
Revenue levelAverage residential rate per residential property assessment (Residential rate revenue/Number of residential property assessments)
$1,769 $1,845 $1,861 $1,895 $1,930
Workforce turnoverResignations and terminations compared to average staff (Number of permanent staff resignations and terminations/Average number of permanent staff for the fi nancial year) x 100
8% 10% 10% 10% 10% Forecast based on long term averages.
Financial performance indicators
134134
Our
Peo
ple
Our
Per
form
ance
Co
rp. G
ove
rnan
ceFi
nanc
ials
Ref
eren
ces
Intr
od
ucti
on
The
Yea
r In
Rev
iew
Our
Co
unci
l
For the year ended 30 June 2015
Dimension/Indicator/measureResults
2014–15
Forecasts
Material Variations2016 2017 2018 2019
Operating positionAdjusted underlying result
Adjusted underlying surplus (or defi cit(Adjusted underlying surplus (defi cit)/Adjusted underlying revenue) x 100”
12% 12% 13% 13% 14%
LiquidityWorking capital
Current assets compared tocurrent liabilities (Current assets/Current liabilities) x 100
191% 181% 196% 152% 172%
Unrestricted cashUnrestricted cash compared tocurrent liabilities (Unrestricted cash/Current liabilities) x 100
145% 134% 149% 116% 120%
ObligationsLoans and borrowings
Loans and borrowings compared to rates(Interest bearing loans and borrowings/Raterevenue) x 100
38% 33% 30% 26% 15% A debt repayment of $17.02 million is scheduled to berepaid in 2018–19.
Loans and borrowingsLoans and borrowings repaymentscompared to rates (Interest and principalrepayments on interest bearing loans and borrowings/Rate revenue) x 100
18% 4% 4% 4% 11% A 20 year loan was refi nanced in 2014–15and will be repaid in fullin 2018–19.
IndebtednessNon-current liabilities compared to own source revenue (Non-current liabilities/Ownsource revenue) x 100
32% 27% 24% 14% 13% Reduction in 2017–18 due to the movement of aloan to current liabilities inpreparation for full payment in 2018–19.
Asset renewalAsset renewal compared to depreciation (Asset renewal expenses/Assetdepreciation) x 100
145% 150% 110% 116% 127%Based on Asset Renewalbudgets and the timing of two major projects.
StabilityRates concentration
Rates compared to adjusted underlyingrevenue (Rate revenue/Adjusted underlyingrevenue) x 100
78% 79% 78% 78% 78%
Rates effortRates compared to property values (Raterevenue/Capital improved value of rateableproperties in the municipality) x 100
0.2% 0.2% 0.2% 0.2% 0.2% Does not include the effect of the biannual propertyrevaluation which may reduce 2017 through 2019 forecast.
Effi ciencyExpenditure levelExpenses per property assessment(Total expenses/Number of propertyassessments)
$2,300 $2,411 $2,470 $2,537 $2,574
Revenue levelAverage residential rate per residentialproperty assessment (Residential raterevenue/Number of residential property assessments)
$1,769 $1,845 $1,861 $1,895 $1,930
Workforce turnoverResignations and terminations comparedto average staff (Number of permanentstaff resignations and terminations/Averagenumber of permanent staff for the fi nancialyear) x 100
8% 10% 10% 10% 10% Forecast based on long termaverages.
Financial performance indicators

135135
Our P
eop
leO
ur Perfo
rmance
Co
rp. G
overnance
FinancialsR
eferencesIntro
ductio
nT
he Year In Review
Our C
ouncil
Defi nitions“adjusted underlying revenue” means total income other than –
(a) non-recurrent grants used to fund capital expenditure; and
(b) non-monetary asset contributions; and
(c) contributions to fund capital expenditure from sources other than those referred to in paragraphs (a) and (b)
“adjusted underlying surplus (or defi cit)” means adjusted underlying revenue less total expenditure.
“ asset renewal expenditure” means expenditure on an existing asset or on replacing an existing asset that returns the service capability of the asset to its original capability.
“current assets” has the same meaning as in the AAS.
“current liabilities” has the same meaning as in the AAS.
“non-current assets” means all assets other than current assets.
“non-current liabilities” means all liabilities other than current liabilities.
“ non-recurrent grant” means a grant obtained on the condition that it be expended in a specifi ed manner and is not expected to be received again during the period covered by a council’s Strategic Resource Plan.
“own-source revenue” means adjusted underlying revenue other than revenue that is not under the control of council (including government grants)“population” means the resident population estimated by council.
“rate revenue” means revenue from general rates, municipal charges, service rates and service charges.
“recurrent grant” means a grant other than a non-recurrent grant.
“residential rates” means revenue from general rates, municipal charges, service rates and service charges levied on residential properties.
“ restricted cash” means cash and cash equivalents, within the meaning of the AAS, that are not available for use other than for a purpose for whichit is restricted, and includes cash to be used to fund capital works expenditure from the previous fi nancial year.
“unrestricted cash” means all cash and cash equivalents other than restricted cash.
135135
Our P
eop
leO
ur Perfo
rmance
Co
rp. G
overnance
FinancialsR
eferencesIntro
ductio
nT
he Year In Review
Our C
ouncil
Defi nitions“adjusted underlying revenue” means total income other than –
(a) non-recurrent grants used to fund capital expenditure; and
(b) non-monetary asset contributions; and
(c) contributions to fund capital expenditure from sources other than those referred to in paragraphs (a) and (b)
“adjusted underlying surplus (or defi cit)” means adjusted underlying revenue less total expenditure.
“ asset renewal expenditure” means expenditure on an existing asset or on replacing an existing asset that returns the service capability of the assetto its original capability.
“current assets” has the same meaning as in the AAS.
“current liabilities” has the same meaning as in the AAS.
“non-current assets” means all assets other than current assets.
“non-current liabilities” means all liabilities other than current liabilities.
“ non-recurrent grant” means a grant obtained on the condition that it be expended in a specifi ed manner and is not expected to be received again during the period covered by a council’s Strategic Resource Plan.
“own-source revenue” means adjusted underlying revenue other than revenue that is not under the control of council (including government grants)“population” means the resident population estimated by council.
“rate revenue” means revenue from general rates, municipal charges, service rates and service charges.
“recurrent grant” means a grant other than a non-recurrent grant.
“residential rates” means revenue from general rates, municipal charges, service rates and service charges levied on residential properties.
“ restricted cash” means cash and cash equivalents, within the meaning of the AAS, that are not available for use other than for a purpose for whichit is restricted, and includes cash to be used to fund capital works expenditure from the previous fi nancial year.
“unrestricted cash” means all cash and cash equivalents other than restricted cash.

136136
Our
Peo
ple
Our
Per
form
ance
Co
rp. G
ove
rnan
ceFi
nanc
ials
Ref
eren
ces
Intr
od
ucti
on
The
Yea
r In
Rev
iew
Our
Co
unci
l
Certifi cation of the Performance Statement
136136
Our
Peo
ple
Our
Per
form
ance
Co
rp. G
ove
rnan
ceFi
nanc
ials
Ref
eren
ces
Intr
od
ucti
on
The
Yea
r In
Rev
iew
Our
Co
unci
l
Certifi cation of the Performance Statement

137137
Our P
eop
leO
ur Perfo
rmance
Co
rp. G
overnance
FinancialsR
eferencesIntro
ductio
nT
he Year In Review
Our C
ouncil
Auditor General’s Report on thePerformance Statements
137137
Our P
eop
leO
ur Perfo
rmance
Co
rp. G
overnance
FinancialsR
eferencesIntro
ductio
nT
he Year In Review
Our C
ouncil
Auditor General’s Report on thePerformance Statements

138138
Our
Peo
ple
Our
Per
form
ance
Co
rp. G
ove
rnan
ceFi
nanc
ials
Ref
eren
ces
Intr
od
ucti
on
The
Yea
r In
Rev
iew
Our
Co
unci
l
Auditor General’s Report on thePerformance Statements
138138
Our
Peo
ple
Our
Per
form
ance
Co
rp. G
ove
rnan
ceFi
nanc
ials
Ref
eren
ces
Intr
od
ucti
on
The
Yea
r In
Rev
iew
Our
Co
unci
l
Auditor General’s Report on thePerformance Statements

139139
Our P
eop
leO
ur Perfo
rmance
Co
rp. G
overnance
FinancialsR
eferencesIntro
ductio
nT
he Year In Review
Our C
ouncil
139139
Our P
eop
leO
ur Perfo
rmance
Co
rp. G
overnance
FinancialsR
eferencesIntro
ductio
nT
he Year In Review
Our C
ouncil

Ref
eren
ces
Our
Peo
ple
Our
Per
form
ance
Co
rp. G
ove
rnan
ceFi
nanc
ials
Intr
od
ucti
on
The
Yea
r In
Rev
iew
Our
Co
unci
l
140
Glossary
Glossary of terms
Accrual accounting System of accounting where items are brought to account and included in the Financial Statements as they are earned or incurred, rather than as they are received or paid.
Accumulated surplus The value of all net assets accumulated over time.
Act Refers to the Local Government Act 1989.
Advocacy Proactively trying to infl uence a decision to be made through support and recommendation, for such things as causes, programs and policies.
Annual report A report of the Council's operations of the previous fi nancial year and contains a report of operations, audited fi nancial statements and an audited performance statement.
Appropriateness Indicators or measures that provide users with suffi cient information to assess the extent to which an entityhas achieved a pre-determined target, goal or outcome.
Asset management Proactively manage the ongoing maintenance and development of Council's assets and facilities to meet the community's current and future needs.
Assets Future economic benefi ts controlled by Council as a result of past transactions or other past events.
Balance sheet A quantitative summary of Council’s fi nancial position at 30 June, including assets, liabilities and net equity.
Biodiversity The variety of all life forms including animals, plants, micro-organisms and the ecosystems which theyare a part of.
Budget A plan setting out the services and initiatives to be funded for the fi nancial year and how they will contribute to achieving the strategic objectives specifi ed in the Council Plan.
Capital works The expansion, renewal, upgrade and establishment of Council's assets.
Cash fl ow statement Shows the expected net cash infl ows and outfl ows in the form of reconciliation between opening and closing balances of total cash and investments for a year.
Comprehensive Income Statement
A fi nancial statement highlighting the accounting surplus or defi cit of Council. It provides an indication of whether the Council has suffi cient revenue to meet expenses in the current year, including non-cash costs such as depreciation and amortisation expenditure. It also includes other comprehensive income items including net asset revaluation increment (decrements) reversals and share of other comprehensive income of associates and joint ventures accounted for by the equity method to arrive at a 'comprehensive result'. The comprehensive result equates to the moment in net assets or total equity from the prior year.
Council Plan This document sets out the medium term goals and objectives for the next four years as part of the overall strategic planning framework and strategic resource plan and is prepared under section 125 of the Local Government Act 1989.
Current assets Assets where Council expects to receive the future economic benefi t within the next twelve months unlessthe asset is restricted from being exchanged or used to settle a liability for at least twelve months after the reporting date.
Current liabilities Liabilities where Council expects to fulfi l its obligation within the next twelve months unless the Council does not have an unconditional right to defer settlement of the liability for at least twelve months after reporting date.
Depreciation and amortisation An expense which recognises the value of a fi xed asset as it is used up over time.
Equity The residual interest in the assets of Council after deduction of its liabilities, which is made up of accumulated surplus and reserves. Total equity is also equal to net assets.
Expense An outgoing payment made by Council.
Financial performance indicators A prescribed set of indicators and measures that assess the effectiveness of fi nancial management in a council covering operating position, liquidity, obligations, stability and effi ciency.
Financial statements The fi nancial statements and notes prepared in accordance with the Local Government Model Financial Report, Australian Accounting Standards and other applicable standards as they apply to the general purpose fi nancial reports and a statement of capital works and included in the annual report.
Financial year The period of 12 months ending on 30 June each year.
Governance Policies and protocols associated with both the functions of Council and of Council offi cers to ensure Council is open, transparent, inclusive and accountable to the community.
Grants – non-recurrent income Grant income received for a ‘one off’ specifi c purpose, generally for a particular project.
Grants – recurrent income Grant income received on a regular basis (i.e. quarterly, annually) and granted to Council by another entity for specifi c or general purposes.
Ref
eren
ces
Our
Peo
ple
Our
Per
form
ance
Co
rp. G
ove
rnan
ceFi
nanc
ials
Intr
od
ucti
on
The
Yea
r In
Rev
iew
Our
Co
unci
l
140
Glossary
Glossary of terms
Accrual accounting System of accounting where items are brought to account and included in the Financial Statements as they are earned or incurred, rather than as they are received or paid.
Accumulated surplus The value of all net assets accumulated over time.
Act Refers to the Local Government Act 1989.
Advocacy Proactively trying to infl uence a decision to be made through support and recommendation, for such things ascauses, programs and policies.
Annual report A report of the Council's operations of the previous fi nancial year and contains a report of operations, auditedfi nancial statements and an audited performance statement.
Appropriateness Indicators or measures that provide users with suffi cient information to assess the extent to which an entityhas achieved a pre-determined target, goal or outcome.
Asset management Proactively manage the ongoing maintenance and development of Council's assets and facilities to meet thecommunity's current and future needs.
Assets Future economic benefi ts controlled by Council as a result of past transactions or other past events.
Balance sheet A quantitative summary of Council’s fi nancial position at 30 June, including assets, liabilities and net equity.
Biodiversity The variety of all life forms including animals, plants, micro-organisms and the ecosystems which theyare a part of.
Budget A plan setting out the services and initiatives to be funded for the fi nancial year and how they will contribute toachieving the strategic objectives specifi ed in the Council Plan.
Capital works The expansion, renewal, upgrade and establishment of Council's assets.
Cash fl ow statement Shows the expected net cash infl ows and outfl ows in the form of reconciliation between opening and closing balances of total cash and investments for a year.
Comprehensive IncomeStatement
A fi nancial statement highlighting the accounting surplus or defi cit of Council. It provides an indication of whetherthe Council has suffi cient revenue to meet expenses in the current year, including non-cash costs such as depreciation and amortisation expenditure. It also includes other comprehensive income items including net assetrevaluation increment (decrements) reversals and share of other comprehensive income of associates and jointventures accounted for by the equity method to arrive at a 'comprehensive result'. The comprehensive result equates to the moment in net assets or total equity from the prior year.
Council Plan This document sets out the medium term goals and objectives for the next four years as part of the overallstrategic planning framework and strategic resource plan and is prepared under section 125 of the Local Government Act 1989.
Current assets Assets where Council expects to receive the future economic benefi t within the next twelve months unlessthe asset is restricted from being exchanged or used to settle a liability for at least twelve months after thereporting date.
Current liabilities Liabilities where Council expects to fulfi l its obligation within the next twelve months unless the Council does nothave an unconditional right to defer settlement of the liability for at least twelve months after reporting date.
Depreciation and amortisation An expense which recognises the value of a fi xed asset as it is used up over time.
Equity The residual interest in the assets of Council after deduction of its liabilities, which is made up of accumulatedsurplus and reserves. Total equity is also equal to net assets.
Expense An outgoing payment made by Council.
Financial performance indicators A prescribed set of indicators and measures that assess the effectiveness of fi nancial management in a councilcovering operating position, liquidity, obligations, stability and effi ciency.
Financial statements The fi nancial statements and notes prepared in accordance with the Local Government Model Financial Report, Australian Accounting Standards and other applicable standards as they apply to the general purpose fi nancialreports and a statement of capital works and included in the annual report.
Financial year The period of 12 months ending on 30 June each year.
Governance Policies and protocols associated with both the functions of Council and of Council offi cers to ensure Council isopen, transparent, inclusive and accountable to the community.
Grants – non-recurrent income Grant income received for a ‘one off’ specifi c purpose, generally for a particular project.
Grants – recurrent income Grant income received on a regular basis (i.e. quarterly, annually) and granted to Council by another entity forspecifi c or general purposes.

References
Our P
eop
leO
ur Perfo
rmance
Co
rp. G
overnance
FinancialsIntro
ductio
nT
he Year In Review
Our C
ouncil
141
Glossary of terms
Indicator What will be measured to assess performance.
Infrastructure Physical assets of the entity or of another entity that contribute to meeting the public's need for access to major economic and social facilities and services.
Infringement Court Refers to Penalty Enforcement by Registration of Infringement Notice. A system established under Schedule 7of the Magistrates Court Act 1989 (Vic) to deal with unpaid fi nes.
Initiatives Actions that are one-off in nature and/or lead to improvements in service.
Innovation Process of working out new ways of doing things or doing something better than before.
Liabilities Future sacrifi ces of economic benefi ts that Council is presently obliged to make to other entities as a resultof past transactions or other past events.
Major initiative Signifi cant initiatives that will directly contribute to the achievement of the Council Plan during the current year and have a major focus in the budget.
Measure How an indicator will be measured and takes the form of a computation, typically including a numerator and denominator.
Minister The Minister for Local Government.
Net assets The difference between total assets and total liabilities, which represents Council’s net worth. Net assets are also equal to total equity.
Non-current assets Assets where the future economic benefi t is not expected to be received within the next twelve months orwhere the asset is restricted from being exchanged or used to settle a liability for at least twelve months afterthe reporting date.
Non-current liabilities Liabilities where the obligation is not expected to be fulfi lled within the next twelve months or where Council hasa right to defer settlement of the liability for at least twelve months after reporting date.
Performance statement A statement including the results of the prescribed service outcome indicators, fi nancial performance indicators and sustainable capacity indicators for the fi nancial year and included in the Annual Report.
Planning and accountability framework
The key statutory planning and reporting documents that are required to be prepared by councils to ensure accountability to local communities in the performance of functions and exercise of powers under the Act.
Property, infrastructure, plant and equipment assets
Often referred to as Fixed Assets. This is the largest component of Council’s asset base or worth. This represents the value of all land, buildings, roads, footpaths, drains, bridges, vehicles, plant and equipment and so on, which are recorded on Council’s asset register.
Regulations The Local Government (Planning and Reporting) Regulations 2014.
Relevance Indicators or measures that have a logical and consistent relationship to an entity’s objectives and are linked to the outcomes to be achieved.
Report of operations A report containing a description of the operations of the council during the fi nancial year and included in the Annual Report.
Revenue Revenue is the amount of money that Council actually receives from its activities, mostly from rates and services provided to customers and ratepayers.
Right-of-way Former laneway no longer required for access to surrounding properties.
Risk management A logical and systematic method of identifying, analysing, evaluating, treating, monitoring and communicating risks associated with any activity, function or process in a way that will enable organisations to achieve objectives and maximise business opportunities. Risk management is as much about identifying opportunities as avoiding or mitigating losses.
Services Assistance, support, advice and other action undertaken by a council for the benefi t of the local community.
Service outcome indicators The prescribed service performance indicators to be included in the performance statement which measure whether the stated service objective has been achieved.
Service performance indicators A prescribed set of indicators measuring the effectiveness and effi ciency of council services covering appropriateness, quality, cost and service outcomes.
Statement of changes in equity Summarises the movement in equity accounts during the year.
Strategic objectives The outcomes a council is seeking to achieve over the next four years and included in the Council Plan.
Strategic Resource Plan A plan of the fi nancial and non-fi nancial resources for at least the next four years required to achieve the strategic objectives in the Council Plan. It is also referred to as a long term fi nancial plan.
References
Our P
eop
leO
ur Perfo
rmance
Co
rp. G
overnance
FinancialsIntro
ductio
nT
he Year In Review
Our C
ouncil
141
Glossary of terms
Indicator What will be measured to assess performance.
Infrastructure Physical assets of the entity or of another entity that contribute to meeting the public's need for access to majoreconomic and social facilities and services.
Infringement Court Refers to Penalty Enforcement by Registration of Infringement Notice. A system established under Schedule 7of the Magistrates Court Act 1989 (Vic) to deal with unpaid fi nes.
Initiatives Actions that are one-off in nature and/or lead to improvements in service.
Innovation Process of working out new ways of doing things or doing something better than before.
Liabilities Future sacrifi ces of economic benefi ts that Council is presently obliged to make to other entities as a resultof past transactions or other past events.
Major initiative Signifi cant initiatives that will directly contribute to the achievement of the Council Plan during the current year and have a major focus in the budget.
Measure How an indicator will be measured and takes the form of a computation, typically including a numerator anddenominator.
Minister The Minister for Local Government.
Net assets The difference between total assets and total liabilities, which represents Council’s net worth. Net assets are also equal to total equity.
Non-current assets Assets where the future economic benefi t is not expected to be received within the next twelve months orwhere the asset is restricted from being exchanged or used to settle a liability for at least twelve months afterthe reporting date.
Non-current liabilities Liabilities where the obligation is not expected to be fulfi lled within the next twelve months or where Council hasa right to defer settlement of the liability for at least twelve months after reporting date.
Performance statement A statement including the results of the prescribed service outcome indicators, fi nancial performance indicators and sustainable capacity indicators for the fi nancial year and included in the Annual Report.
Planning and accountabilityframework
The key statutory planning and reporting documents that are required to be prepared by councils to ensure accountability to local communities in the performance of functions and exercise of powers under the Act.
Property, infrastructure, plantand equipment assets
Often referred to as Fixed Assets. This is the largest component of Council’s asset base or worth. This representsthe value of all land, buildings, roads, footpaths, drains, bridges, vehicles, plant and equipment and so on, whichare recorded on Council’s asset register.
Regulations The Local Government (Planning and Reporting) Regulations 2014.
Relevance Indicators or measures that have a logical and consistent relationship to an entity’s objectives and are linked tothe outcomes to be achieved.
Report of operations A report containing a description of the operations of the council during the fi nancial year and included in the Annual Report.
Revenue Revenue is the amount of money that Council actually receives from its activities, mostly from rates and servicesprovided to customers and ratepayers.
Right-of-way Former laneway no longer required for access to surrounding properties.
Risk management A logical and systematic method of identifying, analysing, evaluating, treating, monitoring and communicatingrisks associated with any activity, function or process in a way that will enable organisations to achieve objectivesand maximise business opportunities. Risk management is as much about identifying opportunities as avoidingor mitigating losses.
Services Assistance, support, advice and other action undertaken by a council for the benefi t of the local community.
Service outcome indicators The prescribed service performance indicators to be included in the performance statement which measurewhether the stated service objective has been achieved.
Service performance indicators A prescribed set of indicators measuring the effectiveness and effi ciency of council services coveringappropriateness, quality, cost and service outcomes.
Statement of changes in equity Summarises the movement in equity accounts during the year.
Strategic objectives The outcomes a council is seeking to achieve over the next four years and included in the Council Plan.
Strategic Resource Plan A plan of the fi nancial and non-fi nancial resources for at least the next four years required to achieve the strategicobjectives in the Council Plan. It is also referred to as a long term fi nancial plan.

Ref
eren
ces
Our
Peo
ple
Our
Per
form
ance
Co
rp. G
ove
rnan
ceFi
nanc
ials
Intr
od
ucti
on
The
Yea
r In
Rev
iew
Our
Co
unci
l
142
Glossary
Glossary of terms
Strategies High level actions directed at achieving the strategic objectives in the Council Plan.
Surplus (defi cit) Represents the difference between total revenues, expenses, net gain (loss) on disposal of property, plant and equipment, infrastructure and share of net profi ts (losses) of associates and joint ventures accounted for by the equity method.
Sustainability Meeting present day needs without compromising future generations ability to meet their needs.
Sustainable capacity indicators A prescribed set of indicators measuring whether councils have the capacity to meet the agreed service and infrastructure needs of the local community and absorb foreseeable changes and unexpected shocks into the future covering fi nancial performance, capacity and governance and management.
Ward Subdivision of the Council area into sections with an elected Councillor to represent the different sections.
Abbreviations
AAS Australian Accounting Standards
AASB Australian Accounting Standards Board
APARC Ashburton Pool and Recreation Centre
AUD Australian Dollar
BCS Business Classifi cation Scheme
CPA Certifi ed Practising Accountant
CALD Culturally and Linguistically Diverse
CEO Chief Executive Offi cer
CO2 Carbon Dioxide
CIV Capital Improved Value
EEO Equal Employment Opportunity
ELT Executive Leadership Team
FTE Full Time Equivalent
GST Goods and Services Tax
HACC Home and Community Care
IBAC Independent Broad-based Anti-corruption Commission
LTFS Long Term Financial Strategy
LAWA Local Area Workplace Agreement
LGPRF Local Government Performance Reporting Framework
LSL Liability for Long Service Leave
MCH Maternal and Child Health
MAV Municipal Association of Victoria
MWMG Metropolitan Waste Management Group Board
RSL Returned and Services League Australia
SEIFA Socio-Economic Indexes for Areas
SLT Senior Leadership Team
tCO2e Tonnes of Carbon Dioxide equivalent
TAFE Technical and Further Education
VCAT Victorian Civil and Administrative Tribunal
VLGI Victorian Local Government Indicators
VAGO Victorian Auditor-General’s Offi ce
VBI Vested Benefi t Index
Ref
eren
ces
Our
Peo
ple
Our
Per
form
ance
Co
rp. G
ove
rnan
ceFi
nanc
ials
Intr
od
ucti
on
The
Yea
r In
Rev
iew
Our
Co
unci
l
142
Glossary
Glossary of terms
Strategies High level actions directed at achieving the strategic objectives in the Council Plan.
Surplus (defi cit) Represents the difference between total revenues, expenses, net gain (loss) on disposal of property, plant andequipment, infrastructure and share of net profi ts (losses) of associates and joint ventures accounted for by the equity method.
Sustainability Meeting present day needs without compromising future generations ability to meet their needs.
Sustainable capacity indicators A prescribed set of indicators measuring whether councils have the capacity to meet the agreed service andinfrastructure needs of the local community and absorb foreseeable changes and unexpected shocks into thefuture covering fi nancial performance, capacity and governance and management.
Ward Subdivision of the Council area into sections with an elected Councillor to represent the different sections.
Abbreviations
AAS Australian Accounting Standards
AASB Australian Accounting Standards Board
APARC Ashburton Pool and Recreation Centre
AUD Australian Dollar
BCS Business Classifi cation Scheme
CPA Certifi ed Practising Accountant
CALD Culturally and Linguistically Diverse
CEO Chief Executive Offi cer
CO2 Carbon Dioxide
CIV Capital Improved Value
EEO Equal Employment Opportunity
ELT Executive Leadership Team
FTE Full Time Equivalent
GST Goods and Services Tax
HACC Home and Community Care
IBAC Independent Broad-based Anti-corruptionCommission
LTFS Long Term Financial Strategy
LAWA Local Area Workplace Agreement
LGPRF Local Government Performance ReportingFramework
LSL Liability for Long Service Leave
MCH Maternal and Child Health
MAV Municipal Association of Victoria
MWMG Metropolitan Waste Management Group Board
RSL Returned and Services League Australia
SEIFA Socio-Economic Indexes for Areas
SLT Senior Leadership Team
tCO2e Tonnes of Carbon Dioxide equivalent
TAFE Technical and Further Education
VCAT Victorian Civil and Administrative Tribunal
VLGI Victorian Local Government Indicators
VAGO Victorian Auditor-General’s Offi ce
VBI Vested Benefi t Index
References
Our P
eop
leO
ur Perfo
rmance
Co
rp. G
overnance
FinancialsIntro
ductio
nT
he Year In Review
Our C
ouncil
143
Index
abbreviations used
Arts and culture
Asset management
Audit committee
Auditor-General’s Reports
Best Value
budget
capital works
CEO and Mayor message
committees of Council
Council Offi ces
Council Plan
Councillors
assignments to individuals
attendance at meetings
delegations
directorates of Council
Economic factors
Equal employment opportunity
Financial performance indicators
Financial Report
Overview
Accounting standards
Balance Sheet
Cash Flow Statement
Comprehensive Income Statement
Descriptions of statements
Notes to the statements
Performance Statement
Statement of Capital Works
Statement of Changes in Equity
glossary
governance
Governance and management checklist
highlights of the year
history
Information Privacy
Innovation
Kew Court House
Long Term Financial Strategy
local laws
major achievements
major initiatives
major projects
maps of Boroondara
Mayor and CEO message
mission
National Competition Policy
organisation structure
Planning framework
performance
Performance Statementfor the year
population of Boroondara
profi le
risk management
senior managers
services
Service performance indicators
social profi le information
Sustainable capacity indicators
staff
Strategic objective
Strategic Resource Plan
Theme
values
Victorian Local Government Indicators
vision
wards of the municipality
waste management
References
Our P
eop
leO
ur Perfo
rmance
Co
rp. G
overnance
FinancialsIntro
ductio
nT
he Year In Review
Our C
ouncil
143
Index
abbreviations used
Arts and culture
Asset management
Audit committee
Auditor-General’s Reports
Best Value
budget
capital works
CEO and Mayor message
committees of Council
Council Offi ces
Council Plan
Councillors
assignments to individuals
attendance at meetings
delegations
directorates of Council
Economic factors
Equal employment opportunity
Financial performance indicators
Financial Report
Overview
Accounting standards
Balance Sheet
Cash Flow Statement
Comprehensive IncomeStatement
Descriptions of statements
Notes to the statements
Performance Statement
Statement of Capital Works
Statement of Changes in Equity
glossary
governance
Governance and management checklist
highlights of the year
history
Information Privacy
Innovation
Kew Court House
Long Term Financial Strategy
local laws
major achievements
major initiatives
major projects
maps of Boroondara
Mayor and CEO message
mission
National Competition Policy
organisation structure
Planning framework
performance
Performance Statementfor the year
population of Boroondara
profi le
risk management
senior managers
services
Service performance indicators
social profi le information
Sustainable capacity indicators
staff
Strategic objective
Strategic Resource Plan
Theme
values
Victorian Local Government Indicators
vision
wards of the municipality
waste management

Contact usTelephone: 9278 4444After hours emergencies: 9278 4444Email: [email protected]: www.boroondara.vic.gov.au
Postal address:Private Bag 1Camberwell VIC 3124
Customer Service Centres:Camberwell offi ce8 Inglesby Road, Camberwell
Hawthorn Town Hall360 Burwood Road, Hawthorn
Kew LibraryCorner Cotham Road and Civic Drive Kew
www.boroondara.vic.gov.au /boroondaracouncil
/boroondara
/boroondara
Translation DetailsFor speech or hearing impairedNational Relay Service TTY 13 36 77Speak and Listen 1300 555 727
Free interpreting service 9278 4002
Translation needed?If you would like a section of this document translated please call Customer Service on 9278 4444 or make your request through Council’s free interpreting service on 9278 4002.
Mandarin
Cantonese
Greek
Italian
Vietnamese