steel concrete reinforcing bar from belarus, china ... · steel concrete reinforcing bar from...
TRANSCRIPT

Steel Concrete Reinforcing Bar FromBelarus, China, Indonesia, Korea, Latvia,
Moldova, Poland, and Ukraine
Investigation Nos. 731-TA-873-875,877-880, and 882 (Review)
Publication 3933 July 2007
Washington, DC 20436

U.S. International Trade Commission
COMMISSIONERS
Daniel R. Pearson, ChairmanShara L. Aranoff, Vice Chairman
Deanna Tanner OkunCharlotte R. Lane
Irving A. WilliamsonDean A. Pinkert
Robert A. RogowskyDirector of Operations
Staff assigned
Olympia Hand, InvestigatorKarl Tsuji, Industry AnalystClark Workman, EconomistDavid Boyland, Accountant
Gracemary Roth-Roffy, AttorneyPatrick Gallagher, Attorney
Steven Hudgens, StatisticianGabriel Ellenberger, Research Assistant
Douglas E. Corkran, Supervisory Investigator
Address all communications toSecretary to the Commission
United States International Trade CommissionWashington, DC 20436

U.S. International Trade CommissionWashington, DC 20436
www.usitc.gov
Steel Concrete Reinforcing Bar FromBelarus, China, Indonesia, Korea, Latvia,
Moldova, Poland, and Ukraine
Investigation Nos. 731-TA-873-875, 877-880, and 882 (Review)
Publication 3933 July 2007


i
CONTENTS
Page
Determination . . . . . . . . . . . . . . . . . . . . . . . . . . . . . . . . . . . . . . . . . . . . . . . . . . . . . . . . . . . . . . . . . . . 1Views of the Commission . . . . . . . . . . . . . . . . . . . . . . . . . . . . . . . . . . . . . . . . . . . . . . . . . . . . . . . . . 3Separate and concurring views of Vice Chairman Shara L. Aranoff regarding Belarus, China,
Indonesia, Moldova, and Ukraine . . . . . . . . . . . . . . . . . . . . . . . . . . . . . . . . . . . . . . . . . . . . . . . . . 43Separate and dissenting views of Chairman Daniel R. Pearson and Commissioner Deanna Tanner
Okun regarding cumulation . . . . . . . . . . . . . . . . . . . . . . . . . . . . . . . . . . . . . . . . . . . . . . . . . . . . . 51Separate and dissenting views of Chairman Daniel R. Pearson, Vice Chairman Shara L. Aranoff,
and Commissioner Deanna Tanner Okun regarding Latvia and Poland . . . . . . . . . . . . . . . . . . . . 65Separate and dissenting views of Chairman Daniel R. Pearson and Commissioner Deanna Tanner
Okun regarding Belarus, China, Indonesia, and Moldova . . . . . . . . . . . . . . . . . . . . . . . . . . . . . . 73Separate views of Commissioner Deanna Tanner Okun regarding Ukraine . . . . . . . . . . . . . . . . . . . 85Separate and dissenting views of Chairman Daniel R. Pearson regarding Ukraine . . . . . . . . . . . . . . 91
Part I: Introduction and overview
Background . . . . . . . . . . . . . . . . . . . . . . . . . . . . . . . . . . . . . . . . . . . . . . . . . . . . . . . . . . . . . . . . . . I-1The original investigations . . . . . . . . . . . . . . . . . . . . . . . . . . . . . . . . . . . . . . . . . . . . . . . . . . . I-2Summary data . . . . . . . . . . . . . . . . . . . . . . . . . . . . . . . . . . . . . . . . . . . . . . . . . . . . . . . . . . . . . I-2
Previous and related Title VII investigations . . . . . . . . . . . . . . . . . . . . . . . . . . . . . . . . . . . . . . . . I-11Previous and related safeguard investigations . . . . . . . . . . . . . . . . . . . . . . . . . . . . . . . . . . . . . . . I-11Statutory criteria and organization of the report . . . . . . . . . . . . . . . . . . . . . . . . . . . . . . . . . . . . . . I-13
Statutory criteria . . . . . . . . . . . . . . . . . . . . . . . . . . . . . . . . . . . . . . . . . . . . . . . . . . . . . . . . . . . I-13Organization of the report . . . . . . . . . . . . . . . . . . . . . . . . . . . . . . . . . . . . . . . . . . . . . . . . . . . . I-14
Commerce’s reviews . . . . . . . . . . . . . . . . . . . . . . . . . . . . . . . . . . . . . . . . . . . . . . . . . . . . . . . . . . . I-15Administrative reviews . . . . . . . . . . . . . . . . . . . . . . . . . . . . . . . . . . . . . . . . . . . . . . . . . . . . . . I-15Results of expedited and full five-year reviews . . . . . . . . . . . . . . . . . . . . . . . . . . . . . . . . . . . I-16
Distribution of Continued Dumping and Subsidy Offset Act funds . . . . . . . . . . . . . . . . . . . . . . . I-16The subject merchandise . . . . . . . . . . . . . . . . . . . . . . . . . . . . . . . . . . . . . . . . . . . . . . . . . . . . . . . . I-19
Commerce’s scope . . . . . . . . . . . . . . . . . . . . . . . . . . . . . . . . . . . . . . . . . . . . . . . . . . . . . . . . . . I-19U.S. tariff treatment . . . . . . . . . . . . . . . . . . . . . . . . . . . . . . . . . . . . . . . . . . . . . . . . . . . . . . . . . I-19
The domestic like product . . . . . . . . . . . . . . . . . . . . . . . . . . . . . . . . . . . . . . . . . . . . . . . . . . . . . . . I-19Description and applications . . . . . . . . . . . . . . . . . . . . . . . . . . . . . . . . . . . . . . . . . . . . . . . . . . I-19Manufacturing process . . . . . . . . . . . . . . . . . . . . . . . . . . . . . . . . . . . . . . . . . . . . . . . . . . . . . . I-22Marketing . . . . . . . . . . . . . . . . . . . . . . . . . . . . . . . . . . . . . . . . . . . . . . . . . . . . . . . . . . . . . . . . I-23
Domestic like product issues . . . . . . . . . . . . . . . . . . . . . . . . . . . . . . . . . . . . . . . . . . . . . . . . . . . . I-25U.S. market participants . . . . . . . . . . . . . . . . . . . . . . . . . . . . . . . . . . . . . . . . . . . . . . . . . . . . . . . . I-26
U.S. producers . . . . . . . . . . . . . . . . . . . . . . . . . . . . . . . . . . . . . . . . . . . . . . . . . . . . . . . . . . . . . I-26U.S. importers . . . . . . . . . . . . . . . . . . . . . . . . . . . . . . . . . . . . . . . . . . . . . . . . . . . . . . . . . . . . . I-28U.S. purchasers . . . . . . . . . . . . . . . . . . . . . . . . . . . . . . . . . . . . . . . . . . . . . . . . . . . . . . . . . . . . I-28
Apparent U.S. consumption and market shares . . . . . . . . . . . . . . . . . . . . . . . . . . . . . . . . . . . . . . I-30Regional industry considerations . . . . . . . . . . . . . . . . . . . . . . . . . . . . . . . . . . . . . . . . . . . . . . . . . I-30

ii
CONTENTS
Page
Part II: Conditions of competition in the U.S. market
Market characteristics . . . . . . . . . . . . . . . . . . . . . . . . . . . . . . . . . . . . . . . . . . . . . . . . . . . . . . . . . . II-1Supply and demand considerations . . . . . . . . . . . . . . . . . . . . . . . . . . . . . . . . . . . . . . . . . . . . . . . . II-4
U.S. supply . . . . . . . . . . . . . . . . . . . . . . . . . . . . . . . . . . . . . . . . . . . . . . . . . . . . . . . . . . . . . . . II-4U.S. demand . . . . . . . . . . . . . . . . . . . . . . . . . . . . . . . . . . . . . . . . . . . . . . . . . . . . . . . . . . . . . . II-7
Substitutability issues . . . . . . . . . . . . . . . . . . . . . . . . . . . . . . . . . . . . . . . . . . . . . . . . . . . . . . . . . . II-10Factors affecting purchasing decisions . . . . . . . . . . . . . . . . . . . . . . . . . . . . . . . . . . . . . . . . . . II-11Comparisons of domestic products, subject imports, and nonsubject imports . . . . . . . . . . . . II-13
Elasticity estimates . . . . . . . . . . . . . . . . . . . . . . . . . . . . . . . . . . . . . . . . . . . . . . . . . . . . . . . . . . . . II-18U.S. supply elasticity . . . . . . . . . . . . . . . . . . . . . . . . . . . . . . . . . . . . . . . . . . . . . . . . . . . . . . . . II-19U.S. demand elasticity . . . . . . . . . . . . . . . . . . . . . . . . . . . . . . . . . . . . . . . . . . . . . . . . . . . . . . . II-20Substitution elasticity . . . . . . . . . . . . . . . . . . . . . . . . . . . . . . . . . . . . . . . . . . . . . . . . . . . . . . . II-20Economic modeling by domestic interested parties . . . . . . . . . . . . . . . . . . . . . . . . . . . . . . . . II-21
Part III: Condition of the U.S. industry
Background . . . . . . . . . . . . . . . . . . . . . . . . . . . . . . . . . . . . . . . . . . . . . . . . . . . . . . . . . . . . . . . . . . III-1U.S. producers’ capacity, production, and capacity utilization . . . . . . . . . . . . . . . . . . . . . . . . . . III-4
Changes during the period in existing operations . . . . . . . . . . . . . . . . . . . . . . . . . . . . . . . . . . III-4Anticipated changes in existing operations . . . . . . . . . . . . . . . . . . . . . . . . . . . . . . . . . . . . . . . III-5Constraints on capacity . . . . . . . . . . . . . . . . . . . . . . . . . . . . . . . . . . . . . . . . . . . . . . . . . . . . . . III-6Alternative products . . . . . . . . . . . . . . . . . . . . . . . . . . . . . . . . . . . . . . . . . . . . . . . . . . . . . . . . III-6
U.S. producers’ domestic shipments, company transfers, and export shipments . . . . . . . . . . . . . III-8Shipments by U.S. mills throughout the United States . . . . . . . . . . . . . . . . . . . . . . . . . . . . . . III-8Shipments by U.S. mills within the specified region . . . . . . . . . . . . . . . . . . . . . . . . . . . . . . . . III-10Shipments by U.S. mills outside the specified region . . . . . . . . . . . . . . . . . . . . . . . . . . . . . . . III-12
U.S. producers’ inventories . . . . . . . . . . . . . . . . . . . . . . . . . . . . . . . . . . . . . . . . . . . . . . . . . . . . . III-14U.S. producers’ imports and purchases . . . . . . . . . . . . . . . . . . . . . . . . . . . . . . . . . . . . . . . . . . . . . III-15U.S. producers’ employment, wages, and productivity . . . . . . . . . . . . . . . . . . . . . . . . . . . . . . . . III-16Financial experience of U.S. producers . . . . . . . . . . . . . . . . . . . . . . . . . . . . . . . . . . . . . . . . . . . . III-18
Background . . . . . . . . . . . . . . . . . . . . . . . . . . . . . . . . . . . . . . . . . . . . . . . . . . . . . . . . . . . . . . . III-18Rebar operations by U.S. mills throughout the United States . . . . . . . . . . . . . . . . . . . . . . . . . III-18Capital expenditures, assets, and return on investment of the U.S. industry . . . . . . . . . . . . . . III-23Rebar operations by U.S. mills within the specified region . . . . . . . . . . . . . . . . . . . . . . . . . . III-25Capital expenditures, assets, and return on investment of U.S. producers of rebar within
the specified region . . . . . . . . . . . . . . . . . . . . . . . . . . . . . . . . . . . . . . . . . . . . . . . . . . . . . . III-29Rebar operations by U.S. mills outside the specified region . . . . . . . . . . . . . . . . . . . . . . . . . . III-33Capital expenditures, assets, and return on investment of U.S. producers of rebar outside
the specified region . . . . . . . . . . . . . . . . . . . . . . . . . . . . . . . . . . . . . . . . . . . . . . . . . . . . . . III-37

iii
CONTENTS
Page
Part IV: U.S. imports and the foreign industries
U.S. imports . . . . . . . . . . . . . . . . . . . . . . . . . . . . . . . . . . . . . . . . . . . . . . . . . . . . . . . . . . . . . . . . . IV-1Imports from Latvia . . . . . . . . . . . . . . . . . . . . . . . . . . . . . . . . . . . . . . . . . . . . . . . . . . . . . . . . . IV-5Leading nonsubject sources of imports . . . . . . . . . . . . . . . . . . . . . . . . . . . . . . . . . . . . . . . . . . IV-5
Recent trends in rebar imports . . . . . . . . . . . . . . . . . . . . . . . . . . . . . . . . . . . . . . . . . . . . . . . . . . . IV-9Cumulation considerations . . . . . . . . . . . . . . . . . . . . . . . . . . . . . . . . . . . . . . . . . . . . . . . . . . . . . . IV-9
Geographic markets . . . . . . . . . . . . . . . . . . . . . . . . . . . . . . . . . . . . . . . . . . . . . . . . . . . . . . . . . IV-11Presence in the market . . . . . . . . . . . . . . . . . . . . . . . . . . . . . . . . . . . . . . . . . . . . . . . . . . . . . . . IV-14
U.S. importers’ inventories . . . . . . . . . . . . . . . . . . . . . . . . . . . . . . . . . . . . . . . . . . . . . . . . . . . . . . IV-14The industry in Belarus . . . . . . . . . . . . . . . . . . . . . . . . . . . . . . . . . . . . . . . . . . . . . . . . . . . . . . . . . IV-15
Overview . . . . . . . . . . . . . . . . . . . . . . . . . . . . . . . . . . . . . . . . . . . . . . . . . . . . . . . . . . . . . . . . . IV-15Rebar operations . . . . . . . . . . . . . . . . . . . . . . . . . . . . . . . . . . . . . . . . . . . . . . . . . . . . . . . . . . . IV-15Alternative products . . . . . . . . . . . . . . . . . . . . . . . . . . . . . . . . . . . . . . . . . . . . . . . . . . . . . . . . IV-16
The industry in China . . . . . . . . . . . . . . . . . . . . . . . . . . . . . . . . . . . . . . . . . . . . . . . . . . . . . . . . . . IV-16Overview . . . . . . . . . . . . . . . . . . . . . . . . . . . . . . . . . . . . . . . . . . . . . . . . . . . . . . . . . . . . . . . . . IV-16Rebar operations . . . . . . . . . . . . . . . . . . . . . . . . . . . . . . . . . . . . . . . . . . . . . . . . . . . . . . . . . . . IV-16
The industry in Indonesia . . . . . . . . . . . . . . . . . . . . . . . . . . . . . . . . . . . . . . . . . . . . . . . . . . . . . . . IV-21Overview . . . . . . . . . . . . . . . . . . . . . . . . . . . . . . . . . . . . . . . . . . . . . . . . . . . . . . . . . . . . . . . . . IV-21Rebar operations . . . . . . . . . . . . . . . . . . . . . . . . . . . . . . . . . . . . . . . . . . . . . . . . . . . . . . . . . . . IV-21
The industry in Korea . . . . . . . . . . . . . . . . . . . . . . . . . . . . . . . . . . . . . . . . . . . . . . . . . . . . . . . . . . IV-22Overview . . . . . . . . . . . . . . . . . . . . . . . . . . . . . . . . . . . . . . . . . . . . . . . . . . . . . . . . . . . . . . . . . IV-22Rebar operations . . . . . . . . . . . . . . . . . . . . . . . . . . . . . . . . . . . . . . . . . . . . . . . . . . . . . . . . . . . IV-23Alternative products . . . . . . . . . . . . . . . . . . . . . . . . . . . . . . . . . . . . . . . . . . . . . . . . . . . . . . . . IV-24
The industry in Latvia . . . . . . . . . . . . . . . . . . . . . . . . . . . . . . . . . . . . . . . . . . . . . . . . . . . . . . . . . . IV-28Overview . . . . . . . . . . . . . . . . . . . . . . . . . . . . . . . . . . . . . . . . . . . . . . . . . . . . . . . . . . . . . . . . . IV-28Rebar operations . . . . . . . . . . . . . . . . . . . . . . . . . . . . . . . . . . . . . . . . . . . . . . . . . . . . . . . . . . . IV-28Alternative products . . . . . . . . . . . . . . . . . . . . . . . . . . . . . . . . . . . . . . . . . . . . . . . . . . . . . . . . IV-33
The industry in Moldova . . . . . . . . . . . . . . . . . . . . . . . . . . . . . . . . . . . . . . . . . . . . . . . . . . . . . . . IV-33Overview . . . . . . . . . . . . . . . . . . . . . . . . . . . . . . . . . . . . . . . . . . . . . . . . . . . . . . . . . . . . . . . . . IV-33Rebar operations . . . . . . . . . . . . . . . . . . . . . . . . . . . . . . . . . . . . . . . . . . . . . . . . . . . . . . . . . . . IV-33Alternative products . . . . . . . . . . . . . . . . . . . . . . . . . . . . . . . . . . . . . . . . . . . . . . . . . . . . . . . . IV-34
The industry in Poland . . . . . . . . . . . . . . . . . . . . . . . . . . . . . . . . . . . . . . . . . . . . . . . . . . . . . . . . . IV-35Overview . . . . . . . . . . . . . . . . . . . . . . . . . . . . . . . . . . . . . . . . . . . . . . . . . . . . . . . . . . . . . . . . . IV-35Rebar operations . . . . . . . . . . . . . . . . . . . . . . . . . . . . . . . . . . . . . . . . . . . . . . . . . . . . . . . . . . . IV-35Alternative products . . . . . . . . . . . . . . . . . . . . . . . . . . . . . . . . . . . . . . . . . . . . . . . . . . . . . . . . IV-41
The industry in Ukraine . . . . . . . . . . . . . . . . . . . . . . . . . . . . . . . . . . . . . . . . . . . . . . . . . . . . . . . . IV-41Overview . . . . . . . . . . . . . . . . . . . . . . . . . . . . . . . . . . . . . . . . . . . . . . . . . . . . . . . . . . . . . . . . . IV-41Rebar operations . . . . . . . . . . . . . . . . . . . . . . . . . . . . . . . . . . . . . . . . . . . . . . . . . . . . . . . . . . . IV-41Alternative products . . . . . . . . . . . . . . . . . . . . . . . . . . . . . . . . . . . . . . . . . . . . . . . . . . . . . . . . IV-47
Subject countries’ capacity and projections . . . . . . . . . . . . . . . . . . . . . . . . . . . . . . . . . . . . . . . . . IV-47

iv
CONTENTS
Page
Part IV: U.S. imports and the foreign industries–Continued
Global market . . . . . . . . . . . . . . . . . . . . . . . . . . . . . . . . . . . . . . . . . . . . . . . . . . . . . . . . . . . . . . . . IV-47Production . . . . . . . . . . . . . . . . . . . . . . . . . . . . . . . . . . . . . . . . . . . . . . . . . . . . . . . . . . . . . . . . IV-47Consumption . . . . . . . . . . . . . . . . . . . . . . . . . . . . . . . . . . . . . . . . . . . . . . . . . . . . . . . . . . . . . . IV-49Prices . . . . . . . . . . . . . . . . . . . . . . . . . . . . . . . . . . . . . . . . . . . . . . . . . . . . . . . . . . . . . . . . . . . . IV-49Additional global supply and demand factors . . . . . . . . . . . . . . . . . . . . . . . . . . . . . . . . . . . . . IV-51Consolidation among global producers . . . . . . . . . . . . . . . . . . . . . . . . . . . . . . . . . . . . . . . . . . IV-53
Part V: Pricing and related information
Factors affecting prices . . . . . . . . . . . . . . . . . . . . . . . . . . . . . . . . . . . . . . . . . . . . . . . . . . . . . . . . . V-1Raw material costs . . . . . . . . . . . . . . . . . . . . . . . . . . . . . . . . . . . . . . . . . . . . . . . . . . . . . . . . . . V-1Transportation costs to the U. S. market . . . . . . . . . . . . . . . . . . . . . . . . . . . . . . . . . . . . . . . . . V-1Transportation costs in the U.S. market . . . . . . . . . . . . . . . . . . . . . . . . . . . . . . . . . . . . . . . . . . V-2Exchange rates . . . . . . . . . . . . . . . . . . . . . . . . . . . . . . . . . . . . . . . . . . . . . . . . . . . . . . . . . . . . . V-2
Pricing practices . . . . . . . . . . . . . . . . . . . . . . . . . . . . . . . . . . . . . . . . . . . . . . . . . . . . . . . . . . . . . . V-3Price data . . . . . . . . . . . . . . . . . . . . . . . . . . . . . . . . . . . . . . . . . . . . . . . . . . . . . . . . . . . . . . . . . . . V-8
Price trends . . . . . . . . . . . . . . . . . . . . . . . . . . . . . . . . . . . . . . . . . . . . . . . . . . . . . . . . . . . . . . . V-8Price comparisons . . . . . . . . . . . . . . . . . . . . . . . . . . . . . . . . . . . . . . . . . . . . . . . . . . . . . . . . . . V-13
Appendixes
A. Federal Register notices and the Commission’s statement on adequacy . . . . . . . . . . . . . . . . . . A-1B. Hearing witnesses . . . . . . . . . . . . . . . . . . . . . . . . . . . . . . . . . . . . . . . . . . . . . . . . . . . . . . . . . . . . B-1C. Summary data . . . . . . . . . . . . . . . . . . . . . . . . . . . . . . . . . . . . . . . . . . . . . . . . . . . . . . . . . . . . . . . C-1D. Responses of U.S. producers, U.S. importers, U.S. purchasers, and foreign producers
concerning the significance of the antidumping duty orders and the likely effects of revocation . . . . . . . . . . . . . . . . . . . . . . . . . . . . . . . . . . . . . . . . . . . . . . . . . . . . . . . . . . . . . . . . . . D-1
E. Company-specific trade data . . . . . . . . . . . . . . . . . . . . . . . . . . . . . . . . . . . . . . . . . . . . . . . . . . . E-1F. Ranking by operating income margins of U.S. producers of rebar within and outside of the
specified region . . . . . . . . . . . . . . . . . . . . . . . . . . . . . . . . . . . . . . . . . . . . . . . . . . . . . . . . . . . . . F-1G. Data concerning imports reported by U.S. importers . . . . . . . . . . . . . . . . . . . . . . . . . . . . . . . . . G-1
Note.–Information that would reveal confidential operations of individual concerns may not be publishedand therefore has been deleted from this report. Such deletions are indicated by asterisks.

1 Chairman Daniel R. Pearson dissenting with respect to the antidumping duty orders on Belarus, Latvia,Moldova, Poland, and Ukraine. See Separate and Dissenting Views of Chairman Daniel R. Pearson andCommissioner Deanna Tanner Okun Regarding Cumulation; Separate and Dissenting Views of Chairman Daniel R.Pearson, Vice Chairman Shara L. Aranoff, and Commissioner Deanna Tanner Okun Regarding Latvia and Poland;Separate and Dissenting Views of Chairman Daniel R. Pearson and Commissioner Deanna Tanner Okun RegardingBelarus, China, Indonesia, and Moldova; Separate and Dissenting Views of Chairman Daniel R. Pearson RegardingUkraine. Chairman Pearson joins the Commission’s views in Sections I (Background), II (Domestic Like Productand Industry), IV. A, B, C, E (Legal Standards, Findings in Original Investigations, Conditions of Competition andthe Business Cycle, and Material Injury With Respect to Korea). 2 Vice Chairman Shara L. Aranoff dissenting with respect to the antidumping duty orders on Poland and Latvia. See Separate and Dissenting Views of Chairman Daniel R. Pearson, Vice Chairman Shara L. Aranoff, andCommissioner Deanna Tanner Okun Regarding Latvia and Poland. For Vice Chairman Aranoff’s views regardingcumulation for Latvia and Poland see Separate and Dissenting Views of Chairman Daniel R. Pearson andCommissioner Deanna Tanner Okun Regarding Cumulation. See also Separate and Concurring Views of ViceChairman Shara L. Aranoff Regarding Belarus, China, Indonesia, Moldova, and Ukraine. Vice Chairman Aranoff joins Sections I, II, III. A, B, C, D. 1, IV. A, B, C & E. 3 Commissioner Deanna Tanner Okun dissenting with respect to the orders on Belarus, Latvia, Moldova, andPoland. See Separate and Dissenting Views of Chairman Daniel R. Pearson and Commissioner Deanna TannerOkun Regarding Cumulation; Separate and Dissenting Views of Chairman Daniel R. Pearson, Vice Chairman SharaL. Aranoff, and Commissioner Deanna Tanner Okun Regarding Latvia and Poland; Separate and Dissenting Viewsof Chairman Daniel R. Pearson and Commissioner Deanna Tanner Okun Regarding Belarus, China, Indonesia, andMoldova; Separate Views of Commissioner Deanna Tanner Okun Regarding Ukraine. Commissioner Okun joinsthe Commission’s views in Sections I (Background), II (Domestic Like Product and Industry), IV. A, B, C, E (LegalStandards, Findings in Original Investigations, Conditions of Competition and the Business Cycle, and MaterialInjury With Respect to Korea). 4 Commissioners Charlotte R. Lane and Dean A. Pinkert dissenting with respect to the antidumping duty order onsubject imports from Korea. They do not join section III. D. 1 or IV. E. 5 Chairman Koplan and Vice Chairman Okun determined that a regional industry producing rebar was materiallyinjured by reason of subject imports from Belarus, Indonesia, Korea, Latvia, Moldova, Poland, and Ukraine andthreatened with material injury with respect to subject imports from China. Commissioners Miller, Hillman, andDevaney determined that a national industry was materially injured by reason of subject imports from Belarus,Indonesia, Korea, Latvia, Moldova, Poland, and Ukraine and threatened with material injury by reason of subjectimports from China. Commissioner Bragg determined that a regional industry was materially injured by reason of
(continued...)
3
VIEWS OF THE COMMISSION
Based on the record in these five-year reviews, we determine under section 751(c) of the TariffAct of 1930, as amended (“the Act”), that revocation of the antidumping duty orders on steel concretereinforcing bars (“rebar”) from Belarus, China, Indonesia, Moldova, Latvia, Poland, and Ukraine wouldbe likely to lead to continuation or recurrence of material injury to an industry in the United States withina reasonably foreseeable time.1 2 3 We also determine that revocation of the antidumping duty order onrebar from Korea would not be likely to lead to the continuation or recurrence of material injury to anindustry in the United States within a reasonably foreseeable time.4
I. BACKGROUND
In 2001, in a series of staggered investigations, the Commission determined that an industry inthe United States was materially injured by reason of imports of rebar from Belarus, Indonesia, Korea,Latvia, Moldova, Poland, and Ukraine and that an industry in the United States was threatened withmaterial injury by reason of imports of rebar from China.5 6 Following the Commission’s determinations,

5 (...continued)subject imports from all seven countries. See Certain Steel Concrete Reinforcing Bars from Indonesia, Poland, andUkraine, Inv. Nos. 731-TA-875, 880, and 882 (Final), USITC Pub. 3425 (May 2001); (“USITC Pub. 3425"); CertainSteel Concrete Reinforcing Bars from Belarus, China, Korea, Latvia, and Moldova, Inv. Nos. 731-TA-873-874 and877-879 (Final), USITC Pub. No. 3440 (July 2001). 6 In its preliminary determinations, the Commission conducted a regional industry analysis as proposed by thepetitioners. In so doing, the Commission found that subject imports from Japan were not sufficiently concentrated inthe region and, therefore, rendered a negative determination as to those imports. The Commission also found thatimports from Austria, Russia, and Venezuela were negligible. See Certain Steel Concrete Reinforcing Bars fromAustria, Belarus, China, Indonesia, Poland, Ukraine and Venezuela, Inv. Nos. 731-TA-872-883 (Preliminary),USITC Pub. 3343 (Aug. 2000). Petitioners appealed the Commission’s negative determination with respect to Japanto the Court of International Trade, but the appeal was dismissed as untimely. Their second attempt to appeal thenegative determination was dismissed for lack of jurisdiction. Rebar Trade Coalition v. United States, 25 C.I.T. 393,394 (2000) (discussing both dismissals). 7 Domestic producers failed to provide individual production or association data in their joint response as requiredby the notice of institution and Commission Rule 207.62(a) and did not respond to a subsequent request by theCommission to remedy this deficiency. The Commission, therefore, determined that the domestic interested partyindividual responses and group response were inadequate. Commission Statement on Adequacy at ConfidentialStaff Report (“CR”) at App. A, Public Staff Report (“PR”) at App. A. 8 Commission Statement of Adequacy at CR at App. A, PR at App. A. 9 CR at IV-20, PR at IV-15 (Belarus), CR at IV-42, PR at IV-28 (Latvia), CR at IV-51, PR at IV-33 (Moldova). 10 CR at IV-68, PR at IV-41. 11 CR at IV-33, PR at IV-22. 12 CR at IV-58 (based on 2005 production), PR at IV-36. 13 CR at IV-25, PR at 16 (China), CR at IV-31, IV-21 (Indonesia).
4
the Department of Commerce (“Commerce”) issued antidumping duty orders on imports from Belarus,China, Indonesia, Korea, Latvia, Moldova, Poland, and Ukraine.
The Commission instituted these reviews of the outstanding orders on August 1, 2006. TheCommission received a joint response from the Rebar Trade Action Coalition (“RTAC”), a tradeassociation comprised of domestic producers Nucor Corp. (“Nucor”), Commercial Metals Company(“CMC”), and Gerdau Ameristeel Corp. (“Gerdau”), as well as two other domestic producers, CascadeSteel Inc. (“Cascade”) and TAMCO Steel (“TAMCO”) (collectively “domestic interested parties”). TheCommission also received responses from Republican Unitary Enterprise Byelorussian Steel Works(“BMZ”), the sole producer of rebar in Belarus; Joint Stock Co. Liepajas Metalurgs (“LM”), the soleproducer of rebar in Latvia; JSCC Moldova Steel Works (“MSW”), the sole producer of rebar inMoldova; and Mittal Steel Kryviy Rih (“Mittal”), a producer and exporter of rebar in Ukraine.
Although the Commission found that the domestic interested parties group response to the noticeof institution was inadequate in these reviews7 and that the respondent interested parties group responsesfrom China, Indonesia, Korea, and Poland were inadequate, it nevertheless found on September 5, 2006,that other circumstances warranted conducting full reviews.8
In these reviews, the data collected by the Commission are believed to represent all or virtuallyall rebar production operations in the United States. Foreign industry coverage, based on 2006production, is estimated to be complete for Belarus, Latvia, and Moldova;9 up to *** percent forUkraine;10 *** percent for Korea;11 and *** percent for Poland.12 No subject producers in China orIndonesia responded to the questionnaires.13
The RTAC, Cascade, and TAMCO submitted a joint brief and presented testimony at thehearing. BMZ, LM, Hyundai Steel Company (“Hyundai”) (a Korean producer of rebar), MSW, andMittal submitted briefs; LM, Hyundai, and Mittal also presented testimony at the hearing.

14 19 U.S.C. § 1677(4)(A). 15 19 U.S.C. § 1677(10). See Nippon Steel Corp. v. United States, 19 CIT 450, 455 (1995); Timken Co. v. UnitedStates, 913 F. Supp. 580, 584 (Ct. Int’l Trade 1996); Torrington Co. v. United States, 747 F. Supp. 744, 748-49 (Ct.Int’l Trade 1990), aff’d, 938 F.2d 1278 (Fed. Cir. 1991). See also S. Rep. No. 249, 96th Cong., 1st Sess. 90-91(1979). 16 See Stainless Steel Sheet and Strip from France, Germany, Italy, Japan, Korea, Mexico, Taiwan and the UnitedKingdom, Inv. Nos. 701-TA-381-382 (Review) and 731-TA-797-804 (Review), USITC Pub. 3788 at 6 (July 2005);Crawfish Tail Meat from China, Inv. No. 731-TA-752 (Review), USITC Pub. 3614 at 4 (July 2003); Steel ConcreteReinforcing Bar from Turkey, Inv. No. 731-TA-745 (Review), USITC Pub. 3577 at 4 (Feb. 2003). 17 CR at I-21, PR at I-19. 18 CR at I-22, PR at I-19. 19 CR at I-21 and I-23 n.33, PR at I-20 n.33. 20 See 71 Fed. Reg. 70509, 70510 (Dec. 5, 2006). 21 USITC Pub. 3425 at 5. 22 Domestic Interested Parties’ Response to the Notice of Institution at 35; LM’s Response to the Notice ofInstitution at 8; and Mittal’s Response to the Notice of Institution at 11.
5
II. DOMESTIC LIKE PRODUCT AND INDUSTRY
A. Domestic Like Product
In making its determination under section 751(c), the Commission defines the “domestic likeproduct” and the “industry.”14 The Act defines the “domestic like product” as “a product which is like, orin the absence of like, most similar in characteristics and uses with, the article subject to an investigationunder this subtitle.”15 The Commission’s practice in five-year reviews is to look to the like productdefinition from the original determination and any previous reviews and consider whether the recordindicates any reason to revisit that definition.16
The subject merchandise as defined by Commerce consists of:
all steel concrete reinforcing bars (rebar) sold in straight lengths. Specifically excludedare plain rounds (i.e., non-deformed or smooth bars) and rebar that has been furtherprocessed through bending or coating.17
The subject merchandise is hot-rolled deformed rebar, designed specifically to enhance the tensileand shear stress strength of concrete structures.18 Rebar is sold to customers in various forms or stages offabrication,19 but only stock deformed rebar, which is not further processed, is subject to the antidumpingduty orders.20
In the original investigations, the Commission determined that the domestic like productconsisted of rebar coextensive with Commerce’s scope.21 The only parties that addressed the issue ofdomestic like product in these reviews were the domestic interested parties, LM, and Mittal. None ofthese parties advocated any change in the like product definition the Commission adopted during theoriginal investigations.22
The record here contains no information that would warrant a reconsideration of the domestic likeproduct definition. In light of this, and absent argument by any party for a different definition of thedomestic like product, we define the domestic like product as rebar corresponding to Commerce’s scope.

23 19 U.S.C. § 1677(4)(A). In defining the domestic industry, the Commission’s general practice has been toinclude in the industry producers of all domestic production of the like product, whether toll-produced, captivelyconsumed, or sold in the domestic merchant market, provided that adequate production-related activity is conductedin the United States. See United States Steel Group v. United States, 873 F. Supp. 673, 682-83 (Ct. Int’l Trade1994), aff’d, 96 F.3d 1352 (Fed. Cir. 1996). 24 The statute states that in a five-year review involving a regional industry:
the Commission may base its determination on the regional industry defined in the original investigationunder this subtitle, another region that satisfies the criteria established in section 1677(4)(C) of this title, orthe United States as a whole. In determining if a regional industry analysis is appropriate for thedetermination in review, the Commission shall consider whether the criteria established in section1677(4)(C) of this title are likely to be satisfied if the order is revoked or the suspended investigation isterminated. 19 U.S.C. § 1675a(a)(8).
The Uruguay Round Agreements Act (“URAA”) Statement of Administrative Action (“SAA”) clarifies that“the Commission is not bound by any determination it may have made in the original investigation regarding theexistence of a regional industry.” SAA, H.R. Rep. No. 103-316, vol. I at 887 (1994). However, the SAA also statesthat the Commission needs “sufficient evidence” to warrant revisiting its original regional industry determination.SAA at 887. Specifically, the SAA states:
If there is sufficient evidence to warrant revisiting the original regional industry determination, theCommission may base its likelihood determination on: (1) the regional industry defined by the Commissionin the original investigation; (2) another regional industry satisfying the criteria of amended section771(4)(C); or (3) the United States industry as a whole.
Id. at 887-888.
6
B. Domestic Industry and Related Parties
Section 771(4)(A) of the Act defines the relevant domestic industry as the “producers as a wholeof a domestic like product, or those producers whose collective output of a domestic like productconstitutes a major proportion of the total domestic production of the product.”23 Consistent with ourdomestic like product determination, as discussed below, we find one domestic industry consisting of alldomestic producers of rebar.
Below, we consider two issues with respect to the definition of the domestic industry: (1) whetherappropriate circumstances exist to conduct a regional industry analysis; and (2) whether appropriatecircumstances exist to exclude any related party.
1. Regional Industry Analysis
a. General Considerations
Section 752(a)(8) of the Act permits use of a regional industry analysis in a five-year review. Specifically, the Act provides that in five-year reviews, the Commission may revisit its original regionalindustry determination and may base its likely injury determination on the original regional industry,another regional industry, or the United States industry as a whole.24 Section 1677(4)(C), 19 U.S.C. §1677(4)(C), provides that:
In appropriate circumstances, the United States, for a particular product market, may be dividedinto 2 or more markets and the producers within each market may be treated as if they were aseparate industry if--

25 19 U.S.C. § 1677(4)(C). The URAA added the definition of “regional industry” in the last sentence and madetechnical language changes. These URAA changes to the regional industry provisions were not intended to affectsubstantive Commission practice. The URAA also amended the statute to require that Commerce “to the maximumextent possible, direct that duties be assessed only on the subject merchandise of the specific exporters or producersthat exported the subject merchandise for sale in the region concerned during the period of investigation.” 19 U.S.C.§ 1673e(d). Therefore, Commerce will “exclude from the [antidumping duty] order, to the ‘maximum extentpossible,’ those exporters or producers that did not export for sale in the region during the period of investigation.” SAA at 859 and 860. 26 The Court of International Trade has described the steps taken by the Commission in a regional industryanalysis as follows:
The statute sets up three prerequisites which must be satisfied before the Commission can reach anaffirmative determination under a regional industry analysis. The Commission must determine that there is: (1) a regional market satisfying the requirements of the statute, (2) a concentration of dumped imports intothe regional market, and (3) material injury or threat thereof to producers of all or almost all of the regionalproduction, or material retardation to the establishment of an industry, due to the subsidized or dumpedimports. The Commission will move on to the next step only if each preceding step is satisfied.
Texas Crushed Stone Co. v. United States, 822 F. Supp. 773, 777 (CIT 1993), aff’d, 35 F.3d 1535, 1542 (Fed. Cir.1994)(“the ITC’s case-by-case approach represents a ‘legitimate policy choice made by the agency in interpretingand applying the statute.’”), aff’g Crushed Limestone from Mexico, Inv. No. 731-TA-562 (Preliminary), USITCPub. 2533 (July 1992)(“Limestone”). See also Committee For Fairly Traded Venezuelan Cement v. United States,372 F.3d. 1284 (Fed. Cir. 2004); Atlantic Sugar, Ltd. v. United States, 519 F. Supp. 916, 920 (CIT 1981)(the courtcautioned against “[a]rbitrary or free handed sculpting of regional markets.”). 27 SAA at 888. The SAA specifically states:
(continued...)
7
(i) the producers within such market sell all or almost all of their production of thelike product in question in that market, and
(ii) the demand in that market is not supplied, to any substantial degree, by producersof the product in question located elsewhere in the United States.
In such appropriate circumstances, material injury, the threat of material injury, or materialretardation of the establishment of an industry may be found to exist with respect to an industryeven if the domestic industry as a whole, or those producers whose collective output of adomestic like product constitutes a major proportion of the total domestic production of thatproduct, is not injured, if there is a concentration of dumped imports or imports of merchandisebenefitting from a countervailable subsidy into such an isolated market and if the producers of all,or almost all, of the production within that market are being materially injured or threatened bymaterial injury, or if the establishment of an industry is being materially retarded, by reason ofthe dumped imports or imports of merchandise benefitting from a countervailable subsidy. Theterm “regional industry” means the domestic producers within a region who are treated as aseparate industry under this subparagraph.25 26
In determining whether appropriate circumstances exist to conduct a regional industry analysis ina five-year review, the Commission takes into account any effect that the order or suspension agreementmay have had on the marketing and distribution patterns for the subject product in analyzing whether themarket isolation and import concentration criteria are likely to be satisfied in the event of revocation ortermination.27 The Commission also takes into account any prior regional industry definition, any product

27 (...continued)Given the predictive nature of a likelihood of injury analysis, the Commission’s analysis in
regional industry investigations will be subject to no greater degree of certainty than in a review involving anational industry. Because the issuance of an order or the acceptance of a suspension agreement may haveaffected the marketing and distribution patterns of the product in question, the Commission’s analysis of aregional industry should take into account whether the market isolation and import concentration criteria insection 771(4)(C) are likely to be satisfied in the event of revocation or termination. Neither theCommission nor interested parties will be required to demonstrate that the regional industry criteriacurrently are satisfied.
Id. 28 SAA at 888. The SAA states:
The Commission should take into account any prior regional industry definition, whether the product atissue has characteristics that naturally lead to the formation of regional markets (e.g., whether it has a lowvalue-to-weight ratio and is fungible), and whether any changes in the isolation of the region or in importconcentration are related to the imposition of the order or the acceptance of a suspension agreement.
29 USITC Pub. 3425 at 8. The region defined by Chairman Koplan, Vice Chairman Okun and CommissionerBragg included Maine, New Hampshire, Vermont, Massachusetts, Connecticut, Rhode Island, New York, NewJersey, Pennsylvania, Delaware, Virginia, Maryland, West Virginia, North Carolina, South Carolina, Georgia,Florida, Mississippi, Alabama, Tennessee, Kentucky, Ohio, Indiana, Illinois, Wisconsin, Michigan, Missouri,Arkansas, Louisiana, Texas, the District of Columbia, and Puerto Rico. Id.
8
characteristics that lend themselves to a regional market, and whether any changes in the isolation of theregion or import concentration are related to the imposition of the order or acceptance of the suspensionagreement.28 As discussed in detail below, the Commission finds that appropriate circumstances do notexist to conduct a regional industry analysis in these reviews.
b. Background
In the original investigations, the Commission was evenly divided as to whether appropriatecircumstances existed to conduct a regional industry analysis. Chairman Koplan, Vice Chairman Okun,and Commissioner Bragg found that such appropriate circumstances existed. Specifically, they foundthat, while transportation costs accounted for a moderate percentage of the total cost of the product, rebarhad a low value-to-weight ratio which appeared to restrict the geographical area in which rebar could becompetitively sold. They noted that shipments of domestic rebar were concentrated within 250 miles ofthe producing mill. These three Commissioners defined the region as the 30-state region originallyproposed by petitioners.29
Commissioners Miller, Hillman, and Devaney, while noting that the statutory market isolationcriteria appeared to be met, found that appropriate circumstances did not exist to conduct a material injuryanalysis on a regional industry basis. These Commissioners found that the proposed region, consisting of30 states, was not otherwise an isolated market that warranted treatment as a regional industry based onseveral factors. First, they noted that the proposed region encompassed over one-half of the United Statesand accounted for nearly 70 percent of apparent consumption. Second, they emphasized that the assertionthat the rebar market was an “isolated” market was undermined by the remarkably similar trends in pricesfor domestic rebar inside and outside the region, as reflected in U.S. producers’ average unit values(“AUVs”). Finally, they noted that while rebar is a low value-to-weight product, this characteristic did

30 USITC Pub. 3425 at 23. 31 Domestic Interested Parties’ Prehearing Brief at 18-19 and Posthearing Brief Ex. E at 7. 32 Mittal’s Prehearing Brief at 27.
9
not appear to restrict the geographical area to which rebar can be transported, given that 13.0 percent ofU.S. shipments were transported over 500 miles.30
c. Appropriate Circumstances
i. Arguments of the Parties
The domestic interested parties argue that a regional industry analysis is appropriate and that theCommission should define a 30-state region as was proposed by petitioners in the original investigations. Specifically, they emphasize that rebar is a low value-to-weight product with relatively hightransportation costs, which necessarily renders the area in which the product is sold isolated and insular. They note that the majority of domestic shipments were within 250 miles of the manufacturing plant andthat the majority of importer shipments within the region were shipped within 100 miles. According todomestic producers, the 30-state region meets the requisite statutory criteria in that regional producersship the vast majority of their rebar production within the region and regional demand is not supplied toany substantial degree from domestic producers outside the region. Moreover, they point out that to theextent that subject imports entered the region during the period of review, they were concentrated in theregion.31
Of the respondent interested parties, only Mittal has addressed whether the Commission shouldproceed on a regional or national basis, arguing that the Commission should proceed on a national basis. Without addressing the market isolation criteria, Mittal maintains that, as a result of consolidation in therebar industry, the U.S. industry no longer has distinct geographical markets in which producers withinsuch markets sell all or almost all of their production. Mittal emphasizes that the clear implication of therecent consolidation of the rebar industry is that a domestic producer will act nationally, rather thanregionally, in the best interests of the company as a whole.32

33 Commissioner Okun does not join the following analysis. As noted above, Commissioner Okun found in theoriginal investigations that appropriate circumstances existed to conduct a regional industry analysis. USITC Pub.3425 at 6-11. Pursuant to 19 U.S.C. § 1675a(a)(8) and its legislative history, she has reviewed whether a regionalindustry analysis would be appropriate in these reviews if the orders were revoked. While she concurs with the datapresented in the following section, she does not reach the same conclusions as her colleagues. Importantly, verylittle has changed with the relevant data between the original investigations and the current reviews. While AUVshave risen for subject merchandise, so too have prices for all steel products, and rebar remains a relativelyinexpensive steel product. Transportation costs have risen proportionately with the cost of rebar and its ratio to thetotal cost of rebar has remained consistent between the original investigations and the current reviews. Moreover,the shipping distances of domestic rebar have not changed significantly since the original investigations. Finally,while the 30-state region is large, it is contiguous and the manufacturing facilities of domestic rebar producers arespread throughout the region in a manner to supply local demand without having to ship long distances.
In these reviews, however, she has revisited her original regional industry determination. Although she stillconcludes that the market isolation criteria likely would be met, she has determined that appropriate circumstancesare not likely to exist to conduct her analysis on a regional industry basis if the orders were revoked. She determinesthat the statutory requirement of concentration of imports within the pertinent region likely would no longer besatisfied if the orders were revoked, particularly with respect to imports from China. China has the largest rebarindustry in the world, which dwarfs its nearest competitor. If the order were revoked and imports from Chinareentered the U.S. market, they likely would do so on a national basis. Moreover, the likely volume of imports fromChina likely would affect the import trends (ratio of imports to consumption in the region) of other subjectproducers. Therefore, for purposes of these reviews, she considers whether revocation of the antidumping dutyorders on rebar from Belarus, China, Indonesia, Korea, Latvia, Moldova, Poland, and Ukraine would be likely tolead to continuation or recurrence of material injury to an industry in the United States on a national industry basis. 34 CR/PR at Tables C-2 and C-3; 2001 Staff Report at Tables C-1 and C-2. 35 2001 Staff Report at V-2. 36 CR/PR at V-2. In these reviews, regional producers’ reported transportation costs accounted for 4 to 8 percentof the total cost of rebar, and non-regional producers’ reported transportation costs accounted for 5 to 10 percent ofthe total rebar cost. CR/PR at V-2. 37 2001 Staff Report at V-2-3.
10
ii. Analysis33
As noted above, in determining whether to conduct its injury analysis on a regional or nationalbasis, the Commission must take into account characteristics that naturally lead to the formation of aregional market, such as low value-to-weight ratio, fungibility, and high transportation costs. Rebar is ahighly fungible product and has a relatively low value-to-weight ratio. However, the value-to-weightratio was substantially higher during the period of review than during the original investigations. Reported AUVs for domestic shipments inside the proposed region and outside the proposed region were$514 and $541 per short ton in 2006, respectively, compared to $*** and $*** per short ton in 2000.34 In the original investigations, domestic producers reported that transportation costs accounted for between5 percent and 10 percent of the total cost of rebar.35 In these reviews, domestic producers’ transportationcosts ranged from 4 percent to 10 percent of the total cost of rebar.36
Neither rebar’s value-to-weight ratio nor transportation costs appear to make the areas in whichrebar is marketed necessarily isolated and insular. In both the original investigations and these reviews, asubstantial portion of rebar shipments were made at relatively long distances from the plant or port ofentry. In the original investigations, U.S. producers reported that 24.2 percent of shipments were within251 to 500 miles, and 13 percent were at distances over 500 miles. At the same time, importers reportedthat 7.6 percent of shipments were within 251 to 500 miles, and 9.1 percent were at distances over 500miles.37 In these reviews, 21 percent of U.S. producers’ shipments were within 251 to 500 miles, and 16

38 CR/PR at V-2-3. A comparison of the distances of shipments from the plant/port of entry within the proposedregion and outside the proposed region also reveals that neither transportation costs nor the value-to-weight ratiorestrict the area in which rebar is sold. Within the proposed region, producers reported that 21 percent of shipmentswere within 251 to 500 miles and 6 percent were at distances over 500 miles. Importers reported that 13 percent ofshipments were within 251 to 500 miles and 6 percent were at distances over 500 miles. Outside the region, wheretransportation costs were slightly higher, domestic producers reported 22 percent of shipments were within 251 to500 miles, and 33 percent were at distances over 500 miles. At the same time, although import shipments outsidethe region were relatively small, importers reported that 80 percent were at distances over 500 miles. CR/PR at V-2-3. 39 The Commission generally has applied a regional industry analysis in instances where the proposed region accounted for smaller percentages of apparent U.S. consumption. See, e.g., Gray Portland Cement and CementClinker From Japan, Mexico, and Venezuela, Inv. Nos. 303-TA-21 (Review) and 731-TA-451, 461, and 519(Review), USITC Pub. 3361 at Tables C-1, C-4 (Oct. 2000); Certain Steel Wire Nails From the Republic of Korea,Inv. No. 731-TA-26 (Final), USITC Pub. 1088 at 10 (Aug. 1980) (10-state region accounted for approximately 20percent of total domestic consumption). 40 USITC Pub. 3425 at 21-22, 29-30; Confidential Opinion at 46-51, 65-67. 41 We note that the Commission recently found that appropriate circumstances existed to conduct a regionalindustry analysis in Concrete Reinforcing Bars From Turkey, Inv. 731-TA-745 (Review), USITC Pub. 3577 (Feb.2003) (“Rebar from Turkey”). In that review, the proposed region did not encompass as great a geographical area(the region accounted for less than a third of the United States and 20 states as opposed to 30) and accounted forroughly 20 percent of total apparent U.S. consumption. In Rebar from Turkey, as here, a considerable portion ofregional producers’ shipments in the original investigations were made at distances over 500 miles. In that review,however, transportation costs were a higher component of the total cost of rebar. Specifically, U.S. producersreported inland transportation costs generally ranging from 6 to 20 percent of the delivered price for sales within theregion and from 5 to 15 percent for sales outside the region. Among importers of rebar from Turkey, the costsranged from 2 to 18 percent of the delivered price for sales within the region, and from 12 to 18 percent outside the
(continued...)
11
percent were at distances over 500 miles. Importers reported that 11 percent of their shipments werewithin 251 to 500 miles, and 18 percent were at distances over 500 miles.38
The domestic interested parties are correct that regional producers currently ship the vast majorityof their rebar production within the region and that regional demand is not supplied to any substantialdegree from domestic producers outside the region. This is not necessarily the result of the existence ofan isolated or insulated market, however, but a function of the large geographic area included in theproposed region, which encompasses over 70 percent of both apparent U.S. consumption and U.S.production.39
The domestic interested parties are also correct that subject imports were concentrated in theregion during the original investigations and continue to be so during the period covered by thesereviews. Nevertheless, although during the original investigations domestic producers outside the regionfaced less direct competition from subject imports than did producers within the region, domesticproducers inside and outside the region both showed very similar operating and financial trends.40 Furthermore, domestic producers outside the region are likely to face more direct competition fromsubject imports and particularly imports from China if the orders under review were revoked. Thevolume of Chinese imports was relatively modest during the original investigations. As discussed later,however, China currently has substantially more rebar production and capacity than any other country inthe world. Due to geographic proximity, the western portion of the United States is likely a more naturalmarket for Chinese producers. Accordingly, we conclude that if the orders are revoked, the imports arelikely to increase to areas outside as well as inside the proposed region, such that imports are not likely tobe concentrated in the region.
For the reasons stated above, we find that appropriate circumstances do not exist to conduct aregional industry analysis.41

41 (...continued)region. Id. at 8. The Commission also found that the industry engaged in the practice of freight equalization,making transportation costs an important component of rebar sales by domestic producers. There is no specificevidence in these reviews that the domestic industry currently engages in a similar practice. Id. at 8-9. 42 Arcelor Mittal acquired Border Steel in April 2007 as part of its acquisition of Border’s parent company,Mexican producer Sicartsa. Arcelor Mittal owns the Ukrainian subject producer, Mittal, and a Polish subjectproducer, Arcelor Huta Warszawa, which is scheduled to bring rebar capacity on-line in late 2007. It also ownsArcelor International Steel America, LLC, which imports subject merchandise from China, Latvia, and Poland. Mittal argued that it has no intention of shipping from its Ukraine facility to the United States and endangering thecommercial positions of Arcelor’s North American facilities. According to Mittal, future exports from Ukraine intoNorth America would be coordinated through its regional marketing office in Dubai and then through Arcelor Mittalin Chicago. CR/PR at Table I-11; Mittal’s Prehearing Brief at 4-5. 43 CMC acquired 71 percent of the former Huta Zawiercie (now CMC Zawiercie (“CMCZ”) ), a Polish subjectproducer, in late 2003, and increased its share of ownership to 99 percent in 2007. CR at IV-62, PR at IV-36. 44 19 U.S.C. § 1677(4)(B). 45 Border Steel is a *** producer of rebar, and it ***. CR/PR at Table I-11. Arcelor Mittal acquired Border Steelin April 2007, and thus none of the data collected for Border Steel during the review period pertains to a periodduring which it was under Arcelor Mittal’s control. Regardless of whether Border Steel’s ties to subject producersand an importer through its parent company would likely serve to shield it from the effects of subject imports shouldthe orders be revoked, the data in the record was not affected by these new relationships and thus are not subject toexclusion.
There is no evidence on the record suggesting that CMC’s ties to CMCZ would shield it from the effects ofsubject imports if the orders were to be revoked. To the contrary, CMC ***. CR/PR at Table I-11. Moreover, wenote that CMCZ currently accounts for an estimated *** percent of rebar production in Poland, a share that is likelyto diminish in light of growing production capability by other Polish producers. CR at IV-58-63, PR at IV-36-38. 46 Chairman Pearson and Commissioner Okun do not join this section. For a discussion of their cumulationanalysis, see Separate and Dissenting Views of Chairman Daniel R. Pearson and Commissioner Deanna TannerOkun Regarding Cumulation.
12
2. Related Parties
There is a question concerning whether appropriate circumstances exist to exclude Border SteelInc.42 and CMC43 from the domestic industry pursuant to section 771(4)((B) of the Act.44 No party arguesfor exclusion, and we do not find that exclusion of either company is appropriate.45
Therefore, consistent with our definition of domestic like product and for the reasons discussedabove, we define the domestic industry as all domestic producers of rebar.
III. CUMULATION46
A. Framework and Background
Section 752(a) of the Act provides that:
the Commission may cumulatively assess the volume and effect of imports of the subjectmerchandise from all countries with respect to which reviews under section 1675(b) or(c) of this title were initiated on the same day, if such imports would be likely to compete witheach other and with domestic like products in the United States market. The Commission shallnot cumulatively assess the volume and effects of imports of the subject merchandise in a case in

47 19 U.S.C. § 1675a(a)(7). 48 19 U.S.C. § 1677(7)(G)(i). 49 See, e.g., Allegheny Ludlum Corp. v. United States, Slip Op. 06-188 at 17 (Ct. Int’l Trade Dec. 22, 2006)(recognizing the wide latitude the Commission has in selecting the type of factors it considers relevant in decidingwhether to exercise discretion to cumulate subject imports in five-year reviews). 50 Where, in a five-year review, Commissioners Lane and Pinkert do not find that the subject imports are likely tohave no discernible adverse impact on the domestic industry and find that such imports would be likely to competewith each other and the domestic like product in the U.S. market, they cumulate such imports unless there is acondition or propensity – not merely a trend – that is likely to persist for a reasonably foreseeable time and thatsignificantly limits competition such that cumulation is not warranted. 51 The four factors generally considered by the Commission in assessing whether imports compete with eachother and with the domestic like product are: (1) the degree of fungibility between the imports from differentcountries and between imports and the domestic like product, including consideration of specific customerrequirements and other quality related questions; (2) the presence of sales or offers to sell in the same geographicmarkets of imports from different countries and the domestic like product; (3) the existence of common or similarchannels of distribution for imports from different countries and the domestic like product; and (4) whether theimports are simultaneously present in the market. See Certain Cast-Iron Pipe Fittings from Brazil, the Republic ofKorea, and Taiwan, Inv. Nos. 731-TA-278-280 (Final), USITC Pub. 1845 (May 1986), aff’d, Fundicao Tupy, S.A. v.United States, 678 F. Supp. 898 (Ct. Int’l Trade 1988), aff’d, 859 F.2d 915 (Fed. Cir. 1988); Mukand Ltd. v. UnitedStates, 937 F. Supp. 910, 915 (Ct. Int’l Trade 1996). 52 See Mukand, 937 F. Supp. at 916; Wieland Werke, AG v. United States, 718 F. Supp. 50, 52 (Ct. Int’l Trade1989) (“Completely overlapping markets are not required.”); United States Steel Group, 873 F. Supp. at 685. Wenote, however, that there have been investigations where the Commission has found an insufficient overlap incompetition and has declined to cumulate subject imports. See, e.g., Live Cattle from Canada and Mexico, Inv. Nos.701-TA-386 (Prelim.) and 731-TA-812-813 (Prelim.), USITC Pub. 3155 at 15 (Feb. 1999), aff’d, Ranchers-Cattlemen Action Legal Foundation v. United States, 74 F. Supp. 2d 1353 (Ct. Int’l Trade 1999); Static RandomAccess Memory Semiconductors from the Republic of Korea and Taiwan, Inv. Nos. 731-TA-761-762 (Final),USITC Pub. 3098 at 13-15 (Apr. 1998). 53 19 U.S.C. § 1675a(a)(7).
13
which it determines that such imports are likely to have no discernible adverse impact on thedomestic industry.47
Cumulation is therefore discretionary in five-year reviews, unlike original investigations, which aregoverned by section 771(7)(G)(i) of the Act.48 Because of the prospective nature of five-year reviews andthe Commission’s discretion with respect to cumulation, we consider significant conditions ofcompetition that are likely to prevail with respect to each subject country if the orders under review areterminated.49 50
The Commission may exercise its discretion to cumulate, however, only if the reviews areinitiated on the same day and the Commission determines that the subject imports are likely to competewith each other and the domestic like product in the U.S. market. The Commission generally hasconsidered four factors intended to provide a framework for determining whether the imports competewith each other and with the domestic like product.51 Only a “reasonable overlap” of competition isrequired.52 In five-year reviews, the relevant inquiry is whether there likely would be competition afterrevocation of the orders, even if none currently exists.
The statute precludes cumulation if the Commission finds that subject imports from a country arelikely to have no discernible adverse impact on the domestic industry.53 We note that neither the statutenor the SAA provides specific guidance on what factors the Commission is to consider in determining

54 SAA, H.R. Rep. No. 103-316, vol. I (1994). 55 Commissioner Bragg cumulated subject imports from all subject countries. USITC Pub. 3425 at 14 n. 62. 56 USITC Pub. 3425 at 16, 25. 57 USITC Pub. 3440 at 7-9; 10-14. 58 71 Fed. Reg. 43443 (Aug. 1, 2006). 59 Chairman Pearson dissenting with respect to subject imports from Korea.
14
that imports “are likely to have no discernible adverse impact” on the domestic industry.54 With respectto this provision, the Commission, however, generally considers the likely volume of the subject importsand the likely impact of those imports on the domestic industry within a reasonably foreseeable time if theorders are revoked.
In the original investigations, five of the six Commissioners cumulated subject imports fromBelarus, Indonesia, Korea, Latvia, Moldova, Poland, and Ukraine, but did not cumulate subject importsfrom China.55 With respect to subject imports from the countries other than China, all six Commissionersfound that rebar is a highly fungible product because all rebar produced, sold, or used in the United Statesmeets certain common requirements, such as ASTM standards. They also noted that the majority ofproducers, importers, and purchasers viewed rebar to be interchangeable regardless of origin. In addition,they found that domestic and imported rebar was sold to both distributors and fabricators. ChairmanKoplan, Vice Chairman Okun, and Commissioner Bragg also found that the geographic overlaprequirement was satisfied because domestic rebar was sold in the region and that subject imports weresold or marketed throughout the region. Commissioners Miller, Hillman, and Devaney found thatdomestic rebar and subject imports competed within a majority of the states. All six Commissionersfound that the domestically produced product and subject imports from all sources were simultaneouslypresent in the regional or national market.56
In the original investigations, five of the six Commissioners found that subject imports fromChina were negligible for present material injury purposes. They found, however, that subject importsfrom China would imminently account for more than 3 percent of all imports of rebar sold into theregion/U.S. market. Although they found that rebar from China was interchangeable with domesticallyproduced rebar and rebar from the other subject countries and that it competed against both domestic andimported rebar, they declined to exercise their discretion to cumulate subject imports from China withimports from the other subject countries for purposes of their analysis of threat of material injury. Specifically, they found the volume and price trends exhibited by subject imports from China and othersubject imports to be significantly different. In so doing, they noted that the volume and U.S. marketshare of subject imports from China rose sharply over the period examined, while the volumes of subjectimports from the other countries fluctuated. At the same time, they found that, although all subjectimports undersold the domestic like product, the margins of underselling by Chinese subject imports weresignificantly higher.57
The statutory threshold for cumulation is satisfied in these reviews, because all reviews wereinitiated on the same day (August 1, 2006).58 The remainder of our analysis of cumulation is set forthbelow.
B. Likelihood of No Discernible Adverse Impact59
We do not find that subject imports of rebar from Belarus, China, Indonesia, Korea, Latvia,Moldova, Poland, and Ukraine would likely have no discernible adverse impact on the domestic industryif the antidumping duty orders were revoked.
60 CR/PR at Table IV-9 (Belarus 2006 production capacity of *** short tons); CR/PR at Table IV-12 (China 2006production capacity of *** short tons); CR/PR at Table IV-16 (Korea 2006 production capacity of *** short tons);CR/PR at Table IV-21 (Latvia 2006 production capacity of *** short tons); CR/PR at Table IV-25 (Moldova 2006production capacity of *** short tons); INV-EE-068, CR/PR Table IV-37 (Indonesia 2006 production capacity of*** short tons); CR/PR at Table IV-30 (Poland 2006 production capacity of *** short tons); and CR/PR at TableIV-37 (Ukraine 2006 production capacity of *** short tons). 61 See e.g., CR/PR at Tables IV-9 (Belarus); IV-14 (China); IV-15 (Indonesia); IV-16 (Korea); IV-21 (Latvia);IV-25 (Moldova); IV-28 (Poland); and IV-33 (Ukraine). 62 CR at I-21-27, PR at I-19-23. 63 See, e.g., CR/PR at Table II-6. 64 See, e.g., CR/PR at Table II-4. 65 See e.g., CR at V-30, PR at V-14; and 2001 Staff Report at Table G-5. 66 See generally Chefline Corp. v. United States, 219 F. Supp. 2d 1313, 1314 (Ct. Int’l Trade 2002). 67 See Mukand Ltd. v. United States, 937 F. Supp. 910, 917 (Ct. Int’l Trade 1996). 68 CR at I-23, PR at I-20. 69 CR/PR at Tables I-8, I-9.
15
In these reviews, each subject country has significant capacity to produce subject merchandise inappreciable volumes.60 The rebar industries in all of the subject countries export a large percentage oftheir production, or, in the case of China, Korea, and Poland, substantial volumes.61 Moreover, rebarproducers in each subject country have ready access to the U.S. market. Prior to the imposition of theantidumping duty orders, subject imports from each country were present in the U.S. market, and we findthat subject imports from each country are likely to have at least some presence in the U.S. market uponrevocation of the orders.
Rebar manufactured in each of the subject countries does not differ from the types of rebarproduced in the United States62 and is substitutable for, and competitive with, domestically producedrebar.63 Competition is likely to be priced-based in light of the reported importance of price in purchasingdecisions.64 Moreover, rebar producers in each subject country undersold U.S. producers during theoriginal investigation period.65
Based on these considerations, we do not find that subject imports from Belarus, China,Indonesia, Korea, Latvia, Moldova, Poland, and Ukraine would likely have no discernible adverse impacton the domestic industry if the orders were revoked.
C. Likely Reasonable Overlap of Competition
With regard to likely overlap of competition, the relevant inquiry is whether there would likely becompetition in the event of revocation even if there are no current imports from a subject country.66 Onlya “reasonable overlap” of competition is required.67 As noted above, the Commission generally hasconsidered whether subject imports would likely compete with each other and with the domestic likeproduct with reference to four factors: (1) fungibility; (2) sales or offers in the same geographic markets;(3) common or similar channels of distribution; and (4) simultaneous presence in the U.S. market.
Fungibility. Rebar is a highly fungible product, with domestically produced product andimported product being readily interchangeable. Virtually all rebar produced, sold, or used in the UnitedStates meets certain common standards, such as ASTM specifications and state and local building codes,which dictate minimum requirements for chemical composition, tensile strength, yield strength, andelongation tolerances.68 Both domestically produced rebar and subject rebar are available in sizes #3 to#18 and are usually sold in lengths of 20, 40, or 60 feet.69 In the original investigations, all U.S.producers and a majority of importers considered domestic rebar and imported rebar to be interchangeable

70 USITC Pub. 3425 at 15. 71 CR/PR at Table II-6. 72 Mittal’s Prehearing Brief at 7. 73 CR/PR at Table I-8. 74 Mittal’s Prehearing Brief at 6. 75 CR/PR at Table I-9. 76 Mittal’s Prehearing Brief at 7-8. 77 CR/PR at Table II-6. 78 CR/PR at Table II-1. 79 CR/PR at Table II-1 80 USITC Pub. 3425 at 15.
16
regardless of the country of origin.70 In these reviews, a majority of domestic producers and a majority ofresponding importers and purchasers reported that domestic and imported rebar were generally viewed asinterchangeable.71
Mittal argues that subject imports and the domestic product are not fungible because importedrebar is concentrated in sizes #3 through #5, while the domestic like product is concentrated in sizes #4through #6.72 Mittal’s argument concedes some overlap in sizes between imported and domestic rebar. Moreover, the record indicates that both domestic and subject imported rebar are sold in the U.S. marketin virtually all sizes.73
Mittal further argues that there is an insufficient overlap of competition between the domestic likeproduct and subject imports because domestic production of rebar was greater in the 60 foot and greaterrange, while imports were more prominent in the 20-40 foot range.74 While more domestic rebar wasproduced in the 60 foot length and more imports were in the 20-40 foot range, both domestic andimported rebar were sold in all lengths during the review period.75
Finally, citing to the prehearing staff report, Mittal argues that there is only a limited overlap ofcompetition with respect to rebar from Ukraine because certain importers and purchasers perceivedimports from Ukraine as being “never” or only “sometimes” interchangeable with rebar from othersubject countries.76 Mittal’s argument, however, appears to be based on a misreading of the prehearingreport. The record indicates that the overwhelming majority of producers, importers, and purchasersreported that subject imports from Ukraine are “always” or “frequently” interchangeable with thedomestic like product and other subject imports.77 Channels of Distribution. In the original investigations, domestically produced rebar andimported rebar were sold to both distributors and fabricators. In these reviews, domestically producedrebar and imported rebar continued to be sold to the same categories of customers. Roughly one-half ofdomestic rebar was sold to firms that function as both end users and distributors, with the remainder goingto end users and distributors. Although limited in volume, subject imports were mostly sold todistributors.78
Mittal argues that because most subject imports, unlike the domestic like product, were sold todistributors, there is limited competition between the domestic like product and subject imports. Therecord, however, indicates that while more domestically produced rebar was sold to distributors/end usersor fabricators in 2006, 20.7 percent of domestically produced rebar was sold to distributors.79 In anyevent, in a five-year review, the proper focus is on the subject imports’ likely post-revocation behavior,and the composition of current imports, which are affected by the discipline of the antidumping orders, isnot necessarily indicative of likely post-revocation behavior. In the original investigations, almost allpurchasers reported buying both domestic and imported rebar.80

81 CR at II-19-20, PR at II-13-14. 82 CR at IV-15, PR at IV-11, CR/PR at Table IV-5. 83 Commissioners Lane and Pinkert do not join in this analysis of other considerations except as noted in fn 96. Where, in a five-year review, they do not find that the subject imports are likely to have no discernible adverseimpact on the domestic industry and find that such imports would be likely to compete with each other and with thedomestic like product in the U.S. market, they cumulate such imports unless there is a condition or propensity – notmerely a trend – that is likely to persist for a reasonably foreseeable time and that significantly limits competitionsuch that cumulation is not warranted.
In these reviews, they find there is no such condition or propensity. Rebar, regardless of the source, is afungible product that sells primarily on the basis of price. Global sales are typically made on a spot basis by traderswho seek the most advantageous price, and thus all subject exporters participate in a common market. Finally, anydifferences in export orientation do not appear to be structural in nature, and each subject country exports significantvolumes of rebar and has demonstrated an ability to shift among markets. Therefore, Commissioners Lane andPinkert exercise their discretion to cumulate the subject imports. 84 Domestic interested parties argued that the Commission should not cumulate subject imports from Korea withsubject imports from the other subject countries because they do not believe that imports of Korean rebar would havea discernable adverse impact if the antidumping duty order on rebar from Korea were revoked. See e.g., DomesticInterested Parties’ Prehearing Brief at 19-20. As discussed earlier, we do not make such a finding. 85 CR/PR at Tables IV-18 and IV-20.
17
Finally, Mittal contends that the domestic product and subject imports have very differentchannels of distribution because a substantial portion of rebar purchases are subject to “Buy American”provisions. Six responding firms reported that “Buy American” provisions apply to 50 or more percent oftheir purchases, while the other 12 firms reported that they applied to 40 percent or less of total purchases. Four responding firms reported that their domestic purchases were not covered by “Buy Americanpurchases.81 Thus, the majority of purchases are not covered by “Buy American” provisions.
Geographic Overlap and Simultaneous Presence in the Market. As noted above, the Commissionfound these factors to be satisfied in the original investigations. Since imposition of the orders, imports ofrebar from subject countries, with the exception of Latvia, have been virtually non-existent and/orsporadic. Those subject imports that entered the United States during the period of review, however, didso throughout most of the country. In the original investigations, subject imports were sold or marketedin a majority of the states.82 There is no indication that upon revocation, there would not again begeographic overlap and simultaneous presence in the market.
On balance, we find that subject imports from each country would be highly fungible, move inthe same channels of distribution, and compete in the same geographic markets during the same periods. We, therefore, conclude that there likely would be a reasonable overlap of competition among subjectimports and between subject imports and the domestic like product in the event of revocation.
D. Other Considerations83
1. Korea
Based on our review of the record, we find that subject imports from Korea would not be likely tocompete under similar conditions of competition as subject imports from Belarus, China, Indonesia,Latvia, Moldova, Poland, and Ukraine. We consequently do not exercise our discretion to cumulatesubject imports from Korea with those from Belarus, China, Indonesia, Latvia, Moldova, Poland, andUkraine.84
During the period of review, Korean rebar was sold almost exclusively in the home market, withonly a small share of production exported, mainly to other Asian markets.85 Based on data from *** andthe World Trade Atlas, total rebar exports from Korea, as a share of Korean production, ranged between

86 Calculated from CR/PR at Tables IV-18 and IV-20. For Hyundai, the sole Korean producer to respond to theCommission’s questionnaire, rebar exports accounted for less than *** percent of total shipments over the period ofreview, except in 2005 when the share was *** percent. CR/PR at Table IV-17. 87 CR/PR at Tables IV-18 and IV-19. 88 See CR/PR at Tables IV-11 (China); IV-15 (Indonesia ); IV-21 (Latvia); IV-28 (Poland). 89 See CR/PR at Tables IV-9 (Belarus); IV-25 (Moldova ); IV-21 (Latvia) and IV-33 (Ukraine). 90 During the review period, rebar exports from Korea ranged from 13,316 short tons in 2003 to 474,175 shorttons in 2005. China’s exports ranged from 387,606 short tons in 2002 to 3.7 million short tons in 2006. CR/PR atTable IV-48. 91 CR/PR at Table IV-18. 92 CR/PR at Tables IV-10 (Belarus); IV-12 (China - no data for 2001-04 data, capacity increased from 2005 to2006); IV-22 (Latvia); IV-26 (Moldova); IV-29 (Poland), IV-33 (Ukraine - Mittal). 93 CR/PR at Table IV-16 (capacity utilization rate of *** percent in 2006, an *** from 2000). 94 CR/PR at Table IV-18 (Korea became a net importer of rebar in 2002). 95 As noted in footnote 2 above, Vice Chairman Aranoff does not join sections III. D. 2 and IV. D of these views. 96 Commissioners Lane and Pinkert join in this analysis only with respect to the Commission’s response to thearguments set forth by Mittal and LM. 97 Mittal’s Prehearing Brief at 8-11; Posthearing Brief at 13-15.
18
*** percent and *** percent over the period of review.86 In fact, Korea has been a net importer since2002, and is projected to remain so for at least the next several years.87 Rebar producers in the othersubject countries, with the exception of China, export substantial portions of their production88 withexports from several subject countries near or exceeding *** percent of total shipments.89 While China’sexports account for a much smaller share of production than the other subject countries, it nonethelessexported significant quantities of rebar during the period of review.90 In addition, there are differences incapacity trends. The capacity of the Korean rebar industry fluctuated in a relatively narrow range duringthe period of review, and was *** percent lower in 2006 that it was in 2001.91 The available data for theother subject countries, by contrast, show that production capacity has either increased or remained steadyover the period of review.92 Finally, although the Korean rebar industry operates at very high capacityutilization rates,93 the Korean producers could not meet home market demand over the period of review,which does not appear to be the case for producers in other subject countries.94 Based on thesedifferences, we find that subject imports from Korea and those from the other subject countries are likelyto compete in the U.S. market under different conditions of competition if the orders are revoked.
Accordingly, we have determined to exercise our discretion not to cumulate subject imports fromKorea with imports from any other subject country.95
2. Other Countries96
Mittal argues that the Commission should exercise its discretion and not cumulate subject importsfrom Ukraine with other subject imports due to Mittal’s corporate affiliation with a U.S. producer ofrebar.97 In this regard, Mittal cites Certain Carbon Steel Products from Australia, Belgium, Brazil,Canada, Finland, France, Germany, Japan, Korea, Mexico, Poland, Romania, Spain, Sweden, Taiwan, andthe United Kingdom, Inv. Nos. AA1921-197 (Second Review); 701-TA-319, 320, 325-327, 348, and 350(Second Review; and 731-TA-573-574, 576, 578, 582-587, 612, and 614-618 (Second Review), USITCPub. 3899 (January 2007) (“CTL Plate”). In CTL Plate, the Commission declined to cumulate subjectimports from Romania with other countries because, inter alia, of the significant changes the RomanianCTL plate industry had undergone since the original investigation, including the facts that the Romanian

98 CTL Plate, USITC Pub. 3899, at 50-51 (Commissioners Koplan and Lane dissenting). 99 CR at IV-68, PR at IV-43. 100 CR/PR at Table I-11. 101 Hearing Transcript at 287-288. 102 CR/PR at Table IV-33. 103 E.g., LM’s Prehearing Brief at 9-10. 104 CR/PR at Table IV-22. 105 CR/PR at Table IV-23 (exports to Algeria increased from 23,647 short tons in 2005 to 73,470 short tons in2006; exports to Russia increased from 7,320 short tons in 2005 to 45,791 short tons in 2006). 106 CR/PR at IV-5. From September 2003 until late 2004, virtually all rebar from Latvia entered the United Statesunder an HTS subheading that was not at the time considered to be subject to antidumping duties. In late 2004,Customs informed the importer that this subheading was indeed subject to antidumping duties, and the importerbegan paying deposits on its imports. The volume of subject imports from Latvia rose from 50,522 short tons in2003 to 121,881 short tons in 2004, then dropped to 36,646 short tons in 2005 and zero in 2006. CR/PR at Table IV-1.
19
producer was no longer state-owned and, at the time of the review, was part of a corporate group thatincluded a major U.S. producer of CTL plate.98
The circumstances in these reviews differ markedly from CTL Plate. In CTL Plate, the soleRomanian producer was affiliated with a major U.S. producer capable of servicing a large portion of theU.S. market. Here, although Mittal accounts for a large share of Ukraine rebar production, it is not theonly rebar producer in Ukraine.99 Moreover, unlike the Romanian producer, Mittal is affiliated throughits parent company Arcelor-Mittal with a *** U.S. rebar producer, Border Steel, located in the westernportion of Texas.100 Mittal argues that Arcelor will make shipping decisions that are in the best interestsof its U.S. affiliate.101 However, while Arcelor may exercise prudence in making its decisions withrespect to the *** portion of the U.S. market supplied by Border Steel, the same is unlikely to be true forthe remainder of the U.S. market. Finally, regardless of whether Mittal is part of a global corporategroup, Mittal itself ***.102
LM argues that Latvia’s accession to the EU in 2004 is a condition of competition that warrants adecision not to cumulate Latvian imports with those of non-EU subject countries.103 However, Latviacontinues to export substantial volumes of rebar to non-EU countries; in 2006, *** percent of Latvia’srebar shipments were to countries outside the EU. In fact, the share of Latvia’s rebar shipments that wereexported to the EU was similar in both 2003 (pre-accession) and in 2006 (*** percent and *** percent,respectively).104 LM projects that the EU will account for similar shares of its total shipments in 2007 and2008. Moreover, Algeria and Russia were Latvia’s fourth and sixth largest export markets, respectively,in 2006, and exports to those two markets increased significantly in 2006.105 Finally, while U.S. importsof rebar from Latvia declined after 2004, this appears at least in part to be due to a change in practice, inlate 2004, by U.S. Customs and Border Protection that resulted in antidumping duties being assessed onrebar imports from Latvia.106
With respect to the other subject countries, Commissioner Williamson does not find sufficientreasons on the record not to exercise his discretion to cumulate. While Commissioner Williamson notesthat some differences exist among the industries in Belarus, China, Indonesia, Latvia, Moldova, Poland,and Ukraine, in light of substantial similarities among them and the similar conditions under whichsubject imports of rebar from those countries would likely compete in the U.S. market upon revocation,he exercises his discretion to cumulate these countries. In particular, as discussed below in conditions ofcompetition, rebar is a highly fungible, commodity-type product, and the record, including that from theoriginal investigations, indicates that rebar from all seven countries would likely compete directly witheach other and with domestic product in the U.S. market upon revocation. Moreover, as discussed below

107 See CR/PR at Tables IV-10, IV-14, IV-23, IV-26, IV-31, and IV-35. 108 19 U.S.C. § 1675a(a). 109 SAA, H.R. Rep. No. 103-316, vol. I, at 883-84 (1994). The SAA states that “[t]he likelihood of injurystandard applies regardless of the nature of the Commission’s original determination (material injury, threat ofmaterial injury, or material retardation of an industry). Likewise, the standard applies to suspended investigationsthat were never completed.” SAA at 883. 110 While the SAA states that “a separate determination regarding current material injury is not necessary,” itindicates that “the Commission may consider relevant factors such as current and likely continued depressedshipment levels and current and likely continued [sic] prices for the domestic like product in the U.S. market inmaking its determination of the likelihood of continuation or recurrence of material injury if the order is revoked.” SAA at 884.
20
in conditions of competition, competition in the U.S. market is highly price-based. The record indicatesthat each of these seven countries exports significant volumes of rebar, and subject producers in eachcountry have demonstrated an ability to shift exports among markets.107
Thus, Commissioner Williamson finds that subject imports from each of the subject countrieswould be likely to compete under similar conditions of competition if the orders were revoked, and heexercises his discretion to cumulate subject imports from Belarus, China, Indonesia, Latvia, Moldova,Poland, and Ukraine.
IV. LIKELIHOOD OF CONTINUATION OR RECURRENCE OF MATERIAL INJURY IFTHE ANTIDUMPING DUTY ORDERS ARE REVOKED
A. Legal Standards
In a five-year review conducted under section 751(c) of the Act, Commerce will revoke anantidumping duty order unless: (1) it makes a determination that dumping or subsidization is likely tocontinue or recur; and (2) the Commission makes a determination that revocation of the antidumping dutyorder “would be likely to lead to continuation or recurrence of material injury within a reasonablyforeseeable time.”108 The SAA states that “under the likelihood standard, the Commission will engage ina counter-factual analysis; it must decide the likely impact in the reasonably foreseeable future of animportant change in the status quo – the revocation or termination of a proceeding and the elimination ofits restraining effects on volumes and prices of imports.”109 Thus, the likelihood standard is prospectivein nature.110 The U.S. Court of International Trade has found that “likely,” as used in the sunset review
111 See NMB Singapore Ltd. v. United States, 288 F. Supp. 2d 1306, 1352 (Ct. Int’l Trade 2003) (“‘likely’ meansprobable within the context of 19 U.S.C. § 1675(c) and 19 U.S.C. § 1675a(a)”), aff’d without opinion, 05-1019 (Fed.Cir. Aug. 3, 2005); Nippon Steel Corp. v. United States, Slip Op. 02-153 at 7-8 (Ct. Int’l Trade Dec. 24, 2002)(same); Usinor Industeel, S.A. v. United States, Slip Op. 02-152 at 4 n.3 & 5-6 n.6 (Ct. Int’l Trade Dec. 20, 2002)(“more likely than not” standard is “consistent with the court’s opinion”; “the court has not interpreted ‘likely’ toimply any particular degree of ‘certainty’”); Indorama Chemicals (Thailand) Ltd. v. United States, Slip Op. 02-105at 20 (Ct. Int’l Trade Sept. 4, 2002) (“standard is based on a likelihood of continuation or recurrence of injury, not acertainty”); Usinor v. United States, Slip Op. 02-70 at 43-44 (Ct. Int’l Trade July 19, 2002) (“‘likely’ is tantamountto ‘probable,’ not merely ‘possible’”). 112 For a complete statement of Commissioner Okun’s interpretation of the likely standard, see Additional Viewsof Vice Chairman Deanna Tanner Okun Concerning the “Likely” Standard in Certain Seamless Carbon and AlloySteel Standard, Line and Pressure Pipe from Argentina, Brazil, Germany, and Italy, Inv. Nos. 701-TA-362 (Review)and 731-TA-707-710 (Review) (Remand), USITC Pub. 3754 (Feb. 2005). 113 Commissioner Lane notes that, consistent with her views in Pressure Sensitive Plastic Tape from Italy, Inv.No. AA1921-167 (Second Review), USITC Pub. 3698 (June 2004), she does not concur with the U.S. Court ofInternational Trade’s interpretation of “likely,” but she will apply the Court’s standard in these reviews and allsubsequent reviews until either Congress clarifies the meaning or the U.S. Court of Appeals for the Federal Circuitaddresses this issue. 114 19 U.S.C. § 1675a(a)(5). 115 SAA at 887. Among the factors that the Commission should consider in this regard are “the fungibility ordifferentiation within the product in question, the level of substitutability between the imported and domesticproducts, the channels of distribution used, the methods of contracting (such as spot sales or long-term contracts),and lead times for delivery of goods, as well as other factors that may only manifest themselves in the longer term,such as planned investment and the shifting of production facilities.” Id. 116 19 U.S.C. § 1675a(a)(1). 117 19 U.S.C. § 1675a(a)(1). There have been no duty absorption findings by Commerce with respect to theorders under review. CR at I-17 n.25, PR at I-15 n.25. The statute further provides that the presence or absence ofany factor that the Commission is required to consider shall not necessarily give decisive guidance with respect tothe Commission’s determination. 19 U.S.C. § 1675a(a)(5). While the Commission must consider all factors, no onefactor is necessarily dispositive. SAA at 886. 118 19 U.S.C. § 1677e(a) authorizes the Commission to use the “facts otherwise available” in reaching adetermination when: (1) necessary information is not on the record or (2) an interested party or other personwithholds information requested by the agency, fails to provide such information in the time, form, or manner
(continued...)
21
provisions of the Act, means “probable,” and the Commission applies that standard in five-yearreviews.111 112 113
The statute states that “the Commission shall consider that the effects of revocation or terminationmay not be imminent, but may manifest themselves only over a longer period of time.”114 According tothe SAA, a “‘reasonably foreseeable time’ will vary from case-to-case, but normally will exceed the‘imminent’ timeframe applicable in a threat of injury analysis in original investigations.”115
Although the standard in a five-year review is not the same as the standard applied in an originalantidumping duty investigation, it contains some of the same fundamental elements. The statute providesthat the Commission is to “consider the likely volume, price effect, and impact of imports of the subjectmerchandise on the industry if the orders are revoked or the suspended investigation is terminated.”116 Itdirects the Commission to take into account its prior injury determination, whether any improvement inthe state of the industry is related to the order or the suspension agreement under review, whether theindustry is vulnerable to material injury if the orders are revoked or the suspension agreement isterminated, and any findings by Commerce regarding duty absorption pursuant to 19 U.S.C.§ 1675(a)(4).117 118 119

118 (...continued)requested, significantly impedes a proceeding, or provides information that cannot be verified pursuant to section781(i) of the Act. 19 U.S.C. § 1677e(a). The verification requirements in section 781(i) are applicable only toCommerce. 19 U.S.C. § 1677m(i). See Titanium Metals Corp. v. United States, 155 F. Supp. 2d 750, 765 (Ct. Int’lTrade 2002) (“the ITC correctly responds that Congress has not required the Commission to conduct verificationprocedures for the evidence before it, or provided a minimum standard by which to measure the thoroughness ofCommission investigations.”). 119 Commissioner Okun notes that the statute authorizes the Commission to take adverse inferences in five-yearreviews, but such authorization does not relieve the Commission of its obligation to consider the record evidence asa whole in making its determination. See 19 U.S.C. § 1677e. She generally gives credence to the facts supplied bythe participating parties and certified by them as true, but bases her decision on the evidence as a whole, and doesnot automatically accept participating parties’ suggested interpretations of the record evidence. Regardless of thelevel of participation and the interpretations urged by participating parties, the Commission is obligated to considerall evidence relating to each of the statutory factors and may not draw adverse inferences that render such analysissuperfluous. “In general, the Commission makes determinations by weighing all of the available evidence regardinga multiplicity of factors relating to the domestic industry as a whole and by drawing reasonable inferences from theevidence it finds most persuasive.” SAA at 869. 120 19 U.S.C. § 1675a(a)(2). 121 19 U.S.C. § 1675a(a)(2)(A)-(D). 122 19 U.S.C. § 1675a(a)(3). The SAA states that “[c]onsistent with its practice in investigations, in consideringthe likely price effects of imports in the event of revocation and termination, the Commission may rely oncircumstantial, as well as direct, evidence of the adverse effects of unfairly traded imports on domestic prices.” SAAat 886. 123 19 U.S.C. § 1675a(a)(4).
22
In evaluating the likely volume of imports of subject merchandise if the antidumping duty ordersare revoked, the Commission is directed to consider whether the likely volume of imports would besignificant either in absolute terms or relative to production or consumption in the United States.120 Indoing so, the Commission must consider “all relevant economic factors,” including four enumeratedfactors: (1) any likely increase in production capacity or existing unused production capacity in theexporting country; (2) existing inventories of the subject merchandise, or likely increases in inventories;(3) the existence of barriers to the importation of the subject merchandise into countries other than theUnited States; and (4) the potential for product shifting if production facilities in the foreign country,which can be used to produce the subject merchandise, are currently being used to produce otherproducts.121
In evaluating the likely price effects of subject imports if the antidumping duty orders arerevoked, the Commission is directed to consider whether there is likely to be significant underselling bythe subject imports as compared to domestic like products and whether the subject imports are likely toenter the United States at prices that otherwise would have a significant depressing or suppressing effecton the price of domestic like products.122
In evaluating the likely impact of imports of subject merchandise if the antidumping orders arerevoked, the Commission is directed to consider all relevant economic factors that are likely to have abearing on the state of the industry in the United States, including but not limited to: (1) likely declines inoutput, sales, market share, profits, productivity, return on investments, and utilization of capacity;(2) likely negative effects on cash flow, inventories, employment, wages, growth, ability to raise capital,and investment; and (3) likely negative effects on the existing development and production efforts of theindustry, including efforts to develop a derivative or more advanced version of the domestic likeproduct.123 All relevant economic factors are to be considered within the context of the business cycle

124 19 U.S.C. § 1675a(a)(4). Section 752(a)(6) of the Act states that “the Commission may consider themagnitude of the margin of dumping” in making its determination in a five-year review. 19 U.S.C. § 1675a(a)(6). The statute defines the “magnitude of the margin of dumping” to be used by the Commission in five-year reviews as“the dumping margin or margins determined by the administering authority under section 1675a(c)(3) of this title.” 19 U.S.C. § 1677(35)(C)(iv). See also SAA at 887.
Commerce conducted expedited sunset reviews of the orders on Belarus, China, Indonesia, Korea,Moldova, and Poland. With respect to the antidumping duty order on subject imports from Belarus, Commercefound likely a country-wide rate of 114.53 percent. With respect to the antidumping duty order on China,Commerce found a likely margin of 133.00 percent both country-wide and for Lawiu Steel Group. With respect tothe antidumping duty order on subject imports from Indonesia, Commerce found likely margins of 71.01 percent foreight named exporters and 60.46 percent for all others. With respect to the antidumping duty order on subjectimports from Korea, Commerce found likely margins of 102.28 percent for Hanbo Iron & Steel and 22.89 percentfor Dongkuk Steel Mill, Korea Iron & Steel Co., and all others. With respect to the antidumping duty order onMoldova, Commerce found a likely country-wide rate of 232.86 percent. With respect to the antidumping duty orderon Poland, Commerce found a likely margin of 52.07 percent for Stalexport and 47.13 percent for all others. 71 Fed.Reg. 9732 (Dec. 5, 2006).
Commerce conducted full reviews for the antidumping duty order on subject imports from Latvia andUkraine. With respect to the antidumping duty order on Latvia, Commerce found likely margins of 17.21 percent forLM and all others. 72 Fed. Reg. 1676 (Apr. 5, 2007). With respect to the antidumping duty order on Ukraine,Commerce found a Ukraine-wide/all others rate of 41.69 percent. 72 Fed. Reg. 9732 (Mar. 5, 2007). 125 The SAA states that in assessing whether the domestic industry is vulnerable to injury if the order is revoked,the Commission “considers, in addition to imports, other factors that may be contributing to overall injury. Whilethese factors, in some cases, may account for the injury to the domestic industry, they may also demonstrate that anindustry is facing difficulties from a variety of sources and is vulnerable to dumped or subsidized imports.” SAA at885. 126 See e.g. Domestic Interested Parties’ Prehearing Brief at 5-12; LM’s Posthearing Brief at 8-9. 127 19 U.S.C. § 1677(7)(A). 128 SAA, H. R. Rep. 103-316, vol. I at 884 (1994). 129 SAA, H.R. Rep. 103-316, vol. I at 884.
23
and the conditions of competition that are distinctive to the industry.124 As instructed by the statute, wehave considered the extent to which any improvement in the state of the domestic industry is related tothe order at issue and whether the industry is vulnerable to material injury if the orders are revoked.125
In these reviews, the parties have raised arguments regarding the amount of likely change inimpact factors pertaining to the domestic industry’s condition such as shipments, employment, andprofitability that is necessary to constitute “likelihood of continuation or recurrence of material injury.”126 Our examination of the amount and type of likely impact necessary to justify our determinations has beenguided by the provisions of the statute, legislative history, and case law.
We find that, within certain general legal parameters, the issue is one of fact that is within ourdiscretion to weigh. The statute defines “material injury” as “harm which is not inconsequential,immaterial, or unimportant.”127 The SAA for the URAA, the source of the five-year review provisions ofthe Act, does not specifically address the question of the amount of change in industry conditionsnecessary to support an affirmative determination. It indicates that in certain circumstances, such as whenthe industry is in very poor condition, very little change in condition may be necessary.128 It alsoexpressly states that “a separate determination regarding current material injury is not necessary.”129 Similarly, the legislative history of the “material injury” standard applicable to original investigationsindicates that the Commission must evaluate impact in the context of overall market conditions, ratherthan by reference to fixed quantitative standards:

130 S. Rep. 96-249 at 88 (1979); accord, H.R. Rep. 96-317 at 46 (1979). 131 19 U.S.C. §§ 1675a(a)(5), 1677(7)(E)(ii), 1677(7)(F)(ii). 132 United States Steel Group v. United States, 96 F.3d 1352, 1362 (Fed. Cir. 1996). 133 Angus Chemical Co. v. United States, 140 F.3d 1478, 1485 (Fed. Cir. 1998). The domestic industry’s“economic condition per se” is also relevant in five-year reviews; the SAA instructs the Commission to consider,among other factors, whether the industry is in a “weakened state” and therefore vulnerable to material injury. SAAat 885. 134 See 19 U.S.C. §§ 1675a(a)(4), 1677(7)(C)(iii).
24
It is expected that in its investigation the Commission will continue to focus on theconditions of trade, competition, and development regarding the industry concerned. Forone industry, an apparently small volume of imports may have a significant impact on themarket; for another, the same volume might not be significant.130
Moreover, the statute emphasizes that “[t]he presence or absence of any factor which the Commission isrequired to consider. . . shall not necessarily give decisive guidance” to the Commission in makingdeterminations in either five-year reviews or original investigations.131
The case law has also emphasized the lack of fixed standards as to what amount of change inindustry condition is necessary to constitute “material injury.” The Federal Circuit has explained that:
In the end, of course, the factual conclusions of each commissioner will drive the legalconclusion he or she reaches, namely whether the requisite injury has been shown. Theinvitation to employ such diversity in methodologies is inherent in the statutesthemselves, given the variety of the considerations to be undertaken and the lack of anyCongressionally mandated procedure for assessment of the statutory tests.132
The Federal Circuit subsequently observed that in original investigations, “one cannot dispose of the casewithout taking into account the entire condition of the industry, both its economic condition per se, andthe overall competitive condition including imports.”133 Because any determination concerning impact orlikely impact requires a factual analysis of many discrete factors, none of which is necessarilydispositive,134 the weight given to any individual factor is a discretionary decision for each Commissioner.
In light of these authorities, our determinations in these reviews have not been based on whethersome fixed level of change in the domestic industry’s condition is likely upon revocation of the ordersunder review. Instead, we examine all pertinent conditions of competition and trade in determiningwhether the likely impact of subject imports will meet the statutory standard of materiality.
B. Findings in the Original Investigations
1. Conditions of Competition and the Business Cycle
In the original determinations, all six Commissioners found the following conditions ofcompetition relevant to their analysis: (1) rebar is primarily used for the reinforcement of concretestructures, and demand for rebar is tied to construction trends; (2) there are at best limited substitutes forrebar; (3) rebar is generally regarded as a commodity product, and rebar of the same grade anddimensions is generally interchangeable regardless of origin; (4) rebar is produced to standardspecifications; (5) price is an important factor in purchasing decisions; (6) differing rebar sizes andlengths tend to predominate in different uses; (7) both domestic and imported rebar sales in the U.S.market primarily take place through distributors, service centers, and fabricators; (8) reportedtransportation costs for domestic rebar shipments ranged from 5 percent to 10 percent of the total cost of

135 USITC Pub. 3425 at 18-19, and 27. 136 USITC Pub. 3425 at 19, 27; Confidential Opinion at 24, 38. 137 USITC Pub. 325 at 19-20, 27-28; Confidential Opinion at 27-29, 38-39. 138 USITC Pub. 3440 at 8, 12. 139 USITC Pub. 3425 at 20, 28; Confidential Opinion at 28, 40, citing to 2000 Staff Report at Tables V-6 and V-7. 140 USITC Pub. 3425 at 20-21, 28-29; Confidential Opinion at 27-28, 40-41. 141 USITC Pub. 3440 at 8, 13.
25
rebar, and inland transportation costs for subject imports ranged from 1.5 percent to 18.0 percent of thetotal cost; (9) shipments of rebar were concentrated within 250 miles of the producing mill or port ofentry; and (10) while imports of rebar are generally excluded from federal and state projects subject to“Buy American” laws, domestic suppliers typically charge the same prices for all products.135 In addition,for both the national and regional markets, apparent consumption rose from 1998 to 1999, and thendeclined slightly in 2000.136
2. Volume
In the original determinations, five of the six Commissioners found that the volume of cumulatedsubject imports from Belarus, Indonesia, Korea, Latvia, Moldova, Poland, and Ukraine in theregion/nation was significant. They noted that the volume of cumulated imports and subject importmarket share increased from 1998 to 1999 but decreased in 2000. They attributed the fact that the volumeand market share of subject imports declined significantly during the latter half of 2000 to the filing of thepetitions in June of that year.137
In finding that Chinese subject imports threatened the regional industry with material injury,Chairman Koplan and Vice Chairman Okun noted that although Chinese subject imports only began toenter the regional market in 1999, Chinese subject imports penetrated the U.S. market very rapidly,increasing their share of the regional market. In finding that subject imports from China threatened thedomestic industry, Commissioners Miller, Hillman, and Devaney similarly found that Chinese subjectimports penetrated the U.S. market very rapidly.138
3. Price Effects
In the original investigations, the six Commissioners found that the cumulated subject importsdepressed or suppressed prices for the domestic like product in the regional/national market to asignificant degree. In so doing, they found that rebar was a commodity product and that price was animportant factor in purchasing decisions. They noted that subject imports undersold the domestic productin virtually all price comparisons, with margins ranging from *** percent to *** percent.139 They furthernoted that AUVs for subject imports were much lower than AUVs for the domestic like product. Moreover, they found that, although prices for both the domestic like product and subject importsdeclined over the period of investigation, the decline in domestic prices exceeded the decrease in rawmaterial costs for the same period. Finally, they found that several confirmed lost sales and lost revenueallegations were due to the lower prices of the subject imports.140
With respect to China, the Commissioners found that subject imports from China undersold thedomestic like product in the region/nation in all quarterly price comparisons. They found that Chinesesubject imports’ AUVs were lower than AUVs for the domestic product sold in the region/nation.141

142 USITC Pub. 3425 at 21-23, 29-30, Confidential Opinion at 29-30, 41-42. 143 USITC Pub. 3425 at 21-23, 29-30. 144 USITC Pub. 3425 at 21, 29. 145 19 U.S.C. § 1675a(a)(4). 146 USITC Pub. 3425 at 20. 147 CR/PR at II-1, CR at II-11, PR at II-8. 148 CR at II-15, PR at II-10. 149 CR at II-14, PR at II-10. 150 Domestic Interested Parties’ Posthearing Brief at Ex. I. 151 CR/PR at Table C-1. 152 CR/PR at Table C-1. 153 CR at II-11, PR at II-8.
26
4. Impact
In the original investigations, all six Commissioners found the regional/national industry wasmaterially injured by reason of cumulated subject imports due to the volume of imports, their relativelyhigh market penetration, the effect of the dumped imports on prices, and the effect of dumped imports onthe condition of the regional or national industry.142 The Commission found that, despite increasedconsumption and U.S. shipments, the domestic industry lost market share, its sales values fell over theperiod examined due to a drop in unit values, and operating income, operating margin, and capitalexpenditures fell significantly.143 The Commission linked these marked declines in key financialindicators to price declines caused by the subject imports.144
C. Conditions of Competition and the Business Cycle
In evaluating the likely impact of the subject imports on the domestic industry, the statute directsthe Commission to consider all relevant economic factors “within the context of the business cycle andconditions of competition that are distinctive to the affected industry.”145
The following conditions of competition are relevant to our determinations in these reviews.U.S. Demand. As was the case in the original investigations, demand for rebar depends upon the
level of construction activity in the United States, which in turn generally depends on the health of theU.S. economy.146 Major end-use products requiring rebar include roads and bridges, commercial andindustrial construction, and public construction.147 Rebar accounts for a relatively small percentage of thetotal cost of end-use products.148 While there are reported substitutes for rebar, actual substitution islimited by end use.149
The United States is the fourth largest market for rebar in the world.150 Apparent U.S.consumption of rebar increased almost every year during the period of review, with the sharpest increaseoccurring between 2005 and 2006. Apparent U.S. consumption was 7.7 million short tons in 2001, 7.4million short tons in 2002, 8.4 million short tons in 2003, 8.7 million short tons in 2004, 8.9 million shorttons in 2005, and 9.9 million short tons in 2006.151 From 2001 to 2006, apparent U.S. consumption grewby over 2.2 million short tons, an increase of 27.7 percent.152 Explanations offered for the increase indemand during the review period included a strong economy and strong market demand due to residentialand nonresidential construction activity.153
While the parties agree that demand for rebar in the United States has been at very high levels,the parties disagree as to whether demand for rebar in the United States will continue to grow over thenext one to two years. The domestic interested parties project that demand will soften due to the recent

154 Hearing Transcript at 72-76. 155 LM’s Posthearing Brief at 3-5, Mittal’s Prehearing Brief at 12. 156 CR at II-13, PR at II-8. 157 CR at II-13, PR at II-8-II-9. 158 MSW’s Posthearing Brief at 5-10, Attachments 1, 2, 4, and 6; CR at IV-92-93. 159 CR at IV-82, PR at IV-50. 160 CR at IV-82, PR at IV-50. 161 CR at IV-82, PR at IV-50. 162 CR at II-15, PR at II-8. 163 CR/PR at Table I-1.
27
decline in residential construction, which they argue will lead to a decline in the nonresidentialconstruction spending within six to nine months.154 In contrast, respondent interested parties assert thatU.S. demand will continue to grow over the next few years. Although respondents acknowledge thatresidential construction declined slightly in 2007, they disagree that this decline will also occur in thenonresidential construction sector. They emphasize that the decline in residential construction is due tosubprime lending difficulties, not to the overall health of the U.S. economy.155
The record indicates that U.S. demand is likely to remain fairly steady for the foreseeable future. Although domestic producers argue that the decline in residential construction is likely to be followedwithin six to nine months by a decline in nonresidential construction, that predicted decline innonresidential construction is not apparent at this time. The record shows that spending for residentialconstruction declined in April 2006 and continued to decrease in most months through April 2007. On ayear-to-year basis, residential construction spending was 14.1 percent lower in April 2007 than in April2006.156 In contrast, spending for nonresidential construction, the largest segment of the rebar market,increased in most months from January 2006 to April 2007. On a year-to-year basis, nonresidentialconstruction spending increased by 12.7 percent between April 2006 and April 2007.157 Moreover,various trade publications and public statements by domestic industry officials indicate that nonresidentialconstruction generally is expected to remain very strong within the reasonable foreseeable future.158 Accordingly, while there may be occasional fluctuations, we find that overall demand for rebar will likelyremain fairly steady for the reasonably foreseeable future.
Global Demand. Global consumption of rebar increased by *** percent between 2001 and 2006,primarily due to rapid consumption growth in East and Southeast Asia, followed by the Commonwealthof Independent States (“C.I.S.”) countries and Europe.159 According to published trade data, globalconsumption of rebar is forecast to increase within the reasonably foreseeable future,160 driven especiallyby demand in East and Southeast Asia and “other world” markets.161
Consistent with published data on demand, four of seven U.S. producers, 11 of 17 importers, and21 of 22 purchasers reported increases in demand. Factors cited for the growth in demand were a strongglobal economy accompanied by increased construction worldwide. Brazil, China, India, and Russiawere cited as countries where the demand for rebar has grown rapidly.162
Supply. Throughout the period of review, the domestic industry was the largest supplier of rebarto the U.S. market, although its share of apparent U.S. consumption fluctuated. The domestic industry’sshare was 77.6 percent in 2001, 88.1 percent in 2003, 77.2 percent in 2004, 83.6 percent in 2005, and75.1 percent in 2006.163
Since the original investigations, there have been several consolidations and acquisitions in thedomestic industry. As a result, eight firms now own and operate the twenty-five U.S. rebar mills,

164 CR/PR at III-1; 2001 Confidential Staff Report at III-1. 165 CR at I-34, PR at I-28. 166 U.S. production capacity for rebar increased from 7.9 million short tons in 2001 to 8.0 million short tons in2002 and 8.4 million short tons in 2003. In 2004, U.S. rebar production capacity declined slightly to 8.1 millionshort tons, but increased to 8.4 million short tons in 2005 and 8.6 million short tons in 2006. CR/PR at Table III-2. 167 U.S. rebar production increased from 6.1 million short tons in 2001 to 6.4 million short tons in 2002 and 7.5million short tons in 2003. In 2004, U.S. rebar production declined to 7.1 million short tons, but increased to 7.5 million short tons in 2005 and 7.7 million short tons in 2006. CR/PR at Table III-2. 168 CR/PR at Table III-2. 169 CR at III-7-III-8, PR at III-5. 170 CR/PR at Table I-20-21. 171 CR/PR at Table IV-3. 172 CR/PR at Table I-15. 173 CR/PR at Table I-12. 174 As an economic consultant testified on behalf of the respondents, “with respect to traders, they are indeedinterested in maximizing their profit and the price” and “whether it is the trader or the internal trading company,they’re looking for profitability and they will follow, I think the relative prices . . . .” Hearing Transcript at 287(Button). As this witness testified, even where a foreign supplier (such as Mittal and its affiliate Arcelor Mittal) hasan in-house trading operation, it makes spot sales at the most advantageous prices like other traders. HearingTranscript at 286-87. Another respondent witness similarly testified that “trading houses live by differentials. Theyfind a market that is particularly appealing and they sell steel into it to maximize their profits.” Hearing Transcript at
(continued...)
28
compared to 14 firms in the original investigations.164 Rebar producers located in nonsubject countriesnow have ownership interests in three U.S. firms. Gerdau’s parent company is owned by Gerdau, S.A.,located in Brazil; Border Steel was acquired by Luxembourg-based Arcelor Mittal from its Mexicanparent company Grupo Villacero, in 2007; and TAMCO is *** owned by Tokyo Steel ManufacturingCo., a Japanese producer.165 During the period of review, U.S. producers’ production capacity increasedevery year, with the exception of a small decline in 2004.166 U.S. producers’ rebar production followed asimilar trend.167 U.S. producers’ capacity utilization peaked at 90.1 percent in 2005, but was noticeablyhigher in the latter part of the period (2003-06), as production increased at a much greater rate thancapacity.168 Domestic producers report that they will begin or have begun adding capacity to theirexisting mills in 2007.169
Nonsubject imports were the next largest supplier to the U.S. rebar market after the domesticindustry. Nonsubject imports’ share of apparent U.S. consumption declined from 20.1 percent in 2001 to16.0 percent in 2002 and 11.3 percent in 2003. Nonsubject imports’ share increased to 21.4 percent in2004, decreased to 15.9 percent in 2005, and increased to 24.9 percent in 2006.170 Turkey, which is alsosubject to an antidumping duty order, was the largest individual source of nonsubject imports. In 2006,the quantity from other nonsubject sources combined was roughly equal to the quantity from Turkey. Turkey was responsible for the bulk of the increase in nonsubject import volume over the latter portion ofthe period of review, as imports of Turkish rebar increased from 206,540 short tons in 2002 to 1.2 millionshort tons in 2006.171
Subject imports’ share of the U.S. market ranged from a high of 2.3 percent in 2001 to less than0.1 percent in 2006. During the period of review, Latvia was the predominant supplier of subject rebarimports to the U.S. market. The annual market penetration of each individual subject country other thanLatvia has been under one percent since 2002.172 Exports of rebar to the United States are predominantlyarranged and transported by global trading companies,173 which generally sell on the spot market and seekto maximize prices by selling into the most advantageous market.174 175

174 (...continued)291 (Phelps). As an official for one of the domestic producers explained, traders “are just speculating, looking forthe best price they will get to bring it in and then move it after that . . . .” Hearing Transcript at 90 (Parrish). Seealso Hearing Transcript at 89-90 (Koch). 175 Chairman Pearson and Commissioner Okun do not join this statement as they do not find it a significantcondition of competition. 176 62 Fed. Reg. 18748 (Apr. 1997). This order is based on a regional industry finding by the Commission.Concrete Reinforcing Bars From Turkey, Inv. 731-TA-745 (Final), USITC Pub. 3034 (April 17, 1997). 177 Steel, Inv. No. TA-201-73, USITC Pub. 3479 (Dec. 2001). 178 See 67 Fed. Reg. 10553, 10589 (Mar. 7, 2002). 179 CR at I-13, PR at I-12. 180 CR at I-23-II-25, PR at I-20-I-21. 181 CR at I-24-II-25, PR at I-20-I-21. 182 CR/PR at Table II-6. 183 CR at II-25-II-26, PR at II-20-II-21 184 CR at II-19-II-20, PR at II-14. 185 Domestic Interested Parties’ Prehearing Brief at 24.
29
During the period of review, there were a number of trade remedy measures in place in the U.S.market that may have contributed to fluctuations in U.S. import levels. Since April 1997, there has beenan antidumping duty order on imports of rebar from Turkey.176 In addition, in 2001, certain steelproducts, including rebar, were the subject of a global safeguards investigation under section 202 of theTrade Act of 1974.177 As a result of the Commission’s affirmative determinations in that investigation,the President imposed an additional ad valorem tariff on imports of rebar, including all the subjectcountries in these reviews. The remedy resulting from this proceeding with respect to rebar was theimposition of an additional tariff of 15 percent for the period of March 20, 2002 through March 19, 2003,an additional tariff of 12 percent for the period of March 20, 2003 through March 19, 2004, and anadditional tariff of 9 percent for the period of March 20, 2004 through March 19, 2005.178 The safeguardduties, however, were terminated on December 4, 2003.179
Interchangeability. Rebar is a highly fungible, commodity product, and rebar of the same gradeand dimensions is generally interchangeable regardless of country of origin. Rebar generally ismanufactured to conform with ASTM standards.180 Both domestic rebar and foreign produced rebar aresold in common sizes and lengths.181 The majority of domestic producers, importers, and purchasersreported that domestic and imported rebar are always or frequently used interchangeably.182
Differing rebar sizes and lengths tend to predominate in different uses. Small rebar sizes (sizes#3-#5) tend to be used in light construction applications (e.g. residences, swimming pools, patios, andwalkways). All sizes and lengths are used in heavy construction (e.g. high rise buildings, commercialfacilities, industrial structures, bridges, roads, etc.), but larger sizes (sizes #6 and above) and longerlengths (e.g. 60 feet ) are exclusively used in heavy construction applications. Rebar is thus sold in acontinuum of sizes, and there generally is an overlap in the sizes of subject imports and the domesticproduct sold in the U.S. market.183
Although imports of rebar are generally excluded from federal and state projects subject to “BuyAmerican” laws, the record indicates that a majority of rebar purchasers have no “Buy American” ordomestic preference policies.184 It does indicate, however, that domestic suppliers charge the same pricesfor all products, regardless of any “Buy American” or domestic preference policies.185

186 CR/PR at Table II-5 187 CR/PR at V-1, and Figure V-1. 188 Chairman Pearson does not join this section. See Separate and Dissenting Views of Chairman Daniel R.Pearson, Vice Chairman Shara L. Aranoff, and Commissioner Deanna Tanner Okun Regarding Latvia and Poland;Separate and Dissenting Views of Chairman Daniel R. Pearson and Commissioner Deanna Tanner Okun RegardingBelarus, China, Indonesia, and Moldova; Separate and Dissenting Views of Chairman Daniel R. Pearson RegardingUkraine. 189 Commissioner Okun does not join this section. See Separate and Dissenting Views of Chairman Daniel R.Pearson, Vice Chairman Shara L. Aranoff, and Commissioner Deanna Tanner Okun Regarding Latvia and Poland;Separate and Dissenting Views of Chairman Daniel R. Pearson and Commissioner Deanna Tanner Okun RegardingBelarus, China, Indonesia, and Moldova; Separate Views of Commissioner Deanna Tanner Okun RegardingUkraine. 190 As discussed above, Commissioner Williamson does not cumulate Korea with the other subject countries, andreaches a negative determination with respect to Korea. He joins the following discussion, except his analysiscovers only Belarus, China, Indonesia, Latvia, Moldova, Poland, and Ukraine. He does not join in the Korea-specific elements of the following discussion. 191 CR/PR at Table I-1. As stated in the conditions of competition section, Latvia was the predominant supplier ofsubject imports during the review period. Id. 192 Commissioner Williamson notes that cumulated subject imports from Belarus, China, Indonesia, Latvia,Moldova, Poland, and Ukraine were 57,622 short tons in 2001, 48,746 short tons in 2002, 50,522 short tons in 2003,129,352 short tons in 2004, 36,706 short tons in 2005, and 133 short tons in 2006. Subject import market share was0.8 percent in 2001, 0.7 percent in 2002,0.6 percent in 2003, 1.5 percent in 2004, 0.4 percent in 2005, and less than
(continued...)
30
Other Factors. Price was cited by a majority of purchasers to be the most important factor inpurchasing decisions. Other factors cited included availability, delivery/service, and quality.186
As was true at the time of the original investigations, raw material costs are an important part ofthe final cost of rebar. Raw material costs increased from 43.0 percent of the cost of goods sold in 2001to 61.6 percent in 2003, before declining to 58.2 percent in 2005, and then increasing to 59.5 percent in2006. Steel scrap is the primary component in raw material costs. The cost of steel scrap rose overallfrom $68 per ton in January 2001 to $251 per ton in March 2004. From March 2004 through the end of2006, steel scrap prices fluctuated widely, although they remained substantially higher than in 2001-2003. Steel scrap prices increased in the first months of 2007, reaching a high of $305 per short ton in March2007.187
D. Revocation of the Antidumping Duty Orders on Cumulated Subject Imports fromBelarus, China, Indonesia, Korea, Latvia, Moldova, Poland, and Ukraine Would BeLikely To Lead To Continuation or Recurrence of Material Injury188 189 190
1. Likely Volume of Subject Imports
During the period examined in these reviews, the volume and market share of subject imports felldramatically as a result of imposition of the orders. The volume of cumulated subject imports declinedfrom 179,061 short tons in 2001 to 48,746 short tons in 2002 and 50,522 short tons in 2003, then rose to129,352 short tons in 2004. The volume of subject imports declined in 2005 to 42,222 short tons andthen declined further to just 133 short tons in 2006. The market share of subject imports followed asimilar trend, decreasing from 2.3 percent in 2001 to 0.7 percent in 2002 and 0.6 percent in 2003, andthen increasing to 1.5 percent in 2004, before falling to 0.5 percent in 2005. As subject imports werevirtually nonexistent in the U.S. market in 2006, subject market share was less than 0.05 percent.191 192

192 (...continued)0.05 percent in 2006. CR/PR at Table I-1. 193 CR at IV-33, PR at IV-22. 194 CR at IV-58, PR at IV-35. 195 See generally CR at IV-20-78, PR at IV-16-IV-47 for foreign industry coverage. 196 CR/PR at Tables IV-10, IV-22, IV-29, IV-33, and C-1. 197 CR/PR at Table IV-10 198 CR/PR at Table IV-22. 199 CR/PR at Table IV-26. 200 CR/PR at Table IV-33. 201 CR/PR at Table IV-16. 202 CR/PR at Table IV-18 and C-1. 203 CR/PR at Table IV-17.
31
In these reviews, the failure of certain subject foreign producers to provide requested data hasprevented assembling a single consistent and comprehensive set of capacity data for subject foreignproducers of rebar. The Commission received a questionnaire response from BMZ, the sole rebarproducer in Belarus; LM, the sole producer of rebar in Latvia; MSW, the sole producer of rebar inMoldova; and Mittal, representing over *** percent of rebar production in Ukraine. With respect toKorea, the Commission received a response from one subject producer, Hyundai, which accounted foronly *** percent of Korean rebar production in 2006.193 With respect to Poland, the Commissionreceived an incomplete response from CMCZ, which accounted for only *** percent of Polish rebarproduction in 2005.194 The Commission did not receive questionnaire responses from any subjectproducer in China or Indonesia.195 Therefore, in assessing subject producer capacity, production, capacityutilization and shipment patterns, we rely on questionnaire data, as well as available public data.
According to data received from subject producers in Belarus, Latvia, Moldova, and Ukraine,their combined capacity to produce rebar has increased substantially since the original investigations. The combined production capacity in these countries was *** short tons in 2006, which is equivalent to*** percent of apparent U.S. consumption and *** percent of U.S. production for the same year.196 Thesubject producers in Belarus, Latvia, Moldova, and Ukraine also reported relatively high capacityutilization rates throughout the period examined in these reviews. BMZ’s capacity utilization ratesranged between a low of *** percent in 2002 and a high of *** percent in 2001.197 LM’s capacityutilization rates ranged between a low of *** percent in 2001 and a high of *** percent in 2006.198 MSW’s capacity utilization rates ranged between a low of *** percent in 2002 and a high of *** percentin 2005.199 Mittal’s capacity utilization rates were reported to be over *** in 2001, 2002, 2003, and 2006,and over *** percent in 2004 and 2005.200
Based on Hyundai’s questionnaire response and published trade data, Korean production capacityincreased from 9.7 million short tons in 2000 to *** short tons in 2006.201 Korean production capacity in2006 was equivalent to *** percent of apparent U.S. consumption and *** percent of U.S. production forthe same year. Based on published trade data, capacity utilization rates for the Korean rebar industryranged between *** percent and *** percent from 2001 to 2005. In 2006, capacity utilization was ***percent.202 Hyundai’s reported capacity utilization rates *** over the period of review, *** from ***percent in 2001 to *** percent in 2003, then *** to *** percent in 2004 and *** percent in 2005. In2006, Hyundai’s reported capacity utilization rate was *** percent.203
As noted above, only one Polish subject producer, CMCZ, responded to the Commission’squestionnaire response, and it only provided data for 2004-06. According to CMCZ’s questionnaire

204 CR/PR at Table IV-29. 205 CR/PR at Table IV-29. 206 CR at IV-62-63, PR at IV-36-37, and CR/PR at C-1. 207 CR/PR at Table IV-12. 208 CR/PR at Tables IV-13 and C-1. 209 CR at IV-31, PR at IV-21. 210 CR/PR at Tables IV-15 and C-1. During the original investigations, the Commission identified 13 firms thatproduced rebar in Indonesia, but only one returned a completed questionnaire to the Commission. The respondingproducer accounted for approximately *** percent of total production of rebar in Indonesia in 2000. Its reportedproduction capacity was *** short tons in 2000. CR at IV-31, PR at IV-21. 211 CR/PR at Tables IV-10 (Belarus), IV-14 (China), IV-20 (Korea), IV-22 (Latvia), IV-26 (Moldova), IV-31(Poland), and IV-35 (Ukraine). There is no available information with respect to Indonesia. 212 During the review period, exports from Korea ranged from 13,316 short tons in 2003 to 474,175 short tons in2005. China’s exports ranged from 387,606 short tons in 2002 to 3.7 million in 2006. CR/PR at Table IV-48. 213 CR/PR at Table IV-11.
32
response, its production capacity increased from *** short tons in 2004 to *** short tons in 2006.204 CMCZ’s reported capacity utilization rates fluctuated, but declined overall from *** percent in 2001 to*** percent in 2006.205 According to published trade data, the total capacity for the Polish rebar industrywas approximately *** short tons in 2006, which is equivalent to *** percent of apparent U.S.consumption and *** percent of U.S. production. Additionally, Polish rebar capacity is expected toincrease within the foreseeable future. The Celsa group acquired Huta Ostroweic in 2003 and planned tomodernize its facilities to increase total steel production. Finally, Arcelor is bringing a new mill on linein Poland which is expected to have *** short tons of rebar production by late 2007.206
According to the ***, Chinese rebar production capacity increased from *** short tons in 2005 to*** short tons in 2006. Rebar production in China also increased from *** short tons in 2005 to ***short tons in 2006, indicating *** percent capacity utilization in 2005 and *** percent capacity utilizationin 2006.207 Total Chinese capacity in 2006 was equivalent to *** percent of apparent U.S. consumptionand *** percent of U.S. production for the same year. Unused Chinese capacity in 2006 of *** short tonsis equivalent to *** percent of apparent U.S. consumption and *** percent of U.S production for thesame year. Chinese capacity is likely to increase over the next several years, as Chinese production isprojected to increase by *** percent of its 2006 level by 2011.208 With respect to Indonesian subject producers, which did not participate in these reviews, ***estimates Indonesian rebar capacity is to be over *** short tons.209 Indonesia’s capacity is approximatelyequivalent to *** percent of apparent U.S. consumption and *** percent of U.S. production in 2006.210
We note that the reported capacity utilization rates in the subject countries are relatively high butshow some unused capacity, particularly with respect to China and on a cumulated basis. In addition tothis unused capacity, subject foreign producers likely would be able to increase significantly theirshipments to the United States within the reasonably foreseeable future by shifting shipments from otherexport markets. Subject countries rely in large measure on export markets and have demonstrated theirability to shift sales with relative ease from their home markets to export markets and between exportmarkets.211 Each of the countries, with the exception of China and Korea, currently exports a sizeableportion of its rebar production. While China’s and Korea’s exports as a share of production are smallerthan the other subject countries, each nonetheless exported significant quantities of rebar during theperiod of review.212 Additionally, the record indicates that China’s exports as a share of production havegrown rapidly over the period of review, from 1.2 percent in 2000 to *** percent in 2006.213 Althoughthere are no available data with respect to Indonesia, exports from all other subject countries totaled ***

214 Calculated from CR/PR at Tables IV-48, IV-10 (Belarus), IV-26 (Moldova). 215 Calculated from CR/PR Tables IV-10, IV-26, IV-48 and C-1. 216 Commissioner Williamson notes that in 2006 total exports for Belarus, China, Latvia, Moldova, Poland andUkraine were *** short tons, equivalent to *** percent of apparent U.S. consumption and *** percent of U.S.production. CR/PR at Tables IV-10, IV-26, IV-48, and C-1. 217 Reported AUVs in the United States and subject countries in 2006 were as follows: United States $522,Belarus $***, Korea $***, Latvia $***, Moldova $***, Poland $***, and Ukraine $***. CR/PR at Tables C-1, IV-10, IV-17, IV-22, IV-26, IV-29, IV-33. According to ***, in 2006, U.S. prices for rebar ranged from $*** to $***,while Chinese prices for rebar ranged from $*** to $*** per short ton and Korean prices ranged from $*** to $***. CR/PR at Table IV-46. There are no available pricing data for the Indonesian rebar market. 218 We recognize that AUV comparisons do not constitute direct price comparisons. Moreover, we are aware thatthe valuation of export shipments excludes transportation and other charges necessary to make direct comparisonsbetween U.S. producers’ sales in the United States and export shipments by those subject countries that providedcomplete shipment data. Nonetheless, the sheer magnitude of the differences in AUVs between U.S. producers’U.S. shipments and subject producers’ average export shipments (including modest volumes exported to the UnitedStates) is striking: $*** per short ton in 2001; $*** per short ton in 2002; $*** per short ton in 2003; $*** per shortton in 2004; $*** per short ton in 2005; and $*** per short ton in 2006. Calculated from Table C-1 (U.S. producers'U.S. shipments) and Tables IV-10, IV-22, IV-26, and IV-33 (total export shipments from Belarus, Latvia, Moldova,and Ukraine, respectively). 219 CR/ PR at Table IV-47. 220 CR/ PR at Tables IV-46 and IV-47. 221 CR/PR at Table I-12, Table IV-3.
33
short tons in 2006,214 which is equivalent to *** percent of apparent U.S. consumption and *** percent ofU.S. production for the same year.215 216
The attractiveness of the U.S. market due to its large size, steady demand, and high prices wouldprovide an incentive to shift exports to the United States in the event of revocation of the orders. Becauserebar is a highly fungible, commodity product, AUV data in these reviews provide a reasonable basis forprice comparisons. The record indicates that AUVs in the United States were higher than in the subjectcountries (except for Poland) during the period of review.217 Moreover, AUV data collected in thesereviews indicate that subject producers’ export shipment AUVs were significantly lower than domesticproducers’ commercial shipment AUVs. This substantial price gap indicates that the attractive, easilyaccessible U.S. market would be faced with a significant volume of low-priced subject imports followingrevocation.218
We note that certain published trade data indicate that prices in a few markets, in particular theEU, Russia, and the Middle East, were reportedly higher in some instances than prices in the UnitedStates.219 U.S. prices, however, are significantly higher in comparison with other important worldmarkets such as China and the Far East.220 Furthermore, the attractiveness of the U.S. market isunderscored by the actions of global trading companies, which, as discussed in the conditions ofcompetition section, seek to maximize prices by selling into the most advantageous markets. During theperiod of review, global trading companies facilitated entry into the U.S. market a sizeable amount ofnonsubject imports, including imports from a number of EU members, Russia, and Egypt,notwithstanding reportedly higher prices in the EU, Russia, and the Middle East.221
In addition, subject imports would be able to penetrate the U.S. market with relative ease if theorders were revoked. Much of the imported product would likely be sold to distributors and fabricators,which in turn would allow imports to be easily distributed to end users throughout the United States.

222 *** Questionnaire Response at II-16c. 223 CR/PR at V-3. 224 CR/PR at Table II-6. 225 Hearing Transcript at 90 (Parrish). 226 CR/PR at Tables V-1-V-12. 227 CR/PR at Table I-1. 228 CR/PR at Tables V-13. 229 CR/PR at Tables V-13. 230 CR/PR at Tables I-1, IV-17 and IV-22.
34
Because distributors buy for inventory, subject producers likely would be able to sell various grades andsizes of rebar in larger amounts than if they sold directly to end users for a particular job. Indeed, ***.222
Given subject producers’ reliance on export markets, their substantial cumulated export volumes,the substantial increase in cumulated subject exports to the United States in the original investigations,cumulated subject producers’ substantial capacity, and the attractiveness and accessibility of the U.S.market, subject imports to the United States likely would increase significantly following revocation ofthe antidumping duty orders. Consequently, based on the record in these reviews, we conclude that thevolume of cumulated subject imports likely would increase to a significant level and regain significantU.S. market share if the orders were revoked.
2. Likely Price Effects
As discussed above, rebar is a highly fungible, commodity product for which price is the mostimportant factor in purchasing decisions. Moreover, price is generally set on a transaction by transactionbasis,223 and the domestic like product and subject imports are viewed as highly interchangeable.224 Asdiscussed in the conditions of competition, sales of imports to the U.S. market are arranged by globaltrading companies that sell on a spot basis and are “looking for the best price to bring it [rebar] into” themost advantageous markets.225
Prices for domestic rebar increased substantially for all products between 2001 to 2006, with thelargest increases in price occurring in 2004.226 This increase reflects the effects of the antidumping dutyorders, as subject import volumes were very low throughout the period of review.
We find that the significantly increased volumes of cumulated subject imports followingrevocation of the orders would likely have significant negative price effects on the domestic like product.In these reviews, price comparisons between the domestic product and subject product are limited largelydue to the diminished volumes of subject imports following imposition of the orders.227 Some pricingdata were reported for imports from Korea and Latvia, although no sales from these countries werereported in 2006. With respect to Korea, the data show that the Korean product undersold the domesticlike product in almost all possible comparisons.228 With respect to Latvia, the data show that the Latvianproduct oversold the domestic product in most available price comparisons.229 The record indicates thatthe AUVs for U.S. shipments of imported rebar from Korea were lower than domestic AUVs and that theAUVs for U.S. shipments of subject imports from Latvia were generally higher than domestic AUVs.230 Given the low volume of subject imports and the restraining effects of the orders, we place little weighton these price comparisons, which are likely not indicative of prices after revocation of the orders.
As an indicator of current relative prices, the record indicates that export shipment AUVs ofproducers in Belarus, Latvia, Moldova, and Ukraine were significantly lower than U.S. producers’

231 Similar data are not available for China and Indonesia. The Commission obtained only partial AUV data withrespect to the Korean and Polish industries. 232 CR/PR at Tables I-1, IV-10, IV-22, IV-26 and IV-33. 233 CR/PR at Tables I-1, IV-10, IV-22, IV-26 and IV-33. 234 CR/PR at Table I-1. 235 CR/PR at Table I-1. 236 CR/PR at Table I-1. 237 CR/PR at Table I-1. 238 CR/PR at Table I-1. 239 CR/PR at Table I-1. 240 CR/PR at Table I-1. 241 CR/PR at Table I-1.
35
commercial shipment AUVs.231 Questionnaire responses show that domestic producers’ AUVs forshipments throughout the entire U.S. market were $522 per short ton, while the average AUV for rebarshipped by subject producers to non-U.S. markets in 2006 averaged $*** per short ton.232 The price gapwas at its highest level in 2006, at $*** per short ton. A similar price gap was present throughout thereview period and the original investigation.233 This substantial price gap indicates a likelihood ofunderselling by subject imports following revocation. There is an incentive for subject producers to shipto the U.S. market, because subject producers likely would be able to receive a higher price in the U.S.market relative to many third-country markets, even as they undersold the U.S. product to increase sales.
In light of the importance of price in the market, the fungible nature of the product, the negativeprice effects of low-priced imports in the original investigations, the pervasive underselling by subjectimports during the original investigations, and the incentive for subject producers to make sales and toobtain market share in the relatively high-priced, large, stable, and accessible U.S. market, we find itlikely that, if the orders were revoked, significant volumes of cumulated subject imports wouldsignificantly undersell the domestic like product to gain market share and would have significantdepressing or suppressing effects on the prices of the domestic like product within a reasonablyforeseeable time.
3. Likely Impact of the Subject Imports on the Domestic Industry
Immediately following the imposition of the orders, an improvement in the condition of thedomestic industry was inhibited, in part, by a decrease in demand from 2000 to 2002. U.S. shipmentsdecreased slightly from 6.3 million short tons in 2000 to 6.0 million short tons in 2001, but then increasedto 6.1 million tons in 2002.234 Domestic production decreased from 6.4 million short tons in 2000 to 6.1million short tons in 2001, and then increased to 6.4 million tons in 2002.235 Employment levels likewisedecreased between 2000 and 2002.236 On the other hand, capacity utilization increased steadily from 76.8percent in 2000 to 79.5 percent in 2002.237 Net sales, in terms of quantity, decreased from 6.5 million in2000 to 6.2 million in 2001, and then increased to 6.4 million in 2002.238 The domestic industry’soperating profits grew from $45 million in 2000 to $110 million in 2001 but dropped to $66 million in2002.239 The domestic industry’s operating income margin improved from 2.5 percent in 2000 to 6.6percent in 2001, but declined to 4.0 percent in 2002.240
With the orders in effect, the domestic industry’s condition improved substantially after 2003, asU.S. demand increased dramatically and U.S. prices rose sharply.241 From 2003 to 2006, the domestic

242 CR/PR at Table I-1. 243 CR/PR at Table I-1. 244 CR/PR at Table I-1. 245 CR/PR at Table I-1. 246 CR/PR at Table I-1. 247 CR/PR at Table III-12. 248 CR/PR at V-1, and Figure V-1. 249 Commissioner Williamson does not join this conclusion with respect to Korea.
36
industry generally experienced high levels of productivity, net sales, and workers employed.242 Capacityutilization rates fluctuated, but remained near 90 percent.243 The unit values of U.S. shipments of rebarrose from $282 per short ton in 2003 to $522 per short ton in 2006.244
Although the domestic industry’s raw material prices increased significantly over the period ofreview, the unit values of U.S. shipments of rebar were able to outpace these increases in costs. Thedomestic industry’s profitability increased in tandem with the rise in prices, as operating profits increasedfrom $66 million in 2003 to $828 million in 2006.245 The domestic industry’s operating margins alsoincreased from 3.1 percent in 2003 to 20.7 percent in 2006.246 At the same time, the domestic industry’scapital expenditures increased from $70 million in 2003 to $146 million in 2006.247 Given the domestic industry’s performance at the end of the period of review, we do not find thatthe domestic industry is currently in a vulnerable or weakened state as contemplated by the statute. Wenote that the domestic industry’s profitability at the end of the period of review can be attributed to thesharp increase in demand and prices and to the existence of the antidumping duty orders.
The industry’s continued healthy performance, however, is linked to the continuation of theantidumping duty orders. As discussed earlier in the conditions of competition, demand is anticipated toremain steady within the foreseeable future. While prices have risen sharply, this is primarily due to theincrease in raw material costs.248 For the reasons discussed above, we find that revocation of theantidumping duty orders would likely lead to significant increases in the volume of cumulated subjectimports at prices that would undersell the domestic like product and significantly suppress or depress U.S.prices. Despite high costs, the domestic industry would be forced to lower prices in order to competewith the increased volume of low-priced imports if the orders were revoked. Thus, if the orders wererevoked, the domestic industry’s profitability would likely decline significantly due to an injurious cost-price squeeze.
The likely price and volume declines also would have a significant adverse impact on theproduction, shipments, market share, sales, and revenue levels of the domestic industry. This reduction inthe industry’s production, sales, and revenue levels would have a direct adverse impact on the industry’sprofitability as well as its ability to raise capital and make and maintain necessary capital investments. Inaddition, we find it likely that revocation of the orders would result in employment declines for domesticfirms.
In light of the foregoing, we conclude that if the antidumping duty orders are revoked, cumulatedsubject imports from Belarus, China, Indonesia, Korea, Latvia, Moldova, Poland, and Ukraine wouldenter the U.S. market in such increased quantities and at such price levels as to cause price suppression ordepression, thus causing significant adverse impact on the domestic industry within a reasonablyforeseeable time.249

250 We note that domestic interested parties do not believe that imports of Korean rebar would have a discernibleadverse impact if the antidumping duty order on rebar from Korea were revoked. See e.g., Domestic InterestedParties Prehearing Brief at 50-51. 251 CR/PR at Table I-1. 252 See, e.g., Memorandum INV-Y-087 at Tables VII-4 and VII-5. See also CR at IV-37, PR at IV-23-24 (Duringthe Asian financial crisis, Korean ***). 253 CR/PR at Table I-1. 254 CR at IV-33, PR at IV-22. Hyundai accounted for *** percent of Korean production in 2006. 255 CR/PR at Table IV-18. 256 CR at IV-37, PR at IV-23. 257 CR/PR at Table IV-18. 258 Calculated from CR/PR Table IV-18. 259 CR/PR at Table IV-17.
37
E. Revocation of the Antidumping Duty Order on Subject Imports from Korea Is NotLikely To Lead to Continuation or Recurrence of Material Injury to the DomesticRebar Industry250
1. Likely Volume of Subject Imports
Subject imports from Korea declined steadily during the original investigation, from 527,080short tons in 1998 to 263,601 short tons in 2000.251 Korea’s export pattern in the original investigationappears to have been affected by the Asian financial crisis, which resulted in a decline in demand forrebar in the previously expanding Asian markets. The disruption in the Asian markets particularlyaffected producers in countries such as Korea, which experienced suppressed home market demand in1998 and 1999, with improved home market shipments in 2000.252 After the order was imposed, subjectimports from Korea fell to 118,469 short tons in 2001 and then remained out of the U.S. market with theexception of a shipment in 2005 of 5,516 short tons.253
In these current five year reviews, several factors support our conclusion that the volume ofsubject imports from Korea would likely not be significant if the order were revoked. Since the originalperiod of investigation, the Korean industry has eliminated capacity and Korea has become a net importerof rebar. Thus, the Korean industry has limited motivation to increase exports to the United States eitherby shifting shipments from its home market or from its modest exports that primarily serve the localAsian market. Moreover, demand in Asia has grown significantly and is projected to remain strong.
The Korean rebar industry is composed of seven or eight producers, of which the largest,Hyundai Steel Co. (“Hyundai”), submitted a foreign producer’s questionnaire response, participated at thehearing, and filed briefs.254 Specifically, Korean production capacity, while large, has decreased over theperiod of review. Korean rebar production capacity decreased during the period of review from *** shorttons to *** short tons.255 This reduction in capacity is due in part to Hyundai’s acquisition of Hanbo Steelduring the period of review and shutting down *** short tons of capacity at one facility and ***.256 Moreover, based on published trade data, capacity utilization of the Korean rebar industry was highthroughout the period of review.257 Between 2001 and 2005 capacity utilization ranged between ***percent and *** percent; in 2006, it was *** percent.258 Additionally, Hyundai reported its capacityutilization rates *** at high levels over the period of review, *** from *** percent in 2001 to *** percentin 2003, then *** to *** percent in 2004, and *** percent in 2005. In 2006, Hyundai’s reported capacityutilization rate was *** percent.259 The record indicates that Korean rebar producers could not meet home
260 CR/PR at Table IV-18. 261 CR/PR at Tables IV-16 and IV-19. 262 CR/PR at Table IV-19. 263 CR/PR at Table IV-16. 264 CR/PR at Tables IV-17 (Hyundai exported *** percent of its shipments to Asia in 2006) and IV-20. 265 CR at IV-82, PR at IV-49 (2007-2011 global consumption expected to increase in East and South East Asia,and other world markets). 266 CR/PR at Table IV-8. 267 CR/PR at Table IV-17. 268 CR/PR at Tables I-1 and IV-17. 269 CR at IV-42, PR at IV-24; and Hyundai Questionnaire Response at 10 (Question II-10). 270 CR at IV-34-38, PR at IV-23.
38
market demand over the period of review, notwithstanding their very high capacity utilization rates. Korea has been a net importer of rebar since 2002.260
While the record lacks information concerning anticipated capacity expansions, the recordindicates that Korea’s production is projected to increase over the next several years, from *** short tonsin 2006 to *** short tons in 2009.261 However, Korea’s consumption is anticipated to increase to an evengreater extent. *** projects that Korea will remain a significant net importer in the reasonably foreseeablefuture.262
As we noted in our respective analyses of whether to cumulate Korea with the other subjectcountries, most of Korea’s shipments serve its home market. While Korean subject producers exportedduring the period of review, exports from Korea accounted for only *** percent of the Korean industry’sproduction in 2006.263 To the extent that Korea exports rebar, it is focused primarily on supplying themarkets in Southeast Asia and in the Pacific.264 As the record indicates, rebar demand is likely toincrease, particularly in Southeast Asia. As such, Korean subject producers would likely continue todedicate a substantial portion of their modest exports to countries in that region if the order wererevoked.265
There were no reported inventories of rebar from Korea present in the U.S. market during theperiod of review.266 Inventories of the subject merchandise in Korea were at low levels relative toshipments throughout the period of review. The ratio of inventories to shipments in 2006 was ***percent, below the 2004 period peak of *** percent.267
In addition to the limited capability of the Korean rebar producers to resume shipping to theUnited States in significant quantifies, there is little incentive for the Korean producers to do so. As notedabove, the Korean home market is flourishing. At the same time, average unit values for rebar in Koreaand the United States are comparable, making it unlikely that Korean producers would divert theirshipments from their home market to take advantage of prices in the U.S. market.268 The potential forproduct shifting appears insignificant. For example, Hyundai reported that it *** to switch productionbetween rebar and other products, using the same equipment and labor, in response to price changes forrebar.269 Furthermore, Korean exports of rebar are not subject to tariff or non-tariff barriers in anycountry other than the United States.270 These facts inhibit the ability and limit the motivation of theKorean producers to divert to the United States rebar currently sold in other markets.
For the reasons stated above, even if there is an increase in subject imports upon revocation,numerous factors militate against a conclusion that the increase will be significant. These include limitedunused capacity in the Korean industry, a home market focus by the Korean industry, limited motivationto increase exports by shifting shipments from other customers, and likely continued strong demand inKorea and other traditional markets. Accordingly, we conclude that any likely increase in subject imports

271 Memorandum INV-Y-087 at Tables V-6 and V-7. 272 CR at V-10, PR at V-13. The Commission collected quarterly pricing data on four rebar products. Data werereceived from domestic producers, and from importers of subject rebar from Korea and Latvia. 273 CR/PR at Table V-13. 274 CR/PR at Tables V-1 through V-12. 275 CR/PR at Tables II-4 and II-6. 276 See, e.g., CR/PR at Tables V-1, V-4, V-7, and V-10. 277 CR at II-11, PR at II-8. 278 CR at V-1, PR at V-1. 279 MSW’s Posthearing Brief at 5-10, Attachments 1, 2, 4, and 6; CR at IV-92-93, PR at IV-51-52. 280 CR/PR at Table IV-44.
39
from Korea will not be significant either in absolute terms or relative to production or consumption in theUnited States.
2. Likely Price Effects of Subject Imports
In the original investigations, rebar from Korea undersold the domestic like product in all or mostcomparisons.271 As subject imports from Korea were largely absent throughout the period of review,available pricing data are limited.272 Subject imports from Korea undersold the domestic like product in 8of 10 possible comparisons during the period of review.273 The reported underselling was for sales of theKorean product in 2001, however, while the reported overselling occurred in the latter part of the periodof review.274
As during the original investigations, we continue to find that domestically produced andimported rebar are generally substitutable, and that price is an important factor in purchasing decisions.275 However, we find that the price effects from the subject imports from Korea likely will not be significantboth based on our finding that the volume of subject imports from Korea likely will not be significant andbecause we find no incentive for producers in Korea to price aggressively any volumes they do sell oroffer to sell in the U.S. market.
According to the pricing data collected in these reviews, U.S. prices of rebar fluctuated within agenerally limited range from 2001 through 2003. Substantial price increases began in the first quarter of2004, rising by 32 percent to 43 percent, for the four products for which data were collected. Accordingto these data, the U.S. industry’s prices for these products doubled or nearly doubled over the period ofreview.276
Although the single largest increase in consumption occurred earlier in the review period, from2002 to 2003, consumption remained strong throughout the period, buoyed by strong construction activityin the U.S. market, especially in major rebar-using projects such as roads, bridges and nonresidentialconstruction.277 Prices also were heavily influenced by the increases in raw material costs, particularlysteel scrap, that occurred in early 2004, when scrap prices rose to $251 per ton, compared to $68 per tonin January 2001. Scrap prices fluctuated after 2004, but generally remained strong, peaking at $305 perton in March 2007.278
As we noted in our discussion of conditions of competition, demand in the U.S. market is likelyto remain fairly steady for the reasonably foreseeable future. Nonresidential construction generally isexpected to remain very strong.279 The record also indicates that global demand is likely to remain strongand growing in the reasonably foreseeable future.280 We do not find that prices in the U.S. market offeran incentive to the Korean industry to shift product to this market, particularly given the strong demandand prices in the Korean home market. Average unit values for rebar in Korea and the United States are

281 CR/PR at Table C-1. In addition, U.S. exports increased by 31.3 percent. Id. 282 CR/PR at Table C-1. 283 CR/PR at Table C-1. 284 CR/PR at Table C-1. 285 We also note that, while up to 10 of the 24 to 25 reporting firms reported losses during the period 2001through 2004, only two firms (***) reported operating losses either in 2005 or 2006. CR/PR at Tables III-9 & III-10. 286 Commissioner Williamson also does not find the domestic industry to be vulnerable, but he does not join thepreceding paragraph. For his analysis of vulnerability, see Section IV. D. 3. 287 *** forecasts that North American consumption of rebar will increase steadily from 2007 through 2010. CR/PR at Table IV-44. Consumption is forecast to increase in other global regions as well; most strongly in Eastand Southeast Asia, and more moderately in the European market. Id.
40
comparable. Moreover, changes in prices in other world markets did not cause the Korean industry tochange its home market focus, as the percentage of total shipments exported remained low throughout thereview period. Thus, we do not find it likely that any increased volumes from Korea in the event ofrevocation (the level of which we do not expect to be significant, as explained above) would be likely tobe sold at prices that significantly undersell the domestic like product or that significantly suppress ordepress prices for the domestic like product. Given the Korean industry’s apparent lack of excesscapacity and attractive prices in its existing markets, we do not find that subject producers from Koreahave an incentive to price aggressively in order to move significant volumes into the U.S. market.
Based on these findings as well as our finding that the volume of subject imports from Korea isnot likely to be significant, we do not find that there is likely to be significant underselling by subjectimports from Korea as compared to the domestic like product, or that imports from Korea are likely toenter the United States at prices that otherwise would have a significant depressing or suppressing effecton the price of the domestic like product. We consequently conclude that the subject imports from Koreaare not likely to have significant price effects if the orders were revoked.
3. Likely Impact of Subject Imports on the Domestic Industry
The record of these reviews indicates that, after issuance of the orders on the subject countriesand a decline in subject import levels, the domestic industry initially made only modest gains in marketshare. However, domestic producers’ production, U.S. shipments, and net sales, after declining slightly in2001 with the economic recession, began to recover in 2002 and 2003, and showed dramaticimprovement through 2006. Between 2001 and 2006, production increased overall 25.3 percent, U.S.shipments increased 23.6 percent, and net sales increased 25.1 percent.281 With production capacityincreasing less rapidly than production (a gain of 9.2 percent between 2001 and 2006), capacityutilization increased by 11.5 percentage points in this same period.282 While domestic employmentincreased only slightly (2.5 percent) between 2001 and 2006, productivity increased 22.3 percent.283 Despite substantially reduced subject import levels, the industry posted deteriorating operating marginsfrom 2001 (6.6 percent) to 2003 (3.1 percent) before improving sharply in 2004 (15.4 percent), andcontinuing to rise throughout the remainder of the review period, peaking at 20.7 percent in 2006.284 Inlight of these data showing a healthy and vibrant industry, we do not find the domestic rebar industry tobe vulnerable.285 286
The conditions that have enabled the industry to realize its recent profits are not likely to changein the foreseeable future. As discussed supra, strong demand in the non-residential construction market, amajor user of rebar, is expected to continue, not just in the U.S. market, but globally as well.287 Whileraw material costs (primarily steel scrap) increased sharply toward the end of the period of review, and

288 CR/PR at Figure V-1; CR/PR at Tables V-1-V-12. Increases in sales value also outpaced increases in costs. Thus, domestic producers’ unit sales values rose from $268 per short ton in 2001, to $518 per short ton in 2006, anincrease of 93.2 percent. CR/PR at Table C-1. At the same time, unit COGS rose from $235 per short ton in 2001 to$383 per short ton in 2006, a smaller increase of 62.9 percent. CR/PR at Table III-9. This differential improvedover the review period, as COGS as a ratio to sales dropped from 87.8 percent in 2001 to 74.0 percent in 2006. Id. 289 CR/PR at Tables V-1-V-12. 290 Chairman Pearson dissents with respect to all orders except China and Indonesia. Vice Chairman Aranoffdissents with respect to the orders on subject imports from Latvia and Poland. Commissioner Okun dissents withrespect to the orders on subject imports from Belarus, Latvia, Moldova, and Poland. 291 Commissioners Lane and Pinkert dissenting with respect to the order on subject imports from Korea.
41
continue to be high, these costs have been more than matched by domestic price increases, which, for themost part, have leveled off at historically high levels and show few signs of reversing direction.288 Thus,domestic prices rose significantly in 2004 above their level from the original investigations and thebeginning of the period examined in these reviews.289
Consistent with our findings that the likely volume and likely price effects of subject importsfrom Korea will not be significant, we find that subject imports would not be likely to have a significantadverse impact on the domestic industry’s output, sales, market share, profits, or return on investment, ifthe order were revoked. Based on the strong expected demand in the United States and global marketsand the current robust condition of the domestic industry, the small volumes of subject imports fromKorea that would be likely upon revocation would not be likely to have a significant adverse impact onthe domestic industry.
V. CONCLUSION
For the foregoing reasons, we determine that revocation of the antidumping duty orders onsubject imports of rebar from Belarus, China, Indonesia, Latvia, Moldova, Poland, and Ukraine would belikely to lead to continuation or recurrence of material injury to the domestic industry within a reasonablyforeseeable time.290 We determine that revocation of the antidumping duty order on subject imports ofrebar from Korea would not be likely to lead to continuation or recurrence of material injury to thedomestic industry within a reasonably foreseeable time.291


1 See the Views of the Commission for my views on cumulation regarding Korea, and Separate and DissentingViews of Chairman Daniel R. Pearson and Commissioner Deanna Tanner Okun Regarding Cumulation, for myviews on cumulation for Latvia and Poland. 2 Mittal’s Prehearing Brief at 8-11; Posthearing Brief at 13-15. 3 CTL Plate, USITC Pub. 3899, at 50-51. (Commissioners Koplan and Lane dissenting; see Id. at 98-99). 4 CR at IV-67-68; PR at IV-41.
43
SEPARATE AND CONCURRING VIEWS OFVICE CHAIRMAN SHARA L. ARANOFF
REGARDING BELARUS, CHINA, INDONESIA, MOLDOVA, AND UKRAINE
I. INTRODUCTION
Based on the record in these five-year reviews, I determine that material injury is likely tocontinue or recur within a reasonably foreseeable time if the antidumping duty orders on subject importsof steel concrete reinforcing bar from Belarus, China, Indonesia, Moldova, and Ukraine are revoked.
I join the Views of the Commission regarding domestic like product, domestic industry, the legalstandard governing five-year reviews, no discernible adverse impact, likely reasonable overlap ofcompetition, conditions of competition, and the summary of the original determination. I write separatelyhere with regard to my analysis of certain cumulation considerations, and the statutory factors with regardto Belarus, China, Indonesia, Moldova, and Ukraine.
II. CUMULATION
Based on my review of the record, I find a reasonable overlap of competition between subjectimports from all subject countries, but conclude that subject imports from Belarus, China, Indonesia,Moldova, and Ukraine would not be likely to compete under similar conditions of competition withsubject imports from Korea, or those from Latvia or Poland. I consequently do not exercise my discretionto cumulate subject imports from Belarus, China, Indonesia, Moldova, and Ukraine with subject importsfrom Korea, Latvia, and Poland. As discussed below, I cumulate subject imports from Belarus, China,Indonesia, Moldova, and Ukraine.1
Regarding subject imports from Ukraine, Mittal Steel Kryviy RIH (Mittal) argues that theCommission should exercise its discretion and not cumulate imports of Ukrainian rebar with other subjectimports due to Mittal’s corporate affiliation with a U.S. producer of rebar, Border Steel.2 In this regard,Mittal cites Certain Carbon Steel Product from Australia, Belgium, Brazil, Canada, Finland, France,Germany, Japan, Korea, Mexico, Poland, Romania, Spain, Sweden, Taiwan, and the United Kingdom,Inv. Nos. AA-1921-197 (Second Review); 701-TA-319, 320, 325-327, 348, and 350 (Second Review;and 731-TA-573-574, 576, 578, 582-587, 612, and 614-618 (Second Review), USITC Pub. 3899 (January2007) (“CTL Plate”). In CTL Plate, the Commission declined to cumulate subject imports from Romaniawith subject imports from other countries because, inter alia, of the significant changes the RomanianCTL plate industry had undergone since the original investigation, including that the Romanian producerwas no longer state-owned and, at the time of the review, was part of a corporate group that included amajor U.S. producer of CTL plate.3
The circumstances in these reviews are distinct from CTL Plate. In CTL Plate, the soleRomanian producer was affiliated with a major U.S. producer capable of servicing a large portion of theU.S. market. Here, although Mittal is the largest known producer in Ukraine, accounting for at least ***percent and possibly up to *** percent of production,4 its U.S. affiliation through its parent, Arcelor

5 CR at III-5; PR at III-4-5 and CR/PR at Table I-11. 6 Hearing Transcript at 287-288. 7 Calculated from CR/PR at Table IV-33. 8 CR/PR at Table I-1. 9 CR/PR at Table I-1. 10 Calculated from CR/PR at Tables IV-9 (Belarus), IV-11 (China), IV-25 (Moldova) and IV-33 (Ukraine). Datafor the industry in Indonesia are not available. 11 CR/PR at Tables IV-10 and IV-26.
44
Mittal, is very recent and is with a U.S. rebar producer, Border Steel, that accounts for ***.5 Mittalargues that Arcelor will make all shipping decisions to the United States which are in the best interest ofits U.S. affiliate.6 However, while Arcelor may exercise prudence in making its decisions as to how muchrebar to ship to the U.S. market, given the generally *** of total U.S. shipments made by Border Steel,the record does not support the conclusion that Arcelor is likely to abstain from serving the U.S. marketwith greater volumes than Border Steel can produce. Finally, whether or not Mittal is part of a globalcorporate group, Mittal, itself, ***.7
Thus, given the highly fungible nature of the product, I find that subject imports from each ofthese subject countries will be likely to compete under similar conditions of competition if the orderswere revoked. Accordingly, I exercise my discretion to cumulate subject imports from Belarus, China,Indonesia, Moldova, and Ukraine.
III. REVOCATION OF THE ORDER ON SUBJECT IMPORTS FROM BELARUS,CHINA, INDONESIA, MOLDOVA, AND UKRAINE IS LIKELY TO LEAD TOCONTINUATION OR RECURRENCE OF MATERIAL INJURY WITHIN AREASONABLY FORESEEABLE TIME
A. Likely Volume of Subject Imports
I apply the legal standards discussed in Section IV above. During the original period of investigation, cumulated subject imports from Belarus, China,
Indonesia, Moldova, and Ukraine had grown from 257,891 short tons in 1998, a *** percent marketshare, to 569,623 short tons in 2000, a *** percent share.8 After the orders were put in place, subjectimports from these five countries dropped almost completely out of the U.S. market, with only sporadicshipments and very small volumes reported.9
In these reviews, the sole producer of rebar in Belarus, BMZ, and in Moldova, MSW, submittedquestionnaire responses, as did Mittal, the largest producer of rebar in Ukraine. Subject foreign producersin China and Indonesia provided no data to the Commission. Thus, in discussing subject producercapacity, I have relied on published data sources in addition to the data gathered in the questionnaires.
Capacity to produce rebar in the cumulated countries grew substantially after 2000, withindividual country growth rates ranging up to *** percent, and likely substantially higher for China,based on its available production data, which shows more than a *** percent production increase.10 Combined capacity in 2006 for those countries for which data were reported (Belarus, Moldova andUkraine) was *** short tons, equivalent to *** percent of apparent U.S. consumption, and *** percent ofU.S. production. Further, the record shows that producers in Belarus and Moldova completed significantcapacity expansions immediately prior to the review period. In 2001, BMZ’s capacity grew *** percent,from *** shorts tons in 2000 to *** short tons in 2001, and MSW’s capacity increased from *** shorttons in 2000 to *** short tons in 20001, a change of *** percent.11 Neither country reported anyadditional or projected capacity to produce rebar throughout the review period. Mittal has reported

12 CR/PR at Table IV-33. 13 CR/PR at Tables IV-10 and IV-33. 14 CR/PR at Table IV-26. 15 CR/PR at Table IV-12. 16 CR/PR at Table IV-12. 17 Compare CR/PR at Table IV-12 to Table III-2. 18 CR/PR at Table IV-13. 19 CR at IV-31; PR at IV-21. 20 CR/PR at Table III-2. 21 CR at IV-31; PR at IV-21. 22 CR/PR at Table IV-15. 23 CR at IV-31; PR at IV-21. 24 Home market shipments as a percent of total shipments in 2006 were, for Belarus, *** percent, for Moldova,*** percent, and for Ukraine, *** percent. CR/PR at Tables IV-10, IV-26, and IV-35.
45
steady increases in capacity throughout the review period, including a projected increase in 2007,increasing its capacity from *** shorts tons in 2001, to *** shorts tons in 2007, an increase of ***percent overall.12 The industries in Belarus and Ukraine reported generally high capacity utilizationrates,13 while Moldovan producer’s capacity utilization rate fluctuated widely throughout the period, andended at *** percent in 2006.14
No current capacity data were reported for producers in China or Indonesia. However, *** datashows that the Chinese industry’s capacity in 2005 was *** short tons in 2005, and increased to *** shorttons in 2006.15 Over this same period, the Chinese industry’s rebar production also increased from ***short tons in 2005 to *** short tons in 2006, indicating improved capacity utilization, but a significantvolume of unused capacity in 2006.16 Compared to the U.S. industry’s capacity to produce rebar, theChinese industry’s capacity is enormous: in 2006 it was equivalent to *** percent of apparent U.S.consumption and *** percent of U.S. production. Unused Chinese capacity in 2006 of *** short tons isequivalent to *** percent of apparent U.S. consumption and *** percent of U.S. production for the sameyear.17 Further, Chinese capacity is projected to continue to increase in each year through 2011, reachingover *** short tons by 2011, an increase of *** percent over 2006 production.18 With respect to the industry in Indonesia, which also did not participate in these reviews, *** datashow Indonesian rebar capacity at about *** short tons,19 or about *** percent of apparent U.S.consumption and *** percent of U.S. production in 2006.20 During the original investigations, thirteenfirms that produced rebar in Indonesia were identified, although only one returned a completedquestionnaire to the Commission.21 The responding producer reported production capacity of *** shorttons in 2000,22 which accounted for about *** percent of total rebar production in Indonesia in 2000.23 Thus, although reported capacity utilization rates in these subject countries are generally high, on acumulated basis substantial unused capacity exists.
Even if the subject foreign producers in these five countries did not increase production of rebar,they would be able to increase their shipments significantly within the foreseeable future if the orders arerevoked. On a percentage of total shipments basis, Belarus, Moldova, Ukraine, and Indonesia (based onoriginal record data), export a substantial portion of rebar production. Indeed, rebar producers in Belarus,Moldova, and Ukraine are *** export-oriented, exporting *** of their production with only limitedvolumes shipped within their home markets.24 Cumulated total exports for Belarus, China, Moldova, and

25 CR/PR at Tables IV-10, IV-26, IV-33, IV-48. 26 Calculated from Tables IV-10, IV-12, IV-26, IV-33, and Table I-1. 27 Calculated from CR/PR at Table IV-12. 28 Compare CR/PR at Table I-1 to Table IV-12. 29 CR/PR at Table IV-11. 30 CR/PR at Tables IV-10 (Belarus), IV-14 (China), IV-26 (Moldova), and IV-35 (Ukraine). There was noavailable information with respect to Indonesia. 31 CR/PR at Table IV-35. 32 CR/PR at Table IV-14. 33 CR/PR at Tables IV-46 and IV-47. 34 CR/PR at Table IV-47. 35 Reported AUVs in the United States and subject countries in 2006 were as follows: United States $522, Belarus$***, Moldova $***, and Ukraine$*** CR/PR at Tables C-1, IV-10, IV-26, and IV-33. According to ***, in 2006,U.S. prices for rebar ranged from $*** to $*** while Chinese prices for rebar ranged from $*** to $***. CR/PR atTable IV-46. There is no available pricing data for the Indonesian home market.
46
Ukraine amounted to *** short tons in 2006,25 which is equivalent to *** percent of apparent U.S.consumption and *** percent of U.S. production for the same year.26
The Chinese industry, on the other hand, serves a very large home market, with *** data showinghome market consumption in 2006 totaling almost *** percent of total production.27 Nevertheless, in thisinstance an analysis of the export orientation of the Chinese rebar industry based simply on thepercentage of production exported is deceptive. Given the enormous overall capacity and production inChina, even after shipping the vast majority of production to its home market, net exports in 2006 were*** short tons, equal to about *** percent of total U.S. consumption.28 Also, as a share of its overallproduction, Chinese rebar exports have grown rapidly over the period of review, from 1.2 percent in 2000to *** percent in 2006.29
During the review period, producers in the subject countries have demonstrated their ability toshift exports with relative ease among export markets as well as from their home markets to exportmarkets.30 The industry in Ukraine exports to a wide range of countries and regions, and cannot bedescribed as focused on a nearby regional market, unlike the industries in Latvia and Poland. In fact, asignificant amount of exports from Ukraine are directed toward Africa and the Middle East to a greaterdegree than other subject producers.31 Chinese producers also export throughout the world. The Chineseindustry’s three most significant export markets are in Asia, and account for just over 50 percent of totalexports. However, its rebar reaches Canada and Mexico, and export volumes to particular countriesfluctuate widely on an annual basis.32 Although there are no available current data with respect toIndonesia, during the period of the original investigation, it exported to the United States in 2 of the 3years.
The U.S. market offers a strong incentive for these five subject countries to shift exports to theUnited States if the orders are revoked. The United States is one of the most attractive markets in theworld because of the combination of its large size, strong demand, and high prices. The record indicatesthat prices in the United States were higher than in the subject countries throughout the period ofreview.33 Moreover, while prices in some markets, in particular the EU, Russia, and the Middle East,were reportedly higher in some instances,34 U.S. prices have been consistently above most other marketsinto which these subject producers are shipping rebar, and significantly higher in comparison with pricesin China and other Asian countries.35
Further, on a volume basis alone, the U.S. market is attractive. Belarus, Moldova, and Ukrainereport many of the same markets as primary export markets, including Russia and other CIS countries,and other regional markets. However, although the Russian and CIS markets have increased consumption

36 CR/PR at Table IV-43. 37 CR/PR at Tables IV-43 and IV-44. 38 CR/PR at Table IV-43. 39 CR/PR at Table I-1. 40 CR/PR at Table I-12, Table IV-3. 41 Hearing Transcript at 286-287 and 291. 42 CR/PR at Table II-6. 43 CR/PR at Table I-12.
47
over the review period,36 they are, and are projected to remain, by far the smallest of the global markets. In fact *** data show *** in demand in the CIS region after 2006. Consumption in 2006 in the CISregion was *** short tons, projected to increase to only *** short tons by 2008, and *** short tons by2011, increases of only *** percent and ***, respectively.37 While growth in the North American marketis forecast to increase by only *** by 2011, the North American market as a whole is several times largerthan that of the CIS region, *** short tons in 2006, compared to *** shorts tons.38 And, the U.S. marketaccounts for the bulk of that demand, 9.8 million short tons in 2006, or about *** percent.39
The appeal of the U.S. market is underscored by actions of global trading companies, which asdiscussed above in Conditions of Competition, seek to maximize prices and profits and thus will seek outthe markets that offer the strongest price levels. During the period of review, the global tradingcompanies facilitated entry of a sizeable amount of nonsubject imports into the U.S. market, includingimports from a number of EU countries, Russia, and Egypt, notwithstanding reportedly higher prices inthe EU, Russia, and the Middle East.40 Further, these trading companies are described as selling on thespot market and seeking to maximize prices by seeking the most advantageous markets,41 rather thanmaintaining long-term or contractual relationships with specific customers or markets.
In addition, subject imports would be able to penetrate the U.S. market with relative ease if theorders were revoked. First, rebar is a commodity product and almost all questionnaire respondents notedthat it highly interchangeable between that produced in the United States and all subject countries.42 Asnoted above, a number of global trading companies have importer trading partners in the United States,which have arranged and transported *** quantities of rebar to the U.S. market.43
Given the importance of export markets for all these subject producers, the absolute volume ofexports, and the absolute and excess capacity in these countries, and taking into consideration the rapidgrowth of subject imports during the original period of investigation, I find that subject imports will bedrawn to the U.S. market, and will be likely to increase significantly upon revocation of the antidumpingduty orders. Consequently, based on the record in these reviews, I conclude that the volume of cumulatedsubject imports likely would increase to a significant level and regain significant U.S. market share if theorders were revoked. Accordingly, I conclude that the likely volume of the subject merchandise, both inabsolute terms and relative to consumption and production in the United States, would likely besignificant, absent the restraining effect of the orders.
B. Likely Price Effects
I apply the legal standards discussed in Section IV above. I find that the significantly increased volumes of cumulated subject imports would likely have
significant negative price effects for the domestic like product. As discussed above, rebar is a highlyfungible, commodity product for which price is the most important factor in purchasing decisions. Purchasers overwhelmingly named price as the number one factor used in purchasing decision; 14purchasers named price the most important factor while the next most cited factor, availability, was

44 CR/PR at Table II-4. 45 CR at V-4; PR at V-3. 46 CR/PR at Table II-6. 47 Confidential 2001 Staff Report at Tables V-6 and V-7. 48 2001 Staff Report at Tables V-6 and V-7. 49 CR at II-11; PR at II-7. 50 CR at V-1; PR at V-1. 51 CR/PR at Table III-9 and Table C-1. 52 CR/PR at Table III-9 and Table C-1.
48
named first by 4.44 Moreover, price is generally set on a transaction by transaction basis45 and thedomestic like product and subject imports are viewed as highly interchangeable.46 Further, no partiesargued that substantial differences in product characteristics existed between the domestic like productand subject imports from Belarus, China, Indonesia, Moldova and Ukraine
In the original investigation period, subject imports from these countries overwhelminglyundersold the domestic product, with margins ranging from *** percent to *** percent.47 Moreover,AUVs for subject imports were well below AUVs for the domestic like product.48 In these reviews, theCommission collected quarterly pricing data on four rebar products. Data were received from domesticproducers, and importers of subject rebar from Korea and Latvia; no pricing data were received for thefive subject countries. During the review period, U.S. producer prices increased substantially on anational basis over the 2001-2006 review period, with the sharpest increases occurring in 2004. During2001-03, rebar prices fluctuated within a generally limited range. However, beginning early in 2004,prices began to climb, rising by 32 percent to 43 percent, for the four products for which data werecollected. Although the biggest increase in consumption occurred earlier in the review period, from 2002to 2003, consumption remained strong throughout the period, buoyed by strong construction activity inthe U.S. market, especially in major rebar using projects such as roads, bridges and nonresidentialconstruction.49
Prices for rebar were also heavily influenced by the increase in raw material costs, particularlysteel scrap, that occurred in early 2004, when scrap price rose to $251 per ton, compared to $68 per tonin January 2001. Scrap prices fluctuated after 2004, but generally remained strong, peaking at $305 perton in March 2007.50 Not only did prices rise significantly, but increases in sales value also outpaced theincrease in costs, such that unit sales values rose from $268 per short ton in 2001, to $518 per short ton in2006, an increase of 93.2 percent. At the same time, unit COGS rose from $235 per short ton in 2001 to$383 per short ton in 2006, a smaller increase, of 62.9 percent.51 This differential improved over thereview period, as COGS as a ratio of sales dropped from 91.1 percent in 2003 to 74.0 percent in 2006.52
As concluded above, subject producers have an incentive to ship to the U.S. market because ofthe higher prices in the U.S. market relative to third-country markets. Factoring importantly in the role ofprice in the market, the fungible nature of the product, the negative price effects of, and pervasiveunderselling by, low-priced imports during the original investigation period, and the incentive to obtainmarket share in the relatively high-priced, large, stable and accessible U.S. market.
Based on the foregoing, I determine that the substantially larger volume of subject imports fromBelarus, China, Indonesia, Moldova, and Ukraine that are likely to enter the U.S. market upon revocationwould be priced aggressively to gain market share and would likely depress or suppress domestic pricesto a significant degree. I consequently conclude that revocation of the orders on subject imports fromBelarus, China, Indonesia, Moldova, and Ukraine would likely result in significant adverse price effects.

53 CR/PR at Table I-1. 54 CR/PR at Table I-1. 55 CR at II-11; PR at II-7. 56 CR/PR at Table I-1. 57 CR/PR at Table III-12.
49
C. Likely Impact of the Subject Imports on the Domestic Industry
Even following the imposition of the orders, the domestic industry faced continuing difficulties,in part due to weakening demand in the U.S. market from 2000 to 2001. U.S. shipments decreasedslightly from 6.4 million short tons in 2000 to 6.0 million short tons in 2001, but increased to 6.1 milliontons in 2002, and showed an increase in market share to 83.4 percent in 2002 compared to 77.3 percentthe year prior. Domestic production decreased from 6.4 million short tons in 2000 to 6.1 million shorttons in 2001, and then increased to 6.3 million tons in 2002. Employment levels likewise decreasedbetween 2000 and 2002. On the other hand, capacity utilization increased steadily from 76.8 percent in2000 to 79.5 percent in 2002. Net sales, in terms of quantity, decreased from 6.5 million in 2000 to 6.2million in 2001, and increased to 6.4 million in 2002. The domestic industry operating profits grew from$45 million in 2000 to $110 million in 2001, but dropped to $66 million in 2002. The domesticindustry’s operating margin improved from 2.5 percent in 2000 to 6.6 percent in 2001, but declined to 4.0percent in 2002.53
The domestic industry’s condition improved notably after 2003, as U.S. demand increaseddramatically and U.S. prices rose sharply.54 As discussed in Conditions of Competition, rebar is used inconstruction projects, with roads and bridges and nonresidential construction among the primary drivers. Strong demand in the construction market during the later years of the review period contributed to thehealthy performance of the domestic industry.55 From 2003 to 2006, the domestic industry generallyexperienced improved productivity, increasing net sales, and strong employment indicators, includingworkers employed. Capacity utilization rates fluctuated, but remained near 90 percent. The average unitvalue of U.S. rebar shipments rose from $282 per short ton in 2003 to $522 per short ton in 2006. As thedomestic industry was able to raise prices beyond its cost increases, its profitability increased in tandemwith the rise in prices. Operating profits increased from $66 million in 2003 to $828 million in 2006, asdid operating margins, growing from 3.1 percent in 2003 to 20.7 percent in 2006.56 At the same time, thedomestic industry’s capital expenditures increased from $70 million in 2003 to $146 million in 2006.57
Given the domestic industry’s very strong performance at the end of the period of review, I donot find that domestic industry is currently in a vulnerable or weakened state as contemplated by thestatute. The domestic industry’s absolute operating income and operating margins were high andimproving on an annual basis after 2003. The domestic industry’s profitability can be attributed to itssuccess in increasing prices beyond cost increases, during a period of strong demand. Demand isanticipated to remain steady within the foreseeable future, thus the conditions that have enabled toindustry to realize its recent healthy financial performance are not likely to change in the foreseeablefuture.
Prices have risen sharply due to the increase in raw material costs. Although the industry hasbeen successful in enacting price increases to address the higher costs, I find that the likely significantvolume of cumulated subject imports from Belarus, China, Indonesia, Moldova, and Ukraine would belikely to have a significant adverse impact on the domestic industry if the orders were revoked. Thus,despite demand that is projected to remain strong, the commodity-like nature of rebar would createconditions in which the domestic industry would face competition in the U.S. market solely on the basisof price, and consequently see price declines in the market in the reasonably foreseeable future. Giventhat the improvement in the domestic industry’s financial condition during the review period was directly

50
attributable to steady price increases that have been maintained, it is reasonable to conclude that aconsistent decline in price levels would eventually lead to a deterioration in the financial condition of theindustry. Thus, I conclude that if the orders on Belarus, China, Indonesia, Moldova and Ukraine wererevoked, the cumulated subject imports would be likely to have a significant adverse impact on thedomestic industry’s output, sales, market share, profits and the ability to raise capital and make capitalexpenditures. In light of the foregoing, I conclude that if the antidumping duty orders are revoked, cumulatedsubject imports from Belarus, China, Indonesia, Moldova, and Ukraine would enter the U.S. market insuch increased quantities and at price levels so as to cause price suppression or depression, thus causing asignificant adverse impact on the domestic industry within a reasonably foreseeable time.
CONCLUSION
For the foregoing reasons, I determine that revocation of the antidumping duty orders on subjectimports of rebar from Belarus, China, Indonesia, Moldova, and Ukraine would be likely to lead tocontinuation or recurrence of material injury to the domestic industry within a reasonably foreseeabletime.

1 19 U.S.C. § 1675a(a)(7). 2 19 U.S.C. § 1677(7)(G)(I). 3 See, e.g., Allegheny Ludlum Corp. v. United States, Slip Op. 06-188 at 17 (Ct. Int’l Trade Dec. 22, 2006)(recognizing the wide latitude the Commission has in selecting the type of factors it considers relevant in decidingwhether to exercise discretion to cumulate subject imports in five-year reviews). 4 The Commission generally has considered four factors intended to provide a framework for determiningwhether the imports compete with each other and with the domestic like product: (1) the degree of fungibilitybetween the imports from different countries and between imports and the domestic like product, includingconsideration of specific customer requirements and other quality related questions; (2) the presence of sales oroffers to sell in the same geographic markets of imports from different countries and the domestic like product; (3)the existence of common or similar channels of distribution for imports from different countries and the domesticlike product; and (4) whether the imports are simultaneously present in the market. See Certain Cast-Iron PipeFittings from Brazil, the Republic of Korea, and Taiwan, Inv. Nos. 731-TA-278-280 (Final), USITC Pub. 1845 (May1986), aff’d, Fundicao Tupy, S.A. v. United States, 678 F. Supp. 898 (Ct. Int’l Trade 1988), aff’d, 859 F.2d 915(Fed. Cir. 1988); Mukand Ltd. v. United States, 937 F. Supp. 910, 915 (Ct. Int’l Trade 1996). In five-year reviews,the relevant inquiry is whether there likely would be competition after revocation of the orders, even if nonecurrently exists. 5 19 U.S.C. § 1675a(a)(7). We note that neither the statute nor the Uruguay Round Agreements Act (“URAA”)Statement of Administrative Action (“SAA”) provides specific guidance on what factors the Commission is toconsider in determining that imports “are likely to have no discernible adverse impact” on the domestic industry. SAA, H.R. Rep. No. 103-316, vol. I (1994).
51
SEPARATE AND DISSENTING VIEWS OF CHAIRMAN DANIEL R. PEARSONAND COMMISSIONER DEANNA TANNER OKUN REGARDING CUMULATION
I. Framework
Section 752(a) of the Act provides that:
the Commission may cumulatively assess the volume and effect of imports of the subjectmerchandise from all countries with respect to which reviews under section 1675(b) or(c) of this title were initiated on the same day, if such imports would be likely to competewith each other and with domestic like products in the United States market. TheCommission shall not cumulatively assess the volume and effects of imports of thesubject merchandise in a case in which it determines that such imports are likely to haveno discernible adverse impact on the domestic industry.1
Cumulation is therefore discretionary in five-year reviews, unlike original investigations, whichare governed by section 771(7)(G)(I) of the Act.2 Because of the prospective nature of five-year reviewsand the Commission’s discretion with respect to cumulation, we consider three issues in deciding whetherto exercise our discretion to cumulate the subject imports: (1) whether imports from the subject countriesare likely to face similar conditions of competition with regard to their participation in the U.S. market forrebar if the orders under review were terminated;3 (2) for those subject imports which are likely tocompete under similar conditions of competition, whether those imports are likely to compete with eachother and with the domestic like product;4 and (3) if based on that analysis we intend to exercise ourdiscretion to cumulate one or more subject countries, we then analyze whether we are precluded fromcumulating such imports because the imports from one or more subject countries, assessed individually,are likely to have no discernible adverse impact on the domestic industry.5

6 The first of three statutory requirements for cumulation is satisfied in these reviews, because all reviews wereinitiated on the same day: August 1, 2006. 71 Fed. Reg. 43523 (Aug. 1, 2006). 7 Certain Steel Concrete Reinforcing Bars from Indonesia, Poland, and Ukraine, Inv. Nos. 731-TA-875, 880, 882(Final), USITC Pub. 3425 (May 2001) at 16, 27. One Commissioner cumulated subject imports from all subjectcountries. 8 USITC Pub. 3425 at 16, 25. 9 Certain Steel Concrete Reinforcing Bars from Belarus, China, Korea, Latvia, and Moldova, Inv. Nos. 731-TA-873-874 and 877-879 (Final), USITC Pub. No. 3440 (July 2001) at 10-14.
52
In so doing, we take into account the various arguments by the parties in favor of and againstcumulation. Our focus in a five-year review is not merely on present conditions of competition, but alsoon likely conditions of competition in the reasonably foreseeable future.6
II. Background
In the original investigations, five of the six Commissioners cumulated subject imports fromBelarus, Indonesia, Korea, Latvia, Moldova, Poland, and Ukraine but did not cumulate subject importsfrom China for purposes of their regional/national material injury analysis.7 With respect to subjectimports from the countries other than China, all six Commissioners found that rebar is a highly fungibleproduct since all rebar produced, sold, or used in the United States meets certain common requirements,such as ASTM specifications. They also noted that the majority of producers, importers, and purchasersviewed rebar to be interchangeable regardless of origin. They also found that domestic and importedrebar was sold to both distributors and fabricators. Chairman Koplan, Vice Chairman Okun, andCommissioner Bragg also found the geographic overlap requirement was satisfied because domestic rebarwas sold in the region and that subject imports were sold or marketed throughout the region. Commissioners Miller, Hillman, and Devaney found that domestic rebar and subject imports competedwithin a majority of the states. All six Commissioners found that the domestically produced product andsubject imports from all sources were simultaneously present in either the regional or national market asappropriate.8
With respect to China, five of the six Commissioners found that imports from China werenegligible for present material injury purposes. The Commission, however, found that China wouldimminently account for more that 3 percent of all subject merchandise sold into the region or U.S. marketas appropriate. Although the Commission found that rebar from China was interchangeable withdomestically produced rebar and rebar from the other subject countries and competed against bothdomestic and imported rebar, the Commission declined to exercise its discretion to cumulate subjectimports from the other subject countries. Specifically, the Commission found that the volume and pricetrends exhibited by subject imports from China and other subject imports were significantly different. The Commission found that the volume and U.S. market share of subject imports from China into theregion/United States rose sharply over the period examined, while the volumes of subject imports fromthe other countries fluctuated. At the same time, the Commission found that although all subject importsundersold the domestic like product, the margins of underselling by subject imports from China weresignificantly higher.9
III. Parties’ Arguments
The domestic interested parties argue that all subject imports of rebar should be cumulated withthe exception of Korea. They argue that imports of rebar from Korea will likely have no discernible

10 Domestic Interested Parties’ Prehearing Brief at 50-51. 11 Domestic Interested Parties’ Prehearing Brief at 20-21, 23-50 and 53-55. 12 Domestic Interested Parties’ Posthearing Brief at 4-10 (Rebar is a commodity product sold on the basis of price. Producers in all countries, with the exception of Korea, are export-oriented and have excess capacity.). Id. at Exhibit1A, 11 (“the unique situation of the Korean rebar industry, specifically the evidence that it will not be competingwithin the U.S. market, warrants the decumulation of the Korean producers of rebar.”). 13 BMZ’s Posthearing Brief at 5-6. 14 Hyundai’s Prehearing Brief at 3-6; Hyundai’s Posthearing Brief at 2-5. 15 LM’s Prehearing Brief at 7-8, 9-12; LM’s Posthearing Brief at 9-11. 16 MSW’s Posthearing Brief at 2-4. 17 Mittal’s Prehearing Brief at 5-8, 12-25; Mittal’s Posthearing Brief at 13-15. 18 Subject producers from China, Indonesia, and Poland did not make any arguments in these reviews concerningcumulation. 19 The list of factors that the Commission has cited in five-year reviews in determining not to exercise itsdiscretion to cumulate subject imports include, but are not limited to, the following: differences in likely volumetrends, differences in product mix, differences in prices or average unit values, differences in foreign productivecapacity, and differences in tariff treatment in U.S. or third-country markets. See, e.g., Certain Carbon Steel
(continued...)
53
adverse impact on the domestic industry.10 For the remaining countries, they argue that the likelihood of“no discernible adverse impact” is not satisfied and claim that it is likely that subject imports from theremaining subject countries will exhibit a reasonable overlap of competition with imports from othersubject countries and with domestically produced rebar.11 Finally, U.S. producers argue that there are nosignificant differences in conditions of competition among the subject countries, with the exception ofKorea, that would not warrant the Commission exercising its discretion to cumulate any of them.12
Rebar producers in the following subject countries argue that their country’s imports should notbe cumulated with those from the other subject countries on the following bases: Belarus, differentconditions of competition;13 Korea, no discernible adverse impact and differences in conditions ofcompetition;14 Latvia, no discernible adverse impact and differences in conditions of competition;15
Moldova, different conditions of competition;16 and Ukraine, no discernible adverse impact, lack ofoverlap of competition, and differences in conditions of competition.17 18
IV. Analysis
In these reviews, we do not exercise our discretion to cumulate subject imports from China,Indonesia, and Ukraine with each other or with other subject countries for purposes of our injury analysis. We, however, exercise our discretion to cumulate subject imports from Latvia and Poland, and tocumulate subject imports from Belarus and Moldova. Chairman Pearson determines that subject importsfrom Korea are likely to have no discernible adverse impact on the domestic industry in the event ofrevocation, and are therefore ineligible for cumulation. Commissioner Okun determines not to exerciseher discretion to cumulate subject imports from Korea with those from any of the other subject countriesfor purposes of her injury analysis.
A. Competition and Other Considerations
We first consider whether factors, such as likely differing conditions of competition for thesubject imports warrant us not exercising our discretion to cumulate subject imports from certaincountries.19

19 (...continued)Products from Australia, Belgium, Brazil, Canada, Finland, France, Germany, Japan, Korea, Mexico, Poland,Romania, Spain, Sweden, Taiwan, and the United Kingdom, Inv. Nos. AA1921-197 (Second Review), 701-TA-319,-320, -325-327, -348, and -350 (Second Review), and 731-TA-573, -574, -576, -578, -582-587, -612, and -614-618(Second Review), USITC Pub. 3899 (Vol. I) at 4 and 50 (January 2007) (Cut-to-Length Plate) (did not cumulatesubject imports from Romania based on corporate affiliation with a major U.S. producer, excess capacity, and tarifftreatment in other markets); Id. at 8 (Corrosion-Resistant Steel) (did not cumulate subject imports from Canadabased on differences in market conditions for production and sourcing); Cut-to-Length Carbon Steel Plate fromChina, Russia, South Africa, and Ukraine, Inv. Nos. 731-TA-753-756 (Review), USITC Pub. 3626 at 16-17 (Sept.2003) (did not cumulate subject imports from South Africa because of differences in volume trends and average unitvalues during period of review, differences in capacity, and differences in treatment in other U.S. trade remedymatters); Helical Spring Lock Washers from China and Taiwan, Inv. Nos. 731-TA-624-625 (Review), USITC Pub.3384 at 9 (Jan. 2001) (did not cumulate based on differences in product mix, AUVs, and capacity); Uranium fromRussia, Ukraine, and Uzbekistan, Inv. Nos. 731-TA-539-C, E, and F (Review), USITC Pub. 3334 at 23-24 (Aug.2000) (did not cumulate Russian and Uzbek imports because they entered the United States in different forms andhad different current and likely volume trends); Stainless Steel Wire Rod from Brazil, France, India, and Spain, Inv.Nos. 701-TA-178, 731-TA-636-638 (Review), USITC Pub. 3321 at 14 (July 2000) (did not cumulate French importsbecause of differences in volume trends, AUVs, and tariff treatment in other markets); Certain Steel Wire Rope fromJapan, Korea, and Mexico, Inv. Nos. AA1921-124, 731-TA-546-547 (Review), USITC Pub. 3259 at 11-12 (Dec.1999) (did not cumulate based on differences in volume, product mix, and capacity). 20 Chairman Pearson does not join this section on Korea, as he determines infra that subject imports from Koreawill have no discernible adverse impact on the domestic industry. 21 Domestic interested parties do not believe that imports of Korean rebar would have a discernible adverseimpact if the antidumping duty order on rebar from Korea were revoked. See e.g., Domestic Interested PartiesPrehearing Brief at 50-51. 22 CR/PR at Table I-1. Subject imports from Korea fell by almost half during the period of investigation, makingup nearly *** of all rebar imports in 1998, but less than *** of rebar imports in 2000. Id. 23 See, e.g., USITC Pub. 3425 at VII-4 (Indonesia) and VII-5-VII-6 (Korea); Original Investigation ConfidentialStaff Report (Memorandum INV-Y-087), May 1, 2001, at Tables VII-3 (Indonesia) and VII-4 and VII-5 (Korea). 24 See, e.g., CR/PR at Tables IV-17, IV-18 and IV-20. 25 CR/PR at Tables IV-18 and IV-20. 26 See, e.g., CR/PR at Tables IV-16, IV-20.
54
1. Korea20
The following factors indicate significant differences in the conditions of competition facingKorean producers as compared to producers in the other subject countries.21
Subject import penetration from Korea differed from most of the other subject countries duringthe original period examined. Subject imports from Korea declined steadily during the originalinvestigations.22 Korea’s export pattern in the original investigations appears to have been affected by theAsian financial crisis, which resulted in a decline in demand for rebar in the previously expanding Asianmarkets. The disruption in the Asian markets particularly affected producers in countries such asIndonesia and Korea, both of which experienced suppressed home market demand in 1998 and 1999, withimproved home market shipments in 2000.23
The Korean industry is not export-oriented, unlike the producers in many of the other subjectcountries. In each year of the period of review, substantially all of Korea’s rebar shipments have beenmade to the home market.24 Indeed, while Korea continues to export modest quantities of rebar, itbecame a net importer in 2002.25 As a result, Korea reported minimal rebar exports to the United Statesthroughout the period or review, and exports accounted for only *** percent of its production in 2006.26 In 2006, the Korean industry exported only 239,035 short tons of rebar to all markets, whereas Chinese

27 See, e.g., CR/PR at Tables IV-20 (Korea), IV-14 (China), IV-35 (Ukraine). 28 CR/PR at Table IV-19. 29 See USITC Pub. 3425 at 13. 30 See USITC Pub. 3425; USITC Pub. No. 3440. 31 USITC Pub. 3440 at 7-9; 10-14. 32 See USITC Pub. 3425 at VII-1 - VII-9. The Commission did not have capacity data for the Chinese industry. Based on available data, the Chinese industry’s production in 2000 was more than 29,450,000 short tons. Indeed,the Chinese industry’s production was three times larger than that of the Korean industry. Compare CR/PR at TableIV-11 with CR/PR at Table IV-16. 33 CR/PR at Table IV-11. As noted previously, the Commission does not have capacity data for the Chineseindustry. 34 See, e.g., CR/PR at Tables IV-11 and IV-14. 35 Many witness testified at the hearing about China’s differences. See, e.g., Hearing Transcript at 8 (Price)(“Since the original investigation, the Chinese industry has experienced explosive growth as capacity, productionand exports have all skyrocketed. China alone has about 50 million tons of excess and divertible rebar capacity.”);
(continued...)
55
producers exported 3,745,801 short tons of rebar in 2006 and Ukrainian producers exported 3,295,050short tons in 2006.27 This trend is likely to continue as Korea is projected to remain a net importer ofrebar for the reasonably foreseeable future.28 On balance, Commissioner Okun finds that the conditionsof competition with respect to Korea are sufficiently different so as to provide a reasonable basis for hernot to exercise her discretion to cumulate subject imports from Korea with those from the other subjectcountries.
2. China
The following factors indicate significant differences in the conditions of competition facingChinese producers as compared to producers in the other subject countries.
In the original investigations, the Commission did not cumulate subject imports from China withsubject imports from the remaining countries because imports from China were negligible.29 Moreover,the Commission determined that the U.S. domestic industry was threatened with material injury by reasonof subject imports from China, whereas it determined that the domestic industry was materially injured bythe other subject countries.30 The Commission found that the volume and price trends exhibited bysubject imports from China and other subject imports differed significantly. Whereas the volume andU.S. market share of subject imports from China rose sharply over the period examined, the volumes ofsubject imports from the other countries fluctuated. Moreover, underselling margins of subject importsfrom China were considerably higher than those for other subject imports.31
While the Chinese industry had the largest capacity of all subject countries in the originalinvestigations,32 during the current review period the Chinese industry has significantly increased itscapacity and production in comparison to other subject countries. For example, whereas the Koreanindustry has reduced its capacity and the other subject producers have either kept their capacity steady orincreased their capacity moderately, the Chinese industry *** its production from 29.45 million short tonsin 2000 to *** short tons in 2006.33 Finally, while China exports a significant volume of rebar because ofits size, most of China’s rebar shipments have been made to the home market, like Korea. Exports fromChina accounted for only *** percent of its production in 2006.34 On balance, we find that the conditionsof competition with respect to China are sufficiently different so as to provide a reasonable basis for usnot to exercise our discretion to cumulate subject imports from China with those from the other subjectcountries.35

35 (...continued)at 26-27 (McCullochs) (“As I look forward, there are several areas of concern for the health of Gerdau Ameristeel'srebar business, but one concern stands out in particular: China. China's rebar production has exploded in the lastseveral years and now accounts for almost 40 percent of global production.”); at 32 (Parrish) (“The threat fromChina has reached epic proportions as that country has almost 50 million tons of excess capacity and is exporting itsrebar at rapidly expanding rates.”); at 164 (Price) (“What is clear with China is that they are a disruptive force on theentire market right now on a global basis. They are disruptive to the U.S. They are disruptive to the third countryexport markets that the CIS producers are currently claiming to want to focus on.”). 36 Subject imports from Indonesia increased from 44,504 short tons in 1998 to 69,261 short tons in 1999 beforedeclining to zero in 2000. CR/PR at Table I-1. 37 CR/PR at Table IV-42. 38 See, e.g., USITC Pub. 3425 at VII-4 (Indonesia) and VII-5-VII-6 (Korea); Memorandum INV-Y-087 at TablesVII-3 (Indonesia) and VII-4 and VII-5 (Korea). 39 No Indonesian producer submitted a foreign producers’ questionnaire response. CR at IV-31, PR at IV-21. The information that we were able to collect may be contradictory, i.e., published data suggesting a smaller industryversus information that there is a new rebar producer in Indonesia. See CR at IV-32, PR at IV-21. 40 CR/PR at Tables IV-18 and IV-19 (Korea), CR at IV-32 n. 24, PR at IV-21 n. 24 (Indonesia). 41 CR at IV-38, PR at IV-24. 42 Memorandum INV-Y-087 at Tables VII-3. 43 See, e.g., CR/PR at Table IV-14 (showing increasing exports of rebar from China throughout Asia, includingIndonesia).
56
3. Indonesia
The following factors indicate significant differences in the conditions of competition facingIndonesian producers as compared to producers in the other subject countries.
Subject import penetration from Indonesia differed from that of most of the other subjectcountries during the original period examined. Indonesia exited the U.S. market in the final year of theperiod of investigation.36 Like Korea, Indonesia’s export pattern in the original investigations appears tohave been affected by the Asian financial crisis, which resulted in a decline in demand for rebar in thepreviously expanding Asian markets.37 The disruption in the Asian markets particularly affectedproducers in countries such as Indonesia and Korea, both of which experienced suppressed home marketdemand in 1998 and 1999, with improved home market shipments in 2000.38 While the industries inIndonesia and Korea shared similar conditions of competition in the original period examined, it isunclear as to whether they are similarly situated now. Whereas the record shows that Korea has reducedits capacity during the period of review, the record for Indonesia is insufficient to make a similarfinding.39 Moreover, the record shows that the Korean rebar industry is focused on its home marketwhereas the record for the Indonesian industry permits no such conclusion.40 With regard to this factor,Indonesia’s shipment patterns likely could be affected as the Chinese industry exports larger volumes ofrebar into the Asian region. Whereas Korea is a net importer of rebar,41 the only information available forIndonesia dates from the original period of investigation which shows that the Indonesian industry reliedupon exports.42 This suggests that the Indonesian industry likely will become more export dependent as itencounters Chinese competition both in its home market and in its export markets.43 On balance, we findthat the conditions of competition with respect to Indonesia are sufficiently different so as to provide areasonable basis for us not to exercise our discretion to cumulate subject imports from Indonesia withthose from the other subject countries.

44 See, e.g., USITC Pub. 3425 at VII-8-9. 45 CR at IV-67, PR at IV-41; Ukrainian Respondent’s Prehearing Brief at 9. 46 CR at IV-67-68, PR at IV-41. 47 CR at IV-68, PR at IV-41. 48 See, e.g., CR/PR at Table I-11. In 2006, Border Steel accounted for *** percent of U.S. production of rebar. Id. 49 CR/PR at Table IV-33. 50 CR/PR at Table IV-35. 51 See, e.g., CR at IV-74, PR at IV-43.
57
4. Ukraine
The following factors indicate significant differences in the conditions of competition facingUkrainian producers as compared to producers in the other subject countries.
Ukraine’s rebar industry has undergone significant changes since the original investigations thatdistinguish it from the rebar industries in the other subject countries. During the original investigations,the Commission identified two state-owned Ukrainian producers of rebar, Krivoi Rog Mining &Metallurgical Integrated Works (“Krivorozhstal”) and Kramatorsk Iron & Steel Works (“Kramatorsk”).44 During the current review period, Krivorozhstal was privatized and purchased in 2005 by Mittal, whicheventually brought the company under the control of the multinational Mittal Steel Group of steelcompanies.45 Mittal Steel Kryviy Rih (“MSKR”) accounts for about *** percent to *** percent of theUkraine market.46 According to available information, one or more producers may account for theremaining rebar production in Ukraine.47 As of April 2007, Arcelor Mittal Steel purchased Mexican long-products producer Siderurgica Lazaro Cardenas las Truchas SA de CV, which owns the assets of U.S.rebar producer Border Steel, Inc., thereby creating an affiliation between Border Steel and the largestUkrainian producer.48
Like most of the other European producers, Ukraine is export dependent, with its largest producerexporting more than *** percent of its shipments.49 Unlike the other European subject producers,however, Ukraine’s exports are more widely divergent, i.e., they are not focused on a nearby regionalmarkets such as the EU or the CIS. Indeed, a significant amount of exports from Ukraine are directedtoward Africa and the Middle East, and to a greater degree than other subject producers.50
Finally, the record also indicates that Ukraine is the only subject country that faces tariff barriersor quantitative restrictions in third-country markets. Ukraine’s exports are subject to a countervailingduty order with a margin of 21 percent in Russia and a quota of 235,750 metric tons (2007 level) in theEuropean Union.51
For these reasons, we find that the conditions of competition with respect to Ukraine aresufficiently different so as to provide a reasonable basis for us to decline to exercise our discretion tocumulate subject imports from Ukraine with those from the other subject countries.
52 See, e.g., CR at IV-43, PR at IV-28; CR at IV-63, PR at IV-37. 53 See CR/PR at Tables IV-22 and IV-23 (Latvia) and IV-29 and IV-31 (Poland). In the original investigations,Latvia’s principal export markets after the United States included ***. Memorandum INV-Y-087 at VII-14. WhilePoland was focused on its home market during the original investigations, its principal export markets after theUnited States included ***. Memorandum INV-Y-087 at VII-18, Table VII-8. 54 CR/PR at Table IV-29. 55 CR/PR at Table IV-22. 56 CR/PR at Table IV-22. 57 CR/PR at Table IV-31. 58 See, e.g., CR at IV-43, PR at IV-28-29; CR/PR at Tables IV-46 and IV-47. 59 CR/PR at Table IV-9 (Belarus) (the ratio of exports to shipments increased from *** percent in 2000 to ***percent in 2006); CR/PR at Table IV-25 (Moldova) (the ratio of exports to shipments increased from *** percent in2000 to *** percent in 2006). 60 In the original investigations, Belarus marketed its products worldwide, but its principal export marketsincluded ***. Memorandum INV-Y-087 at VII-2. In the original investigations, Moldova’s principal exportmarkets after the United States included ***. Memorandum INV-Y-087 at VII-16.
58
5. Latvia and Poland
We find similarities in the conditions of competition in the U.S. market with respect to Latvia andPoland such that it is appropriate to cumulate subject imports from these countries with each other, butnot with subject imports from other subject countries.
Both Latvia and Poland joined the European Union in 2004.52 Since joining the EU, both Latviaand Poland have shifted their focus to a significant extent to the internal EU market, including their homemarkets.53 With respect to Poland, a large percentage of its shipments have been to its home market, ***percent to *** percent between 2004 and 2006.54 And while most of Latvia’s shipments are exported, it,too, has increased its focus on the home market in recent years.55 More important, to the extent that bothcountries export, they now focus on the European Union. In 2006, most of Latvia’s exports were to EUdestinations, continuing a trend that can be seen throughout the review period.56 In the case of Poland,eight of its top ten export markets in 2006 were EU member states, which is consistent with its exportpatterns throughout the review period.57 Subject producers in Latvia and Poland have significantincentives to ship to the EU, such as close proximity, preferential transportation tariffs for shipmentswithin the EU, tariff advantages over non-EU suppliers, no possibility that trade remedy measures will beapplied to intra-EU shipments, and relatively high prices.58 These incentives likely will continue to existin the reasonably foreseeable future.
Thus, while we recognize that there are some differences in the conditions of competition facingLatvia and Poland, e.g., their differing orientation toward the home market, we find that the similaritiesoutweigh these differences.
6. Belarus and Moldova
Unlike subject industries in Latvia and Poland, the industries in Belarus and Moldova do notshare the same advantages of EU membership. Moreover, the ratio of export shipments to total shipmentsfor the industries in Belarus and Moldova have increased over the period.59 While Belarus and Moldovaare export oriented, however, their focus primarily is on supplying the markets in their region.60 Duringthe period of review, the Belarusian producer has shipped the majority of its rebar to Russia and othermembers of the Commonwealth of Independent States (“CIS”), the European Union, and its home

61 CR at IV-21, PR at IV-15. In 2006, *** percent of Belarusian shipments were to its home market, *** percentto the EU and *** percent to other markets, which for the Belarusian producer is Russia and the CIS countries. CR/PR at Table IV-10. 62 CR at IV-52, PR at IV-33; CR/PR at Table IV-26. 63 See, e.g., Table IV-43 and IV-44; CR at IV-94, PR at IV-52. 64 See Certain Cast-Iron Pipe Fittings from Brazil, the Republic of Korea, and Taiwan, Inv. Nos. 731-TA-278-280(Final), USITC Pub. 1845 (May 1986), aff'd, Fundicao Tupy, S.A. v. United States, 678 F. Supp. 898 (Ct. Int'l Trade1988), aff'd, 859 F.2d 915 (Fed. Cir. 1988); Mukand Ltd. v. United States, 937 F. Supp. 910, 915 (Ct. Int’l Trade1996)). 65 Chairman Pearson determines that subject imports from Korea will have no discernible adverse impact on thedomestic industry. 66 USITC Pub. 3425 at 13. 67 CR at I-11, PR at II-7. 68 USITC Pub. 3425 at 15.
59
market.61 Likewise, the Moldovan producer exports most of its shipments to Russia and Ukraine.62 Subject producers in Belarus and Moldova have significant incentives to ship to markets in their regionand these incentives likely will continue in the reasonably foreseeable future. In particular, Russia andthe CIS states offer close proximity, strong demand, and relatively high prices.63
Thus, while we recognize that there are some differences in the conditions of competition facingBelarus and Moldova, we find that the similarities outweigh these differences.
B. Likelihood of a Reasonable Overlap of Competition
In assessing likely competition for purposes of cumulation in original investigations, theCommission generally has considered four factors intended to provide a framework for determiningwhether the imports compete with each other and with the domestic like product: (1) fungibility; (2) salesor offers in the same geographic markets; (3) common or similar channels of distribution; and (4)simultaneous presence.64 In five-year reviews, the relevant inquiry is whether there likely would be areasonable overlap of competition even if none currently exists because the subject imports are absentfrom the U.S. market. We consider these four factors in addition to those discussed above with respect tosubject imports from Belarus, Latvia, Moldova, and Poland. Because we have found that uniqueconditions of competition apply individually to China, Indonesia, Korea, and Ukraine, we do not considerthe issue of likely reasonable overlap of competition with respect to subject imports from China,Indonesia, Korea, and Ukraine.65
In the original investigations, the majority of the Commission cumulated subject imports from allsubject countries with the exception of China, based on a reasonable overlap of competition.66
Fungibility. Rebar is a highly fungible product, with domestically produced product andimported product being readily interchangeable.67 Virtually all rebar produced, sold, or used in theUnited States meets certain common standards, such as ASTM specifications, and state and local buildingcodes, which dictate minimum requirements for chemical composition, tensile strength, yield strength,and elongation tolerances. Both domestically produced rebar and subject rebar are available in sizes #3 to#18 and are usually sold in lengths of 20, 40, or 60 feet. In the original investigations, all U.S. producersand a majority of importers considered domestic rebar and imported rebar to be interchangeableregardless of the country of origin.68 In these reviews, a majority of domestic producers, and of

69 CR/PR at Table II-6. 70 CR/PR at Table I-10. 71 CR at II-19-20, PR at II-13-14. 72 CR at IV-15, PR at IV-11, CR/PR at Table IV-5. In the original investigations, Vice Chairman Okunconducted a regional industry analysis. 73 Because we decline to cumulate subject imports from China, Indonesia, or Ukraine with each other or withthose from any other subject countries on the basis of differences in likely conditions of competition, we find itunnecessary to decide the issue of no discernible adverse impact with respect to China, Indonesia, or Ukraine. Cf.Top-of-the-Stove Stainless Steel Cooking Ware from Korea, INV Nos. 701-TA-267 and 731-TA-304 (Review)(Remand), USITC Pub. 3485 (Jan. 2002) at 5 (declining to address criterion of no discernible adverse impact in theabsence of evidence of a reasonable overlap of competition).
60
responding importers and purchasers reported that domestic and imported bar were generally viewed to beinterchangeable.69
Channels of Distribution. In the original investigations, domestically produced rebar andimported rebar were sold to both distributors and fabricators. In these reviews, domestically producedrebar and imported rebar continued to be sold to the same categories of customers. Roughly one-half ofdomestic rebar was sold to firms that function as both end users and distributors, with the remainder goingto end users and distributors. The diminished volumes of subject imports were mostly sold todistributors.70
Six responding firms reported that “Buy American” provisions apply to 50 or more percent oftheir purchases, while the other 12 firms reported that they applied to 40 percent or less of total purchases. Four responding firms reported that their domestic purchases were not covered by “Buy Americanpurchases.71 Thus, the majority of purchases are not covered by “Buy American” provisions.
Geographic Overlap and Simultaneous Presence in the Market. As noted above, the Commissionfound these factors to be satisfied in the original investigations. Since imposition of the orders, imports ofrebar from subject countries, with the exception of Latvia, have been virtually non-existent and/orsporadic since imposition of the orders. However, those subject imports that entered the United States didso throughout most of the country, except the northern-most states, during the period of review.72 In theoriginal investigations, subject imports were sold or marketed in a majority of the states. There is noindication that upon revocation, there would not again be geographic overlap and simultaneous presencein the market.
On balance, we find that subject imports from each country would be highly fungible, move inthe same channels of distribution, and compete in the same geographic markets during the same periods. We therefore conclude that there likely would be a reasonable overlap of competition among subjectimports and between subject imports and the domestic like product in the event of revocation.
On balance, we find that there will likely be a reasonable overlap of competition between subjectimports from Belarus, Latvia, Moldova and Poland and the domestic like product as well as amongsubject imports from each of these countries should the orders be revoked.
C. Likelihood of No Discernible Adverse Impact
We consider all relevant factors in analyzing “no discernible adverse impact” in these reviews. Based on the record, Chairman Pearson finds that subject imports from Korea are likely to have nodiscernible adverse impact on the domestic industry in the event the antidumping duty order on importsfrom Korea were revoked. We do not find, however, that subject imports from Belarus, Latvia, Moldovaor Poland are likely to have no discernible adverse impact in the event of revocation of the antidumpingduty orders.73

74 Commissioner Okun does not join this section on Korea. Because she declines to exercise her discretion tocumulate Korea, she does not find it necessary to consider whether imports from Korea would have no discernibleadverse impact. 75 CR/PR at Table IV-17. 76 Id. 77 See, e.g., Certain Carbon Steel Products from Australia, Belgium, Brazil, Canada, Finland, France, Germany,Japan, Korea, Mexico, Poland, Romania, Spain, Sweden, Taiwan, and the United Kingdom, Inv. Nos. AA1921-127(Second Review); 701-TA-319, 320, 325-327, 348, and 350 (Second Review); and 731-TA-573, 574, 576, 578, 582-87, 612, and 614-618 (Second Review), USITC Pub. 3899 at 44-46 (January 2007); Titanium Sponge from Japan,Kazakhstan, Russia, and Ukraine, Inv. Nos. 751-TA-17-20, USITC Pub. 3119 at 9 (August 1998); aff’d, TitaniumMetals Corp. v. United States, 155 F. Supp. 2d 750 (Ct. Int’l Trade 2001). 78 CR/PR at Table IV-18. 79 CR/PR at Table IV-19. 80 CR/PR at Tables IV-18 and IV-20. During the period of review, Korean export shipments were at their highestin 2005, at 474,175 short tons. In that year, Korean production, according to ***, was *** short tons. 81 Memorandum INV-Y-087 at Table VII-4.
61
1. Korea74
The Commission received data from the largest producer of rebar in Korea, Hyundai Steel Co.(“Hyundai”). For this firm, capacity increased overall during the period of review, but declined sharplytoward the end of the period.75 Capacity utilization was extremely high throughout the period. Substantially all of Hyundai’s capacity is devoted to serving increasing home market demand. Hyundai’sshipments to the home market increased strongly over the period of review, from *** short tons in 2001to *** short tons in 2006. Hyundai’s exports, by contrast, fluctuated randomly over the period of review,and never accounted for more than *** percent of total shipments.76
One of the factors the Commission has examined when assessing the issue of “no discernibleadverse impact” is whether it is likely that any production by the subject country will be exported to theUnited States in the reasonably foreseeable future.77 This factor depends in turn on the extent to with theindustry in the subject country relies on exports to market its production of the subject product; i.e., theoverall “export-orientation” of the subject country. In this review, record evidence indicates that it ishighly unlikely that, if the order were revoked, the Korean rebar industry would export significantquantities of rebar either to the United States or to other export markets.
Information obtained by the Commission concerning the entire Korean industry indicates that, forthe majority of the review period, rebar consumption in the Korean market exceeded rebar production.78 It is apparent from the record that growing home market demand has made Korea a net importer of rebar. Moreover, the production shortfall in Korea is expected to continue, at least until 2011.79 Although Koreadid export rebar during the period of review to a wide variety of destinations, at their peak such exportsaccounted for only *** percent of total Korean production.80 Indeed, because of the consistent excess ofconsumption over production during the period of review, it is more reasonable to characterize the Koreanindustry as import-oriented.
Moreover, this lack of export orientation on the part of the Korean industry is not a completelynew development. In the original investigations, which covered the years 1998 through 2000, totalexports from Korea declined sharply, not just to the United States, but to all markets, ending up at just*** percent of total shipments by 2000, while domestic shipments increased rapidly.81 These trendslikely reflect the Korean economy’s recovery from the Asian financial crisis, which was at its most severe
82 During the original investigations, Korean exports peaked at *** short tons in 1998, nearly *** percent of totalshipments, before declining to *** short tons in 1999 (*** percent of total shipments), and bottoming out at ***short tons in 2000 (*** percent of total shipments). Id. 83 CR/PR at Table IV-9 (Belarus 2006 production capacity of *** short tons); CR/PR at Table IV-21 (Latvia 2006production capacity of *** short tons); CR/PR at Table IV-25 (Moldova 2006 production capacity of *** shorttons); and CR/PR at Table IV-30 (Poland 2006 production capacity of *** short tons). 84 See e.g., CR/PR at Table IV-9 (Belarus); CR/PR at Table IV-21 (Latvia); CR/PR at Table IV-25 (Moldova);and CR/PR at Table IV-28 (Poland). 85 CR at I-21-26, PR at I-19-22. 86 See, e.g., CR/PR at Table II-6 .
62
in 1998.82 Hence, because the Korean industry is currently so heavily dependent on imports, and has beenso for at least the last five years, it is difficult to accept the theory that the industry will shift its focus toexporting, either to the United States or to other export markets, in the reasonably foreseeable future.
In sum, in examining the degree of export orientation of the Korean industry, Chairman Pearsonfocuses on the concept that, given the current import-dependent state of the Korean industry, there wouldlikely be no discernible effect of revocation of the order on the U.S. rebar industry, whether in terms ofimpact on domestic prices, financial performance, or market share. In other words, given the fact thatKorea must import rebar, whether the United States maintains an order on Korean rebar is essentiallyirrelevant to the Korean industry. Although this likely lack of effect results from the likelihood ofcontinued insignificant levels of exports from Korea to the United States, this does not imply thatChairman Pearson has examined only likely volume in making my determination. Rather, becauseChairman Pearson finds it extremely unlikely that the Korean industry will shift from being import-dependent to being export-oriented in the reasonably foreseeable future, he cannot find it likely that theactivities of the Korean producers will have any effect on the U.S. industry in that time frame. Thus,Chairman Pearson determines that any imports from Korea would have no discernible adverse impact onthe U.S. industry in the event the order on rebar from Korea is revoked.
Accordingly, Chairman Pearson concludes that, in the event the antidumping order on imports ofrebar from Korea is revoked, imports of rebar from Korea are likely to have no discernible adverse impacton the domestic industry producing rebar. Therefore, Chairman Pearson declines to cumulate importsfrom Korea in making his determination in this review, and he concurs with the views of the Commissionmajority in concluding that material injury to the U.S. rebar industry would not continue or recur if theantidumping order on imports from Korea were revoked.
2. Belarus, Latvia, Moldova, and Poland
In these reviews, each of these subject countries has significant capacity to produce subjectmerchandise in appreciable volumes.83 The rebar industries in these subject countries export substantialvolumes.84 Moreover, rebar producers in these subject countries have ready access to the U.S. market. Prior to the imposition of the antidumping duty orders, subject imports from each country were present inthe U.S. market, and we find that subject imports from each country are likely to have at least somepresence in the U.S. market upon revocation of the orders.
Rebar manufactured in each of the subject countries does not differ from the types of rebarproduced in the United States,85 and is substitutable for, and competitive with, domestically producedrebar.86 Competition is likely to be based, in large part, on price, in light of the importance of price in

87 See, e.g., CR/PR at Table II-4. 88 See e.g., CR/PR at IV-36; Memorandum INV-Y-087 at Table G-5.
63
purchasing decisions.87 Moreover, rebar producers in these subject countries undersold U.S. producers attimes during the original investigation period.88
Accordingly, we do not conclude that the subject imports from Belarus, Latvia, Moldova orPoland would have no discernible adverse impact on the U.S. market if the orders were lifted. Wetherefore are not precluded from exercising our discretion to cumulate subject imports from thesecountries.
V. Conclusion
We thus determine, based on unique conditions of competition with respect to China, Indonesiaand Ukraine, not to exercise our discretion to cumulate subject imports from China, Indonesia andUkraine with each other or those from any of the other subject countries for purposes of our analysis. Commissioner Okun also determines, based on unique conditions of competition with respect to Korea,not to exercise her discretion to cumulate subject imports from Korea with those from any of the othersubject countries for purposes of her analysis. Chairman Pearson determines that subject imports fromKorea are likely to have no discernible adverse impact on the domestic industry in the event ofrevocation, and are therefore ineligible for cumulation. With respect to Belarus, Latvia, Moldova, orPoland, we find that the no discernible adverse impact exception to cumulation does not apply to any ofthem, and find that there would likely be a reasonable overlap of competition between subject importsfrom each of those countries and the domestic like product as well as among subject imports from eachcountry. We also find similarities in other conditions of competition in the U.S. market with respect toLatvia and Poland such that it is appropriate to cumulate subject imports from these countries with eachother, but not with subject imports from Belarus and Moldova.
Accordingly, we consider subject imports from China, Indonesia, Korea, and Ukraine separatelyfrom each other and all other subject imports, and we cumulate subject imports from Latvia and Polandand consider them separately from the cumulated subject imports from Belarus and Moldova.


1 19 U.S.C. § 1675(d)(2). 2 For a discussion of Chairman Pearson and Commissioner Okun’s cumulation analysis, see Separate andDissenting Views of Chairman Daniel R. Pearson and Commissioner Deanna Tanner Okun Regarding Cumulation. 3 For a discussion of Vice Chairman Aranoff’s cumulation analysis, see Separate Views of Vice Chairman SharaL. Aranoff Regarding Imports from Belarus, China, Indonesia, Moldova, and Ukraine. 4 CR/PR at Table I-1. On an individual basis, subject imports from Latvia peaked in 2004 before ceasing in 2006,while those from Poland virtually ceased after 2001. After 2001, most of the cumulated subject import volume wasfrom Latvia. Id. 5 CR/PR at Table I-1. 6 CR/PR at Tables IV-22 and IV-29. 7 One source estimates total Polish rebar capacity to be *** short tons. CR/PR at Table IV-30.
65
SEPARATE AND DISSENTING VIEWS OF CHAIRMAN DANIEL R. PEARSON,VICE CHAIRMAN SHARA L. ARANOFF, AND COMMISSIONER DEANNA TANNER OKUN
REGARDING LATVIA AND POLAND
I. INTRODUCTION
Section 751(d)(2) of the Tariff Act of 1930, as amended (“the Act”), requires that the U.S.Department of Commerce (“Commerce”) revoke a countervailing duty or an antidumping duty order orterminate a suspended investigation in a five-year review unless Commerce determines that dumping or acountervailable subsidy would be likely to continue or recur and the U.S. International Trade Commission(“Commission”) determines that material injury to a U.S. industry would be likely to continue or recurwithin a reasonably foreseeable time.1 Based on the record in these first five-year reviews, we determinethat material injury is not likely to continue or recur within a reasonably foreseeable time if theantidumping duty orders on subject imports of certain steel concrete reinforcing bars (“rebar”) fromLatvia and Poland were revoked.
We join our colleagues’ discussion regarding domestic like product, domestic industry, the legalstandard governing five-year reviews and conditions of competition. We write separately to discusscumulation and our analysis of the statutory factors.2 3
II. NO LIKELIHOOD OF CONTINUATION OR RECURRENCE OF MATERIAL INJURYUPON REVOCATION OF THE ORDERS ON CUMULATED SUBJECT IMPORTSFROM LATVIA AND POLAND
A. Likely Volume of Subject Imports
In the original investigations, the subject imports from Latvia and Poland fluctuated irregularly,rising from 150,233 short tons in 1998 to 314,678 short tons in 1999 and 276,997 short tons in 2000. After the orders were imposed, subject imports from Latvia and Poland declined from pre-order levels,but remained in the U.S. market at fairly steady levels, averaging about 50,000 short tons a year untilpeaking in 2004 to 129,184 short tons, accounting for 1.5 percent of the U.S. market.4 Cumulated subjectimports from Latvia and Poland then declined sharply to 129 short tons in 2006, accounting for less than0.05 percent of the U.S. market.5 The combined reported capacity of these subject countries’ producerswas *** short tons in 2006,6 although we recognize that data limitations may understate total productivecapacity in Poland.7
In these current five year reviews, several factors support our conclusion that the cumulatedvolume of subject imports from Latvia and Poland would likely not be significant if the orders were

8 CR/PR at Table IV-21. LM’s capacity in 2000 was *** short tons, increased to *** short tons in 2001, andremained at that level throughout the review period. 9 Id. 10 CR/PR at Table IV-30. IISI Steel Statistic Yearbook 2006, at 56, estimates an export to total shipment share of33.0 percent in 2005. CR/PR at Table IV-28. A second known producer is Celsa HUTA Ostrowiec, which had aplanned modernization in 2007 that would increase its overall steel bar capacity to 1.2 million metric tons, most ofwhich was described as being destined for the Polish home market. This improvement includes capacity to produceproducts other than rebar, including plain and flat bars, angles and squares. Record evidence suggests that it nowships mainly to its home market and surrounding markets. Arcelor Mittal also is projected to begin production ofrebar and other bar in Poland in late 2007, to serve the Polish construction market. CR at IV-62-63; PR at IV-36. 11 CR/PR at Tables IV-22, IV-28, and IV-29. Polish exports totaled about one-third of total shipments ***. CR/PR at Tables IV-28 and IV-29. 12 CR/PR at Table IV-22 and LM Posthearing Brief at 1-12. 13 CR/PR at Table IV-22.
66
revoked. With their accession to membership in the European Union, both Latvia and Poland, to theextent that they rely upon exports, have adopted an European-focused strategy. Demand in Europe hasgrown significantly and is projected to remain strong, and the EU market offers important advantages forLatvian and Polish producers. Finally, the industries in both Latvia and Poland have not significantlyexpanded capacity and any planned capacity expansions, in the case of the Polish industry, appear tosupport its growing home market.
Latvia has a single producer, Liepajas Metalurgs (“LM”), which responded to the foreignproducer questionnaire and participated as an interested party. LM reported no mergers or acquisitionsduring the review period, and after an increase in capacity in 2001,8 its productive capacity remainedstable through 2006 at just over *** short tons. No additional capacity expansions are planned. Itscapacity utilization has increased throughout the review period, reaching *** percent in 2006, and isprojected to remain at a high level through 2008.9 At the end of 2006, its excess capacity was less than*** short tons.
Domestic producers identified four potential producers in Poland, of which one, CMC Zawiercie(“CMCZ”), responded to the Commission’s foreign producer questionnaire. CMCZ is estimated to haveaccounted for about *** percent of rebar production in Poland in 2005. It reported capacity of *** shorttons in 2006, and projected an increase in capacity in 2007 to *** short tons. Production estimates for thePolish industry in public data sources suggest that total capacity and production in Poland are *** and946,000 short tons, respectively.10 Reported excess capacity at the end of 2006 is unknown, given theoverall limited production data on the record.
To varying degrees, the industries in Latvia and Poland consistently have exported rebar. Duringthe review period, Latvia exported almost all of its production – with overall exports declining slowly as ashare of total shipments, from *** percent of total shipments in 2001 to *** percent in 2006. Polandexported a much lower percentage of its shipments, about 33 percent, maintaining a focus on its homemarket throughout the review period.11 Record evidence shows that home market shipments in bothcountries are predicted to increase through 2008, but that overall shipment patterns should remainconsistent with those exhibited during the review period.
In 2004, Latvia acceded to membership in the European Union. While the EU had been animportant export market for LM throughout the review period,12 this focus increased notably as Latviajoined the EU. In 2001, Latvia shipped *** percent of its total shipments to the EU; this rate peaked at*** percent in 2005, before settling at *** percent in 2006. Exports to the EU are projected to remain atabout *** of total shipments in the foreseeable future.13 World Trade Atlas data show exports fromLatvia to more than a dozen EU countries in 2006, with the United Kingdom, Germany, and Ireland
14 CR/PR at Table IV-23. 15 Id. 16 CR/PR at Table IV-23. 17 CR/PR at Tables I-1 and IV-31. 18 CR/PR at Table IV-29 (note). 19 Beginning in September 2003, subject imports from Latvia entered the United States as non-subject alloy rebar(HTS subheading 7228.80.50). ***. CR at IV-5-6; PR at IV-5.
RTAC alleges that, with this import pattern, LM and its U.S. customer, ***, were taking actions to evadethe antidumping duties on the subject rebar imported from Latvia. According to RTAC, these actions followed whatit describes as an incorrect Customs ruling that the Latvian rebar was not subject to the order. Coincidental with asubsequent Customs reversal of its ruling and the imposition of duties on the imports from Latvia, RTAC states thatsuch import volumes ceased. RTAC argues that these actions during the review period demonstrate a continuinginterest in the U.S. market by LM. LM Prehearing Brief at 41; CR/PR at IV-5. The record shows that imports fromLatvia were lower in 2005. ***. CR at IV-7; PR at IV-5. The record does not permit us to conclude, as RTACargues, that it was the reversal of the Customs ruling, as opposed to Latvia’s accession to the EU, that caused LM’sexports to the United States to decline. 20 RTAC Prehearing Brief at 77-78. 21 RTAC Prehearing Brief at 46-47. 22 CR/PR at Table IV-43.
67
combined accounting for the three largest shares, and totaling 38.4 percent of total exports.14 Algeria andRussia each accounted for a significant share of exports as well; exports to Algeria peaked at 141,012tons in 2002, fell to zero in 2004, and then grew to 73,470 tons, while exports to Russia grew from 593tons in 2001 to 45,791 tons in 2006.15 Other than the export volumes to the United States discussedabove, LM had only a very small volume of exports to countries in the Western Hemisphere after 2003.16
Like Latvia, Poland became an EU member in 2004. It has continued its home market focussince its accession, although total exports, on an absolute basis, have increased. World Trade Atlas datashow that overall exports from Poland to the world increased from a low of 99,579 short tons in 2002, to340,022 short tons in 2006. All of Poland’s principal export markets are EU member states, with themost significant volume, 84.5 percent, destined for just five countries: Germany, Czech Republic,Slovakia, Hungary, and Portugal. With the exception of the small volumes of subject imports entering theUnited States during the period of review, it does not appear that Poland exported rebar to any otherWestern Hemisphere country.17
CMCZ has stated that it would examine whether to resume exports if the order were revoked.18 RTAC uses this statement to argue that the subject producers have an incentive to increase subjectimports to the U.S. market if the orders were revoked.19 For several reasons, we do not find that theconsiderations cited by RTAC change our conclusion that significant volumes of subject imports fromLatvia and Poland are not likely to be redirected to the United States within the reasonably foreseeablefuture.
RTAC argues that both Latvia and Poland are export platforms,20 and as such have an incentive toincrease exports to the United States.21 We disagree. Global demand has increased significantly since theoriginal investigations, increasing from *** short tons in 2001 to *** short tons in 2006, an increase of*** percent. While North American growth approached *** percent, Europe and the CIS, both of whichare important markets for the subject industries in Latvia and Poland, grew at *** percent and ***percent, respectively.22 This volume growth, strengthened by export patterns for these two countries thatshow, for Latvia, a shift to a more European-focused strategy, and, in the case of Poland, maintaining aEuropean-focused strategy, diminishes the likelihood that cumulated subject imports from Latvia andPoland will shift to the United States if the orders were revoked. Subject producers in Latvia and Poland

23 See, e.g., CR at IV-43, PR at IV-28. According to record data, Europe has strong demand for rebar in partbecause its consumption outstrips regional production. Compare CR/PR at Table IV-43 with CR/PR at Table IV-40. This phenomena is projected to continue for the reasonably foreseeable future. Compare CR/PR at Table IV-44 withCR/PR at Table IV-41. 24 JSCC Moldova Steel Works Posthearing Brief, Att. 1. 25 RTAC Prehearing Brief at 79-81. 26 See, e.g., CR/PR at Tables IV-46 and IV-47. 27 CR/PR at Table IV-46. 28 CR/PR at Table IV-47. 29 CR at IV-50; PR at IV-33, and LM Prehearing Brief at 17. LM notes in its brief that its ***. 30 CR/PR at Table IV-24.
68
have significant incentives to ship to the EU and these incentives likely will continue in the reasonablyforeseeable future. The EU market offers close proximity, preferential transportation tariffs for shipmentswithin the EU, tariff advantages over non-EU suppliers, no possibility of trade remedy measures beingimposed on shipments within the EU, and strong demand.23
Further, we do not see any pending shift for Poland away from its focus on its home market. Inits 2006 Annual Report, CMCZ’s parent company stated that the Polish and adjacent markets areexpected to remain strong.24
RTAC also argues that stronger prices in the U.S. market will provide an incentive for subjectproducers to shift exports currently made to other markets to the United States.25 While the record showssome AUV gaps among the export markets for Latvia and Poland compared to the United States, overall,record data establish that in the European market and in particular in those countries that serve as theprincipal export markets for these subject producers, prevailing market prices are near, and at timesexceed, those in the United States.26 This fact is particularly significant in analyzing likely import volumefrom Poland, as rebar prices in Poland generally have been comparable to or exceeded those in the U.S.market for the last year.27 Likewise, published prices throughout the EU market generally have beencomparable to or higher than those in the U.S. market for the past 12 months.28 Thus, we do not concludethat pricing in the U.S. market is sufficiently attractive relative to pricing in the principal markets forrebar from Latvia and Poland for the Latvian and Polish rebar industries to shift to the U.S. marketsignificant volumes of rebar currently being shipped elsewhere.
Neither Latvia nor Poland faces any third country barriers to their exports. Inventories in bothcountries as a ratio to total shipments were very low and declined during the review period. Respondingproducers in each country have the capability to shift production among various bar products, thusallowing for possible product-shifting if the orders are revoked. However, LM reports that it *** toswitch production in response to relative price changes of bar products, given that alternate products suchas angles and shapes command higher prices, and its rebar production is constrained by rebar rollingcapacity.29 Moreover, the production volume of such alternative products was very low during the periodof review, suggesting that any scope for product-shifting would be limited at best.30 Finally, anyincreases in production of subject rebar likely will be directed to the EU market, as has been the patternover the most recent period, with capacity utilization rising even as capacity and exports also increased.
Thus, although revocation of the orders on rebar from Latvia and Poland likely will result in someadditional volume of subject imports into the United States, we do not believe that the additional volumewill be significant in light of the strong and growing demand in the current principal markets for thesesubject industries. We consequently conclude that any likely increase in subject imports from Latvia andPoland would not be significant either in absolute terms or relative to production or consumption in theUnited States if the orders were revoked.

31 CR at V-30; PR at V-14. 32 CR/PR at Table V-13. 33 The Commission collected quarterly pricing data on four rebar products. Data were received from domesticproducers, and from importers of subject rebar from Korea and Latvia. 34 CR/PR at Tables II-4 and II-6. 35 See, e.g., CR/PR at Tables V-1, V-4, V-7, and V-10. 36 CR at II-11; PR at II-7. 37 CR at V-1; PR at V-1. 38 RTAC Prehearing Brief at 42. 39 MSW’s Posthearing Brief at 5-10, Attachments 1, 2, 4, and 6; CR at IV-92-93, PR at IV-52.
69
B. Likely Price Effects of Subject Imports
In the original investigations, rebar from Latvia and Poland undersold the domestic like productin all or most comparisons.31 In these reviews, price data for Latvia were not sufficient to establish atrend, but generally oversold domestic rebar.32 There were no price comparisons for imports from Polandin these reviews.33
As during the original investigations, we continue to find that domestically produced andimported rebar are generally substitutable, and that price is an important factor in purchasing decisions.34 However, we find that the price effects from the cumulated subject imports from Latvia and Poland likelywill not be significant both based on our finding that the volume of these cumulated subject imports likelywill not be significant and because we find no incentive for producers in these countries to priceaggressively any volumes they do sell or offer to sell in the U.S. market.
According to the pricing data collected in these reviews, U.S. prices of rebar fluctuated within agenerally limited range from 2001 through 2003. Substantial price increases began in the first quarter of2004, rising by 33 percent to 43 percent, for the four products for which data were collected. Accordingto these data, the U.S. industry’s prices for these products doubled or nearly doubled over the period ofreview.35
Although the single largest increase in consumption occurred earlier in the review period, from2002 to 2003, consumption remained strong throughout the period, buoyed by strong construction activityin the U.S. market, especially in major rebar-using projects such as roads, bridges and nonresidentialconstruction.36 Prices also were heavily influenced by the increases in raw material costs, particularlysteel scrap, that occurred in early 2004, when scrap prices rose to $251 per ton, compared to $68 per tonin January 2001. Scrap prices fluctuated after 2004, but generally remained strong, peaking at $305 perton in March 2007.37
The domestic industry argues that for LM, its price behavior in the U.S. market during the reviewperiod, based on comparisons of U.S. and Latvian AUVs, shows it selling consistently below U.S.producer prices.38 We note, however, that even with this difference, the domestic industry was able toincrease its prices, its AUVs, and its overall financial performance, despite the presence in the U.S.market of the subject imports from Latvia. Further, a comparison of actual import pricing reported inCommission questionnaires for Latvian rebar and the domestic like product showed overselling in amajority of comparisons.
RTAC also argues that the high and increasing prices in the U.S. market are unlikely to continueto the extent that demand growth is slowing or demand is declining in the reasonably foreseeable future. The record indicates otherwise. As noted in our discussion of conditions of competition, demand in theU.S. market is likely to remain fairly steady for the reasonably foreseeable future. Nonresidentialconstruction generally is expected to remain very strong.39 The record also indicates that global demand

40 CR/PR at Table IV-44. 41 CR/PR at Table C-1. In addition, U.S. exports increased by 31.3 percent. Id. 42 Id. 43 Id. 44 Id. 45 We also note that, while up to 10 of the 24 to 25 reporting firms reported losses during the period 2001 through2004, only two firms (***) reported operating losses either in 2005 or 2006. CR/PR at Tables III-9 and III-10. 46 *** forecasts that North American consumption of rebar will increase steadily from 2007 through 2010. CR/PR at Table IV-44. Consumption is forecast to increase in other global regions as well; most strongly in Eastand Southeast Asia, and more moderately in the European market. Id.
70
is likely to remain strong and growing in the reasonably foreseeable future.40 Because, as describedabove, prices in the home and regional markets of Latvia and Poland are at least as attractive as prices inthe U.S. market, we do not find it likely that any increased volumes from Latvia and Poland in the eventof revocation (the level of which we do not expect to be significant, as explained above) would be likelyto be sold at prices that significantly undersell the domestic like product or that significantly suppress ordepress prices for the domestic like product. Given their apparent lack of excess capacity and attractiveprices in their existing markets, we do not find that subject producers from Latvia and Poland have anincentive to price aggressively in order to move significant volumes into the U.S. market.
Based on these findings as well as our finding that the volume of cumulated subject imports fromLatvia and Poland is not likely to be significant, we do not find that there is likely to be significantunderselling by these subject imports as compared to the domestic like product, or that imports from thesesubject countries are likely to enter the United States at prices that otherwise would have a significantdepressing or suppressing effect on the price of the domestic like product. We consequently concludethat the subject imports from Latvia and Poland are not likely to have significant price effects if the orderswere revoked.
C. Likely Impact of Subject Imports
The record of these reviews indicates that, after issuance of the orders on the subject countriesand a decline in subject import levels, the domestic industry initially made only modest gains in marketshare. However, domestic producers’ production, U.S. shipments, and net sales, after declining slightly in2001 with the economic recession, began to recover in 2002 and 2003, and showed dramaticimprovement through 2006. Between 2001 and 2006, production increased overall 25.3 percent, U.S.shipments increased 23.6 percent, and net sales increased 25.1 percent.41 With production capacityincreasing less rapidly than production (a gain of 9.2 percent between 2001 and 2006), capacityutilization increased by 11.5 percentage points in this same period.42 While domestic employmentincreased only slightly (2.5 percent) between 2001 and 2006, productivity increased 22.3 percent.43 Despite substantially reduced subject import levels, the industry posted deteriorating operating marginsfrom 2001 (6.6 percent) to 2003 (3.1 percent) before improving sharply in 2004 (15.4 percent), andcontinuing to rise throughout the remainder of the review period, peaking at 20.7 percent in 2006.44
In light of these data showing a healthy and vibrant industry, we do not find the domestic rebarindustry to be vulnerable.45 Moreover, the conditions that have enabled the industry to realize its recentprofits are not likely to change in the foreseeable future. As discussed in the Commission’s views, strongdemand in the non-residential construction market, a major user of rebar, is expected to continue, not justin the U.S. market, but globally as well.46 While raw material costs (primarily steel scrap) increasedsharply toward the end of the period of review, and continue to be high, these costs have been more thanmatched by domestic price increases, which, for the most part, have leveled off at historically high levels

47 CR/PR at Figure V-1; CR/PR at Tables V-1-V-12. Increases in sales value also outpaced increases in costs. Thus, domestic producers’ unit sales values rose from $268 per short ton in 2001, to $518 per short ton in 2006, anincrease of 93.2] percent. CR/PR at Table C-1. At the same time, unit COGS rose from $235 per short ton in 2001to $383 per short ton in 2006, a smaller increase of 62.9 percent. CR/PR at Table III-9. This differential improvedover the review period, as COGS as a ratio to sales dropped from 87.8 percent in 2001 to 74.0 percent in 2006. Id. 48 CR/PR at Tables V-1-V-12.
71
and show few signs of reversing direction.47 Thus, domestic prices rose significantly in 2004 above theirlevel from the original investigations and the beginning of the period examined in these reviews.48
Consistent with our findings that the likely volume and likely price effects of subject importsfrom Latvia and Poland will not be significant, we find that subject imports would not be likely to have asignificant adverse impact on the domestic industry’s output, sales, market share, profits, or return oninvestment, if the orders were revoked. Based on the strong expected demand in the United States andglobal markets and the current robust condition of the domestic industry, the small volumes of subjectimports from Latvia and Poland that would be likely upon revocation would not be likely to have asignificant adverse impact on the domestic industry.
III. CONCLUSION
For the foregoing reasons, we find that revocation of the antidumping duty orders on certain steelconcrete reinforcing bars from Latvia and Poland would not be likely to lead to continuation or recurrenceof material injury to an industry in the United States within a reasonably foreseeable time.


1 19 U.S.C. § 1675(d)(2). 2 For a discussion of Chairman Pearson and Commissioner Okun’s cumulation analysis, see Separate andDissenting Views of Chairman Daniel R. Pearson and Commissioner Deanna Tanner Okun Regarding Cumulation. 3 CR/PR at Table I-1. 4 CR/PR at Tables IV-9 and IV-25.
73
SEPARATE AND DISSENTING VIEWS OF CHAIRMAN DANIEL R. PEARSON ANDCOMMISSIONER DEANNA TANNER OKUN REGARDING BELARUS, CHINA, INDONESIA,
AND MOLDOVA
I. INTRODUCTION
Section 751(d)(2) of the Tariff Act of 1930, as amended (“the Act”), requires that the U.S.Department of Commerce (“Commerce”) revoke a countervailing duty or an antidumping duty order orterminate a suspended investigation in a five-year review unless Commerce determines that dumping or acountervailable subsidy would be likely to continue or recur and the U.S. International Trade Commission(“Commission”) determines that material injury to a U.S. industry would be likely to continue or recurwithin a reasonably foreseeable time.1 Based on the record in these first five-year reviews, we determinethat material injury is not likely to continue or recur within a reasonably foreseeable time if theantidumping duty orders on subject imports of certain steel concrete reinforcing bars (“rebar”) fromBelarus and Moldova were revoked. We also determine that material injury is likely to continue or recurwithin a reasonably foreseeable time if the antidumping duty orders on subject imports of rebar fromChina and Indonesia were revoked.
We join our colleagues’ discussion regarding domestic like product, domestic industry, the legalstandard governing five-year reviews and conditions of competition. We write separately to discusscumulation and our analysis of the statutory factors.2
II. NO LIKELIHOOD OF CONTINUATION OR RECURRENCE OF MATERIAL INJURYUPON REVOCATION OF THE ORDERS ON CUMULATED SUBJECT IMPORTSFROM BELARUS AND MOLDOVA
A. Likely Volume of Subject Imports
In the original investigations, the subject imports from Belarus and Moldova fluctuatedirregularly, rising from 210,313 short tons in 1998 to 262,341 short tons in 1999 and 238,445 short tonsin 2000. After the orders were imposed, subject imports from Belarus virtually ceased with the exceptionof small volumes in 2002, while those from Moldova completely ceased.3 On a cumulated basis, subjectrebar imports from Belarus and Moldova reached 2,820 short tons in 2002, accounting for less than 0.05percent of the U.S. market, before exiting the U.S. market. The combined reported capacity of thesesubject countries’ producers was *** short tons in 2006.4
In these current five year reviews, several factors support our conclusion that the cumulatedvolume of subject imports from Belarus and Moldova would likely not be significant if the orders wererevoked. Both Belarus and Moldova have adopted a strategy to supply their regional markets. Demandin Europe and Russia and other members of the Commonwealth of Independent States (“CIS”) has grownsignificantly and is projected to remain strong, and the regional markets offer advantages for Belarus andMoldova. Finally, the industries in both Belarus and Moldova have operated at fairly high levels ofcapacity utilization and have only modest levels of unused capacity.
Belarus and Moldova each have a single producer, Byelorussian Steel Works (“BMZ”) and JSCCMoldova Steel Works (“MSW”), respectively. Both responded to the foreign producer questionnaire and

5 CR/PR at Tables IV-9 and IV-10. In the original investigation, BMZ reported that it anticipated ***. SeeOriginal Investigation Confidential Staff Report (Memorandum INV-Y-087), May 1, 2001, at Table VII-1. 6 CR at IV-24, PR at IV-15. See also BMZ’s Posthearing Brief at 3 (disputing claim by the domestic industry thatan upgrade to its rolling mill will affect rebar production. Rather, BMZ reports that the upgrade will affect only itswire rod production). 7 CR/PR at Table IV-10. 8 CR/PR at Table IV-10. 9 CR/PR at Tables IV-25 and IV-26. 10 CR/PR at Table IV-26. 11 CR/PR at Table IV-26. 12 CR/PR at Tables IV-10 and IV-26. 13 CR at IV-21, PR at IV-15. 14 CR/PR at Table IV-10. 15 CR/PR at Table IV-10. See also BMZ’s Posthearing Brief at 1-2. 16 CR/PR at Tables I-1 and IV-10.
74
filed briefs. While both industries increased their capacity during the period of review, it appears thatthey did so to meet growing demand in their regional markets. Belarusian producer BMZ’s capacity in2000 was *** short tons, increased to *** short tons in 2001, and gradually increased to *** short tons in2005. Its productive capacity remained stable through 2006.5 No additional capacity expansions areplanned for rebar.6 Its capacity utilization has remained high throughout the review period, reaching ***percent in 2006, and is projected to remain at a high level through 2008.7 At the end of 2006, its excesscapacity was only *** short tons.8 Moldova’s MSW reported no mergers or acquisitions during thereview period, and after an increase in capacity from *** short tons in 2000,9 just prior to the reviewperiod, its productive capacity remained stable through 2006, at just over *** short tons. No additionalcapacity is planned. *** plummeted in 2002, its capacity utilization has remained relatively highthroughout the review period, reaching *** percent in 2006, and is projected to remain at a high levelthrough 2008.10 At the end of 2006, its excess capacity was *** short tons.11
Both Belarus and Moldova are significant exporters of rebar. During the review period, Belarusexported *** of its production – with overall exports declining slowly, from *** percent of totalshipments in 2001 to *** percent in 2006, while Moldova has consistently exported *** all of itsproduction, exporting *** percent of its shipments in 2006.12 Record evidence shows that thesecountries’ overall shipment patterns should remain consistent with those exhibited during the reviewperiod.
While Belarus and Moldova are export oriented, their focus, however, primarily is on supplyingthe markets in their region. During the period of review, Belarusian producer BMZ has shipped themajority of its rebar to Russia and other members of the CIS, the European Union, and its home market.13 BMZ became slightly less export-oriented during the period of review.14 Given its proximity, theBelarusian producer exports almost *** of its shipments to local markets in the region such as Russia andthe CIS countries. Moreover, while Belarus is not a member of the EU, during the period of review BMZconsistently exported a significant share of its shipments to the EU, particularly the nearby Baltic states,accounting for *** percent of total shipments in 2006. Finally, *** percent of BMZ’s shipments were toits home market in 2006.15 Other than the small export volumes to the United States discussed above,BMZ has not exported subject product to the United States since 2002.16

17 CR at IV-52, PR at IV-33; CR/PR at Table IV-26. See also MSW’s Posthearing Brief at 2. 18 CR/PR at Table IV-26; CR at IV-52, PR at IV-33. 19 CR at IV-52, PR at IV-33. See also MSW’s Posthearing Brief at Attachment 7. 20 In addition, there were no subject imports into the United States from Moldova during the period of review.CR/PR at Tables I-1 and IV-26. 21 RTAC Prehearing Brief at 65. 22 CR/PR at Tables IV-43 and IV-44. 23 Compare Tables IV-40 and IV-41 with Tables IV-43 and IV-44. 24 RTAC Prehearing Brief at 77-78. 25 RTAC Prehearing Brief at 46-47. 26 CR/PR at Table IV-43. 27 See, e.g., Table IV-43 and IV-44. See also MSW’s Posthearing Brief, Att. 1. 28 RTAC Prehearing Brief at 79-81. 29 See, e.g., CR/PR at Tables IV-46 and IV-47.
75
Likewise, the Moldovan producer exports most of its shipments to Russia and Ukraine given itsproximity to those markets.17 While the Moldovan producer exported a significant share of its shipmentsto the CIS nations throughout the period of review, the importance of this region has grown in recentyears as MSW’s share of shipments to the European Union and declined and it has shifted thoseshipments to supply the growing demand and high prices of its CIS neighbors, particularly Russia.18 Russia has become one of the fastest growing markets for rebar and is expected to remain so.19 20 WhileRTAC alleges that the Russian industry plans to increase its rebar capacity by several million metric tonsby 2010, which could displace imports from Moldova,21 the record indicates that consumption in the CIShas been increasing and is projected to increase in the reasonably foreseeable future.22 Moreover, theratio of production to consumption in the CIS region has been consistent during the period of review andis projected to remain consistent going forward.23 Accordingly, we do not conclude that the exportpatterns for Moldova or Belarus are likely to change in the reasonably foreseeable future.
RTAC argues that both Belarus and Moldova are export platforms,24 and as such have anincentive to increase exports to the United States.25 We disagree. Global demand has increasedsignificantly since the original investigations, increasing from *** short tons in 2001 to *** short tons in2006, an increase of *** percent. While North American growth approached *** percent, Europe and theCIS, both of which are important markets for the subject industries in Belarus and Moldova, grew at ***percent and *** percent, respectively.26 This volume growth, strengthened by export patterns for thesetwo countries that show, for Moldova, a shift to a strong regional-focused strategy (Russia and the CISstates), and in the case of Belarus, maintaining a regional-focused strategy (Russia and the Baltic states),diminishes the likelihood that cumulated subject imports from Belarus and Moldova will shift to theUnited States if the orders were revoked. Rather, subject producers in Belarus and Moldova havesignificant incentives to ship to markets in their region and these incentives likely will continue in thereasonably foreseeable future. In particular, Russia, the CIS states, and the Baltic states (in the case ofBelarus), offer close proximity, strong demand, and relatively high prices.27
RTAC also argues that stronger prices in the U.S. market will provide an incentive for subjectproducers to shift exports currently made to other markets to the United States.28 While the record showssome AUV gaps among the export markets for Belarus and Moldova compared to the United States,overall, record data establish that in the European market and in particular in those countries that serve asthe principal export markets for these subject imports, prevailing market prices remain strong.29 Thus, wedo not conclude that pricing in the U.S. market is sufficiently attractive compared to pricing in the

30 CR at IV-24, PR at IV-16. 31 CR at IV-56-57; PR at IV-34; CR/PR at Table IV-27. 32 Memorandum INV-Y-087 at Tables V-6 and V-7. 33 The Commission collected quarterly pricing data on four rebar products. Data were received from domesticproducers, and from importers of subject rebar from Korea and Latvia. 34 CR/PR at Tables II-4 and II-6. 35 See, e.g., CR/PR at Tables V-1, V-4, V-7, and V-10.
76
principal markets for rebar from Belarus and Moldova for the industries in these countries to shift to theU.S. market significant volumes of rebar currently being shipped elsewhere.
Neither Belarus nor Moldova faces any third country barriers to their exports. Inventories in bothcountries as a ratio to total shipments either were very low and declined during the review period (in thecase of Moldova) or were *** (in the case of Belarus). The Belarusian producer reports that while it doesproduce high quality products including SBQ bars and rounds, corners and square bars, it *** producethese products on the same equipment and machinery used to produce rebar. Thus, BMZ *** thecapability to shift production among various bar products.30 The Moldovan producer has the capability toshift production among various bar products, thus allowing for possible product-shifting if the orders arerevoked. However, MSW reports that while it *** to switch production in response to relative pricechanges of bar products, ***.31 Further, any increases in production of subject rebar likely will bedirected to MSW’s regional market, as has been the pattern over the most recent period.
Thus, although revocation of the orders on rebar from Belarus and Moldova likely will result insome additional volume of subject imports into the United States, we do not believe that the additionalvolume will be significant in light of the strong and growing demand in the current principal markets forthese countries’ rebar industries. We consequently conclude that any likely increase in subject importsfrom Belarus and Moldova would not be significant either in absolute terms or relative to production orconsumption in the United States if the orders were revoked.
B. Likely Price Effects of Subject Imports
In the original investigations, rebar from Belarus and Moldova undersold the domestic likeproduct in the majority of comparisons (Belarus) or in all of them (Moldova).32 There were no pricecomparisons for imports from Belarus and Moldova in these reviews.33
As during the original investigations, we continue to find that domestically produced andimported rebar are generally substitutable, and that price is an important factor in purchasing decisions.34 However, we find that the price effects from the cumulated subject imports from Belarus and Moldovalikely will not be significant both based on our finding that the volume of these cumulated subject importslikely will not be significant and because we find no incentive for producers in these countries to priceaggressively any volumes they do sell or offer to sell in the U.S. market.
According to the pricing data collected in these reviews, U.S. prices of rebar fluctuated within agenerally limited range from 2001 through 2003. Substantial price increases began in the first quarter of2004, rising by 32 percent to 43 percent, for the four products for which data were collected. Accordingto these data, the U.S. industry’s prices for these products doubled or nearly doubled over the period ofreview.35
Although the single largest increase in consumption occurred earlier in the review period, from2002 to 2003, consumption remained strong throughout the period, buoyed by strong construction activityin the U.S. market, especially in major rebar-using projects such as roads, bridges and nonresidential

36 CR at II-11; PR at II-7. 37 CR at V-1; PR at V-1. 38 MSW’s Posthearing Brief at 5-10, Attachments 1, 2, 4, and 6; CR at IV-92-93, PR at IV-52. 39 CR/PR at Table IV-44. 40 CR/PR at Table C-1. In addition, U.S. exports increased by 31.3 percent. Id. 41 Id. 42 Id.
77
construction.36 Prices also were heavily influenced by the increases in raw material costs, particularlysteel scrap, that occurred in early 2004, when scrap prices rose to $251 per ton, compared to $68 per tonin January 2001. Scrap prices fluctuated after 2004, but generally remained strong, peaking at $305 perton in March 2007.37
RTAC also argues that the high and increasing prices in the U.S. market are unlikely to continueto the extent that demand growth is slowing or demand is declining in the reasonably foreseeable future. The record indicates otherwise. As noted in our discussion of conditions of competition, demand in theU.S. market is likely to remain fairly steady for the reasonably foreseeable future. Nonresidentialconstruction generally is expected to remain very strong.38 The record also indicates that global demandis likely to remain strong and growing in the reasonably foreseeable future.39 Because, as describedabove, prices in the home and regional markets of Belarus and Moldova are strong and are comparable toprices in the U.S. market, we do not find it likely that any increased volumes from Belarus and Moldovain the event of revocation (the level of which we do not expect to be significant, as explained above)would be likely to be sold at prices that significantly undersell the domestic like product or thatsignificantly suppress or depress prices for the domestic like product. Given their apparent lack of excesscapacity and attractive prices in their existing markets, we do not find that subject producers from Belarusand Moldova have an incentive to price aggressively in order to move significant volumes into the U.S.market.
Based on these findings as well as our finding that the volume of cumulated subject imports fromBelarus and Moldova is not likely to be significant, we do not find that there is likely to be significantunderselling by these subject imports as compared to the domestic like product, or that imports from thesesubject countries are likely to enter the United States at prices that otherwise would have a significantdepressing or suppressing effect on the price of the domestic like product. We consequently concludethat the subject imports from Belarus and Moldova are not likely to have significant price effects if theorders were revoked.
C. Likely Impact of Subject Imports
The record of these reviews indicates that, after issuance of the orders on the subject countriesand a decline in subject import levels, the domestic industry initially made only modest gains in marketshare. However, domestic producers’ production, U.S. shipments, and net sales, after declining slightly in2001 with the economic recession, began to recover in 2002 and 2003, and showed dramaticimprovement through 2006. Between 2001 and 2006, production increased overall 25.3 percent, U.S.shipments increased 23.6 percent, and net sales increased 25.1 percent.40 With production capacityincreasing less rapidly than production (a gain of 9.2 percent between 2001 and 2006), capacityutilization increased by 11.5 percentage points in this same period.41 While domestic employmentincreased only slightly (2.5 percent) between 2001 and 2006, productivity increased 22.3 percent.42 Despite substantially reduced subject import levels, the industry posted deteriorating operating margins

43 Id. 44 We also note that, while up to 10 of the 24 to 25 reporting firms reported losses during the period 2001 through2004, only two firms (***) reported operating losses either in 2005 or 2006. CR/PR at Tables III-9 and III-10. 45 *** forecasts that North American consumption of rebar will increase steadily from 2007 through 2010. CR/PR at Table IV-44. Consumption is forecast to increase in other global regions as well; most strongly in Eastand Southeast Asia, and more moderately in the European market. Id. 46 CR/PR at Figure V-1; CR/PR at Tables V-1-V-12. Increases in sales value also outpaced increases in costs. Thus, domestic producers’ unit sales values rose from $268 per short ton in 2001, to $518 per short ton in 2006, anincrease of 93.2] percent. CR/PR at Table C-1. At the same time, unit COGS rose from $235 per short ton in 2001to $383 per short ton in 2006, a smaller increase of 62.9 percent. CR/PR at Table III-9. This differential improvedover the review period, as COGS as a ratio to sales dropped from 87.8 percent in 2001 to 74.0 percent in 2006. Id. 47 CR/PR at Tables V-1-V-12. 48 See Certain Steel Concrete Reinforcing Bars from Indonesia, Poland, and Ukraine, Inv. Nos. 731-TA-875, 880,882 (Final), USITC Pub. 3425 (May 2001) at 13. 49 See USITC Pub. 3425; Certain Steel Concrete Reinforcing Bars from Belarus, China, Korea, Latvia, andMoldova, Inv. Nos. 731-TA-873-874 and 877-879 (Final), USITC Pub. No. 3440 (July 2001). Imports of rebar fromChina increased from zero short tons in 1998 to 17,547 short tons in 1999 to 163,124 short tons in 2000. CR/PR at
(continued...)
78
from 2001 (6.6 percent) to 2003 (3.1 percent) before improving sharply in 2004 (15.4 percent), andcontinuing to rise throughout the remainder of the review period, peaking at 20.7 percent in 2006.43
In light of these data showing a healthy and vibrant industry, we do not find the domestic rebarindustry to be vulnerable.44 Moreover, the conditions that have enabled the industry to realize its recentprofits are not likely to change in the foreseeable future. As discussed in the Commission’s views, strongdemand in the non-residential construction market, a major user of rebar, is expected to continue, not justin the U.S. market, but globally as well.45 While raw material costs (primarily steel scrap) increasedsharply toward the end of the period of review, and continue to be high, these costs have been more thanmatched by domestic price increases, which, for the most part, have leveled off at historically high levelsand show few signs of reversing direction.46 Thus, domestic prices rose significantly in 2004 above theirlevel from the original investigations and the beginning of the period examined in these reviews.47
Consistent with our findings that the likely volume and likely price effects of subject importsfrom Belarus and Moldova will not be significant, we find that subject imports would not be likely tohave a significant adverse impact on the domestic industry’s output, sales, market share, profits, or returnon investment, if the orders were revoked. Based on the strong expected demand in the United States andglobal markets and the current robust condition of the domestic industry, the small volumes of subjectimports from Belarus and Moldova that would be likely upon revocation would not be likely to have asignificant adverse impact on the domestic industry.
III. LIKELIHOOD OF CONTINUATION OR RECURRENCE OF MATERIAL INJURYUPON REVOCATION OF THE ORDER ON SUBJECT IMPORTS FROM CHINA
A. Likely Volume of Subject Imports
In the original investigation, the Commission did not cumulate subject imports from China withsubject imports from the remaining countries because imports from China were negligible for presentmaterial injury purposes.48 However, the Commission found that China would imminently account formore than 3 percent of all subject merchandise sold into the region or U.S. market (as appropriate), andthe Commission determined that the U.S. domestic industry was threatened with material injury by reasonof subject imports from China.49 After the order was imposed, subject imports from China virtually

49 (...continued)Table I-1. 50 CR/PR at Table I-1. 51 See CR at IV-24-25, PR at 16. 52 CR/PR at Table IV-11. 53 CR/PR at Table IV-12. These were the only years available for capacity. 54 Compare CR/PR at Table IV-12 with Table C-1. 55 CR/PR at Table IV-12. 56 Compare CR/PR at Table IV-12 with Table C-1. 57 CR/PR at Tables IV-12 and IV-13. 58 CR/PR at Table IV-13. 59 See, e.g., CR/PR at Tables IV-11 and IV-14. 60 See, e.g., CR/PR at Tables IV-11 and IV-14. 61 CR/PR at Table IV-14. *** reported an *** exports in 2006. CR/PR at Table IV-12. Moreover, China’svolume of exports increased substantially from 1.8 million short tons in 2005 to 3.7 million short tons in 2006. CR/PR at Table IV-14. 62 CR/PR at Table IV-14.
79
ceased with the exception of very small volumes (never exceeding 169 short tons) in each of the years ofthe period of review except for 2003.50
In these current five year reviews, several factors support our conclusion that the volume ofsubject imports from China likely would be significant if the order were revoked. While the Commissiondid not receive questionnaire responses from any subject producers in China,51 available data indicate thatChina is the world’s largest producer of rebar. Unlike any other subject producer, the Chinese industryhas significantly increased both its capacity and production of rebar since the original investigations. TheChinese industry has *** its production from 29.45 million short tons in 2000 to *** million short tons in2006.52 The industry continues to add to its capacity; according to ***, Chinese rebar production capacityrecently increased from *** short tons in 2005 to *** short tons in 2006.53 Total Chinese capacity in2006 was equivalent to *** percent of apparent U.S. consumption and *** percent of U.S. production forthe same year.54 Over the past two years, the Chinese capacity utilization rate has been *** percent in2005 and *** percent in 2006.55 Chinese excess capacity in 2006 of *** short tons is equivalent to ***percent of apparent U.S. consumption and *** percent of U.S. production for the same year.56 While therecord lacks information concerning anticipated capacity expansions, *** reports that Chinese productionis projected to increase over the next several years, from *** short tons in 2006 to *** short tons in2009.57 In addition, while Chinese consumption is anticipated to increase, *** projects that China willremain a significant net exporter in the reasonably foreseeable future.58
As we noted in our analysis of whether to cumulate China with the other subject countries, theChinese industry primarily serves its home market.59 Exports from China accounted for only *** percentof its production in 2006.60 However, because of the sheer quantity of its production, the volume of itsexports are quite large, totaling 3.7 million short tons in 2006.61 While four of China’s top five exportdestinations are in Asia, the fourth is Canada, which has seen an increasing volume of imports from Chinain the recent period. Moreover, in 2006, China expanded its list of countries to which it exports andexported greater quantities of rebar to countries throughout the world, including several in the Americas.62 This volume growth of exports, strengthened by China’s shifting export patterns, increases the likelihoodthat subject imports from China will shift to the United States if the order were revoked.

63 RTAC Prehearing Brief at 79-81. 64 Compare CR/PR at Table IV-14 with Tables IV-46 and IV-47 (both the Asian markets and Canada); see alsoCR/PR at Tables IV-46 and IV-47 (showing a gap of *** per short ton between monthly prices in the United Statesand China). 65 China does not face any third country barriers to its exports. CR at IV-27, PR at IV-17. We note that therecord lacks information concerning Chinese inventories or the Chinese industry’s ability to engage in productshifting. 66 Memorandum INV-Y-087 at Tables V-6 and V-7. 67 USITC Pub. 3440 at 7-9; 10-14. 68 CR/PR at Tables II-4 and II-6. 69 See, e.g., CR/PR at Tables V-1, V-4, V-7, and V-10. 70 CR at V-1; PR at V-1. 71 MSW’s Posthearing Brief at 5-10, Attachments 1, 2, 4, and 6; CR at IV-92-93, PR at IV-52. 72 CR/PR at Table IV-44.
80
RTAC also argues that stronger prices in the U.S. market will provide an incentive for China toshift exports currently made to other markets to the United States.63 The record shows a gap in AUVsamong the export markets for China compared to the United States.64 Thus, we conclude that pricing inthe U.S. market is sufficiently attractive in relationship to pricing in China and China’s principal exportmarkets for Chinese producers to shift to the U.S. market significant volumes of rebar currently beingshipped elsewhere.65
Thus, given China’s shifting pattern and expansion of exports, its large export volume, itssubstantial increase in subject exports to the United States in the original investigations, its enormouscapacity and the attractiveness of the U.S. market, subject imports from China likely would increasesignificantly following revocation of the antidumping duty order. We consequently conclude that thelikely increase in subject imports from China would be significant either in absolute terms or relative toproduction or consumption in the United States if the order were revoked.
B. Likely Price Effects of Subject Imports
In the original investigations, rebar from China undersold the domestic like product in allcomparisons.66 Moreover, the Commission found that subject imports from China undersold the domesticlike product at a greater rate than other subject imports.67 There were no price comparisons for importsfrom China in these reviews.
As during the original investigations, we continue to find that domestically produced andimported rebar are generally substitutable, and that price is an important factor in purchasing decisions.68
While U.S. prices strengthened over the review period as noted above,69 a major driver behind therise in prices was soaring raw material costs, particularly steel scrap, that occurred in early 2004, whenscrap prices rose to $251 per ton, compared to $68 per ton in January 2001. Scrap prices fluctuated after2004, but generally remained strong, peaking at $305 per ton in March 2007.70
RTAC argues that the improved prices in the U.S. market are unlikely to continue to the extentthat demand growth is slowing or demand is declining in the reasonably foreseeable future. The recordindicates otherwise. As noted in our discussion of conditions of competition, demand in the U.S. marketis likely to remain fairly steady for the reasonably foreseeable future. Nonresidential constructiongenerally is expected to remain very strong.71 The record also indicates that global demand is likely toremain strong and growing in the reasonably foreseeable future.72 However, because prices in theChinese home market and its principal export markets in comparison to those in the United States are

73 CR/PR at Tables IV-46 and IV-47. 74 CR/PR at Table I-1.
81
showing a fairly significant gap (*** per short ton),73 we find it likely that the increased volumes fromChina in the event of revocation would be likely to be sold at prices that significantly undersell thedomestic like product. Given China’s export volume, its substantial capacity and the attractiveness of theU.S. market, we find that subject producers from China have an incentive to price aggressively in order tomove significant volumes into the U.S. market.
Based on these findings as well as our finding that the volume of subject imports from China islikely to be significant, we find that there is likely to be significant underselling by these subject importsas compared to the domestic like product, or that imports from China are likely to enter the United Statesat prices that otherwise would have a significant depressing or suppressing effect on the price of thedomestic like product. We consequently conclude that subject imports from China are likely to havesignificant price effects if the order were revoked.
C. Likely Impact of Subject Imports
As instructed by the statute, we have considered the extent to which any improvement in the stateof the domestic industry is related to the antidumping duty order at issue and whether the industry isvulnerable to material injury if the order were revoked.
For the reasons already discussed in section I.C above, we do not find the domestic industry to bevulnerable. Nonetheless, we find that subject imports from China would be likely to have a significantadverse impact on the industry if the antidumping order on rebar from China were revoked. For reasonsoutlined above, we determine that, in the event of revocation, the volume of imports from China would besignificant. Given the commodity-like nature of rebar, it is likely that such significant volumes wouldcompete in the U.S. market solely on the basis of price. Consequently, given the likely significantvolumes from China, and despite continued healthy demand, one would expect to see price declines in theU.S. market in the reasonably foreseeable future. Given that, during the period of review, theimprovement in the domestic industry’s financial condition was directly attributable to incremental priceincreases and sustained higher price levels, it is reasonable to conclude similarly that consistent declinesin price levels would eventually lead to a deterioration in the financial condition of the industry. Hence,we conclude that, in the event the order on rebar from China were revoked, subject imports from Chinawould be likely to have a significant adverse impact on the domestic industry’s output, sales, marketshare, profits, and return on investment.
IV. LIKELIHOOD OF CONTINUATION OR RECURRENCE OF MATERIAL INJURYUPON REVOCATION OF THE ORDER ON SUBJECT IMPORTS FROM INDONESIA
A. Likely Volume of Subject Imports
Subject imports from Indonesia fluctuated irregularly during the original investigations, risingfrom 44,504 short tons in 1998 to 69,261 short tons in 1999, before declining to zero short tons in 2000.74 Indonesia’s export pattern in the original investigations appears to have been affected by the Asianfinancial crisis, which resulted in a decline in demand for rebar in the previously expanding Asianmarkets. The disruption in the Asian markets particularly affected producers in countries such asIndonesia, which experienced suppressed home market demand in 1998 and 1999, with improved home

75 See, e.g., USITC Pub. 3425 at VII-4 (Indonesia) (“Indonesia’s steel industry has largely been oriented towardsthe domestic market. However, in 1998 and 1999 (especially with the slowdown of the domestic market inIndonesia resulting from the Asian economic crisis), the industry reportedly took advantage of the depreciation ofthe Indonesian rupiah vis-a-vis the U.S. dollar and strong demand in the United States and began to increase itsexports, particularly its exports to the United States.”); Memorandum INV-Y-087 at Table VII-3 (Indonesia). 76 CR/PR at Table I-1. 77 PT The Master Steel estimated that it accounted for only *** percent of the country’s total production of rebarin 2000. See Memorandum INV-Y-087 at VII-7-8; USITC Pub. 3425 at VII-3-4. 78 CR at IV-31, PR at IV-21. 79 CR at IV-32, PR at IV-21. 80 CR at IV-32, PR at IV-21. 81 Memorandum INV-Y-087 at Table VII-3. 82 Memorandum INV-Y-087 at VII-8. 83 See Memorandum INV-Y-087 at Table VII-3. 84 RTAC Prehearing Brief at 79-81. 85 See CR/PR at Tables IV-46 and IV-47 (showing a gap of *** per short ton between monthly prices in theUnited States and prices in Asia).
82
market shipments in 2000.75 After the order was imposed, subject imports from Indonesia remained outof the U.S. market.76
In these current five year reviews, several factors support our conclusion that the volume ofsubject imports from Indonesia would likely be significant if the order were revoked. The Indonesianindustry likely remains export-oriented. Moreover, as Chinese export volumes continue to grow, theIndonesian industry likely will face competition from China in its principal export markets and in theIndonesian market. Thus, given Indonesia’s substantial increase in subject exports to the United States inthe original investigations, and the attractiveness of the U.S. market, subject imports from Indonesialikely would increase significantly following revocation of the antidumping duty order.
In the original investigations, only one Indonesian producer of rebar, PT The Master Steel Mfg.Co., returned a completed questionnaire. The Commission also received information from the IndonesianMinistry of Industry and Trade, which reported that 28 firms in Indonesia produced rebar and estimatedthat these firms had a combined capacity of about 4.8 million short tons.77 No Indonesian rebar producerresponded to the Commission’s foreign producer questionnaire in the current reviews.78 Based onavailable information, it appears as if there is at least one new producer of rebar in Indonesia, Ispat Indo. On the other hand, *** identifies only eight Indonesian producers of rebar, with a combined estimatedrebar capacity of *** short tons.79 RTAC alleges that PT Krakatau Steel could convert wire rodproduction to rebar production, potentially adding one million tons of additional rebar capacity.80
In the original investigations, Indonesia was export oriented in part because of the impact of theAsian financial crisis. In 1998, Master Steel exported *** percent of its shipments, *** percent in 1999,and *** percent in 2000.81 The one responding Indonesian producer in the original investigationsreported exports to the United States, ***.82 Its exports to markets other than the United States wereerratic during the original investigations.83 Because no Indonesian rebar producer responded to theCommission’s questionnaire in the current reviews and because no other data are available, theCommission has no current information concerning the Indonesian producers’ export orientation orprimary export markets.
RTAC argues that stronger prices in the U.S. market will provide an incentive for Indonesia toshift exports currently made to other markets to the United States.84 The record shows a gap in AUVsbetween destinations in Asia compared to the United States.85 Lacking any other information with respectto Indonesian producers’ export prices, we conclude that pricing in the U.S. market is sufficiently

86 Indonesia does not face any third country barriers to its exports. CR at IV-32, PR at IV-21-22. We note thatthe record lacks information concerning Indonesian inventories or the Indonesian industry’s ability to engage inproduct shifting other than that alleged by RTAC for non-rebar producer PT Krakatau. 87 China’s top three export destinations are in Asia. CR/PR at Table IV-14. Information from the originalinvestigation suggests that Asia ***. Memorandum INV-Y-087 at VII-8. Moreover, in 2006, China expanded itslist of countries to which it exports and exported significantly greater quantities of rebar to countries throughout theworld, including many in Asia. CR/PR at Table IV-14. 88 Memorandum INV-Y-087 at Tables V-6 and V-7. 89 CR/PR at Tables II-4 and II-6. 90 See, e.g., CR/PR at Tables V-1, V-4, V-7, and V-10. 91 CR at V-1; PR at V-1. 92 MSW’s Posthearing Brief at 5-10, Attachments 1, 2, 4, and 6; CR at IV-92-93, PR at IV-52.
83
attractive in relationship to pricing in Asia for Indonesian producers to shift to the U.S. market significantvolumes of rebar currently being shipped elsewhere.86
Unlike the information we have on the current record concerning Korea, which shows a recoveryfrom the impact of the Asian financial crisis, a strong home market focus, and Korea’s new status as a netimporter of rebar, the record does not contain any similar information concerning Indonesia. Whileinformation on the current record suggests that the Indonesian industry may not be as large as it was inthe original investigation, the Indonesian industry likely remains export-oriented, and thus would beincreasingly affected as the Chinese industry exports larger volumes of rebar throughout the world,including Indonesia.87 This conclusion suggests that the Indonesian industry likely will face competitionfrom China in its principal export markets and in the Indonesian market. Thus, the Indonesian industrylikely will become more export dependent as it was in the original investigations. Moreover, givenIndonesia’s erratic export pattern in the original investigations, its substantial increase in subject exportsto the United States in the original investigations, and the attractiveness of the U.S. market, subjectimports from Indonesia likely would increase significantly following revocation of the antidumping dutyorder. We consequently conclude that the likely increase in subject imports from Indonesia would besignificant either in absolute terms or relative to production or consumption in the United States if theorder were revoked.
B. Likely Price Effects of Subject Imports
In the original investigations, rebar from Indonesia undersold the domestic like product in allcomparisons.88 There were no price comparisons for imports from Indonesia in these reviews.
As during the original investigations, we continue to find that domestically produced andimported rebar are generally substitutable, and that price is an important factor in purchasing decisions.89
While U.S. prices strengthened over the review period as noted above,90 a major driver behind therise in prices was soaring raw material costs, particularly steel scrap, that occurred in early 2004, whenscrap prices rose to $251 per ton, compared to $68 per ton in January 2001. Scrap prices fluctuated after2004, but generally remained strong, peaking at $305 per ton in March 2007.91
RTAC argues that the improved prices in the U.S. market are unlikely to continue to the extentthat demand growth is slowing or demand is declining in the reasonably foreseeable future. The recordindicates otherwise. As noted in our discussion of conditions of competition, demand in the U.S. marketis likely to remain fairly steady for the reasonably foreseeable future. Nonresidential constructiongenerally is expected to remain very strong.92 The record also indicates that global demand is likely to

93 CR/PR at Table IV-44. 94 CR/PR at Tables IV-46 and IV-47.
84
remain strong and growing in the reasonably foreseeable future.93 However, because prices in Asianmarkets in comparison to those in the United States are lower,94 we find it likely that the increasedvolumes from Indonesia in the event of revocation would be likely to be sold at prices that significantlyundersell the domestic like product. Given Indonesia’s substantial increase in subject exports to theUnited States in the original investigations, and the attractiveness of the U.S. market, we find that subjectproducers from Indonesia have an incentive to price aggressively in order to move significant volumesinto the U.S. market.
Based on these findings as well as our finding that the volume of subject imports from Indonesiais likely to be significant, we find that there is likely to be significant underselling by subject importsfrom Indonesia as compared to the domestic like product, or that imports from Indonesia are likely toenter the United States at prices that otherwise would have a significant depressing or suppressing effecton the price of the domestic like product. We consequently conclude that subject imports from Indonesiaare likely to have significant price effects if the order were revoked.
C. Likely Impact of Subject Imports
As instructed by the statute, we have considered the extent to which any improvement in the stateof the domestic industry is related to the antidumping duty order at issue and whether the industry isvulnerable to material injury if the order were revoked.
For the reasons already discussed in section I.C above, we do not find the domestic industry to bevulnerable. Nonetheless, we find that subject imports from Indonesia would be likely to have asignificant adverse impact on the industry if the antidumping order on rebar from Indonesia wererevoked. For reasons outlined above, we determine that, in the event of revocation, the volume of importsfrom Indonesia would be significant. Given the commodity-like nature of rebar, it is likely that suchsignificant volumes would compete in the U.S. market solely on the basis of price. Consequently, giventhe likely significant volumes from Indonesia, and despite continued healthy demand, one would expectto see price declines in the U.S. market in the reasonably foreseeable future. Given that, during the periodof review, the improvement in the domestic industry’s financial condition was directly attributable toincremental price increases and sustained higher price levels, it is reasonable to conclude similarly thatconsistent declines in price levels would eventually lead to a deterioration in the financial condition of theindustry. Hence, we conclude that, in the event the order on rebar from Indonesia were revoked, subjectimports from Indonesia would be likely to have a significant adverse impact on the domestic industry’soutput, sales, market share, profits, and return on investment.
V. CONCLUSION
For the foregoing reasons, we find that revocation of the antidumping duty orders on certain steelconcrete reinforcing bars from Belarus and Moldova would not be likely to lead to continuation orrecurrence of material injury to an industry in the United States within a reasonably foreseeable time. Wealso find that revocation of the antidumping duty orders on rebar from China and Indonesia would belikely to lead to continuation or recurrence of material injury to an industry in the United States within areasonably foreseeable time.

1 19 U.S.C. § 1675(d)(2). 2 For a discussion of my cumulation analysis, see Separate and Dissenting Views of Chairman Daniel R. Pearsonand Commissioner Deanna Tanner Okun Regarding Cumulation. 3 CR/PR at Table I-1. 4 CR/PR at Table I-1. 5 Original Investigation Confidential Staff Report (Memorandum INV-Y-087), May 1, 2001, at VII-20. 6 CR/PR at Tables I-1, IV-33, and IV-35.
85
SEPARATE VIEWS OF COMMISSIONER DEANNA TANNER OKUNREGARDING UKRAINE
I. INTRODUCTION
Section 751(d)(2) of the Tariff Act of 1930, as amended (“the Act”), requires that the U.S.Department of Commerce (“Commerce”) revoke a countervailing duty or an antidumping duty order orterminate a suspended investigation in a five-year review unless Commerce determines that dumping or acountervailable subsidy would be likely to continue or recur and the U.S. International Trade Commission(“Commission”) determines that material injury to a U.S. industry would be likely to continue or recurwithin a reasonably foreseeable time.1 Based on the record in these first five-year reviews, I determinethat material injury is likely to continue or recur within a reasonably foreseeable time if the antidumpingduty order on subject imports of certain steel concrete reinforcing bars (“rebar”) from Ukraine wererevoked.
I join my colleagues’ discussion regarding domestic like product, domestic industry, the legalstandard governing five-year reviews and conditions of competition. I write separately to discusscumulation and my analysis of the statutory factors.2
II. LIKELIHOOD OF CONTINUATION OR RECURRENCE OF MATERIAL INJURYUPON REVOCATION OF THE ORDER ON SUBJECT IMPORTS FROM UKRAINE
A. Likely Volume of Subject Imports
Subject imports from Ukraine significantly increased during the original investigations, risingfrom 3,074 short tons in 1998 to 168,054 short tons in 2000.3 Their market share also grew steadily from*** percent in 1998 to *** percent in 2000, as apparent domestic consumption rose overall.4 TheUkrainian industry exported rebar worldwide. In addition to exporting rebar to the United States, theindustry also shipped to ***.5 After the order was imposed, subject imports from Ukraine virtuallyceased.6
In these current five year reviews, several factors support my conclusion that the volume ofsubject imports from Ukraine would likely be significant if the order were revoked. The Ukrainianindustry remains export-oriented, it exports significant volumes of rebar (second only to China), and ithas shifted export destinations throughout the period of review. While Ukraine’s largest rebar producernow is affiliated with a U.S. producer through the Arcelor Mittal Steel group, this is a new relationshipand the U.S. producer’s share of U.S. production is small.
Ukraine’s rebar industry has undergone significant restructuring since the original periodexamined. During the original investigations, the Commission identified two state-owned Ukrainianproducers of rebar, Krivoi Rog Mining & Metallurgical Integrated Works (“Krivorozhstal”) and

7 See, e.g., USITC Pub. 3425 at VII-8-9. 8 CR at IV-67, PR at IV-41; Ukrainian Respondent’s Prehearing Brief at 9. 9 CR at IV-67-68, PR at IV-41. 10 CR at IV-68, PR at IV-41. 11 See, e.g., CR/PR at Table I-11. 12 See CR at IV-67-68, PR at IV-41. 13 CR/PR at Table IV-33. 14 CR/PR at Table IV-37. See also CR at IV-72, PR at IV-42. 15 CR/PR at Table IV-33. 16 CR/PR at Table IV-33. 17 CR/PR at Table IV-33. 18 See CR/PR at Tables IV-33 and IV-35. 19 CR/PR at Table IV-33. 20 CR/PR at Table IV-48. 21 CR/PR at Table IV-35. The Ukrainian industry shipped 831,919 short tons of rebar to Algeria in 2006, andshipped 506,521 short tons to Syria. Id.
86
Kramatorsk Iron & Steel Works (“Kramatorsk”).7 During the current review period, Krivorozhstal wasprivatized and purchased in 2005 by Mittal, which eventually brought the company under the control ofthe multinational Mittal Steel Group.8 Mittal Steel Kryviy Rih (“MSKR”) accounts for about *** percentto *** percent of the Ukraine market.9 According to available information, one or more producers mayaccount for the remaining rebar production in Ukraine.10 As of April 2007, Arcelor Mittal Steelpurchased Mexican long-products producer Siderurgica Lazaro Cardenas las Truchas SA de CV, whichowns the assets of U.S. rebar producer Border Steel, Inc., thereby creating an affiliation between BorderSteel and the largest Ukrainian producer.11
The industry in Ukraine has increased both its capacity and production of rebar during the periodof review. While the Commission did not receive questionnaire responses from all Ukrainian producers,12
data submitted by MSKR show that it increased its capacity from *** short tons in 2001 to *** short tonsin 2006, and it increased its production from *** short tons in 2001 to *** short tons in 2006. MSKRprojects that it will further increase its capacity and production through 2008 to *** short tons and ***short tons, respectively.13 It does not appear that any further capacity expansions are planned for the otherUkrainian producers.14 Capacity utilization rates have been very high (nearly *** percent throughout theperiod), but were projected to decrease slightly in 2007-08, to *** percent.15
Ukraine is export oriented, with its largest producer exporting more than *** percent of itsshipments.16 While Ukraine home market shipments have increased over the period of review from ***percent of total shipments in 2001 to a peak of *** percent in 2006, and its ratio of exports to totalshipments has declined,17 it has irregularly increased the volume of its exports from *** short tons in2001 to 3.40 million short tons in 2006.18 MSKR alone reported that it will increase the volume of itsexports this year to *** short tons.19 Moreover, the volume of Ukraine’s exports is second only to that ofChina.20
Unlike the other European subject producers, Ukraine’s exports are more widely divergent, i.e.,they are not focused on a nearby regional markets such as the European Union (“EU”) or theCommonwealth of Independent States (“CIS”). Indeed, the vast majority of exports from Ukraine aredirected toward Africa and the Middle East to a greater degree than other subject producers.21 In addition,during recent years of the period of review, Ukraine has shifted the volume of shipments between variousexport destinations. Moreover, these shifts in volumes and export destinations appear to correspond to

22 CR/PR at Table IV-35. For example, Ukraine in 2006 shipped additional volumes to countries that offered thehighest prices, in particular Russia, as well as nearby Georgia, Belarus, and Kazakhstan. 23 CR/PR at Table IV-35. Ukraine exported 17,659 short tons to Canada. 24 CR at IV-74; PR at IV-43. 25 Inventories as a ratio to total shipments were very low throughout the period of review, never exceeding ***percent. CR/PR at Table IV-33. 26 Compare CR/PR at Table IV-35 with Tables IV-46 and IV-47; see also Table IV-33. 27 See, e.g., Certain Carbon Steel Products from Australia, Belgium, Brazil, Canada, Finland, France, Germany,Japan, Korea, Mexico, Poland, Romania, Spain, Sweden, Taiwan, and the United Kingdom, Inv. Nos. AA1921-197(Second Review), 701-TA-319, 320, 325-327, 348, and 350 (Second Review; and 731-TA-573-574, 576, 578,582-587, 612, and 614-618 (Second Review), USITC Pub. 3899 (Vol. I) (January 2007); Internal CombustionIndustrial Forklift Trucks from Japan, Inv. No. 731-TA-377 (Second Review), USITC Pub. 3831 (December 2005). 28 CR/PR at Table I-11. 29 While I note that Arcelor Mittal now owns larger rebar-producing facilities in Mexico (Sicartsa) and in Canada(Contrecoeur and Longeuil) (CR/PR at Table IV-34), this relationship is too new to evaluate. In addition, the recorddoes not contain enough information as whether the Mexican and Canadian facilities have sufficient capacity tosupply Arcelor Mittal’s North American interests. CR/PR at Table IV-34. 30 CR at IV-72, n. 75; PR at IV-42, n. 75. 31 I also have considered whether Ukrainian producers will likely re-direct production of alternative productstoward subject merchandise if the order is revoked. 19 U.S.C. § 1675a(a)(2)(D). MSKR’s facility ***. CR/PR atTable IV-36.
87
markets that offer price premiums.22 Finally, for the first time during the period of review, Ukraine beganto export rebar to North America in 2006.23 This volume growth of exports, strengthened by Ukraine’sshifting export patterns to seek higher prices, increases the likelihood that subject imports from Ukrainewill shift to the United States if the order were revoked.
With regard to third-country trade barriers, Ukraine is the only subject country with restrictions. Russia currently maintains a 21 percent countervailing duty against imports from Ukraine. The EU alsoimposes a quota of 235,750 metric tons on rebar from Ukraine.24 25
The record data show a gap in average unit values among the export markets for Ukrainecompared to the United States.26 Thus, I conclude that pricing in the U.S. market is sufficiently attractivein relationship to pricing in Ukraine and Ukraine’s principal export markets for Ukrainian producers toshift to the U.S. market significant volumes of rebar currently being shipped elsewhere.
Finally, I have considered whether the new corporate relationship between Ukraine’s largest rebarproducer and U.S. producer Border Steel, Inc. will reduce the likelihood that Ukraine would export rebarto the United States if the order were revoked. In other reviews, I have found that transnational entitiesmay have sufficient incentives to operate their global facilities to serve regional markets in a manner sothat affiliated firms do not disrupt market conditions in regions served by other facilities in the corporatefamily.27 I find, however, that there are important differences between facts in the current review andthose in other reviews. First, this newly established corporate relationship (April 2007) has not operatedfor a sufficient amount of time to show a shift in export patterns. Second, domestic producer Border Steeland, thus, Arcelor Mittal, has only a small footprint in the United States with *** percent of U.S. rebarproduction in 2006.28 Thus, the United States cannot be supplied by this Arcelor Mittal facility alone.29 While Arcelor Mittal’s stated global corporate strategy is to operate in regional markets and its NorthAmerican shipments of all steel products are to be coordinated by its sales marketing offices in Dubai andChicago,30 I cannot conclude on the present facts that the new corporate relationship will restrain subjectimport volumes from Ukraine in the reasonably foreseeable future if the order were revoked.31

32 Memorandum INV-Y-087 at Tables V-6 and V-7. 33 CR/PR at Tables II-4 and II-6. 34 I incorporate herein my entire finding on pricing from section I.B of my Latvia and Poland views. See Separateand Dissenting Views of Chairman Daniel R. Pearson and Commissioner Deanna Tanner Okun RegardingCumulation; Separate and Dissenting Views of Chairman Daniel R. Pearson, Vice Chairman Shara L. Aranoff, andCommissioner Deanna Tanner Okun Regarding Latvia and Poland. 35 See, e.g., CR/PR at Tables V-1, V-4, V-7, and V-10. 36 CR at V-1; PR at V-1. 37 MSW’s Posthearing Brief at 5-10, Attachments 1, 2, 4, and 6; CR at IV-92-93, PR at IV-51-52. 38 CR/PR at Table IV-44. 39 CR/PR at Tables IV-33, IV-35, IV-46 and IV-47.
88
Given Ukraine’s shifting export pattern, its large and increasing export volume, and theattractiveness of prices in the U.S. market, subject imports from Ukraine likely would increasesignificantly following revocation of the antidumping duty order. I consequently conclude that the likelyincrease in subject imports from Ukraine would be significant either in absolute terms or relative toproduction or consumption in the United States if the order were revoked.
B. Likely Price Effects of Subject Imports
In the original investigations, rebar from Ukraine undersold the domestic like product in allcomparisons except for one.32 There were no price comparisons for imports from Ukraine in thesereviews.
As during the original investigations, I continue to find that domestically produced and importedrebar are generally substitutable, and that price is an important factor in purchasing decisions.33 34
While U.S. prices strengthened over the review period as noted above,35 a major driver behind therise in prices was soaring raw material costs, particularly steel scrap, that occurred in early 2004, whenscrap prices rose to $251 per ton, compared to $68 per ton in January 2001. Scrap prices fluctuated after2004, but generally remained strong, peaking at $305 per ton in March 2007.36
RTAC argues that the improved prices in the U.S. market are unlikely to continue to the extentthat demand growth is slowing or demand is declining in the reasonably foreseeable future. The recordindicates otherwise. As noted in the Commission’s discussion of conditions of competition, demand inthe U.S. market is likely to remain fairly steady for the reasonably foreseeable future. Nonresidentialconstruction generally is expected to remain very strong.37 The record also indicates that global demandis likely to remain strong and growing in the reasonably foreseeable future.38 However, because prices inUkraine’s home market and its principal export markets in comparison to those in the United States arelower,39 I find it likely that the increased volumes from Ukraine in the event of revocation would likely besold at prices that significantly undersell the domestic like product. Given Ukraine’s substantial increasein subject exports to the United States in the original investigations, and the attractiveness of the U.S.market, I find that subject producers from Ukraine have an incentive to price aggressively in order tomove significant volumes into the U.S. market.
Based on these findings as well as my finding that the volume of subject imports from Ukraine islikely to be significant, I find that there is likely to be significant underselling by subject imports fromUkraine as compared to the domestic like product, or that imports from Ukraine are likely to enter theUnited States at prices that otherwise would have a significant depressing or suppressing effect on theprice of the domestic like product. I consequently conclude that subject imports from Ukraine are likelyto have significant price effects if the order were revoked.

40 See Separate and Dissenting Views of Chairman Daniel R. Pearson and Commissioner Deanna Tanner OkunRegarding Cumulation; Separate and Dissenting Views of Chairman Daniel R. Pearson, Vice Chairman Shara L.Aranoff, and Commissioner Deanna Tanner Okun Regarding Latvia and Poland.
89
C. Likely Impact of Subject Imports
As instructed by the statute, I have considered the extent to which any improvement in the stateof the domestic industry is related to the antidumping duty order at issue and whether the industry isvulnerable to material injury if the order were revoked.
For the reasons already discussed in section I.C of my Latvia and Poland views,40 I do not findthe domestic industry to be vulnerable. Nonetheless, I find that subject imports from Ukraine would belikely to have a significant adverse impact on the industry if the antidumping order on rebar from Ukrainewere revoked. For reasons outlined above, I determine that, in the event of revocation, the volume ofimports from Ukraine would be significant. Given the commodity-like nature of rebar, it is likely thatsuch significant volumes would compete in the U.S. market solely on the basis of price. Consequently,given the likely significant volumes from Ukraine, and despite continued healthy demand, one wouldexpect to see price declines in the U.S. market in the reasonably foreseeable future. Given that, during theperiod of review, the improvement in the domestic industry’s financial condition was directly attributableto incremental price increases and sustained higher price levels, it is reasonable to conclude similarly thatconsistent declines in price levels would eventually lead to a deterioration in the financial condition of theindustry. Hence, I conclude that, in the event the order on rebar from Ukraine were revoked, subjectimports from Ukraine would be likely to have a significant adverse impact on the domestic industry’soutput, sales, market share, profits, and return on investment.
III. CONCLUSION
For the foregoing reasons, I find that revocation of the antidumping duty order on certain steelconcrete reinforcing bars from Ukraine would be likely to lead to continuation or recurrence of materialinjury to an industry in the United States within a reasonably foreseeable time.


1 With regard to the legal standards conditions of competition, I join my colleagues’ discussion in the majorityviews. For my views on cumulation of imports from Ukraine with other subject imports, see Separate andDissenting Views of Chairman Daniel R. Pearson And Commissioner Deanna Tanner Okun Regarding Cumulation. 2 A discussion of the Commission’s findings in the original determinations is contained in the majority views. 3 Mittal was the only firm to respond in the original investigation, but did not provide usable data. CR at IV-67;PR at IV-41. 4 CR at IV-67; PR at IV-41. 5 CR at IV-67-68; PR at IV-41. 6 CR/PR at Table I-1. 7 Id. 8 Id. 9 CR/PR at Table IV-33. 10 Id. 11 Id.
91
SEPARATE AND DISSENTING VIEWS OF CHAIRMAN DANIEL R. PEARSONREGARDING UKRAINE
Revocation of the Order on Subject Imports of Steel Concrete Reinforcing Bar (“Rebar”) fromUkraine Is Not Likely to Lead to Continuation or Recurrence of Material Injury Within aReasonably Foreseeable Time1
A. Likely Volume of Subject Imports2
In this review, information on the industry in Ukraine was provided by Mittal Steel Kryviy Rih(“Mittal”).3 Mittal is the successor firm to the Ukrainian steel producer Krivoi Rog Mining &Metallurgical Integrated Works (“Krivorozhstal”), which was previously 100 percent owned by thegovernment of Ukraine.4 There are varying estimates as to the percentage of the Ukrainian industry thatMittal represents. Mittal itself estimated that it accounted for between *** and *** percent of theindustry, although proprietary data sources such as *** and *** put Mittal’s market share at well over*** percent.5 At any rate, it appears that, with Mittal’s response, the Commission has fairlycomprehensive information on the industry in Ukraine.
In the original investigation, the volume of subject imports of rebar from Ukraine increased ineach year of the period of investigation. U.S. imports from Ukraine rose from 3,074 short tons in 1998 to95,904 short tons in 1999, and then grew further to 168,054 short tons in 2000.6 Their market share alsogrew steadily from less than *** percent in 1998 to *** percent in 1999, then to *** percent in 2000, asapparent domestic consumption rose overall.7
As with several other subject countries in these reviews, subject imports from Ukrainedisappeared from the U.S. market after the orders were put in place.8 The Ukrainian industry’s capacityto manufacture rebar fluctuated irregularly during the period of review. Capacity declined from 2001 to2002 to a period low of *** short tons, then increased in 2003 to a level of *** short tons. It thendeclined through 2005, reaching *** short tons, then increased to a period high of *** short tons in 2006,the last year of the period of review.9 Production showed a similar trend.10 Mittal’s capacity utilizationwas at or near *** percent throughout the period of review.11

12 Mittal prehearing brief at 9. 13 CR/PR at Table IV-34; CR at IV-72, PR at IV-42. 14 CR/PR at Table IV-9. 15 CR/PR at Table IV-33. 16 CR/PR at Table IV-35. The Ukraine industry shipped 831,919 short tons of rebar to Algeria in 2006, andshipped 506,521 short tons to Syria. 17 CR at IV-92-94; PR at IV-51-53. 18 CR/PR at Table IV-33. 19 CR at IV-74; PR at IV-43. 20 CR/PR at Table IV-33. 21 19 U.S.C. § 1675a(a)(2)(D). 22 CR/PR at Table IV-36. 23 Id.
92
As noted above, during the period of investigation, Mittal’s facilities were owned by thegovernment of Ukraine, which operated them under the name of Krivorozhstal.12 In November 2005,however, Krivorozhstal became affiliated with the Mittal Steel Group, which later, through its mergerwith Arcelor, became the largest steel producer in the world, and which operates a global marketingorganization for steel sales. Thus, the largest Ukrainian producer and the only one that apparentlyshipped substantial volumes to the U.S. market during the period of investigation is no longer anindependent actor wholly owned and operated by a government entity but rather is a branch of a world-wide steel company with over 10 mills producing rebar, including five in North America.13
The industry in Ukraine as a whole is export-oriented.14 The extent, however, to which theindustry sends its shipments to offshore locations has been declining. As a share of total shipments, totalexports of rebar from Ukraine declined steadily from *** percent in 2001 to *** percent.15 The vastmajority of Ukraine’s exports go to locations in North Africa and the Middle East, with Algeria and Syriabeing the top two export destinations in 2006.16 The record indicates that residential and non-residentialconstruction activity is expected to remain robust in these regions in the near future.17
Inventories as a ratio to total shipments were very low throughout the period of review, neverexceeding *** percent.18 With regard to third-country trade barriers, while Russia currently maintains a21-percent CVD levy against Ukraine, that tariff does not seem to have constrained Ukrainian exports tothat country. In 2006 Ukraine exported *** metric tons to Russia, a *** increase over its 2005 exportlevel of *** metric tons, and it expects to export *** metric tons to Russia in 2007.19 The EuropeanUnion (EU) also imposes a quota of 235,750 metric tons on rebar from Ukraine. It is unlikely that thisquota is much of a constraint on Ukrainian exports either, as exports to the EU never exceeded *** shorttons during the period of review. The Ukrainian industry *** to the United States if the order isrevoked.20
I have considered whether Ukrainian producers will likely re-direct production of alternativeproducts towards subject merchandise if the order is revoked. The statute directs the Commission toconsider the potential for product shifting if production facilities in the foreign country, which can beused to produce the subject merchandise, are currently being used to produce other products.21 Ukrainianproducers’ facilities are capable of producing other products besides subject rebar, such as coiled rebar,rounds, squares, angles, and strips.22 Thus, in theory, subject producers could engage in product shiftingin order to increase the volume of rebar exported to the U.S. market.
I do not find that Mittal will likely engage in product shifting. First, Mittal’s facilities onlyproduce *** on the same facilities producing rebar, so the scope for product shifting is limited.23 Second,the record indicates that these alternative products are more specialized than rebar and also are ***, so it

24 CR at IV-78, fn. 80; PR at IV-47, fn. 80. 25 See, e.g., CR/PR at Tables IV-43 & IV-47; CR at IV-92-94; PR at IV-51-53. 26 CR/PR at Table I-11. 27 CR/PR at Table IV-34. 28 CR at IV-72, fn. 75; PR at IV-42, fn. 75. 29 CR/PR at Table IV-35. 30 A discussion of the Commission’s findings in the original determinations is contained in the majority views. 31 See Original Confidential Staff Report at Tables V-2-V-12.
93
would not make good business sense to shift production from those products to rebar, even if theantidumping order were revoked.24 Finally, while U.S. demand has increased during the period of reviewand U.S. prices for subject rebar have increased, the record indicates that global demand is also strong andthat rebar prices have increased in other markets as well.25
Most important, I find that the inclusion of the Ukrainian producer under the Arcelor-Mittalcorporate umbrella is a significant change in conditions of competition that makes it unlikely that Mittalwill ship rebar to the United States so as to have a negative impact on the U.S. rebar market. The MittalSteel Group owns several rebar-producing facilities in North America, including Border Steel, Inc. inVinton, TX, which accounted for *** percent of U.S. rebar production in 2006 and ***.26 In addition toBorder Steel, the Mittal Group also owns much larger rebar-producing facilities in Mexico (Sicartsa) andin Canada (Contrecoeur and Longeuil).27 As a general matter, I find it unlikely, in situations where aforeign producer is owned and controlled by a transnational entity, that such a producer would sell intoany country (including the United States) in which it has an affiliated firm so as to disrupt marketconditions in that location by, for example, rapidly increasing shipments or lowering prices. Rather, Ifind it more likely that such affiliations would tend to reduce competition among the sister companies soas not to cause price reductions in the home markets of any of the related firms.
In the context of this review, I find that the behavior of Mittal’s state-owned predecessor,Krivorozhstal, during the original investigation (where exports to the United States surged markedly) isunlikely to be repeated by Mittal in the foreseeable future, owing to the fact that Mittal’s shipments arenow coordinated by the Mittal Group’s central sales marketing offices in Dubai and Chicago.28 I notefurther that my analysis is supported by the actual behavior of Mittal in the North American market sincethe 2005 takeover of Krivorozhstal. In 2006, the Ukrainian industry shipped only 17,659 tons to Canada,which had just revoked its antidumping order against imports from Ukraine.29 Thus, there was nomassive surge of imports into the Canadian market pursuant to revocation of that order.
Therefore, on the basis of lack of excess capacity in the Ukrainian industry, the low ratio ofinventories to total shipments, the lack of overly restrictive trade barriers in third countries, the industry’ssignificant focus on other export markets, such as those in North Africa and the Middle East, that arelucrative based on strong current and anticipated demand, and, most important, because of the changedcorporate alignment of the major Ukrainian producer, I find that the likely volume of subject imports ofrebar from Ukraine would not be significant if the antidumping duty order were revoked.
B. Likely Price Effects of Subject Imports30
Subject imports of rebar from Ukraine predominantly undersold domestic merchandise in theoriginal investigations.31 As Ukraine did not ship to the United States during the period of review, thereare no pricing data for Ukraine in the current record. For reasons outlined above in my discussion of thelikely volume of subject imports from Ukraine, however, I do not find that any imports from Ukrainesubsequent to revocation of the order will have adverse price effects. I find that the change in ownershipof the predominant Ukrainian production facility during the period of review makes it unlikely that any

32 CR/PR at Table II-5. 33 CR/PR at figure V-3. 34 CR/PR at Table I-1. 35 A discussion of the Commission’s findings in the original determinations is contained in the majority views.For my vulnerability analysis and the discussion of the impact factors, see Separate and Dissenting Views ofChairman Daniel R. Pearson and Commissioner Deanna Tanner Okun regarding Belarus, China, Indonesia, andMoldova, supra.
94
increased volumes would be sold at prices that would adversely affect the U.S. market. Arcelor Mittalwould not want to sell rebar in the U.S. market at prices that would disrupt the operations of its U.S.affiliate, Border Steel, or its other North American affiliates. In addition, while price is an importantfactor in purchasing decisions, other factors are equally important, such as availability and reliability ofsupply.32
Based on the significant increases in U.S. prices over the period of review,33 which weremaintained in 2006 despite surges in nonsubject imports,34 as well as my finding that revocation of theantidumping duty order on subject imports from Ukraine will likely not result in significant increasedvolumes of subject rebar to the United States, I find that any limited increase in the volume of subjectimports from Ukraine upon revocation is not likely to result in significant adverse price effects.
C. Likely Impact of Subject Imports35
In line with my findings regarding the likely volume and price effects of subject imports fromUkraine, I find that subject imports would not be likely to have a significant adverse impact on thedomestic industry’s output, sales, market share, profits, or return on investment, if the order wererevoked. As demand is projected to remain strong, the small volume of subject imports that would belikely upon revocation would not be likely to have a significant adverse impact on the domestic industry. Therefore, I find that revocation of the antidumping duty order on subject imports from Ukraine is notlikely to lead to the continuation or recurrence of material injury to the U.S. rebar industry within areasonably foreseeable time.
CONCLUSION
For the foregoing reasons, I conclude that revocation of the antidumping duty order onrebar from Ukraine would not be likely to lead to continuation or recurrence of material injury to anindustry in the United States within a reasonably foreseeable time.

1 At the time of the original investigations, the Commission was evenly divided with respect to the issue of aregional industry. For purposes of these reviews, and consistent with the Commission’s definition in the originalinvestigations, data are presented for a specified region which comprises Puerto Rico, the District of Columbia, and30 States: Alabama, Arkansas, Connecticut, Delaware, Florida, Georgia, Illinois, Indiana, Kentucky, Louisiana,Maine, Maryland, Massachusetts, Michigan, Mississippi, Missouri, New Hampshire, New Jersey, New York, NorthCarolina, Ohio, Pennsylvania, Rhode Island, South Carolina, Tennessee, Texas, Vermont, Virginia, West Virginia,and Wisconsin. 2 The Commission’s notice of institution, notice to conduct a full review, scheduling notice, and statement onadequacy appear in app. A and may also be found at the Commission’s web site (internet address www.usitc.gov). Commissioners’ votes on whether to conduct an expedited or full review may also be found at the web site.
I-1
PART I: INTRODUCTION AND OVERVIEW
BACKGROUND
On August 1, 2006, the U.S. International Trade Commission (“Commission” or “USITC”) gavenotice, pursuant to section 751(c) of the Tariff Act of 1930 (the Act), that it had instituted reviews todetermine whether revocation of the antidumping duty orders on concrete reinforcing bar (“rebar”) fromBelarus, China, Indonesia, Korea, Latvia, Moldova, Poland, and Ukraine would likely lead to thecontinuation or recurrence of material injury.1 Effective November 6, 2006, the Commission determinedthat it would conduct full reviews pursuant to section 751(c)(5) of the Act. Information relating to thebackground and schedule of the reviews is provided in the following tabulation.2
Effective date Action
September 7, 2001 Commerce’s antidumping duty orders (66 FR 46777)
August 1, 2006 Commission’s institution of reviews (71 FR 43523)
November 6, 2006 Commission’s decision to conduct full reviews (71 FR 66974, November 17, 2006)
November 30, 2006 Commission’s scheduling of the reviews (71 FR 70786, December 6, 2006)
December 5, 2006Commerce’s final results of expedited reviews on Belarus, China, Indonesia, Korea,Moldova, and Poland (71 FR 70509)1
March 5, 2007 Commerce’s final results of full review on Ukraine (72 FR 9732)1
April 5, 2007 Commerce’s final results of full review on Latvia (72 FR 16767)1
May 10, 2007 Commission’s hearing2
July 10, 2007 Commission’s vote
July 26, 2007 Commission’s determinations transmitted to Commerce
1 Commerce’s final results are presented in app. A. 2 App. B contains a list of witnesses who appeared at the hearing.

3 The petitions were filed by the Rebar Trade Action Coalition (RTAC), Washington, DC. The individualmembership of RTAC was as follows: AmeriSteel (Tampa, FL); Auburn Steel Co., (Auburn, NY); BirminghamSteel Corp. (Birmingham, AL); Border Steel, Inc. (El Paso, TX); CMC Steel Group (Seguin, TX); Marion Steel Co.(Marion, OH); Nucor Steel (Darlington, SC); and Riverview Steel (Glassport, PA). Auburn was not a petitioner withrespect to Indonesia and Japan. 4 Certain Steel Concrete Reinforcing Bars from Austria, Belarus, China, Indonesia, Japan, Korea, Latvia,Moldova, Poland, Russia, Ukraine, and Venezuela, Invs. Nos. 731-TA-872-883 (Preliminary), USITC Publication3343, August 2000. In its preliminary investigations, the Commission conducted a regional industry analysis asproposed by the petitioners. In so doing, the Commission found that subject imports from Austria, Japan, Russia,and Venezuela were not sufficiently concentrated in the region and concluded that there was no reasonableindication that a regional industry in the United States was materially injured or threatened with material injury. Ibid., p. 3. 5 Concrete Reinforcing Bars from Indonesia, Poland, and Ukraine, Invs. Nos. 731-TA-875, 880, and 882 (Final),USITC Publication 3425, May 2001 and Concrete Reinforcing Bars from Belarus, China, Korea, Latvia, andMoldova, Invs. Nos. 731-TA-873-874 and 877-879 (Final), USITC Publication 3440, July 2001. 6 Memorandum INV-Y-087, May 1, 2001, p. IV-2, fn. 4.
I-2
The Original Investigations
On June 28, 2000, petitions were filed with Commerce and the Commission alleging that aregional industry in the United States was materially injured and threatened with material injury by reasonof dumped imports of rebar from Austria, Belarus, China, Indonesia, Japan, Korea, Latvia, Moldova,Poland, Russia, Ukraine, and Venezuela.3 In its preliminary determinations transmitted to Commerce onAugust 14, 2000, the Commission terminated its investigations with respect to Austria, Japan, Russia, andVenezuela.4 In May and July 2001, the Commission made affirmative determinations concerning LTFVimports of rebar from Belarus, China, Indonesia, Korea, Latvia, Moldova, Poland, and Ukraine, but wasevenly divided regarding the issue of a regional industry.5
Summary Data
Tables I-1 and I-2 present a summary of data from the original investigations and from thesereviews. U.S. industry data are based on questionnaire responses of eight firms operating 25 mills thataccounted for virtually all known production of rebar in the United States. U.S. import data are based onofficial Commerce statistics, with the exception of data on imports from Belarus from 1998 to 2000,which are based on questionnaire responses of U.S. importers of rebar from Belarus at the time of theoriginal investigations because petitioners and the respondent from Belarus agreed that the officialstatistics understated U.S. imports of rebar from Belarus.6
During the original investigations, apparent consumption peaked in 1999, then declined in 2000on both a national and a regional basis. Apparent consumption continued to decrease between 2000 and2002, then increased through 2006 on a national and regional basis. The U.S. producers’ share ofconsumption was less in 2006 than 2000 (a change that was more pronounced on a national than aregional basis). Subject imports have decreased to a fraction of their quantities during the originalinvestigations. Nonsubject imports, in particular imports from Turkey, increased markedly during thelatter part of the review period. U.S. producers’ capacity utilization and productivity have made largegains, while workers’ hourly wages increased noticeably. The unit values of shipments and net salesincreased sharply in the latter part of the review period, offsetting higher unit costs.

I-3
Table I-1Rebar: Summary data for the national U.S. market from the original investigations and current reviews, 1998-2006
(Quantity in short tons; value in $1,000; unit values, unit labor costs, and unit financial data are per short ton)
Item
Calendar year1
1998 1999 2000 2001 2002 2003 2004 2005 2006
U.S. consumption quantity: Amount *** *** *** 7,735,092 7,368,986 8,492,487 8,718,690 8,868,598 9,875,423
Producers’ share:2 *** *** *** 77.6 83.4 88.1 77.2 83.6 75.1
Importers’ share:
Belarus2 *** *** *** 0.0 (3) 0.0 0.0 0.0 0.0
China2 *** *** *** (3) (3) 0.0 (3) (3) (3)
Indonesia2 *** *** *** 0.0 0.0 0.0 0.0 0.0 0.0
Korea2 *** *** *** 1.5 0.0 0.0 0.0 0.1 0.0
Latvia2 *** *** *** 0.4 0.6 0.6 1.4 0.4 0.0
Moldova2 *** *** *** 0.0 0.0 0.0 0.0 0.0 0.0
Poland2 *** *** *** 0.3 0.0 0.0 0.1 0.0 (3)
Ukraine2 *** *** *** 0.0 0.0 0.0 0.0 0.0 0.0
Subtotal2 *** *** *** 2.3 0.7 0.6 1.5 0.5 (3)
All other countries2 *** *** *** 20.1 16.0 11.3 21.4 15.9 24.9
Total imports2 *** *** *** 22.4 16.6 11.9 22.8 16.4 24.9
U.S. consumption value: Amount *** *** *** 2,000,487 1,873,951 2,394,862 3,920,696 4,128,649 4,957,637
Producers’ share:2 *** *** *** 80.6 85.3 88.2 76.4 85.0 78.1
Importers’ share:
Belarus2 *** *** *** 0.0 (3) 0.0 0.0 0.0 0.0
China2 *** *** *** (3) (3) 0.0 (3) (3) (3)
Indonesia2 *** *** *** 0.0 0.0 0.0 0.0 0.0 0.0
Korea2 *** *** *** 1.3 0.0 0.0 0.0 0.1 0.0
Latvia2 *** *** *** 0.3 0.6 0.6 1.1 0.4 0.0
Moldova2 *** *** *** 0.0 0.0 0.0 0.0 0.0 0.0
Poland2 *** *** *** 0.3 0.0 0.0 0.1 0.0 (3)
Ukraine2 *** *** *** 0.0 0.0 0.0 0.0 0.0 0.0
Subtotal2 *** *** *** 2.0 0.6 0.6 1.1 0.4 (3)
All other countries2 *** *** *** 17.4 14.0 11.2 22.5 14.5 21.9
Total imports2 *** *** *** 19.4 14.7 11.8 23.6 15.0 21.9
Table continued on the following page.

I-4
Table I-1--ContinuedRebar: Summary data for the national U.S. market from the original investigations and current reviews, 1998-2006
(Quantity in short tons; value in $1,000; unit values, unit labor costs, and unit financial data are per short ton)
Item
Calendar year1
1998 1999 2000 2001 2002 2003 2004 2005 2006
U.S. imports from-- Belarus:4 Quantity *** *** *** 0 2,820 0 0 0 0
Value *** *** *** 0 577 0 0 0 0
Unit value $*** $*** $*** (5) $205 (5) (5) (5) (5)
China:4 Quantity 0 17,547 163,124 47 21 0 169 60 3
Value 0 3,360 36,268 23 13 0 173 18 4
Unit value (5) $191 $222 $492 $635 (5) $1,027 $299 $1,303
Indonesia:4 Quantity 44,504 69,261 0 0 0 0 0 0 0
Value 9,708 17,411 0 0 0 0 0 0 0
Unit value $218 $251 (5) (5) (5) (5) (5) (5) (5)
Korea:4 Quantity 527,080 423,893 263,601 118,469 0 0 0 5,516 0
Value 138,508 88,385 56,402 26,314 0 0 0 2,262 0
Unit value $263 $209 $214 $222 (5) (5) (5) $410 (5)
Latvia:4 Quantity 97,002 303,997 207,705 33,662 45,904 50,522 121,881 36,646 0
Value 34,013 60,153 41,965 6,761 10,720 14,316 42,001 15,059 0
Unit value $351 $198 $202 $201 $234 $283 $345 $411 (5)
Moldova:4 Quantity 187,271 183,803 181,492 0 0 0 0 0 0
Value 58,477 40,228 38,473 0 0 0 0 0 0
Unit value $312 $219 $212 (5) (5) (5) (5) (5) (5)
Poland:4 Quantity 53,231 10,681 69,292 26,884 0 0 7,303 0 129
Value 15,034 2,049 13,959 5,943 0 0 2,789 0 50
Unit value $282 $192 $201 $221 (5) (5) $382 (5) $387
Ukraine:4 Quantity 3,074 95,904 168,054 0 0 0 0 0 0
Value 826 18,412 33,783 0 0 0 0 0 0
Unit value $269 $192 $201 (5) (5) (5) (5) (5) (5)
Subtotal: Quantity *** *** *** 179,061 48,746 50,522 129,352 42,222 133
Value *** *** *** 39,042 11,310 14,316 44,963 17,339 54
Unit value $*** $*** $*** $218 $232 $283 $348 $411 $411
Table continued on the following page.

I-5
Table I-1--ContinuedRebar: Summary data for the national U.S. market from the original investigations and current reviews, 1998-2006
(Quantity in short tons; value in $1,000; unit values, unit labor costs, and unit financial data are per short ton)
Item
Calendar year1
1998 1999 2000 2001 2002 2003 2004 2005 2006
All other countries:4 Quantity 234,824 627,031 447,875 1,551,751 1,177,809 962,562 1,861,470 1,410,136 2,454,275
Value 58,811 135,104 104,930 348,890 263,224 269,131 881,861 600,627 1,084,640
Unit value $250 $215 $234 $225 $223 $280 $474 $426 $442
All countries: Quantity *** *** *** 1,730,812 1,226,554 1,013,084 1,990,822 1,452,358 2,454,407
Value *** *** *** 387,932 274,535 283,447 926,824 617,966 1,084,694
Unit value $*** $*** $*** $224 $224 $280 $466 $425 $442
U.S. producers’-- Average capacity quantity 7,894,486 8,311,304 8,392,708 7,886,652 7,993,078 8,424,774 8,154,261 8,367,112 8,615,640
Production quantity 6,069,810 6,226,289 6,444,053 6,146,866 6,354,037 7,501,223 7,076,073 7,541,574 7,704,871
Capacity utilization2 76.9 74.9 76.8 77.9 79.5 89.0 86.8 90.1 89.4
U.S. shipments: Quantity 5,753,110 6,182,533 6,308,658 6,004,280 6,142,432 7,479,403 6,727,868 7,416,240 7,421,016
Value 1,760,831 1,701,922 1,705,969 1,612,555 1,599,417 2,111,414 2,993,872 3,510,682 3,872,943
Unit value $306 $275 $270 $269 $260 $282 $445 $473 $522
Exports: Quantity 125,986 112,508 135,690 *** *** *** *** *** ***
Value 39,036 29,367 35,720 *** *** *** *** *** ***
Unit value $310 $261 $263 *** *** *** *** *** ***
Table continued on the following page.

I-6
Table I-1--ContinuedRebar: Summary data for the national U.S. market from the original investigations and current reviews, 1998-2006
(Quantity in short tons; value in $1,000; unit values, unit labor costs, and unit financial data are per short ton)
Item
Calendar year1
1998 1999 2000 2001 2002 2003 2004 2005 2006
Ending inventory quantity 700,006 630,355 631,653 601,153 617,597 441,762 619,492 533,925 597,345
Inventories/total shipments2 11.9 10.0 9.8 *** *** *** *** *** ***
Production workers 4,134 4,247 4,216 3,967 3,827 3,897 3,719 3,909 4,066
Hours worked (1,000 hours) 8,949 9,015 8,773 8,438 8,093 8,938 8,149 8,390 8,650
Wages paid (1,000 dollars) 187,156 198,411 202,146 211,855 215,541 237,579 238,024 265,621 284,103
Hourly wages $20.91 $22.01 $23.04 $25.11 $26.63 $26.58 $29.21 $31.66 $32.85
Productivity (short tons per 1,000 hours) 657.8 667.9 711.9 728.5 785.1 839.3 868.3 898.9 890.8
Net sales: Quantity 5,888,924 6,342,811 6,472,547 6,190,355 6,338,939 7,615,292 7,016,005 7,533,213 7,742,037
Value 1,802,793 1,744,029 1,750,282 1,657,996 1,654,343 2,137,694 3,029,572 3,531,181 4,006,813
Unit value $306 $275 $270 $268 $261 $281 $432 $469 $518
Cost of goods sold 1,613,285 1,536,041 1,605,071 1,455,311 1,503,097 1,946,966 2,398,760 2,717,517 2,965,198
Gross profit or (loss) 189,508 207,988 145,211 202,685 151,246 190,728 630,812 813,665 1,041,615
Operating income or (loss) 103,904 105,557 44,562 109,908 66,308 65,702 466,410 621,520 827,761
Unit cost of goods sold $274 $242 $248 $235 $237 $256 $342 $361 $383
Unit operating income or (loss) $18 $17 $7 $18 $10 $9 $66 $83 $107
Cost of goods sold/sales2 89.5 88.1 91.7 87.8 90.9 91.1 79.2 77.0 74.0
Operating income or (loss)/sales2 5.8 6.1 2.5 6.6 4.0 3.1 15.4 17.6 20.7
1 Financial data are on a fiscal year basis. 2 In percent. 3 Less than 0.05 percent. 4 Data for Latvia for 2001-06 are for imports entered under HTS subheading 7214.20.00 plus imports entered under HTS statistical reporting number 7228.30.8050 from official Commercestatistics. In addition, a ***. ***. All other import data presented are from official Commerce statistics for imports entered under HTS subheading 7214.20.00. 5 Not applicable.
Note.–Because of rounding, figures may not add to the totals shown. Data for 1998-2000 are derived from information presented in table C-4 of the staff report from the original investigations. During the original investigations, ***. INV-Y-087, May 1, 2001, p. IV-2, fn. 4.
Source: Compiled from data submitted in response to Commission questionnaires and from official Commerce statistics.

I-7
Table I-2Rebar: Summary data for the specified region from the original investigations and current reviews, 1998-2006
(Quantity in short tons; value in $1,000; unit values, unit labor costs, and unit financial data are per short ton)
Item
Calendar year1
1998 1999 2000 2001 2002 2003 2004 2005 2006
Regional U.S. consumptionquantity: Amount *** *** *** 5,560,169 5,354,127 5,959,510 6,294,675 6,391,058 7,201,337
Regional producers’ share:2 *** *** *** 71.5 75.7 80.6 70.3 76.7 69.4
Non-regional producers’ share:2 *** *** *** 2.6 2.8 3.7 2.7 3.7 2.6
Importers’ share: Belarus2 *** *** *** 0.0 0.1 0.0 0.0 0.0 0.0
China2 *** *** *** (3) (3) 0.0 (3) (3) 0.0
Indonesia2 *** *** *** 0.0 0.0 0.0 0.0 0.0 0.0
Korea2 *** *** *** 1.5 0.0 0.0 0.0 0.0 0.0
Latvia2 *** *** *** 0.6 0.9 0.8 1.9 0.6 0.0
Moldova2 *** *** *** 0.0 0.0 0.0 0.0 0.0 0.0
Poland2 *** *** *** 0.5 0.0 0.0 0.1 0.0 (3)
Ukraine2 *** *** *** 0.0 0.0 0.0 0.0 0.0 0.0
Subtotal2 *** *** *** 2.6 0.9 0.8 2.0 0.6 (3)
All other countries2 *** *** *** 23.3 20.5 14.9 25.0 19.0 28.0
Total imports2 *** *** *** 25.9 21.4 15.8 27.1 19.6 28.0
Regional U.S. consumption value: Amount *** *** *** 1,415,257 1,346,810 1,666,355 2,821,376 2,922,359 3,558,746
Regional producers’ share:2 *** *** *** 74.2 77.8 80.2 69.2 77.8 72.1
Non-regional producers’ share:2 *** *** *** 3.0 3.2 4.1 2.7 3.9 2.8
Importers’ share: Belarus2 *** *** *** 0.0 (3) 0.0 0.0 0.0 0.0
China2 *** *** *** (3) (3) 0.0 (3) (3) 0.0
Indonesia2 *** *** *** 0.0 0.0 0.0 0.0 0.0 0.0
Korea2 *** *** *** 1.3 0.0 0.0 0.0 0.0 0.0
Latvia2 *** *** *** 0.5 0.8 0.9 1.5 0.5 0.0
Moldova2 *** *** *** 0.0 0.0 0.0 0.0 0.0 0.0
Poland2 *** *** *** 0.4 0.0 0.0 0.1 0.0 (3)
Ukraine2 *** *** *** 0.0 0.0 0.0 0.0 0.0 0.0
Subtotal2 *** *** *** 2.2 0.8 0.9 1.6 0.5 (3)
All other countries2 *** *** *** 20.6 18.2 14.8 26.5 17.8 25.1
Total imports2 *** *** *** 22.8 19.0 15.6 28.1 18.3 25.1
Table continued on the following page.

I-8
Table I-2--ContinuedRebar: Summary data for the specified region from the original investigations and current reviews, 1998-2006
(Quantity in short tons; value in $1,000; unit values, unit labor costs, and unit financial data are per short ton)
Item
Calendar year1
1998 1999 2000 2001 2002 2003 2004 2005 2006
Regional U.S. imports from-- Belarus:4 Quantity *** *** *** 0 2,820 0 0 0 0
Value *** *** *** 0 577 0 0 0 0
Unit value $*** $*** $*** (5) $205 (5) (5) (5) (5)
China:4
Quantity 0 17,417 123,217 47 21 0 15 43 0
Value 0 3,330 27,451 23 13 0 15 13 0
Unit value $0 $191 $223 $492 $635 (5) $1,011 $309 (5)
Indonesia:4 Quantity 44,504 63,748 0 0 0 0 0 0 0
Value 9,708 16,185 0 0 0 0 0 0 0
Unit value $218 $254 (5) (5) (5) (5) (5) (5) (5)
Korea:4 Quantity 405,254 291,275 205,841 84,188 0 0 0 0 0
Value 107,157 59,202 42,993 18,688 0 0 0 0 0
Unit value $264 $203 $209 $222 (5) (5) (5) (5) (5)
Latvia:4 Quantity 97,002 303,997 207,705 33,662 45,904 50,522 121,881 36,646 0
Value 34,013 60,153 41,965 6,761 10,720 14,316 42,001 15,059 0
Unit value $351 $198 $202 $201 $234 $283 $345 $411 (5)
Moldova:4 Quantity 187,250 183,803 181,492 0 0 0 0 0 0
Value 58,463 40,228 38,473 0 0 0 0 0 0
Unit value $312 $219 $212 (5) (5) (5) (5) (5) (5)
Poland:4 Quantity 53,231 10,681 69,278 26,553 0 0 6,927 0 129
Value 15,034 2,049 13,953 5,779 0 0 2,254 0 50
Unit value $282 $192 $201 $218 (5) (5) $325 (5) $387
Ukraine:4
Quantity 3,074 95,904 168,054 0 0 0 0 0 0
Value 826 18,412 33,783 0 0 0 0 0 0
Unit value $269 $192 $201 (5) (5) (5) (5) (5) (5)
Subtotal: Quantity *** *** *** 144,449 48,746 50,522 128,823 36,688 129
Value *** *** *** 31,251 11,310 14,316 44,270 15,073 50
Unit value $*** $*** $*** $216 $232 $283 $344 $411 $387
All other countries:4 Quantity 191,622 527,844 377,045 1,296,320 1,099,441 888,404 1,574,058 1,216,390 2,013,740
Value 47,315 111,780 86,875 291,353 244,537 246,135 747,255 518,875 892,702
Unit value $247 $212 $230 $225 $222 $277 $475 $427 $443
Table continued on the following page.

I-9
Table I-2--ContinuedRebar: Summary data for the specified region from the original investigations and current reviews, 1998-2006
(Quantity in short tons; value in $1,000; unit values, unit labor costs, and unit financial data are per short ton)
Item
Calendar year1
1998 1999 2000 2001 2002 2003 2004 2005 2006
All countries: Quantity *** *** *** 1,440,769 1,148,186 938,926 1,702,880 1,253,079 2,013,869
Value *** *** *** 322,605 255,848 260,452 791,525 533,948 892,752
Unit value $*** $*** $*** $224 $223 $277 $465 $426 $443
Non-regional U.S. producers’-- U.S. shipments to region: Quantity 160,857 194,992 153,149 145,438 150,445 218,253 168,422 236,191 188,951
Value 50,118 54,270 41,836 42,810 43,034 68,723 77,524 113,829 98,886
Unit value $312 $278 $273 $294 $286 $315 $460 $482 $523
Regional U.S. producers’-- Capacity quantity 5,198,086 5,494,904 5,612,908 5,551,138 5,687,574 5,866,111 5,760,559 5,863,662 6,116,290
Production quantity 3,910,732 4,095,918 4,236,273 4,252,563 4,472,788 5,089,855 4,897,577 5,195,599 5,426,079
Capacity utilization2 75.2 74.5 75.5 76.6 78.6 86.8 85.0 88.6 88.7
U.S. shipments within the region: Quantity 3,524,250 3,768,882 3,842,009 3,973,962 4,055,496 4,802,331 4,423,373 4,901,788 4,998,517
Value 1,088,605 1,033,380 1,032,215 1,049,843 1,047,928 1,337,181 1,952,326 2,274,582 2,567,108
Unit value $309 $274 $269 $264 $258 $278 $441 $464 $514
U.S. shipments outside the region: Quantity 288,606 321,192 339,879 328,409 340,383 384,011 370,460 341,984 376,581
Value 90,298 90,498 94,369 90,046 89,352 108,524 163,724 164,493 203,004
Unit value $313 $282 $278 $274 $263 $283 $442 $481 $539
Exports: Quantity 22,204 14,186 36,567 *** *** *** *** *** ***
Value 6,738 3,743 8,493 *** *** *** *** *** ***
Unit value $303 $264 $232 *** *** *** *** *** ***
Table continued on the following page.

I-10
Table I-2--ContinuedRebar: Summary data for the specified region from the original investigations and current reviews, 1998-2006
(Quantity in short tons; value in $1,000; unit values, unit labor costs, and unit financial data are per short ton)
Item
Calendar year1
1998 1999 2000 2001 2002 2003 2004 2005 2006
Ending inventory quantity 408,929 402,168 420,309 366,847 428,665 325,883 426,645 366,923 414,605
Inventories/ total shipments2 10.7 9.8 10.0 *** *** *** *** *** ***
Production workers 2,649 2,706 2,771 2,635 2,609 2,590 2,482 2,593 2,739
Hours worked (1,000 hours) 5,537 5,684 5,716 5,617 5,559 5,905 5,632 5,611 6,052
Wages paid (1,000 dollars) 114,445 123,264 127,747 134,824 139,834 150,379 154,854 165,826 184,669
Hourly wages $20.67 $21.69 $22.35 $24.00 $25.15 $25.47 $27.50 $29.55 $30.52
Productivity (short tons per 1,000 hours) 673.2 684.5 706.5 757.1 804.6 862.0 869.6 926.0 896.7
Net sales: Quantity 3,846,322 4,162,424 4,251,627 4,314,344 4,412,317 5,130,869 4,914,478 5,161,392 5,478,984
Value 1,189,115 1,143,322 1,144,546 1,137,102 1,144,308 1,414,388 2,074,882 2,365,696 2,789,490
Unit value $309 $275 $269 $264 $259 $276 $422 $458 $509
Cost of goods sold 1,055,997 1,017,965 1,064,507 1,009,807 1,039,787 1,299,180 1,668,707 1,825,527 2,075,643
Gross profit or (loss) 133,118 125,357 80,039 127,295 104,521 115,208 406,175 540,170 713,847
Operating income or (loss) 75,822 55,634 11,571 53,156 37,263 10,385 264,971 380,389 528,712
Unit cost of goods sold $275 $245 $250 $234 $236 $253 $340 $354 $379
Unit operating income or (loss) $20 $13 $3 $12 $8 $2 $54 $74 $96
Cost of goods sold/sales2 88.8 89.0 93.0 88.8 90.9 91.9 80.4 77.2 74.4
Operating income or (loss)/sales2 6.4 4.9 1.0 4.7 3.3 0.7 12.8 16.1 19.0
1 Financial data are on a fiscal year basis. 2 In percent. 3 Less than 0.05 percent. 4 Data for Latvia for 2001-06 are for imports entered under HTS subheading 7214.20.00 plus imports entered under HTS statistical reporting number7228.30.8050 from official Commerce statistics. In addition, a ***. ***. All other import data presented are from official Commerce statistics for importsentered under HTS subheading 7214.20.00. 5 Not applicable.
Note.–Because of rounding, figures may not add to the totals shown. Data for 1998-2000 are derived from information presented in table C-4 of the staffreport from the original investigations. During the original investigations, ***. INV-Y-087, May 1, 2001, p. IV-2, fn. 4.
Source: Compiled from data submitted in response to Commission questionnaires and from official Commerce statistics.

7 Steel Reinforcing Bars from Canada, Tariff Commission Publication 122, March 1964. In this investigation, theCommission focused on a Pacific Northwest industry consisting of three producers in Washington and Oregon. 8 Steel Bars, Reinforcing Bars, and Shapes from Australia, Tariff Commission Publication 314, February 1970. 9 Deformed Concrete Reinforcing Bars of Non-Alloy Steel from Mexico, Tariff Commission Publication 605,August 1973. 10 Concrete Reinforcing Bars from Turkey, Inv. No. 731-TA-745 (Final), USITC Publication 3034, April 1997. 11 62 FR 18748. 12 Concrete Reinforcing Bars from Turkey, Inv. No. 731-TA-745 (Review), USITC Publication 3577, February2003. 13 19 U.S.C. § 2252. 14 Institution and Scheduling of an Investigation under Section 202 of the Trade Act of 1974 (19 U.S.C. 2252) (theAct), 66 FR 35267, July 3, 2001. 15 19 U.S.C. § 2251. 16 Consolidation of Senate Finance Committee Resolution Requesting a Section 201 Investigation with theInvestigation Requested by the United States Trade Representative on June 22, 2001, 66 FR 44158, August 22,2001.
I-11
PREVIOUS AND RELATED TITLE VII INVESTIGATIONS
The Commission has conducted four other antidumping duty investigations concerning rebar. InMarch 1964, the U.S. Tariff Commission made an affirmative determination concerning LTFV imports ofsteel reinforcing bars from Canada (investigation No. AA1921-33).7 In February 1970, the Commissionmade an affirmative determination concerning LTFV imports of steel bars, reinforcing bars, and shapesfrom Australia (investigation No. AA1921-62).8 There are no outstanding antidumping duty orders as aresult of either of these investigations. In August 1973, the Commission made a negative determinationconcerning LTFV imports of deformed concrete reinforcing bars of non-alloy steel from Mexico(investigation No. AA1921-122).9 Finally, in 1997, the Commission made a final affirmativedetermination concerning LTFV imports of rebar from Turkey10 and Commerce issued an antidumpingduty order on April 17, 1997.11 In 2003, the Commission made an affirmative determination in its firstfive-year review concerning rebar from Turkey.12 The Commission is scheduled to institute a secondfive-year review of this order in February 2008.
PREVIOUS AND RELATED SAFEGUARD INVESTIGATIONS
Following receipt of a request from the Office of the United States Trade Representative(“USTR”) on June 22, 2001, the Commission instituted investigation No. TA-201-73, Steel, under section202 of the Trade Act of 197413 to determine whether certain steel products, including rebar, were beingimported into the United States in such increased quantities as to be a substantial cause of serious injury,or the threat thereof, to the domestic industries producing articles like or directly competitive with theimported article.14 On July 26, 2001, the Commission received a resolution adopted by the Committee onFinance of the U.S. Senate (“Senate Finance Committee” or “Committee”) requesting that theCommission investigate certain steel imports under section 201 of the Trade Act of 1974.15 Consistentwith the Senate Finance Committee’s resolution, the Commission consolidated the investigation requestedby the Committee with the Commission’s previously instituted investigation No. TA-201-73.16 OnDecember 20, 2001, the Commission issued its determinations and remedy recommendations. TheCommission reached an affirmative determination with respect to rebar.

17 Presidential Proclamation 7529 of March 5, 2002, To Facilitate Positive Adjustment to Competition FromImports of Certain Steel Products, 67 FR 10553, March 7, 2002. 18 The increased duties were reduced from 15 percent to 12 percent on March 20, 2003. 19 The Department of Commerce published regulations establishing such a system on December 31, 2002. 20 Of the countries subject to these reviews, safeguard measures were not applied to imports from Indonesia,Latvia, and Poland. Imports of rebar from Moldova were subject to the U.S. safeguard measures, notwithstandingthat country’s designation as a developing country WTO member. 21 Steel: Monitoring Developments in the Domestic Industry, Inv. No. TA-204-9, USITC Publication 3632,September 2003. 22 Steel: Monitoring Developments in the Domestic Industry, Inv. No. TA-204-9, Volume I, USITC Publication3632, September 2003, pp. xiv-xv. 23 Presidential Proclamation 7741 of December 4, 2003, To Provide for the Termination of Action Taken WithRegard to Imports of Certain Steel Products, 68 FR 68483, December 8, 2003. 24 Proclamation 7741 terminated the tariff-rate quota and the increased import duties on certain steel products, butdirected the Secretary of Commerce to continue the monitoring system until the earlier of March 21, 2005, or suchtime as the Secretary establishes a replacement program. On March 11, 2005, Commerce published an interim final
(continued...)
I-12
On March 5, 2002, following determinations regarding serious injury or threat of serious injuryby the Commission under section 202 of the Trade Act of 1974, the President announced the safeguardmeasures that he planned to implement to facilitate efforts by various domestic steel industries and theirworkers to make a positive adjustment to import competition with respect to certain steel products. Thesafeguard measures encompassed 10 different product categories for which the Commission madeaffirmative determinations or was evenly divided. Presidential Proclamation 7529 implemented thesafeguard measures, principally in the form of tariffs and tariff-rate quotas, effective March 20, 2002, fora period of three years and one day. Import relief relating to rebar consisted of an additional tariff of 15percent ad valorem on imports in the first year, 12 percent in the second year, and 9 percent in the thirdyear.17 18 The President also instructed the Secretary of the Treasury and the Secretary of Commerce toestablish a system of import licensing to facilitate the monitoring of imports of certain steel products.19
The safeguard measures applied to imports of subject steel products from all countries exceptCanada, Israel, Jordan, and Mexico, which had entered into free trade agreements with the United States,and most developing countries that were members of the World Trade Organization.20 The President’sinitial proclamation also excluded numerous specific products from the measures, and was followed bysubsequent additional exclusions.
On September 19, 2003, the Commission submitted a mid-term report to the President and theCongress on the results of its monitoring of developments in the steel industry, as required by section204(a)(2) of the Trade Act of 1974.21 The Commission’s monitoring report noted that total imports ofrebar declined, as imports from covered sources declined sharply, while imports from sources not coveredby the safeguard measure (notably Brazil, the Dominican Republic, and Egypt) increased. Notwithstanding decreased demand for rebar, output-related indicators for the domestic industry such asproduction, capacity utilization, and shipments increased in the first relief year, as did labor productivity. Per-unit net sales, however, declined while unit costs (specifically, unit raw materials costs), increased inthe first relief year, and the domestic industry reported an operating loss.22
On December 4, 2003, President Bush terminated the U.S. measure with respect to increasedtariffs, following receipt of the Commission’s mid-point monitoring report in September 2003, and afterseeking information from the U.S. Secretary of Commerce and U.S. Secretary of Labor, havingdetermined that the effectiveness of the action taken had been impaired by changed circumstances.23 Import licensing, however, remained in place through March 21, 2005, and continues in modified form atthis time.24

24 (...continued)rule to implement a replacement program for the period beyond March 21, 2005. Steel Import Monitoring andAnalysis System, 70 FR 12133, March 11, 2005. On December 5, 2005, Commerce published its final rule. SteelImport Monitoring and Analysis System, 70 FR 72373, December 5, 2005.
I-13
On March 21, 2005, the Commission instituted an investigation under section 204(d) of the TradeAct of 1974 for the purpose of evaluating the effectiveness of the relief action imposed by the Presidenton imports of certain steel products. The Commission’s report on the evaluation was transmitted to thePresident and the Congress on September 19, 2005.
STATUTORY CRITERIA AND ORGANIZATION OF THE REPORT
Statutory Criteria
Section 751(c) of the Act requires Commerce and the Commission to conduct a review no laterthan five years after the issuance of an antidumping or countervailing duty order or the suspension of aninvestigation to determine whether revocation of the order or termination of the suspended investigation“would be likely to lead to continuation or recurrence of dumping or a countervailable subsidy (as thecase may be) and of material injury.”
Section 752(a) of the Act provides that in making its determination of likelihood of continuationor recurrence of material injury--
(1) IN GENERAL.-- . . . the Commission shall determine whether revocation ofan order, or termination of a suspended investigation, would be likely to lead tocontinuation or recurrence of material injury within a reasonably foreseeable time. TheCommission shall consider the likely volume, price effect, and impact of imports of thesubject merchandise on the industry if the order is revoked or the suspended investigationis terminated. The Commission shall take into account--
(A) its prior injury determinations, including the volume, priceeffect, and impact of imports of the subject merchandise on the industrybefore the order was issued or the suspension agreement was accepted,
(B) whether any improvement in the state of the industry isrelated to the order or the suspension agreement,
(C) whether the industry is vulnerable to material injury if theorder is revoked or the suspension agreement is terminated, and
(D) in an antidumping proceeding . . ., (Commerce’s findings)regarding duty absorption . . ..
(2) VOLUME.--In evaluating the likely volume of imports of the subjectmerchandise if the order is revoked or the suspended investigation is terminated, theCommission shall consider whether the likely volume of imports of the subjectmerchandise would be significant if the order is revoked or the suspended investigation isterminated, either in absolute terms or relative to production or consumption in theUnited States. In so doing, the Commission shall consider all relevant economic factors,including--
(A) any likely increase in production capacity or existing unusedproduction capacity in the exporting country,
(B) existing inventories of the subject merchandise, or likelyincreases in inventories,

I-14
(C) the existence of barriers to the importation of suchmerchandise into countries other than the United States, and
(D) the potential for product-shifting if production facilities inthe foreign country, which can be used to produce the subjectmerchandise, are currently being used to produce other products.
(3) PRICE.--In evaluating the likely price effects of imports of the subjectmerchandise if the order is revoked or the suspended investigation is terminated, theCommission shall consider whether--
(A) there is likely to be significant price underselling by importsof the subject merchandise as compared to domestic like products, and
(B) imports of the subject merchandise are likely to enter theUnited States at prices that otherwise would have a significantdepressing or suppressing effect on the price of domestic like products.
(4) IMPACT ON THE INDUSTRY.--In evaluating the likely impact of imports ofthe subject merchandise on the industry if the order is revoked or the suspendedinvestigation is terminated, the Commission shall consider all relevant economic factorswhich are likely to have a bearing on the state of the industry in the United States,including, but not limited to--
(A) likely declines in output, sales, market share, profits,productivity, return on investments, and utilization of capacity,
(B) likely negative effects on cash flow, inventories, employment,wages, growth, ability to raise capital, and investment, and
(C) likely negative effects on the existing development andproduction efforts of the industry, including efforts to develop aderivative or more advanced version of the domestic like product.
The Commission shall evaluate all such relevant economic factors . . . within the contextof the business cycle and the conditions of competition that are distinctive to the affectedindustry.
Section 752(a)(6) of the Act states further that in making its determination, “the Commission mayconsider the magnitude of the margin of dumping or the magnitude of the net countervailable subsidy. Ifa countervailable subsidy is involved, the Commission shall consider information regarding the nature ofthe countervailable subsidy and whether the subsidy is a subsidy described in Article 3 or 6.1 of theSubsidies Agreement.”
Organization of the Report
Information obtained during the course of the reviews that relates to the above factors ispresented throughout this report. A summary of data collected in the reviews is presented in appendix C. Responses by U.S. producers, importers, and purchasers of rebar to a series of questions concerning thesignificance of the existing antidumping duty orders and the likely effects of revocation are presented in

25 No duty absorption findings were made for any of the subject countries. 26 For previously reviewed or investigated companies not included in an administrative review, the cash depositrate continues to be the company-specific rate published for the most recent period.
I-15
appendix D. U.S. producers’ company-by-company data for trade and financial indicators are presentedin appendices E and F. Import data from responses to Commission questionnaires are presented inappendix G.
COMMERCE’S REVIEWS
Administrative Reviews25
The following tables present information on Commerce’s administrative reviews of the subjectorders.26 Commerce did not initiate or complete any antidumping duty order administrative reviews ofsubject imports from Belarus, China, Indonesia, Moldova, Poland, or Ukraine.
Korea
Since the issuance of the antidumping duty order, three antidumping duty administrative reviewshave been completed with regard to subject imports of rebar from Korea. The results of the completedadministrative reviews are shown in table I-3.
Table I-3Rebar: Administrative reviews of the antidumping duty order for Korea
Date results published Period of review Producer or exporter Margin
April 13, 2004 (69 FR 19400) 1/30/2001 - 8/31/2002
Dongkuk Steel Mill 11.74Korea Iron and Steel 11.74All others 22.89
September 9, 2004(69 FR 54642)1 9/30/2002 - 8/31/2003
Dongil Industries 102.28Hanbo Iron & Steel 102.28All others 22.89
April 13, 2007 (72 FR 18630) 9/30/2004 - 8/31/2005
Dongkuk Steel Mill 0.00Korea Iron and Steel 0.00Hwanyoung Steel 0.00Dongil Industries 102.28All others 22.89
1 DSM, INI Steel, KISCO, and Kosteel included in initial review but rescinded.
Source: Cited Federal Register notices.
Latvia
Commerce completed four antidumping duty order administrative reviews of rebar from Latvia,and published the preliminary results of another. The results of the completed administrative reviews areshown in table I-4.

27 Section 754 of the Tariff Act of 1930, as amended (19 U.S.C. § 1675(c)). 28 19 CFR 159.64 (g).
I-16
Table I-4Rebar: Administrative reviews of the antidumping duty order for Latvia
Date results published Period of review Producer or exporter Margin
December 22, 2003(68 FR 71067) 1/30/2001 - 8/31/2002
Liepajas Metalurgs 0.87All others 17.21
December 14, 2004(69 FR 74498) 9/30/2002 - 8/31/2003
Liepajas Metalurgs 3.01All others 17.21
February 10, 2006(71 FR 7016) 9/1/2003 - 8/31/2004
Liepajas Metalurgs 5.24All others 17.21
December 3, 2006(71 FR 74900) 9/1/2004 - 8/31/2005
Liepajas Metalurgs 5.94All others 17.21
June 4, 2007(72 FR 30773)1 9/1/2005 - 8/31/2006
Liepajas Metalurgs 5.94All others 17.21
1 Preliminary results.
Source: Cited Federal Register notices.
Results of Expedited and Full Five-Year Reviews
Table I-5 presents the margins calculated by Commerce in its original investigations and firstreviews.
DISTRIBUTION OF CONTINUED DUMPING AND SUBSIDY OFFSET ACT FUNDS
The Continued Dumping and Subsidy Offset Act of 2000 (“CDSOA”) (also known as the ByrdAmendment) provides that assessed duties received pursuant to antidumping or countervailing dutyorders must be distributed to affected domestic producers for certain qualifying expenditures that theseproducers incur after the issuance of such orders.27 During the review period, qualified U.S. producers ofrebar were eligible to receive disbursements from the U.S. Customs and Border Protection (“Customs”)under CDSOA relating to eight antidumping duty orders on the subject product beginning in Federalfiscal year 2002.28 Tables I-6 and I-7 present CDSOA disbursements and claims for Federal fiscal years(October 1-September 30) 2002-06 by source and by firm, respectively.

I-17
Table I-5Rebar: Commerce’s original and first five-year review margins for producers/exporters, by subject country
Producer/exporterOriginal margin
(percent)First five-year review margin
(percent)
Belarus1
Belarus-wide rate 114.53 114.53
China2
Laiwu Steel Group 133.00 133.00
China-wide rate 133.00 133.00
Indonesia3
Sakti, Bhirma, Krakatau, Perdana, Hanil,Pulogadung, Tungal, Master Steel 71.01 71.01
All others 60.46 60.46
Korea4
Dongkuk Steel Mill and Korea Iron & Steel Co. 22.89 22.89
Hanbo Iron & Steel 102.28 102.28
All others 22.89 22.89
Latvia5
Liepajas Metalurgs 17.21 17.21
All others 17.21 17.21
Moldova6
Moldova-wide rate 232.86 232.86
Poland7
Stalexport 52.07 52.07
All others 47.13 47.13
Ukraine8
Ukraine-wide rate/all others9 41.69 41.69
1 Antidumping duty order, 66 FR 46777, September 7, 2001; final results of first expedited sunset review, 71 FR 70509,December 5, 2006. 2 Antidumping duty order, 66 FR 46777, September 7, 2001; final results of first expedited sunset review, 71 FR 70509,December 5, 2006. 3 Antidumping duty order, 66 FR 46777, September 7, 2001; final results of first expedited sunset review, 71 FR 70509,December 5, 2006. 4 Antidumping duty order, 66 FR 46777, September 7, 2001; final results of first expedited sunset review, 71 FR 70509,December 5, 2006. 5 Antidumping duty order, 66 FR 46777, September 7, 2001; final results of first full sunset review, 72 FR 16767, April 5, 2007. 6 Antidumping duty order, 66 FR 46777, September 7, 2001; final results of first expedited sunset review, 71 FR 70509,December 5, 2006. 7 Antidumping duty order, 66 FR 46777, September 7, 2001; final results of first expedited sunset review, 71 FR 70509,December 5, 2006. 8 Antidumping duty order, 66 FR 46777, September 7, 2001; final results of first full sunset review, 72 FR 9732, March 5,2007. 9 The ‘Ukraine-wide’ rate is now the ‘all others’ rate because, as of February 1, 2006, Ukraine graduated to market economystatus. 71 FR 9520, February 24, 2006.
Source: Cited Federal Register notices.

I-18
Table I-6Rebar: CDSOA disbursements, by source, Federal fiscal years 2002-06
ItemFederal fiscal year
2002 2003 2004 2005 2006Disbursements (1,000 dollars)
Belarus 0 0 0 0 0China 0 0 0 0 2Indonesia 0 0 0 0 0Korea 0 0 0 0 2,829Latvia 0 235 95 188 2,476Moldova 0 0 0 0 0Poland 0 47 0 0 0Ukraine 0 0 0 0 0 Total 0 282 95 188 5,305Note.--Because of rounding, figures may not add to the totals shown.
Source: U.S. Customs and Border Protection’s CDSOA Annual Reports. Retrieved fromwww.cbp.gov/xp/cgov/import/add_cvd.
Table I-7Rebar: CDSOA disbursements, by firm, and total claims, Federal fiscal years 2002-06
ItemFederal fiscal year
2002 2003 2004 2005 2006Disbursements (1,000 dollars)
AmeriSteel 0 0 0 0 0Border 0 20 6 6 174Chaparral Steel 0 0 0 8 170CMC Steel Group 0 63 20 24 543Gerdau USA 0 90 37 60 1,878Marion Steel 0 29 9 11 0North Star Steel 0 52 14 0 0Nucor Corp. 0 0 0 69 1,669Nucor Steel 0 0 0 9 0Nucor Steel Auburn 0 0 0 0 197Nucor Steel Marion 0 0 0 0 261Sheffield Steel 0 28 9 0 0Tamco 0 0 0 0 416 Total 0 282 95 188 5,305
Claims (1,000 dollars) Total 2,873,720 7,117,901 2,294,936 45,735,627 80,788,617Note.--Because of rounding, figures may not add to the totals shown.
Source: U.S. Customs and Border Protection’s CDSOA Annual Reports. Retrieved fromwww.cbp.gov/xp/cgov/import/add_cvd.

29 “Deformed” refers to the pattern of uniformly shaped surface protrusions or ribs running across, and evenlyspaced along, the length of a rebar. See 71 FR 70510, December 5, 2006. HTS subheadings will be addressed in thenext section of the report entitled “U.S. Tariff Treatment.” Commerce stated that although the HTS subheadings areprovided for convenience and customs purposes, its written description of the scope is dispositive. 30 71 FR 70509, December 5, 2006, and 72 FR 9732, March 5, 2007. 31 Such entries were imported by ***.
I-19
THE SUBJECT MERCHANDISE
Commerce’s Scope
The imported product subject to the antidumping orders under review, as defined by Commerce in its final results of expedited reviews:
all steel concrete reinforcing bars (rebar) sold in straight lengths. Specifically excludedare plain rounds (i.e., non-deformed or smooth bars) and rebar that has been furtherprocessed through bending or coating.29
Unless specified otherwise, throughout this report the subject imported product as defined by Commerceand its domestically produced counterpart is referred to simply as “rebar.”
U.S. Tariff Treatment
HTS subheading 7214.20.00 covers straight concrete reinforcing bars and rods, of iron ornonalloy steel, that are not further worked than forged, hot-rolled, hot-drawn, or hot-extruded, butincluding those twisted after rolling. The 2006 general rate of duty for this subheading is “Free.” Theoriginal orders mentioned only HTS subheading 7214.20.00 and “any other tariff item number.” Nonetheless, there are several subheadings, delineated by steel composition, under HTS headings 7222(products of stainless steel) and 7228 (of alloy steel) for bars and rods, not further worked than hot-rolled,hot-drawn, or extruded. Concrete reinforcing bars are not specifically mentioned under any of thesesubheadings. Commerce’s final results of the expedited and full sunset reviews of the antidumping dutyorders, however, explicitly included HTS statistical reporting numbers 7228.30.8050, 7222.11.0050,7222.30.0000, 7228.60.6000, and 7228.20.1000,30 all with a rate of duty of “Free.” This change followedentries of rebar from Latvia under the HTS number 7228.30.8050 during the review period.31
THE DOMESTIC LIKE PRODUCT
Description and Applications
Rebar is used almost exclusively in the construction industry to provide structural reinforcementto concrete structures, being embedded in concrete to enhance its compressional and tensional strength aswell as to control cracking as the concrete shrinks during curing or due to temperature fluctuations. Rebar is designed specifically to resist tension, compression, temperature variation, and shear stresses inreinforced concrete, as the surface protrusions (deformations) on a deformed bar inhibit longitudinalmovement relative to the surrounding concrete. During construction, rebar is placed in a form andconcrete from a mixer is poured over it. Once the concrete has set, deformation is resisted and stressesare transferred from the concrete to the steel reinforcement by friction and adhesion along the surface ofthe steel.

32 The ASTM standards apply to both deformed and plain-round rebar, whether in straight lengths or coiled. There are separate and non-interchangeable standards for rebar with dimensions and designations in English units(e.g., ASTM A615) versus SI (metric) units (e.g., ASTM 615M). 33 Both deformed and plain rebar are most commonly rolled from nonalloy billet steel to the requirements ofASTM A615/A615M. Rebar can also be re-rolled from the head (top) portion slit from scrapped nonalloy steel railsor re-rolled from scrapped axles of railroad rolling stock and locomotives (ASTM A996/A996M deformed rebar ofeither rail or axle steel, A616/A616M deformed and plain rebar of rail steel, and A617/A617M deformed and plainrebar of axle steel). For special applications (e.g., in seismic areas) that require a combination of strength,weldability, ductility, and bendability, ASTM A706/A706M (a high-strength low-alloy (HSLA) steel) is specified. Certain forged rebars of nonalloy or HSLA steel are covered under ASTM A970/A970M. There is also a standardfor deformed and plain rebar of stainless steel (ASTM A955/A995M) for special applications requiring corrosionresistance (e.g., for long-term resistance to road salts and de-icing chemicals on bridges) or controlled magneticpermeability (e.g., for avoiding interference with hospital imaging equipment). 34 Steel Concrete Reinforcing Bars from Turkey, Inv. No. 732-TA-745 (Final), USITC Publication 3034, April1997. 35 Certain Steel Concrete Reinforcing Bars from Indonesia, Poland, and Ukraine, Invs. Nos. 731-TA-875, 880,and 882 (Final), USITC Publication 3425, May 2001. 36 Nominal diameters of deformed rebar are equivalent to those of plain round bars of the same unit weight (mass)per foot (meter). 37 Rebar is also available in metric sizes, with nominal diameters from 10 millimeters (mm) to 57 mm specified byASTM standards. 38 ***.
I-20
Rebar generally is manufactured to conform with standards of the ASTM32 which specify for eachbar size the nominal unit weight, nominal dimensions, and deformation requirements (dimension andspacing of deformations), as well as chemical composition, tensile strength, yield strength (grade), andelongation tolerances. There are several ASTM specifications for rebar, based on steel composition.33 Generally, deformed rebars of these various ASTM specifications are interchangeable except for use inseismic areas.34
Deformed and plain rebars are identified by distinguishing sets of raised marks legibly rolled ontothe surface of one side of the bar to denote, in order, the producer’s hallmark, mill designation, sizedesignation, specification of the type of steel, and minimum-yield designation. Guidelines for use ofdeformed rebar in building construction are provided by the American Concrete Institute (ACI) 318 Codeand in highway and bridge construction by the American Association of State Highway andTransportation Officials (AASHTO) Standard Specifications. Contents of the two specifications aresimilar and are applicable throughout the continental United States and in Puerto Rico.35
Rebar is available in sizes #3 through #18 specified by American Society for Testing andMaterials (“ASTM”) standards. These size numbers are about 8 times the respective nominal diameters36
in inches (e.g., 3/8-inch rebar is designated as size #3 and 1-inch rebar is designated as size #8), althoughthis relationship diverges somewhat for rebar larger than size #9.37 Table I-8 presents data on U.S.producers’ production and U.S. importers’ imports of rebar in 2006 by size. Domestic rebar wasconcentrated in sizes #4 through #6, while imports were concentrated in sizes #3 through #5. There wereno subject imports reported in 2006. U.S. producers offered a wider distribution of sizes than U.S.importers, although not all U.S. plants produce all sizes. For example, ***.38

39 Hearing transcript, pp. 132-133 (McCullocks and Parrish). 40 Hearing transcript, p. 133 (Koch). 41 Steel Concrete Reinforcing Bars from Turkey, Inv. No. 732-TA-745 (Review), USITC Publication 3577,February 2003.
I-21
Table I-8Rebar: U.S. producers’ and importers’ production and imports, by size, in 2006
Item
Size by number
3 4 5 6 7 8 9 10 11 14/18 Other Total
Quantity (short tons)
UnitedStates 226,655 1,724,862 1,992,467 1,141,926 550,848 593,269 439,835 285,102 477,084 33,893 248,217 7,714,159
Imports fromall othersources 342,045 513,731 334,483 128,726 44,770 45,291 25,041 24,487 29,527 779 0 1,488,880
Share of quantity (percent)
UnitedStates 2.9 22.4 25.8 14.8 7.1 7.7 5.7 3.7 6.2 0.4 3.2 100.0
Imports fromall othersources 23.0 34.5 22.5 8.6 3.0 3.0 1.7 1.6 2.0 0.1 0.0 100.0
Note.–There were no subject imports reported in importers’ questionnaire responses in 2006.
Source: Compiled from data submitted in response to Commission questionnaires.
Rebar is shipped in various lengths, from less than 20 feet to more than 60 feet. Table I-9presents data on U.S. producers’ production and importers’ imports in 2006, by length. Domesticproduction was greatest in the 60-foot and greater range, while imports were more prominent in the 20-40foot range. There were no subject imports reported in 2006. According to representatives of twodomestic rebar producers, there may be slight differences in prices between 20-, 40-, and 60-foot lengths,but typically prices are the same regardless of length; nevertheless, prices have been lower in the past for20-foot lengths to be more competitive with imports.39 A domestic distributor and fabricator of rebarreported paying a lesser price for 20-foot lengths in competition with imports, and a somewhat higherprice for 60-foot lengths, a reflection of the additional freight handling costs of longer-length flat-bedtruck trailers than for transporting 40-foot and 60-foot lengths.40 Rebar prices are examined in moredetail in Part V.
Certain rebar sizes and lengths tend to predominate among end uses. A considerable portion ofsmaller sizes #3-#5 are applied to light construction applications (e.g., residences, swimming pools,patios, and walkways). By contrast, heavy construction applications (e.g., high-rise buildings,commercial facilities, industrial structures, bridges, roads, etc.) utilize all sizes and lengths. Nevertheless,the larger sizes (#6 and above) and longer lengths (e.g., 60 foot and above) are almost exclusively utilizedin heavy construction applications.41

42 For re-rolling rebar (or other bars or shapes) from scrapped nonalloy steel rails, the head (top) portion is slitfrom the web (middle) and foot (bottom) portions of the reheated rail. The slit head portion is used for rebarproduction whereas the web and foot portions can be re-rolled into other steel mill products including channels,angles, and flats.
I-22
Table I-9Rebar: U.S. producers’ production and importers’ imports, by source and length, 2006
Item < 20'$ 20' but
< 40'$ 40' but
< 60' $ 60' Total
Quantity (short tons)
United States 352,194 1,993,174 1,818,474 3,531,410 7,695,252
Imports from allother sources 122,434 754,997 498,410 113,037 1,488,878
Share of quantity (percent)
United States 4.6 25.9 23.6 45.9 100.0
Imports from allother sources 8.2 50.7 33.5 7.6 100.0
Note.–There were no subject imports reported in importers’ questionnaire responses in 2006.
Source: Compiled from data submitted in response to Commission questionnaires.
Manufacturing Process
Rebar mills typically specialize in producing their rebar either from (1) billet steel, (2) rail steel,or (3) axle steel, because each involves different starting materials and imposes somewhat differentrolling requirements. The most common manufacturing process for deformed rebar from billet steelconsists of three stages: (1) melting steel scrap, (2) casting billets, and (3) hot-rolling the bar. In contrast,the manufacturing process for rebar from scrapped rail or axle steel, or from purchased billets, requiresonly the rolling stage.
In the United States, non-integrated “mini-mills” produce rebar by melting steel scrap in electricarc furnaces. Once molten steel is produced, it can be poured from the furnace into a refractory-linedladle, where any necessary alloys are added to effect the required chemical and physical properties.Molten steel must be cast into billets of the size and shape suitable for the rolling process. In the morecommon continuous (strand-) casting process, molten steel is poured from the ladle into a tundish(reservoir dam) which controls the rate of flow into the molds of the caster. A solid “skin” forms aroundthe molten steel at the top openings of the molds, and as the columns of partially solidified steel descendthrough the caster, water sprays rapidly cool the cast steel (which helps minimize compositionalsegregation) to the point that the strands are completely solidified when emerging from the bottom of thecaster. Lengths of continuous-cast billets are flame cut at intervals, and then may either be sent directlyfor further processing or be cooled on a cooling bed and subsequently stored for later use.
Prior to rolling, newly cast billets, scrapped rails,42 or scrapped railroad axles are heated to rollingtemperature in a reheat furnace. The steel is reduced in size as it passes through successive rolling stands. Most modern rolling mills are in-line, and rebar of different sizes can be produced by changing the rolls. Deformations are rolled onto the surface of the rebar as it passes through the final finishing stand, which

43 When rolling plain rebar, with uniformly smooth surfaces rather than with deformations, smooth-grooved rollsare substituted in the final finishing stand. 44 Domestic facilities capable of producing coiled rebar are Gerdau-Ameristeel’s mill in Jacksonville, FL,Cascade’s mill in McMinnville, OR, and Nucor’s mill in Plymouth, UT, the latter two outside the region. Domesticproducers’ questionnaire responses.
I-23
has patterns cut into the grooves of the rolls.43 After the rolling process, rebar is cut to length, beforebeing sent to the cooling bed.
Many U.S. producers of rebar produce additional products using the same equipment, machinery,and production workers that are used to produce straight-length rebar. Other products include merchantand special-quality (SBQ) bars, and fence and sign posts. Production of coiled rebar requires layingheads (coilers), which most mills producing straight-length rebar lack.44 Rebar mills equipped with layingheads usually also produce steel wire rod. Alternative products produced by U.S. mills are discussed ingreater detail in Part III of this report.
Marketing
Table I-10 presents detailed data on channels of distribution for U.S. producers’ and importers’shipments of rebar collected during these reviews. Most U.S. producers’ shipments were to firms thatwere either end users or end users that also distribute, whereas a minority of U.S. producers’ shipmentswent to firms that were exclusively distributors. However, most U.S. importers’ shipments were todistributors. Channels of distribution for U.S. producers’ and importers’ shipments are also discussed inPart II of this report.

I-24
Table I-10Rebar: Channels of distribution for U.S. producers’ and U.S. importers’ U.S. shipments of rebar, 2001-06
Share of quantity (percent)
Item 2001 2002 2003 2004 2005 2006
Shipments by national producers--
To distributors within the region 12.2 12.4 13.0 12.7 13.7 14.4
To distributors outside the region 6.5 6.4 6.9 6.9 6.5 6.3
Total shipments to distributors 18.7 18.8 19.9 19.6 20.2 20.7
To end users within the region 29.2 28.6 24.4 26.5 25.8 26.3
To end users outside the region 6.1 6.2 6.7 6.7 6.4 5.9
Total shipments to end users 35.3 34.7 31.1 33.2 32.2 32.2
To distributors/end users within the region 27.1 26.8 29.0 28.4 28.8 28.7
To distributors/end users outside the region 19.0 19.6 20.0 18.8 18.8 18.5
Total shipments to distributors/end users 46.0 46.4 49.0 47.2 47.7 47.2
Shipments by producers within the specified region–
To distributors within the region 16.4 16.8 18.0 17.3 18.6 19.3
To distributors outside the region 1.2 1.3 1.4 1.6 1.2 1.1
Total shipments to distributors 17.6 18.1 19.5 18.9 19.8 20.4
To end users within the region 40.1 39.3 34.4 36.4 35.5 35.4
To end users outside the region 2.1 2.7 2.9 2.9 2.6 2.1
Total shipments to end users 42.2 42.0 37.2 39.3 38.1 37.5
To distributors/end users within the region 35.6 35.3 39.1 37.7 38.0 37.5
To distributors/end users outside the region 4.6 4.7 4.2 4.1 4.0 4.7
Total shipments to distributors/end users 40.2 40.0 43.3 41.8 42.1 42.2
Shipments by producers outside the specified region--
To distributors within the region 1.5 1.5 1.6 1.4 1.8 1.5
To distributors outside the region 20.1 19.3 19.3 19.9 19.2 20.0
Total shipments to distributors 21.6 20.9 20.9 21.4 20.9 21.4
To end users within the region 1.5 1.6 1.8 2.0 2.5 2.3
To end users outside the region 16.3 15.0 15.4 16.1 15.4 15.9
Total shipments to end users 17.8 16.6 17.2 18.1 17.9 18.3
To distributors/end users within the region 5.5 5.5 6.1 5.3 6.6 5.5
To distributors/end users outside the region 55.1 57.1 55.8 55.2 54.6 54.9
Total shipments to distributors/end users 60.6 62.6 61.9 60.5 61.2 60.3
Table continued on the following page.
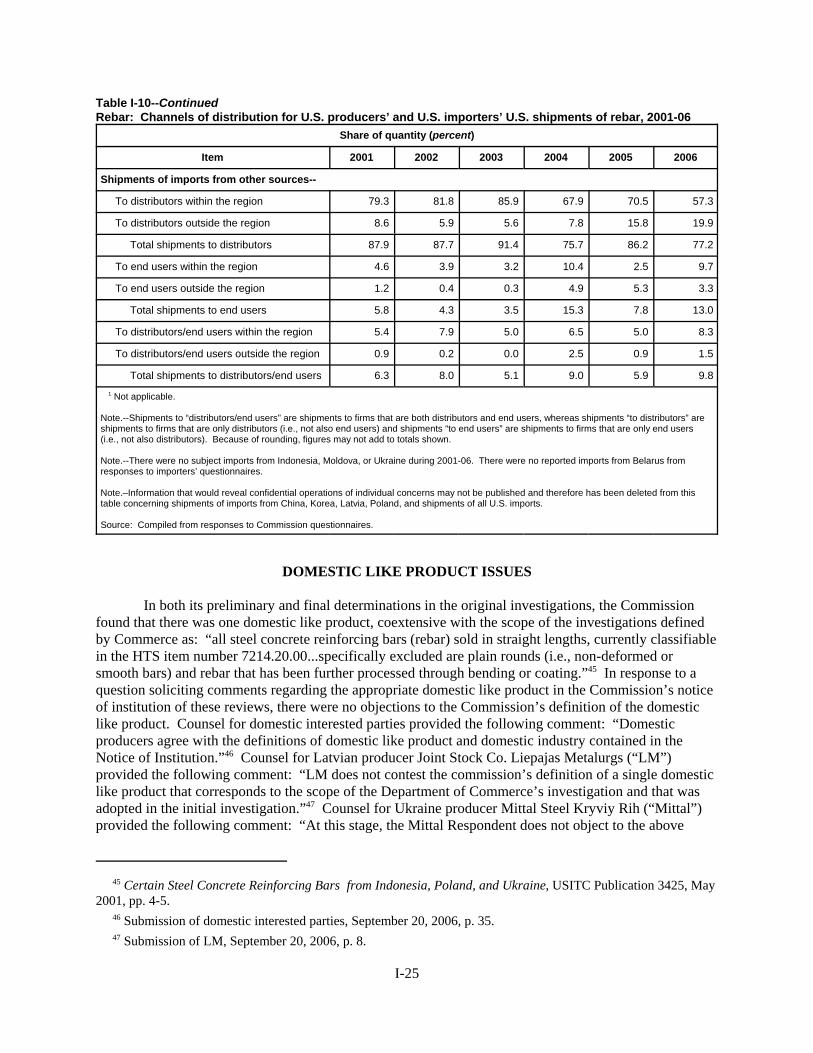
45 Certain Steel Concrete Reinforcing Bars from Indonesia, Poland, and Ukraine, USITC Publication 3425, May2001, pp. 4-5. 46 Submission of domestic interested parties, September 20, 2006, p. 35. 47 Submission of LM, September 20, 2006, p. 8.
I-25
Table I-10--ContinuedRebar: Channels of distribution for U.S. producers’ and U.S. importers’ U.S. shipments of rebar, 2001-06
Share of quantity (percent)
Item 2001 2002 2003 2004 2005 2006
Shipments of imports from other sources--
To distributors within the region 79.3 81.8 85.9 67.9 70.5 57.3
To distributors outside the region 8.6 5.9 5.6 7.8 15.8 19.9
Total shipments to distributors 87.9 87.7 91.4 75.7 86.2 77.2
To end users within the region 4.6 3.9 3.2 10.4 2.5 9.7
To end users outside the region 1.2 0.4 0.3 4.9 5.3 3.3
Total shipments to end users 5.8 4.3 3.5 15.3 7.8 13.0
To distributors/end users within the region 5.4 7.9 5.0 6.5 5.0 8.3
To distributors/end users outside the region 0.9 0.2 0.0 2.5 0.9 1.5
Total shipments to distributors/end users 6.3 8.0 5.1 9.0 5.9 9.8
1 Not applicable.
Note.--Shipments to “distributors/end users” are shipments to firms that are both distributors and end users, whereas shipments “to distributors” areshipments to firms that are only distributors (i.e., not also end users) and shipments “to end users” are shipments to firms that are only end users(i.e., not also distributors). Because of rounding, figures may not add to totals shown.
Note.--There were no subject imports from Indonesia, Moldova, or Ukraine during 2001-06. There were no reported imports from Belarus fromresponses to importers’ questionnaires.
Note.–Information that would reveal confidential operations of individual concerns may not be published and therefore has been deleted from thistable concerning shipments of imports from China, Korea, Latvia, Poland, and shipments of all U.S. imports.
Source: Compiled from responses to Commission questionnaires.
DOMESTIC LIKE PRODUCT ISSUES
In both its preliminary and final determinations in the original investigations, the Commissionfound that there was one domestic like product, coextensive with the scope of the investigations definedby Commerce as: “all steel concrete reinforcing bars (rebar) sold in straight lengths, currently classifiablein the HTS item number 7214.20.00...specifically excluded are plain rounds (i.e., non-deformed orsmooth bars) and rebar that has been further processed through bending or coating.”45 In response to aquestion soliciting comments regarding the appropriate domestic like product in the Commission’s noticeof institution of these reviews, there were no objections to the Commission’s definition of the domesticlike product. Counsel for domestic interested parties provided the following comment: “Domesticproducers agree with the definitions of domestic like product and domestic industry contained in theNotice of Institution.”46 Counsel for Latvian producer Joint Stock Co. Liepajas Metalurgs (“LM”)provided the following comment: “LM does not contest the commission’s definition of a single domesticlike product that corresponds to the scope of the Department of Commerce’s investigation and that wasadopted in the initial investigation.”47 Counsel for Ukraine producer Mittal Steel Kryviy Rih (“Mittal”)provided the following comment: “At this stage, the Mittal Respondent does not object to the above

48 Submission of Mittal, September 20, 2006, p. 11. 49 ***. ***, written correspondence to USITC staff, February 19, 2007. 50 For more information about these former members of the petitioning coalition, see table III-1 in Part III of thisreport.
I-26
definitions of the domestic like products. However, they reserve the right to address this like productissue in the course of the sunset review proceeding.”48 No party subsequently argued in favor of analternative like product at the Commission’s hearing or in prehearing or posthearing briefs.
U.S. MARKET PARTICIPANTS
U.S. Producers
The Commission sent producer questionnaires to nine firms known to be capable of producingrebar. Eight firms, encompassing 25 mills in which rebar is produced, supplied the Commission withcomplete information on their rebar operations in the United States. An additional firm, capable ofproducing the product, has not produced rebar to date nor envisions doing so in the future.49 Eighteen ofthe mills are located inside the 30-State region and the other seven are located outside the region. Fourfirms comprising the original petitioning coalition (excluding Auburn Steel, Birmingham Steel, MarionSteel, and Riverview Steel)50 accounted for *** percent of reported U.S. production within the region and*** percent of all reported rebar production in the United States during 2006. Table I-11 presentsinformation on the producers both within and outside the specified region.

I-27
Table I-11Rebar: U.S. mills within and outside the specified region, locations, shares of 2006 production, parent companies, andpositions on the orders
FirmProductionlocations
Share of 2006 productionin region/nation
(in percent) Parent companyPosition on the
orders
U.S. mills within the specified region
Border Steel, Inc. Vinton, TX ***BSRM Holdings Inc., ElPaso, TX1 ***
Chaparral Steel Co. Midlothian, TX *** None ***
Commercial MetalsCo.
Magnolia, ARCayce, SCSeguin, TX Corporate total
******
****** None ***
Gerdau AmeristeelU.S., Inc.
Baldwin, FLCharlotte, NCSayreville, NJJackson, TNKnoxville, TN Corporate total
************
******
Gerdau Ameristeel,Corp., Ontario, Canada,owned *** percent byGerdau, S.A., PortoAlegre, Brazil ***
Nucor Corp.
Birmingham, ALKankakee, ILJackson, MSAuburn, NYMarion, OHDarlington, SCJewett, TX Corporate total
******************
******
None
***
Steel DynamicsEngineered BarProducts Division Pittsboro, IN *** None ***
U.S. mills outside the specified region
Cascade SteelRolling Mills, Inc. McMinnville, OR ***
Schnitzer SteelIndustries, Portland, OR ***
Gerdau AmeristeelU.S., Inc.
Wilton, IASt. Paul, MNSand Springs, OK Corporate total
******
******
Gerdau Ameristeel,Corp., Ontario, Canada,owned *** percent byGerdau, S.A., PortoAlegre, Brazil ***
Nucor Corp.
Plymouth, UTSeattle, WA Corporate total
*** ***
*** None ***
TAMCO SteelRanchoCucamonga, CA ***
*** percent AmeronInternational Corp.,Pasadena, CA; ***percent Mitsui, NewYork, NY; *** percentTokyo Steel Mfg. Co.,Ltd., Tokyo, Japan ***
Note.–Because of rounding, figures may not add to total shown.
1 In turn, owned by Mexican long-products producer Siderurgica Lazaro Cardenas las Truchas SA de CV (Sicartsa), until being acquired fromthe parent company, Mexico-based Grupo Villacero, by Arcelor Mittal Steel in April 2007. Phillip Price, “Arcelor Mittal Finalizes Purchase of LongProducts Maker Sicartsa,” American Metal Market, April 23, 2007.
Source: Compiled from data submitted in response to Commission questionnaires.

51 *** questionnaire response. 52 Phillip Price, “Arcelor Mittal Finalizes Purchase of Long Products Maker Sicartsa,” American Metal Market,April 23, 2007. 53 Two additional importers, ***, provided questionnaire responses without usable data. 54 One firm’s main office is located in Ontario, but it operates U.S. establishments in Arizona, California, Idaho,Massachusetts, Pennsylvania, and Utah.
I-28
*** producers support continuing the antidumping duty orders on imports from Belarus, China,Indonesia, Korea, Latvia, Moldova, and Poland. *** support continuing the antidumping duties onUkraine, for which ***.51
Two firms are owned by rebar producers located in nonsubject countries. Gerdau AmeristeelU.S. Inc’s. parent company, Gerdau Ameristeel Corp., of Ontario, Canada, is ***-percent owned byGerdau S.A., based in Brazil. TAMCO Steel is ***-percent owned by Tokyo Steel Manufacturing Co.Ltd., a Japanese producer. Also, Border Steel, and other facilities ultimately owned by Mexican long-products producer Sicartsa, were acquired from its Mexican parent company, Grupo Villacero, byLuxembourg-based Arcelor Mittal in April 2007.52 In addition, information regarding the relationshipbetween Commercial Metals Co. (CMC) and Polish Producer CMC Zawiercie appears in Part IV.
U.S. Importers
Eighteen U.S. importers provided data in response to the Commission’s questionnaires. Thesecompanies account for a substantial share of rebar imports from all sources (ranging from 70 to 84percent during 2001-06).53 Six importers replied that they did not import rebar from any country duringthe review period. Eleven firms did not respond to Commission questionnaires, and seven firms were notable to be contacted by Commission staff. Importers were concentrated in New York and Texas withinthe specified region, and in Minnesota and California outside the region. Four importers reported data forsubject imports: ***, and all were located inside the region except for ***. Table I-12 presents asummary of information regarding U.S. importers of rebar from all sources.
U.S. Purchasers
In response to purchaser questionnaires sent by the Commission to 40 firms, 22 purchaserssupplied questionnaires and two reported that they had not purchased the subject product during theperiod for which data were collected. Of these responding firms, six have main offices located in Texas,while the others have main offices located in various states including California, Florida, Georgia, Idaho,Illinois, Massachusetts, Mississippi, Nevada, Pennsylvania, Tennessee, and Washington.54 During 2001-06, all 22 of these firms purchased all or part of their rebar from U.S. producers. Four purchasers boughtsmall quantities of imports from one or more subject countries including China, Korea, Latvia, andPoland during the period. Fourteen of the purchasers bought imports from nonsubject sources during2001-06. Nine of the firms operate exclusively as distributors while the others are fabricators or endusers that also function as distributors in some cases. Five of the purchasers are owned fully or partiallyby U.S. rebar producers.

I-29
Table-I-12Rebar: U.S. importers, source of imports, U.S. headquarters, and parent companies
Firm Source of imports Headquarters Parent company
U.S. Importers Within the Specified Region
Arcelor International America, LLC *** New York, NYMittal Steel Co., N.V., Rotterdam,Netherlands ***%
Commercial Metals Co. *** Irving, TX
None, but related to CMC DallasTrading, Irving, TX, also owned byCMC.
CCC Steel GmbH & Co. KG ***Hamburg Germany; (ports ofentry inside the region)
***% CCC International, Hamburg,Germany; ***% Rosularia, Hamburg,Germany
Duferco Steel, Inc. *** Matawan, NJ Nina Finance (Luxembourg) ***%
Ferromontan, Inc. *** San Juan, Puerto RicoOtto Wolff, Dusseldorf, Germany***%
Gerdau Ameristeel US, Inc. *** Tampa, FL
Gerdau Ameristeel, Corp., Ontario,Canada, owned ***% by Gerdau, S.A.,Porto Alegre, Brazil
Global Market Services, Inc. *** New York, NY ***
Man Ferrostal, Inc. *** Houston, TXMan Capitol Corp., New York, NY***%
Mitsui Steel, Inc. *** Houston, TXMitsui & Co., Ltd., Tokyo, Japan***%
Rio Grande Steel, Ltd. *** McAllen, TX None
S & P Steel Products and Services,Inc. *** Laredo, TX
VI Industries, Inc., Wilmington, DE***%
SEBA International, Ltd. *** Houston, TX None
Stemcor USA, Inc. *** New York, NY Stemcor Holdings, Ltd., London, UK
TATA, Inc. *** New York, NYTATA Steel, Ltd., Mumbai, India***%
Thyssen Krupp Materials NorthAmerica, Inc. *** Southfield, MI TK USA, Inc., Troy, MI ***
Voest-Alpine Intertrading, AG *** Houston, TX
Management, Linz, Austria ***%;Voest-Alpine, AG, Linz, Austria***%; V-A Technology, AG, Linz,Austria ***%; RZB Bank, Vienna,Austria ***%; Bunk Austria, Vienna,Austria ***%; Erste Bank, Vienna,Austria ***%
U.S. Importers Outside the Specified Region
Cargill, Inc. *** Minnetonka, MN None
Dongkuk International, Inc. (DKI) *** Torrance, CA
***% Dongkuk Steel Mill, Seoul,Korea; ***%t Union Steel, Seoul,Korea; ***% KISCO, Changwon,Korea
Source: Compiled from data submitted in response to Commission questionnaires.

I-30
APPARENT U.S. CONSUMPTION AND MARKET SHARES
Tables I-13 and I-14 present apparent U.S. consumption for the review period and tables I-15through I-17 present U.S. market shares. Apparent consumption on a national basis generally increasedduring the period of review, with U.S. national producers’ market share fluctuating to a peak in 2003 anda low in 2006, at the same time that market share for subject imports fluctuated from a peak in 2001 todisappear in 2006, and nonsubject imports generally gained market share, with a corresponding low pointin 2003.
Regional apparent consumption fluctuated from 2001 to 2006, ending distinctly higher during thelatter part of the period than the earlier part of the period. Regional producers experienced a fluctuatingmarket share, ending with a decreased market share in 2006 compared with 2001. Outside the region,U.S. producers maintained a much larger share of expanding consumption.
REGIONAL INDUSTRY CONSIDERATIONS
The following tabulation presents data relating to the Commission’s determination regarding theappropriateness of a regional industry analysis in these reviews regarding the domestic industry.
Item 2001 2002 2003 2004 2005 2006
Share of regional U.S. producers’ U.S. shipments withinthe specified region (percent) 92.4 92.3 92.6 92.3 93.5 93.0
Share of regional demand supplied by U.S. producersoutside the specified region (percent) 2.6 2.8 3.7 2.7 3.7 2.6
Source: See tables C-1, C-2, and C-3.
Table I-18 presents data comparing imports from subject countries to within-region and outside-of-region consumption, as well as to total imports within the specified region.

I-31
Table I-13Rebar: U.S. shipments of domestic product, U.S. imports, by sources, and apparent U.S. consumption, 2001-06
2001 2002 2003 2004 2005 2006
Item Quantity (short tons)
Shipments by regional producers 4,302,371 4,395,879 5,186,342 4,793,833 5,243,772 5,375,098
Shipments by non-regional producers 1,701,909 1,746,553 2,293,061 1,934,035 2,172,468 2,045,918
U.S. imports from--
Belarus 0 2,820 0 0 0 0
China 47 21 0 169 60 3
Korea 118,469 0 0 0 5,516 0
Latvia 33,662 45,904 50,522 121,881 36,646 0
Poland 26,884 0 0 7,303 0 129
Subtotal 179,061 48,746 50,522 129,352 42,222 133
All other 1,551,751 1,177,809 962,562 1,861,470 1,410,136 2,454,275
Total U.S. imports 1,730,812 1,226,554 1,013,084 1,990,822 1,452,358 2,454,407
Apparent U.S. consumption 7,735,092 7,368,986 8,492,487 8,718,690 8,868,598 9,875,423
Value ($1,000)
Shipments by regional producers 1,139,888 1,137,280 1,445,705 2,116,051 2,439,075 2,770,112
Shipments by non-regional producers 472,667 462,137 665,710 877,822 1,071,607 1,102,831
U.S. imports from--
Belarus 0 577 0 0 0 0
China 23 13 0 173 18 4
Korea 26,314 0 0 0 2,262 0
Latvia 6,761 10,720 14,316 42,001 15,059 0
Poland 5,943 0 0 2,789 0 50
Subtotal 39,042 11,310 14,316 44,963 17,339 54
All other 348,890 263,224 269,131 881,861 600,627 1,084,640
Total U.S. imports 387,932 274,535 283,447 926,824 617,966 1,084,694
Apparent U.S. consumption 2,000,487 1,873,951 2,394,862 3,920,696 4,128,649 4,957,637
Note.–Because of rounding, figures may not add to totals shown. There were no subject imports from Indonesia, Moldova, or Ukraine during 2001-06. ***. Data for Latvia are for imports under HTS subheading 7214.20.00 plus imports under HTS statistical reporting number 7228.30.8050 from official Commercestatistics. In addition, a ***. All other import data presented are from official Commerce statistics under HTS subheading 7214.20.00.
Source: Compiled from data submitted in response to Commission questionnaires and from official Commerce statistics.

I-32
Table I-14 Rebar: U.S. shipments of domestic product, U.S. imports, by sources, and apparent consumption, within and outside the specified region, 2001-06
Item 2001 2002 2003 2004 2005 2006
Quantity (short tons)
Within the specified region:
Shipments by regional producers within the specified region 3,973,962 4,055,496 4,802,331 4,423,373 4,901,788 4,998,517
Shipments by non-regional producers into the specified region 145,438 150,445 218,253 168,422 236,191 188,951
U.S. imports into the specified region from--
Belarus 0 2,820 0 0 0 0
China 47 21 0 15 43 0
Korea 84,188 0 0 0 0 0
Latvia 33,662 45,904 50,522 121,881 36,646 0
Poland 26,553 0 0 6,927 0 129
Subtotal 144,449 48,746 50,522 128,823 36,688 129
All other 1,296,320 1,099,441 888,404 1,574,058 1,216,390 2,013,740
Total U.S. imports 1,440,769 1,148,186 938,926 1,702,880 1,253,079 2,013,869
Apparent consumption 5,560,169 5,354,127 5,959,510 6,294,675 6,391,058 7,201,337
Outside the specified region:
Shipments by regional producers outside the specified region 328,409 340,383 384,011 370,460 341,984 376,581
Shipments by non-regional producers outside the specified region 1,556,471 1,596,108 2,074,808 1,765,613 1,936,277 1,856,967
U.S. imports outside the specified region from--
Belarus 0 0 0 0 0 0
China 0 0 0 154 18 3
Korea 34,281 0 0 0 5,516 0
Latvia 0 0 0 0 0 0
Poland 331 0 0 376 0 0
Subtotal 34,612 0 0 530 5,534 3
All other 255,431 78,368 74,158 287,412 193,745 440,535
Total U.S. imports 290,043 78,368 74,158 287,942 199,279 440,538
Apparent consumption 2,174,923 2,014,859 2,532,977 2,424,015 2,477,540 2,674,086Continued on the following page.

I-33
Table I-14--ContinuedRebar: U.S. shipments of domestic product, U.S. imports, by sources, and apparent consumption, within and outside the specified region, 2001-06
Item 2001 2002 2003 2004 2005 2006
Value ($1,000)
Within the specified region:
Shipments by regional producers within the specified region 1,049,843 1,047,928 1,337,181 1,952,326 2,274,582 2,567,108
Shipments by non-regional producers into the specified region 42,810 43,034 68,723 77,524 113,829 98,886
U.S. imports into the specified region from--
Belarus 0 577 0 0 0 0
China 23 13 0 15 13 0
Korea 18,688 0 0 0 0 0
Latvia 6,761 10,720 14,316 42,001 15,059 0
Poland 5,779 0 0 2,254 0 50
Subtotal 31,251 11,310 14,316 44,270 15,073 50
All other 291,353 244,537 246,135 747,255 518,875 892,702
Total U.S. imports 322,605 255,848 260,452 791,525 533,948 892,752
Apparent consumption 1,415,257 1,346,810 1,666,355 2,821,376 2,922,359 3,558,746
Outside the specified region:
Shipments by regional producers outsidethe specified region 90,046 89,352 108,524 163,724 164,493 203,004
Shipments by non-regional producers outside the specified region 429,857 419,103 596,987 800,298 957,777 1,003,945
U.S. imports outside the specified region from--
Belarus 0 0 0 0 0 0
China 0 0 0 158 5 4
Korea 7,626 0 0 0 2,262 0
Latvia 0 0 0 0 0 0
Poland 164 0 0 534 0 0
Subtotal 7,790 0 0 692 2,267 4
All other 57,537 18,687 22,996 134,606 81,752 191,938
Total U.S. imports 65,327 18,687 22,996 135,299 84,019 191,943
Apparent consumption 585,231 527,142 728,506 1,099,321 1,206,289 1,398,892
Note.–Because of rounding, figures may not add to totals shown. There were no subject imports from Indonesia, Moldova, or Ukraine during 2001-06. ***. Data for Latvia are for imports under HTS subheading 7214.20.00 plus imports under HTS statistical reporting number 7228.30.8050 from official Commercestatistics. In addition, a ***. All other import data presented are from official Commerce statistics under HTS subheading 7214.20.00.
Source: Compiled from data submitted in response to Commission questionnaires and from official Commerce statistics.

I-34
Table I-15Rebar: Apparent U.S. consumption and market shares for the nation, 2001-06
Item 2001 2002 2003 2004 2005 2006
Quantity (short tons)
Apparent U.S. consumption 7,735,092 7,368,986 8,492,487 8,718,690 8,868,598 9,875,423
Value ($1,000)
Apparent U.S. consumption 2,000,487 1,873,951 2,394,862 3,920,696 4,128,649 4,957,637
Share of quantity (percent)
Shipments by regional producers 55.6 59.7 61.1 55.0 59.1 54.4
Shipments by non-regional producers 22.0 23.7 27.0 22.2 24.5 20.7
U.S. imports from--
Belarus 0.0 (1) 0.0 0.0 0.0 0.0
China (1) (1) 0.0 (1) (1) (1)
Korea 1.5 0.0 0.0 0.0 0.1 0.0
Latvia 0.4 0.6 0.6 1.4 0.4 0.0
Poland 0.3 0.0 0.0 0.1 0.0 (1)
Subtotal 2.3 0.7 0.6 1.5 0.5 (1)
All other 20.1 16.0 11.3 21.4 15.9 24.9
Total U.S. imports 22.4 16.6 11.9 22.8 16.4 24.9
Share of value (percent)
Shipments by regional producers 57.0 60.7 60.4 54.0 59.1 55.9
Shipments by non-regional producers 23.6 24.7 27.8 22.4 26.0 22.2
U.S. imports from--
Belarus 0.0 (1) 0.0 0.0 0.0 0.0
China (1) (1) 0.0 (1) (1) (1)
Korea 1.3 0.0 0.0 0.0 0.1 0.0
Latvia 0.3 0.6 0.6 1.1 0.4 0.0
Poland 0.3 0.0 0.0 0.1 0.0 (1)
Subtotal 2.0 0.6 0.6 1.1 0.4 (1)
All other 17.4 14.0 11.2 22.5 14.5 21.9
Total U.S. imports 19.4 14.7 11.8 23.6 15.0 21.9
Note.–Because of rounding, figures may not add to totals shown. There were no subject imports from Indonesia, Moldova, or Ukraine during 2001-06. ***. Data for Latvia are for imports under HTS subheading 7214.20.00 plus imports under HTS statistical reporting number 7228.30.8050 from official Commercestatistics. In addition, a ***. All other import data presented are from official Commerce statistics under HTS subheading 7214.20.00.
1 Less than 0.05 percent.
Source: Compiled from data submitted in response to Commission questionnaires and from official Commerce statistics.

I-35
Table I-16Rebar: Apparent consumption and market shares within the specified region, 2001-06
Item 2001 2002 2003 2004 2005 2006
Quantity (short tons)
Apparent consumption 5,560,169 5,354,127 5,959,510 6,294,675 6,391,058 7,201,337
Value ($1,000)
Apparent consumption 1,415,257 1,346,810 1,666,355 2,821,376 2,922,359 3,558,746
Share of quantity (percent)
Shipments by regional producers within the specified region 71.5 75.7 80.6 70.3 76.7 69.4
Shipments by non-regional producers into the specifiedregion 2.6 2.8 3.7 2.7 3.7 2.6
U.S. imports into the specified region from--
Belarus 0.0 0.1 0.0 0.0 0.0 0.0
China (1) (1) 0.0 (1) (1) 0.0
Korea 1.5 0.0 0.0 0.0 0.0 0.0
Latvia 0.6 0.9 0.8 1.9 0.6 0.0
Poland 0.5 0.0 0.0 0.1 0.0 (1)
Subtotal 2.6 0.9 0.8 2.0 0.6 (1)
All other 23.3 20.5 14.9 25.0 19.0 28.0
Total U.S. imports 25.9 21.4 15.8 27.1 19.6 28.0
Share of value (percent)
Shipments by regional producers within the specified region 74.2 77.8 80.2 69.2 77.8 72.1
Shipments by non-regional producers into the specifiedregion 3.0 3.2 4.1 2.7 3.9 2.8
U.S. imports into the specified region from--
Belarus 0.0 (1) 0.0 0.0 0.0 0.0
China (1) (1) 0.0 (1) (1) 0.0
Korea 1.3 0.0 0.0 0.0 0.0 0.0
Latvia 0.5 0.8 0.9 1.5 0.5 0.0
Poland 0.4 0.0 0.0 0.1 0.0 (1)
Subtotal 2.2 0.8 0.9 1.6 0.5 (1)
All other 20.6 18.2 14.8 26.5 17.8 25.1
Total U.S. imports 22.8 19.0 15.6 28.1 18.3 25.1
Note.–Because of rounding, figures may not add to totals shown. There were no subject imports from Indonesia, Moldova, or Ukraine during the period ofreview. ***. Data for Latvia for 2001-06 are for imports under HTS subheading 7214.20.00 plus imports under HTS statistical reporting number7228.30.8050 from official Commerce statistics. In addition, a ***. All other import data presented are from official Commerce statistics under HTSsubheading 7214.20.00.
1 Less than 0.05 percent.
Source: Compiled from data submitted in response to Commission questionnaires and from official Commerce statistics.

I-36
Table I-17Rebar: Apparent consumption and market shares outside the specified region, 2001-06
Item 2001 2002 2003 2004 2005 2006
Quantity (short tons)
Apparent consumption 2,174,923 2,014,859 2,532,977 2,424,015 2,477,540 2,674,086
Value ($1,000)
Apparent consumption 585,231 527,142 728,506 1,099,321 1,206,289 1,398,892
Share of quantity (percent)
Shipments by regional producers outside the specified region 15.1 16.9 15.2 15.3 13.8 14.1
Shipments by non-regional producers outside the specifiedregion 71.6 79.2 81.9 72.8 78.2 69.4
U.S. imports outside the specified region from--
Belarus 0.0 0.0 0.0 0.0 0.0 0.0
China 0.0 0.0 0.0 (1) (1) (1)
Korea 1.6 0.0 0.0 0.0 0.2 0.0
Latvia 0.0 0.0 0.0 0.0 0.0 0.0
Poland (1) 0.0 0.0 (1) 0.0 0.0
Subtotal 1.6 0.0 0.0 (1) 0.2 (1)
All other 11.7 3.9 2.9 11.9 7.8 16.5
Total U.S. imports 13.3 3.9 2.9 11.9 8.0 16.5
Share of value (percent)
Shipments by regional producers outside the specified region 15.4 17.0 14.9 14.9 13.6 14.5
Shipments by non-regional producers outside the specifiedregion 73.5 79.5 81.9 72.8 79.4 71.8
U.S. imports outside the specified region from--
Belarus 0.0 0.0 0.0 0.0 0.0 0.0
China 0.0 0.0 0.0 (1) (1) (1)
Korea 1.3 0.0 0.0 0.0 0.2 0.0
Latvia 0.0 0.0 0.0 0.0 0.0 0.0
Poland (1) 0.0 0.0 (1) 0.0 0.0
Subtotal 1.3 0.0 0.0 0.1 0.2 (1)
All other 9.8 3.5 3.2 12.2 6.8 13.7
Total U.S. imports 11.2 3.5 3.2 12.3 7.0 13.7
Note.–Because of rounding, figures may not add to totals shown. There were no subject imports from Indonesia, Moldova, or Ukraine during 2001-06. ***. Data for Latvia are for imports under HTS subheading 7214.20.00 plus imports under HTS statistical reporting number 7228.30.8050 from official Commercestatistics. In addition, a ***. All other import data presented are from official Commerce statistics under HTS subheading 7214.20.00.
1 Less than 0.05 percent.
Source: Compiled from data submitted in response to Commission questionnaires and from official Commerce statistics.

I-37
Table I-18Rebar: Comparisons of imports, by country, to regional consumption and total imports, 2001-06
Item 2001 2002 2003 2004 2005 2006
Belarus:Ratio of imports from Belarus to consumption within the specifiedregion 0.0 0.1 0.0 0.0 0.0 0.0
Ratio of imports from Belarus to consumption outside the specifiedregion 0.0 0.0 0.0 0.0 0.0 0.0
Ratio of imports from Belarus within the specified region to totalimports from Belarus (1) 100.0 (1) (1) (1) (1)
China:Ratio of imports from China to consumption within the specifiedregion 0.0 0.0 0.0 0.0 0.0 0.0
Ratio of imports from China to consumption outside the specifiedregion 0.0 0.0 0.0 0.0 0.0 0.0
Ratio of imports from China within the specified region to totalimports from China 100.0 100.0 (1) 8.8 70.4 0.0
Korea:Ratio of imports from Korea to consumption within the specifiedregion 1.5 0.0 0.0 0.0 0.0 0.0
Ratio of imports from Korea to consumption outside the specifiedregion 1.6 0.0 0.0 0.0 0.2 0.0
Ratio of imports from Korea within the specified region to totalimports from Korea 71.1 (1) (1) (1) 0.0 (1)
Latvia:Ratio of imports from Latvia to consumption within the specifiedregion 0.6 0.9 0.8 1.9 0.6 0.0
Ratio of imports from Latvia to consumption outside the specifiedregion 0.0 0.0 0.0 0.0 0.0 0.0
Ratio of imports from Latvia within the specified region to totalimports from Latvia 100.0 100.0 100.0 100.0 100.0 (1)
Poland:Ratio of imports from Poland to consumption within the specifiedregion 0.5 0.0 0.0 0.1 0.0 0.0
Ratio of imports from Poland to consumption outside the specifiedregion 0.0 0.0 0.0 0.0 0.0 0.0
Ratio of imports from Poland within the specified region to totalimports from Poland 98.8 (1) (1) 94.9 (1) 100.0
Subject Imports:Ratio of subject imports to consumption within the specified region 2.6 0.9 0.8 2.0 0.6 0.0
Ratio of subject imports to consumption outside the specified region 1.6 0.0 0.0 0.0 0.2 0.0
Ratio of subject imports within the specified region to total subjectimports 80.7 100.0 100.0 99.6 86.9 97.4
1 Not applicable.
Note.–There were no subject imports from Indonesia, Moldova, or Ukraine during 2001-06.
Source: See tables C-1, C-2, and C-3.


1 One U.S. producer also reported that rebar is used in the manufacture of mine roof bolts. 2 Jim Fritch, Executive Vice President of CMC Steel Group testified at the hearing that nonresidentialconstruction spending tends to be a “ bigger driver” of demand for rebar than residential construction spending. Hearing transcript, pp. 74-75 (Fritch). 3 The specified region includes Alabama, Arkansas, Connecticut, Delaware, Florida, Georgia, Illinois, Indiana,Kentucky, Louisiana, Maine, Maryland, Massachusetts, Michigan, Mississippi, Missouri, New Hampshire, NewJersey, New York, North Carolina, Ohio, Pennsylvania, Rhode Island, South Carolina, Tennessee, Texas, Vermont,Virginia, West Virginia and Wisconsin; as well as Puerto Rico and the District of Columbia. All other states areconsidered outside of the specified region. 4 For additional details on channel structure on a regional basis, please refer to table I-10.
II-1
PART II: CONDITIONS OF COMPETITION IN THE U.S. MARKET
MARKET CHARACTERISTICS
Because rebar is used in concrete reinforcement, the U.S. market for this product is closely tied tothe construction activity in the United States. Major end-use products requiring rebar include roads andbridges, commercial and industrial construction, residential construction, and public construction.1 Hearing testimony indicates that nonresidential construction accounts for a larger share of rebar use thanresidential construction.2 When purchasers were asked whether the market for rebar is subject to businesscycles, opinions were varied. However, several purchasers reported that the level of construction activityslows during winter months due to inclement weather, resulting in a reduced demand for rebar.
While some manufactured rebar is used in construction applications with no further processing, alarge share is also sold to fabricators that process the rebar further before it is finally used in constructionapplications. Three U.S. producers, CMC, Gerdau, and Nucor, all own purchasing firms that operate asfabricators and/or distributors. These purchasing firms obtain the rebar for fabrication or distributionfrom their parent companies and in some cases from other producers and import suppliers.
U.S. producers and importers sell to the same categories of customers, but the proportions vary. During 2001-06, producers were more likely to sell to end users or to firms that function both as end usersand distributors rather than those that function solely as distributors. In contrast, the majority of allimporters sell principally to distributors. Table II-1 presents the shares of total U.S. producer shipmentsand shipments of imports from China, Korea, Latvia, Poland, and nonsubject countries that went to end users, distributors, and distributors/endusers on an annual basis both inside and outside the specifiedregion.3 There were no importer shipment data for imports of rebar from Belarus, Indonesia, Moldova, orUkraine.4 Table II-2 discusses the geographic distribution of U.S. shipments of rebar.
The reported lead times for delivery of U.S.-produced and imported rebar from subject andnonsubject countries varies widely. In the case of producers, if the item is held in inventory, deliveryranges from one to seven days. For non-inventory orders which account for the majority of producersales, the lead times range from 25 to 60 days for firms both inside and outside of the region. Forresponding importers of rebar from the subject countries, non-inventory orders (which constitute the bulkof sales) have lead times ranging from 90 to 120 days. Among nonsubject importers, the lead time fornon-inventory orders, which also account for most sales, is 30 to 120 days.

II-2
Table II-1Rebar: Channels of distribution for domestic product and imports1 sold in the U.S. market (as ashare of total shipments), by year and by source, 2001-06
Item 2001 2002 2003 2004 2005 2006
Share of quantity (percent)
Total shipments by all U.S. producers
To distributors 18.7 18.8 19.9 19.6 20.2 20.7
To end users 35.3 34.7 31.1 33.2 32.2 32.2
To distributor/end users 46.0 46.4 49.0 47.2 47.7 47.2
Total 100.0 100.0 100.0 100.0 100.0 100.0
Shipments by U.S. producers within the specified region
To distributors 17.6 18.1 19.5 18.9 19.8 20.4
To end users 42.2 42.0 37.2 39.3 38.1 37.5
To distributor/end users 40.2 40.0 43.3 41.8 42.1 42.2
Total 100.0 100.0 100.0 100.0 100.0 100.0
Shipments by U.S. producers outside the specified region
To distributors 21.6 20.9 20.9 21.4 20.9 21.4
To end users 17.8 16.6 17.2 18.1 17.9 18.3
To distributor/end users 60.6 62.6 61.9 60.5 61.2 60.3
Total 100.0 100.0 100.0 100.0 100.0 100.0
Shipments of imports from China
To distributors *** *** (2) (2) (2) (2)
To end users *** *** (2) (2) (2) (2)
To distributor/end users *** *** (2) (2) (2) (2)
Total *** *** (2) (2) (2) (2)
Shipments of imports from Korea
To distributors *** *** (2) (2) *** (2)
To end users *** *** (2) (2) *** (2)
To distributor/end users *** *** (2) (2) *** (2)
Total *** *** (2) (2) *** (2)
Continued on the following page.

II-3
Table II-1--ContinuedRebar: Channels of distribution for domestic product and imports1 sold in the U.S. market (as apercent of total shipments), by year and by source, 2001-06
Item 2001 2002 2003 2004 2005 2006
Share of quantity (percent)
Shipments of imports from Latvia
To distributors *** *** *** *** *** (2)
To end users *** *** *** *** *** (2)
To distributor/end users *** *** *** *** *** (2)
Total *** *** *** *** *** (2)
Shipments of imports from Poland
To distributors *** *** (2) (2) (2) (2)
To end users *** *** (2) (2) (2) (2)
To distributor/end users *** *** (2) (2) (2) (2)
Total *** *** (2) (2) (2) (2)
Shipments of imports from nonsubject countries
To distributors 87.9 87.7 91.4 75.7 86.2 77.2
To end users 5.8 4.3 3.5 15.3 7.8 13.0
To distributor/end users 6.3 8.0 5.1 9.0 5.9 9.8
Total 100.0 100.0 100.0 100.0 100.0 100.0
1 There were no reported imports from Belarus, Indonesia, Moldova, or Ukraine. 2 Not applicable.
Source: Compiled from data submitted in response to Commission questionnaires.

II-4
Table II-2Rebar: Geographic market areas in the United States served by domestic producers and importersof subject product
Region Producers
Importers fromsubject
countries
Importers from nonsubject countries
Within the specified region
Northern States1 3 3 5
Southern States2 4 3 10
Outside the specified region
Northern States3 4 0 3
Southern States4 6 1 9 1 Includes Connecticut, Delaware, Illinois, Indiana, Maine, Maryland, Massachusetts, Michigan, New Hampshire,New Jersey, New York, Ohio, Pennsylvania, Rhode Island, Vermont, West Virginia, and Wisconsin. 2 Includes Alabama, Arkansas, Florida, Georgia, Kentucky, Louisiana, Mississippi, Missouri, North Carolina,South Carolina, Tennessee, Texas, Virginia, plus the District of Columbia and Puerto Rico. 3 Includes Alaska, Idaho, Iowa, Minnesota, Montana, Nebraska, North Dakota, Oregon, South Dakota,Washington, and Wyoming. 4 Includes Arizona, California, Colorado, Hawaii, Kansas, New Mexico, Nevada, Oklahoma, Utah, plus the VirginIslands.
Source: Compiled from data submitted in response to Commission questionnaires.
SUPPLY AND DEMAND CONSIDERATIONS
U.S. Supply
Domestic Industry
The response of the domestic industry to increased competition resulting from the removal of theantidumping duties is likely to depend upon such factors as the level of industry capacity utilization, thelevel of inventories, costs of production, the availability of export markets, and the flexibility of shiftingproduction equipment to other products.
Some excess capacity has existed in the industry throughout the 2001-06 period, while the ratioof inventories to shipments was moderate during this period both nationally and inside and outside of theregion. U.S. producers’ capacity utilization for the national market ranged from a low of 77.9 percent in2001 to a high of 90.1 percent in 2005. During 2006, it was 89.4 percent. The capacity utilization ratewithin the specified region ranged from a low of 76.6 percent in 2001 to a high of 88.7 percent in 2006. Outside of the region, the capacity utilization rate ranged from a low of 81.1 percent to a high of 94.2percent in 2003. During 2006, the rate outside the region was 91.2 percent. The ratio of inventories tototal shipments for the national market ranged from a low of *** percent in *** to a high of *** percentin *** and was *** percent in 2006. The ratio of inventories to total shipments for producers locatedwithin the region ranged between *** percent and *** percent during 2001-06. The ratio of inventoriesto total shipments for producers located outside the region ranged between *** percent and *** percentduring this period.
Exports consistently accounted for about *** percent of total shipments annually during theentire 2001-06 period. When asked whether they could easily shift sales from the U.S. market to exports,

II-5
none of the six responding producers located inside and outside of the region reported that this would befeasible. In general, producers reported that they are best equipped to serve local and regional markets inthe United States and are not well equipped to compete in other markets due to price competition fromforeign suppliers. Two firms that currently export to Canada reported that if they attempted to expandexports to this market they would face aggressive competition from China.
Six of eight U.S. producers reported that they produce other products including wire rod, coiledrebar, special bar merchant bar products, and special bar quality bar products on the same equipment andmachinery used to produce rebar and/or using the same production and/or related workers used to producerebar. Producers were asked whether they would be able to switch production between rebar and otherproducts in response to changes in the price of rebar relative to the price of other products, using the sameequipment and labor. Among firms that responded to this question, two answered that such a switchwould only bring an excess supply of the other products onto the market. Another firm reported that theconversion for making merchant bar would be expensive and would involve a long lead time.
Subject Import Supply
The ability of rebar producers from Belarus, China, Indonesia, Korea, Latvia, Moldova, Poland,and Ukraine to increase or decrease shipments of rebar to the U.S. market depends upon such factors ascapacity utilization rates, planned expansions in capacity, current inventory levels, current levels of bothhome market sales and exports to markets other than the United States, and the potential for the diversionof shipments to the United States. While foreign producer data for examining this issue are available forBelarus, Korea, Latvia, Moldova, Poland, and Ukraine, no foreign producer data for Indonesia areavailable. In the case of China, limited industry data are available.
Belarus
During the 2001-06 period, the sole Belarusian producer, BSW, reported consistently highcapacity utilization rates ranging from a low of *** percent in *** to a high of *** percent in ***. During 2006, BSW operated at a *** percent capacity utilization rate. The rate is projected to be ***percent in both 2007 and 2008. This suggests that this industry has little, if any, capability to expandproduction. BSW reported *** end-of-period inventories during the 2001-06 period. The EuropeanUnion has been an important destination for Belarus shipments during this period. Shipments to theEuropean Union ranged from a low of *** percent of total shipments in *** to a high of *** percent in***. *** shares of these shipments went to the Belarus home market and the Asian markets. All othermarkets excluding the European Union, the home market, and Asia, accounted for between *** percentand *** percent of total shipments during 2001-06. There were no reported exports to the United Statesduring these years. These data suggest that BSW may have the potential to shift sales from the EuropeanUnion and other markets to the United States.
China
Information based upon very limited data shows that Chinese production tripled between 2000and 2006, rising from 29.5 million short tons in 2000 to *** short tons in 2006. Exports as a share ofproduction increased from 1.2 percent in 2000 to *** percent in 2006. China’s leading markets for rebarare Canada, Hong Kong, Korea, and Singapore (see table IV-14). Exports to all of these markets haveincreased in recent years, with Korea accounting for the greatest growth. Exports to the United States, incontrast, have been very small during 2001-06. With a large home market, and growing export markets,China may have potential for shifting some sales to the United States.

5 Hyundai posthearing brief, exh. 3.
II-6
Korea
While detailed information is only available from the largest Korean producer, Hyundai, theKorean Iron and Steel Institute estimates that there were five leading Korean rebar producers in 2006.This Institute estimated that Hyundai accounted for *** percent of rebar production in 2006 followed byDongkuk (*** percent), Hankuk Steel (*** percent), YK steel (*** percent), and Daihan (*** percent).5
During the 2001-06 period, Hyundai reported capacity utilization rates for rebar ranging from alow of *** percent in *** to a high of *** percent in ***. During 2006, the capacity utilization rate was*** percent. The rate is projected to be *** percent in both 2007 and 2008. Hyundai’s end-of-periodinventories to shipments ranged from a low of *** percent in *** to a high of *** percent in ***. It was*** percent in ***. The Korean home market has been *** the largest market for Hyundai’s shipmentsduring this period. Shipments to the home market ranged from a low of *** percent to a high of ***percent in ***. There were no reported exports to the United States or the European Union during 2001-06. A small share of Hyundai’s shipments went to Asian and other markets during 2001-06. Whilecapacity utilization rates are high, and inventory levels for Hyundai are relatively low, the existence ofalternative markets, especially the Korean home market, suggests that Hyundai may have the potential toshift some sales to the United States.
Latvia
During the 2001-06 period, Latvian rebar producer LM reported capacity utilization rates rangingfrom a low of *** percent in *** to a high of *** percent in ***. The rate is projected to be *** percentin 2007 and *** percent in 2008. LM’s end-of-period inventories to shipments ranged from a low of ***percent in *** to a high of *** percent in ***. The European Union has been *** the largest market forLatvian shipments during this period. Shipments to the European Union increased from a low of ***percent of total shipments in *** to a high of *** percent in ***. During 2006, the European Unionaccounted for *** percent of Latvia’s total shipments. *** smaller shares of these shipments went to theLatvian home market and the Asian markets during 2001-06. All other markets excluding the EuropeanUnion, the home market, and Asia decreased from *** percent of total shipments in 2001 to *** percentin 2006. Prior to 2006, exports to the United States ranged from a low of *** percent of Latvianshipments in *** to a high of *** percent in ***. There were *** reported exports to the United Statesduring 2006. While capacity utilization rates are relatively high and inventory levels for Latvia arerelatively low, the existence of alternative markets suggests that the Latvian industry may have thepotential to shift sales from these markets to the United States.
Moldova
During the 2001-06 period, the Moldovan rebar producer MSW reported capacity utilization ratesranging widely from a low of *** percent in *** to a high of *** percent in ***. During 2006, MSWoperated at *** percent capacity utilization. The rate is projected to be *** percent in 2007 and ***percent in 2008. MSW’s ratio of end-of-period inventories to shipments ranged from a low of ***percent in *** to a high of *** percent in ***. The European Union had been a large market forshipments of Moldovian rebar during 2001-04, accounting for between *** percent and *** percent ofMSW’s total shipments in those years. However, after that time, MSW reported that ***. Moldovanexports to the “all other market” category, which includes ***, increased from a low of *** percent oftotal shipments in *** to a high of *** percent in *** and then decreased slightly to *** percent in 2006.

6 One U.S. producer also reported that rebar is used in the manufacture of mine roof bolts.
II-7
As a result, shipments to the European Union decreased to *** percent of total shipments in2005, and in 2006 there were *** to this market. Shipments to the Moldovan home market and to Asianmarkets were consistently small during 2001-06. There were no reported exports to the United Statesduring 2001-06. While capacity utilization rates are relatively high, and inventory levels are very low forMoldova, the existence of markets in Russia and Ukraine and nearby countries suggests that the industrymay have the potential to shift sales from these markets to the United States.
Poland
One Polish producer, CMCZ, provided information on its rebar operations between 2004 (theyear in which Poland entered the European Union) and 2006. CMCZ’s capacity utilization rate was ***percent in 2004, *** percent in 2005, and *** percent in 2006. Its projected capacity utilization rate is*** percent in 2007 and *** percent in 2008. CMCZ’s ratio of end-of-period inventories to shipmentsranged from a low of *** percent in *** to a high of *** percent in ***. During 2004-06 *** ofCMCZ’s shipments went either to its home market or were exported to the European Union. Its homemarket share of total shipments ranged between *** percent and *** percent annually during these years,while exports to the European Union ranged between *** percent and *** percent. CMCZ projected thatits home market will account for *** percent of its shipments in both 2007 and 2008, and that theEuropean Union will account for *** in each of those years. The availability of some excess capacity,and the existence of these markets suggests that CMCZ may have potential for exporting to the UnitedStates.
Ukraine
During the 2001-06 period, the Ukraine producer Mittal operated at a near *** percent capacityutilization rate. The rate is projected to be about *** percent in both 2007 and 2008. The industry’s ratioof end-of-period inventories to shipments ranged from a low of *** percent in *** to a high of ***percent in ***. The home market for rebar has been increasing during the period, reaching *** percent oftotal shipments in 2006. European Union and Asian markets have consistently accounted for a *** smallshare of Ukrainian shipments during the period. There were no reported exports to the United States after2001. Ukrainian exports to all other markets excluding the European Union, the home market, and Asia,have consistently accounted for the majority of all shipments, though the share has been declining. Theshare of shipments going to all other markets decreased from *** percent of the total in 2001 to ***percent in 2006. While the capacity utilization rate is high, the existence of alternative markets suggeststhat the industry may have the potential to shift sales from markets such as Russia, the Middle East,Africa, Eastern Europe, and South America to the United States.
U.S. Demand
Since rebar is used in reinforcing concrete, U.S. demand for this product depends upon the levelof construction activity in the United States. Major end-use products requiring rebar include roads andbridges, commercial and industrial construction, residential construction, and public construction.6 Overall demand in the United States (as measured by apparent U.S. consumption) increased in quantityterms from 7.7 million short tons in 2001 to 9.9 million short tons in 2006. Increases occurred both insideand outside of the specified region. Within the specified region, apparent consumption increased

7 Two producers reported that they did not know whether demand had increased, decreased, or remainedunchanged. 8 Total U.S. spending for residential and nonresidential construction were not available prior to 2002, because theU.S. Census Bureau did not break out government spending between these categories prior to 2002. 9 Hearing transcript, p. 56 (Parrish).
II-8
from 5.6 million short tons in 2001 to 7.2 million short tons in 2006. Outside the specified region,apparent consumption increased from 2.2 million short tons in 2001 to 2.7 million short tons in 2006.
When asked whether the demand for rebar in the United States has changed since 2001, mostquestionnaire respondents reported that demand has increased. Five responding producers,7 10 of 14responding importers, and 18 of 22 purchasers reported that it had increased during this period. Firmsreporting an increase in demand commonly cited such factors as a strong economy and strong marketdemand due to residential and nonresidential construction activity. Two purchasers reported that demandhad both increased and decreased since 2001. Three importers and two purchasers reported that demandwas unchanged. One importer reported that demand had fluctuated during the period. All *** U.S.producers that reported an overall increase in demand since 2001 also reported that residentialconstruction spending declined during the period. The total value of construction in the United States for2001-06, and the value of residential and nonresidential construction during 2002-06 are shown in figureII-1.8 The data show that the value of total construction and nonresidential construction increased duringall years shown. As shown in this figure, the value of residential construction spending fell in 2006, butincreased overall during the 2002-06 period.
Both residential and nonresidential construction spending can be divided between public andprivate spending. Most residential construction spending is private. During 2006, nearly 99 percent ofthis spending was classified as private with the remainder classified as public. For nonresidentialconstruction, spending is more evenly divided between the public and private sectors. During 2006, 53percent of nonresidential construction was private, and 47 percent was public. Major items falling underprivate nonresidential construction included commercial, office, educational and power includingelectrical, gas and oil. Major items classified under public nonresidential include highways and streets,educational, transportation and sewage and waste disposal.
The domestic interested parties have argued that a decline in residential construction spending islikely to lead to a decline in nonresidential construction spending within six to nine months.9 Thefollowing figure presents residential and nonresidential construction for the period January 2006 throughApril 2007 on a seasonally adjusted annualized basis. As shown in figure II-2, residential constructionspending was largely unchanged from January of 2006 to March of 2006. It then declined in April of2006 and continued to decrease in most months through April of 2007. On a year-to-year basis,residential construction spending was 14.1 percent lower in April 2007 than in April 2006. In contrast toresidential construction, nonresidential construction spending increased in most months during January2006 through April 2007 period. It increased by 12.7 percent between April 2006 and April 2007.

II-9
Figure II-1Construction spending: Total, residential, and nonresidential construction spending in the UnitedStates, 2001-06
Source: U.S. Census Bureau, Manufacturing, Mining and Construction Statistics, Construction Spending. http://www.census.gov/const/www/c30index.html#.
Figure II-2Construction spending: Residential and nonresidential construction spending in the United Statesseasonally adjusted annual rate, monthly, January 2006-April 2007
Source:U.S. Census Bureau, Manufacturing, Mining and Construction Statistics, Construction Spending. http://www.census.gov/const/www/c30index.html#.

II-10
Substitutes
When asked whether there are other products that can be substituted for rebar, responses werevaried. Five of seven responding producers, one of four importers from the subject countries, three of 13importers from nonsubject countries, and 12 of 22 purchasers reported the existence of substitutes. Wiremesh was most frequently cited as a substitute. One producer noted that wire mesh can only besubstituted for rebar in non-critical applications such as concrete floors and concrete sidewalks. Decisionsto use mesh are usually made well in advance of the construction date, and are not driven by short-termprice changes. According to this producer, there are no substitutes for larger sizes of rebar. In addition towire mesh, other items listed as potential substitutes included fiber mesh, fiberglass rebar, post tensioncable, and structural steel. When asked whether changes in the prices of the substitutes would affect theprice of rebar, all questionnaire respondents answered no.
Cost Share
Questionnaire respondents reported that rebar generally accounts for a small share of the cost offinal end-use products. Four of seven producers provided estimates of the costs of rebar in various end-use applications including residences, bridges, commercial/industrial construction and publicconstruction. In all cases, the estimates amounted to 5 percent or less. Most importers and purchaserscould not provide estimates of these cost shares. However, one importer reported that rebar accounts for10 percent of construction costs and one purchaser reported that it accounts for *** percent of the cost ofmine roof bolts.
Demand Outside the United States
When questionnaire respondents were asked how demand outside the United States had changedsince 2001, most respondents that were familiar with demand in world markets reported that demand hadincreased. Four of seven U.S. producers, 11 of 17 importers, and 21 of 22 purchasers reported increasesin demand. Factors cited for the growth in demand were a strong global economy accompanied byincreased construction worldwide. Brazil, China, India, and Russia were cited as countries where thedemand for rebar had grown rapidly. Two importers reported that demand was unchanged since 2001.No questionnaire respondents reported that demand had decreased.
SUBSTITUTABILITY ISSUES
The degree of substitutability between domestic products and subject imports, between domesticproducts and nonsubject imports, between subject imports from different sources, and between subjectand nonsubject imports is discussed in this section. The information is based mainly on questionnaireresponses of producers, importers, and purchasers.
Twenty-two purchasers responded to the Commission’s questionnaires. Nine of the firms operateexclusively as distributors while the others are fabricators or end users that also function as distributors insome cases. During 2001-06, 10 of these purchasers bought rebar from U.S. producers located bothinside and outside of the region, 11 bought only from producers located inside the region, and one boughtonly from producers located outside of the region. Fourteen of the purchasers bought imports fromnonsubject sources during 2001-06. The combined value of reported purchases during each of the yearsis shown in table II-3.

10 None of the firms that bought rebar from these countries has detailed pricing or marketing informationconcerning imports from these sources.
II-11
Four purchasers bought imports from one or more subject countries including China, Korea,Latvia, and Poland during the period. The value of these purchases was small as shown in table II-3.10 No purchasers reported buying any rebar from Belarus, Indonesia, Moldova, or Ukraine.
Purchasers were asked whether they had purchased rebar from any of the eight subject countries before 2001, and also whether their purchasing pattern had changed after 2001. Of the 21 responding purchasers, 18 reported that they had not purchased from any of the subject countries prior to 2001. Onefirm that had purchased from Korea reported that it discontinued those purchases because of theantidumping order. Another firm that had purchased from Indonesia, Korea, and Moldova prior to 2001reported that it had discontinued purchases as a result of the antidumping orders. This firm also reportedthat it had increased purchases from nonsubject sources because of the order. In addition, one firm thatreported purchasing rebar from all of the eight subject countries prior to 2001 reported that it haddiscontinued purchases from these countries after 2001 because rebar from those countries was no longeravailable from traders.
Table II-3Rebar: Value of purchases (in thousands of dollars) from U.S. producers and importers, asreported by U.S. purchasers, 2001-06
Purchase source
Year
2001 2002 2003 2004 2005 2006
Producers inside region $470,581 $502,081 $457,888 $837,900 $997,193 $1,179,955
Producers outside region 88,585 90,411 117,491 240,761 311,576 326,765
China *** *** *** *** *** ***
Korea *** *** *** *** *** ***
Latvia *** *** *** *** *** ***
Poland *** *** *** *** *** ***
Nonsubject countries 17,559 18,541 28,073 234,388 192,070 326,735
Source: Compiled from data submitted in response to Commission questionnaires.
Factors Affecting Purchasing Decisions
When asked to rank the three most important factors involved in purchasing decisions,purchasers chose price most frequently, with 14 of the 22 purchasers ranking this factor first (table II-4).Other purchasing considerations with high ranking included availability, delivery/service, and quality.
In order to obtain more information on purchasing decisions, firms were asked whether thesedecisions are based mainly on price. Purchasers were instructed to answer always, usually, sometimes, ornever. Four purchasers selected always, 14 selected usually, and four selected sometimes.
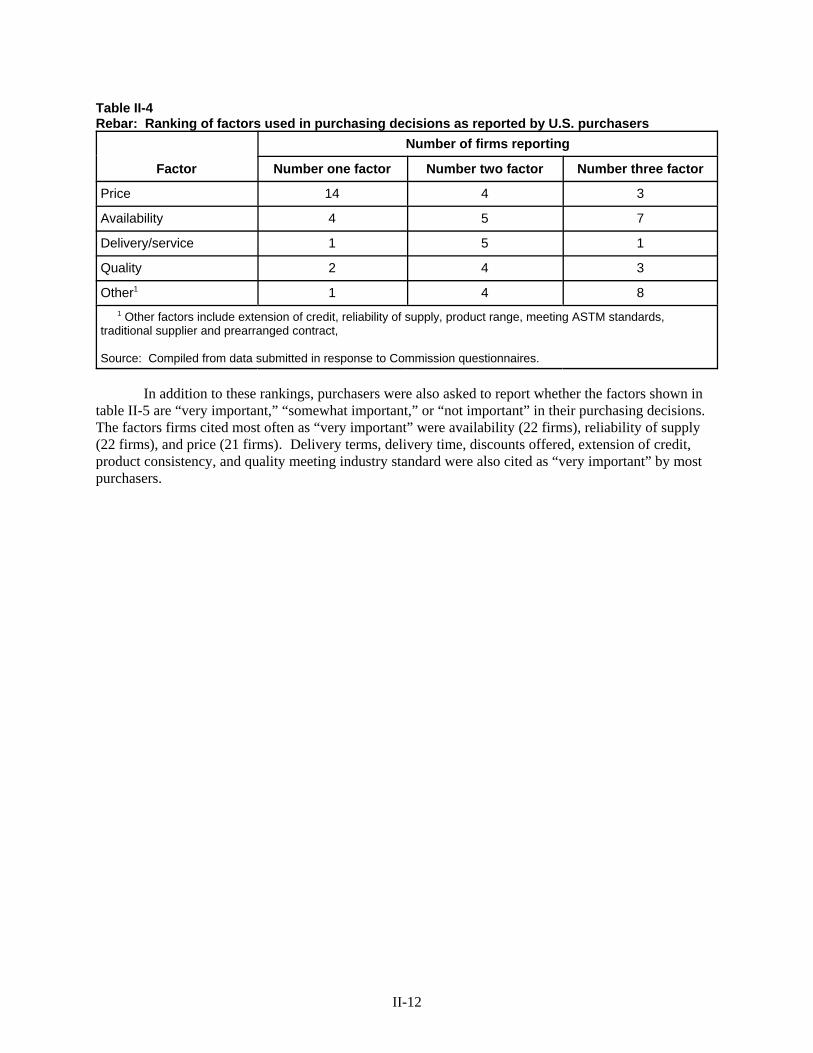
II-12
Table II-4Rebar: Ranking of factors used in purchasing decisions as reported by U.S. purchasers
Factor
Number of firms reporting
Number one factor Number two factor Number three factor
Price 14 4 3
Availability 4 5 7
Delivery/service 1 5 1
Quality 2 4 3
Other1 1 4 8
1 Other factors include extension of credit, reliability of supply, product range, meeting ASTM standards,traditional supplier and prearranged contract,
Source: Compiled from data submitted in response to Commission questionnaires.
In addition to these rankings, purchasers were also asked to report whether the factors shown intable II-5 are “very important,” “somewhat important,” or “not important” in their purchasing decisions. The factors firms cited most often as “very important” were availability (22 firms), reliability of supply(22 firms), and price (21 firms). Delivery terms, delivery time, discounts offered, extension of credit, product consistency, and quality meeting industry standard were also cited as “very important” by mostpurchasers.

11 Information on this bill, which was signed into law on August 10, 2005, can be found at the Federal HighwayTransportation website: http://fhwa.dot.gov/safetealu/index.htm. 12 At the hearing David Phelps, president of the American Institute for International Steel stated that when newhighway, bridge, and mass transit bills get signed, the “Buy American” rules prohibit foreign steel products. Hearing transcript, pp. 219-220 (Phelps).
II-13
Table II-5Rebar: Importance of purchasing factors, as reported by U.S. purchasers
FactorVery important Somewhat important Not important
Number of firms respondingAvailability 22 - -Delivery terms 13 8 1Delivery time 18 4 -Discounts offered 13 5 4Extension of credit 14 5 3Price 21 1 -Minimum quantity requirements 3 8 11Packaging 5 12 5Product consistency 15 7 -Quality meets industry standard 20 2 -Quality exceeds industry standard 5 7 10Product range 4 17 -Reliability of supply 22 - -Technical support/service 8 8 6U.S. transportation costs 10 7 5Source: Compiled from data submitted in response to Commission questionnaires.
Comparisons of Domestic Products, Subject Imports, and Nonsubject Imports
Both producers and purchasers were asked questions concerning the extent of “Buy American”considerations as a factor in their sales and purchases. When asked to report the percentage of their sales that were subject to “Buy American” provisions within the specified region and outside of the region in2006, one producer reported that 20 percent of the sales inside of the region and 20 percent of salesoutside of the region are subject to “Buy American” provisions. Another producer located inside of theregion reported that about 10 percent of its sales are subject to these provisions. Among the other fiveproducers, one firm reported that it is aware that “some” of its customers make use of “Buy American”provisions, but it does not know the percentage of its sales that are subject to these provisions. Anotherfirm reported that it could not specifically identify its sales that go into projects that are subject to suchprovisions. Another producer reported that it was not aware of “Buy American” provisions in the marketarea (outside of the specified region) where it sells. Two other firms reported that they did not haveinformation on the subject.
Producers were also asked whether there has been a shift in the percentage of sales subject to “Buy American” provisions since 2001. One firm said that because of the Federal highway bill, severalstates have increased their letting of highway work, thus increasing its level of “Buy American”business.11 12 Another producer reported that there has been no consistent shift in the use of theseprovisions over time. None of the other firms were able to comment on any shift in the percentage ofsales subject to “Buy American provisions.”
II-14
Purchasers were asked to report separately the typical percentages of their purchases of domesticproduct that are subject by law or regulation to “Buy American” provision, those that are not subject tolaw but are required by their customers to be from domestic sources, and those that are deliberatelybought from domestic sources for other reasons. Nineteen of the 22 responding purchasers reported thatthey buy some rebar from domestic producers for one or more of the three reasons. In the case ofdomestic purchases required by law, 18 firms reported that “Buy American” provisions apply to between5 percent and 100 percent of their purchases. Six of these 18 firms reported that 50 percent or more oftheir purchases were within this category, while the other 12 firms reported that they accounted for 40percent or less of total purchases. Seven firms reported that between 10 percent and 85 percent of theirpurchases are from domestic sources due to customer requirements. Five purchasers stated that they buybetween 25 percent and 100 percent of their rebar from domestic sources for other reasons such as adesire to avoid mixing domestic and foreign steel or a preference for domestic products.
To determine whether U.S.-produced rebar can generally be used in the same applications asimports from the subject countries and nonsubject, producers, importers, and purchasers were askedwhether the product can “always,” “frequently,” “sometimes,” or “never” be used interchangeably. Asshown in table II-6, a majority of questionnaire respondents reported that the products are always orfrequently interchangeable. The responses also indicated that imports of rebar from the different subjectcountries are generally viewed as interchangeable with each other and with imports from nonsubjectcountries. However, one purchaser reported that customers sometimes perceived a quality differencebetween the U.S. product and the imported product from Latvia. This purchaser also noted that domesticcontent requirement limit interchangeability for imports from Latvia. In addition, four other purchasers and two importers commented generally in their questionnaires that in some cases “Buy American”policies may restrict purchases of imports.

II-15
Table II-6Rebar: Interchangeability of product from the United States and subject and nonsubject sources1
Country comparison
U.S. producers U.S. importers Purchasers
A F S N 0 A F S N 0 A F S N 0
U.S. vs. Belarus 6 0 0 0 1 6 4 0 1 6 8 1 2 1 10U.S. vs. China 6 0 0 0 1 6 4 0 1 6 10 2 2 0 8U.S. vs. Indonesia 6 0 0 0 1 6 4 0 1 6 8 1 2 1 10U.S. vs. Korea 6 0 0 0 1 6 4 0 1 6 10 1 3 1 7U.S. vs. Latvia 6 0 0 0 1 6 4 0 1 6 8 1 2 1 10U.S. vs. Moldova 6 0 0 0 1 6 4 0 1 6 8 1 2 1 10U.S. vs. Poland 6 0 0 0 1 6 4 0 1 6 8 1 2 1 10U.S. vs. Ukraine 6 0 0 0 1 6 4 0 1 6 8 1 2 1 10U.S. vs. nonsubject 6 0 0 0 1 6 4 0 1 6 10 2 1 0 9Belarus vs. China 6 0 0 0 1 9 3 0 1 4 8 1 0 1 12Belarus vs. Indonesia 6 0 0 0 1 9 3 0 1 4 8 1 0 1 12Belarus vs. Korea 6 0 0 0 1 9 3 0 1 4 8 1 0 1 12Belarus vs. Latvia 6 0 0 0 1 9 3 0 1 4 8 0 1 1 12Belarus vs. Moldova 6 0 0 0 1 9 3 0 1 4 8 0 1 1 12Belarus vs. Poland 6 0 0 0 1 9 3 0 1 4 8 0 1 1 12Belarus vs. Ukraine 6 0 0 0 1 9 3 0 1 4 8 0 1 1 12Belarus vs. nonsubject 6 0 0 0 1 9 3 0 1 4 8 0 1 1 12China vs. Indonesia 6 0 0 0 1 9 3 0 1 4 8 1 0 1 12China vs. Korea 5 0 0 0 1 9 3 0 1 4 8 1 0 1 12China vs. Latvia 5 0 0 0 1 9 3 0 1 4 8 1 0 1 12China vs. Moldova 5 0 0 0 1 9 3 0 1 4 8 1 0 1 12China vs. Poland 6 0 0 0 1 9 3 0 1 4 8 1 0 1 12China vs. Ukraine 6 0 0 0 1 9 3 0 1 4 8 1 0 1 12China vs. Nonsubject 6 0 0 0 1 9 3 0 1 4 8 0 1 1 12Indonesia vs. Korea 6 0 0 0 1 9 3 0 1 4 8 0 1 1 12Indonesia vs. Latvia 6 0 0 0 1 9 3 0 1 4 8 0 1 1 12Indonesia vs. Moldova 6 0 0 0 1 9 3 0 1 4 8 0 1 1 12Indonesia vs. Poland 6 0 0 0 1 9 3 0 1 4 8 0 1 1 12Indonesia vs. Ukraine 6 0 0 0 1 9 3 0 1 4 8 0 1 1 12Indonesia vs. nonsubject 6 0 0 0 1 9 3 0 1 4 8 1 0 1 12Korea vs. Latvia 6 0 0 0 1 9 3 0 1 4 8 1 0 1 12Korea vs. Moldova 6 0 0 0 1 9 3 0 1 4 8 1 0 1 12Korea vs. Poland 6 0 0 0 1 9 3 0 1 4 8 1 0 1 12Korea vs. Ukraine 6 0 0 0 1 9 3 0 1 4 8 1 0 1 12Korea vs. nonsubject 6 0 0 0 1 9 3 0 1 4 8 0 1 1 12Table continued on the following page.

II-16
Table II–6-- ContinuedRebar: Interchangeability of product from the United States and subject and nonsubject sources1
Country comparison
U.S. producers U.S. importers Purchasers
A F S N 0 A F S N 0 A F S N 0
Latvia vs. Moldova 6 0 0 0 1 9 3 0 1 4 8 0 1 1 12Latvia vs. Poland 6 0 0 0 1 9 3 0 1 4 8 0 1 1 12Latvia vs. Ukraine 6 0 0 0 1 9 3 0 1 4 8 0 1 1 12Latvia vs. nonsubject 6 0 0 0 1 9 3 0 1 4 8 0 1 1 12Moldova vs. Poland 6 0 0 0 1 9 3 0 1 4 8 0 1 1 12Moldova vs. Ukraine 6 0 0 0 1 9 3 0 1 4 8 0 1 1 12Moldova vs. nonsubject 6 0 0 0 1 9 3 0 1 4 8 0 1 1 12Poland vs. Ukraine 6 0 0 0 1 9 3 0 1 4 8 0 1 1 12Poland vs. nonsubject 6 0 0 0 1 9 3 0 1 4 8 0 1 1 12Ukraine vs. nonsubject 6 0 0 0 1 9 3 0 1 4 8 0 1 1 12 1 Producers, importers, and purchasers were asked if rebar produced in the United States and in other countriesis used interchangeably.
Note: “A” = Always, “F” = Frequently, “S” = Sometimes, “N” = Never, and “0” = No familiarity.
Source: Compiled from data submitted in response to Commission questionnaires.
In addition to questions concerning interchangeability, producers and importers were also askedto compare U.S.-produced products with imports from each of the subject countries and with nonsubjectimports in terms of product differences other than price such as quality, availability, product range, andother characteristics, as a factor in their sales of rebar. All five responding producers reported that thedifferences are never significant (table II-7). Importers most commonly reported that the differences arefrequently or sometimes significant, while the few purchasers that reported generally viewed such non-price differences as sometimes or even never significant.
Five importers commented on general factors other than price that may effect purchasingdecisions. These firms cited a number of factors including delivery lead times, availability, ocean freightrates, quality considerations, and the limited range of products from foreign mills as important factors. No particular countries were cited by the importers in a comparison with the United States. Onepurchaser that compared U.S.-produced rebar with imports from Latvia reported that the United States hasan advantage in availability, lead times, and quality. Another purchaser reported that it sometimes needsdomestic rebar to comply with “Buy American” requirements, and a third purchaser reported that “BuyAmerican” provisions account for 25 to 30 percent of their business.

II-17
Table II-7Rebar: U.S. producers’ and importers’ perceived importance of factors other than price in sales ofproducts produced in the United States and in other countries1
Country comparison
U.S. producers U.S. importers Purchasers
A F S N 0 A F S N 0 A F S N 0
U.S. vs. Belarus 0 0 0 6 1 2 3 4 1 7 0 0 4 4 14U.S. vs. China 0 0 0 6 1 2 3 4 1 7 0 0 6 4 12U.S. vs. Indonesia 0 0 0 6 1 2 3 4 1 7 0 0 5 4 13U.S. vs. Korea 0 0 0 6 1 2 3 4 1 7 0 0 6 5 11U.S. vs. Latvia 0 0 0 6 1 2 3 4 1 7 1 0 4 4 13U.S. vs. Moldova 0 0 0 6 1 2 3 4 1 7 0 0 4 4 14U.S. vs. Poland 0 0 0 6 1 2 3 4 1 7 0 0 4 4 14U.S. vs Ukraine 0 0 0 6 1 2 3 4 1 7 0 0 4 4 14U.S. vs nonsubject 0 0 0 6 1 2 3 4 1 7 1 0 4 4 13Belarus vs. China 0 0 0 6 1 1 3 4 2 7 0 0 2 4 16Belarus vs. Indonesia 0 0 0 6 1 1 3 4 2 7 0 0 2 4 16Belarus vs. Korea 0 0 0 6 1 1 3 4 2 7 0 0 2 4 16Belarus vs. Latvia 0 0 0 6 1 1 3 4 2 7 0 0 2 4 16Belarus vs. Moldova 0 0 0 6 1 1 3 4 2 7 0 0 2 4 16Belarus vs. Poland 0 0 0 6 1 1 3 4 2 7 0 0 2 4 16Belarus vs. Ukraine 0 0 0 6 1 1 3 4 2 7 0 0 2 4 16Belarus vs. nonsubject 0 0 0 6 1 1 3 4 2 7 0 0 2 4 16China vs. Indonesia 0 0 0 6 1 1 3 4 2 7 0 0 2 4 16China vs. Korea 0 0 0 6 1 1 3 4 2 7 0 0 2 4 16China vs. Latvia 0 0 0 6 1 1 3 4 2 7 0 0 2 4 16China vs. Moldova 0 0 0 6 1 1 3 4 2 7 0 0 2 4 16China vs. Poland 0 0 0 6 1 1 3 4 2 7 0 0 2 4 16China vs. Ukraine 0 0 0 6 1 1 3 4 2 7 0 0 2 4 16China vs. Nonsubject 0 0 0 5 1 1 3 4 2 7 0 0 2 4 16Indonesia vs. Korea 0 0 0 6 1 1 3 4 2 7 0 0 2 4 16Indonesia vs. Latvia 0 0 0 6 1 1 3 4 2 7 0 0 2 4 16Indonesia vs. Moldova 0 0 0 6 1 1 3 4 2 7 0 0 2 4 16Indonesia vs. Poland 0 0 0 6 1 1 3 4 2 7 0 0 2 4 16Indonesia vs. Ukraine 0 0 0 6 1 1 3 4 2 7 0 0 2 4 16Indonesia vs. nonsubject 0 0 0 6 1 1 3 4 2 7 0 0 2 4 16Korea vs. Latvia 0 0 0 6 1 1 3 4 2 7 0 0 2 4 16Korea vs. Moldova 0 0 0 6 1 1 3 4 2 7 0 0 2 4 16Korea vs. Poland 0 0 0 6 1 1 3 4 2 7 0 0 2 4 16Korea vs. Ukraine 0 0 0 6 1 1 3 4 2 7 0 0 2 4 16Korea vs. nonsubject 0 0 0 6 1 1 3 4 2 7 0 0 2 4 16Table continued on the following page.

II-18
Table II–7-- ContinuedRebar: U.S. producers’ and importers’ perceived importance of factors other than price in sales ofproducts produced in the United States and in other countries1
Country comparison
U.S. producers U.S. importers Purchasers
A F S N 0 A F S N 0 A F S N 0
Latvia vs. Moldova 0 0 0 6 1 1 3 4 2 7 0 0 2 4 16Latvia vs. Poland 0 0 0 6 1 1 3 4 2 7 0 0 2 4 16Latvia vs. Ukraine 0 0 0 6 1 1 3 4 2 7 0 0 2 4 16Latvia vs. nonsubject 0 0 0 6 1 1 3 4 2 7 0 0 2 4 16Moldova vs. Poland 0 0 0 6 1 1 3 4 2 7 0 0 2 4 16Moldova vs. Ukraine 0 0 0 6 1 1 3 4 2 7 0 0 2 4 16Moldova vs. nonsubject 0 0 0 6 1 1 3 4 2 7 0 0 2 4 16Poland vs. Ukraine 0 0 0 6 1 1 3 4 2 7 0 0 2 4 16Poland. vs. nonsubject 0 0 0 6 1 1 3 4 2 7 0 0 2 4 16Ukraine vs. nonsubject 0 0 0 6 1 1 3 4 2 7 0 0 2 4 16 1 Producers and importers were asked if differences other than price between rebar produced in the United Statesand in other countries are a significant factor in their firms’ sales of rebar.
Note: “A” = Always, “F” = Frequently, “S” = Sometimes, “N” = Never, and “0” = No familiarity.
Source: Compiled from data submitted in response to Commission questionnaires.
Purchasers also were asked to compare rebar on a country-by-country basis in 15 specifiedcharacteristics, noting whether the products from the two countries are superior, comparable, or inferior toeach other. No purchasers provided comparisons between the United States product and the importedproduct from any of the eight subject countries. While four purchasers reported buying small quantitiesof imports from one or more of the subject countries during the period, these firms all indicated that theydid not have the detailed pricing/marketing knowledge necessary to compare these imported productswith similar U.S.-produced rebar. However, purchasers did provide comparisons between the UnitedStates and nonsubject countries including Brazil, Bulgaria, the Dominican Republic, Egypt, Germany,Japan, Malaysia, Mexico, Singapore, Taiwan, and Turkey. The results of these comparisons presented onan aggregate basis in table II-8 show that the United States was generally ranked superior to thesenonsubject imports as a group in product availability, delivery terms, delivery time, minimum quantity requirements, product range, reliability of supply, and technical support/service. For most othercategories, a majority or plurality ranked the United States products comparable with nonsubject imports.
ELASTICITY ESTIMATES
This section discusses elasticity estimates for rebar. Parties were encouraged to comment onthese estimates as an attachment to their prehearing briefs. The domestic interested parties commentedon all of the elasticity estimates discussed below in an attachment to their prehearing brief. However,none of the interested parties representing foreign suppliers commented on these estimates.

13 A supply function is not defined in the case of a non-competitive market. 14 Domestic interested parties prehearing brief, exh. 1, The Effects of Order Revocation on the Prices, Shipments,and Profits of the Regional and National Rebar Industries, Economic Submission, p. 12.
II-19
Table II–8Rebar: Comparisons between U.S.-produced and nonsubject products, as reported by U.S.purchasers1
Factor U.S. vs Nonsubject2
S C INumber of firms responding
Product availability 16 6 0 Delivery terms 14 8 0 Delivery time 19 3 0 Discounts offered 7 11 4 Extension of credit 6 12 4 Lower price 3 11 8 Minimum quantity requirements 12 9 - Packaging 3 18 - Product consistency 4 18 - Quality meets industry standards 1 20 1 Quality exceeds industry standards 5 15 2 Product range 12 8 - Reliability of supply 13 9 - Technical support/service 19 3 - U.S. transportation costs 11 11 - Note.--S=first listed country’s product is superior; C=both countries’ products are comparable; I=first listed country’s product isinferior. 1 No purchasers compared the United States products with imports from any of the eight subject countries. 2 Nonsubject countries included Brazil, Bulgaria, the Dominican Republic, Egypt, Germany, Japan, Malaysia, Mexico,Singapore, Taiwan, and Turkey. Source: Compiled from data submitted in response to Commission questionnaires.
U.S. Supply Elasticity13
The domestic supply elasticity for rebar measures the sensitivity of the quantity supplied by U.S.producers to changes in the U.S. market price of rebar. This elasticity depends upon several factorsincluding the level of excess capacity, the availability of alternate markets for U.S.-produced rebar,inventory levels, and the producers’ ability to shift to the manufacture of other products. The earlieranalysis of these factors indicates that the U.S. industry has some flexibility in adjusting supply inresponse to price change. Therefore, this elasticity is likely to range between 5 and 10. The domesticinterested parties have argued that the domestic industry supply elasticity is only moderately elastic,arguing that a range of 3 to 5 is more realistic than the staff estimate at least for a short-term period suchas a year.14 In view of the fact that some excess capacity currently exists in the industry, and thatdomestic inventories are fairly significant in relation to total shipments, there does not seem to be a strongbasis for lowering the estimates shown in the preliminary report.

15 Ibid., pp. 12-13. 16 The substitution elasticity measures the responsiveness of the relative U.S. consumption levels of the subjectimports and the domestic like product to changes in their relative prices. This reflects how easily purchasers switchfrom the U.S. product to the subject imports (or vice versa) when prices change.
II-20
U.S. Demand Elasticity
The U.S. demand elasticity for rebar measures the sensitivity of the overall quantity demanded toa change in the U.S. market price of rebar. This estimate depends on factors discussed earlier such as theexistence, availability, and commercial viability of substitute products, as well as the component share ofrebar in the final cost of end-use products in which it is used. Because of a lack of close, broadlyaccepted substitutes, and the fact that rebar accounts for a relatively small share of the cost of productswhere it is used, it is likely that the aggregate demand for rebar is moderately inelastic. For thepreliminary report the staff estimated a range of values -.5 to -1.0.
The domestic interested parties argued that these values are too high. During the original finalinvestigations relating to rebar from the subject countries, the staff estimated a range for the demandelasticity of -.25 to -.75. Noting this result, the domestic interested parties argued that the value of thiselasticity should actually be -.25.15 In arriving at their estimate, they cited a statement in the final reportindicating that a majority of responding firms reported that there were no practical substitutes for rebar. They further argued that over the past six years, the large increases in rebar prices did not result in anysignificant substitution of alternative products toward rebar.
In contrast to the original investigations, a large share of the questionnaire respondents in thecurrent reviews reported that substitutes do exist. When asked to list substitute products, five of sevenproducers and 12 of 22 purchasers and four of seventeen importers listed substitutes. Substitutesmentioned included not only wire mesh but also fiber mesh, fiberglass rebar, post tension cable, andstructural steel. In view of this information, there does not appear to be a strong reason to adjust thepreliminary staff estimate of a range of -.5 to 1.0, although it is likely that the elasticity is nearer to thelower end of the range than the upper end of the range since substitution of other products for rebar maynot be practical in the majority of applications. The domestic interested parties argue that there was nosignificant substitution away from rebar during the past six years when rebar prices increased. There areno available data to evaluate this argument conclusively.
Substitution Elasticity
The elasticity of substitution depends upon the extent of product differentiation between thedomestic and imported rebar.16 Product differentiation, in turn, depends upon such factors as quality andconditions of sale (availability, delivery, etc.). Based on available information indicating that thedomestic and imported products from the subject countries can always or frequently be usedinterchangeably, the elasticity of substitution between U.S.-produced rebar and imported rebar is likely tobe in the range of 3 to 5. The domestic interested parties argued that in view of generic nature of rebar,the high degree of substitutability of rebar between U.S.-produced and imported rebar, and the importanceof price in purchasing decisions, the substitution elasticity is likely to be very high, at least as high as theupper end of the staff estimate. While the domestic interested parties have made some relevant pointsconcerning this elasticity, the existence of “Buy American” provisions does limit the substitutability insome cases.

17 Ibid., pp. 15-18. 18 Domestic interested parties prehearing brief, exh. 1, Econometric Analysis of the Impact of Subject Imports onRegional and National Rebar Prices, Economic Submission, pp. 1-15.
II-21
Economic Modeling by Domestic Interested Parties
The domestic interested parties provided two separate economic methodologies in theirprehearing submission, an economic model designed to simulate the effects of the removal of the orders,and an econometric analysis of the impact of the subject imports on the regional and national rebar prices. These methodologies are discussed briefly below.
One approach consists of a basic simulation model designed to estimate the likely effects ofremoving the antidumping duties on the domestic industry. The model makes use of inputs from the staffreport including market shares, income statements, and balance sheets. It also makes use of certainelasticities estimated by the Commission staff, and other elasticities estimated by the parties. Theapproach used is to calculate levels of domestic shipments, prices, profits, and labor compensation thatwould have prevailed during each year of the 2001-06 period if the antidumping duties had not beenimposed. The model is applied on both a national and regional basis. The results consistently show thatin the absence of the antidumping duties, import market shares from subject countries would have beenhigher, and domestic shipments, prices, profits, and wages would all have been substantially lower. In allscenarios estimated for a regional industry the model assumes that in the absence of the duties, nonsubjectimports would have accounted for 16 percent of the U.S. market, the percentage that existed during theoriginal investigations before the antidumping duties were applied. In all scenarios estimated for anational industry the model assumes that in the absence of the duties nonsubject imports would haveaccounted for 12 percent of the U.S. market, again, the percentage that prevailed during the originalinvestigations before the antidumping duties were applied.17
Some question arises concerning the elasticities used. The very low U.S. demand elasticity of -0.25 used in all estimates may be overestimating the effects of the dumped imports on the prevailing pricein the U.S. market. In addition the foreign supply elasticity of 10, which applies to all subject andnonsubject imports in all of the scenarios appears rather high, particularly in light of domestic supplyelasticities ranging between 3 and 5.
The econometric analysis performed by the domestic interested parties was designed to examinethe effects of certain variables, including steel scrap prices, lagged quantities of imports from subject andnonsubject countries, and the value of nonresidential construction on U.S. prices of rebar.18 The analysiswas performed separately on both a national and regional basis. The regression made use of 31 quartersof data during the period 1998-2006. The results showed that U.S. prices are positively related to scrapprices and nonresidential construction spending and are negatively related to lagged quantities of imports. All of the independent variables were statistically significant for both the national and regional analysis,and the R2 value of .98 indicates that these variables seem to explain much of the variation in U.S. prices.
Much of the explanation for these very high R2 values appears to be due to the importance ofsteel scrap as the major raw material input used in the production of rebar. During 2001-06 the cost ofthis scrap ranged between 43 percent and 61 percent of the final cost of rebar annually. In 2006, itamounted to 61.6 percent of the final cost of rebar. The close association between steel scrap and rebarprices during the review period is evident from figure V-1 which depicts movement scrap prices and theprice data shown in figure V-3. There is also some question as to why lagged variables for imports areused in their analysis. The domestic interested parties argue that price effects of import surges tend tobuild slowly and peak several quarters after the product enters the United States due to purchaserinventory adjustments combined with formal and informal contracts. However, questionnaire evidenceindicates that most sales in this industry are on a spot rather than contract basis (see part V). While thereare lead times in delivery of rebar from both producers and importers, the long delays suggested by thismodel do not appear to apply (see the section of Market Characteristics).


1 For purposes of these reviews, and consistent with the Commission’s definition in the original investigations,data are presented for a specified region which comprises Puerto Rico, the District of Columbia, and 30 States: Alabama, Arkansas, Connecticut, Delaware, Florida, Georgia, Illinois, Indiana, Kentucky, Louisiana, Maine,Maryland, Massachusetts, Michigan, Mississippi, Missouri, New Hampshire, New Jersey, New York, NorthCarolina, Ohio, Pennsylvania, Rhode Island, South Carolina, Tennessee, Texas, Vermont, Virginia, West Virginia,and Wisconsin.
III-1
PART III: CONDITION OF THE U.S. INDUSTRY
BACKGROUND
The information in this section of the report was compiled from responses to the Commission’squestionnaires and from secondary sources. Twenty-five mills owned by eight firms, which togetheraccounted for almost all of the known U.S. production of rebar during the period for which data werecollected, supplied information on their operations. Table III-1 summarizes important industry eventsthat have taken place within and outside the specified region since January 2001.1 Based on publiclyavailable information compiled for table III-1, four of the firms comprising the petitioning coalitionexited the domestic industry, either without their facilities being acquired by another domestic producer(Riverview Steel Corp’s single mill in 2001) or with their facilities being acquired by other domesticproducers (Auburn Steel Co. Inc’s. two mills, one by Nucor in 2001 and the other ultimately by Nucor in2004; Birmingham Steel Corp’s. three mills by Nucor in 2002; and Marion Steel Co’s. single mill byNucor in 2005).

III-2
Table III-1Rebar: Important industry events, within and outside the specified region, 2001-07
Month/ Year Company Description of Event
Events within the specified region
February2001
Auburn Steel Co.Inc.
Closure: The rebar and merchant-quality bar mini-mill in Lemont, IL, wassubsequently acquired by Slater Steel Corp. in September 2002.
April 2001 Nucor Corp.Acquisition: Nucor acquires the rebar, merchant-quality bar, and light-section mini-mill in Auburn, NY, from Auburn Steel Co. Inc.
August2001
Riverview SteelCorp.
Bankruptcy and shut down: Enters Chapter 11 bankruptcy protection andshuts down rebar production at its rolling mill (no melt-shop capacity) inGlassport, PA. The mill was previously shut down in August 2000 andsubsequently re-opened in spring 2001.
June 2001Empire SpecialtySteel Inc.
Closure: The stainless and alloy rebar and merchant-quality bar rolling mill(no melt-shop capacity) in Dunkirk, NY, was subsequently re-opened afterthe February 2002 sale to Universal Stainless & Alloy Products Inc.
July 2001
International Steel &Tube Industries (IstilUSA)
Acquisition: Istil USA acquired Susquehanna Steel Corp’s. previouslyshuttered rebar, merchant-quality bar, and light-section mini-mill in Milton,PA. Reportedly was in a pre-production phase, but no further informationavailable as to the mill’s operating status.
February2002
Universal Stainless& Alloy ProductsInc.
Acquisition and restart: Universal acquired the stainless and alloy rebarand merchant-quality bar rolling mill (no melt-shop capacity) in Dunkirk, NY,from Empire Specialty Steel Inc., which was restarted in March 2002.
June 2002Birmingham SteelCorp.
Bankruptcy: Rebar and merchant-quality bar mills subsequently acquiredby Nucor Corp. in December 2002, including those in Birmingham, AL,Kankakee, IL, and Jackson, MS. Birmingham exits the domestic rebarindustry.
September2002 Steel Dynamics Inc.
Acquisition and upgrade: Steel Dynamics, previously without rebar-production capacity, resolved litigation with Nucor Steel for purchasingQualitech Steel SBQ and began converting the special-quality bar mini-millin Pittsboro, IN, to also produce rebar and other merchant-quality bar.
September2002 Slater Steel Corp.
Acquisition and restart: Slater Steel acquired Auburn Steel Co. Inc’s.previously shuttered rebar and merchant-quality bar mini-mill in Lemont, IL,at which rolling operations were restarted in December 2002 with billetsprovided by other Slater Steel facilities in both the United States andCanada. The melt-shop equipment was dismantled and redistributedamong its other facilities.
October2002
Gerdau AmeristeelU.S. Inc. and Co-Steel Inc.
Merger: Gerdau Ameristeel acquires the rebar and merchant-quality barmini-mill in Sayerville, NJ, through its merger with Canadian-based Co-Steel.
December2002 Nucor Corp.
Acquisition: Nucor acquires the remaining rebar and merchant-quality barmini-mills of bankrupt Birmingham Steel Corp., including those inBirmingham, AL, Kankakee, IL, and Jackson, MS.
June 2003 Slater Steel Corp.
Bankruptcy: Carbon and alloy rebar and merchant-quality bar mini-mill inLemont, IL, subsequently sold to Nucor Corp. in January 2004. Stainlessmerchant-quality bar mill in Fort Wayne, IN, sold to Valbruna Stainless Inc.in February 2004 and subsequently restarted in July 2004.
January2004 Nucor Corp.
Acquisition: Nucor acquires the previously idled rebar, merchant-qualitybar, and special-quality bar rolling mill (no melt-shop capacity) at Lemont,IL, from bankrupt Slater Steel Corp.
Table continued on next page.

III-3
Table III-1 – ContinuedRebar: Important industry events, within and outside the specified region, 2001-07
Month/ Year Company Description of Event
Events within the specified region
February2004
Valbruna StainlessInc.
Acquisition and restart: Valbruna acquires the stainless and alloy rebar,merchant-quality bar, and light-section mini-mill in Fort Wayne, IN, frombankrupt Slater Steel Corp., which was subsequently restarted July 2004.
June 2005 Nucor Corp.Acquisition: Nucor acquires Marion Steel Co. and its rebar and merchant-quality bar mini-mill in Marion, OH.
May 2006 Nucor Corp.Acquisition: Nucor acquires Connecticut Steel Corp. and its mini-mill inWallingford, CT, which produces nonsubject coiled rebar.
May 2006 Nucor Corp.
Upgrade and restart: Upgraded and restarted the Jackson, MS, rebar,merchant-quality bar and light-section mini-mill previously acquired frombankrupt Birmingham Steel Corp.
April 2007 Border Steel, Inc.
Foreign acquisition: Luxembourg-based Arcelor Mittal Border Steelacquired Border Steel, along with production facilities in Mexico, owned byMexican long-products producer Sicartsa from the Mexican parent companyGrupo Villacero.
May 2007
UnidentifiedEuropeansteelmaker
Potential new mill: An unnamed European steelmaker reportedlyevaluates a site in Kansas City, MO, for a new rebar mill. If this site isselected from among the various sites and states under consideration, millconstruction could begin as early as January 2008. No further informationavailable as to planned production capacity.
Events outside the specified region
December2001 Sheffield Steel Corp.
Emergence from bankruptcy: Rebar, merchant-quality bar, and special-quality bar produced at its mini-mill in Sand Springs, OK.
December2002 Nucor Corp.
Acquisition: Nucor acquires the remaining rebar and merchant-quality barmini-mills of bankrupt Birmingham Steel Corp., including the one in Seattle,WA.
March2003 Nucor Corp.
Acquisition: Nucor acquired the wire rod and rebar mini-mill in Kingman,AZ, from North Star Steel Inc., where the melt shop was idled since 2000due to high electricity costs. In July 2004, the melt-shop equipment wasdismantled and redistributed among other Nucor facility locations, afterunsuccessful attempts to negotiate favorable electric power contracts. Otherwise, the reheating, rolling, and finishing facilities remain intact.
November2004
Gerdau AmeristeelU.S. Inc.
Acquisition: Gerdau Ameristeel acquires the remaining long-product mini-mills of North Star Steel Inc., including the ones in Wilton, IA, and St. Paul,MN. North Star Steel exits the domestic rebar industry.
June 2006Gerdau AmeristeelU.S. Inc.
Acquisition: Gerdau Ameristeel acquires Sheffield Steel Corp., includingits rebar, merchant-quality bar, and special-quality bar mini-mill in SandSprings, OK.
March2007
Commercial MetalsCo.
Foreign acquisition: Commercial Metals increased its control of CMC-Zwiercie S.A. to 99 percent by purchasing the 26.8-percent stake owned bythe Polish Ministry of State Treasury. Remaining shares are small holdingsof numerous individuals.
Source: American Metal Market, various issues; Steel News, various issues; company Internet sites; otherarticles, various issues; Steel: Evaluation of the Effectiveness of Import Relief, Inv. No. TA-204-12, USITCPublication 3797, September 2005; Steel: Monitoring Developments in the Domestic Industry, Inv. No. TA-204-9,vol. I, part I, USITC Publication 3632, September 2003; Concrete Reinforcing Bars from Turkey, Inv. No. 731-TA-745 (Review), USITC Publication 3577, February 2003; and Certain Steel Concrete Reinforcing Bars fromIndonesia, Poland, and Ukraine, Invs. Nos. 731-TA-875, 880, and 882 (Final), USITC Publication 3425, May 2001.

III-4
U.S. PRODUCERS’ CAPACITY, PRODUCTION, AND CAPACITY UTILIZATION
As shown in table III-2, national U.S. producers’ capacity in 2006 was higher than in 2001, andexpanded fairly steadily (with the exception of a small decline in 2004) during the review period. The2004 capacity decreases were attributable mostly to declines outside the specified region by *** and ***plants, although there were very slight declines also distributed throughout most plants inside thespecified region. Production followed a similar, but more pronounced, trend. Capacity utilization peakedin 2005, but was noticeably higher throughout 2003-06 than in 2001-02, as production increased at amuch greater rate than capacity. Non-regional producers reported higher levels of capacity utilizationthan regional producers, particularly in 2003.
Table III-2Rebar: U.S. producers’ capacity, production, and capacity utilization, by mill location, 2001-06
Item 2001 2002 2003 2004 2005 2006
National:
Capacity (short tons) 7,886,652 7,993,078 8,424,774 8,154,261 8,367,112 8,615,640
Production (short tons) 6,146,866 6,354,037 7,501,223 7,076,073 7,541,574 7,704,871
Capacity utilization (percent) 77.9 79.5 89.0 86.8 90.1 89.4
Mills within the specified region:
Capacity (short tons) 5,551,138 5,687,574 5,866,111 5,760,559 5,863,662 6,116,290
Production (short tons) 4,252,563 4,472,788 5,089,855 4,897,577 5,195,599 5,426,079
Capacity utilization (percent) 76.6 78.6 86.8 85.0 88.6 88.7
Mills outside the specified region:
Capacity (short tons) 2,335,514 2,305,504 2,558,663 2,393,702 2,503,450 2,499,350
Production (short tons) 1,894,303 1,881,249 2,411,368 2,178,496 2,345,975 2,278,792
Capacity utilization (percent) 81.1 81.6 94.2 91.0 93.7 91.2
Source: Compiled from data submitted in response to Commission questionnaires.
Changes During the Period in Existing Operations
U.S. producers were requested to report any changes to their operations producing rebar duringthe period of review. Some responding firms reported no changes to their operations, but many firmsexperienced changes to their operations relating to the production of rebar since 2001, and reported thefollowing.
Firms Within the Region
Border Steel, along with other facilities owned by Mexican long-products producer Sicartsa, wasacquired from its Mexican parent company, Grupo Villacero, by Luxembourg-based Arcelor Mittal in

2 Phillip Price, “Arcelor Mittal Finalizes Purchase of Long Products Maker Sicartsa,” American Metal Market,April 23, 2007. 3 “Arcelor Mittal in $1.4-Billion Deal to Buy Sicartsa,” American Metal Market, December 20, 2006. 4 Michael Cowden, “Brazil’s Grupo Gerdau Said Making a Play for Chaparral,” American Metal Market, May 23,2007. 5 Chaparral Steel Co., “Chaparral Steel Company Retains Goldman, Sachs & Co. To Assist in Review ofStrategic Alternatives,” news release, April 25, 2007; and Michael Cowden, “Chaparral Board Explores Sale,Merger Possibilities,” American Metal Market, April 26, 2007.
III-5
April 2007.2 The Sicartsa acquisition, along with Arcelor Mittal’s existing Mexican flat-rolled facilities,reportedly will make Arcelor Mittal the largest producer of long- and flat-rolled steel products in Mexico. Arcelor Mittal also plans to form a joint venture with Grupo Villacero to distribute long products in bothMexico and the southwestern United States.3
CMC reported several changes to its operations for plants inside the region. ***. Gerdau reported several changes to its plants in the region. As detailed previously, Gerdau has
purchased several steel mills since 2001. In addition, the company has ***. In 2002, the companymerged with Co-Steel. As a result, it acquired a rebar mill in Sayreville, NJ. ***.
In May 2007, Gerdau’s parent company, Brazil-based Grupo Gerdau S.A., was reportedly intake-over discussions to acquire Chaparral, but neither Chaparral nor Gerdau representatives offered anyfurther public comments.4 Previously, Chaparral announced that its board of directors will be evaluatingstrategic corporate alternatives for the firm, including a possible sale, merger, partnership, acquisition, orrecapitalization.5
Finally, as discussed above, Nucor acquired Auburn Steel in 2001, Birmingham Steel in 2002(Birmingham, Jackson, and Kankakee within the region), and Marion Steel in 2005.
Firms Outside the Region
Gerdau reported that it acquired certain steel making assets of North Star Steel from Cargill,including two rebar producing facilities in Wilton, IA, and St. Paul, MN, in 2004. ***. In 2006, Gerdauacquired Sheffield Steel Corp., including a rebar mill in Sand Springs, OK. ***.
Nucor acquired Birmingham Steel in 2002 (Nucor Seattle).***.
Anticipated Changes in Existing Operations
The Commission asked domestic producers to report anticipated changes in their operations in thefuture. Some firms reported anticipated changes, which are summarized below.
Firms Within the Region
***.
Firms Outside the Region
***.

6 *** submitted articles outlining CMC’s plans to build a new micro mill in Casa Grande, AZ, with a capacity ofabout 280,000 tons, starting in 2009. Submission of ***, March 7, 2007. 7 ***. 8 ***.
III-6
***.6
***. ***.
Constraints on Capacity
Some firms reported constraints on their capacity to produce rebar, which are listed below.
Firms Within the Region
***. ***.
Firms Outside the Region
***. ***. ***.***.
Alternative Products
The Commission collected data on coiled (nonsubject) rebar and other bar production by U.S.rebar producers. As shown in table III-3, production of merchant bar and other bar products (such asSBQ bar) increased between 2001 and 2006, although only merchant bar was produced in volumescomparable to the production of rebar. Overall capacity utilization, like the allocated rebar data discussedpreviously, was markedly higher in 2003-06 than in 2001-02, as production growth outstripped increasesin capacity.
Shifting from producing rebar to other products, while possible for some producers, is not alwaysdesirable. Several producers reported their views on producing alternate products on the same equipmentthat they use to produce rebar, which are summarized below.
Firms Within the Region
***.***.7
***.
Firms Outside the Region
***. ***.8

III-7
Table III-3Rebar: U.S. capacity, production, and capacity utilization for subject rebar, nonsubject (coiled) rebar, andother bar products, 2001-06
Item 2001 2002 2003 2004 2005 2006Quantity (short tons)
National:Average rolling capacity 13,647,000 13,713,000 14,070,000 14,584,000 14,740,000 15,124,255Production:
Straight rebar 6,143,665 6,368,524 7,500,721 7,067,122 7,538,873 7,713,433Coiled rebar *** *** *** *** *** ***Merchant bar 4,106,918 4,049,591 4,252,917 4,521,834 4,409,960 4,705,420Other1 *** *** *** *** *** ***
Total production 10,992,978 11,292,051 12,682,920 12,840,207 13,295,595 13,864,789
Capacity utilization (percent) 80.6 82.3 90.1 88.0 90.2 91.7For mills within the region:Average rolling capacity 9,341,000 9,341,000 9,595,000 10,152,000 10,282,000 10,594,255Production:
Straight rebar 4,249,362 4,487,275 5,089,353 4,888,626 5,192,898 5,434,641Coiled rebar *** *** *** *** *** ***Merchant bar 2,764,546 2,682,442 2,806,118 3,003,903 2,858,008 3,165,371Other1 *** *** *** *** *** ***
Total production 7,601,808 7,828,702 8,573,993 8,880,737 9,152,891 9,778,253
Capacity utilization (percent) 81.4 83.8 89.4 87.5 89.0 92.3For mills outside the region:Average rolling capacity 4,306,000 4,372,000 4,475,000 4,432,000 4,458,000 4,530,000Production:
Straight rebar 1,894,303 1,881,249 2,411,368 2,178,496 2,345,975 2,278,792Coiled rebar *** *** *** *** *** ***Merchant bar 1,342,372 1,367,149 1,446,799 1,517,931 1,551,952 1,540,049Other1 *** *** *** *** *** ***
Total production 3,391,170 3,463,349 4,108,927 3,959,470 4,142,704 4,086,536
Capacity utilization (percent) 78.8 79.2 91.8 89.3 92.9 90.2 1 Other products included SBQ rounds, corners, squares, and flats; highway sign posts; fence posts; wire rods; and t-poststock.
Source: Compiled from data submitted in response to Commission questionnaires.

9 U.S. producers’ submissions of March 6, 2007 and March 8, 2007. 10 Submission by Gerdau, March 7, 2007. 11 Domestic interested parties submission on behalf of ***, and hearing transcript, pp. 89 (McCullachs andParrish) and 92 (Fritsch). 12 Domestic interested parties provided data on shipments for the first four months of 2007 for Cascade, CMC,Gerdau, Nucor, and TAMCO. Compared with the first four months of 2006, shipments increased slightly on aquantity basis but increased even more a value basis, as average unit values increased by *** percent. May 24,2007 submission by domestic interested parties, monthly shipments summary, p. 3. If examined on a monthly basis,the first three months of 2007 showed increases in shipment quantities, and April 2007 showed decreases inshipment quantities, while all four months experienced increases in average unit values of shipments.
III-8
U.S. PRODUCERS’ DOMESTIC SHIPMENTS, COMPANY TRANSFERS, AND EXPORT SHIPMENTS
Shipments by U.S. Mills Throughout the United States
Data on domestic producers’ shipments of rebar on a national basis are presented in table III-4. U.S. commercial shipments, transfers, and exports generally increased from 2001 to 2006, while internalconsumption decreased during the same period. Transfers rose faster than commercial shipments, butexports increased more rapidly still. Transfers to related firms primarily took place inside the specifiedregion, and *** accounted for the majority of such transfers during the period.
The sharp increase in the average unit values of shipments in 2004-06 reflected marked increasesin raw material and other input costs (scrap steel, electricity, natural gas, and alloys), according to severalU.S. producers.9 The price of scrap steel in 2004 was almost double the price in 2003, according toAmerican Metal Market scrap indices for heavy melt and busheling.10 Rebar producers pass along theseraw material cost increases to purchasers in the form of price increases (CMC and Gerdau) and surcharges(in the case of *** and Nucor).11 12

III-9
Table III-4Rebar: U.S. national producers’ shipments, by types, 2001-06
Item 2001 2002 2003 2004 2005 2006
Quantity (short tons)
U.S. shipments:
Commercial shipments to–
Inside the specified region *** *** *** *** *** ***
Outside the specified region *** *** *** *** *** ***
Subtotal *** *** *** *** *** ***
Internal consumption *** *** *** *** *** ***
Transfers to related firms--
Inside the specified region *** *** *** *** *** ***
Outside the specified region *** *** *** *** *** ***
Subtotal *** *** *** *** *** ***
Subtotal, U.S. shipments 6,004,280 6,142,432 7,479,403 6,727,868 7,416,240 7,421,016
Export shipments *** *** *** *** *** ***
Total shipments *** *** *** *** *** ***
Value (1,000 dollars)
U.S. shipments:
Commercial shipments to--
Inside the specified region *** *** *** *** *** ***
Outside the specified region *** *** *** *** *** ***
Subtotal *** *** *** *** *** ***
Internal consumption *** *** *** *** *** ***
Transfers to related firms--
Inside the specified region *** *** *** *** *** ***
Outside the specified region *** *** *** *** *** ***
Subtotal *** *** *** *** *** ***
Subtotal, U.S. shipments 1,612,555 1,599,417 2,111,414 2,993,872 3,510,682 3,872,943
Export shipments *** *** *** *** *** ***
Total shipments *** *** *** *** *** ***Table continued on the following page.

13 Domestic interested parties provided data on shipments for the first four months of 2007 for CMC, Gerdau, andNucor. Compared with the first four months of 2006, shipments remained steady on a quantity basis but increasedon a value basis, as average unit values increased by *** percent. May 24, 2007 submission by domestic interestedparties, monthly shipments summary, p. 3. If examined on a monthly basis, the first three months of 2007 showedincreases in shipment quantities, and April 2007 showed decreases in shipment quantities, while all four monthsexperienced increases in average unit values of shipments. 14 E-mail from ***, June 5, 2007. 15 ***.
III-10
Table III-4--ContinuedRebar: U.S. national producers’ shipments, by types, 2001-06
Item 2001 2002 2003 2004 2005 2006
Unit value (per short ton)
U.S. shipments:
Commercial shipments to--
Inside the specified region $*** $*** $*** $*** $*** $***
Outside the specified region *** *** *** *** *** ***
Average *** *** *** *** *** ***
Internal consumption *** *** *** *** *** ***
Transfers to related firms--
Inside the specified region *** *** *** *** *** ***
Outside the specified region *** *** *** *** *** ***
Average *** *** *** *** *** ***
Average, U.S. shipments 269 260 282 445 473 522
Export shipments *** *** *** *** *** ***
Average, all shipments *** *** *** *** *** ***
Source: Compiled from data submitted in response to Commission questionnaires.
Shipments by U.S. Mills Within the Specified Region
Data on domestic producers’ shipments of rebar within the specified region are presented in tableIII-5.13 Transfers rose slightly more than commercial shipments during 2001-06, and exports roseirregularly more than other types of shipments. The Harris Steel acquisition by Nucor should not have alarge impact on the trend in transfer shipments within the region in the future, as six out of eight ofHarris’ locations are outside the region, and ***. Further, ***.14 The *** plant reported a small amountof internal consumption because it includes an on-site rebar fabrication facility.15

III-11
Table III-5Rebar: U.S. shipments by producers within the specified region, by types, 2001-06
Item 2001 2002 2003 2004 2005 2006
Quantity (short tons)
U.S. shipments:
Commercial shipments to–
Inside the specified region *** *** *** *** *** ***
Outside the specified region *** *** *** *** *** ***
Subtotal *** *** *** *** *** ***
Internal consumption *** *** *** *** *** ***
Transfers to related firms--
Inside the specified region *** *** *** *** *** ***
Outside the specified region *** *** *** *** *** ***
Subtotal *** *** *** *** *** ***
Subtotal, U.S. shipments 4,302,371 4,395,879 5,186,342 4,793,833 5,243,772 5,375,098
Export shipments *** *** *** *** *** ***
Total shipments *** *** *** *** *** ***
Value (1,000 dollars)
U.S. shipments:
Commercial shipments to--
Inside the specified region *** *** *** *** *** ***
Outside the specified region *** *** *** *** *** ***
Subtotal *** *** *** *** *** ***
Internal consumption *** *** *** *** *** ***
Transfers to related firms--
Inside the specified region *** *** *** *** *** ***
Outside the specified region *** *** *** *** *** ***
Subtotal *** *** *** *** *** ***
Subtotal, U.S. shipments 1,139,888 1,137,280 1,445,705 2,116,051 2,439,075 2,770,112
Export shipments *** *** *** *** *** ***
Total shipments *** *** *** *** *** ***Table continued on the following page.

16 Transfers to related firms outside the region increased greatly due to a ***. 17 Hearing transcript, p. 14 (Gurley). 18 E-mail from ***, June 5, 2007.
III-12
Table III-5--ContinuedRebar: U.S. shipments by producers within the specified region, by types, 2001-06
Item 2001 2002 2003 2004 2005 2006
Unit value (per short ton)
U.S. shipments:
Commercial shipments to--
Inside the specified region $*** $*** $*** $*** $*** $***
Outside the specified region *** *** *** *** *** ***
Average *** *** *** *** *** ***
Internal consumption *** *** *** *** *** ***
Transfers to related firms–
Inside the specified region *** *** *** *** *** ***
Outside the specified region *** *** *** *** *** ***
Average *** *** *** *** *** ***
Average, U.S. shipments 265 259 279 441 465 515
Export shipments *** *** *** *** *** ***
Average, all shipments *** *** *** *** *** ***
Source: Compiled from data submitted in response to Commission questionnaires.
Shipments by U.S. Mills Outside the Specified Region
Data on domestic producers’ shipments of rebar outside the region are presented in table III-6. Commercial shipments, transfers, and exports increased during 2001-06, with transfers increasing at thegreatest rate, followed by exports.16 Although Mittal has argued about the significance of Nucor’s recentpurchase of Harris Steel,17 ***,18 so it is unclear whether there would be an expectation that transferswould increase in the future, even though ***. Average unit values for commercial shipments by U.S.producers outside the region were somewhat higher than average unit values for commercial shipments byU.S. producers within the region in each year between 2001 and 2006.

III-13
Table III-6Rebar: U.S. shipments by producers outside the specified region, by types, 2001-06
Item 2001 2002 2003 2004 2005 2006
Quantity (short tons)
U.S. shipments:
Commercial shipments to–
Inside the specified region *** *** *** *** *** ***
Outside the specified region *** *** *** *** *** ***
Subtotal *** *** *** *** *** ***
Internal consumption *** *** *** *** *** ***
Transfers to related firms--
Inside the specified region *** *** *** *** *** ***
Outside the specified region *** *** *** *** *** ***
Subtotal *** *** *** *** *** ***
Subtotal, U.S. shipments 1,701,909 1,746,553 2,293,061 1,934,035 2,172,468 2,045,918
Export shipments *** *** *** *** *** ***
Total shipments *** *** *** *** *** ***
Value (1,000 dollars)
U.S. shipments:
Commercial shipments to--
Inside the specified region *** *** *** *** *** ***
Outside the specified region *** *** *** *** *** ***
Subtotal *** *** *** *** *** ***
Internal consumption *** *** *** *** *** ***
Transfers to related firms--
Inside the specified region *** *** *** *** *** ***
Outside the specified region *** *** *** *** *** ***
Subtotal *** *** *** *** *** ***
Subtotal, U.S. shipments 472,667 462,137 665,710 877,822 1,071,607 1,102,831
Export shipments *** *** *** *** *** ***
Total shipments *** *** *** *** *** ***Table continued on the following page.

19 The decline in inventories during 2001-06 outside the region was accounted for by ***, which influenced thetrend for the national industry as well.
III-14
Table III-6--ContinuedRebar: U.S. shipments by producers outside the specified region, by types, 2001-06
Item 2001 2002 2003 2004 2005 2006
Unit value (per short ton)
U.S. shipments:
Commercial shipments to--
Inside the specified region $*** $*** $*** $*** $*** $***
Outside the specified region *** *** *** *** *** ***
Average *** *** *** *** *** ***
Internal consumption *** *** *** *** *** ***
Transfers to related firms–
Inside the specified region *** *** *** *** *** ***
Outside the specified region *** *** *** *** *** ***
Average *** *** *** *** *** ***
Average, U.S. shipments 278 265 290 454 493 539
Export shipments *** *** *** *** *** ***
Average, all shipments *** *** *** *** *** ***
Source: Compiled from data submitted in response to Commission questionnaires.
U.S. PRODUCERS’ INVENTORIES
Data collected in these reviews on domestic producers’ end-of-period inventories of rebar arepresented in table III-7. The domestic industry’s inventories of rebar as a ratio to total shipmentsfluctuated in a downward trend on the national level, from a peak in 2001-02 to a low point in 2003. Producers outside the region generally held a higher ratio of inventories to total shipments in most yearsof the review period than producers inside the region, although the irregularly declining trend ininventories relative to total shipments was similar. In absolute terms, however, end-of-period inventorieswere higher in 2006 than in 2001 for mills within the specified region, but lower for mills outside thespecified region.19

20 Compiled from data submitted in response to Commission questionnaires. 21 ***.
III-15
Table III-7Rebar: U.S. producers’ end-of-period inventories, by mill location, 2001-06
Item 2001 2002 2003 2004 2005 2006
National:
Inventories (short tons) 601,153 617,597 441,762 619,492 533,925 597,345
Ratio to production (percent) 9.8 9.7 5.9 8.8 7.1 7.8
Ratio to U.S. shipments (percent) 10.0 10.1 5.9 9.2 7.2 8.0
Ratio to total shipments (percent) *** *** *** *** *** ***
Mills within the specified region:
Inventories (short tons) 366,847 428,665 325,883 426,645 366,923 414,605
Ratio to production (percent) 8.6 9.6 6.4 8.7 7.1 7.6
Ratio to U.S. shipments (percent) 8.5 9.8 6.3 8.9 7.0 7.7
Ratio to total shipments (percent) *** *** *** *** *** ***
Mills outside the specified region:
Inventories (short tons) 234,306 188,932 115,879 192,847 167,002 182,740
Ratio to production (percent) 12.4 10.0 4.8 8.9 7.1 8.0
Ratio to U.S. shipments (percent) 13.8 10.8 5.1 10.0 7.7 8.9
Ratio to total shipments (percent) *** *** *** *** *** ***
Source: Compiled from data submitted in response to Commission questionnaires.
U.S. PRODUCERS’ IMPORTS AND PURCHASES
U.S. producers did not import rebar from the subject countries during the period of review. ***. ***. The following tabulation shows nonsubject imports by U.S. producers during 2001-06:20
Item 2001 2002 2003 2004 2005 2006
***’s imports of rebar from nonsubjectsources (short tons) *** *** *** *** *** ***
***’s imports of rebar from nonsubjectsources (short tons) *** *** *** *** *** ***
U.S. producers did not have any reported purchases from other U.S. producers or U.S. importers. A subsidiary of ***, purchased rebar from ***21 and ***. It also purchased rebar from *** during 2001-06.

22 ***. 23 ***. 24 ***.
III-16
U.S. PRODUCERS’ EMPLOYMENT, WAGES, AND PRODUCTIVITY
Table III-8 provides data on U.S. rebar producers’ production and related workers. On a nationallevel, between 2001 and 2006 the number of production and related workers and their hours workedremained relatively stable (but with rising hourly wages), while productivity made large gains and unitlabor costs increased slightly. The increase in the number of workers in the national rebar industry wasattributable to the producers within the specified region. Productivity was higher inside the region, whilehourly wages and unit labor costs were higher outside the region.
Despite the overall gain of employment in the industry, *** lost almost *** workers between2001 and 2002, as production declined, and the workers were only partially reinstated as productionincreased during the remainder of the period. ***.22
Within the hourly wage rates for the overall industry there was a wide variation among firms,with some firms, mostly in the South, consistently lower (for example, ***), and some plants in the Westconsistently higher (for example, ***). Within an individual plant there was sometimes a wide variationacross years, such as with ***’s hourly wages, which went from $*** in 2001 to $*** in 2006. ***.23
The variation in productivity can be fairly large within corporate entities, for example between***, at the very low end of *** to *** short tons per 1,000 hours, and ***, at the very high end of around*** short tons per 1,000 hours. The explanation for the disparity is that ***.24

III-17
Table III-8Rebar: Average number of production-and-related workers, hours worked, wages paid to suchworkers, hourly wages, productivity, and unit labor costs, by mill location, 2001-06
Item 2001 2002 2003 2004 2005 2006
National:
PRWs (number) 3,967 3,827 3,897 3,719 3,909 4,066
Hours worked (1,000) 8,438 8,093 8,938 8,149 8,390 8,650
Wages paid ($1,000) 211,855 215,541 237,579 238,024 265,621 284,103
Hourly wages $25.11 $26.63 $26.58 $29.21 $31.66 $32.85
Productivity (tons per 1,000 hours) 728.5 785.1 839.3 868.3 898.9 890.8
Unit labor costs (per short ton) $34.47 $33.92 $31.67 $33.64 $35.22 $36.87
Mills within the specified region:
PRWs (number) 2,635 2,609 2,590 2,482 2,593 2,739
Hours worked (1,000) 5,617 5,559 5,905 5,632 5,611 6,052
Wages paid ($1,000) 134,824 139,834 150,379 154,854 165,826 184,669
Hourly wages $24.00 $25.15 $25.47 $27.50 $29.55 $30.52
Productivity (tons per 1,000 hours) 757.1 804.6 862.0 869.6 926.0 896.7
Unit labor costs (per short ton) $31.70 $31.26 $29.54 $31.62 $31.92 $34.03
Mills outside the specified region:
PRWs (number) 1,332 1,218 1,307 1,237 1,316 1,327
Hours worked (1,000) 2,821 2,534 3,033 2,517 2,779 2,598
Wages paid ($1,000) 77,031 75,707 87,200 83,170 99,795 99,434
Hourly wages $27.31 $29.88 $28.75 $33.04 $35.91 $38.27
Productivity (tons per 1,000 hours) 671.5 742.4 795.0 865.5 844.2 877.1
Unit labor costs (per short ton) $40.66 $40.24 $36.16 $38.18 $42.54 $43.63
Source: Compiled from data submitted in response to Commission questionnaires.

25 An exception was the Gerdau mill in Sand Springs, OK, which reported fiscal years ending April 30. ***. Chaparral reported for fiscal years ending May 31. Cascade and CMC reported for fiscal years ending August 31. Border Steel reported for fiscal years ending September 30. TAMCO reported for fiscal years ending November 30. SDI reported on a calendar-year basis. 26 Mittal announced its intention to acquire Border Steel (as part of Sicarsta) from Grupo Villacero on December20, 2006. Event Brief of Arcelor Mittal acquires Sicarsta, the leading Mexican long steel producer – ConferenceCall – Final, Regional Business News, December 20, 2006. The purchase was subsequently finalized on April 20,2007. Arcelor Mittal Reports First Quarter 2007 Results, Mittal Press Release, May 16, 2007. 27 ***. ***. Letter from Wiley Rein on behalf of CMC, March 6, 2007. ***. Letter from Wiley Rein on behalfof Nucor, March 8, 2007. 28 At the Commission’s hearing on May 10, 2007, Commissioner Lane requested that the U.S. industry provide its2007 operating income. Pursuant to this request, operating income and related financial information were reportedfor activity inside the region and outside the region; interim 2007 activity inside the region reflecting CMC (allmills), Gerdau (all mills), and Nucor (all mills) and activity outside the region reflecting Cascade, Gerdau (all mills),Nucor (all mills), and TAMCO. May 24, 2007 posthearing submission by Wiley Rein. The financial results forJanuary-April 2007 indicate that, while some mills reported lower absolute operating income in the first four monthsof 2007 compared to the first four months of 2006, most mills reported higher absolute operating income in January-April 2007. Despite the increase in absolute operating income in January-April 2007 compared to January-April2006, operating income as a percent of sales was marginally lower: inside the region (*** percent to *** percent);outside the region (*** percent to *** percent); and for the U.S. industry as a whole (*** percent to *** percent). While profitability by month was not reported, accompanying financial information showed that April 2007sales volume and value generally declined compared to both April 2006 and March 2007. In contrast, April 2007average sales value was higher compared to April 2006 and March 2007. ***. ***. For the overall U.S. industryApril 2007 sales volume and value declined *** percent and *** percent, respectively, compared to April 2006 and*** percent and *** percent, respectively, compared to March 2007. Average unit sales value for the overallindustry in April 2007 was *** and *** percent higher, respectively compared to April 2006 and March 2007.
III-18
FINANCIAL EXPERIENCE OF U.S. PRODUCERS
Background
This section of the report presents the financial results of 25 U.S. mills producing rebar: 18 millslocated within the specified region and seven located outside the specified region. All U.S. producersreported their financial results on the basis of U.S. Generally Accepted Accounting Principles (“GAAP”). Gerdau and Nucor both reported financial results for calendar-year periods, while the majority of otherU.S. producers reported for fiscal years.25
As discussed in detail in the beginning of Part III, the U.S. rebar industry has undergonesubstantial consolidation during the period. Mills are identified in the following tables according to theirownership at the end of the current review period.26
The majority of overall activity represents commercial sales, but also includes not insubstantialtransfers as well as a small amount of internal consumption.27
Rebar Operations by U.S. Mills Throughout the United States
Table III-9 presents the total rebar operations of all U.S. producers. Aggregated company-specific financial information for selected items is presented in table III-10. Table III-11 presents avariance analysis of the financial results of total U.S. rebar operations.
As shown in table III-9, overall operating income margins declined from 2001 through 2003 andthen improved substantially from 2004 through 2006.28 While overall rebar sales volume increased

III-19
Table III-9Rebar: Results of all U.S. producers’ operations, 2001-06
Item
Calendar and fiscal year
2001 2002 2003 2004 2005 2006
Quantity (short tons)
Commercial sales *** *** *** *** *** ***
Internal consumption *** *** *** *** *** ***
Transfers *** *** *** *** *** ***
Total net sales 6,190,355 6,338,939 7,615,292 7,016,005 7,533,213 7,742,037
Value ($1,000)
Commercial sales *** *** *** *** *** ***
Internal consumption *** *** *** *** *** ***
Transfers *** *** *** *** *** ***
Total net sales 1,657,996 1,654,343 2,137,695 3,029,572 3,531,181 4,006,813
Raw material 626,462 685,289 992,219 1,476,938 1,580,740 1,764,607
Direct labor 180,157 185,206 214,246 208,856 235,796 250,471
Other factory costs 648,691 632,602 740,501 712,967 900,981 950,120
Total cost of goods sold 1,455,311 1,503,097 1,946,966 2,398,760 2,717,517 2,965,198
Gross profit or (loss) 202,685 151,246 190,729 630,812 813,665 1,041,615
SG&A expenses 92,777 84,938 125,026 164,402 192,145 213,854
Operating income or (loss) 109,908 66,308 65,703 466,410 621,520 827,760
Interest expense 53,046 38,174 36,013 32,321 25,950 22,539
Other expenses 11,042 4,179 6,203 6,333 6,616 8,011
CDSOA funds received 3 803 1,181 892 719 2,831
Other income items 6,127 7,524 4,864 4,906 21,940 26,803
Net income or (loss) 51,950 32,282 29,531 433,554 611,613 826,845
Depr. and amortization (incl. above) 96,036 89,318 101,084 99,507 105,398 106,395
Estimated cash flow 147,985 121,600 130,616 533,062 717,010 933,240
Ratio to net sales (percent)
Raw material 37.8 41.4 46.4 48.8 44.8 44.0
Direct labor 10.9 11.2 10.0 6.9 6.7 6.3
Other factory costs 39.1 38.2 34.6 23.5 25.5 23.7
Total cost of goods sold 87.8 90.9 91.1 79.2 77.0 74.0
Gross profit 12.2 9.1 8.9 20.8 23.0 26.0
SG&A expenses 5.6 5.1 5.8 5.4 5.4 5.3
Operating income or (loss) 6.6 4.0 3.1 15.4 17.6 20.7
Net income or (loss) 3.1 2.0 1.4 14.3 17.3 20.6
Table continued on the following page.

III-20
Table III-9--ContinuedRebar: Results of all U.S. producers’ operations, 2001-06
Item
Calendar and fiscal year
2001 2002 2003 2004 2005 2006
Value (dollars per short ton)
Commercial sales *** *** *** *** *** ***
Internal consumption *** *** *** *** *** ***
Transfers *** *** *** *** *** ***
Net sales 268 261 281 432 469 518
Raw material 101 108 130 211 210 228
Direct labor 29 29 28 30 31 32
Other factory costs 105 100 97 102 120 123
Total cost of goods sold 235 237 256 342 361 383
Gross profit or (loss) 33 24 25 90 108 135
SG&A expenses 15 13 16 23 26 28
Operating income or (loss) 18 10 9 66 83 107
Number of mills reporting
Data 24 24 24 24 25 25
Operating losses 8 9 10 2 2 2
Source: Compiled from data submitted in response to Commission questionnaires.
Table III-10Rebar: Results of all U.S. producers’ operations, by firms, 2001-06
* * * * * * *

III-21
Table III-11Rebar: Variance analysis of all U.S. producers’ operations, 2001-06
Item
Calendar and fiscal year
2001-06 2001-02 2002-03 2003-04 2004-05 2005-06
Value ($1,000)
Total net sales:
Price variance 1,933,222 (43,448) 150,247 1,060,104 278,275 377,746
Volume variance 415,595 39,796 333,104 (168,226) 223,335 97,886
Total net sales variance 2,348,817 (3,652) 483,351 891,877 501,609 475,631
Cost of sales:
Raw material:
Cost variance (981,115) (43,791) (168,946) (562,801) 5,075 (140,048)
Volume variance (157,030) (15,037) (137,984) 78,083 (108,877) (43,819)
Net raw material variance (1,138,14 (58,827) (306,930) (484,719) (103,802) (183,867)
Direct labor:
Cost variance (25,156) (724) 8,252 (11,470) (11,544) (8,139)
Volume variance (45,158) (4,324) (37,291) 16,860 (15,397) (6,536)
Net direct labor variance (70,314) (5,049) (29,040) 5,390 (26,940) (14,675)
Other factory costs:
Cost variance (138,827) 31,660 19,476 (30,739) (135,455) (24,164)
Volume variance (162,602) (15,570) (127,375) 58,274 (52,559) (24,976)
Net other factory cost variance (301,429) 16,089 (107,900) 27,535 (188,014) (49,140)
Net cost of sales:
Cost variance (1,145,09 (12,856) (141,219) (605,011) (141,924) (172,351)
Volume variance (364,790) (34,931) (302,650) 153,217 (176,833) (75,331)
Total net cost of sales variance (1,509,88 (47,787) (443,869) (451,794) (318,756) (247,682)
Gross profit variance 838,929 (51,439) 39,482 440,083 182,853 227,950
SG&A expenses:
Expense variance (97,821) 10,066 (22,986) (49,215) (15,624) (16,383)
Volume variance (23,256) (2,227) (17,102) 9,839 (12,119) (5,326)
Total SG&A variance (121,077) 7,839 (40,088) (39,376) (27,744) (21,709)
Operating income variance 717,853 (43,600) (606) 400,708 155,110 206,241
Summarized as:
Price variance 1,933,222 (43,448) 150,247 1,060,104 278,275 377,746
Net cost/expense variance (1,242,91 (2,789) (164,204) (654,226) (157,548) (188,734)
Net volume variance 27,550 2,638 13,351 (5,170) 34,383 17,229
Source: Compiled from data submitted in response to Commission questionnaires.

29 Letter from Wiley Rein on behalf of Gerdau, March 7, 2007. 30 Letter from Wiley Rein on behalf of Cascade March 7, 2007. 31 Letter from Wiley Rein on behalf of TAMCO, March 6, 2007. 32 As shown in table III-9, the small decline in overall average raw material costs in 2005 is generally consistentwith the trend of scrap prices during the second half of the period (see, e.g., Cyclical spot-market pricing peak hascome and gone, Purchasing, November 2, 2006, p. 32B). Among other things, the pattern of company-specificaverage raw material costs shown in table III-10 reflects different inventory valuation methods. Nucor’s use ofLIFO inventory valuation (Nucor 2005 annual report, p. 22), for example, is consistent with a pattern of period-to-period average ***. 33 Ferrous scrap prices have reportedly continued to increase in 2007. In February, American Metal Marketreported that “{f}or the second consecutive month, prices for merchant and reinforcing bar products are poised toincrease to offset rising scrap costs. Nucor Corp., Charlotte, N.C., the largest producer of rebar and merchant barproducts in the United States, is raising its scrap surcharge by $40 per ton but lowering its base prices by $10 perton, resulting in a $30 net increase effective with March 1 {2007} shipments. Last month, Nucor raised its surcharge$25 per ton but reduced base prices by $10 per ton, resulting in a $15 net increase for February.” Nucor boosting barprices $30/T for March shipments, American Metal Market, February 19, 2007, p. 16. An increase in net rebarprices was also announced in March. According to American Metal Market, “{r}ising ferrous scrap costs arepushing prices for merchant bar and reinforcing bar higher. Nucor Corp., Charlotte. N.C. led the way with theannouncement of what amounts to a $55-a-short-ton ($2.75-per-hundredweight) increase on rebar and merchant barproducts effective with April 1 shipments. Nucor is achieving the increase by lifting its scrap surcharge by $70 a tonand simultaneously reducing base prices by $15 a ton. CMC Steel Group, a Seguin, Texas-based division ofCommercial Metals Co followed the Nucor move immediately with a $55-a-ton hike . . .” Rising scrap costs pushbar product prices higher, American Metal Market, March 19, 2007, p. 16. A subsequent American Metal Marketarticle noted that “ {p}rices for shredded scrap in the United States have moved steadily higher since December,climbing a total of about $140 per ton to around $360. U.S. rebar producers have responded by increasing prices byabout $100 per ton over the past three months, but U.S. prices nevertheless remain well below prices in othermarkets.” Rebar World, American Metal Market, March 26, 2007, p. 7. 34 Nucor 2006 Annual Report, p. 24. According to Nucor its “{t}otal energy costs per ton were flat from 2003 to2004 as higher natural gas prices of approximately 8% were offset by increased production efficiency at our steelmills. Nucor 2005 Annual Report, p. 24. 35 Nucor 2006 Annual Report, p. 13.
III-22
during the review period, higher total revenue was primarily the result of positive price variances, asshown in the sales section of the variance analysis (see table III-11).
In the second half of the period, both average revenue and average cost of goods sold (“COGS”)increased sharply. When asked to explain this trend, U.S. producers described the same underlyingfactors. For example, Gerdau stated that ***.29 Similarly, Cascade stated that ***.30 TAMCO stated that***.31
As shown in table III-10, company-specific average raw material costs, while reflecting the samebasic pattern, did not move in lock step. In 2005, for example, *** reported *** overall average rawmaterial costs compared to 2004, while the other companies reported *** average raw material costs.32 In2006 compared to 2005, higher average raw material costs were reported by the majority of companies.33
The increase in average raw material costs in the second half of the period was also accompaniedby higher average energy costs. Nucor stated in its 2006 annual report that “{t}otal energy costsincreased approximately $7 per ton from 2004 to 2005 due to increases of 31% and 19%, respectively, inthe prices of natural gas and electricity.”34 In contrast, “{t}otal energy costs decreased approximately $1per ton from 2005 to 2006 as natural gas prices decreased approximately 10% and electricity pricesincreased approximately 2%.”35 Direct energy costs for producing rebar would generally be a componentof other factory costs which, as shown in table III-9, increased sharply on an average unit basis in 2005compared to 2004 and again in 2006 but by a somewhat smaller amount. Fuel costs, which are reflected

36 Nucor’s unit freight costs reportedly increased 12 percent between 2004 and 2005 and another 8 percentbetween 2005 to 2006. These increases were attributed primarily to higher fuel costs. Nucor 2006 Annual Report,pp. 22 and 24. Similarly, in its 2005 annual report, Gerdau also noted the impact of higher fuel costs on overall costof goods sold. Gerdau 2005 Annual Report, p. 13. 37 For purposes of this report metal spread represents the difference between average sales value and average rawmaterial cost. It should be noted, however, that metal spread is defined somewhat differently by at least one rebarproducer; i.e., Gerdau describes metal spread as an indicator which compares “ . . . current selling prices with thecurrent price of scrap melted in production and does not consider the timing effect of scrap costs for products sold.” Gerdau 2005 Annual Report, p. 6 and p. 13. 38 Table VI-16, p. VI-22 of original staff report. 39 This pattern appears to be generally consistent with increased interest income associated with larger balances ofcash, cash equivalents, and short term investments in the second half of the period. For example and with respect tonet interest income reported in its 2006 consolidated income statement, Nucor stated that from 2005 to 2006“{g}ross interest income more than doubled due to increases in average cash equivalents and short-term investmentsand, to a lesser extent, due to increases in average interest rates. Gross interest expense increased approximately10% primarily due to increased average interest rates.” Nucor 2006 Annual Report, p. 23. 40 While the Commission’s questionnaire requested R&D expenses, no company reported such expenses. 41 *** did not report capital expenditures.
III-23
in both COGS and selling, general, and administrative (“SG&A”) expenses, also increased during theperiod.36 Higher average revenue in the second half of the period resulted in notably higher levels ofprofitability. As shown in the variance analysis, the majority of the increase in operating income between2003 and 2004 was the result of an overall positive price variance which offset and exceededcorresponding negative cost/expense variances. Subsequent positive operating income variancesbetween 2004 and 2005 and between 2005 and 2006, although smaller, were due to the same factors. This overall positive difference between average sales value and average costs is embodied primarily inthe “metal spread”37 which, as shown in table III-10, declined from 2001 through 2003 and then rose in2004 and subsequent periods. In the second half of the period, these substantially higher metal spreadsare reflected in lower COGS-to-sales ratios and higher gross profit margins.
During the period overall SG&A expenses as a share of sales ranged from 5.1 percent to 5.8percent, which is similar to the range of SG&A expense ratios reported during the original investigation: 4.7 percent to 5.9 percent.38 Notable trends in individual mill SG&A expenses are discussed in theregion-specific sections below.
As shown in table III-9, other income increased notably in 2005 and 2006. In addition toincreases in other income reported by two particular mills, as discussed in the region-specific sectionbelow, most U.S. mills also reported generally higher other income in the second half of the period.39
Capital Expenditures, Assets, and Return on Investment of the U.S. Industry
The reported values of capital expenditures, assets, and calculated return on investment of all U.S.producers of rebar are shown in table III-12.40
For the period as a whole, the *** mills accounted for the largest share of cumulative capitalexpenditures: ***.41
As shown in table III-12, the majority of overall capital expenditures occurred in the second halfof the period which corresponds with substantially higher levels of estimated cash flow from operationsand increased return on investment. Notable capital expenditures and return on investment by particularmills are described in the region-specific sections below.

III-24
Table III-12Rebar: Capital expenditures, assets, and return on investment of all U.S. producers, 2001-06
Item
Calendar and fiscal year
2001 2002 2003 2004 2005 2006
Capital expenditures: Value ($1,000)
Border Steel *** *** *** *** *** ***
Cascade *** *** *** *** *** ***
Chaparral *** *** *** *** *** ***
CMC *** *** *** *** *** ***
Gerdau *** *** *** *** *** ***
Nucor *** *** *** *** *** ***
SDI *** *** *** *** *** ***
TAMCO *** *** *** *** *** ***
Total 61,609 43,782 70,159 84,896 128,049 146,048
Assets: Value ($1,000)
Border Steel *** *** *** *** *** ***
Cascade *** *** *** *** *** ***
Chaparral *** *** *** *** *** ***
CMC *** *** *** *** *** ***
Gerdau *** *** *** *** *** ***
Nucor *** *** *** *** *** ***
SDI *** *** *** *** *** ***
TAMCO *** *** *** *** *** ***
Total, U.S. producers 1,282,055 1,397,254 1,500,871 1,698,999 2,115,517 2,077,430
Return on investment: Ratio of operating income or (loss) to assets (percent)
Border Steel *** *** *** *** *** ***
Cascade *** *** *** *** *** ***
Chaparral *** *** *** *** *** ***
CMC *** *** *** *** *** ***
Gerdau *** *** *** *** *** ***
Nucor *** *** *** *** *** ***
SDI *** *** *** *** *** ***
TAMCO *** *** *** *** *** ***
Average, U.S. producers 8.6 4.7 4.4 27.5 29.4 39.8 1 Not applicable. SDI did not have rebar operations from 2001 through 2004.
Source: Compiled from data submitted in response to Commission questionnaires.

42 For purposes of these reviews, the specified region represents the following 30 States: Alabama, Arkansas,Connecticut, Delaware, Florida, Georgia, Illinois, Indiana, Kentucky, Louisiana, Maine, Maryland, Massachusetts,Michigan, Mississippi, Missouri, New Hampshire, New Jersey, New York, North Carolina, Ohio, Pennsylvania,Rhode Island, South Carolina, Tennessee, Texas, Vermont, Virginia, West Virginia and Wisconsin, as well as PuertoRico and the District of Columbia. 43 Appendix F ranks by operating income margin U.S. producer mill operations within and outside the specifiedregion. 44 According to CMC, ***. Letter from Wiley Rein on behalf of CMC, March 6, 2007. According to CMC’s2006 10-K, “{t}he Arkansas minimill primarily manufactures metal fence post stock, small diameter reinforcing bar,sign posts and bed frame angles with some flats, angles and squares.” CMC 2006 10-K, p. 5. 45 According to Nucor ***. Letter from Wiley Rein on behalf of Nucor, March 27, 2007. 46 Gerdau stated that ***. Letter from Wiley Rein on behalf of Gerdau, March 27, 2007. 47 ***. Letter from Wiley Rein on behalf of Nucor, March 27, 2007. 48 Letter from Wiley Rein on behalf of Gerdau, March 7, 2007. It should be noted that, as shown in table III-14,***. 49 Chaparral’s 2006 10-K states that “ . . . our steel bar products include specialty bar products and, to a lesserextent, reinforcing bar.” Chaparral 2006 10-K, p. 3. 50 According to SDI’s 2004 Annual Report, “{d}uring 2004, the first year of operation under Steel Dynamicsmanagement, the Bar Products Division shipped 318,000 tons of special-bar-quality (SBQ) and merchant-bar-quality(MBQ) round bars. The new division became profitable in its fourth month of operation. It achieved a return oninvestment of over 25 percent in 2004 and by years end had achieved a capacity utilization rate of over 75 percent.” SDI 2004 annual report, p. 1. 51 Direct comparisons of average COGS by company and/or mill are problematic due to differences in overallproduct focus (e.g., merchant bar versus rebar), as well rebar product mix. ***. Nucor mill responses to questionsII-13 and II-14 of U.S. producer questionnaire.
III-25
Rebar Operations by U.S. Mills Within the Specified Region
Table III-13 presents the financial results of U.S. producers’ rebar operations within the specifiedregion.42 Corresponding company-specific financial information for selected items is presented in tableIII-14. Table III-15 presents a variance analysis of the financial results within the region.43
Operations within the region accounted for slightly more than two-thirds of total U.S. rebaroperations on a quantity basis. As shown in table III-14, period-to-period changes in mill volume were insome instances *** different compared to the overall trend; e.g., the ***.44
While the majority of mills inside the region reported higher sales volume in 2006 compared to2005, ***. According to ***.
***.45 46 For most of the period *** COGS-to-sales ratio inside the specified region. However, as shown
in table III-14, ***; i.e., ***. ***.47 *** with respect to the larger volume producers, *** COGS to sales ratios for most of the period
with the *** mill generally ***. According to ***.48
Although Chaparral *** in terms of its COGS-to-sales ratio, this is generally consistent with thefact that rebar represents a *** portion of Chaparral’s overall activity.49 Similarly, SDI’s bar division is***.50 51

III-26
Table III-13Rebar: Results of operations of U.S. producers within the specified region, 2001-06
Item
Calendar and fiscal year
2001 2002 2003 2004 2005 2006
Quantity (short tons)
Commercial sales *** *** *** *** *** ***
Internal consumption *** *** *** *** *** ***
Transfers *** *** *** *** *** ***
Total net sales 4,314,344 4,412,317 5,130,869 4,914,478 5,161,392 5,478,984
Value ($1,000)
Commercial sales *** *** *** *** *** ***
Internal consumption *** *** *** *** *** ***
Transfers *** *** *** *** *** ***
Total net sales 1,137,102 1,144,308 1,414,388 2,074,882 2,365,696 2,789,490
Raw material 430,455 476,266 660,281 1,019,128 1,053,637 1,233,950
Direct labor 116,007 121,587 139,216 139,403 150,125 167,141
Other factory costs 463,344 441,934 499,683 510,177 621,765 674,552
Total cost of goods sold 1,009,807 1,039,787 1,299,180 1,668,707 1,825,527 2,075,643
Gross profit or (loss) 127,295 104,521 115,208 406,175 540,170 713,847
SG&A expenses 74,139 67,258 104,823 141,204 159,781 185,135
Operating income or (loss) 53,156 37,263 10,385 264,971 380,389 528,712
Interest expense 42,127 28,920 28,439 26,908 21,192 18,678
Other expenses 6,281 4,154 5,180 6,333 6,610 7,824
CDSOA funds received 3 803 1,101 869 712 1,975
Other income items 5,777 5,962 2,814 3,754 21,333 24,626
Net income or (loss) 10,528 10,954 (19,319) 236,354 374,632 528,811
Depr. and amortization (incl. above) 66,086 60,115 72,058 72,515 78,600 81,087
Estimated cash flow 76,613 71,069 52,739 308,869 453,231 609,898
Ratio to net sales (percent)
Raw material 37.9 41.6 46.7 49.1 44.5 44.2
Direct labor 10.2 10.6 9.8 6.7 6.3 6.0
Other factory costs 40.7 38.6 35.3 24.6 26.3 24.2
Total cost of goods sold 88.8 90.9 91.9 80.4 77.2 74.4
Gross profit 11.2 9.1 8.1 19.6 22.8 25.6
SG&A expenses 6.5 5.9 7.4 6.8 6.8 6.6
Operating income or (loss) 4.7 3.3 0.7 12.8 16.1 19.0
Net income or (loss) 0.9 1.0 (1.4) 11.4 15.8 19.0
Table continued on the following page.

III-27
Table III-13--ContinuedRebar: Results of operations of U.S. producers within the specified region, 2001-06
Item
Calendar and fiscal year
2001 2002 2003 2004 2005 2006
Value (dollars per short ton)
Commercial sales *** *** *** *** *** ***
Internal consumption *** *** *** *** *** ***
Transfers *** *** *** *** *** ***
Net sales 264 259 276 422 458 509
Raw material 100 108 129 207 204 225
Direct labor 27 28 27 28 29 31
Other factory costs 107 100 97 104 120 123
Total cost of goods sold 234 236 253 340 354 379
Gross profit or (loss) 30 24 22 83 105 130
SG&A expenses 17 15 20 29 31 34
Operating income or (loss) 12 8 2 54 74 96
Number of mills reporting
Data 17 17 17 17 18 18
Operating losses 6 8 9 2 1 2
Source: Compiled from data submitted in response to Commission questionnaires.
Table III-14Rebar: Results of operations, by firms, of U.S. producers within the specified region, 2001-06
* * * * * * *

III-28
Table III-15Rebar: Variance analysis of operations of U.S. producers within the specified region, 2001-06
Item
Calendar and fiscal year
2001-06 2001-02 2002-03 2003-04 2004-05 2005-06
Value ($1,000)
Total net sales:
Price variance 1,345,432 (18,616) 83,728 720,145 186,568 278,227
Volume variance 306,956 25,822 186,352 (59,651) 104,247 145,567
Total net sales variance 1,652,388 7,206 270,080 660,494 290,814 423,794
Cost of sales:
Raw material:
Cost variance (687,295) (36,036) (106,454) (386,694) 16,694 (115,480)
Volume variance (116,200) (9,775) (77,561) 27,847 (51,203) (64,833)
Net raw material variance (803,495) (45,811) (184,015) (358,847) (34,509) (180,313)
Direct labor:
Cost variance (19,818) (2,945) 2,172 (6,059) (3,719) (7,778)
Volume variance (31,316) (2,634) (19,801) 5,871 (7,004) (9,238)
Net direct labor variance (51,134) (5,580) (17,629) (187) (10,722) (17,016)
Other factory costs:
Cost variance (86,130) 31,932 14,220 (31,567) (85,955) (14,529)
Volume variance (125,078) (10,522) (71,970) 21,074 (25,632) (38,259)
Net other factory cost variance (211,208) 21,410 (57,750) (10,493) (111,588) (52,788)
Net cost of sales:
Cost variance (793,244) (7,049) (90,062) (424,319) (72,980) (137,788)
Volume variance (272,593) (22,931) (169,331) 54,792 (83,839) (112,329)
Total net cost of sales (1,065,83 (29,981) (259,393) (369,527) (156,819) (250,117)
Gross profit variance 586,552 (22,774) 10,687 290,967 133,995 173,677
SG&A expenses:
Expense variance (90,982) 8,565 (26,612) (40,801) (11,483) (15,522)
Volume variance (20,014) (1,684) (10,953) 4,421 (7,094) (9,832)
Total SG&A variance (110,996) 6,881 (37,565) (36,381) (18,578) (25,354)
Operating income variance 475,556 (15,893) (26,878) 254,586 115,417 148,323
Summarized as:
Price variance 1,345,432 (18,616) 83,728 720,145 186,568 278,227
Net cost/expense variance (884,226) 1,516 (116,674) (465,121) (84,463) (153,310)
Net volume variance 14,349 1,207 6,068 (438) 13,313 23,406
Source: Compiled from data submitted in response to Commission questionnaires.

52 With respect to the ***. Letter from Wiley Rein on behalf of Nucor, March 27, 2007. In contrast, the increase in the ***. Letter from Wiley Rein on behalf of Nucor, March 14, 2007. 53 Letter from Wiley Rein on behalf of CMC, March 6, 2007. ***. ***. According to the CMC 2004 10-K, the CMC Seguin, TX, mill’s overall lower operating profitability in2004 “. . . was due largely to the failure of {the CMC Seguin, TX mill’s} primary transformer on May 31, 2004,with the subsequent failure of the principal back up transformer in June 2004 and accruals related to a sales tax auditand unclaimed property. Although another replacement transformer was installed, it had a lower capacity, resultingin lower production than we had planned. In order to meet our sales commitments to our SMI-Texas customers inthe fourth quarter of 2004, we purchased and rolled billets from other affiliated and unrelated minimills at highercosts.” CMC 2004 10-K, p. 26. 54 Letter from Wiley Rein on behalf of CMC, March 6, 2007. ***. 55 While the Commission’s questionnaire requested R&D expenses, no company inside the region reported suchexpenses. 56 ***. Letter from Wiley Rein on behalf of Gerdau, March 7, 2007. 57 Letter from Wiley Rein on behalf of Nucor, March 8, 2007. 58 Letter from Wiley Rein on behalf of CMC, March 6, 2007. 59 E-mail from ***, April 3, 2007.
III-29
With respect to changes in profitability during the period, while the ***’s absolute level ofoperating income was higher in the second half of the period, its 2006 operating profit margin was veryclose to its 2001 operating profit margin. The majority of other mills, in contrast, reported higher levelsof absolute operating income and higher operating profit margins at the end of the period compared to thebeginning. In addition to the previously noted 2006 *** in relative SG&A expenses from 2003 through2006. ***, although reporting a similar pattern of ***, generated improved financial results in the secondhalf of the period.52
Notwithstanding the *** in financial performance at the end of the period, the *** reported, inabsolute terms and as a percent of sales, the highest level of company-specific operating profit in 2006inside the specified region.
As shown in table III-13, the large increase in other income at the end of the period ***.53 ***.54 As noted in the overall U.S. industry section above, other income also appears to have generally
increased in the second half of the period due to interest income associated with larger balances of cash,cash equivalents, and short-term investments.
Capital Expenditures, Assets, and Return On Investment of U.S. Producers of Rebar Within the Specified Region
The reported value of capital expenditures, assets, and calculated return on investment of U.S.producers in the specified region are shown in table III-16.55
While representing a number of different items, capital expenditures at the ***.56 The majority of the ***. In contrast with the overall pattern of capital expenditures, *** reported
*** capital expenditures in the middle of the review period. According to the company, the ***.57 The *** CMC mill to report a *** in the level of second half capital expenditures was ***.
According to CMC, the ***.58 Border Steel reported a relatively *** at the end of the period. According to Border Steel, ***.59

III-30
Table III-16Rebar: Capital expenditures, assets, and return on investment of U.S. producers within the specified region,2001-06
Item
Calendar and fiscal year
2001 2002 2003 2004 2005 2006
Capital expenditures: Value ($1,000)
Border Steel, El Paso, TX *** *** *** *** *** ***
Chaparral, Midlothian, TX *** *** *** *** *** ***
CMC, Magnolia, AR *** *** *** *** *** ***
CMC, Cayce, SC *** *** *** *** *** ***
CMC, Seguin, TX *** *** *** *** *** ***
CMC subtotal *** *** *** *** *** ***
Gerdau, Jacksonville, FL *** *** *** *** *** ***
Gerdau, Charlotte, NC *** *** *** *** *** ***
Gerdau, Sayerville, NJ *** *** *** *** *** ***
Gerdau, Jackson, TN *** *** *** *** *** ***
Gerdau, Knoxville, TN *** *** *** *** *** ***
Gerdau subtotal *** *** *** *** *** ***
Nucor, Birmingham, AL *** *** *** *** *** ***
Nucor, Kankakee, IL *** *** *** *** *** ***
Nucor, Auburn, NY *** *** *** *** *** ***
Nucor, Marion, OH *** *** *** *** *** ***
Nucor, Jackson, MS *** *** *** *** *** ***
Nucor, Darlington, SC *** *** *** *** *** ***
Nucor, Jewett, TX *** *** *** *** *** ***
Nucor subtotal *** *** *** *** *** ***
SDI, Pittsboro, IN *** *** *** *** *** ***
Total 41,378 37,686 61,872 69,110 108,742 114,695
Table continued on the following page.

III-31
Table III-16--ContinuedRebar: Capital expenditures, assets, and return on investment of U.S. producers within the specified region,2001-06
Item
Calendar and fiscal year
2001 2002 2003 2004 2005 2006
Assets: Value ($1,000)
Border Steel, El Paso, TX *** *** *** *** *** ***
Chaparral, Midlothian, TX *** *** *** *** *** ***
CMC, Magnolia, AR *** *** *** *** *** ***
CMC, Cayce, SC *** *** *** *** *** ***
CMC, Seguin, TX *** *** *** *** *** ***
CMC subtotal *** *** *** *** *** ***
Gerdau, Jacksonville, FL *** *** *** *** *** ***
Gerdau, Charlotte, NC *** *** *** *** *** ***
Gerdau, Sayerville, NJ *** *** *** *** *** ***
Gerdau, Jackson, TN *** *** *** *** *** ***
Gerdau, Knoxville, TN *** *** *** *** *** ***
Gerdau subtotal *** *** *** *** *** ***
Nucor, Birmingham, AL *** *** *** *** *** ***
Nucor, Kankakee, IL *** *** *** *** *** ***
Nucor, Auburn, NY *** *** *** *** *** ***
Nucor, Marion, OH *** *** *** *** *** ***
Nucor, Jackson, MS *** *** *** *** *** ***
Nucor, Darlington, SC *** *** *** *** *** ***
Nucor, Jewett, TX *** *** *** *** *** ***
Nucor subtotal *** *** *** *** *** ***
SDI, Pittsboro, IN *** *** *** *** *** ***
Total 821,091 973,506 1,064,752 1,179,963 1,522,208 1,531,966
Table continued on the following page.

III-32
Table III-16--ContinuedRebar: Capital expenditures, assets, and return on investment of U.S. producers within the specified region,2001-06
Item
Calendar and fiscal year
2001 2002 2003 2004 2005 2006
Return on investment: Ratio of operating income or (loss) to assets (percent)
Border Steel, El Paso, TX *** *** *** *** *** ***
Chaparral, Midlothian, TX *** *** *** *** *** ***
CMC, Magnolia, AR *** *** *** *** *** ***
CMC, Cayce, SC *** *** *** *** *** ***
CMC, Seguin, TX *** *** *** *** *** ***
CMC subtotal *** *** *** *** *** ***
Gerdau, Jacksonville, FL *** *** *** *** *** ***
Gerdau, Charlotte, NC *** *** *** *** *** ***
Gerdau, Sayerville, NJ *** *** *** *** *** ***
Gerdau, Jackson, TN *** *** *** *** *** ***
Gerdau, Knoxville, TN *** *** *** *** *** ***
Gerdau subtotal *** *** *** *** *** ***
Nucor, Birmingham, AL *** *** *** *** *** ***
Nucor, Kankakee, IL *** *** *** *** *** ***
Nucor, Auburn, NY *** *** *** *** *** ***
Nucor, Marion, OH *** *** *** *** *** ***
Nucor, Jackson, MS *** *** *** *** *** ***
Nucor, Darlington, SC *** *** *** *** *** ***
Nucor, Jewett, TX *** *** *** *** *** ***
Nucor subtotal *** *** *** *** *** ***
SDI, Pittsboro, IN *** *** *** *** *** ***
Average 6.5 3.8 1.0 22.5 25.0 34.5
1 ***. 2 Not applicable. SDI did not have rebar operations from 2001 through 2004.
Source: Compiled from data submitted in response to Commission questionnaires.

60 Appendix F ranks by operating income margin U.S. producer mill operations within and outside the specifiedregion. 61 The mills outside the specified region reported a mixed pattern of volume change in 2006. ***. 62 Letter from Wiley Rein on behalf of Gerdau, March 7, 2007. 63 As shown in table II-1, U.S. producers outside the region reported a lower percentage of sales directly to endusers and a higher percentage of sales to distributors and distributor/end users. 64 Although much less pronounced, a pattern of lower SG&A expense ratios and higher operating profit outsidethe region was also generally present in the original investigation During the original investigation period (1998through 2000) SG&A expense ratios inside the specified region ranged from *** percent to *** percent compared toa range of *** percent to *** percent outside the region. Corresponding operating income margins inside thespecified region ranged from *** percent to *** percent and outside the region ranged from *** percent to ***percent. Table VI-1, p. VI-2 and Table VI-9, p. VI-15 of original staff report. 65 In response to a question regarding the ***. Letter from Wiley Rein on behalf of Gerdau, March 27, 2007.
III-33
Rebar Operations by U.S. Mills Outside the Specified Region
Table III-17 presents the financial results of U.S. producers’ rebar operations outside thespecified region. Corresponding company-specific financial information for selected items is presented intable III-18. Table III-19 presents a variance analysis of the financial results outside the specifiedregion.60
Operations outside the region accounted for slightly less than one-third of total U.S. rebaroperations on a quantity basis. Unlike operations within the specified region, the quantity of net salesoutside the region declined somewhat at the end of the period.61
Similar to operations within the specified region, operating results outside the specified regionimproved substantially in 2004. In contrast, however, the overall financial results outside the region donot reflect consistent year-to-year increases in 2004 through 2006 operating income margins. As shownin table III-18, *** reported 2005 operating income margins which were at about the same level as 2004,while *** reported declines in their operating income margins in 2005. While the ***. ***.
Along with *** in 2005, ***. In response to a question regarding these observed differences,Gerdau stated that ***.62
While overall operations inside and outside the region reflect similar patterns, operations outsidethe region consistently generated higher relative operating income margins. In part this is because, asshown in table III-18 compared to table III-14, in each year the average metal spread outside the regionwas higher than the average metal spread inside the region; the difference being somewhat larger in thesecond half of the period. Additionally, outside the region overall SG&A expense ratios wereconsistently lower which, to some extent, likely reflects differences in channels of distribution betweenthe two regions.63 64 The relative difference in SG&A expense ratios inside and outside the region is alsoaccounted for by several mills inside the region whose SG&A expenses *** during the period (seefootnote 52). As shown in table III-18, the SG&A expense ratio reported by ***.65

III-34
Table III-17Rebar: Results of operations of U.S. producers outside the specified region, 2001-06
Item
Calendar and fiscal year
2001 2002 2003 2004 2005 2006
Quantity (short tons)
Commercial sales *** *** *** *** *** ***
Internal consumption *** *** *** *** *** ***
Transfers *** *** *** *** *** ***
Total net sales 1,876,011 1,926,622 2,484,423 2,101,527 2,371,821 2,263,053
Value ($1,000)
Commercial sales *** *** *** *** *** ***
Internal consumption *** *** *** *** *** ***
Transfers *** *** *** *** *** ***
Total net sales 520,894 510,035 723,306 954,690 1,165,485 1,217,323
Raw material 196,007 209,023 331,938 457,810 527,103 530,657
Direct labor 64,150 63,619 75,030 69,453 85,671 83,330
Other factory costs 185,347 190,668 240,818 202,790 279,216 275,568
Total cost of goods sold 445,504 463,310 647,786 730,053 891,990 889,555
Gross profit or (loss) 75,390 46,725 75,520 224,637 273,495 327,768
SG&A expenses 18,638 17,680 20,203 23,198 32,364 28,719
Operating income or (loss) 56,752 29,045 55,317 201,439 241,131 299,049
Interest expense 10,919 9,254 7,574 5,413 4,758 3,861
Other expenses 4,761 25 1,023 0 6 187
CDSOA funds received 0 0 80 23 7 856
Other income items 350 1,562 2,050 1,152 607 2,177
Net income or (loss) 41,422 21,328 48,850 197,201 236,981 298,034
Depr. and amortization (incl. above) 29,950 29,203 29,026 26,992 26,798 25,308
Estimated cash flow 71,372 50,531 77,876 224,193 263,779 323,342
Ratio to net sales (percent)
Raw material 37.6 41.0 45.9 48.0 45.2 43.6
Direct labor 12.3 12.5 10.4 7.3 7.4 6.8
Other factory costs 35.6 37.4 33.3 21.2 24.0 22.6
Total cost of goods sold 85.5 90.8 89.6 76.5 76.5 73.1
Gross profit 14.5 9.2 10.4 23.5 23.5 26.9
SG&A expenses 3.6 3.5 2.8 2.4 2.8 2.4
Operating income or (loss) 10.9 5.7 7.6 21.1 20.7 24.6
Net income or (loss) 8.0 4.2 6.8 20.7 20.3 24.5
Table continued on the following page.

III-35
Table III-17--ContinuedRebar: Results of operations of U.S. producers outside the specified region, 2001-06
Item
Calendar and fiscal year
2001 2002 2003 2004 2005 2006
Value (dollars per short ton)
Commercial sales *** *** *** *** *** ***
Internal consumption *** *** *** *** *** ***
Transfers *** *** *** *** *** ***
Net sales 278 265 291 454 491 538
Raw material 104 108 134 218 222 234
Direct labor 34 33 30 33 36 37
Other factory costs 99 99 97 96 118 122
Total cost of goods sold 237 240 261 347 376 393
Gross profit or (loss) 40 24 30 107 115 145
SG&A expenses 10 9 8 11 14 13
Operating income or (loss) 30 15 22 96 102 132
Number of mills reporting
Data 7 7 7 7 7 7
Operating losses 2 1 1 0 1 0
Source: Compiled from data submitted in response to Commission questionnaires.
Table III-18Rebar: Results of operations, by firms, of U.S. producers outside the specified region, 2001-06
* * * * * * *

III-36
Table III-19Rebar: Variance analysis of operations of U.S. producers outside the specified region, 2001-06
Item
Calendar and fiscal year
2001-06 2001-02 2002-03 2003-04 2004-05 2005-06
Value ($1,000)
Total net sales:
Price variance 588,963 (24,911) 65,604 342,858 88,005 105,285
Volume variance 107,466 14,053 147,667 (111,475) 122,790 (53,447)
Total net sales variance 696,429 (10,859) 213,271 231,383 210,795 51,838
Cost of sales:
Raw material:
Cost variance (294,212) (7,728) (62,398) (177,030) (10,410) (27,726)
Volume variance (40,438) (5,288) (60,517) 51,158 (58,883) 24,172
Net raw material variance (334,650) (13,016) (122,915) (125,872) (69,293) (3,554)
Direct labor:
Cost variance (5,945) 2,262 7,008 (5,987) (7,285) (1,588)
Volume variance (13,235) (1,731) (18,419) 11,564 (8,933) 3,929
Net direct labor variance (19,180) 531 (11,411) 5,577 (16,218) 2,341
Other factory costs:
Cost variance (51,982) (321) 5,053 913 (50,344) (9,156)
Volume variance (38,239) (5,000) (55,203) 37,115 (26,082) 12,804
Net other factory cost variance (90,221) (5,321) (50,150) 38,028 (76,426) 3,648
Net cost of sales:
Cost variance (352,139) (5,787) (50,337) (182,103) (68,039) (38,470)
Volume variance (91,912) (12,019) (134,139) 99,836 (93,898) 40,905
Total net cost of sales variance (444,051) (17,806) (184,476) (82,267) (161,937) 2,435
Gross profit variance 252,378 (28,665) 28,795 149,116 48,858 54,273
SG&A expenses:
Expense variance (6,236) 1,461 2,596 (6,109) (6,182) 2,161
Volume variance (3,845) (503) (5,119) 3,114 (2,984) 1,484
Total SG&A variance (10,081) 958 (2,523) (2,995) (9,166) 3,645
Operating income variance 242,297 (27,707) 26,272 146,121 39,692 57,918
Summarized as:
Price variance 588,963 (24,911) 65,604 342,858 88,005 105,285
Net cost/expense variance (358,374) (4,326) (47,741) (188,212) (74,221) (36,309)
Net volume variance 11,709 1,531 8,409 (8,525) 25,909 (11,058)
Source: Compiled from data submitted in response to Commission questionnaires.

66 While the Commission’s questionnaire requested R&D expenses, no company outside the region reported suchexpenses.
III-37
Capital Expenditures, Assets, and Return on Investment of U.S. ProducersOutside the Specified Region
The reported values of capital expenditures, assets, and calculated return on investment of U.S.producers outside the specified region are shown in table III-20.66
Table III-20Rebar: Capital expenditures, assets, and return on investment of U.S. producers outside the specifiedregion, 2001-06
Item
Calendar and fiscal year
2001 2002 2003 2004 2005 2006
Capital expenditures: Value ($1,000)
Cascade, McMinneville, OR *** *** *** *** *** ***
Gerdau, Wilton, IA *** *** *** *** *** ***
Gerdau, St. Paul, MN *** *** *** *** *** ***
Gerdau, Sand Springs, OK *** *** *** *** *** ***
Gerdau subtotal *** *** *** *** *** ***
Nucor, Plymouth, UT *** *** *** *** *** ***
Nucor, Seattle, WA *** *** *** *** *** ***
Nucor subtotal *** *** *** *** *** ***
TAMCO, Rancho Cucamonga, CA *** *** *** *** *** ***
Total 20,231 6,097 8,287 15,785 19,307 31,352
Assets: Value ($1,000)
Cascade, McMinneville, OR *** *** *** *** *** ***
Gerdau, Wilton, IA *** *** *** *** *** ***
Gerdau, St. Paul, MN *** *** *** *** *** ***
Gerdau, Sand Springs, OK *** *** *** *** *** ***
Gerdau subtotal *** *** *** *** *** ***
Nucor, Plymouth, UT *** *** *** *** *** ***
Nucor, Seattle, WA *** *** *** *** *** ***
Nucor subtotal *** *** *** *** *** ***
TAMCO, Rancho Cucamonga, CA *** *** *** *** *** ***
Total 460,964 423,748 436,119 519,036 593,309 545,464
Table continued on the following page.

67 ***. Letter from Wiley Rein on behalf of Gerdau March 7, 2007. 68 Letter from Wiley Rein on behalf of Cascade, March 7, 2007. 69 Letter from Wiley Rein on behalf of TAMCO, March 6, 2007. 70 Letter from Wiley Rein on behalf of Nucor, March 27, 2007.
III-38
Table III-20--ContinuedRebar: Capital expenditures, assets, and return on investment of U.S. producers outside the specifiedregion, 2001-06
Item
Calendar and fiscal year
2001 2002 2003 2004 2005 2006
Return on investment: Ratio of operating income or (loss) to assets (percent)
Cascade, McMinneville, OR *** *** *** *** *** ***
Gerdau, Wilton, IA *** *** *** *** *** ***
Gerdau, St. Paul, MN *** *** *** *** *** ***
Gerdau, Sand Springs, OK *** *** *** *** *** ***
Gerdau subtotal *** *** *** *** *** ***
Nucor, Plymouth, UT *** *** *** *** *** ***
Nucor, Seattle, WA *** *** *** *** *** ***
Nucor subtotal *** *** *** *** *** ***
TAMCO, Rancho Cucamonga, CA *** *** *** *** *** ***
Average 12.3 6.9 12.7 38.8 40.6 54.8
Source: Compiled from data submitted in response to Commission questionnaires.
Outside the region the *** level of second half capital expenditures with the *** accounted for bythe ***. According to Gerdau, the ***.67
With respect to Cascade’s 2005 and 2006 capital expenditures, the company stated that ***.68 In contrast with the pattern of capital expenditures reported by other mills outside the region,
TAMCO’s ***. According to TAMCO, ***.69 As shown in table III-20, the return on investment calculated for the ***. When asked to
comment on this mill’s calculated return on investment, Nucor stated that ***.70

1 Two additional importers, *** provided questionnaire responses without usable data. 2 There were no subject imports from Indonesia, Moldova, or Ukraine between 2001 and 2006. ***. Data forLatvia are for imports entered under HTS subheading 7214.20.00 plus imports entered under HTS statisticalreporting number 7228.30.8050 from official Commerce statistics. In addition, a ***. All other import datapresented are from official Commerce statistics under HTS subheading 7214.20.00. 3 Orders were reported by ***.
IV-1
PART IV: U.S. IMPORTS AND THE FOREIGN INDUSTRIES
U.S. IMPORTS
Eighteen U.S. importers provided data in response to the Commission’s questionnaires.1 Sixfirms replied that they did not import rebar from any country since 2001. Eleven firms did not respond toCommission questionnaires, and seven firms were not able to be contacted by Commission staff. TheCommission received responses from firms accounting for a substantial share of rebar imports from allsources (ranging from 70 to 84 percent during 2001-06). Questionnaire responses accounted for virtuallyall subject imports from Korea and Latvia (the suppliers of the vast majority of subject imports during thereview period), but lacked sufficient coverage for subject imports from Belarus, China, and Poland. Accordingly, import data in this report are derived from official Commerce statistics for rebar.2
As shown in table IV-1, subject imports from Korea and Poland ceased in 2001 after theimposition of the order, with the exception of 7,303 short tons from Poland in 2004, 5,516 short tons fromKorea in 2005, and 129 short tons from Poland in 2006. Subject imports from Belarus entered only in2002 (2,820 short tons). Subject imports from Latvia were the only substantial subject import presencein the U.S. market after 2001, and those imports ceased in mid-2005.
Nonsubject imports were substantially larger than subject imports and increased markedly in2004 and 2006, especially imports from Turkey. Subject imports primarily entered into the specifiedregion, as did imports from all other sources. Appendix G includes data from responses to importers’questionnaires regarding imports and shipments of imports of rebar. Those data confirm the entry ofimports mainly into the region, although the questionnaire data differ from official statistics in showingimports from Korea entering *** into the specified region, while shipments of imports from Korea weremade *** outside the specified region.
Responding U.S. importers reported that they had arranged for the delivery of *** short tons ofrebar from *** after December 31, 2006.3 Table IV-4 (presented later in this chapter) shows 36 tons ofrebar imports entering from China during the first quarter of 2007.

IV-2
Table IV-1Rebar: U.S. imports, by sources and destinations, 2001-06
Item 2001 2002 2003 2004 2005 2006
Quantity (short tons)
Imports from Belarus to destinations--
Within the specified region 0 2,820 0 0 0 0
Outside the region 0 0 0 0 0 0
Total 0 2,820 0 0 0 0
Imports from China to destinations--
Within the specified region 47 21 0 15 43 0
Outside the region 0 0 0 154 18 3
Total 47 21 0 169 60 3
Imports from Korea to destinations--
Within the specified region 84,188 0 0 0 0 0
Outside the region 34,281 0 0 0 5,516 0
Total 118,469 0 0 0 5,516 0
Imports from Latvia to destinations--
Within the specified region 33,662 45,904 50,522 121,881 36,646 0
Outside the region 0 0 0 0 0 0
Total 33,662 45,904 50,522 121,881 36,646 0
Imports from Poland to destinations--
Within the specified region 26,553 0 0 6,927 0 129
Outside the region 331 0 0 376 0 0
Total 26,884 0 0 7,303 0 129
Imports from subject sources--
Within the specified region 144,449 48,746 50,522 128,823 36,688 129
Outside the region 34,612 0 0 530 5,534 3
Total 179,061 48,746 50,522 129,352 42,222 133
Imports from all other sources to destinations--
Within the specified region 1,296,320 1,099,441 888,404 1,574,058 1,216,390 2,013,740
Outside the region 255,431 78,368 74,158 287,412 193,745 440,535
Total 1,551,751 1,177,809 962,562 1,861,470 1,410,136 2,454,275
Total imports to destinations--
Within the specified region 1,440,769 1,148,186 938,926 1,702,880 1,253,079 2,013,869
Outside the region 290,043 78,368 74,158 287,942 199,279 440,538
Total 1,730,812 1,226,554 1,013,084 1,990,822 1,452,358 2,454,407Table continued on the following page.

IV-3
Table IV-1--ContinuedRebar: U.S. imports, by sources and destinations, 2001-06
Item 2001 2002 2003 2004 2005 2006
Value ($1,000)1
Imports from Belarus to destinations--
Within the specified region 0 577 0 0 0 0
Outside the region 0 0 0 0 0 0
Total 0 577 0 0 0 0
Imports from China to destinations--
Within the specified region 23 13 0 15 13 0
Outside the region 0 0 0 158 5 4
Total 23 13 0 173 18 4
Imports from Korea to destinations--
Within the specified region 18,688 0 0 0 0 0
Outside the region 7,626 0 0 0 2,262 0
Total 26,314 0 0 0 2,262 0
Imports from Latvia to destinations--
Within the specified region 6,761 10,720 14,316 42,001 15,059 0
Outside the region 0 0 0 0 0 0
Total 6,761 10,720 14,316 42,001 15,059 0
Imports from Poland to destinations--
Within the specified region 5,779 0 0 2,254 0 50
Outside the region 164 0 0 534 0 0
Total 5,943 0 0 2,789 0 50
Imports from subject sources--
Within the specified region 31,251 11,310 14,316 44,270 15,073 50
Outside the region 7,790 0 0 692 2,267 4
Total 39,042 11,310 14,316 44,963 17,339 54
Imports from all other sources to destinations--
Within the specified region 291,353 244,537 246,135 747,255 518,875 892,702
Outside the region 57,537 18,687 22,996 134,606 81,752 191,938
Total 348,890 263,224 269,131 881,861 600,627 1,084,640
Total imports to destinations--
Within the specified region 322,605 255,848 260,452 791,525 533,948 892,752
Outside the region 65,327 18,687 22,996 135,299 84,019 191,943
Total 387,932 274,535 283,447 926,824 617,966 1,084,694Table continued on the following page.

IV-4
Table IV-1--ContinuedRebar: U.S. imports, by sources and destinations, 2001-06
Item 2001 2002 2003 2004 2005 2006
Unit value (per short ton)
Imports from Belarus to destinations--
Within the specified region (2) $205 (2) (2) (2) (2)
Outside the region (2) (2) (2) (2) (2) (2)
Average (2) 205 (2) (2) (2) (2)
Imports from China to destinations--
Within the specified region $492 635 (2) $1,011 $309 (2)
Outside the region (2) (2) (2) 1,029 275 $1,303
Average 492 635 (2) 1,027 299 1,303
Imports from Korea to destinations--
Within the specified region 222 (2) (2) (2) (2) (2)
Outside the region 222 (2) (2) (2) 410 (2)
Average 222 (2) (2) (2) 410 (2)
Imports from Latvia to destinations--
Within the specified region 201 234 $283 345 411 (2)
Outside the region (2) (2) (2) (2) (2) (2)
Average 201 234 283 345 411 (2)
Imports from Poland to destinations--
Within the specified region 218 (2) (2) 325 (2) 387
Outside the region 496 (2) (2) 1,421 (2) (2)
Average 221 (2) (2) 382 (2) 387
Imports from subject sources--
Within the specified region 216 232 283 344 411 387
Outside the region 225 (2) (2) 1,308 410 1,303
Average 218 232 283 348 411 411
Imports from all other sources to destinations--
Within the specified region 225 222 277 475 427 443
Outside the region 225 238 310 468 422 436
Average 225 223 280 474 426 442
Total imports to destinations--
Within the specified region 224 223 277 465 426 443
Outside the region 225 238 310 470 422 436
Average 224 224 280 466 425 442
1 Landed, duty-paid. 2 Not applicable.
Note.--Because of rounding, figures may not add to totals shown. There were no subject imports from Indonesia, Moldova, or Ukraine between 2001 and 2006. ***. Datafor Latvia are for imports entered under HTS subheading 7214.20.00 plus imports entered under HTS statistical reporting number 7228.30.8050 from official Commercestatistics. In addition, a ***. All other import data presented are from official Commerce statistics under subheading HTS 7214.20.00.
Source: Compiled from Department of Commerce official statistics and responses to Commission questionnaires.

4 Submission by Wiley Rein to Commerce, July 22, 2005, p. 5. 5 ***. 6 Staff interview with ***, May 10, 2007. 7 LM reported *** under HTS heading 7228. 8 Telephone interview with ***. 9 Respondent interested party LM’s prehearing brief, May 1, 2007, p. 8. 10 Hearing transcript, pp. 184-186 (Zaharin). 11 The data in this table are based on official import statistics of Commerce for rebar under HTS subheading7214.20.00.
IV-5
Imports from Latvia
Beginning in September 2003, according to domestic interested parties, virtually all rebar fromLatvia entered the United States under HTS subheading 7228.80.50 (alloy rebar), instead of the usualHTS classification of rebar under 7214.20.00 (non-alloy rebar). Domestic interested parties argued thatthe shift in tariff classification, coinciding with the beginning of Commerce’s administrative review, wasa deliberate scheme designed to evade the antidumping duty orders.4 ***.5 In its foreign producers’questionnaire response, LM explained that “***.”
During a meeting between LM officials and Commission staff, LM officials explained that ***.6 Table IV-2 presents data from importers’ questionnaires regarding imports of rebar under HTS
subheading 7228.80.50. The data presented do not match LM’s account of exports matching its invoicesfor silicon levels of 0.6 percent to ***, and LM has provided a reconciliation of its exports in metric tonsto imports reported under official statistics in short tons for HTS heading 7228.7 LM’s total exports to theUnited States ***. The data in table IV-2 also do not match the domestic interested parties’ allegationsthat imports began in September 2003 under HTS heading 7228, as 11,068 short tons were reported in2002.
***.8 In its prehearing brief, LM stated that it ceased rebar exports to the United States inSeptember 2005 because its accession to the EU in 2004 made the EU market more attractive in terms ofhigher prices, and that the higher trans-Atlantic freight rates gave LM little economic incentive tocontinue sales to the United States.9 During the public hearing, and LM official testified that LM hadmade an effort to increase its mandatary certification requirements as an EU supplier to 13 countries in2006, receives preferential transportation tariffs for shipments within the EU, and has been able todevelop long term supply contracts with end users in the EU, thereby cutting out the distributors andincreasing profits, and concluded that the company therefore has no reason to return to the U.S. market.10
Table IV-2Rebar: U.S. imports under HTS statistical reporting number 7228.30.8050, by sources anddestinations, 2001-06
* * * * * * *
Leading Nonsubject Sources of Imports
During the period for which data were collected, in addition to the five active subject countries,the United States imported rebar from many other countries. The leading 20 nonsubject suppliers areshown in table IV-3.11

IV-6
Table IV-3Rebar: U.S. imports from leading nonsubject sources, 2001-06
Item 2001 2002 2003 2004 2005 2006
Quantity (short tons)
Covered by order since 1997
Turkey1 206,540 234,115 122,391 713,690 488,472 1,161,412
Not covered by order
Argentina 3,364 12,934 24,284 0 17,290 336
Belgium1 1,007 0 0 0 165 2,751
Brazil 29,246 97,082 85,630 49,182 127,500 73,576
Bulgaria 9,790 16,474 60,049 188,466 54,724 88,466
Canada 1,615 1,006 252 2,729 29,763 39,942
Dominican Republic 7,898 71,710 69,394 104,378 46,007 95,403
Egypt 39,069 67,615 107,377 17,450 0 48,465
Germany1 74,837 91,901 36,576 74,068 95,528 64,895
Hong Kong1 0 0 0 0 2,761 36,300
Italy1 122,283 16,364 0 11,638 158 0
Japan1 386,530 269,575 36,731 195,302 166,048 222,150
Malaysia1 90,618 20,953 0 0 14 29,928
Mexico 193,248 161,805 253,028 254,341 251,349 170,452
Romania 36,635 30,776 70,663 86,991 55,586 33,179
Russia1 45,401 26,926 0 7,891 0 16,967
Singapore1 29,599 0 0 13,208 0 22,438
Taiwan1 10,904 1,058 0 51,678 40,804 300,675
Thailand 3,963 254 698 11,654 86 38,806
Venezuela1 53,017 4,274 30,396 17,019 24,714 3,918
All others 206,185 52,986 65,093 61,783 9,167 4,216
Total nonsubject 1,551,751 1,177,809 962,562 1,861,470 1,410,136 2,454,275
Table continued on following page.

IV-7
Table IV-3--ContinuedRebar: U.S. imports from leading nonsubject sources, 2001-06
Item 2001 2002 2003 2004 2005 2006
Value (1,000 dollars)2
Covered by order since 1997
Turkey1 41,826 52,105 35,277 362,738 213,040 509,144
Not covered by order
Argentina 609 2,864 5,614 0 8,011 223
Belgium1 820 0 0 0 237 1,092
Brazil 6,215 21,364 23,696 20,107 50,292 34,413
Bulgaria 3,964 3,603 17,357 73,184 22,672 39,305
Canada 746 446 104 1,509 12,916 19,340
Dominican Republic 1,919 17,947 21,259 41,970 21,515 46,810
Egypt 8,963 15,407 28,809 26,367 0 22,821
Germany1 19,326 19,931 10,588 54,151 40,820 29,062
Hong Kong1 0 0 0 0 1,141 15,876
Italy1 27,145 3,981 0 4,990 66 0
Japan1 84,560 56,385 11,432 85,340 69,358 94,461
Malaysia1 19,791 4,498 0 0 10 13,892
Mexico 44,678 37,902 69,376 104,277 106,060 74,180
Romania 9,429 7,403 18,865 36,395 24,194 12,493
Russia1 9,408 6,032 0 2,637 0 7,865
Singapore1 6,844 0 0 6,650 0 9,475
Taiwan1 2,541 241 0 26,159 16,620 131,027
Thailand 903 85 267 5,287 41 18,127
Venezuela1 12,919 958 8,773 7,551 9,231 1,582
All others 46,285 12,071 17,716 22,550 4,400 3,452
Total nonsubject 348,890 263,224 269,131 881,861 600,627 1,084,640
Table continued on the following page.

IV-8
Table IV-3--ContinuedRebar: U.S. imports from leading nonsubject sources, 2001-06
Item 2001 2002 2003 2004 2005 2006
Unit value (per short ton)
Covered by order since 1997
Turkey1 $203 $223 $288 $508 $436 $438
Not covered by order
Argentina 181 221 231 (3) 463 665
Belgium1 814 (3) (3) (3) 1,431 397
Brazil 213 220 277 409 394 468
Bulgaria 405 219 289 388 414 444
Canada 462 443 411 553 434 484
Dominican Republic 243 250 306 402 468 491
Egypt 229 228 268 1,511 (3) 471
Germany1 258 217 289 731 427 448
Hong Kong1 (3) (3) (3) (3) 413 437
Italy1 222 243 (3) 429 415 (3)
Japan1 219 209 311 437 418 425
Malaysia1 218 215 (3) (3) 734 464
Mexico 231 234 274 410 422 435
Romania 257 241 267 418 435 377
Russia1 207 224 (3) 334 (3) 464
Singapore1 231 (3) (3) 503 (3) 422
Taiwan1 233 228 (3) 506 407 436
Thailand 228 336 382 454 479 467
Venezuela1 244 224 289 444 374 404
All others 224 228 272 365 480 819
Total nonsubject 225 223 280 474 426 442
1 Countries subject to safeguard duties during 2002-03. 2 Landed, duty-paid. 3 Not applicable.
Note.–All other sources include Costa Rica, India, Paraguay, and the United Kingdom. Shaded columns are years affected bysafeguard duties.
Source: Compiled from official Commerce statistics under HTS subheading 7214.20.00.

12 Staff telephone interview with ***.
IV-9
The total quantity of rebar imports from all nonsubject sources increased from 2001 to 2006,reflecting a sharp increase in imports from Turkey in the latter part of the period. Imports from Turkeyare currently subject to an antidumping duty order.
A major importer of rebar from Turkey, ***, was asked to comment on the increase in importsfrom Turkey. ***.12
RECENT TRENDS IN REBAR IMPORTS
Table IV-4 shows quarterly imports during 2006 and the first quarter of 2007. During January-March 2007, imports from Turkey were lower than in the first quarter of 2006. During April 2007,imports from Turkey further declined sharply, from 50,000 to 65,000 short tons per month during the firstthree months of 2007 to 8,596 short tons in April. Imports from Brazil, Malaysia, Dominican Republic,and Singapore increased noticeably during the period from January-March 2006 to January-March 2007. During the first quarter of 2007, Turkey remained the largest foreign supplier of rebar to the UnitedStates, followed by Mexico, Taiwan, Malaysia, and Japan. During April 2007, imports from other majorsuppliers, such as Mexico and the Dominican Republic, decreased from the previous months in 2007,with the exception of Brazil, whose imports increased during April from previous months during 2007. Monthly nonsubject imports during the first three months of 2007 fluctuated from 165,000 short tons inJanuary to 213,000 short tons in March. Nonsubject imports in April 2007 were about 116,000 shorttons.
CUMULATION CONSIDERATIONS
In assessing whether subject imports are likely to compete with each other and with the domesticlike product with respect to cumulation, the Commission generally has considered the following fourfactors: (1) fungibility, (2) presence of sales or offers to sell in the same geographic markets, (3) commonor similar channels of distribution, and (4) simultaneous presence in the market. Fungibilityconsiderations and channels of distribution are discussed in Parts I and II of this report; additionalinformation regarding geographic markets and presence in the market are discussed below.

IV-10
Table IV-4Rebar: U.S. imports, by quarter, all sources, 2006-07
ItemJan.-Mar.
2006Apr.-June
2006July-Sept.
2006Oct.-Dec.
2006Jan.-Mar.
2007
Quantity (short tons)
Subject imports
China 0 0 3 0 36
Poland 0 129 0 0 0
Total 0 129 3 0 36
Nonsubject imports
Argentina 0 0 0 336 8,154
Australia 183 185 0 105 0
Belgium 0 2,751 0 0 0
Brazil 8,366 14,243 39,671 11,296 37,409
Bulgaria 38,659 4,936 30,249 14,622 0
Canada 11,893 11,830 14,223 1,996 5,853
Dominican Republic 17,614 36,313 28,892 12,584 41,856
Egypt 0 0 38,753 9,712 4,216
Germany 39,104 24,392 703 696 1,387
Hong Kong 0 0 25,889 10,410 0
India 0 258 116 140 257
Japan 62,725 75,471 73,012 10,943 55,343
Luxemburg 1,380 888 11 0 34
Malaysia 19 0 1,606 28,303 59,934
Mexico 66,018 13,777 8,849 81,808 83,819
Panama 20 0 0 0 0
Peru 84 545 0 0 0
Romania 17,507 15,672 0 0 0
Russia 0 0 16,967 0 0
Singapore 0 0 17,040 5,398 27,934
Switzerland 0 0 0 30 16
Taiwan 86,070 102,825 86,305 25,475 63,295
Thailand 0 0 27,529 11,277 0
Turkey 239,288 401,080 363,610 157,433 165,429
United Kingdom 0 215 54 0 0
Venezuela 3,918 0 0 0 0
Total 592,851 705,382 773,480 382,563 554,937
Source: Compiled from official Commerce statistics.
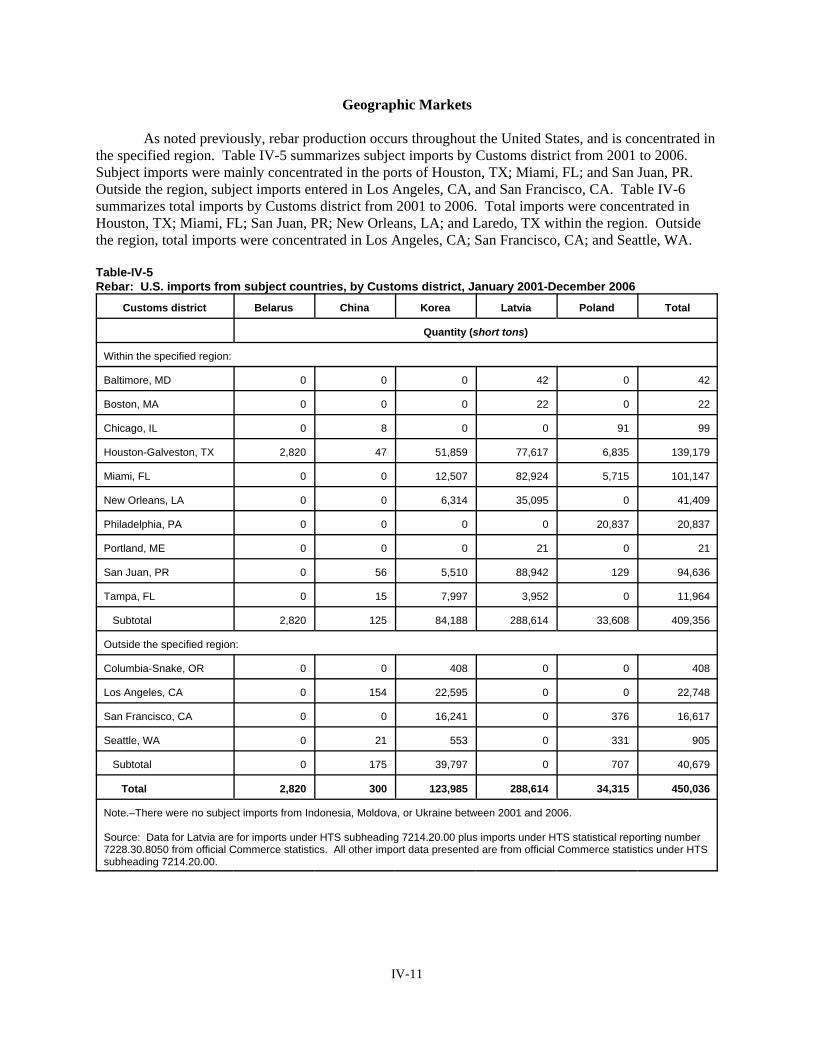
IV-11
Geographic Markets
As noted previously, rebar production occurs throughout the United States, and is concentrated inthe specified region. Table IV-5 summarizes subject imports by Customs district from 2001 to 2006. Subject imports were mainly concentrated in the ports of Houston, TX; Miami, FL; and San Juan, PR. Outside the region, subject imports entered in Los Angeles, CA, and San Francisco, CA. Table IV-6summarizes total imports by Customs district from 2001 to 2006. Total imports were concentrated inHouston, TX; Miami, FL; San Juan, PR; New Orleans, LA; and Laredo, TX within the region. Outsidethe region, total imports were concentrated in Los Angeles, CA; San Francisco, CA; and Seattle, WA.
Table-IV-5Rebar: U.S. imports from subject countries, by Customs district, January 2001-December 2006
Customs district Belarus China Korea Latvia Poland Total
Quantity (short tons)
Within the specified region:
Baltimore, MD 0 0 0 42 0 42
Boston, MA 0 0 0 22 0 22
Chicago, IL 0 8 0 0 91 99
Houston-Galveston, TX 2,820 47 51,859 77,617 6,835 139,179
Miami, FL 0 0 12,507 82,924 5,715 101,147
New Orleans, LA 0 0 6,314 35,095 0 41,409
Philadelphia, PA 0 0 0 0 20,837 20,837
Portland, ME 0 0 0 21 0 21
San Juan, PR 0 56 5,510 88,942 129 94,636
Tampa, FL 0 15 7,997 3,952 0 11,964
Subtotal 2,820 125 84,188 288,614 33,608 409,356
Outside the specified region:
Columbia-Snake, OR 0 0 408 0 0 408
Los Angeles, CA 0 154 22,595 0 0 22,748
San Francisco, CA 0 0 16,241 0 376 16,617
Seattle, WA 0 21 553 0 331 905
Subtotal 0 175 39,797 0 707 40,679
Total 2,820 300 123,985 288,614 34,315 450,036
Note.–There were no subject imports from Indonesia, Moldova, or Ukraine between 2001 and 2006.
Source: Data for Latvia are for imports under HTS subheading 7214.20.00 plus imports under HTS statistical reporting number7228.30.8050 from official Commerce statistics. All other import data presented are from official Commerce statistics under HTSsubheading 7214.20.00.

IV-12
Table-IV-6Rebar: U.S. imports from all countries, by Customs district, January 2001-December 2006
Customs district 2001 2002 2003 2004 2005 2006
Quantity (short tons)
Within the specified region:
Baltimore, MD 22,733 22 4,884 54,410 43,364 64,644
Boston, MA 0 22 83 5,324 0 0
Buffalo, NY 64 158 102 1,776 7,961 654
Charleston, SC 2,899 0 0 78 20 20
Charlotte, NC 30,275 12,926 10 0 0 13,577
Chicago, IL 26 7 179 112 8 74
Cleveland, OH 173 0 0 0 4 0
Dallas-Fort Worth, TX 0 44 0 0 0 0
Detroit, MI 396 300 117 1,181 478 4,875
El Paso, TX 0 16 239 4,453 20,379 1,049
Houston-Galveston, TX 513,204 345,219 293,321 658,020 338,725 848,129
Laredo, TX 51,047 84,019 159,978 180,707 202,269 132,578
Miami, FL 146,192 87,510 58,973 175,869 183,622 283,726
Milwaukee, WI 0 0 0 0 0 122
Mobile, AL 175 0 0 0 504 1,066
New Orleans, LA 240,076 198,253 29,871 122,953 105,975 188,069
New York, NY 20 100 127 0 7,178 16,626
Norfolk, VA 35 0 0 0 0 0
Ogdensburg, NY 25 23 0 431 21,048 34,476
Philadelphia, PA 92,213 78,708 63,891 94,834 48,918 73,454
Portland, ME 532 63 0 0 0 16
Providence, RI 0 9,964 0 0 0 0
San Juan, PR 282,886 256,177 281,218 276,398 253,662 269,577
Savannah, GA 1,017 50 80 11,266 2,297 6,613
St. Albans, VT 45 0 0 0 450 189
St. Louis, MO 0 0 0 0 0 49
Tampa, FL 56,735 74,604 45,843 115,071 16,216 74,286
Washington, DC 0 3 9 0 0 0
Subtotal 1,440,769 1,148,186 938,926 1,702,880 1,253,079 2,013,869
Table continued on the following page.

IV-13
Table-IV-6--ContinuedRebar: U.S. imports from all countries, by Customs district, January 2001-December 2006
Customs district 2001 2002 2003 2004 2005 2006
Quantity (short tons)
Outside the specified region:
Anchorage, AK 0 500 0 0 56 0
Columbia-Snake, OR 11,579 0 34 2,553 0 4,494
Duluth, MN 16 0 0 3 0 0
Great Falls, MT 22 0 93 123 133 107
Honolulu, HI 5,698 3,360 0 11,384 15,746 16,987
Los Angeles, CA 129,682 38,251 38,171 160,151 109,394 248,648
Pembina, ND 245 415 18 68 38 20
San Diego, CA 10,697 14,754 15,270 17,951 10,819 21,094
San Francisco, CA 118,148 20,125 17,126 94,996 62,398 148,483
Seattle, WA 13,848 896 617 244 26 3
U.S. Virgin Islands 108 67 2,828 467 668 702
Subtotal 290,043 78,368 74,158 287,942 199,279 440,538
Total 1,730,812 1,226,554 1,013,084 1,990,822 1,452,358 2,454,407
Source: Data for Latvia are for imports under HTS subheading 7214.20.00 plus imports under HTS statistical reporting number7228.30.8050 from official Commerce statistics. All other import data presented are from official Commerce statistics under HTSsubheading 7214.20.00.

IV-14
Presence in the Market
Table IV-7 presents data on the monthly entries of U.S. imports of rebar, by source, during theperiod for which data were collected. Rebar produced in China, Latvia, and Poland was generally presentin a few months throughout the period for which data were collected. Rebar from Belarus was onlypresent in one month of 2002. Rebar from Korea was present in six months of 2001 and only one monthin 2005. Imports from all other sources combined were present throughout the period.
Table IV-7Rebar: U.S. imports, monthly entries into the United States, by source, 2001-06
Source 2001 2002 2003 2004 2005 2006
Belarus 0 1 0 0 0 0
China 2 1 0 3 3 1
Korea 6 0 0 0 1 0
Latvia 3 4 4 7 4 0
Poland 7 0 0 5 0 1
All others 12 12 12 12 12 12
Note.–There were no subject imports from Indonesia, Moldova, or Ukraine between 2001 and 2006.
Source: Data for Latvia are for imports under HTS subheading 7214.20.00 plus imports under HTS statisticalreporting number 7228.30.8050 from official Commerce statistics. All other import data presented are from officialCommerce statistics under HTS subheading 7214.20.00.
U.S. IMPORTERS’ INVENTORIES
Data relating to U.S. importers’ inventories of imports of rebar from nonsubject sources arepresented in table IV-8. There were no reported inventories of subject imports. Inventories of nonsubjectrebar fluctuated during the period and were minimal relative to U.S. imports and U.S. shipments ofimports.
Table IV-8Rebar: U.S. importers’ reported end-of-period inventories of imports and ratios of inventories toreported U.S. importers’ imports and to U.S. importers’ U.S. shipments, 2001-06
Item 2001 2002 2003 2004 2005 2006
Imports from all sources (total imports):
Inventories (short tons) 22,489 17,440 13,882 68,956 21,575 53,870
Ratio to imports (percent) 2.1 1.9 1.9 4.5 2.2 3.1
Ratio to U.S. shipments (percent) 2.1 1.9 2.0 4.7 2.2 3.1
Note.--No importer reported inventories from subject countries during the period of review.
Source: Compiled from data submitted in response to Commission questionnaires.

13 BMZ’s posthearing brief, p. 4. 14 Submission by domestic interested parties, September 20, 2006, pp. 18-19. 15 BMZ’s posthearing brief, p. 3.
IV-15
THE INDUSTRY IN BELARUS
Overview
Byelorussian Steel Works (“BMZ”) is the only producer of rebar in Belarus. Rebar is producedin the firm’s commercial steel unit, which was launched in 1984. When asked to describe the technologyused to produce rebar, BMZ described the following. “***.” Table IV-9 presents comparativeinformation available from the original investigations and the current reviews. Capacity and productionhave grown *** from 2000 to 2006, and capacity utilization has increased. The concentration in exportshipments also increased over the period.
Table IV-9Rebar: Comparison of select Belarusian industry data, 2000 and 2006
* * * * * * *
Rebar Operations
Information on BMZ’s rebar operations is presented in table IV-10. Capacity and productionincreased *** between 2000 and 2006. ***. BMZ reported that it “***.” According to BMZ’sposthearing brief, its marketing strategy has been to supply customers in Belarus, Russia, other CIScountries, the EU, Asia, and the United States. During 2001-06, BMZ has shipped the majority of itsrebar to Russia, Belarus, and other CIS states. Sales to Russia increased by more than 30 percent, andaccounted for one half of BMZ’s total shipments of rebar by 2006.13 BMZ reported no barriers to itsexports in countries other than the United States.
Table IV-10Rebar: Belarusian production capacity, production, shipments, and inventories, 2001-06, withprojections for 2007-08
* * * * * * *
When asked about any changes to operations, BMZ replied that “***.” Capacity is based on ***hours per week, *** weeks per year. Constraints on capacity were reported to be “***.” Capacity ***between 2000 and 2001, then *** increased thereafter. Projections call for ***, assuming the ordersremain in place, and BMZ has *** if the orders were revoked, according to its questionnaire response. Although BMZ’s questionnaire response reported ***, domestic interested parties have alleged that itannounced its intention to upgrade its rolling mills at a cost of $15 million during 2005-08, and that anyextra capacity resulting from such an upgrade could result in adding to the future overcapacity andoversupply of the global market for rebar.14 BMZ, however, reported that the upgrade will affect only wirerod production.15

IV-16
Alternative Products
In addition to rebar, the firm produces a range of high quality products including SBQ bars androunds, corners, and square bars, *** on the same equipment and machinery used to produce rebar. BMZis *** able to switch production between rebar and other products in response to a relative price change inrebar vis-a-vis the price of other products, using the same equipment and labor.
THE INDUSTRY IN CHINA
Overview
During the original investigations, the petition listed some 17 firms believed to be producing rebarin China at the time. Only Laiwu Steel Group, Ltd. (“Laiwu”) provided data in response to Commissionquestionnaires. Domestic interested parties identified 20 potential producers of rebar in China in aresponse to the Commission’s notice of institution, none of whom replied to the Commission’s foreignproducers’ questionnaire during these reviews. During the original investigations, the U.S. Embassy inBeijing was able to obtain limited information from industry sources regarding certain data from theChinese rebar industry, of which Laiwu accounted for about *** percent of total production in 2000. TableIV-11 presents comparative information available from the original investigations and the current reviews. Production more than *** from 2000 to 2006, and the share of production devoted to exports, whilerelatively small, grew over the period.
Table IV-11Rebar: Comparison of select Chinese industry data, 2000 and 2006
Item 2000 2006
Production (short tons) 29,450,000 ***
Exports/production (percent) 1.2 ***
Note.–Data on capacity, shipments, and inventories are unavailable.
Source: Confidential original report (INV-Y-087, May 1, 2001), tabulation at page VII-5; *** production data contained in May 24,2007 submission by domestic interested parties (converted to short tons by Commission staff); and World Trade Atlas, ChinaExports under HTS subheading 7214.20.
Rebar Operations
Available information on China’s rebar market and industry operations (capacity, production,consumption, and implied net exports) is presented in table IV-12.
Table IV-12Rebar: Chinese capacity, production, consumption, and net exports, 2001-06
* * * * * * *
Production is expected to grow about *** percent of its 2006 level by the year 2011 according to***. Chinese consumption is expected to grow by about *** percent during the same time period. By theyear 2011, China is still expected to be a net exporter, with a projected surplus of *** short tons of rebarproduced that will not be consumed in China. China’s net export to production ratio projected at that time
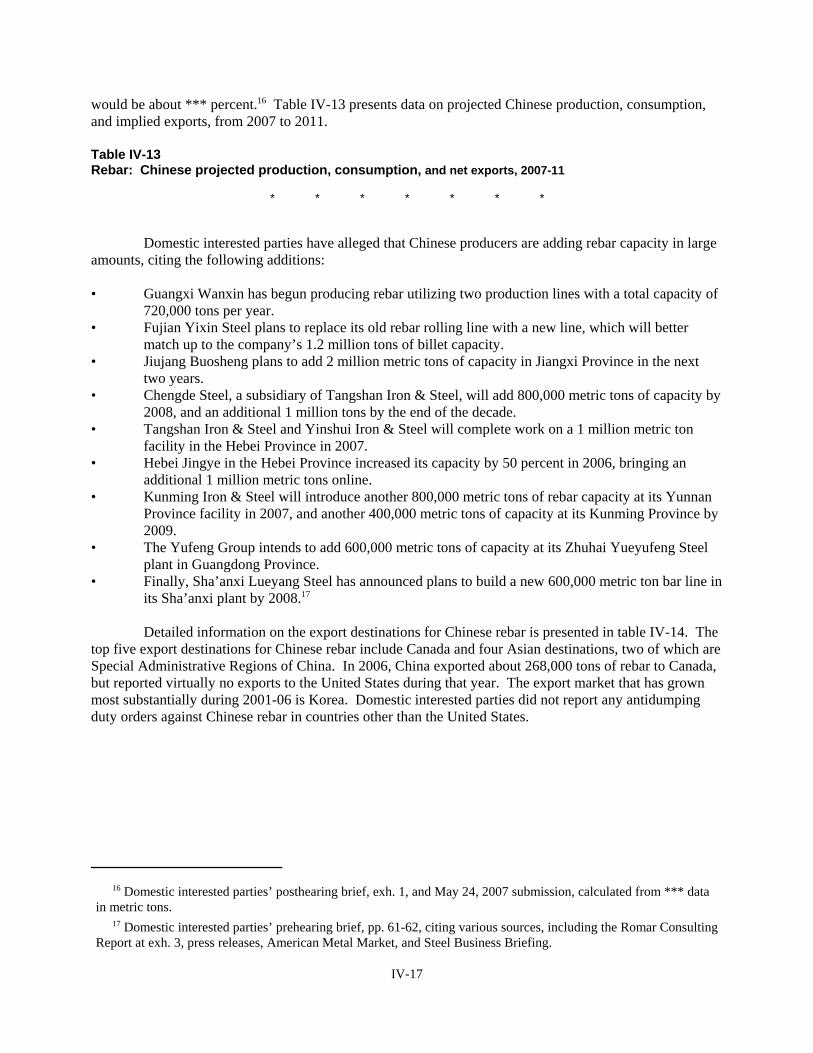
16 Domestic interested parties’ posthearing brief, exh. 1, and May 24, 2007 submission, calculated from *** datain metric tons. 17 Domestic interested parties’ prehearing brief, pp. 61-62, citing various sources, including the Romar ConsultingReport at exh. 3, press releases, American Metal Market, and Steel Business Briefing.
IV-17
would be about *** percent.16 Table IV-13 presents data on projected Chinese production, consumption,and implied exports, from 2007 to 2011.
Table IV-13Rebar: Chinese projected production, consumption, and net exports, 2007-11
* * * * * * *
Domestic interested parties have alleged that Chinese producers are adding rebar capacity in largeamounts, citing the following additions:
• Guangxi Wanxin has begun producing rebar utilizing two production lines with a total capacity of720,000 tons per year.
• Fujian Yixin Steel plans to replace its old rebar rolling line with a new line, which will bettermatch up to the company’s 1.2 million tons of billet capacity.
• Jiujang Buosheng plans to add 2 million metric tons of capacity in Jiangxi Province in the nexttwo years.
• Chengde Steel, a subsidiary of Tangshan Iron & Steel, will add 800,000 metric tons of capacity by2008, and an additional 1 million tons by the end of the decade.
• Tangshan Iron & Steel and Yinshui Iron & Steel will complete work on a 1 million metric tonfacility in the Hebei Province in 2007.
• Hebei Jingye in the Hebei Province increased its capacity by 50 percent in 2006, bringing anadditional 1 million metric tons online.
• Kunming Iron & Steel will introduce another 800,000 metric tons of rebar capacity at its YunnanProvince facility in 2007, and another 400,000 metric tons of capacity at its Kunming Province by2009.
• The Yufeng Group intends to add 600,000 metric tons of capacity at its Zhuhai Yueyufeng Steelplant in Guangdong Province.
• Finally, Sha’anxi Lueyang Steel has announced plans to build a new 600,000 metric ton bar line inits Sha’anxi plant by 2008.17
Detailed information on the export destinations for Chinese rebar is presented in table IV-14. Thetop five export destinations for Chinese rebar include Canada and four Asian destinations, two of which areSpecial Administrative Regions of China. In 2006, China exported about 268,000 tons of rebar to Canada,but reported virtually no exports to the United States during that year. The export market that has grownmost substantially during 2001-06 is Korea. Domestic interested parties did not report any antidumpingduty orders against Chinese rebar in countries other than the United States.

IV-18
Table IV-14Rebar: Quantities, values, and average unit values of exports from China, by destinations, in descendingorder of quantities shipped, 2001-06
Destinations 2001 2002 2003 2004 2005 2006Quantity (short tons)
United States 1,647 0 0 0 334 1,482Others: Hong Kong 404,986 206,862 364,322 290,429 554,602 822,519 Korea, South 0 10,784 195,989 272,321 485,991 786,164 Singapore 0 33,400 64,983 256,387 228,548 345,610 Canada 89,381 64,337 14,028 132,031 96,852 268,307 Iran 0 0 0 32,252 21,251 157,470 India 0 0 0 0 30,812 155,386 Macau 13,427 13,218 22,918 38,978 134,936 126,087 Syria 0 0 0 0 0 114,970 Myanmar 13,126 22,405 61,003 77,307 82,417 105,880 Angola 5 0 0 3,043 15,881 100,722 Yemen 0 0 0 179 21,423 96,159 United Arab Emirates 0 0 0 0 28 90,507 South Africa 0 0 0 0 0 65,675 Mexico 0 0 0 0 0 59,885 Sudan 313 2,052 3,375 586 10,852 49,733 Brunei Darussalam 9,806 6,459 0 19,749 12,563 45,135 Pakistan 0 237 6,186 2,033 11,081 33,423 Kazakhstan 0 60 904 3,744 926 30,088 Ecuador 0 6 0 0 0 27,657 Indonesia 105 280 0 223 3,559 20,852 Cyprus 0 0 0 0 0 20,795 Mongolia 1,092 84 592 1,513 2,689 20,741 Russia 91 0 1 307 510 20,534 Panama 0 0 0 1,116 0 17,446 Cameroon 0 0 6 0 392 16,558 Taiwan 0 0 0 0 626 15,530 Ethiopia 110 0 41 606 1,468 10,748 Afghanistan 0 3 212 532 4,424 10,568 Ghana 0 0 19 33 0 9,970 Tanzania 74 0 0 1,134 5,436 9,858 Nicaragua 0 0 0 0 0 8,052 Saudi Arabia 0 0 0 0 0 5,975 Turkmenistan 0 0 0 1,388 0 5,874 Trinidad and Tobago 0 0 0 0 0 5,846 Philippines 0 0 11 0 0 5,728 All others 48,517 27,420 23,726 40,880 50,024 57,868 Total world 582,681 387,606 758,314 1,176,771 1,777,625 3,745,801Table continued on the following page.

IV-19
Table IV-14–ContinuedRebar: Quantities, values, and average unit values of exports from China, by destinations, in descendingorder of quantities shipped, 2001-06
Destinations 2001 2002 2003 2004 2005 2006Value ($1,000)
United States 556 0 0 0 150 494Others: Hong Kong 72,448 40674 79,651 100,393 189,151 278,104 Korea, South 0 2,184 47,622 100,498 173,700 271,905 Singapore 0 6,806 15,766 88,614 75,293 114,896 Canada 16,487 12,192 3,614 45,737 34,819 97,008 Iran 0 0 0 9,084 7,509 56,806 India 0 0 0 0 10,772 49,488 Macau 2,476 2,590 5,468 14,729 49,082 44,516 Syria 0 0 0 0 0 41,296 Myanmar 2,925 5,212 14,677 26,098 26,553 33,939 Angola 2 0 0 1,171 5,596 35,275 Yemen 0 0 0 71 6,799 33,231 United Arab Emirates 0 0 0 0 19 31,910 South Africa 0 0 0 0 0 23,837 Mexico 0 0 0 0 0 21,580 Sudan 89 514 953 227 3,686 17,569 Brunei Darussalam 1,668 841 0 6,727 4,480 15,564 Pakistan 0 68 1,787 750 4,030 12,424 Kazakhstan 0 9 191 1,191 371 11,574 Ecuador 0 1 0 0 0 10,792 Indonesia 25 55 0 82 1,306 7,641 Cyprus 0 0 0 0 0 7,469 Mongolia 240 20 159 585 1,005 7,864 Russia 27 0 0 145 241 7,824 Panama 0 0 0 395 0 6,208 Cameroon 0 0 2 0 183 6,610 Taiwan 0 0 0 0 240 5,766 Ethiopia 26 0 26 446 577 4,061 Afghanistan 0 1 76 193 1,555 4,169 Ghana 0 0 6 10 0 3,430 Tanzania 19 0 0 486 2,099 3,724 Nicaragua 0 0 0 0 0 3,175 Saudi Arabia 0 0 0 0 0 2,181 Turkmenistan 0 0 0 571 0 2,124 Trinidad and Tobago 0 0 0 0 0 1,720 Philippines 0 0 6 0 0 1,912 All others 9,650 5,768 6,058 14,155 19,103 22,631 Total world 106,638 76,935 176,062 412,357 618,318 1,300,719Table continued on the following page.

IV-20
Table IV-14–ContinuedRebar: Quantities, values, and average unit values of exports from China, by destinations, in descendingorder of quantities shipped, 2001-06
Destinations 2001 2002 2003 2004 2005 2006Average unit value (per short ton)
United States $338 (1) (1) (1) $448 $334Others: Hong Kong 179 $197 $219 $346 341 338 Korea, South (1) 203 243 369 357 346 Singapore (1) 204 243 346 329 332 Canada 184 190 258 346 360 362 Iran (1) (1) (1) 282 353 361 India (1) (1) (1) (1) 350 318 Macau 184 196 239 378 364 353 Syria (1) (1) (1) (1) (1) 359 Myanmar 223 233 241 338 322 321 Angola 393 (1) (1) 385 352 350 Yemen (1) (1) (1) 399 317 346 United Arab Emirates (1) (1) (1) (1) 699 353 South Africa (1) (1) (1) (1) (1) 363 Mexico (1) (1) (1) (1) (1) 360 Sudan 283 250 282 387 340 353 Brunei Darussalam 170 130 (1) 341 357 345 Pakistan (1) 285 289 369 364 372 Kazakhstan (1) 150 211 318 400 385 Ecuador (1) 142 (1) (1) (1) 390 Indonesia 239 197 (1) 367 367 366 Cyprus (1) (1) (1) (1) (1) 359 Mongolia 219 236 268 387 374 379 Russia 298 (1) 363 470 473 381 Panama (1) (1) (1) 354 (1) 356 Cameroon (1) (1) 294 (1) 466 399 Taiwan (1) (1) (1) (1) 384 371 Ethiopia 233 (1) 635 737 393 378 Afghanistan (1) 265 358 363 352 394 Ghana (1) (1) 319 294 (1) 344 Tanzania 253 (1) (1) 428 386 378 Nicaragua (1) (1) (1) (1) (1) 394 Saudi Arabia (1) (1) (1) (1) (1) 365 Turkmenistan (1) (1) (1) 411 (1) 362 Trinidad and Tobago (1) (1) (1) (1) (1) 294 Philippines (1) (1) 577 (1) (1) 334 All others 199 210 255 346 382 391 Total world 183 198 232 350 348 347 1 Not applicable.
Note.--HTS 7214.20 Other bars, hot-worked, for concrete reinforcement bars (of carbon steel, not coiled).
Source: World Trade Atlas, as reported by China Customs.

18 Certain Steel Concrete Reinforcing Bars From Indonesia, Poland, and Ukraine, Invs. Nos. 731-TA-875, 880,and 882 (Final), USITC Publication 3425, pp. VII-3-VII-4. 19 Confidential original report (INV-Y-087, May 1, 2001), p. VII-7. 20 Certain Steel Concrete Reinforcing Bars From Indonesia, Poland, and Ukraine, Invs. Nos. 731-TA-875, 880,and 882 (Final), USITC Publication 3425, p. VII-4. 21 Certain Steel Concrete Reinforcing Bars From Indonesia, Poland, and Ukraine, Invs. Nos. 731-TA-875, 880,and 882 (Final), USITC Publication 3425, pp. VII-3-VII-4. 22 http://www.ispatindo.com/Home.htm, retrieved on March 19, 2007. 23 ***. 24 Production and export data concerning the industry producing rebar in Indonesia are unavailable from publicsources. 25 Domestic interested parties’ response to the notice of institution, September 20, 2006, p. 23. 26 According to the company website, Krakatau Steel produces and sells three kinds of steel product: hot-rolledsteel, cold-rolled steel, and wire rod steel. Steel bars are produced and sold by a subsidiary company of KrakatauSteel, but their raw materials (steel billets) are supplied by Krakatau Steel. http://www.krakatausteel.com/product/index.asp, retrieved on June 1, 2007. ***.
IV-21
THE INDUSTRY IN INDONESIA
Overview
In the original investigations, the Commission identified 13 firms that produced rebar inIndonesia, but only one, PT The Master Steel Mfg. Co., returned a completed questionnaire to theCommission. The Commission also received information from the Indonesian Ministry of Industry andTrade (“MOIT”).18 In these current reviews, domestic interested parties identified six potential producersof rebar in Indonesia in a response to the Commission’s notice of institution, none of which replied to theCommission’s foreign producers’ questionnaire.
During the original investigation, PT The Master Steel estimated that it accounted for only ***percent of the country’s total production of rebar in 2000, and exported rebar to the United States ***.19 Table IV-15 presents comparative information available from the original investigations and these firstreviews.
Table IV-15Rebar: Comparison of select Indonesian industry data, 2000 and 2006
* * * * * * *
Rebar Operations
The MOIT estimated that in 2000 there were 28 firms in Indonesia that produced rebar, with acombined capacity of 4.8 million tons, and that the industry was mainly oriented towards the domesticmarket.20 Ispat Indo had indicated in the original investigations that it did not produce rebar.21 However, itappears that the firm does now produce rebar at its facility.22 Indeed, Ispat Indo is one of eight Indonesianfirms identified by *** as having quantifiable capacity to produce rebar. In total, these firms have anestimated *** short tons of rebar capacity.23 24 According to domestic interested parties, potentially onemillion additional tons of capacity may be available if PT Krakatau Steel should convert some of its wirerod production to the production of rebar.25 26 Imports of rebar from Indonesia, as well as six other

27 Canadian International Trade Tribunal, Certain Concrete Reinforcing Bar Originating in or Exported from theRepublic of Indonesia, Japan, the Republic of Latvia, the Republic of Moldova, the Republic of Poland, ChineseTaipei, and Ukraine, Inquiry No. NQ-2000-007, June 1, 2001. 28 Canadian International Trade Tribunal, Hot-Rolled Deformed Carbon or Low Alloy Steel Concrete ReinforcingBar in Straight Lengths or in Coils, Originating in or Exported from the Republic of Indonesia, Japan, the Republicof Latvia, the Republic of Moldova, the Republic of Poland, Chinese Taipei, and Ukraine, Expiry No. LE-2005-002,September 14, 2005. 29 Hyundai prehearing brief, exh. 3.
IV-22
countries, were subject to antidumping duty orders in Canada between 2001 and 2006.27 However, in anotice issued September 14, 2005, the Canadian International Trade Tribunal rescinded its finding withrespect to all seven subject countries, having received no submissions in support of a review andcontinuation of the finding.28
THE INDUSTRY IN KOREA
Overview
Domestic interested parties have alleged that there are eight producers of rebar in Korea: DongilIndustries, Dongkuk Steel Mill (Donkuk), Han Kook Steel & Mill, INI Steel, Korea Iron & Steel (KISCO),Kosteel, Young Heung Iron & Steel, and Hyundai Steel Co. During the original investigations, foreignproducer questionnaire responses were received from Dongkuk, Inchon Iron & Steel Co., Ltd., and KISCO,accounting for about *** percent of production in Korea in 1999. During these reviews, only Hyundairesponded to Commission questionnaires providing data on its operations. Comparing Hyundai’s reported2005 production with IISI’s reported production for Korea in 2005, Hyundai appears to account forapproximately *** percent of production of rebar in Korea. In its questionnaire response, Hyundai itselfestimated that it accounted for *** percent of Korean rebar production in 2006. In its posthearing brief,Hyundai submitted data from the Korean Iron & Steel Institute (KOSA) which estimated that there werefive leading Korean rebar producers in 2006, accounting for the following shares of rebar capacity inKorea: ***.29
When asked to describe the technology used to produce rebar, Hyundai described the following. “***.”
During the original investigations, the American Embassy in Seoul was able to obtain informationfrom industry sources regarding data from the Korean rebar industry of eight producers. Table IV-16presents comparative information available from the original investigations and the current reviews.Production and capacity increased from 2000 to 2006, capacity utilization also increased, and the amountof production devoted to exports was small.

30 Canadian International Trade Tribunal, Certain Concrete Reinforcing Bar Originating in or Exported from theRepublic of Cuba, the Republic of Korea, and the Republic of Turkey, Inquiry No. NQ-99-002, January 12, 2000. 31 Canadian International Trade Tribunal, Certain Concrete Reinforcing Bar Originating in or Exported from theRepublic of Cuba, the Republic of Korea, and the Republic of Turkey, Expiry Review No. RR-2004-001, January 11,2005.
IV-23
Table IV-16Rebar: Comparison of select Korean industry data, 2000 and 2006
Item 2000 2006
Capacity (short tons) 9,736,000 ***
Production (short tons) 8,276,000 ***
Capacity utilization (percent) 85.0 ***
Exports/production (percent) 2.3 ***
Inventories/shipments (percent) 3.3 ***
Note.–The 2006 ratio for inventories is inventories/production, as the KOSA data are for production, not shipments.
Source: Confidential original report (INV-Y-087, May 1, 2001), Hyundai’s prehearing brief, exh. 3, and posthearingbrief, exh. 1, KOSA capacity, production, export (267,895 short tons), and inventory (306,876 short tons) data for2006. Note that calculations using IISI Steel Statistical Yearbook 2006 for 2005 data for production and World TradeAtlas, “Korea Exports under HS 721420" for 2005 exports yields an export to production ratio in 2005 of 4.5 percent.
Rebar Operations
Information on Hyundai’s rebar operations is presented in table IV-17. Home market salesconstitute more than *** percent of its shipments, with the remainder primarily exported to Asian markets. When asked to identify new export markets, Hyundai mentioned the ***. Hyundai did not identify anybarriers to its exports to any countries other than the United States. Imports of rebar from Korea, as well asCuba and Turkey, were subject to antidumping duty orders in Canada between 2000 and 2005.30 However,in an order issued January 11, 2005, the Canadian International Trade Tribunal rescinded its finding withrespect to all three subject countries.31
Table IV-17Rebar: Hyundai’s production capacity, production, shipments, and inventories, 2001-06, withprojections for 2007-08
* * * * * * *
Capacity is based on *** per year. Constraints on capacity were reported to be “***.” Capacityincreased between 2003 and 2005, then decreased in 2006 and is expected to remain steady thereafter. Hyundai’s questionnaire response notes that it acquired Hanbo Steel ***. The acquisition resulted in ***. Hyundai stated that the electric arc industry initiated a rationalization plan after the Asian Financial Crisisto address ***.

32 *** data for production from May 24, 2007 submission of domestic interested parties; *** data forconsumption from domestic interested parties’ posthearing brief, additional questions exh. 1.
IV-24
With respect to anticipated changes to its operations, Hyundai reported that the ***.Information on Korea’s rebar market and operations (capacity, production, consumption, and implied tradeposition) is presented in table IV-18, indicating that Korea became a net importer in 2002.
Table IV-18Rebar: Korean capacity, production, consumption, and net exports, 2001-06
* * * * * * *
According to *** data supplied by the domestic interested parties, projected growth inconsumption should match production growth in Korea in 2007-11, causing Korea to remain a net importerof rebar, as shown in table IV-19.32
Table IV-19Rebar: Korean projected consumption, production, and net exports, 2007-11
* * * * * * *
Detailed information on destinations for Korean exports is presented in table IV-20. The top fiveexport destinations for Korean rebar include Canada, Hong Kong, Singapore, Kuwait, and Panama.
Alternative Products
In addition to rebar, Hyundai produces a range of other products, including H-Beams, hot-rolled,and STS CR, all produced ***. Hyundai reported that it *** to switch production between rebar and otherproducts in response to a relative price change of rebar vis-a-vis the price of other products, using the sameequipment and labor.

IV-25
Table IV-20Rebar: Quantities, values, and average unit values of exports from Korea, by destinations, in descendingorder of quantities shipped, 2001-06
Destinations 2001 2002 2003 2004 2005 2006Quantity (short tons)
United States: 50 U.S. States 81,063 901 7 3,033 6,346 739 Guam 5,861 6,586 6,458 10,960 9,545 9,454 Northern Mariana Islands 826 3,457 1,037 280 1,450 2,095 Puerto Rico 5,510 0 0 0 0 0 American Samoa 52 0 0 0 0 0 Subtotal 93,312 10,945 7,502 14,273 17,341 12,288Others: Panama 19,438 6,978 0 0 33,815 86,173 Kuwait 0 11,213 0 0 0 27,981 Singapore 0 0 0 6,889 136,574 27,514 Hong Kong 145,330 28,089 276 53,744 101,597 23,175 Canada 0 8,854 0 0 31,385 21,314 Angola 0 0 0 0 0 12,008 Philippines 0 0 0 65 0 8,160 Brunei Darussalam 0 0 0 0 59,906 6,052 Japan 12 70 52 3,939 9,930 3,382 Pakistan 0 0 0 0 0 3,189 Indonesia 28 0 0 0 2 2,315 United Arab Emirates 0 0 0 1,121 5,792 2,299 Micronesia, Federated States 2,174 1,286 1,850 1,168 1,220 1,353 Palau 2,025 1,179 382 311 484 689 Taiwan 0 0 43 159 35,308 432 Marshall Islands 55 110 1,280 72 75 277 Western Samoa 193 55 0 454 680 207 Russia 14 0 0 0 698 101 Saudi Arabia 0 0 0 0 0 68 Ireland 0 27 0 39 0 21 China 1,634 71 742 1,099 45 13 Cambodia 0 0 0 0 0 12 Tajikistan 0 0 0 0 0 6 Solomon Islands 0 0 2 134 109 2 Malaysia 0 0 0 0 664 2 Vietnam 1,270 821 630 185 21,794 0 Myanmar 10,656 10,373 0 0 16,381 0 All others 7570 133 557 450 374 0 Total world 283,711 80,203 13,316 84,104 474,175 239,035
Table continued on the following page.

IV-26
Table IV-20–ContinuedRebar: Quantities, values, and average unit values of exports from Korea, by destinations, in descendingorder of quantities shipped, 2001-06
Destinations 2001 2002 2003 2004 2005 2006Value ($1,000)
United States: 50 U.S. States 16,325 192 7 1,321 2,375 351 Guam 1,275 1,674 2,106 4,625 4,182 4,254 Northern Mariana Islands 165 900 323 129 631 918 Puerto Rico 1,140 0 0 0 0 0 American Samoa 12 0 0 0 0 0 Subtotal 18,916 2,766 2,436 6,075 7,188 5,523Others: Panama 3,629 1,369 0 0 11,906 32,535 Kuwait 0 2,014 0 0 0 10,946 Singapore 0 0 0 2,342 44,170 8,140 Hong Kong 25,137 4,419 42 17,676 34,221 7,451 Canada 0 1,677 0 0 10,505 8,041 Angola 0 0 0 0 0 5,665 Philippines 0 0 0 23 0 3,271 Brunei Darussalam 0 0 0 0 20,589 1,908 Japan 94 435 61 1,659 3,624 1,197 Pakistan 0 0 0 0 0 1,070 Indonesia 25 0 0 0 6 709 United Arab Emirates 0 0 0 419 2,070 888 Micronesia, Federated States 493 356 647 559 646 669 Palau 472 313 127 155 245 346 Taiwan 0 0 18 75 11,305 269 Marshall Islands 35 74 515 27 63 210 Western Samoa 49 14 0 207 337 109 Russia 10 0 0 0 865 149 Saudi Arabia 0 0 0 0 0 61 Ireland 0 17 0 36 0 11 China 477 35 308 387 92 21 Cambodia 0 0 0 0 0 24 Tajikistan 0 0 0 0 0 3 Solomon Islands 0 0 1 63 55 1 Malaysia 0 0 0 0 331 28 Vietnam 412 316 265 78 6,463 0 Myanmar 1,896 1,769 0 0 5,645 0 All others 1,468 39 166 211 175 0 Total world 53,115 15,615 4,585 29,992 160,500 89,245Table continued on the following page.

IV-27
Table IV-20–ContinuedRebar: Quantities, values, and average unit values of exports from Korea, by destinations, in descendingorder of quantities shipped, 2001-06
Destinations 2001 2002 2003 2004 2005 2006Average unit value (per short ton)
United States: 50 U.S. States $201 $213 $998 $436 $374 $475 Guam 218 254 326 422 438 450 Northern Mariana Islands 199 260 312 461 435 438 Puerto Rico 207 (1) (1) (1) (1) (1) American Samoa 229 (1) (1) (1) (1) (1) Subtotal 203 253 325 426 414 450Others: Panama 187 196 (1) (1) 352 378 Kuwait (1) 180 (1) (1) (1) 391 Singapore (1) (1) (1) 340 323 296 Hong Kong 173 157 154 329 337 322 Canada (1) 189 (1) (1) 335 377 Angola (1) (1) (1) (1) (1) 472 Philippines (1) (1) (1) 358 (1) 401 Brunei Darussalam (1) (1) (1) (1) 344 315 Japan 7,824 6,225 1,171 421 365 354 Pakistan (1) (1) (1) (1) (1) 336 Indonesia 894 (1) (1) (1) 3,600 306 United Arab Emirates (1) (1) (1) 374 357 386 Micronesia, Federated States 227 277 350 479 530 494 Palau 233 266 332 499 507 502 Taiwan (1) (1) 408 472 320 622 Marshall Islands 641 669 402 372 839 759 Western Samoa 253 259 (1) 456 495 525 Russia 737 (1) (1) (1) 1,240 1,474 Saudi Arabia (1) (1) (1) (1) (1) 898 Ireland (1) 635 (1) 938 (1) 499 China 292 501 415 352 2,045 1,629 Cambodia (1) (1) (1) (1) (1) 2,000 Tajikistan (1) (1) (1) (1) (1) 484 Solomon Islands (1) (1) 417 466 503 525 Malaysia (1) (1) (1) (1) 498 16,712 Vietnam 325 385 420 424 297 (1) Myanmar 178 171 (1) (1) 345 (1) All others 194 294 298 469 468 (1) Total world 187 195 344 357 338 373 1 Not applicable.
Note.--HTS 7214.20 Other bars, hot-worked, for concrete reinforcement bars (of carbon steel, not coiled).
Source: World Trade Atlas, as reported by Korean Customs Service.

33 Canadian International Trade Tribunal, Certain Concrete Reinforcing Bar Originating in or Exported from theRepublic of Indonesia, Japan, the Republic of Latvia, the Republic of Moldova, the Republic of Poland, ChineseTaipei, and Ukraine, Inquiry No. NQ-2000-007, June 1, 2001. 34 Canadian International Trade Tribunal, Hot-Rolled Deformed Carbon or Low Alloy Steel Concrete ReinforcingBar in Straight Lengths or in Coils, Originating in or Exported from the Republic of Indonesia, Japan, the Republicof Latvia, the Republic of Moldova, the Republic of Poland, Chinese Taipei, and Ukraine, Expiry No. LE-2005-002,September 14, 2005. 35 LM’s prehearing brief, May 1, 2007, p. 8. 36 Hearing transcript, pp. 184-186 (Zaharin).
IV-28
THE INDUSTRY IN LATVIA
Overview
Liepajas Metalurgs (“LM”) is the only producer of rebar in Latvia. When asked to describe thetechnology used to produce rebar, LM described the following. “***.” Table IV-21 presentscomparative information available from the original investigations and the current reviews. Capacity andproduction have grown *** from 2000 to 2006, while capacity utilization has decreased. Theconcentration in export shipments also has decreased over the period but exports remained the vastmajority of shipments.
Table IV-21Rebar: Comparison of select Latvian industry data, 2000 and 2006
* * * * * * *
Rebar Operations
Information on LM’s rebar operations is presented in table IV-22. ***. LM reported developingnew markets for its exports. ***. LM reported no barriers to its exports to countries other than theUnited States. Imports of rebar from Latvia, as well as six other countries, were subject to antidumpingduty orders in Canada between 2001 and 2006.33 However, in a notice issued September 14, 2005, theCanadian International Trade Tribunal rescinded its finding with respect to all seven subject countries,having received no submissions in support of a review and continuation of the finding.34
Table IV-22Rebar: Latvian production capacity, production, shipments, and inventories, 2001-06, withprojections for 2007-08
* * * * * * *
In its prehearing brief, LM stated that it ceased rebar exports to the United States in September2005 because its accession to the EU in 2004 made the EU market more attractive in terms of higherprices, and the higher trans-Atlantic freight rates gave LM little economic incentive to continue sales tothe United States.35 During the public hearing, an LM official testified that LM had made an effort toincrease its mandatary certification requirements as an EU supplier to 13 countries in 2006, receivespreferential transportation tariffs for shipments within the EU, has been able to develop long-term supplycontracts with end users in the EU (thereby cutting out the distributors and increasing profits), and therefore has no reason to return to the U.S. market.36 In its posthearing brief, LM provided data on EUtrends for rebar consumption. From 2002 to 2006, consumption for the EU 26 grew from 19,983,802

37 LM’s posthearing brief, exh. 2, citing data from the Eurofer Rebars Committee. 38 Domestic interested parties’ prehearing brief, p. 67. 39 Hearing transcript, p. 188 (Zaharin). 40 Submission of LM on March 23, 2007. 41 LM’s prehearing brief, p. 8.
IV-29
short tons to 25,346,546 short tons.37 Table IV-23 provides data from the World Trade Atlas on thedestinations for Latvian exports to world sources, most of which are EU destinations. Domesticinterested parties argue that press reports indicated at least 6 million metric tons of new rebar productioncapacity is expected to be brought on line in Europe, which could supplant imports from the subjectcountries, or at least prevent those countries from increasing their presence in the European market.38
LM’s capacity is based on *** hours per week, *** weeks per year. Constraints on capacity werereported to be “***.” Although LM responded that ***, capacity increased by *** percent between 2000(the end of the original period of investigations) and 2001, then *** thereafter. At the public hearing,LM’s representative testified that LM was operating currently at “95 percent of its maximal theoreticalrolling capacity, and 100 percent of its effective capacity.”39 LM’s questionnaire response mentions that***. ***.”
The IISI Steel Statistical Yearbook of 2006 lists production in Latvia for 2003 and 2004 as573,000 metric tons (631,624 short tons) and 637,000 metric tons (702,172 short tons), respectively,which are *** what was reported by LM for those years in its questionnaire response. As noted earlier inthe section of the report under “Imports from Latvia,” LM reported exports of alloy rebar to the UnitedStates of *** in its questionnaire response under HTS heading 7228. These data represent its exports ***. Although the data do not match rebar imports classified under HTS heading 7228, LM ***.40
LM’s projections call for ***, assuming the orders remain in place, and LM has *** if the orderswere revoked, according to its questionnaire response. According to LM’s prehearing brief, it does notanticipate reentering the U.S. market, even if the order is revoked, as long as the current conditions ofcompetition remain in effect.41

IV-30
Table IV-23Rebar: Quantities, values, and average unit values of exports from Latvia, by destinations, in descendingorder of quantities shipped, 2001-06
Destinations 2001 2002 2003 2004 2005 2006Quantity (short tons)
United States 40,803 51,455 67,913 117,543 37,196 0Others: United Kingdom 49,151 76,506 186,151 111,639 126,334 91,509 Germany 70,849 93,326 86,023 71,967 47,427 83,777 Ireland 29,726 19,037 56,076 61,234 68,476 81,482 Algeria 124,038 141,012 21,973 0 23,647 73,470 Lithuania 8,228 5,667 14,171 24,121 52,642 50,659 Russia 593 754 549 240 7,320 45,791 Poland 31,750 26,158 7,733 20,038 12,486 42,551 Estonia 4,969 1,736 5,711 17,978 30,600 38,231 Netherlands 10,350 30,038 32,771 40,640 39,507 28,701 Finland 2,306 15,087 9,549 17,857 25,396 25,451 Iceland 5,023 4,995 9,047 13,282 20,018 21,856 Norway 0 0 0 0 2,123 19,860 Belgium 0 0 0 6,403 10,775 13,541 Spain 2 0 0 4,318 22,643 12,744 Denmark 0 0 0 0 12,650 10,185 Portugal 0 16,719 30,569 53,107 70,841 9,926 Sweden 1,801 11,719 7,214 13,668 14,023 8,491 Nigeria 4,129 0 0 4,151 10,108 4,410 Czech Republic 0 0 0 73 321 2,630 Hungary 123 396 0 1,889 8,135 1,586 Kazakhstan 0 0 5,964 11,995 2,338 822 Slovakia 0 0 0 692 1,239 613 Belarus 844 1,403 575 0 798 143 Peru 6,053 20,665 46,288 0 28,930 0 Chile 0 0 0 7,842 8,337 0 Iran 104,257 22,032 22,044 26,819 0 0 Ukraine 0 0 1,248 8,015 0 0 Panama 10,007 6,113 10,552 0 0 0 Canada 5,572 9,781 3,461 0 0 0 Hong Kong 21,605 27,556 0 0 0 0 Singapore 0 11,107 0 0 0 0 Guatemala 22,316 5,935 0 0 0 0 Italy 0 5,598 0 0 0 0 Haiti 0 4,066 0 0 0 0 Switzerland 1 50 0 0 0 0 All others 54,378 0 0 0 0 0 Total world 608,872 608,899 625,579 635,511 684,307 668,415
Table continued on the following page.

IV-31
Table IV-23–ContinuedRebar: Quantities, values, and average unit values of exports from Latvia, by destinations, in descendingorder of quantities shipped, 2001-06
Destinations 2001 2002 2003 2004 2005 2006Value ($1,000)
United States 6542 9,707 17,704 37,585 13,741 0Others: United Kingdom 8,381 14,522 43,437 43,911 46,382 43,224 Germany 12,771 17,148 20,866 31,625 17,390 41,142 Ireland 5,015 3,793 13,392 23,444 25,051 35,825 Algeria 20,585 23,166 4,248 0 8,621 31,867 Lithuania 1,093 745 3,518 10,368 19,878 23,513 Russia 71 124 109 104 2,675 25,242 Poland 5,567 4,687 1,960 8,867 4,601 20,935 Estonia 710 271 1,442 7,686 11,587 17,803 Netherlands 1,766 5,472 7,971 15,318 13,849 12,888 Finland 417 2,895 2,659 7,916 9,953 11,612 Iceland 896 937 2,187 5,608 8,070 10,531 Norway 0 0 0 0 792 10,744 Belgium 0 0 0 2,962 3,858 5,906 Spain 0 0 0 1,146 8,262 5,607 Denmark 0 0 0 0 4,764 4,864 Portugal 0 3,113 7,635 21,656 24,192 4,612 Sweden 311 2,085 1,761 5,346 5,350 3,813 Nigeria 685 0 0 1,794 3,580 2,048 Czech Republic 0 0 0 31 129 1,307 Hungary 22 84 0 854 3,231 700 Kazakhstan 0 0 1,528 5,855 944 336 Slovakia 0 0 0 287 510 321 Belarus 102 181 99 0 246 53 Peru 1,000 3,525 9,274 0 9,134 0 Chile 0 0 0 2,967 2,757 0 Iran 16,425 4,162 4,387 9,800 0 0 Ukraine 0 0 295 1,863 0 0 Panama 1,668 1,235 2,692 0 0 0 Canada 1,064 1,870 921 0 0 0 Hong Kong 3,358 5,044 0 0 0 0 Singapore 0 1,674 0 0 0 0 Guatemala 3,680 983 0 0 0 0 Italy 0 975 0 0 0 0 Haiti 0 686 0 0 0 0 Switzerland 0 11 0 0 0 0 All others 8,955 0 0 0 0 0 Total world 101,086 109,094 148,086 246,995 249,546 314,892
Table continued on the following page.

IV-32
Table IV-23–ContinuedRebar: Quantities, values, and average unit values of exports from Latvia, by destinations, in descendingorder of quantities shipped, 2001-06
Destinations 2001 2002 2003 2004 2005 2006Average unit value (per short ton)
United States $160 $189 $261 $320 $369 (1)Others: United Kingdom 171 190 233 393 367 $472 Germany 180 184 243 439 367 491 Ireland 169 199 239 383 366 440 Algeria 166 164 193 (1) 365 434 Lithuania 133 132 248 430 378 464 Russia 120 164 199 434 365 551 Poland 175 179 253 443 368 492 Estonia 143 156 253 428 379 466 Netherlands 171 182 243 377 351 449 Finland 181 192 278 443 392 456 Iceland 178 188 242 422 403 482 Norway (1) (1) (1) (1) 373 541 Belgium (1) (1) (1) 463 358 436 Spain 129 (1) (1) 265 365 440 Denmark (1) (1) (1) (1) 377 478 Portugal (1) 186 250 408 342 465 Sweden 173 178 244 391 382 449 Nigeria 166 (1) (1) 432 354 464 Czech Republic (1) (1) (1) 423 403 497 Hungary 175 211 (1) 452 397 441 Kazakhstan (1) (1) 256 488 404 408 Slovakia (1) (1) (1) 414 412 524 Belarus 121 129 171 (1) 308 373 Peru 165 171 200 (1) 316 (1) Chile (1) (1) (1) 378 331 (1) Iran 158 189 199 365 (1) (1) Ukraine (1) (1) 236 232 (1) (1) Panama 167 202 255 (1) (1) (1) Canada 191 191 266 (1) (1) (1) Hong Kong 155 183 (1) (1) (1) (1) Singapore (1) 151 (1) (1) (1) (1) Guatemala 165 166 (1) (1) (1) (1) Italy (1) 174 (1) (1) (1) (1) Haiti (1) 169 (1) (1) (1) (1) Switzerland 158 227 (1) (1) (1) (1) All others 165 (1) (1) (1) (1) (1) Total world 166 179 237 389 365 471 1 Not applicable.
Note.--HTS 7214.20 Other bars, hot-worked, for concrete reinforcement bars (of carbon steel, not coiled).
Source: World Trade Atlas, as reported by EuroStat.

42 MSW’s posthearing brief, p. 2. 43 Ibid., p. 9. 44 Domestic interested parties’ prehearing brief, p. 65.
IV-33
Alternative Products
In addition to rebar, the firm produces a range of other bar products, including rounds, flat bars,and wire rod on the same equipment and machinery used to produce rebar. As presented in table IV-24,the production of other bar products increased in 2001-03, peaked in 2004-05, and declined in 2006. LMreported that it *** to switch production between rebar and other products in response to a relative pricechange of rebar vis-a-vis the price of other products, using the same equipment and labor.
Table IV-24Rebar: Latvian capacity, production, and capacity utilization for subject and nonsubject (coiled)rebar and other bar products, 2001-06
* * * * * * *
THE INDUSTRY IN MOLDOVA
Overview
JSCC Moldova Steel Works (“MSW”) is the only producer of rebar in Moldova. When asked todescribe the technology used to produce rebar, MSW described the following. “***.” Table IV-25presents comparative information available from the original investigations and the current reviews. Capacity and production have grown from 2000 to 2006, and capacity utilization has decreased. Theconcentration in export shipments has increased since 2000.
Table IV-25Rebar: Comparison of select Moldovan industry data, 2000 and 2006
* * * * * * *
Rebar Operations
Information on MSW’s rebar operations is presented in table IV-26. ***. Most of MSW’soutput is shipped to ***. MSW reported developing new export markets in ***. According to MSW’sposthearing brief, for the last several years, it has been supplying rebar to nearby markets, such as Russiaand Ukraine, which have shown considerable growth and strong demand and increasing prices.42 Russiahas been cited as one of the fastest growing markets for rebar, and is expected to remain so.43 However,domestic interested parties allege that the Russian industry is bringing almost 5 million metric tons ofrebar capacity on line between 2007 and 2010. This new capacity could displace any imports from thesubject countries or prevent any growth in their exports to Russia.44

45 Canadian International Trade Tribunal, Certain Concrete Reinforcing Bar Originating in or Exported from theRepublic of Indonesia, Japan, the Republic of Latvia, the Republic of Moldova, the Republic of Poland, ChineseTaipei, and Ukraine, Inquiry No. NQ-2000-007, June 1, 2001. 46 Canadian International Trade Tribunal, Hot-Rolled Deformed Carbon or Low Alloy Steel Concrete ReinforcingBar in Straight Lengths or in Coils, Originating in or Exported from the Republic of Indonesia, Japan, the Republicof Latvia, the Republic of Moldova, the Republic of Poland, Chinese Taipei, and Ukraine, Expiry No. LE-2005-002,September 14, 2005. 47 Submission by domestic interested parties, September 20, 2006, p. 25. 48 MSW’s posthearing brief, pp. 3-4.
IV-34
Table IV-26Rebar: Moldovan production capacity, production, shipments, and inventories, 2001-06, withprojections for 2007-08
* * * * * * *
MSW reported no barriers to its exports to countries other than the United States. Imports ofrebar from Moldova, as well as six other countries, were subject to antidumping duty orders in Canada between 2001 and 2006.45 However, in a notice issued September 14, 2005, the Canadian InternationalTrade Tribunal rescinded its finding with respect to all seven subject countries, having received nosubmissions in support of a review and continuation of the finding.46
Capacity is based on *** hours per week, *** weeks per year. Constraints on capacity werereported to be “***.” Capacity increased by *** percent between 2000 (the end of the original period ofinvestigations) and 2001, then ***. MSW’s questionnaire response mentions that during ***. Although***, domestic interested parties maintain that MSW plans to install a new continuous caster, which wouldincrease efficiency and enable the production of higher steel grades.47 MSW reported that the continuouscaster would allow it to offer a wider range of products but would not increase its capacity.48
MSW’s projections ***, assuming the orders remain in place, and MSW *** if the orders wererevoked, according to its questionnaire response.
Alternative Products
In addition to rebar, MSW produces plain round bar and merchant bar (angle bar) on the sameequipment and machinery used to produce rebar. As presented in table IV-27, the production of other barand merchant bar products fluctuated during the period. When asked if it was able to switch fromproducing rebar to producing other products in response to a relative price change of rebar vis-a-vis theprice of other products, using the same equipment and labor, MSW replied ***. “***.”
Table IV-27Rebar: Moldovan capacity, production, and capacity utilization for subject and nonsubject (coiled)rebar and other bar products, 2001-06
* * * * * * *

49 Certain Steel Concrete Reinforcing Bars From Indonesia, Poland, and Ukraine, Invs. Nos. 731-TA-875, 880,and 882 (Final), USITC Publication 3425, p. VII-7. 50 CMCZ reported that *** percent of its total sales in the most recent fiscal year was represented by sales ofrebar. 51 CMCZ did not provide data for the years prior to 2004.
IV-35
THE INDUSTRY IN POLAND
Overview
The Commission identified two producers of rebar in Poland - Huta Ostrowiec and HutaZawiercie - in the original investigations.49 In the current review, domestic interested parties identifiedfour potential producers of rebar in Poland in a response to the Commission's notice of institution, butonly CMC Zawiercie (“CMCZ”) replied to the Commission's foreign producers' questionnaire, providingdata from 2004 to 2006.50 Comparing CMCZ’s reported 2005 production with IISI’s reported productionfor Poland in 2005, CMCZ accounted for an estimated *** percent of rebar production in Poland in 2005. When asked to describe the technology used to produce rebar, CMCZ described the following. ***.
Table IV-28 presents comparative information available from the original investigations andthese reviews.
Table IV-28Rebar: Comparison of select Polish industry data, 2000 and 2005
Item 2000 2005
Capacity (short tons) *** (1)
Production (short tons) *** 946,0002
Capacity utilization (percent) *** (1)
Exports/shipments (percent) *** 33.02 3
Inventories/shipments (percent) *** (1)
1 Data not available. 2 Data from IISI's Steel Statistical Yearbook 2006, p. 56. Data include small amounts of products outside the scope. Originaldata published in metric tons, which were converted to short tons by multiplying by 1.102311. 3 Exports/production. Based on production statistics from IISI and export statistics from the World Trade Atlas.
Note.--Data for 2000 were provided by Huta Ostrowiec and Huta Zawiercie. Data for 2005 were calculated from IISI and WorldTrade Atlas data.
Source: Confidential original report (INV-Y-087, May 1, 2001), table VII-8; International Iron and Steel Institute's Steel StatisticalYearbook 2006, p. 56 for 2005 production; and World Trade Atlas, Polish Exports under HS 721420 for 2005 exports.
Rebar Operations
Information on CMCZ’s rebar operations is presented in table IV-29. Home market salesconstituted *** percent of its shipments. From 2004 to 2006,51 the share of shipments to its home market***. The remainder of CMCZ’s shipments were *** exported to the European Union, with *** exportsto the United States. CMCZ reported that it ***. CMCZ did not identify any barriers to trade in anycountries other than the United States, but imports of rebar from Poland, as well as six other countries,

52 Canadian International Trade Tribunal, Certain Concrete Reinforcing Bar Originating in or Exported from theRepublic of Indonesia, Japan, the Republic of Latvia, the Republic of Moldova, the Republic of Poland, ChineseTaipei, and Ukraine, Inquiry No. NQ-2000-007, June 1, 2001. 53 Canadian International Trade Tribunal, Hot-Rolled Deformed Carbon or Low Alloy Steel Concrete ReinforcingBar in Straight Lengths or in Coils, Originating in or Exported from the Republic of Indonesia, Japan, the Republicof Latvia, the Republic of Moldova, the Republic of Poland, Chinese Taipei, and Ukraine, Expiry No. LE-2005-002,September 14, 2005. 54 http://www.cmcpoland.com/2, retrieved March 15, 2007. 55 “Commercial Metals Company acquires shares of CMC Zawiercie held by Polish state treasury,”CNNMoney.com, March 2, 2007,http://money.cnn.com/news/newsfeeds/articles/prnewswire/DAF01102032007-1.htm, retrieved on March 15, 2007. 56 E-mail from ***, June 1, 2007. 57 http://www.celsaho.com/en/zonapublica/index.aspx, retrieved on March 15, 2007. 58 http://www.celsaho.com/en/zonapublica/empresa.aspx, retrieved on March 15, 2007. The rolled productdivision produces rebar, plain bar, flat bar, squares, and angles. 59 http://www.commercialmetals.com/cmcz.asp, retrieved on March 15, 2007. 60 Bianca Markram, “Arcelor tender targets $37.4M construction of Polish bar mill,” American Metal Market,September 7, 2005. 61 Mittal’s posthearing brief, exh. 3.
IV-36
were subject to antidumping duty orders in Canada between 2001 and 2006.52 However, in a noticeissued September 14, 2005, the Canadian International Trade Tribunal rescinded its finding with respectto all seven subject countries, having received no submissions in support of a review and continuation ofthe finding.53
Table IV-29Rebar: CMCZ’s production capacity, production, shipments, and inventories, 2001-06, withprojections for 2007-08
* * * * * * *
CMCZ’s capacity increased by nearly *** short tons between 2004 and 2006 while productionincreased by less than *** short tons, resulting in a capacity utilization rate of *** percent in 2006. CMCZ has experienced several changes since 2000. On December 3, 2003, Commercial Metals(International) AG, a subsidiary of CMC, acquired a 71-percent interest in Huta Zawiercie and changedits name to CMC Zawiercie.54 In early 2007, CMC purchased all of the shares that were owned by thePolish government, and now owns 99 percent of CMCZ.55 CMC has made ***. Improvements ***. CMCZ ***. CMCZ reported in its questionnaire response that it anticipates ***56 ***.
With respect to the broader Polish rebar industry, in 2003, Huta Ostrowiec was acquired by theCelsa Group.57 It had planned a modernization in April 2007 that would increase total steel production to1.2 million metric tons, which will predominantly be aimed at the Polish market.58 The company shipsmainly to customers in Poland, but also to surrounding markets through rail services and port facilitieswithin Poland.59 Arcelor has plans to begin producing rebar and merchant bar by 2007 in Poland to servethe construction market in Poland.60 The new mill is expected to have *** net tons of rebar production bylate 2007.61
The quantity of Polish exports increased nearly threefold over the review period, from 113,702short tons in 2001 to 340,022 short tons in 2006, while the value increased by more than a factor of eight. Germany was Poland’s biggest export market, both in terms of quantity and value. Poland exported no

62 http://europa.eu/abc/european_countries/eu_members/poland/index_en.htm, retrieved on June 4, 2007.
IV-37
rebar to the United States during the period for which data were collected. Table IV-31 presents availabledata on Polish production and exports.
Table IV-30 presents general data for Polish capacity, production, and exports of rebar from 2001to 2006, and table IV-31 provides data on rebar exports from Poland to the United States and to Poland'sprimary foreign rebar markets. Poland entered the EU in 2004.62 Since its entry, Polish exports to EUMember States increased, and, in 2006, eight of its top ten export markets for rebar were EU MemberStates. Total Polish exports also increased during the period for which data were collected, tripling fromtheir 2001 level to their 2006 level.
Table IV-30Rebar: General data for Polish capacity, production, and exports, 2001-06
Item 2001 2002 2003 2004 2005 2006
Capacity (short tons) (1) (1) (1) (1) *** ***
Production (short tons) (1) 787,000 918,000 1,048,000 946,000 (1)
Exports (short tons) 113,702 99,579 144,760 276,890 282,943 340,022
1 Not available.
Note.–Data originally published in metric tons, converted to short tons by dividing by 0.90718474.
Source: IISI Steel Statistical Yearbook 2006 for production for 2002-05. ***, in domestic interested parties' prehearing brief, exh. 7,for capacity 2005-06. World Trade Atlas for exports for 2001-06.

IV-38
Table IV-31Rebar: Quantities, values, and average unit values of exports from Poland, by destinations, in descendingorder of quantities shipped, 2001-06
Destinations 2001 2002 2003 2004 2005 2006Quantity (short tons)
United States 0 0 0 0 0 0Others: Germany 18,353 40,351 64,548 58,794 69,949 94,954 Czech Republic 23,613 21,076 29,522 62,130 45,927 69,546 Slovakia 14,966 10,515 11,703 22,889 35,968 46,396 Hungary 43,089 24,941 30,695 35,672 50,582 41,027 Portugal 0 0 0 0 18,835 35,249 Sweden 84 107 0 4,685 15,119 15,864 Norway 1 1 0 12,806 15,138 10,889 Lithuania 0 144 0 504 4,673 10,764 Latvia 1 0 0 0 608 3,245 Croatia 0 0 662 2,685 1,496 3,000 Estonia 0 0 0 52 1,873 2,620 United Kingdom 411 333 3,373 1,442 903 1,494 Denmark 0 0 0 323 927 1,179 Italy 0 0 0 448 1,346 965 Finland 0 0 0 0 5,634 874 Belgium 25 0 0 0 1,273 741 Slovenia 0 438 0 7,098 2,245 529 Netherlands 1 109 163 2,643 879 363 Russia 0 76 0 0 0 310 Belarus 0 0 0 0 283 19 Iceland 0 0 0 0 3,337 0 Bulgaria 0 0 0 0 2,989 0 Ireland 0 0 112 1,117 2,212 0 Austria 660 56 0 3,255 441 0 Switzerland 0 0 26 0 182 0 Luxembourg 0 0 0 546 131 0 Tunisia 0 0 0 30,059 0 0 Algeria 11,216 0 0 21,950 0 0 Israel 0 0 0 7,651 0 0 France 0 26 28 82 0 0 Sao Tome and Principe 0 0 0 57 0 0 Ukraine 0 0 65 7 0 0 Kazakhstan 0 0 3,857 0 0 0 All others 1,284 1,409 4 0 0 0 Total world 113,702 99,579 144,760 276,890 282,943 340,022
Table continued on the following page.

IV-39
Table IV-31–ContinuedRebar: Quantities, values, and average unit values of exports from Poland, by destinations, in descendingorder of quantities shipped, 2001-06
Destinations 2001 2002 2003 2004 2005 2006Value ($1,000)
United States 0 0 0 0 0 0Others: Germany 3,176 7,584 14,991 25,543 25,634 44,552 Czech Republic 4,273 3,914 7,828 24,545 18,132 34,254 Slovakia 2,742 2,182 3,220 9,662 13,639 23,056 Hungary 7,805 5,043 8,338 14,871 18,526 20,058 Portugal 0 0 0 0 7,601 17,752 Sweden 18 19 0 2,198 5,851 7,683 Norway 0 1 0 5,037 6,397 4,724 Lithuania 0 23 0 209 1,697 5,558 Latvia 0 0 0 0 203 1,726 Croatia 0 0 192 1,003 627 1,408 Estonia 0 0 0 22 682 1,384 United Kingdom 217 154 835 559 320 631 Denmark 0 0 0 147 362 589 Italy 0 0 0 244 539 553 Finland 0 0 0 0 2,273 440 Belgium 8 0 0 0 483 338 Slovenia 0 87 0 2,588 872 216 Netherlands 0 22 34 1,196 336 185 Russia 0 12 0 0 0 172 Belarus 0 0 0 0 87 20 Iceland 0 0 0 0 1,350 0 Bulgaria 0 0 0 0 1,129 0 Ireland 0 0 29 433 783 0 Austria 116 10 0 1,517 156 0 Switzerland 0 0 6 0 68 0 Luxembourg 0 0 0 231 52 0 Tunisia 0 0 0 10,788 0 0 Algeria 1,664 0 0 7,207 0 0 Israel 0 0 0 2,512 0 0 France 0 12 6 43 0 0 Sao Tome and Principe 0 0 0 18 0 0 Ukraine 0 0 20 5 0 0 Kazakhstan 0 0 953 0 0 0 All others 282 295 1 0 0 0 Total world 20,301 19,359 36,455 110,576 107,796 165,300
Table continued on the following page.

IV-40
Table IV-31–ContinuedRebar: Quantities, values, and average unit values of exports from Poland, by destinations, in descendingorder of quantities shipped, 2001-06
Destinations 2001 2002 2003 2004 2005 2006Average unit value (per short ton)
United States (1) (1) (1) (1) (1) (1)Others: Germany $173 $188 $232 $434 $366 $469 Czech Republic 181 186 265 395 395 493 Slovakia 183 208 275 422 379 497 Hungary 181 202 272 417 366 489 Portugal (1) (1) (1) (1) 404 504 Sweden 218 175 (1) 469 387 484 Norway 298 1,315 (1) 393 423 434 Lithuania (1) 162 (1) 415 363 516 Latvia 264 (1) (1) (1) 333 532 Croatia (1) (1) 290 373 419 469 Estonia (1) (1) (1) 424 364 528 United Kingdom 528 463 248 387 354 422 Denmark (1) (1) (1) 455 391 500 Italy (1) (1) (1) 545 400 573 Finland (1) (1) (1) (1) 403 503 Belgium 306 (1) (1) (1) 379 457 Slovenia (1) 199 (1) 365 388 407 Netherlands 178 199 208 453 383 510 Russia (1) 163 (1) (1) (1) 555 Belarus (1) (1) (1) (1) 307 1,069 Iceland (1) (1) (1) (1) 405 (1) Bulgaria (1) (1) (1) (1) 378 (1) Ireland (1) (1) 259 388 354 (1) Austria 175 181 (1) 466 353 (1) Switzerland (1) (1) 241 (1) 376 (1) Luxembourg (1) (1) (1) 423 394 (1) Tunisia (1) (1) (1) 359 (1) (1) Algeria 148 (1) (1) 328 (1) (1) Israel (1) (1) (1) 328 (1) (1) France (1) 441 228 527 (1) (1) Sao Tome and Principe (1) (1) (1) 307 (1) (1) Ukraine (1) (1) 314 815 (1) (1) Kazakhstan (1) (1) 247 (1) (1) (1) All others 220 209 269 (1) (1) (1) Total world 179 194 252 399 381 486 1 Not applicable.
Note.--HTS 7214.20 Other bars, hot-worked, for concrete reinforcement bars (of carbon steel, not coiled).
Source: World Trade Atlas, as reported by EuroStat.

63 Mittal’s prehearing brief, p. 5, and exh. 2. ***. 64 Ibid.
IV-41
Alternative Products
As shown in table IV-32, in addition to rebar, CMCZ produces merchant bars (flats, rounds,squares) on the same equipment and machinery used to produce rebar. CMCZ *** able to switchproduction between rebar and other products in response to a relative price change of rebar vis-a-vis theprice of other products, using the same equipment and labor, and ***.
Table IV-32Rebar: CMCZ capacity, production, and capacity utilization for subject and nonsubject (coiled) rebar andother bar products, 2001-06
* * * * * * *
THE INDUSTRY IN UKRAINE
Overview
The major producer in Ukraine today is Mittal Steel Kryviy Rih (“Mittal”), the formerly state-owned entity previously named Krivoi Rog Mining & Metallurgical Integrated Works (“Krivorozhstal”),which supplied a response with no useful data to the Commission’s foreign producers’ questionnaire in thepreliminary phase of the original investigations, and supplied the only questionnaire data in these reviews. In its questionnaire response, Mittal claimed to account for about *** percent of the Ukraine market. In itsprehearing brief, Mittal claims that its share of Ukraine production is actually over *** percent, citing asits source ***.63 The original petition and the response to the notice of institution of these reviews namedfive producers of rebar in Ukraine. In addition to Mittal, identified producers included: Dneprovsky Iron& Steel, Makeevska Steel Works, Makeyevsky Iron & Steel, and Yenakievo Iron & Steel. With theexception of Mittal, none of the firms responded to the Commission’s foreign producers’ questionnaire. ***, cited in Mittal’s prehearing brief, lists Yenakievo as accounting for about *** percent of Ukraineproduction in 2006 and Makeevka as accounting for *** percent of production during the same year.64 *** data provided by domestic interested parties in their prehearing brief provided capacity shares for2006 for Ukraine as follows: Mittal (*** percent) and Doneetsk Iron & Steel (DMZ) (*** percent).
When asked to describe the technology used to produce rebar, Mittal described the following. “***.”
Rebar Operations
Information on Mittal’s rebar operations is presented in table IV-33. Capacity is based on *** perweek. Constraints on capacity were reported to be “***.” Capacity ***.
Table IV-33Rebar: Mittal’s production capacity, production, shipments, and inventories, 2001-06, with projections for2007-08
* * * * * * *

65 Mittal’s prehearing brief, p. 10 and fn. 33. 66 Mittal’s prehearing brief, pp. 15-16. 67 Domestic interested parties’ prehearing brief, p. 66. 68 Mittal’s prehearing brief, p. 17. 69 Domestic interested parties’ prehearing brief, p. 65. 70 Domestic interested parties’ prehearing brief, exh. 7, ***. 71 Mittal’s posthearing brief, exh. 30. 72 http://rus.istil.com.ua, retrieved on June 4, 2007. 73 Domestic interested parties’ prehearing brief, exh. 7, and posthearing brief, exh. 3. 74 Mittal’s posthearing brief, exh. 30. 75 According to Mittal, it has no incentive to ship from its Ukraine facility to the United States, and endanger thecommercial positions of its North American facilities. Future exports of Mittal Ukraine would be coordinated by aregional marketing office in Dubai, and then through Arcelor Mittal in Chicago. Any exports from Mittal Ukrainewould be strictly coordinated to ensure maximum profitability and to make sure that the interests of five importantArcelor Mittal mills in North America, as well as those of all other affiliates, are taken into account. Mittal’sposthearing brief, pp. 4-5. According to domestic interested parties, Mittal Kryviy Rih is the largest of Mittal’s
(continued...)
IV-42
***. Mittal reported ***.***.65 Most of Mittal’s output is shipped to ***. According to Mittal, Dubai is a market of
tremendous growth in the future, with the Dubai International Financial Center, an underground terminaland airport concourses, and additional airport projects, in addition to a new metro system. Saudia Arabiaintends to build two new industrial cities and ports in 2007, which will involve new construction plantsand infrastructure. Further, Iran anticipates an increase in construction in the near future of 15-20percent.66 However, domestic interested parties allege that local producers have invested in about 12million metric tons of rebar capacity to come on line by 2010, possibly displacing imports from thesubject countries or at least preventing growth in their exports.67 In addition, according to Mittal, theconstruction industry in Russia has experienced extraordinary growth in recent years, and the futuregrowth is expected to lead to an increase in rebar consumption equal to 7.2 million metric tons to 8.4million metric tons per year (according to the Russian Association of Metal Suppliers). *** estimates thatRussia will require additional rebar supplies from Mittal.68 Again, domestic interested parties argue thatRussian producers are expected to add almost 5 million metric tons of rebar capacity between 2007 and2010, thereby displacing imports from the subject countries.69
Also provided by *** were projections through 2010 for new capacity built by Istil of *** shorttons.70 Mittal has argued that in fact these data are incorrect and that Mittal representatives have calledIstil and have been assured that it does not produce rebar and has no plans to produce it.71 Istil’s web sitelists production of special bar quality rounds, but no production of rebar. Further, the firm’s web sitedescribes a modernizing project that will improve cost and energy efficiency and increase productionvolume and quality control of existing products.72 In addition, domestic interested parties have allegedthat the firm “Eurofinance” plans to add 1,800,000 tons of capacity in Ukraine in 2007-10.73 Mittal hasargued that it is unclear whether the Eurofinance project will go forward, that the production would beginin late 2010, and that according to a news article, the capacity would be 800,000 metric tons. It alsobelieves that about half of the production would be destined for the Ukraine market, where there would bea projected shortage of rebar.74
Mittal is part of a large world-wide steel company, now Arcelor Mittal, with over 10 millsproducing rebar, including five facilities in Canada (two mills), the United States, and Mexico (twomills). With the April 23, 2007, acquisition of Mexican long steel producer Sicartsa, Mittal acquiredBorder Steel in Texas.75 Table IV-34 lists Arcelor Mittal’s world-wide rebar facilities and their

75 (...continued)world-wide rebar facilities, and a rational group-wide strategy for Mittal would require subsidiaries to act in amanner that maximizes the profits of the group, rather than of any individual subsidiary. Given the large Ukrainecapacity and the high U.S. rebar prices, the domestic interested parties argue that a strategy of maximizing the entiregroup’s profits could result in Mittal Kryviy Rih exporting rebar to the United States. Domestic interested parties’posthearing brief, exh. d., p. 1. 76 Mittal’s posthearing brief, exh. 3. 77 Mittal’s posthearing brief, exh. 1, p. 20. 78 Canadian International Trade Tribunal, Certain Concrete Reinforcing Bar Originating in or Exported from theRepublic of Indonesia, Japan, the Republic of Latvia, the Republic of Moldova, the Republic of Poland, ChineseTaipei, and Ukraine, Inquiry No. NQ-2000-007, June 1, 2001. 79 Canadian International Trade Tribunal, Hot-Rolled Deformed Carbon or Low Alloy Steel Concrete ReinforcingBar in Straight Lengths or in Coils, Originating in or Exported from the Republic of Indonesia, Japan, the Republicof Latvia, the Republic of Moldova, the Republic of Poland, Chinese Taipei, and Ukraine, Expiry No. LE-2005-002,September 14, 2005.
IV-43
Table IV-34Rebar: Arcelor Mittal’s world plants, their production, shipments, and exports to the United States,in net tons, 2006-07
* * * * * * *
production and shipments to the United States in 2006-07.76 The majority of Arcelor Mittal’s worldexports to the United States are from its Mexican plant, followed by its Brazilian plant.
Mittal’s exports are subject to barriers in Russia (a countervailing duty (“CVD”) rate of 21percent imposed in 2002) and in the EU (quota of 235,750 metric tons in 2007, imposed in 1995). ***. In 2005 Ukraine exported *** metric tons to Russia. In 2006 it increased its exports to *** metric tons,despite the CVD tariff. In 2007, Mittal expects to export *** metric tons to Russia.77 Imports of rebarfrom Ukraine, as well as six other countries, were subject to antidumping duty orders in Canada between2001 and 2006.78 However, in a notice issued September 14, 2005, the Canadian International TradeTribunal rescinded its finding with respect to all seven subject countries, having received no submissionsin support of a review and continuation of the finding.79 Table IV-35 presents Ukraine exports to worldmarkets.

IV-44
Table IV-35Rebar: Quantities, values, and average unit values of exports from the Ukraine, by destinations, indescending order of quantities shipped, 2001-06
Destinations 2001 2002 2003 2004 2005 2006Quantity (short tons)
United States (1) 134 0 0 0 0Others: Algeria (1) 475,670 960,650 1,220,688 1,100,340 831,919 Syria (1) 486,789 552,220 397,686 550,916 506,521 Russia (1) 49,438 12,245 134,182 40,065 240,887 Libya (1) 12,016 14,701 8,016 5,716 210,247 Iran (1) 159,124 347,506 213,076 255,377 148,732 Azerbaijan (1) 22,136 33,492 69,707 89,214 146,297 Jordan (1) 9,048 0 0 22,376 93,729 Georgia (1) 29,252 35,933 28,269 36,666 83,256 Panama (1) 37,851 0 27,667 6,063 82,949 Yugoslavia (1) 30,724 143,472 99,712 64,562 67,531 United Arab Emirates (1) 5,484 0 92,277 0 65,733 Pakistan (1) 0 0 0 15,062 64,938 India (1) 0 5,358 21,590 34,758 60,816 Armenia (1) 15,526 14,537 16,179 31,259 55,743 Cyprus (1) 104,688 105,114 59,112 36,125 53,057 Moldova (1) 3,502 4,960 19,836 35,303 49,657 Belarus (1) 1,005 3,853 3,465 5,973 41,574 Lithuania (1) 12,389 19,641 23,843 22,318 40,549 Albania (1) 29,339 28,908 72,804 56,699 34,474 Bulgaria (1) 237,725 107,419 42,672 15,192 30,483 Italy (1) 45,750 18,761 0 36,811 29,899 Kazakhstan (1) 711 6,501 41,333 3,311 27,992 Nigeria (1) 151,760 303,684 96,686 120,394 27,928 Tunisia (1) 0 19,751 42,283 23,154 27,355 Cameroon (1) 11,532 1,767 6,333 8,575 25,151 Sudan (1) 21,444 99,592 116,811 34,985 22,942 Senegal (1) 2,541 4,241 10,285 18,206 22,721 Tanzania (1) 4,541 774 141 7,213 20,575 Canada (1) 0 0 0 0 17,659 Mauritania (1) 14,574 8,890 844 13,926 14,122 Latvia (1) 3,989 9,873 23,745 10,813 11,959 All others (1) 1,245,384 561,107 376,626 300,177 137,654 Total world (1) 3,224,068 3,424,953 3,265,868 3,001,548 3,295,050
Table continued on the following page.

IV-45
Table IV-35–ContinuedRebar: Quantities, values, and average unit values of exports from the Ukraine, by destinations, indescending order of quantities shipped, 2001-06
Destinations 2001 2002 2003 2004 2005 2006Value ($1,000)
United States (1) 28 0 0 0 0Others: Algeria (1) 75,210 204,160 350,276 355,561 288,000 Syria (1) 76,491 113,642 109,925 175,924 173,646 Russia (1) 7,942 2,502 38,519 12,449 107,708 Libya (1) 2,029 2,970 2,330 1,784 72,610 Iran (1) 27,391 69,497 62,460 82,109 52,218 Azerbaijan (1) 3,520 7,561 20,339 28,282 56,753 Jordan (1) 1,679 0 0 7,364 30,738 Georgia (1) 4,709 8,112 8,412 11,869 33,282 Panama (1) 6,617 0 7,962 2,028 28,788 Yugoslavia (1) 4,973 31,208 33,027 21,576 24,264 United Arab Emirates (1) 935 0 24,826 0 24,526 Pakistan (1) 0 0 0 5,185 21,588 India (1) 0 1,125 5,778 11,334 19,509 Armenia (1) 2,537 3,197 4,865 10,155 21,461 Cyprus (1) 16,713 22,099 14,931 11,252 20,337 Moldova (1) 564 1,070 6,326 11,443 19,738 Belarus (1) 176 845 1,059 2,042 18,280 Lithuania (1) 2,038 4,353 7,787 7,250 17,765 Albania (1) 4,707 6,461 18,710 18,341 13,760 Bulgaria (1) 38,198 23,626 12,673 4,806 11,968 Italy (1) 7,548 4,449 0 11,029 12,332 Kazakhstan (1) 132 1,500 12,299 1,090 12,147 Nigeria (1) 24,870 63,201 26,772 39,044 9,915 Tunisia (1) 0 4,371 12,736 7,569 10,003 Cameroon (1) 1,948 375 1,641 2,701 8,348 Sudan (1) 3,641 20,905 31,999 10,898 8,029 Senegal (1) 434 901 2,939 6,120 7,686 Tanzania (1) 772 162 45 2,317 7,166 Canada (1) 0 0 0 0 6,408 Mauritania (1) 2,361 1,967 253 4,553 4,740 Latvia (1) 664 2,172 7,825 3,422 5,158 All others (1) 194,692 115,869 108,837 97,012 50,686 Total world (1) 513,518 718,300 935,550 966,509 1,199,557
Table continued on the following page.

IV-46
Table IV-35–ContinuedRebar: Quantities, values, and average unit values of exports from the Ukraine, by destinations, indescending order of quantities shipped, 2001-06
Destinations 2001 2002 2003 2004 2005 2006Average unit value (per short ton)
United States (1) $211 (2) (2) (2) (2)Others: Algeria (1) 158 $213 $287 $323 $346 Syria (1) 157 206 276 319 343 Russia (1) 161 204 287 311 447 Libya (1) 169 202 291 312 345 Iran (1) 172 200 293 322 351 Azerbaijan (1) 159 226 292 317 388 Jordan (1) 186 (2) (2) 329 328 Georgia (1) 161 226 298 324 400 Panama (1) 175 (2) 288 334 347 Yugoslavia (1) 162 218 331 334 359 United Arab Emirates (1) 170 (2) 269 (2) 373 Pakistan (1) (2) (2) (2) 344 332 India (1) (2) 210 268 326 321 Armenia (1) 163 220 301 325 385 Cyprus (1) 160 210 253 311 383 Moldova (1) 161 216 319 324 397 Belarus (1) 175 219 306 342 440 Lithuania (1) 164 222 327 325 438 Albania (1) 160 223 257 323 399 Bulgaria (1) 161 220 297 316 393 Italy (1) 165 237 (2) 300 412 Kazakhstan (1) 185 231 298 329 434 Nigeria (1) 164 208 277 324 355 Tunisia (1) (2) 221 301 327 366 Cameroon (1) 169 212 259 315 332 Sudan (1) 170 210 274 312 350 Senegal (1) 171 212 286 336 338 Tanzania (1) 170 209 320 321 348 Canada (1) (2) (2) (2) (2) 363 Mauritania (1) 162 221 299 327 336 Latvia (1) 166 220 330 316 431 All others (1) 156 206 289 323 368 Total world (1) 159 210 286 322 364 1 Not available. 2 Not applicable.
Note– HTS 7214.20 Other bars, hot-worked, for concrete reinforcement bars (of carbon steel, not coiled).
Source: World Trade Atlas, as reported by the State Customs Committee of Ukraine.

80 “***.” 81 Domestic interested parties’ prehearing brief, exhibit 7. 82 The percentage growth of global rebar production could not be calculated over the entire 5-year period, asChina did not report during 2001-02. 83 Similarly, the regional and global totals understate actual output as certain major producers (e.g., Japan, Russia,Turkey, and Ukraine) did not report to the IISI during this period.
IV-47
Alternative Products
In addition to straight rebar, Mittal produces coiled rebar, rounds, squares, angles, and strips onthe same equipment and machinery used to produce rebar. As presented in table IV-36, the production ofother bar generally increased during the period. When asked if it was able to switch from producing rebarto producing other products in response to a relative price change of rebar vis-a-vis the price of otherproducts, using the same equipment and labor, Mittal replied ***.80
Table IV-36Rebar: Mittal’s capacity, production, and capacity utilization for subject and nonsubject (coiled) rebar andother bar products, 2001-06
* * * * * * *SUBJECT COUNTRIES’ CAPACITY AND PROJECTIONS
Table IV-37 presents rebar capacity from 2005 to 2010 reported by ***.81
Table IV-37Rebar: Subject countries’ capacity projections, 2005-10
* * * * * * *
GLOBAL MARKET
Production
Global production of rebar has grown substantially in recent years. According to the IISI, globalrebar production rose by 29.1 percent between 2003 and 2005.82 Regional production quantities compiledby IISI are presented in table IV-38.83

84 ***.
IV-48
Table IV-38Rebar: Global and regional production, 2001-05
Region 2001 2002 2003 2004 2005
Quantity (1,000 short tons)
North America 10,897 10,787 11,912 12,839 12,037
South America 4,569 3,311 2,884 3,445 3,347
Europe1 16,654 16,566 18,868 20,430 16,687
CIS (Russia and Ukraine) (2) (2) (2) (2) (2)
Asia3 10,791 12,077 56,725 75,452 85,151
Africa and Middle East 3,072 3,558 4,083 4,149 4,743
Total 45,983 46,300 94,470 116,314 121,966
1 Turkey not reported for 2001-05. 2 Not reported. 3 China not reported for 2001-02 and Japan not reported for 2001-05.
Source: “Table 20, Production of Concrete Reinforcing Bars.” Steel Statistical Yearbook 2006. Brussels:International Iron & Steel Institute (2006).
In addition to the public data published by IISI, *** compiles annual production data for majorrebar-producing regions. According to this source,84 global production of rebar increased by *** percentduring the five years between 1996 and 2000, and by *** percent during the six years between 2001 and2006. In terms of sheer volume, East and Southeast Asia accounted for the greatest production increasesin both periods, and is forecast to lead global production in the coming years as well. Overall, globalproduction is forecast to increase by *** percent during the five years between 2007 and 2011. In termsof the rate of increase in production levels, production increased (or is projected to increase) mostsubstantially in East and Southeast Asia during each of the periods 1996-2000; 2001-06; and 2007-2011. Data compiled by *** on historical, current, and projected global production of rebar are presented intables IV-39 through IV-41.
Table IV-39Rebar: Global and regional production, 1996-2000
* * * * * * *
Table IV-40Rebar: Global and regional production, 2001-06
* * * * * * *
Table IV-41Rebar: Forecast of global and regional production, 2007-11
* * * * * * *

85 ***. 86 During 1997-98, the Asian Financial Crisis rippled through many of East and Southeast Asian economies,including Korea. Subsequently, in 1998, Russia also experienced its own financial crisis. 87 See Part II of this report for the individual perspectives of U.S. producers, importers, and purchasers on demandin the United States and in other markets.
IV-49
Consumption
Data compiled by *** on historical, current, and forecast global consumption of rebar arepresented in tables IV-42-44.85 Worldwide consumption of rebar increased by *** percent during thefive-year period between 1996 and 2000, as consumption in North America and Europe grew morerapidly than consumption in East and Southeast Asia and “other” world markets, while consumption inthe C.I.S. barely grew at all (actually declining between 1998 and 2000).86 Worldwide consumption ofrebar increased by *** percent during the six-year period between 2001 and 2006, paced by rapidconsumption growth in East and Southeast Asia, followed by the C.I.S. and Europe. Global consumptionof rebar is forecast to continue to grow in the coming years, with the most rapid increase during the five-year period between 2007 and 2011 forecast for East and Southeast Asia and “other” world markets.87
Table IV-42Rebar: Global and regional consumption, 1996-2000
* * * * * * *
Table IV-43Rebar: Global and regional consumption, 2001-06
* * * * * * *
Table IV-44Rebar: Forecast of global and regional consumption, 2007-2011
* * * * * * *
Prices
The Commission asked producers, importers, and purchasers to compare prices for rebar in U.S.and non-U.S. markets. Domestic producers did not provide price comparisons, nor did most of the U.S.importers. Among importers that did so, *** were the most detailed– current prices (including freight)are the same ($*** per metric ton) in the United States, India, the Middle East and Europe. By contrast,*** noted that rebar prices in the U.S. market are a bit higher than in any other country’s market, whereas*** responded that international prices exceed U.S. prices. *** noted that prices in the U.S. market werenormally higher than in foreign markets but not since 2004.
Most (16 of 22) of the U.S. purchasers provided price-shift comparisons for rebar from U.S.versus foreign sources. Among those responding, *** reported that U.S. and foreign prices changed bythe same amount. *** further noted that U.S. prices are now still higher, whereas *** indicated that theyare now still lower than foreign prices. By contrast, among those reporting that U.S. prices have changedrelative to foreign prices, *** noted that U.S. prices are now higher, whereas *** noted that they are nowlower than foreign prices. *** also reported that U.S. prices have changed relative to foreign prices butdid not specify whether U.S. prices are now higher or lower relative to foreign prices.

88 Purchasers were asked to rank “lower price,” among various other product and market characteristics, for rebarpurchased from source A compared to source B, as either “superior” (i.e., a lower price for rebar from source Acompared to source B), “comparable” (the same or similar price), or “inferior” (higher price). 89 ***. 90 The world average price reported here is an arithmetic average of the high and low transaction prices reportedfor the month. MEPS world transaction prices are an arithmetic average of the transaction prices identified in theEU, North America, and Asia, converted into U.S. dollars. MEPS, International Steel Review, January 2005 - May2007 issues. 91 MEPS, International Steel Review, January 2005 - May 2007 issues.
IV-50
Domestic purchasers were also asked to compare prices for U.S.-produced rebar and thatimported from foreign sources88 of which they have knowledge. Fourteen respondents provided suchcomparisons but among them, only *** cited the subject countries among the foreign sources:
***.***.***.***.***.***.***.***.***.***.***.***.89
***.***.A fifteenth purchaser, ***.Published price data on rebar are available from several reputable sources, although often such
data are available by subscription only and cannot be reproduced without consent of their publisher. These data are collected based on different product categories, timing, and commercial considerations,and so may not be directly comparable with each other. Moreover, such data are distinct from the pricing data presented in Part V of this report, which are collected directly from U.S. producers and U.S.importers according to precise product definitions.
As reported by MEPS, world average monthly transaction prices (table IV-45)90 for rebar fellbetween January and July 2005, declining from $*** to $*** per short ton during that period. Thereafter,prices began recovering rapidly, peaking at $*** per short ton in October 2005, before slumping to $***per short ton during November and December 2005. World prices subsequently started rising again,reaching $*** per short ton by September 2006, before decreasing again starting in the following monthdown to $*** per short ton by January 2007. Subsequently, world average monthly transaction pricesturned up again to reach $*** per short ton by May 2007.
Table IV-45Rebar: World average transaction prices (high, low, and average), January 2005 - May 2007
* * * * * * *
Additional country-specific transaction prices for rebar are also compiled by MEPS,91 and showmonthly price fluctuations across major producing countries. Table IV-46 presents monthly average

92 Compiled from data published in ***. 93 Information presented in this section is primarily derived from the following sources: MEPS International SteelReview, January 2007 - May 2007 issues; ***; ***; and public sources as cited.
IV-51
negotiated transaction prices for rebar in certain subject markets and in the United States. Negotiatedtransaction prices in the United States fell in the months following January 2005, reaching the lowestpoint during the summer but recovering in early fall to values exceeding those at the beginning of theyear. By contrast, negotiated prices fell with fluctuations to a low point in the fourth quarter of 2005 inPoland and in the first quarter of 2006 in China. Prices fluctuated more frequently in Korea. Peak priceswere attained in May 2007 in Korea and Poland, while the May 2007 prices in China approached the peaklevels attained in early 2005. Higher prices were sustained over late summer-early fall 2006 in the UnitedStates, decreased in the fourth quarter of 2006, and subsequently rose to a new high in May 2007.
Table IV-46Rebar: Negotiated monthly average transaction prices (ex-mill) by subject country and the UnitedStates, January 2005 - May 2007
* * * * * * *
In addition, *** compiles country- and region-specific monthly prices for rebar, as presented intable IV-47.92 According to these data, prices in these selected markets diverged over the 18-monthperiod. U.S. prices were relatively stable through April 2006 before rising to a higher plateau that wassustained during the third quarter of 2006; U.S. prices subsequently fell during winter 2006-07 beforeturning upward again in February 2007. Prices in Germany and the United Kingdom rose withfluctuations to peak in April 2007. The EU export price increased irregularly over 2006-07. By contrast,the Japanese export price remained stable longer, through the second quarter of 2006, and then rose to alevel that was slightly above the prevailing level during the first half of the year, before increasingnoticeably in spring 2007. After starting at a stable level, the Far East price rose beginning in March-June2006; despite declining from this level, Far Eastern prices remained higher throughout the second half ofthe year compared to the early months of 2006, then increased noticeably in 2007. Finally, the price inChina rose irregularly through June 2006, then decreased irregularly over the remainder of the year,though remaining generally higher than during the first half of the year; Chinese prices subsequentlyfirmed in 2007.
Table IV-47Rebar: Prices, by country or by region, and by month, December 2005 - May 2007
* * * * * * *
Additional Global Supply and Demand Factors93
In early 2007, the global rebar market demand began emerging from the seasonal winterdownturn in non-residential construction activity. Economic growth in global regions pursuinginfrastructure development (e.g., North Africa, the Middle East, northern Europe, Russia, China, India,and certain other parts of Asia) was cited in March 2007 by one U.S. steel executive for anticipating

94 Scott Robertson, “Rebar World.” American Metal Market, March 23, 2007 (citing Murray R. McClean,President and Chief Executive Officer, CMC). 95 Scott Robertson, “Imported Rebar Sags, US Mart Starts to Slow,” American Metal Market, May 31, 2007. 96 Reportedly, according to some industry sources, Chinese steel mills re-entered the export market in the lateMay with higher prices for finished steel products, incorporating the anticipated higher net export tax levels (due tolower export tax rebate levels), that were unattractive to buyers, at the same time that exporters in other regions wereoffering lower prices. According to another report, Chinese steel exporters anticipate a shipment slowdown lastingthrough August 2007, in part, due to the new export tax rebate level adjustments and the seasonal market downturn. Phillip Price, “China’s High Export Prices Leave Buyers on Sidelines,” American Metal Market, May 30, 2007; andHongmei Li, “Steel Export Taxes Expected to Slow Chinese Shipments,” American Metal Market, May 29, 2007.
IV-52
continued growth of global demand for rebar in 2007.94 However, by May 2007, a steel trader reportedlynoted that the previously steady rebar market has weakened in the United States, and is starting to showsigns of weakening in Europe, Turkey, and certain other areas of the Middle East.95
In North America, particularly in the United States, favorable market conditions for rebar includerebounding non-residential construction activity that is not anticipated to slow down in the near future,reduced inventory levels held by service centers and end users due to slowing import levels, andsignificant order backlogs. Continued weakness of the dollar would ease import pressure on the U.S.market. Likewise, some importers reportedly are diverting rebar from the U.S. market to more lucrativeones in the Middle East.
Early in 2007, European rebar producers benefitted from stronger than normal constructiondemand due to a relatively mild winter and restocking of inventories by end users in preparation for majorinfrastructure development projects. Several new electric power plants are planned for Germany, eachwith potential to consume 500,000 metric tons of rebar. In the United Kingdom, construction demand forrebar and other long-rolled steel products has remained robust so far through May, and is anticipated toset a record in 2007. The European market did not directly import Chinese rebar which has not yetreceived EU product-consistency certification (homologation approval); rather, Turkish rebar displacedby Chinese rebar from traditional markets in the Middle East is being diverted to Europe. By March andApril 2007, European supplies tightened as more Italian rebar was diverted to North Africa and theMiddle East, and German rebar was sent to Eastern Europe. By contrast, European end-use and inventorybuild-up slackened somewhat in May 2007 to avoid holding too much “over-priced” rebar as Turkishexport prices softened. The strength of the euro relative to the dollar reportedly has eroded Europeancompetitiveness in the United States and third-country markets.
Rebar supplies are anticipated to remain tight through the summer in the Czech Republic, Poland,and Slovakia, attributable to foreseeable continued robust domestic construction activity after a mildwinter.
Russian domestic rebar producers benefitted from strong domestic demand during the first twomonths of 2007, that partially offset reduced shipments to traditional markets in the Middle East.
Residential and non-residential concrete construction activity in the Middle East, anticipated toremain robust at least through the second quarter of 2007, provided a lucrative market for imported rebarfrom China, Russia, and Turkey, among other sources. The United Arab Emirates anticipatecommissioning several new rolling mills over the next few years to help meet rising construction demandfor rebar.
East Asian and Southeast Asian rebar buyers were reportedly taking a wait-and-see approachtoward the end of 2006 regarding additional purchases of Chinese rebar in anticipation of changes toChina’s export tax and export tax rebate levels, scheduled to enter into force June 1, 2007.96 Rebardemand is anticipated to remain robust due to mild winter conditions across much of Asia. Previously,Chinese long-rolled steel products output (including rebar) exceeded domestic consumption in the fourthquarter of 2006 but exports helped relieve (and are anticipated to continue easing) the excess from the

97 Export subtotals and world totals are under-reported, because certain trade is not reported consistently fromyear to year (e.g., Ukraine) or even at all (e.g., Turkey). 98 Phillip Price, “Arcelor Mittal Finalizes Purchase of Long Products Maker Sicartsa,” American Metal Market,April 23, 2007.
IV-53
Chinese domestic market. Moreover, China is increasingly seeking new markets for its rebar in theMiddle East where prices are higher than in traditional Chinese markets in Southeast Asia. By May 2007,Chinese domestic consumption of long products (including rebar) was more robust than previouslyanticipated, attributable to the stepped-up construction pace for the 2008 Beijing Olympic Games.
Domestic demand in Taiwan was flat, attributed to slower construction activity due to high steelprices.
Indian demand for long-rolled steel products, including rebar, is anticipated to surge in the nearfuture with large anticipated national investment in infrastructure development and governmentcampaigns to promote steel use.
Brazil continued to experience recovery of domestic demand for steel in the first quarter of 2007. Demand was particularly robust for long products (including rebar) with rising domestic constructionactivity, to the point that exports of long products in March 2007 declined by 31.1 percent compared tothe same month’s level a year ago.
Monthly exports of carbon steel rebar in straight lengths are compiled for reporting countries byWorld Trade Atlas. Exports for the reporting subject countries as a group, the top-10 nonsubjectcountries as a group, and worldwide generally increased each year between 2001 and 2006, with the onlyoverall decline occurring in 2004 (table IV-48).97
Consolidation Among Global Producers
The trend of consolidation in the steel industry has encompassed U.S. firms (see Part III) andforeign firms that manufacture rebar. In addition to the purely domestic (U.S.) transactions discussedpreviously, Canadian-based Gerdau Ameristeel acquired the rebar and merchant-quality bar mini-mill inSayerville, NJ, through its merger with Canadian-based Co-Steel in October 2002 (table III-1). BorderSteel, along with other long-products facilities owned by Mexican producer Sicartsa, were acquired byLuxembourg-based Arcelor-Mittal from Sicartsa’s Mexican parent company, Grupo Villacero, whenBorder’s parent company Sicartsa was purchased from Mexico-based Villacerro in April 2007.98 CMC’sacquisition of the Polish producer, Huta Zawiercie S.A., in December 2003 (renamed CMC-Zawiercie orCMCZ), was noted in “The Industry in Poland” section of Part IV.

IV-54
Table IV-48Rebar: Reported worldwide exports from subject countries, top 10 nonsubject countries, and all othercountries, 2001-061
Exporting country 2001 2002 2003 2004 2005 2006
Quantity (short tons)China 582,681 387,606 758,314 1,176,771 1,777,625 3,745,801Ukraine (2) 3,224,068 3,424,953 3,265,868 3,001,548 3,295,050Latvia 608,872 608,899 625,579 635,511 684,307 668,415Poland 113,702 99,579 144,760 276,890 282,943 340,022Korea 283,711 80,203 13,316 84,104 474,175 239,035Belarus (3) (3) (3) (3) (3) (3)Indonesia (3) (3) (3) (3) (3) (3)Moldova (3) (3) (3) (3) (3) (3) Subtotal: Subject countries 1,588,966 4,400,356 4,966,921 5,439,144 6,220,599 8,288,323Italy 732,350 699,728 734,462 621,682 724,874 1,253,990Germany 410,710 535,870 611,533 799,223 930,299 916,796Brazil 185,570 301,935 697,756 467,161 844,622 687,097Portugal 184,629 401,494 420,675 286,726 455,718 578,559Japan 599,134 551,068 879,335 690,952 575,699 469,766France 291,523 484,385 515,327 468,263 504,800 455,399Luxembourg 505,674 505,667 503,361 512,792 325,806 442,116Czech Republic 579,958 514,146 415,773 340,886 386,933 374,572Hong Kong 56,947 72,125 214,801 179,206 239,672 368,880Greece 69,325 99,443 153,720 252,643 289,412 362,193 Subtotal: Top nonsubject 3,615,821 4,165,861 5,146,742 4,619,533 5,277,835 5,909,368All other countries 2,281,842 2,255,459 3,204,450 3,200,436 2,636,888 2,741,844 World 7,486,629 10,821,676 13,318,113 13,259,113 14,135,322 16,939,534
1 HTS code included: 7214.20, Other bars, hot-worked, for concrete reinforcement (of carbon steel, not coiled). 2 Not reported. 3 Export data for Belarus, Indonesia, and Moldova are not available.
Source: Compiled from World Trade Atlas, Global Trade Information Services, Inc., 1993-2007.

V-1
PART V: PRICING AND RELATED INFORMATION
FACTORS AFFECTING PRICING
Raw Material Costs
Raw material costs make up an important part of the final cost of rebar. Raw material costs increased from 43.0 percent of the cost of goods sold in 2001 to 61.6 percent in 2003 before declining to58.2 percent in 2005, and then increasing to 59.5 percent in 2006.
Steel scrap is the primary component in raw material costs. As shown in figure V-1, the cost ofsteel scrap rose irregularly from $68 per ton in January of 2001 to about $251 per ton in March 2004.From that time through the end of 2006 steel scrap prices fluctuated widely, while remaining substantiallyhigher than in 2001-03. During the early months of 2007 scrap prices rose further, reaching a high of$305 per short ton in March of 2007.
Figure V-1Scrap steel: Monthly prices, January 2001-April 2007
Source: No. 1 heavy melt, Chicago, AMM.com.
Transportation Costs to the U.S. Market
The calculation of transportation costs of rebar shipped to the United States from the subject countries was complicated by the sporadic availability of data. In 2006, the only imports were fromPoland and China and the values involved were too small to develop meaningful calculations oftransportation costs for that year. In the case of Belarus, the transportation costs to the United Statesamounted to 17.7 percent of the customs value in 2002, the last year that U.S. imports of rebar from

1 The estimated cost was obtained by subtracting the customs value from the c.i.f. value of the imports and then dividing by the customs value. Rebar is classified under HTS subheadings 7228.30.8050 and 7214.20.00. 2 A large percentage of shipments outside of the region was from *** plants located in ***. Without these datathe percentage of shipments of over 500 miles outside of the region ***.
V-2
Belarus occurred.1 All imports from Belarus entered a port within the specified region. For China in2004, the costs amounted to 13.8 percent, with all imports going to ports outside of the region. For Korea in 2005 the cost amounted to 13.3 percent of the customs value, with all imports going to aports outside the region. For Latvia in 2005 the cost amounted to 12.6 percent, with all imports going toa port within the region. For Poland in 2005 the cost amounted to 9.1 percent, with all imports going toports within the region.
Transportation Costs in the U.S. Market
The U.S.-inland transportation costs of rebar vary from firm to firm as a share of the total delivered price. Among the five U.S. producers that made estimates, the costs ranged from 4 to 8 percentof the delivered price for sales within the region, and from 5 to 10 percent for sales outside of the region. Among importers that provided estimates, the costs ranged from 1 percent to as much as 15 percent of thedelivered price for sales within the region, and from 5 to 11 percent for sales outside the region.
Producers and importers were asked to provide their total quantities of commercial shipmentsinvolving distances of less than 100 miles, 101 to 250 miles, 251 to 500 miles, and distances over 500miles on a national basis and within and outside of the region during 2006. None of the importers fromthe eight subject countries reported commercial shipments during 2006. Therefore all importer data werefor nonsubject countries. On a national basis for responding producers, about 26 percent of shipmentswere for distances less than 100 miles, about 36 percent were for distances between 101 and 250 miles,about 21 percent were for distances between 251 and 500 miles, and about 16 percent were over 500miles. Within the region for responding producers, about 21 percent of shipments were for distances lessthan 100 miles, about 52 percent were for distances between 101 and 250 miles, about 21 percent were fordistances between 251 and 500 miles, and about 6 percent were over 500 miles. Outside of the region forresponding producers about 34 percent of shipments were for distances less than 100 miles, about 11percent were for distances between 101 to 250 miles, about 22 percent were for distances between 251and 500 miles, and about 33 percent2 were for distances over 500 miles. On a national basis for responding importers, about 63 percent of shipments were for distances less than 100 miles, about 8percent were for distances between 101 to 250 miles, about 11 percent were for distances between 251and 500 miles, and about 18 percent were for distances over 500 miles. For responding importers’shipments within the region, about 71 percent were for distances less than 100 miles, about 10 percentwere for distances between 101 to 250 miles, about 13 percent were for distances between 251 and 500miles, and about 6 percent were for distances over 500 miles. For the relatively small quantity ofimporter shipments outside the region, about 20 percent were for distances less than 100 miles, and about80 percent were for distances over 500 miles. There were only minimal levels of shipments for distancesof 100 to 250 miles, and no shipments for distances between 251 and 500 miles.
Exchange Rates
Nominal exchange rates for the currencies of Belarus, China, Indonesia, Korea, Latvia, Moldova,Poland, and Ukraine in relation to the U.S. dollar on a quarterly basis for the period 2001-06 are

3 Real exchange rates were calculated by adjusting the nominal rates for movements in producer prices in theUnited States and in the subject countries. 4 *** reported that it changes its price monthly based upon a scrap surcharge. 5 Nucor ***, then clarified at the hearing that it applies a surcharge to its price based principally upon fluctuationsin the cost of scrap. Nucor began using this surcharge in late 2003 or early 2004, as the price of scrap was risingrapidly, in order to track movements in the price of scrap. At times when the price of scrap is going up, Nucor isforced to lower its base price in order to be competitive in the market. Hearing transcript, pp. 86-87 (Parrish).
V-3
resented in figure V-2.3 Real exchange rate data are also shown for Indonesia, Korea, Latvia, and Poland. In the case of the other four countries real exchange rates could not be computed because of the lack ofproducer price indices. The data show that the Latvian lat, the Korean won, and the Polish zlotyappreciated substantially in relation to the dollar in both nominal and real terms during the period, whilethe Chinese yuan and the Ukrainian hryvnia appreciated by smaller percentages in nominal terms. TheIndonesian rupah’s appreciation was small in nominal terms but greater in real terms. The Belarus rubeldepreciated in nominal terms during the period, while the Moldovian lei fluctuated in nominal terms.
PRICING PRACTICES
U.S. producers and importers described a variety of methods for determining the price of rebar inthe United States. One producer reported that price changes monthly based upon a scrap surcharge,4 threereported that prices are determined on a transaction by transaction basis,5 two reported that the market setsthe price, and one reported that the price is based upon the volume of the purchase, the distance from theproducer’s location, and the competitive situation. One U.S. producer with establishments both insideand outside of the region reported that it uses price lists. Among the four importers from the subjectcountries, three reported that the price is determined through transaction by transaction negotiations, andone reported that the price is determined by the market situation. For responding importers fromnonsubject countries, ten stated that prices are determined by transaction by transaction negotiations andthree reported that the market determines prices.
Most producers and importers of rebar do not have a formal discount policy based upon quantityor volume. Among seven responding producers, five reported that they do not have such a policy. One firm located inside the region reported that it generally tries not to offer discounts from regular prices, butbecause of imports, it has been offering selected terms for customers taking extra volumes. This includesdiscounts and extra payment terms for 60 days. Another firm located outside the region reported that ithas annual/quarterly volume discounts that apply to two of its end-use customers and one of its distributorcustomers. Of the other five producers, one reported that discounts are set by the market, one reportedthat its buyers receive consideration based upon the market and competitive factors, two reported thatthey do not provide quantity or volume discounts and one reported that it normally does not offer thesediscounts. Six of the seven producers reported that they do provide discounts ranging from ½ to 2 percentfor early payments of accounts. None of the four importers of rebar from the subject countries have aformal discount policy based upon volume, and none reported the use of discounts based upon the earlypayment of accounts. One of the 13 importers of rebar from the nonsubject countries reported that it doesprovide quantity and volume discounts, but none of the other 12 importers provide such discounts. Noneof these 13 importers provide discounts for early payments of accounts.
Methods of quoting prices for rebar are varied. Among seven responding producers, threegenerally quote on an f.o.b. basis and four generally quote delivered prices. Among the four importersfrom the subject countries, one quotes on an ex-dock duty paid basis, one quotes on a delivered basis, onequotes f.o.b. port of entry, and one quotes f.o.b. loaded truck. Among the 13 importers of nonsubject

V-4
Figure V-2Exchange rates: Indexes of the nominal and real exchange rates of the currencies of Belarus, China, Indonesia, Korea, Latvia, Moldova, Poland, and Ukraine relative to the U.S. dollar, byquarters, 2001-06
Continued on the following page.

V-5
Figure V-2--ContinuedExchange rates: Indexes of the nominal and real exchange rates of the currencies of Belarus, China, Indonesia, Korea, Latvia, Moldova, Poland, and Ukraine relative to the U.S. dollar, byquarters, 2001-06
Continued on the following page.

V-6
Figure V-2--ContinuedExchange rates: Indexes of the nominal and real exchange rates of the currencies of Belarus, China, Indonesia, Korea, Latvia, Moldova, Poland, and Ukraine relative to the U.S. dollar, byquarters, 2001-06
Continued on the following page.

V-7
Figure V-2--ContinuedExchange rates: Indexes of the nominal and real exchange rates of the currencies of Belarus, China, Indonesia, Korea, Latvia, Moldova, Poland, and Ukraine relative to the U.S. dollar, byquarters, 2001-06
Source: IMF International Financial Statistics, May 2007 and various earlier issues.

6 Importers that only imported from nonsubject countries were not asked to break out their sales on a spot orcontract basis. However, their questionnaire responses indicate that most such sales are on a spot basis.
V-8
imports that responded to the question, methods of quoting included f.o.b port of entry, f.o.b loaded truck,C.I.F. duty paid, and delivered. None of the producers or importers sell rebar over the internet.
Most rebar sales by both producers and importers from subject countries are on a spot basis. Ofthe few firms reporting contract sales, all were for periods of less than one year. No firms reported longterm contracts involving multiple shipments with periods of one year or more. Four of seven U.S.producers reported selling exclusively on a spot basis, one reported that 90 percent of its sales are contractand 10 percent are spot, another reported that 80 percent of its sales are contract and 20 percentare spotand a third reported 10 percent are contract and 90 percent are spot. For the three producers reportingshort-term contract sales, the contract periods are from 30 days to three months. One reported that onlythe price is fixed during this period, and the other two reported that both the price and quantity are fixed during this period. One includes a meet-or-release provision in its contracts, while theother two producers did not include this provision. When asked whether sales from subject countrieswere on a spot or contract basis during 2006, two of four importers of rebar from the subject countriesreported selling exclusively on a spot basis in 2006, while two did not import in 2006.6
PRICE DATA
The Commission asked U.S. producers and importers of rebar from Belarus, China, Indonesia,Korea, Latvia, Moldova, Poland, and Ukraine to provide quarterly data for the total quantity and f.o.bvalue of rebar that was shipped to unrelated purchasers in the U.S. market during 2001-06. The productsfor which pricing data were requested are as follows:
Product 1.–Straight ASTM A615, No. 3, grade 60 rebar
Product 2.--Straight ASTM A615, No. 4, grade 60 rebar
Product 3.--Straight ASTM A615, No. 5, grade 60 rebar
Product 4.--Straight ASTM A615, No. 6, grade 60 rebar
Seven U.S. producers provided price data for all products, with four of these firms reportingprices in all quarters. The price data reported by these producers accounted for 53 percent of U.S.domestic shipments within the region in 2006 and 67 percent of total shipments outside the region in thatyear. Among importers, some price data was reported for imports from Korea and Latvia, although nosales from these countries were reported in 2006. There was no useable price data reported for importsfrom any of the other subject countries.
Price Trends
Quarterly weighted-average f.o.b. prices during 2001-06 for the four products of U.S.-producedand imported rebar from Korea and Latvia are shown in tables V-1 through V-12 and in figure V-3. Thedata are presented for sales to the entire U.S. market as well as for sales within and outside of thespecified region. U.S. producer prices for all products increased substantially both nationally and withinand outside the region over the 2001-06 period, with the largest increases occurring in 2004. The amountof price data from Korea and Latvia is too small to determine a trend.

V-9
Table V-1Rebar: Weighted-average f.o.b. prices and quantities of domestic and imported product 1,1 and margins ofunderselling/(overselling), 2001-06
Period
United States Korea Latvia
Price(per ton)
Quantity(shorttons)
Price(per ton)
Quantity(shorttons)
Margin(percent)
Price(per ton)
Quantity(shorttons)
Margin(percent)
2001: January-March $297 26,525 $*** *** *** - - -
April-June 308 30,977 *** *** *** - - -
July-September 298 27,076 - - - - - -
October-December 287 25,178 - - - $*** *** ***
2002: January-March 281 41,405 - - - - - -
April-June 283 40,055 - - - - - -
July-September 279 40,106 - - - *** *** ***
October-December 273 36,801 - - - - - -
2003: January-March 287 45,527 - - - *** *** ***
April-June 316 47,760 - - - *** *** ***
July-September 324 56,646 - - - *** *** ***
October-December 332 40,050 - - - - - -
2004: January-March 413 34,918 - - - *** *** ***
April-June 511 27,192 - - - *** *** ***
July-September 547 23,964 - - - *** *** ***
October-December 533 26,863 - - - *** *** ***
2005: January-March 480 35,789 - - - *** *** ***
April-June 477 39,298 - - - *** *** ***
July-September 486 44,810 - - - *** *** ***
October-December 507 35,630 - - - - - -
2006: January-March 509 35,723 - - - - - -
April-June 533 40,711 - - - - - -
July-September 564 31,033 - - - - - -
October-December 545 28,209 - - - - - -
1 Product 1.– ASTM A615, No. 3, Grade 60.
Source: Compiled from data submitted in response to Commission questionnaires.
Tables V-2 (prices and quantities of product 1 sold within the specified region) and V-3 (prices andquantities of product 1 sold outside the specified region) have been suppressed.

V-10
Table V-4Rebar: Weighted-average f.o.b. prices and quantities of domestic and imported product 2,1 and margins ofunderselling/(overselling), 2001-06
Period
United States Korea Latvia
Price(per ton)
Quantity(shorttons)
Price(per ton)
Quantity(shorttons)
Margin(percent)
Price(per ton)
Quantity(shorttons)
Margin(percent)
2001: January-March $269 230,981 $*** *** *** - - -
April-June 278 250,847 *** *** *** - - -
July-September 279 233,576 - - - - - -
October-December 270 193,868 - - - $*** *** ***
2002: January-March 259 209,408 - - - - - -
April-June 263 254,634 - - - - - -
July-September 264 239,926 - - - *** *** ***
October-December 260 209,547 - - - - - -
2003: January-March 262 286,909 - - - *** *** ***
April-June 286 292,436 - - - *** *** ***
July-September 297 320,645 - - - *** *** ***
October-December 318 302,929 - - - - - -
2004: January-March 382 326,840 - - - *** *** ***
April-June 476 287,079 - - - *** *** ***
July-September 504 299,851 - - - *** *** ***
October-December 498 201,986 - - - *** *** ***
2005: January-March 464 317,033 *** *** *** *** *** ***
April-June 464 340,889 - - - *** *** ***
July-September 469 363,355 - - - *** *** ***
October-December 492 303,398 - - - - - -
2006: January-March 497 313,682 - - - - - -
April-June 517 380,590 - - - - - -
July-September 552 306,379 - - - - - -
October-December 533 248,120 - - - - - -
1 Product 2.– ASTM A615, No. 4, Grade 60.
Source: Compiled from data submitted in response to Commission questionnaires.
Tables V-5 (prices and quantities of product 2 sold within the specified region) and V-6 (prices andquantities of product 2 sold outside the specified region) have been suppressed.

V-11
Table V-7Rebar: Weighted-average f.o.b. prices and quantities of domestic and imported product 3,1 and margins ofunderselling/(overselling), 2001-06
Period
United States Korea Latvia
Price(per ton)
Quantity(shorttons)
Price(per ton)
Quantity(shorttons)
Margin(percent)
Price(per ton)
Quantity(shorttons)
Margin(percent)
2001: January-March $257 304,180 $*** *** *** - - -
April-June 267 333,163 *** *** *** - - -
July-September 268 312,457 - - - - - -
October-December 258 279,291 - - - $*** *** ***
2002: January-March 249 296,421 - - - - - -
April-June 254 346,652 - - - - - -
July-September 255 325,052 - - - *** *** ***
October-December 251 308,482 - - - - - -
2003: January-March 251 379,418 - - - *** *** ***
April-June 277 382,464 - - - *** *** ***
July-September 288 420,158 - - - *** *** ***
October-December 308 422,728 - - - - - -
2004: January-March 372 396,614 - - - *** *** ***
April-June 466 395,417 - - - *** *** ***
July-September 492 374,975 - - - *** *** ***
October-December 491 300,808 - - - *** *** ***
2005: January-March 460 416,552 *** *** *** *** *** ***
April-June 456 431,967 - - - *** *** ***
July-September 459 472,645 - - - *** *** ***
October-December 490 381,824 - - - - - -
2006: January-March 489 402,865 - - - - - -
April-June 509 453,725 - - - - - -
July-September 538 405,142 - - - - - -
October-December 525 341,902 - - - - - -
1 Product 3.– ASTM A615, No. 5, Grade 60.
Source: Compiled from data submitted in response to Commission questionnaires.
Tables V-8 (prices and quantities of product 3 sold within the specified region) and V-9 (prices andquantities of product 3 sold outside the specified region) have been suppressed.

V-12
Table V-10Rebar: Weighted-average f.o.b. prices and quantities of domestic and imported product 4,1 and margins ofunderselling/(overselling), 2001-06
Period
United States Korea Latvia
Price(per ton)
Quantity(shorttons)
Price(per ton)
Quantity(shorttons)
Margin(percent)
Price(per ton)
Quantity(shorttons)
Margin(percent)
2001: January-March $252 167,329 $*** *** *** - - -
April-June 265 182,115 *** *** *** - - -
July-September 265 173,539 - - - - - -
October-December 254 155,487 - - - $*** *** ***
2002: January-March 246 164,533 - - - - - -
April-June 250 181,641 - - - - - -
July-September 249 183,172 - - - *** *** ***
October-December 247 156,454 - - - - - -
2003: January-March 247 194,994 - - - *** *** ***
April-June 269 201,151 - - - *** *** ***
July-September 280 220,694 - - - *** *** ***
October-December 299 210,453 - - - - - -
2004: January-March 365 209,558 - - - *** *** ***
April-June 451 190,282 - - - *** *** ***
July-September 480 194,634 - - - *** *** ***
October-December 482 154,297 - - - *** *** ***
2005: January-March 454 207,079 - - - *** *** ***
April-June 450 226,633 - - - *** *** ***
July-September 454 245,932 - - - *** *** ***
October-December 488 204,730 - - - - - -
2006: January-March 487 235,944 - - - - - -
April-June 503 242,924 - - - - - -
July-September 534 230,966 - - - - - -
October-December 521 201,561 - - - - - -
1 Product 4.– ASTM A615, No. 6, Grade 60.
Source: Compiled from data submitted in response to Commission questionnaires.
Tables V-11 (prices and quantities of product 4 sold within the specified region) and V-12 (prices andquantities of product 4 sold outside the specified region) have been suppressed.

V-13
Figure V-3Rebar: Weighted-average f.o.b. prices of products 1-4, by country and by region, 2001-06
* * * * * * *
Figure V-3- ContinuedRebar: Weighted-average f.o.b. prices of products 1-4, by country and by region, 2001-06
* * * * * * *
Figure V-3- ContinuedRebar: Weighted-average f.o.b. prices of products 1-4, by country and by region, 2001-06
* * * * * * *
Figure V-3- ContinuedRebar: Weighted-average f.o.b. prices of products 1-4, by country and by region, 2001-06
* * * * * * *
Figure V-3- ContinuedRebar: Weighted-average f.o.b. prices of products 1-4, by country and by region, 2001-06
* * * * * * *
Figure V-3- ContinuedRebar: Weighted-average f.o.b. prices of products 1-4, by country and by region, 2001-06
* * * * * * *
Price Comparisons
In the current reviews, price comparisons were made between domestic products and importsfrom Korea and Latvia for the entire U.S. market, for Korea for sales within the specified region andoutside of the region and for imports from Latvia for sales within the specified region. There were nosales of imports from Latvia outside of the region. The results of these comparisons shown in table V-13indicate that imports from Korea were priced lower than the domestic product on a national basis andboth inside and outside of the specified region, in the majority of comparisons while imports from Latviawere priced higher than the domestic product in the majority of comparisons nationally and within thespecified region.

7 Certain Steel Concrete Reinforcing Bar from Indonesia, Poland, and Ukraine, Invs. Nos. 731-TA-875-880 and882 (Final), USITC Publication. 3425, May 2001 p. V-18, tables V-6 and V-7.
V-14
Table V-13Rebar: Instances and ranges of under/(over)selling, by country
Total U.S. market
CountryUnderselling Overselling
Number ofinstances
Range of margins(percent)
Number ofinstances
Range of margins(percent)
Korea 8 9.5-28.9 2 5.2-6.3
Latvia 17 0.3-22.8 31 0.9-35.8
Within the specified region
CountryUnderselling Overselling
Number ofinstances
Range of margins(percent)
Number ofinstances
Range of margins(percent)
Korea 8 7.0-28.4 - -
Latvia 16 0.8-21.4 33 1.6-37.8
Outside of the specified region
CountryUnderselling Overselling
Number ofinstances
Range of margins(percent)
Number ofinstances
Range of margins(percent)
Korea 8 13.7-31.1 2 3.0-3.1
Latvia - - - -
Source: Compiled from data submitted in response to Commission questionnaires.
During the original investigations, prices of imports from China, Korea, Indonesia, and Latviawere consistently lower than the domestic product in all price comparisons, while imports from Belarus,Poland, and Ukraine were priced lower in the majority of comparisons.7

A-1
APPENDIX A
FEDERAL REGISTER NOTICES AND THE COMMISSION’S STATEMENT ON ADEQUACY


43523 Federal Register / Vol. 71, No. 147 / Tuesday, August 1, 2006 / Notices
1 No response to this request for information is required if a currently valid Office of Management and Budget (OMB) number is not displayed; the OMB number is 3117–0016/USITC No. 06–5–158, expiration date June 30, 2008. Public reporting burden for the request is estimated to average 10 hours per response. Please send comments regarding the accuracy of this burden estimate to the Office of Investigations, U.S. International Trade Commission, 500 E Street, SW., Washington, DC 20436.
Domestic Like Product. Identify any known related parties and the nature of the relationship as defined in section 771(4)(B) of the Act (19 U.S.C. 1677(4)(B)).
(6) A list of all known and currently operating U.S. importers of the Subject Merchandise and producers of the Subject Merchandise in each Subject Country that currently export or have exported Subject Merchandise to the United States or other countries since the Order Dates.
(7) If you are a U.S. producer of the Domestic Like Product, provide the following information on your firm’s operations on that product during calendar year 2005 (report quantity data in short tons and value data in U.S. dollars, f.o.b. plant). If you are a union/ worker group or trade/business association, provide the information, on an aggregate basis, for the firms in which your workers are employed/ which are members of your association.
(a) Production (quantity) and, if known, an estimate of the percentage of total U.S. production of the Domestic Like Product accounted for by your firm’s(s’) production;
(b) The quantity and value of U.S. commercial shipments of the Domestic Like Product produced in your U.S. plant(s); and
(c) The quantity and value of U.S. internal consumption/company transfers of the Domestic Like Product produced in your U.S. plant(s).
(8) If you are a U.S. importer or a trade/business association of U.S. importers of the Subject Merchandise from the Subject Country(ies), provide the following information on your firm’s(s’) operations on that product during calendar year 2005 (report quantity data in short tons and value data in U.S. dollars). If you are a trade/ business association, provide the information, on an aggregate basis, for the firms which are members of your association.
(a) The quantity and value (landed, duty-paid but not including antidumping or countervailing duties) of U.S. imports and, if known, an estimate of the percentage of total U.S. imports of Subject Merchandise from each Subject Country accounted for by your firm’s(s’) imports;
(b) The quantity and value (f.o.b. U.S. port, including antidumping and/or countervailing duties) of U.S. commercial shipments of Subject Merchandise imported from each Subject Country; and
(c) The quantity and value (f.o.b. U.S. port, including antidumping and/or countervailing duties) of U.S. internal consumption/company transfers of
Subject Merchandise imported from each Subject Country.
(9) If you are a producer, an exporter, or a trade/business association of producers or exporters of the Subject Merchandise in the Subject Country(ies), provide the following information on your firm’s(s’) operations on that product during calendar year 2005 (report quantity data in short tons and value data in U.S. dollars, landed and duty-paid at the U.S. port but not including antidumping or countervailing duties). If you are a trade/business association, provide the information, on an aggregate basis, for the firms which are members of your association.
(a) Production (quantity) and, if known, an estimate of the percentage of total production of Subject Merchandise in each Subject Country accounted for by your firm’s(s’) production; and
(b) The quantity and value of your firm’s(s’) exports to the United States of Subject Merchandise and, if known, an estimate of the percentage of total exports to the United States of Subject Merchandise from each Subject Country accounted for by your firm’s(s’) exports.
(10) Identify significant changes, if any, in the supply and demand conditions or business cycle for the Domestic Like Product that have occurred in the United States or in the market for the Subject Merchandise in the Subject Countries since the Order Dates, and significant changes, if any, that are likely to occur within a reasonably foreseeable time. Supply conditions to consider include technology; production methods; development efforts; ability to increase production (including the shift of production facilities used for other products and the use, cost, or availability of major inputs into production); and factors related to the ability to shift supply among different national markets (including barriers to importation in foreign markets or changes in market demand abroad). Demand conditions to consider include end uses and applications; the existence and availability of substitute products; and the level of competition among the Domestic Like Product produced in the United States, Subject Merchandise produced in the Subject Countries, and such merchandise from other countries.
(11) (Optional) A statement of whether you agree with the above definitions of the Domestic Like Product and Domestic Industry; if you disagree with either or both of these definitions, please explain why and provide alternative definitions.
Authority: These reviews are being conducted under authority of title VII of the
Tariff Act of 1930; this notice is published pursuant to section 207.61 of the Commission’s rules.
Issued: July 26, 2006. By order of the Commission.
Marilyn R. Abbott, Secretary to the Commission. [FR Doc. E6–12274 Filed 7–31–06; 8:45 am] BILLING CODE 7020–02–P
INTERNATIONAL TRADE COMMISSION
[Investigation Nos. 731–TA–873–875, 877– 880, and 882 (Review)]
Steel Concrete Reinforcing Bar From Belarus, China, Indonesia, Korea, Latvia, Moldova, Poland, and Ukraine
AGENCY: International Trade Commission. ACTION: Institution of five-year reviews concerning the antidumping duty orders on steel concrete reinforcing bar from Belarus, China, Indonesia, Korea, Latvia, Moldova, Poland, and Ukraine.
SUMMARY: The Commission hereby gives notice that it has instituted reviews pursuant to section 751(c) of the Tariff Act of 1930 (19 U.S.C. 1675(c)) (the Act) to determine whether revocation of the antidumping duty orders on steel concrete reinforcing bar from Belarus, China, Indonesia, Korea, Latvia, Moldova, Poland, and Ukraine would be likely to lead to continuation or recurrence of material injury. Pursuant to section 751(c)(2) of the Act, interested parties are requested to respond to this notice by submitting the information specified below to the Commission; 1 to be assured of consideration, the deadline for responses is September 20, 2006. Comments on the adequacy of responses may be filed with the Commission by October 16, 2006. For further information concerning the conduct of these reviews and rules of general application, consult the Commission’s Rules of Practice and Procedure, part 201, subparts A through E (19 CFR part 201), and part 207, subparts A, D, E, and F (19 CFR part 207). DATES: Effective Date: August 1, 2006. FOR FURTHER INFORMATION CONTACT: Mary Messer (202–205–3193), Office of
VerDate Aug<31>2005 20:04 Jul 31, 2006 Jkt 208001 PO 00000 Frm 00091 Fmt 4703 Sfmt 4703 E:\FR\FM\01AUN1.SGM 01AUN1rwilk
ins
on P
RO
D1P
C63
with
NO
TIC
ES

43524 Federal Register / Vol. 71, No. 147 / Tuesday, August 1, 2006 / Notices
Investigations, U.S. International Trade Commission, 500 E Street, SW., Washington, DC 20436. Hearing- impaired persons can obtain information on this matter by contacting the Commission’s TDD terminal on 202– 205–1810. Persons with mobility impairments who will need special assistance in gaining access to the Commission should contact the Office of the Secretary at 202–205–2000. General information concerning the Commission may also be obtained by accessing its Internet server (http:// www.usitc.gov). The public record for these reviews may be viewed on the Commission’s electronic docket (EDIS) at http://edis.usitc.gov. SUPPLEMENTARY INFORMATION:
Background—On September 7, 2001, the Department of Commerce issued antidumping duty orders on imports of steel concrete reinforcing bar from Belarus, China, Indonesia, Korea, Latvia, Moldova, Poland, and Ukraine (66 FR 46777). The Commission is conducting reviews to determine whether revocation of the orders would be likely to lead to continuation or recurrence of material injury to the domestic industry within a reasonably foreseeable time. It will assess the adequacy of interested party responses to this notice of institution to determine whether to conduct full reviews or expedited reviews. The Commission’s determinations in any expedited reviews will be based on the facts available, which may include information provided in response to this notice.
Definitions—The following definitions apply to these reviews:
(1) Subject Merchandise is the class or kind of merchandise that is within the scope of the five-year reviews, as defined by the Department of Commerce.
(2) The Subject Countries in these reviews are Belarus, China, Indonesia, Korea, Latvia, Moldova, Poland, and Ukraine.
(3) The Domestic Like Product is the domestically produced product or products which are like, or in the absence of like, most similar in characteristics and uses with, the Subject Merchandise. In its original determinations, the Commission defined the Domestic Like Product as certain steel concrete reinforcing bar, coextensive with the scope of the Subject Merchandise.
(4) The Domestic Industry is the U.S. producers as a whole of the Domestic Like Product, or those producers whose collective output of the Domestic Like Product constitutes a major proportion
of the total domestic production of the product. In its original determinations, three Commissioners based their material injury analysis on a national industry consisting of all producers of steel concrete reinforcing bar and three Commissioners found a regional industry consisting of all domestic production facilities producing the Domestic Like Product in the region consisting of the 30 contiguous states from New England to Texas and from the Gulf of Mexico north on both sides of the Mississippi up to the Canadian border, plus the District of Columbia and Puerto Rico.
For purposes of this notice, you should report information separately on each of the following two Domestic Industries: (1) All domestic producers of steel concrete reinforcing bar and (2) domestic producers of steel concrete reinforcing bar with production facilities located in the District of Columbia, Puerto Rico, and the following 30 states: Maine, New Hampshire, Vermont, Massachusetts, Connecticut, Rhode Island, New York, New Jersey, Pennsylvania, Delaware, Virginia, Maryland, West Virginia, North Carolina, South Carolina, Georgia, Florida, Mississippi, Alabama, Tennessee, Kentucky, Ohio, Indiana, Illinois, Wisconsin, Michigan, Missouri, Arkansas, Louisiana, and Texas.
(5) The Order Date is the date that the antidumping duty orders under review became effective. In these reviews, the Order Date is September 7, 2001.
(6) An Importer is any person or firm engaged, either directly or through a parent company or subsidiary, in importing the Subject Merchandise into the United States from a foreign manufacturer or through its selling agent.
Participation in the reviews and public service list—Persons, including industrial users of the Subject Merchandise and, if the merchandise is sold at the retail level, representative consumer organizations, wishing to participate in the reviews as parties must file an entry of appearance with the Secretary to the Commission, as provided in section 201.11(b)(4) of the Commission’s rules, no later than 21 days after publication of this notice in the Federal Register. The Secretary will maintain a public service list containing the names and addresses of all persons, or their representatives, who are parties to the reviews.
Former Commission employees who are seeking to appear in Commission five-year reviews are reminded that they are required, pursuant to 19 CFR 201.15, to seek Commission approval if the matter in which they are seeking to
appear was pending in any manner or form during their Commission employment. The Commission’s designated agency ethics official has advised that a five-year review is the ‘‘same particular matter’’ as the underlying original investigation for purposes of 19 CFR 201.15 and 18 U.S.C. 207, the post employment statute for Federal employees. Former employees may seek informal advice from Commission ethics officials with respect to this and the related issue of whether the employee’s participation was ‘‘personal and substantial.’’ However, any informal consultation will not relieve former employees of the obligation to seek approval to appear from the Commission under its rule 201.15. For ethics advice, contact Carol McCue Verratti, Deputy Agency Ethics Official, at 202–205–3088.
Limited disclosure of business proprietary information (BPI) under an administrative protective order (APO) and APO service list—Pursuant to section 207.7(a) of the Commission’s rules, the Secretary will make BPI submitted in these reviews available to authorized applicants under the APO issued in the reviews, provided that the application is made no later than 21 days after publication of this notice in the Federal Register. Authorized applicants must represent interested parties, as defined in 19 U.S.C. 1677(9), who are parties to the reviews. A separate service list will be maintained by the Secretary for those parties authorized to receive BPI under the APO.
Certification—Pursuant to section 207.3 of the Commission’s rules, any person submitting information to the Commission in connection with these reviews must certify that the information is accurate and complete to the best of the submitter’s knowledge. In making the certification, the submitter will be deemed to consent, unless otherwise specified, for the Commission, its employees, and contract personnel to use the information provided in any other reviews or investigations of the same or comparable products which the Commission conducts under Title VII of the Act, or in internal audits and investigations relating to the programs and operations of the Commission pursuant to 5 U.S.C. Appendix 3.
Written submissions—Pursuant to section 207.61 of the Commission’s rules, each interested party response to this notice must provide the information specified below. The deadline for filing such responses is September 20, 2006. Pursuant to section 207.62(b) of the Commission’s rules, eligible parties (as
VerDate Aug<31>2005 20:04 Jul 31, 2006 Jkt 208001 PO 00000 Frm 00092 Fmt 4703 Sfmt 4703 E:\FR\FM\01AUN1.SGM 01AUN1rwilk
ins
on P
RO
D1P
C63
with
NO
TIC
ES

43525 Federal Register / Vol. 71, No. 147 / Tuesday, August 1, 2006 / Notices
specified in Commission rule 207.62(b)(1)) may also file comments concerning the adequacy of responses to the notice of institution and whether the Commission should conduct expedited or full reviews. The deadline for filing such comments is October 16, 2006. All written submissions must conform with the provisions of sections 201.8 and 207.3 of the Commission’s rules and any submissions that contain BPI must also conform with the requirements of sections 201.6 and 207.7 of the Commission’s rules. The Commission’s rules do not authorize filing of submissions with the Secretary by facsimile or electronic means, except to the extent permitted by section 201.8 of the Commission’s rules, as amended, 67 FR 68036 (November 8, 2002). Also, in accordance with sections 201.16(c) and 207.3 of the Commission’s rules, each document filed by a party to the reviews must be served on all other parties to the reviews (as identified by either the public or APO service list as appropriate), and a certificate of service must accompany the document (if you are not a party to the reviews you do not need to serve your response).
Inability to provide requested information—Pursuant to section 207.61(c) of the Commission’s rules, any interested party that cannot furnish the information requested by this notice in the requested form and manner shall notify the Commission at the earliest possible time, provide a full explanation of why it cannot provide the requested information, and indicate alternative forms in which it can provide equivalent information. If an interested party does not provide this notification (or the Commission finds the explanation provided in the notification inadequate) and fails to provide a complete response to this notice, the Commission may take an adverse inference against the party pursuant to section 776(b) of the Act in making its determinations in the reviews.
Information To Be Provided in Response to This Notice of Institution: If you are a domestic producer, union/ worker group, or trade/business association; import/export Subject Merchandise from more than one Subject Country; or produce Subject Merchandise in more than one Subject Country, you may file a single response. If you do so, please ensure that your response to each question includes the information requested for each pertinent Subject Country. As used below, the term ‘‘firm’’ includes any related firms.
(1) The name and address of your firm or entity (including World Wide Web address if available) and name,
telephone number, fax number, and e- mail address of the certifying official.
(2) A statement indicating whether your firm/entity is a U.S. producer of the Domestic Like Product, a U.S. union or worker group, a U.S. importer of the Subject Merchandise, a foreign producer or exporter of the Subject Merchandise, a U.S. or foreign trade or business association, or another interested party (including an explanation). If you are a union/worker group or trade/business association, identify the firms in which your workers are employed or which are members of your association.
(3) A statement indicating whether your firm/entity is willing to participate in these reviews by providing information requested by the Commission.
(4) A statement of the likely effects of the revocation of the antidumping duty orders on the Domestic Industry in general and/or your firm/entity specifically. In your response, please discuss the various factors specified in section 752(a) of the Act (19 U.S.C. 1675a(a)) including the likely volume of subject imports, likely price effects of subject imports, and likely impact of imports of Subject Merchandise on the Domestic Industry.
(5) A list of all known and currently operating U.S. producers of the Domestic Like Product. Identify any known related parties and the nature of the relationship as defined in section 771(4)(B) of the Act (19 U.S.C. 1677(4)(B)).
(6) A list of all known and currently operating U.S. importers of the Subject Merchandise and producers of the Subject Merchandise in each Subject Country that currently export or have exported Subject Merchandise to the United States or other countries since the Order Date.
(7) If you are a U.S. producer of the Domestic Like Product, provide the following information on your firm’s operations on that product during calendar year 2005 (report quantity data in short tons and value data in U.S. dollars, f.o.b. plant). If you are a union/ worker group or trade/business association, provide the information, on an aggregate basis, for the firms in which your workers are employed/ which are members of your association.
(a) Production (quantity) and, if known, an estimate of the percentage of total U.S. production of the Domestic Like Product accounted for by your firm’s(s’) production;
(b) The quantity and value of U.S. commercial shipments of the Domestic Like Product produced in your U.S. plant(s); and.
(c) The quantity and value of U.S. internal consumption/company transfers of the Domestic Like Product produced in your U.S. plant(s).
(8) If you are a U.S. importer or a trade/business association of U.S. importers of the Subject Merchandise from the Subject Country(ies), provide the following information on your firm’s(s’) operations on that product during calendar year 2005 (report quantity data in short tons and value data in U.S. dollars). If you are a trade/ business association, provide the information, on an aggregate basis, for the firms which are members of your association.
(a) The quantity and value (landed, duty-paid but not including antidumping duties) of U.S. imports and, if known, an estimate of the percentage of total U.S. imports of Subject Merchandise from each Subject Country accounted for by your firm’s(s’) imports;
(b) The quantity and value (f.o.b. U.S. port, including antidumping duties) of U.S. commercial shipments of Subject Merchandise imported from each Subject Country; and
(c) The quantity and value (f.o.b. U.S. port, including antidumping duties) of U.S. internal consumption/company transfers of Subject Merchandise imported from each Subject Country.
(9) If you are a producer, an exporter, or a trade/business association of producers or exporters of the Subject Merchandise in the Subject Country(ies), provide the following information on your firm’s(s’) operations on that product during calendar year 2005 (report quantity data in short tons and value data in U.S. dollars, landed and duty-paid at the U.S. port but not including antidumping duties). If you are a trade/business association, provide the information, on an aggregate basis, for the firms which are members of your association.
(a) Production (quantity) and, if known, an estimate of the percentage of total production of Subject Merchandise in each Subject Country accounted for by your firm’s(s’) production; and
(b) The quantity and value of your firm’s(s’) exports to the United States of Subject Merchandise and, if known, an estimate of the percentage of total exports to the United States of Subject Merchandise from each Subject Country accounted for by your firm’s(s’) exports.
(10) Identify significant changes, if any, in the supply and demand conditions or business cycle for the Domestic Like Product that have occurred in the United States or in the market for the Subject Merchandise in the Subject Countries since the Order
VerDate Aug<31>2005 20:04 Jul 31, 2006 Jkt 208001 PO 00000 Frm 00093 Fmt 4703 Sfmt 4703 E:\FR\FM\01AUN1.SGM 01AUN1rwilk
ins
on P
RO
D1P
C63
with
NO
TIC
ES

43526 Federal Register / Vol. 71, No. 147 / Tuesday, August 1, 2006 / Notices
Date, and significant changes, if any, that are likely to occur within a reasonably foreseeable time. Supply conditions to consider include technology; production methods; development efforts; ability to increase production (including the shift of production facilities used for other products and the use, cost, or availability of major inputs into production); and factors related to the ability to shift supply among different national markets (including barriers to importation in foreign markets or changes in market demand abroad). Demand conditions to consider include end uses and applications; the existence and availability of substitute products; and the level of competition among the Domestic Like Product produced in the United States, Subject Merchandise produced in the Subject Countries, and such merchandise from other countries.
(11) (Optional) A statement of whether you agree with the above definitions of the Domestic Like Product and Domestic Industry; if you disagree with either or both of these definitions, please explain why and provide alternative definitions.
Authority: These reviews are being conducted under authority of title VII of the Tariff Act of 1930; this notice is published pursuant to section 207.61 of the Commission’s rules.
By order of the Commission. Issued: July 26, 2006.
Marilyn R. Abbott, Secretary to the Commission. [FR Doc. E6–12275 Filed 7–31–06; 8:45 am] BILLING CODE 7020–02–P
INTERNATIONAL TRADE COMMISSION
[USITC SE–06–048]
Government in the Sunshine Act Meeting Notice
AGENCY HOLDING THE MEETING: United States International Trade Commission. TIME AND DATE: August 7, 2006 at 11 a.m. PLACE: Room 101, 500 E Street SW., Washington, DC 20436, Telephone: (202) 205–2000. STATUS: Open to the public. MATTERS TO BE CONSIDERED: 1. Agenda for future meetings: none.
2. Minutes. 3. Ratification List. 4. Inv. No. 731–TA–1104
(Preliminary) (Certain Polyester Staple Fiber from China)—briefing and vote. (The Commission is currently scheduled to transmit its determination to the Secretary of Commerce on August 7,
2006; Commissioners’ opinions are currently scheduled to be transmitted to the Secretary of Commerce on or before August 14, 2006.).
5. Outstanding action jackets: none. In accordance with Commission
policy, subject matter listed above, not disposed of at the scheduled meeting, may be carried over to the agenda of the following meeting.
By order of the Commission. Issued: July 27, 2006.
Marilyn R. Abbott, Secretary to the Commission. [FR Doc. 06–6644 Filed 7–28–06; 1:12 pm] BILLING CODE 7020–02–P
DEPARTMENT OF JUSTICE
Drug Enforcement Administration
Importer of Controlled Substances; Notice of Application
Prior to issuing a registration under 21 U.S.C. 952(a)(2)(B), and in accordance with 21 CFR 1301.34(a), this is notice that on April 13, 2005, Kenco VPI, Division of Kenco Group Inc., 350 Corporate Place, Chattanooga, TN 37419, has made application to the Drug Enforcement Administration (DEA) by letter to be registered as an importer of Nabilone (7379), a basic class of controlled substance listed in Schedule II.
The company plans to import the listed controlled substance for distribution to its customers.
Kenco VPI has been an importer of Schedule III–V controlled substances since June 14, 2004. On April 14, 2005, the DEA added Schedule II to the firm’s importer registration. The DEA also added the drug code for Nabilone, a Schedule II controlled substance, to the firm’s registration on April 28, 2005. Both amendments to the registration were made without benefit of the required legal process for modifying the DEA registration. Kenco VPI is currently complying with the legal requirements to register as a Schedule III importer. In addition the firm was given authorization to import the Nabilone product into the United States on May 12, 2005. The Nabilone product was approved by the Food & Drug Administration on May 15, 2006. DEA has agreed to allow Kenco VPI to continue to import the Nabilone product into the United States, while the firm is completing the required legal process.
Any manufacturer who on April 13, 2005, was registered, or applying to be registered with DEA to manufacture such basic class of controlled substance
may file comments or objections to the issuance of the proposed registration and may, at the same time, file a written request for a hearing on such application pursuant to 21 CFR 1301.43 and in such form as prescribed by 21 CFR 1316.47. For purposes of this Notice, DEA has chosen recognized applicable manufacturers registered on April 13, 2005, the date on which Kenco submitted its initial request to have Nabilone added to its DEA importer registration. By employing this date, DEA seeks to equitably address its initial failure to publish Kenco’s request to import Nabilone, while at the same time allowing those entities that would have been in a position to request a hearing on April 13, 2005, had DEA filed a timely notice, the right to request a hearing.
Any such written comments or objections being sent via regular mail may be addressed, in quintuplicate, to the Deputy Assistant Administrator, Office of Diversion Control, Drug Enforcement Administration, Washington, DC 20537, Attention: DEA Federal Register Representative/ODL; or any being sent via express mail should be sent to DEA Headquarters, Attention: DEA Federal Register Representative/ ODL, 2401 Jefferson-Davis Highway, Alexandria, Virginia 22301; and must be filed no later than August 31, 2006.
This procedure is to be conducted simultaneously with and independent of the procedures described in 21 CFR 1301.34(b), (c), (d), (e), and (f). As noted in a previous notice published in the Federal Register on September 23, 1975, (40 FR 43745–46), all applicants for registration to import a basic class of any controlled substance listed in Schedule I or II are, and will continue to be, required to demonstrate to the Deputy Assistant Administrator, Office of Diversion Control, Drug Enforcement Administration, that the requirements for such registration pursuant to 21 U.S.C. 958(a), 21 U.S.C. 823(a), and 21 CFR 1301.34(b), (c), (d), (e), and (f) are satisfied.
Dated: July 26, 2006.
Joseph T. Rannazzisi, Deputy Assistant Administrator, Office of Diversion Control, Drug Enforcement Administration. [FR Doc. E6–12256 Filed 7–31–06; 8:45 am]
BILLING CODE 4410–09–P
VerDate Aug<31>2005 20:04 Jul 31, 2006 Jkt 208001 PO 00000 Frm 00094 Fmt 4703 Sfmt 4703 E:\FR\FM\01AUN1.SGM 01AUN1rwilk
ins
on P
RO
D1P
C63
with
NO
TIC
ES

43443 Federal Register / Vol. 71, No. 147 / Tuesday, August 1, 2006 / Notices
Trade Administration, Room 1870, U.S. Department of Commerce, 14th Street & Constitution Avenue, NW., Washington, DC 20230. The Department also asks parties to serve a copy of their requests to the Office of Antidumping/ Countervailing Operations, Attention: Sheila Forbes, in room 3065 of the main Commerce Building. Further, in accordance with section 351.303(f)(l)(i) of the regulations, a copy of each request must be served on every party on the Department’s service list.
The Department will publish in the Federal Register a notice of ‘‘Initiation of Administrative Review of Antidumping or Countervailing Duty Order, Finding, or Suspended Investigation’’ for requests received by the last day of August 2006. If the Department does not receive, by the last day of August 2006, a request for review of entries covered by an order, finding, or suspended investigation listed in this notice and for the period identified above, the Department will instruct the U.S. Customs and Border Protection to assess antidumping or countervailing duties on those entries at a rate equal to the cash deposit of (or bond for) estimated antidumping or countervailing duties required on those entries at the time of entry, or withdrawal from warehouse, for consumption and to continue to collect the cash deposit previously ordered.
This notice is not required by statute but is published as a service to the international trading community.
Dated: July 26, 2006. Thomas F. Futtner, Acting Office Director, AD/CVD Operations, Office 4, Import Administration. [FR Doc. E6–12366 Filed 7–31–06; 8:45 am] BILLING CODE 3510–DS–P
DEPARTMENT OF COMMERCE
International Trade Administration
Antidumping or Countervailing Duty Order, Finding, or Suspended Investigation; Advance Notification of Sunset Reviews
AGENCY: Import Administration, International Trade Administration, Department of Commerce. ACTION: Notice of Upcoming Sunset Reviews
SUPPLEMENTARY INFORMATION:
Background
Every five years, pursuant to section 751(c) of the Tariff Act of 1930, as amended, (‘‘the Act’’), the Department of Commerce (‘‘the Department’’) and the International Trade Commission automatically initiate and conduct a review to determine whether revocation of a countervailing or antidumping duty order or termination of an investigation suspended under section 704 or 734 of the Act would be likely to lead to continuation or recurrence of dumping or a countervailable subsidy (as the case may be) and of material injury. As a courtesy, the Department provides advance notice of these cases that are scheduled for sunset reviews one month before those reviews are initiated.
FOR FURTHER INFORMATION CONTACT: Zev Primor, Office 4, AD/CVD Operations, Import Administration, International Trade Administration, U.S. Department of Commerce at (202) 482–4114.
Upcoming Sunset Reviews
There are no sunset reviews scheduled for initiation in September, 2006.
For information on the Department’s procedures for the conduct of sunset reviews, See 19 CFR 351.218. This notice is not required by statute but is published as a service to the international trading community. Guidance on methodological or analytical issues relevant to the Department’s conduct of sunset reviews is set forth in the Department’s Policy Bulletin 98.3, ‘‘Policies Regarding the Conduct of Five-year (‘‘Sunset’’) Reviews of Antidumping and Countervailing Duty Orders;’’ Policy Bulletin, 63 FR 18871 (April 16, 1998) (‘‘Sunset Policy Bulletin’’). The Notice of Initiation of Five-year (‘‘Sunset’’) Reviews provides further information regarding what is required of all parties to participate in sunset reviews.
Dated: July 19, 2006.
Thomas F. Futtner, Acting Office Director, AD/CVD Operations, Office 4, Import Administration. [FR Doc. E6–12412 Filed 7–31–06; 8:45 am]
BILLING CODE 3510–DS–S
DEPARTMENT OF COMMERCE
International Trade Administration
Initiation of Five-year (‘‘Sunset’’) Reviews
AGENCY: Import Administration, International Trade Administration, Department of Commerce. SUMMARY: In accordance with section 751(c) of the Tariff Act of 1930, as amended (‘‘the Act’’), the Department of Commerce (‘‘the Department’’) is automatically initiating a five-year (‘‘Sunset Review’’) of the antidumping and countervailing duty orders listed below. The International Trade Commission (‘‘the Commission’’) is publishing concurrently with this notice its notice of Institution of Five-year Review which covers these same order. EFFECTIVE DATE: August 1, 2006. FOR FURTHER INFORMATION CONTACT: The Department official identified in the Initiation of Review(s) section below at AD/CVD Operations, Import Administration, International Trade Administration, U.S. Department of Commerce, 14th & Constitution Ave., NW., Washington, DC 20230. For information from the Commission contact Mary Messer, Office of Investigations, U.S. International Trade Commission at (202) 205–3193. SUPPLEMENTARY INFORMATION:
Background
The Department’s procedures for the conduct of Sunset Reviews are set forth in its Procedures for Conducting Five- year (‘‘Sunset’’) Reviews of Antidumping and Countervailing Duty Orders, 63 FR 13516 (March 20, 1998) and 70 FR 62061 (October 28, 2005). Guidance on methodological or analytical issues relevant to the Department’s conduct of Sunset Reviews is set forth in the Department’s Policy Bulletin 98.3 Policies Regarding the Conduct of Five-year (‘‘Sunset’’) Reviews of Antidumping and Countervailing Duty Orders; Policy Bulletin, 63 FR 18871 (April 16, 1998) (‘‘Sunset Policy Bulletin’’).
Initiation of Reviews
In accordance with 19 CFR 351.218(c), we are initiating the Sunset Review of the following antidumping and countervailing duty orders:
DOC Case No. ITC Case No. Country Product Department Contact
A–570–862 ............... 731–TA–894 PRC Foundry Coke Jim Nunno(202) 482–0783 A–823–810 ............... 731–TA–891 Ukraine Solid Agricultural Grade Ammonium Nitrate Brandon Farlander (202) 482–0182 A–357–814 ............... 731–TA–898 Argentina Certain Hot–Rolled Carbon Steel Flat Products Zev Primor (202) 482–4114 A–570–865 ............... 731–TA–899 PRC Certain Hot–Rolled Carbon Steel Flat Products Zev Primor (202) 482–4114 A–533–820 ............... 731–TA–900 India Certain Hot–Rolled Carbon Steel Flat Products Zev Primor (202) 482–4114
VerDate Aug<31>2005 21:00 Jul 31, 2006 Jkt 208001 PO 00000 Frm 00011 Fmt 4703 Sfmt 4703 E:\FR\FM\01AUN1.SGM 01AUN1rwilk
ins
on P
RO
D1P
C63
with
NO
TIC
ES

43444 Federal Register / Vol. 71, No. 147 / Tuesday, August 1, 2006 / Notices
1 In comments made on the interim final sunset regulations, a number of parties stated that the proposed five-day period for rebuttals to substantive responses to a notice of initiation was insufficient. This requirement was retained in the final sunset regulations at 19 CFR 351.218(d)(4). As provided in 19 CFR 351.302(b), however, the Department will consider individual requests for extension of that five-day deadline based upon a showing of good cause.
DOC Case No. ITC Case No. Country Product Department Contact
A–560–812 ............... 731–TA–901 Indonesia Certain Hot–Rolled Carbon Steel Flat Products Zev Primor (202) 482–4114 A–834–806 ............... 731–TA–902 Kazakhstan Certain Hot–Rolled Carbon Steel Flat Products Dana Mermelstein (202) 482–1391 A–421–807 ............... 731–TA–903 Netherlands Certain Hot–Rolled Carbon Steel Flat Products Dana Mermelstein (202) 482–1391 A–485–806 ............... 731–TA–904 Romania Certain Hot–Rolled Carbon Steel Flat Products Zev Primor (202) 482–4114 A–791–809 ............... 731–TA–905 South Africa Certain Hot–Rolled Carbon Steel Flat Products Dana Mermelstein (202) 482–1391 A–583–835 ............... 731–TA–906 Taiwan Certain Hot–Rolled Carbon Steel Flat Products Dana Mermelstein (202) 482–1391 A–549–817 ............... 731–TA–907 Thailand Certain Hot–Rolled Carbon Steel Flat Products Dana Mermelstein (202) 482–1391 A–823–811 ............... 731–TA–908 Ukraine Certain Hot–Rolled Carbon Steel Flat Products Dana Mermelstein (202) 482–1391 A–822–804 ............... 731–TA–873 Belarus Steel Concrete Reinforcing Bars Brandon Farlander (202) 482–0182 A–570–860 ............... 731–TA–874 PRC Steel Concrete Reinforcing Bars Brandon Farlander (202) 482–0182 A–560–811 ............... 731–TA–875 Indonesia Steel Concrete Reinforcing Bars Brandon Farlander (202) 482–0182 A–449–804 ............... 731–TA–878 Latvia Steel Concrete Reinforcing Bars Brandon Farlander (202) 482–0182 A–841–804 ............... 731–TA–879 Moldova Steel Concrete Reinforcing Bars Brandon Farlander (202) 482–0182 A–455–803 ............... 731–TA–880 Poland Steel Concrete Reinforcing Bars Brandon Farlander (202) 482–0182 A–580–844 ............... 731–TA–877 South Korea Steel Concrete Reinforcing Bars Brandon Farlander (202) 482–0182 A–823–809 ............... 731–TA–882 Ukraine Steel Concrete Reinforcing Bars Brandon Farlander (202) 482–0182 Countervailing Duty
Proceedings.C–357–815 .............. 701–TA–404 Argentina Certain Hot–Rolled Carbon Steel Flat Products Brandon Farlander (202) 482–0182 C–533–821 .............. 701–TA–405 India Certain Hot–Rolled Carbon Steel Flat Products Brandon Farlander (202) 482–0182 C–560–813 .............. 701–TA–406 Indonesia Certain Hot–Rolled Carbon Steel Flat Products Brandon Farlander (202) 482–0182 C–791–810 .............. 701–TA–407 South Africa Certain Hot–Rolled Carbon Steel Flat Products Dana Mermelstein (202) 482–1391 C–549–818 .............. 701–TA–408 Thailand Certain Hot–Rolled Carbon Steel Flat Products Dana Mermelstein (202) 482–1391
Filing Information
As a courtesy, we are making information related to Sunset proceedings, including copies of the Department’s regulations regarding Sunset Reviews (19 CFR 351.218) and Sunset Policy Bulletin, the Department’s schedule of Sunset Reviews, case history information (i.e., previous margins, duty absorption determinations, scope language, import volumes), and service lists available to the public on the Department’s sunset Internet website at the following address: ‘‘http://ia.ita.doc.gov/sunset/.’’ All submissions in these Sunset Reviews must be filed in accordance with the Department’s regulations regarding format, translation, service, and certification of documents. These rules can be found at 19 CFR 351.303.
Pursuant to 19 CFR 351.103(c), the Department will maintain and make available a service list for these proceedings. To facilitate the timely preparation of the service list(s), it is requested that those seeking recognition as interested parties to a proceeding contact the Department in writing within 10 days of the publication of the Notice of Initiation.
Because deadlines in Sunset Reviews can be very short, we urge interested parties to apply for access to proprietary information under administrative protective order (‘‘APO’’) immediately following publication in the Federal Register of the notice of initiation of the sunset review. The Department’s regulations on submission of proprietary information and eligibility to receive access to business proprietary
information under APO can be found at 19 CFR 351.304–306.
Information Required from Interested Parties
Domestic interested parties (defined in section 771(9)(C), (D), (E), (F), and (G) of the Act and 19 CFR 351.102(b)) wishing to participate in these Sunset Reviews must respond not later than 15 days after the date of publication in the Federal Register of this notice of initiation by filing a notice of intent to participate. The required contents of the notice of intent to participate are set forth at 19 CFR 351.218(d)(1)(ii). In accordance with the Department’s regulations, if we do not receive a notice of intent to participate from at least one domestic interested party by the 15-day deadline, the Department will automatically revoke the orders without further review. See 19 CFR 351.218(d)(1)(iii).
If we receive an order–specific notice of intent to participate from a domestic interested party, the Department’s regulations provide that all parties wishing to participate in the Sunset Review must file complete substantive responses not later than 30 days after the date of publication in the Federal Register of this notice of initiation. The required contents of a substantive response, on an order–specific basis, are set forth at 19 CFR 351.218(d)(3). Note that certain information requirements differ for respondent and domestic parties. Also, note that the Department’s information requirements are distinct from the Commission’s information
requirements.1 Please consult the Department’s regulations for information regarding the Department’s conduct of Sunset Reviews. Please consult the Department’s regulations at 19 CFR Part 351 for definitions of terms and for other general information concerning antidumping and countervailing duty proceedings at the Department.
This notice of initiation is being published in accordance with section 751(c) of the Act and 19 CFR 351.218(c).
Dated: July 27, 2006. Thomas F. Futtner, Acting Office Director, AD/CVD Operations, Office 4, Import Administration. [FR Doc. E6–12339 Filed 7–31–06; 8:45 am] BILLING CODE 3510–DS–S
DEPARTMENT OF COMMERCE
International Trade Administration
(A–489–501)
Notice of Final Results of Antidumping Duty New Shipper Review: Certain Welded Carbon Steel Pipe and Tube from Turkey
AGENCY: Import Administration, International Trade Administration, U.S. Department of Commerce.
VerDate Aug<31>2005 21:00 Jul 31, 2006 Jkt 208001 PO 00000 Frm 00012 Fmt 4703 Sfmt 4703 E:\FR\FM\01AUN1.SGM 01AUN1rwilk
ins
on P
RO
D1P
C63
with
NO
TIC
ES

66974 Federal Register / Vol. 71, No. 222 / Friday, November 17, 2006 / Notices
Clara, California. 71 FR 7995 (Feb. 15, 2006). The complaint alleged violations of section 337 of the Tariff Act of 1930, as amended, 19 U.S.C. 1337, in the importation into the United States, the sale for importation, and the sale within the United States after importation of certain incremental dental positioning adjustment appliances by reason of infringement of certain claims of U.S. Patent Nos. 6,685,469; 6,450,807 (‘‘the ‘807 patent’’); 6,394,801; 6,398,548; 6,722,880; 6,629,840; 6,699,037; 6,318,994; 6,729,876; 6,602,070; 6,471,511; and 6,227,850. The complaint also alleged violation of section 337 by reason of misappropriation of trade secrets. The complaint and notice of investigation named OrthoClear, Inc., of San Francisco, California; OrthoClear Holdings, Inc., of Tortola, British Virgin Islands; and OrthoClear Pakistan Pvt, Ltd., of Lahore, Pakistan as respondents.
On July 10, 2006, the ALJ issued an ID terminating the investigation with respect to the ‘807 patent. On July 20, 2006, the Commission determined not to review this ID.
On October 13, 2006, complainant Align Technology, Inc. and respondents OrthoClear, Inc.; OrthoClear Holdings, Inc.; and OrthoClear Pakistan Pvt., Ltd. filed a joint motion to terminate the investigation based on a consent order. On October 25, 2006, the Commission investigative attorney filed a response in support of the motion. On October 27, 2006, the ALJ issued the subject ID (Order No. 32), granting the joint motion. No petitions for review have been filed. The Commission has determined not to review the subject ID.
This action is taken under the authority of section 337 of the Tariff Act of 1930, 19 U.S.C. 1337, and Commission Rules 210.21, 210.42(h), 19 CFR 210.21, 210.42(h).
Issued: November 13, 2006. By order of the Commission.
Marilyn R. Abbott, Secretary to the Commission. [FR Doc. E6–19489 Filed 11–16–06; 8:45 am] BILLING CODE 7020–02–P
INTERNATIONAL TRADE COMMISSION
[Investigation Nos. 731–TA–873–875, 877– 880, and 882 (Review)]
Steel Concrete Reinforcing Bar From Belarus, China, Indonesia, Korea, Latvia, Moldova, Poland, and Ukraine
AGENCY: United States International Trade Commission.
ACTION: Notice of Commission determination to conduct full five-year reviews concerning the antidumping duty orders on steel concrete reinforcing bar from Belarus, China, Indonesia, Korea, Latvia, Moldova, Poland, and Ukraine.
SUMMARY: The Commission hereby gives notice that it will proceed with full reviews pursuant to section 751(c)(5) of the Tariff Act of 1930 (19 U.S.C. 1675(c)(5)) to determine whether revocation of the antidumping duty orders on steel concrete reinforcing bar from Belarus, China, Indonesia, Korea, Latvia, Moldova, Poland, and Ukraine would be likely to lead to continuation or recurrence of material injury within a reasonably foreseeable time. A schedule for the reviews will be established and announced at a later date. For further information concerning the conduct of these reviews and rules of general application, consult the Commission’s Rules of Practice and Procedure, part 201, subparts A through E (19 CFR part 201), and part 207, subparts A, D, E, and F (19 CFR part 207). DATES: Effective Date: November 6, 2006. FOR FURTHER INFORMATION CONTACT: Mary Messer (202–205–3193), Office of Investigations, U.S. International Trade Commission, 500 E Street SW., Washington, DC 20436. Hearing- impaired persons can obtain information on this matter by contacting the Commission’s TDD terminal on 202– 205–1810. Persons with mobility impairments who will need special assistance in gaining access to the Commission should contact the Office of the Secretary at 202–205–2000. General information concerning the Commission may also be obtained by accessing its internet server (http:// www.usitc.gov). The public record for these reviews may be viewed on the Commission’s electronic docket (EDIS) at http://edis.usitc.gov. SUPPLEMENTARY INFORMATION: On November 6, 2006, the Commission determined that it should proceed to full reviews in the subject five-year reviews pursuant to section 751(c)(5) of the Act. The Commission found that the domestic interested party group response to its notice of institution (71 FR 43523, August 1, 2006) was inadequate. The Commission also found that the respondent interested party group responses with respect to Belarus, Latvia, Moldova, and Ukraine were adequate and the respondent interested party group responses with respect to China, Indonesia, Korea, and Poland
were inadequate. The Commission found that other circumstances warranted conducting full reviews of the antidumping duty orders concerning steel concrete reinforcing bar from Belarus, China, Indonesia, Korea, Latvia, Moldova, Poland, and Ukraine. A record of the Commissioners’ votes, the Commission’s statement on adequacy, and any individual Commissioner’s statements will be available from the Office of the Secretary and at the Commission’s Web site.
Authority: These reviews are being conducted under authority of title VII of the Tariff Act of 1930; this notice is published pursuant to § 207.62 of the Commission’s rules.
Issued: November 13, 2006. By order of the Commission.
Marilyn R. Abbott, Secretary to the Commission. [FR Doc. E6–19475 Filed 11–16–06; 8:45 am] BILLING CODE 7020–02–P
DEPARTMENT OF JUSTICE
Drug Enforcement Administration
Importer of Controlled Substances; Notice of Application
Pursuant to 21 U.S.C. 958(i), the Attorney General shall, prior to issuing a registration under this Section to a bulk manufacturer of a controlled substance in schedule I or II and prior to issuing a regulation under 21 U.S.C. 952(a) (2) (B) authorizing the importation of such a substance, provide manufacturers holding registrations for the bulk manufacture of the substance an opportunity for a hearing.
Therefore, in accordance with 21 CFR 1301.34(a), this is notice that on September 14, 2006, Kenco VPI, Division of Kenco Group Inc., 350 Corporate Place, Chattanooga, Tennessee 37419, made application by renewal to the Drug Enforcement Administration (DEA) to be registered as an importer of Nabilone (7379), a basic class of controlled substance listed in schedule II.
The company plans to import the listed controlled substance for distribution to its customers.
Any manufacturer who is presently, or is applying to be, registered with DEA to manufacture such basic class of controlled substance may file comments or objections to the issuance of the proposed registration and may, at the same time, file a written request for a hearing on such application pursuant to 21 CFR 1301.43 and in such form as prescribed by 21 CFR 1316.47.
VerDate Aug<31>2005 16:31 Nov 16, 2006 Jkt 211001 PO 00000 Frm 00068 Fmt 4703 Sfmt 4703 E:\FR\FM\17NON1.SGM 17NON1jlent
ini o
n P
RO
D1P
C65
with
NO
TIC
ES

70509 Federal Register / Vol. 71, No. 233 / Tuesday, December 5, 2006 / Notices
Antidumping Duty Sunset Review of Solid Agricultural Grade Ammonium Nitrate from Ukraine,’’ (September 20, 2006). On October 10, 2006, the domestic interested parties submitted comments supporting the Department’s adequacy determination.
Pursuant to 19 CFR 351.218(e)(1)(ii)(C)(2), the Department has conducted an expedited sunset review of this antidumping duty order.
Scope of the Order
The merchandise covered by this order are solid, fertilizer grade ammonium nitrate (‘‘ammonium nitrate’’ or ‘‘subject merchandise’’) products, whether prilled, granular or in other solid form, with or without additives or coating, and with a bulk density equal to or greater than 53 pounds per cubic foot. Specifically excluded from this scope is solid ammonium nitrate with a bulk density less than 53 pounds per cubic foot (commonly referred to as industrial or explosive grade ammonium nitrate). The merchandise subject to this investigation is classified in the Harmonized Tariff Schedule of the United States (‘‘HTSUS’’) at subheading 3102.30.00.00. HTSUS subheadings are provided for convenience and customs purposes. The written description of the scope of the order is dispositive.
Analysis of Comments Received
All issues raised in these reviews are addressed in the ‘‘Issues and Decision Memorandum for the Expedited Sunset Review of the Antidumping Duty Order on Solid Agricultural Grade Ammonium Nitrate from Ukraine; Final Results’’ (‘‘Decision Memo’’) from Stephen J. Claeys, Deputy Assistant Secretary for Import Administration, to David M. Spooner, Assistant Secretary for Import Administration (November 29, 2006), which is hereby adopted by this notice. The issues discussed in the Decision Memo include the likelihood of continuation or recurrence of dumping and the magnitude of the margins likely to prevail if the order were to be revoked. Parties can find a complete discussion of all issues raised in these reviews and the corresponding recommendations in this public memorandum which is on file in room B–099 of the main Department building.
In addition, a complete version of the Decision Memo can be accessed directly on the Web at http://ia.ita.doc.gov/frn. The paper copy and electronic version of the Decision Memo are identical in content.
Final Results of Review The Department determines that
revocation of the antidumping duty order on ammonium nitrate from Ukraine would be likely to lead to continuation or recurrence of dumping at the rates listed below:
Producers/Exporters Margin (percent)
J.S.C. ‘‘Concern’’ Stirol 156.29 All Others rate1 ............. 156.29
1 As of February 1, 2006, Ukraine graduated to market economy status (see Final Results of Inquiry Into Ukraine’s Status as a Non-Mar-ket Economy Country, February 24, 2006 (71 FR 9520)). As a result, the Ukraine-wide rate is now the All Others rate. See Certain Cut-to- Length Carbon Steel Plate from Romania: No-tice of Final Results and Final Partial Rescis-sion of Antidumping Duty Administrative Re-view, 71 FR 12651 (March 15, 2005) and ac-companying Issues and Decision Memo-randum at Comment 2.
Notification regarding Administrative Protective Order
This notice also serves as the only reminder to parties subject to administrative protective order (‘‘APO’’) of their responsibility concerning the return or destruction of proprietary information disclosed under APO in accordance with 19 CFR 351.305. Timely notification of the return or destruction of APO materials or conversion to judicial protective order is hereby requested. Failure to comply with the regulations and terms of an APO is a violation which is subject to sanction.
We are issuing and publishing the results and notice in accordance with sections 751(c), 752(c), and 777(i)(1) of the Act.
Dated: November 29, 2006. Joseph A. Spetrini, Acting Assistant Secretary for Import Administration. [FR Doc. E6–20551 Filed 12–4–06; 8:45 am] Billing Code: 3510–DS–S
DEPARTMENT OF COMMERCE
International Trade Administration
A–822–804, A–570–860, A–560–811, A–841– 804, A–455–803, A–580–844
Steel Concrete Reinforcing Bars from Moldova, the People’s Republic of China, South Korea, Indonesia, Poland, and Belarus; Final Results of the Expedited Sunset Reviews of the Antidumping Duty Orders
AGENCY: Import Administration, International Trade Administration, Department of Commerce. SUMMARY: On August 1, 2006, the Department of Commerce (‘‘the
Department’’) initiated sunset reviews of the antidumping duty orders on steel concrete reinforcing bars from Moldova, the People’s Republic of China, South Korea, Indonesia, Poland, and Belarus pursuant to section 751(c) of the Tariff Act of 1930, as amended (‘‘the Act’’). The Department has conducted expedited (120-day) sunset reviews for these orders pursuant to 19 CFR 351.218(e)(1)(ii)(C)(2). As a result of these sunset reviews, the Department finds that revocation of the antidumping duty orders would be likely to lead to continuation or recurrence of dumping. EFFECTIVE DATE: December 5, 2006. FOR FURTHER INFORMATION CONTACT: Audrey Twyman, Damian Felton, or Brandon Farlander, AD/CVD Operations, Office 1, Import Administration, International Trade Administration, U.S. Department of Commerce, 14th Street & Constitution Avenue, NW, Washington, DC 20230; telephone: (202) 482–3534, (202) 482– 0133, and (202) 482–4136, respectively. SUPPLEMENTARY INFORMATION:
Background
On August 1, 2006, the Department published the notice of initiation of the sunset reviews of the antidumping duty orders on steel concrete reinforcing bars (‘‘rebar’’) from Moldova, the People’s Republic of China (‘‘PRC’’), South Korea, Indonesia, Poland, and Belarus pursuant to section 751(c) of the Act. See Initiation of Five-year (‘‘Sunset’’) Reviews, 71 FR 43443 (August 1, 2006) (‘‘Notice of Initiation’’).
On August 11, 2006, the Department received a notice of intent to participate from the following domestic parties: the Rebar Trade Action Coalition and its individual producer members, Nucor Corporation, CMC Steel Group, and Gerdau Ameristeel, as well as domestic producers TAMCO Steel and Schnitzer Steel Industries, Inc. (‘‘Schnitzer’’) (collectively ‘‘domestic interested parties’’), within the deadline specified in 19 CFR 351.218(d)(1)(i). The companies claimed interested party status under section 771(9)(C) of the Act, as manufacturers of a domestic–like product in the United States.
On August 31, 2006, the Department received a complete substantive response to the notice of initiation from the domestic interested parties within the 30-day deadline specified in 19 CFR 351.218(d)(3)(i). In this response, Cascade Steel Rolling Mills, Inc. (‘‘Cascade’’) was substituted for Schnitzer as a domestic interested party. Cascade is a wholly owned subsidiary of Schnitzer. Also, Steel Dynamics, Inc. (‘‘SDI’’) was added as a domestic
VerDate Aug<31>2005 15:14 Dec 04, 2006 Jkt 211001 PO 00000 Frm 00009 Fmt 4703 Sfmt 4703 E:\FR\FM\05DEN1.SGM 05DEN1yche
rry
on P
RO
D1P
C64
with
NO
TIC
ES

70510 Federal Register / Vol. 71, No. 233 / Tuesday, December 5, 2006 / Notices
producer. Because SDI did not file a notice of intent to participate in this review, it is not eligible to file a substantive response. See 19 CFR 351.218(d)(iii)(A). Therefore, the domestic interested parties are now the Rebar Trade Action Coalition and its individual producer members, Nucor Corporation, CMC Steel Group, and Gerdau Ameristeel, as well as TAMCO Steel, and Cascade.
We received no responses from respondent interested parties with respect to any of the orders covered by these sunset reviews except Moldova. On August 31, 2006, the Department received a substantive response from respondent interested party, JSCC Moldova Steel Works, which was within the deadline specified in 19 CFR 351.218(d)(3)(i). On September 20, 2006, the Department determined that JSCC Moldova Steel Works did not account for more than 50 percent of exports by volume of the subject merchandise, because it reported that it had no exports during the 2001–2005 sunset review period. Therefore, the Department found that JSCC Moldova Steel Works did not submit an adequate substantive response to the Department’s Notice of Initiation. See Memorandum to Susan H. Kuhbach entitled, ‘‘Adequacy Determination in Antidumping Duty Sunset Review of
Steel Concrete Reinforcing Bars from Moldova,’’ (September 20, 2006).
As a result of an inadequate response from Moldova and no substantive response from the PRC, South Korea, Indonesia, Belarus, and Poland, pursuant to 19 CFR 351.218(e)(1)(ii)(C)(2), the Department conducted an expedited (120-day) sunset review of these orders.
Scope of the Orders
The product covered by these orders is all steel concrete reinforcing bars sold in straight lengths, currently classifiable in the Harmonized Tariff Schedule of the United States (‘‘HTSUS’’) under item numbers 7214.20.00, 7228.30.8050, 7222.11.0050, 7222.30.0000, 7228.60.6000, 7228.20.1000, or any other tariff item number. Specifically excluded are plain rounds (i.e., non– deformed or smooth bars) and rebar that has been further processed through bending or coating. HTSUS subheadings are provided for convenience and customs purposes. The written description of the scope of the order is dispositive.
Analysis of Comments Received
All issues raised in these reviews are addressed in the ‘‘Issues and Decision Memorandum for the Expedited Sunset Reviews of the Antidumping Duty Orders on Steel Concrete Reinforcing
Bars from Moldova, the People’s Republic of China, South Korea, Indonesia, Poland, and Belarus; Final Results’’ from Stephen J. Claeys, Deputy Assistant Secretary for Import Administration, to David M. Spooner, Assistant Secretary for Import Administration (November 29, 2006), which is hereby adopted by this notice (‘‘Decision Memo’’). The issues discussed in the Decision Memo include the likelihood of continuation or recurrence of dumping and the magnitude of the margins likely to prevail if the orders were to be revoked. Parties can find a complete discussion of all issues raised in these reviews and the corresponding recommendations in this public memorandum which is on file in room B–099 of the main Department building.
In addition, a complete version of the Decision Memo can be accessed directly on the Web at http://ia.ita.doc.gov/frn. The paper copy and electronic version of the Decision Memo are identical in content.
Final Results of Reviews
We determine that revocation of the antidumping duty orders on rebar from Moldova, the PRC, South Korea, Indonesia, Poland, and Belarus would be likely to lead to continuation or recurrence of dumping at the following weighted–average percentage margins:
Manufacturers/Exporters/Producers Weighted Average Margin (percent)
Moldova.Moldova–Wide Rate .......................................................................................................................................................... 232.86 PRC.Laiwu Steel Group ............................................................................................................................................................. 133.00 PRC–Wide Rate ................................................................................................................................................................ 133.00 South Korea.Dongkuk Steel Mill Co., Ltd./Korea Iron & Steel Co., Ltd. ................................................................................................ 22.89 Hanbo Iron & Steel Co., Ltd. ............................................................................................................................................. 102.28 All Others ........................................................................................................................................................................... 22.89 Indonesia.PT Gunung Gahapi Sakti .................................................................................................................................................. 71.01 PT Bhirma Steel ................................................................................................................................................................ 71.01 Krakatau Wajatama ........................................................................................................................................................... 71.01 PT Jakarta Steel Perdana Industri .................................................................................................................................... 71.01 PT Hanil Jaya Metal Works ............................................................................................................................................... 71.01 PT Pulogadung Steel ......................................................................................................................................................... 71.01 PT Jakarta Cakra Tunggal ................................................................................................................................................ 71.01 PT The Master Steel Manufacturing Co. ........................................................................................................................... 71.01 All Others ........................................................................................................................................................................... 60.46 Poland.Stalexport ........................................................................................................................................................................... 52.07 All Others ........................................................................................................................................................................... 47.13 Belarus.Belarus–Wide Rate ............................................................................................................................................................ 114.53
This notice also serves as the only reminder to parties subject to administrative protective orders (‘‘APO’’) of their responsibility
concerning the return or destruction of proprietary information disclosed under APO in accordance with 19 CFR 351.305. Timely notification of the
return or destruction of APO materials or conversion to judicial protective orders is hereby requested. Failure to comply with the regulations and terms
VerDate Aug<31>2005 15:14 Dec 04, 2006 Jkt 211001 PO 00000 Frm 00010 Fmt 4703 Sfmt 4703 E:\FR\FM\05DEN1.SGM 05DEN1yche
rry
on P
RO
D1P
C64
with
NO
TIC
ES

70511 Federal Register / Vol. 71, No. 233 / Tuesday, December 5, 2006 / Notices
of an APO is a violation which is subject to sanction.
We are issuing and publishing the results and notice in accordance with sections 751(c), 752(c), and 777(i)(1) of the Act.
Dated: November 29, 2006. Joseph A. Spetrini, Acting Assistant Secretary for Import Administration. [FR Doc. E6–20549 Filed 12–4–06; 8:45 am] BILLING CODE 3510–DS–S
DEPARTMENT OF COMMERCE
National Institute of Standards and Technology
Jointly Owned Invention Available for Licensing
AGENCY: National Institute of Standards and Technology, Commerce ACTION: Notice.
SUMMARY: The invention listed below is jointly owned by the U.S. Government, as represented by the Department of Commerce, and Cree Inc. The Department of Commerce’s interest in the invention is available for licensing, in accordance with 35 U.S.C. 207 and 37 CFR part 404 to achieve expeditious commercialization of results of federally funded research and development. FOR FURTHER INFORMATION CONTACT: Technical and licensing information on this invention may be obtained by writing to: National Institute of Standards and Technology, Office of Technology Partnerships, Attn: Mary Clague, Building 222, Room A155, Gaithersburg, MD 20899. Information is also available via telephone: 301–975– 4188, fax 301–869–2751, or e-mail: [email protected]. Any request for information should include the NIST Docket number or Patent number and title for the invention as indicated below.
The invention available for licensing is: [DOCKET NUMBER 06–008US]
Title: Power Switching Semiconductor Devices Including Rectifying Junction-Shunts.
Abstract: A semiconductor device includes a drift layer having a first conductivity type and a body region adjacent the drift layer. The body region has a second conductivity type opposite the first conductivity type and forms a p-n junction with the drift layer. The device further includes a contactor region in the body region and having the first conductivity type, and a shunt channel region extending through the body region from the contactor region to
the drift layer. The shunt channel region has the first conductivity type. The device further includes a first terminal in electrical contact with the body region and the contactor region, and a second terminal in electrical contact with the drift layer. The shunt channel region has a length, thickness and doping concentration selected that: (1) The shunt channel region is fully depleted when zero voltage is applied across the first and second terminals, (2) the shunt channel becomes conductive at voltages less than the built-in potential of the drift layer to body region p-n junction, and/or (3) the shunt channel is not conductive for voltages that reverse biase the p–n junction between the drift region and the body region.
Dated: November 29, 2006. James E. Hill, Acting Deputy Director. [FR Doc. E6–20582 Filed 12–4–06; 8:45 am] BILLING CODE 3510–13–P
DEPARTMENT OF COMMERCE
National Oceanic and Atmospheric Administration
Proposed Information Collection; Comment Request; Fisheries Certificate of Origin
AGENCY: National Oceanic and Atmospheric Administration (NOAA). ACTION: Notice.
SUMMARY: The Department of Commerce, as part of its continuing effort to reduce paperwork and respondent burden, invites the general public and other Federal agencies to take this opportunity to comment on proposed and/or continuing information collections, as required by the Paperwork Reduction Act of 1995. DATES: Written comments must be submitted on or before February 5, 2007. ADDRESSES: Direct all written comments to Diana Hynek, Departmental Paperwork Clearance Officer, Department of Commerce, Room 6625, 14th and Constitution Avenue, NW., Washington, DC 20230 (or via the Internet at [email protected]). FOR FURTHER INFORMATION CONTACT: Requests for additional information or copies of the information collection instrument and instructions should be directed to William G. Jacobson, 562– 980–4035 or [email protected]. SUPPLEMENTARY INFORMATION:
I. Abstract The information required by the
International Dolphin Conservation
Program Act, amendment to the Marine Mammal Protection Act, is needed: To document the dolphin-safe status of tuna import shipments; to verify that import shipments of fish were not harvested by large scale, high seas driftnets; and to verify that imported tuna was not harvested by an embargoed nation or one that is otherwise prohibited from exporting tuna to the United States. Forms are submitted by importers and processors.
II. Method of Collection
Forms may be submitted by mail or electronically.
III. Data
OMB Number: 0648–0335. Form Number: NOAA Form 370. Type of Review: Regular submission. Affected Public: Business or other for-
profits organizations. Estimated Number of Respondents:
350. Estimated Time Per Response: 20
minutes. Estimated Total Annual Burden
Hours: 3,663. Estimated Total Annual Cost to
Public: $3,397.
IV. Request for Comments
Comments are invited on: (a) Whether the proposed collection of information is necessary for the proper performance of the functions of the agency, including whether the information shall have practical utility; (b) the accuracy of the agency’s estimate of the burden (including hours and cost) of the proposed collection of information; (c) ways to enhance the quality, utility, and clarity of the information to be collected; and (d) ways to minimize the burden of the collection of information on respondents, including through the use of automated collection techniques or other forms of information technology.
Comments submitted in response to this notice will be summarized and/or included in the request for OMB approval of this information collection; they also will become a matter of public record.
Dated: November 30, 2006.
Gwellnar Banks, Management Analyst, Office of the Chief Information Officer. [FR Doc. E6–20513 Filed 12–4–06; 8:45 am]
BILLING CODE 3510–22–P
VerDate Aug<31>2005 15:14 Dec 04, 2006 Jkt 211001 PO 00000 Frm 00011 Fmt 4703 Sfmt 4703 E:\FR\FM\05DEN1.SGM 05DEN1yche
rry
on P
RO
D1P
C64
with
NO
TIC
ES
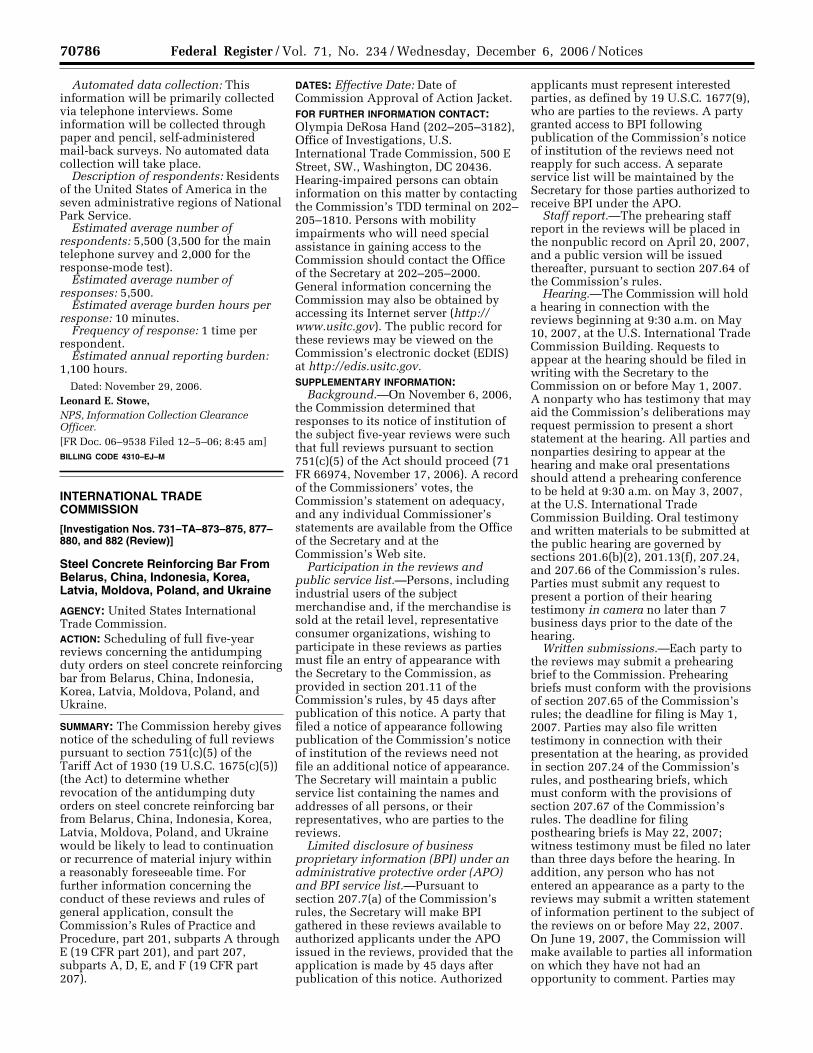
70786 Federal Register / Vol. 71, No. 234 / Wednesday, December 6, 2006 / Notices
Automated data collection: This information will be primarily collected via telephone interviews. Some information will be collected through paper and pencil, self-administered mail-back surveys. No automated data collection will take place.
Description of respondents: Residents of the United States of America in the seven administrative regions of National Park Service.
Estimated average number of respondents: 5,500 (3,500 for the main telephone survey and 2,000 for the response-mode test).
Estimated average number of responses: 5,500.
Estimated average burden hours per response: 10 minutes.
Frequency of response: 1 time per respondent.
Estimated annual reporting burden: 1,100 hours.
Dated: November 29, 2006. Leonard E. Stowe, NPS, Information Collection Clearance Officer. [FR Doc. 06–9538 Filed 12–5–06; 8:45 am] BILLING CODE 4310–EJ–M
INTERNATIONAL TRADE COMMISSION
[Investigation Nos. 731–TA–873–875, 877– 880, and 882 (Review)]
Steel Concrete Reinforcing Bar From Belarus, China, Indonesia, Korea, Latvia, Moldova, Poland, and Ukraine
AGENCY: United States International Trade Commission. ACTION: Scheduling of full five-year reviews concerning the antidumping duty orders on steel concrete reinforcing bar from Belarus, China, Indonesia, Korea, Latvia, Moldova, Poland, and Ukraine.
SUMMARY: The Commission hereby gives notice of the scheduling of full reviews pursuant to section 751(c)(5) of the Tariff Act of 1930 (19 U.S.C. 1675(c)(5)) (the Act) to determine whether revocation of the antidumping duty orders on steel concrete reinforcing bar from Belarus, China, Indonesia, Korea, Latvia, Moldova, Poland, and Ukraine would be likely to lead to continuation or recurrence of material injury within a reasonably foreseeable time. For further information concerning the conduct of these reviews and rules of general application, consult the Commission’s Rules of Practice and Procedure, part 201, subparts A through E (19 CFR part 201), and part 207, subparts A, D, E, and F (19 CFR part 207).
DATES: Effective Date: Date of Commission Approval of Action Jacket. FOR FURTHER INFORMATION CONTACT: Olympia DeRosa Hand (202–205–3182), Office of Investigations, U.S. International Trade Commission, 500 E Street, SW., Washington, DC 20436. Hearing-impaired persons can obtain information on this matter by contacting the Commission’s TDD terminal on 202– 205–1810. Persons with mobility impairments who will need special assistance in gaining access to the Commission should contact the Office of the Secretary at 202–205–2000. General information concerning the Commission may also be obtained by accessing its Internet server (http:// www.usitc.gov). The public record for these reviews may be viewed on the Commission’s electronic docket (EDIS) at http://edis.usitc.gov. SUPPLEMENTARY INFORMATION:
Background.—On November 6, 2006, the Commission determined that responses to its notice of institution of the subject five-year reviews were such that full reviews pursuant to section 751(c)(5) of the Act should proceed (71 FR 66974, November 17, 2006). A record of the Commissioners’ votes, the Commission’s statement on adequacy, and any individual Commissioner’s statements are available from the Office of the Secretary and at the Commission’s Web site.
Participation in the reviews and public service list.—Persons, including industrial users of the subject merchandise and, if the merchandise is sold at the retail level, representative consumer organizations, wishing to participate in these reviews as parties must file an entry of appearance with the Secretary to the Commission, as provided in section 201.11 of the Commission’s rules, by 45 days after publication of this notice. A party that filed a notice of appearance following publication of the Commission’s notice of institution of the reviews need not file an additional notice of appearance. The Secretary will maintain a public service list containing the names and addresses of all persons, or their representatives, who are parties to the reviews.
Limited disclosure of business proprietary information (BPI) under an administrative protective order (APO) and BPI service list.—Pursuant to section 207.7(a) of the Commission’s rules, the Secretary will make BPI gathered in these reviews available to authorized applicants under the APO issued in the reviews, provided that the application is made by 45 days after publication of this notice. Authorized
applicants must represent interested parties, as defined by 19 U.S.C. 1677(9), who are parties to the reviews. A party granted access to BPI following publication of the Commission’s notice of institution of the reviews need not reapply for such access. A separate service list will be maintained by the Secretary for those parties authorized to receive BPI under the APO.
Staff report.—The prehearing staff report in the reviews will be placed in the nonpublic record on April 20, 2007, and a public version will be issued thereafter, pursuant to section 207.64 of the Commission’s rules.
Hearing.—The Commission will hold a hearing in connection with the reviews beginning at 9:30 a.m. on May 10, 2007, at the U.S. International Trade Commission Building. Requests to appear at the hearing should be filed in writing with the Secretary to the Commission on or before May 1, 2007. A nonparty who has testimony that may aid the Commission’s deliberations may request permission to present a short statement at the hearing. All parties and nonparties desiring to appear at the hearing and make oral presentations should attend a prehearing conference to be held at 9:30 a.m. on May 3, 2007, at the U.S. International Trade Commission Building. Oral testimony and written materials to be submitted at the public hearing are governed by sections 201.6(b)(2), 201.13(f), 207.24, and 207.66 of the Commission’s rules. Parties must submit any request to present a portion of their hearing testimony in camera no later than 7 business days prior to the date of the hearing.
Written submissions.—Each party to the reviews may submit a prehearing brief to the Commission. Prehearing briefs must conform with the provisions of section 207.65 of the Commission’s rules; the deadline for filing is May 1, 2007. Parties may also file written testimony in connection with their presentation at the hearing, as provided in section 207.24 of the Commission’s rules, and posthearing briefs, which must conform with the provisions of section 207.67 of the Commission’s rules. The deadline for filing posthearing briefs is May 22, 2007; witness testimony must be filed no later than three days before the hearing. In addition, any person who has not entered an appearance as a party to the reviews may submit a written statement of information pertinent to the subject of the reviews on or before May 22, 2007. On June 19, 2007, the Commission will make available to parties all information on which they have not had an opportunity to comment. Parties may
VerDate Aug<31>2005 16:03 Dec 05, 2006 Jkt 211001 PO 00000 Frm 00053 Fmt 4703 Sfmt 4703 E:\FR\FM\06DEN1.SGM 06DEN1PW
ALK
ER
on
PR
OD
PC
60 w
ith N
OT
ICE
S

70787 Federal Register / Vol. 71, No. 234 / Wednesday, December 6, 2006 / Notices
submit final comments on this information on or before June 21, 2007, but such final comments must not contain new factual information and must otherwise comply with section 207.68 of the Commission’s rules. All written submissions must conform with the provisions of section 201.8 of the Commission’s rules; any submissions that contain BPI must also conform with the requirements of sections 201.6, 207.3, and 207.7 of the Commission’s rules. The Commission’s rules do not authorize filing of submissions with the Secretary by facsimile or electronic means, except to the extent permitted by section 201.8 of the Commission’s rules, as amended, 67 FR 68036 (November 8, 2002). Even where electronic filing of a document is permitted, certain documents must also be filed in paper form, as specified in II(C) of the Commission’s Handbook on Electronic Filing Procedures, 67 FR 68168, 68173 (November 8, 2002).
Additional written submissions to the Commission, including requests pursuant to section 201.12 of the Commission’s rules, shall not be accepted unless good cause is shown for accepting such submissions, or unless the submission is pursuant to a specific request by a Commissioner or Commission staff.
In accordance with sections 201.16(c) and 207.3 of the Commission’s rules, each document filed by a party to the reviews must be served on all other parties to the reviews (as identified by either the public or BPI service list), and a certificate of service must be timely filed. The Secretary will not accept a document for filing without a certificate of service.
Authority: These reviews are being conducted under authority of title VII of the Tariff Act of 1930; this notice is published pursuant to section 207.62 of the Commission’s rules.
Issued: December 1, 2006.
By order of the Commission.
Marilyn R. Abbott, Secretary to the Commission. [FR Doc. E6–20672 Filed 12–5–06; 8:45 am]
BILLING CODE 7020–02–P
INTERNATIONAL TRADE COMMISSION
[Investigation No. 332–482; Investigation No. Singapore FTA–103–015]
U.S.-Singapore FTA: Probable Economic Effect of Accelerated Tariff Elimination and Modification of Rules of Origin
AGENCY: United States International Trade Commission. ACTION: Institution of investigation and request for written submissions.
SUMMARY: Following receipt of a request on October 27, 2006, from the United States Trade Representative (USTR) under section 332(g) of the Tariff Act of 1930 (19 U.S.C. 1332(g)) and in accordance with section 103 of the United States-Singapore Free Trade Agreement (USSFTA) Implementation Act (19 U.S.C. 3805 note), the Commission instituted Investigation Nos. 332–482 and Singapore FTA–103– 015, U.S.-Singapore FTA: Probable Economic Effect of Accelerated Tariff Elimination and Modification of Rules of Origin. DATES: Effective Date: November 28, 2006.
FOR FURTHER INFORMATION CONTACT: Information may be obtained from Vincent Honnold, Office of Industries (202–205–3314 or [email protected]); for information on legal aspects, contact William Gearhart of the Commission’s Office of the General Counsel (202–205– 3091 or [email protected]). The media should contact Margaret O’Laughlin, Office of External Relations (202–205–1819 or [email protected]).
Background: According to USTR’s request letter, the United States and Singapore have agreed to enter into consultations to consider acceleration of the reduction or elimination of tariffs (including an increase in the quota level of certain tariff rate quotas) for certain articles, and a rules of origin change. Sections 201(b) and 202(o) of the United States-Singapore Free Trade Agreement Implementation Act (Act) authorize the President to proclaim modifications in duty treatment and rules of origin changes, respectively, subject to the consultation and layover requirements in section 103 of the Act. Section 103 requires that the President obtain advice regarding the proposed action from the Commission.
The USTR requested that the Commission provide advice, with respect to three articles, as to the probable economic effect of accelerating
the reduction or elimination of the U.S. tariff under the USSFTA on domestic industries producing like or directly competitive articles, and on consumers of the affected goods. The three articles are (1) preparations for infant use, put up for retail sale (HS 1901.10); (2) peanuts in snack products (HS 2008.11); and (3) polycarbonates (HS 3907.40.00). The USTR also requested that the Commission provide advice on the probable effect of a modification in the rules of origin for photocopiers (HS 9009.12.00) on U.S. trade under the USSFTA, on total U.S. trade, and on domestic industries. Additional information concerning these articles is available from the Office of the Secretary to the Commission or by accessing the electronic version of this notice at the Commission’s Internet site (http://www.usitc.gov). The current USSFTA rules of origin can be found in General Note 25 of the 2006 Harmonized Tariff Schedule of the United States (see ‘‘General Notes’’ link at http://www.usitc.gov/tata/hts/ bychapter/index.htm).
As requested, the Commission will forward its advice to the USTR by February 5, 2007. USTR indicated that those sections of the Commission’s report that analyze the probable economic effects, as well as other information that would reveal aspects of the probable effects advice, will be classified.
Written Submissions: In lieu of a public hearing, interested parties are invited to submit written statements concerning the matters to be addressed by the Commission in this investigation. Submissions should be addressed to the Secretary, United States International Trade Commission, 500 E Street SW., Washington, DC 20436. To be assured of consideration by the Commission, written statements should be submitted to the Commission at the earliest practical date and should be received no later than the close of business on December 19, 2006. All written submissions must conform with the provisions of section 201.8 of the Commission’s Rules of Practice and Procedure (19 CFR 201.8). Section 201.8 of the rules requires that a signed original (or copy designated as an original) and fourteen (14) copies of each document be filed. In the event that confidential treatment of the document is requested, at least four (4) additional copies must be filed, from which the confidential business information must be deleted (see the following paragraph for further information regarding confidential business information). The Commission’s rules authorize filing
VerDate Aug<31>2005 16:03 Dec 05, 2006 Jkt 211001 PO 00000 Frm 00054 Fmt 4703 Sfmt 4703 E:\FR\FM\06DEN1.SGM 06DEN1PW
ALK
ER
on
PR
OD
PC
60 w
ith N
OT
ICE
S

9732 Federal Register / Vol. 72, No. 42 / Monday, March 5, 2007 / Notices
Carrier Bags from the People’s Republic of China: Notice of Extension of Time Limit for the Final Results of the Antidumping Duty Administrative Review, 72 FR 7417 (February 15, 2007). The final results are currently due by February 26, 2007.
Extension of Time Limit for Final Results of Review
Pursuant to section 751(a)(3)(A) of the Tariff Act of 1930, as amended (‘‘the Act’’), the Department shall make a final determination in an administrative review of an antidumping duty order within 120 days after the date on which the preliminary determination is published. The Act further provides, however, that the Department may extend that 120-day period to 180 days if it determines it is not practicable to complete the review within the foregoing time period.
The Department finds that it is not practicable to complete the final results of the administrative review of PRCBs from the PRC by February 26, 2007, due to complex issues related to the calculation of surrogate financial ratios. Therefore, in accordance with section 751(a)(3)(A) of the Act, the Department is extending the time period for completion of the final results of this review to 180 days after publication of the Preliminary Results. Therefore, the final results are now due no later than March 12, 2007.
This notice is published in accordance with sections 751(a)(3)(A) and 777(i) of the Act.
Dated: February 26, 2007. Stephen J. Claeys, Deputy Assistant Secretaryfor Import Administration. [FR Doc. E7–3790 Filed 3–2–07; 8:45 am] BILLING CODE 3510–DS–S
DEPARTMENT OF COMMERCE
International Trade Administration
[A–533–810]
Stainless Steel Bar from India: Notice of Extension of Time Limit for the Preliminary Results of the 2006 New Shipper Review
AGENCY: Import Administration, International Trade Administration, Commerce.
EFFECTIVE DATE: March 5, 2007. FOR FURTHER INFORMATION CONTACT: Devta Ohri or Brandon Farlander, AD/ CVD Operations, Office 1, Import Administration, International Trade Administration, U.S. Department of Commerce, 14th Street and Constitution
Avenue, NW, Washington, DC 20230, telephone (202) 482–3853 or (202) 482– 0182, respectively. SUPPLEMENTARY INFORMATION:
Statutory Time Limits Section 751(a)(2)(B)(iv) of the Tariff
Act of 1930, as amended (the Act) and section 351.214(i)(1) of the Department of Commerce’s (Department) regulations require the Department to issue the preliminary results of a new shipper review within 180 days after the date on which the new shipper review was initiated, and the final results of review within 90 days after the date on which the preliminary results were issued. However, if the Department determines that the issues are extraordinarily complicated, section 751(a)(2)(B)(iv) of the Act and section 351.214(i)(2) of the Department’s regulations allow the Department to extend the deadline for the preliminary results to up to 300 days after the date on which the new shipper review was initiated.
Background On September 26, 2006, the
Department published a notice of initiation of a new shipper review of the antidumping duty order on stainless steel bar from India for Ambica Steels Limited (Ambica), covering the period February 1, 2006 through July 31, 2006. See Stainless Steel Bar from India: Notice of Initiation of Antidumping Duty New Shipper Review, 71 FR 56105 (September 26, 2006). On January 24, 2007, the Department initiated a cost investigation of Ambica. The preliminary results for this review are currently due no later than March 19, 2007.
Extension of Time Limits for Preliminary Results
Pursuant to section 751(a)(2)(B)(iv) of the Act, the Department may extend the deadline for completion of the preliminary results of a new shipper review if it determines that the case is extraordinarily complicated. Because the Department needs additional time to evaluate Ambica’s recently submitted cost information, examine sales issues, such as product grade hierarchy, and to issue additional supplemental questionnaires, the Department has determined that this review is extraordinarily complicated, and the preliminary results of this new shipper review cannot be completed within the statutory time limit of 180 days. Therefore, in accordance with section 751(a)(2)(B)(iv) of the Act and section 351.214(i)(2) of the regulations, the Department is extending the time limit for the completion of the preliminary
results by 120 days until no later than July 17, 2007.
This notice is published pursuant to sections 751(a)(2)(B)(iv) and 777(i)(1) of the Act.
Dated: February 27, 2007. Stephen J. Claeys, Deputy Assistant Secretaryfor Import Administration. [FR Doc. E7–3796 Filed 3–2–07; 8:45 am] BILLING CODE 3510–DS–S
DEPARTMENT OF COMMERCE
International Trade Administration
[A–823–809]
Steel Concrete Reinforcing Bars from Ukraine; Final Results of the Sunset Review of Antidumping Duty Order
AGENCY: Import Administration, International Trade Administration, Department of Commerce SUMMARY: On November 27, 2006, the Department of Commerce (‘‘the Department’’) published a notice of preliminary results of the full sunset review of the antidumping duty order on steel concrete reinforcing bars (‘‘rebar’’) from Ukraine pursuant to section 751(c) of the Tariff Act of 1930, as amended (‘‘the Act’’). We provided interested parties an opportunity to comment on our preliminary results. We did not receive comments from either domestic or respondent interested parties. As a result of this review, the Department finds that revocation of this order would be likely to lead to continuation or recurrence of dumping at the levels indicated in the ‘‘Final Results of Review’’ section of this notice. EFFECTIVE DATE: March 5, 2007. FOR FURTHER INFORMATION CONTACT: Audrey R. Twyman or Brandon Farlander, AD/CVD Operations, Office 1, Import Administration, International Trade Administration, U.S. Department of Commerce, 14th Street & Constitution Avenue, NW, Washington, DC, 20230; telephone: 202–482–3534 and 202–482– 0182, respectively. SUPPLEMENTARY INFORMATION:
Background On November 27, 2006, the
Department published in the Federal Register a notice of preliminary results of the full sunset review of the antidumping duty order on rebar from Ukraine, pursuant to section 751(c) of the Act. See Steel Concrete Reinforcing Bars from Ukraine; Preliminary Results of the Sunset Review of Antidumping Duty Order, 71 FR 68543 (November 27,
VerDate Aug<31>2005 15:17 Mar 02, 2007 Jkt 211001 PO 00000 Frm 00008 Fmt 4703 Sfmt 4703 E:\FR\FM\05MRN1.SGM 05MRN1erjo
nes
on P
RO
DP
C74
with
NO
TIC
ES

9733 Federal Register / Vol. 72, No. 42 / Monday, March 5, 2007 / Notices
2006) (‘‘Preliminary Results’’). In our Preliminary Results, we determined that revocation of the order would likely result in continuation or recurrence of dumping with a margin of 41.69 percent for the all others rate, including Mittal Steel Kryviy Rih and Krivorozhstal Steel Works. We did not receive a case brief on behalf of either domestic or respondent interested parties within the deadline specified in 19 CFR 351.309(c)(1)(i).
Scope of the Order The product covered by this order is
all steel concrete reinforcing bars sold in
straight lengths, currently classifiable in the Harmonized Tariff Schedule of the United States (‘‘HTSUS’’) under item numbers 7214.20.00, 7228.30.8050, 7222.11.0050, 7222.30.0000, 7228.60.6000, 7228.20.1000, or any other tariff item number. Specifically excluded are plain rounds (i.e., non– deformed or smooth bars) and rebar that has been further processed through bending or coating.
HTSUS subheadings are provided for convenience and customs purposes. The written description of the scope of the order is dispositive.
Analysis of Comments Received
The Department did not receive case briefs from either domestic or respondent interested parties. Therefore, we have not made any changes to our Preliminary Results.
Final Results of Review
We determine that revocation of the antidumping duty order on rebar from Ukraine would be likely to lead to continuation or recurrence of dumping at the following weighted–average margin:
Manufacturers/Producers/Exporters Weighted–Average Margin (Percent)
All Others Rate, including Mittal Steel Kryviy Rih and ‘‘Krivorozhstal’’ Steel Works1 .............................................. 41.69
1 As of February 1, 2006, Ukraine graduated to market economy status. See Final Results of Inquiry Into Ukraine’s Status as a Non-Market Economy Country, 71 FR 9520 (February 24, 2006). As a result, the Ukraine wide rate is now the All Others rate. Mittal Steel is considered part of the all others rate because a successor-in-interest determination has not been made. See, e.g., Cut-to-Length Carbon Steel Plate from Bel-gium, Brazil, Finland, Germany, Mexico, Poland, Romania, Spain, Sweden, and the United Kingdom and Carbon Steel Plate from Taiwan; Sec-ond Five-Year (Sunset) Reviews of Antidumping Duty Orders and Antidumping Finding; Final Results, 71 FR 11577, 11579 (March 8, 2006) (ex-plaining that Duferco is subject to the all others rate because the Department had not yet conducted a changed circumstances review to deter-mine the successor-in-interest to Forges de Clabecq, S.A.).
This notice serves as the only reminder to parties subject to administrative protective order (‘‘APO’’) of their responsibility concerning the disposition of proprietary information disclosed under APO in accordance with 19 CFR 351.305. Timely notification of return/destruction of APO materials or conversion to judicial protective order is hereby requested. Failure to comply with the regulations and the terms of an APO is a sanctionable violation.
We are issuing and publishing these results in accordance with sections 751(c), 752(c), and 777(i)(1) of the Act.
Dated: February 27, 2007. David M. Spooner, Assistant Secretaryfor Import Administration. [FR Doc. E7–3799 Filed 3–2–07; 8:45 am] BILLING CODE 3510–DS–S
DEPARTMENT OF COMMERCE
International Trade Administration
DEPARTMENT OF THE INTERIOR
[Docket No.990813222–0035–03]
RIN 0625–AA55
Allocation of Duty–Exemptions for Calendar Year 2007Among Watch Producers Located in the United States Virgin Islands
AGENCY: Import Administration, International Trade Administration, Department of Commerce; Office of
Insular Affairs, Department of the Interior.
ACTION: Notice.
SUMMARY: This action allocates calendar year 2007 duty exemptions for watch producers located in the Virgin Islands pursuant to Pub. L. 97–446, as amended by Pub. L. 103–465, Pub. L 106–36 and Pub. L. 108–429 (‘‘the Act’’). FOR FURTHER INFORMATION CONTACT: Faye Robinson, (202) 482–3526. SUPPLEMENTARY INFORMATION: Pursuant to the Act, the Departments of the Interior and Commerce (the Departments) share responsibility for the allocation of duty exemptions among watch assembly firms in the United States insular possessions and the Northern Mariana Islands. In accordance with Section 303.3(a) of the regulations (15 CFR 303.3(a)), the total quantity of duty- free insular watches and watch movements for calendar year 2007 is 1,866,000 units for the Virgin Islands (65 F.R. 8048, February 17, 2000).
The criteria for the calculation of the calendar year 2007 duty–exemption allocations among insular watch producers are set forth in Section 303.14 of the regulations (15 CFR 303.14).
The Departments have verified and adjusted the data submitted on application form ITA–334P by Virgin Islands producers and inspected their current operations in accordance with Section 303.5 of the regulations (15 CFR 303.5).
In calendar year 2006 the Virgin Islands watch assembly firms shipped 268,430 watches and watch movements into the customs territory of the United States under the Act. The dollar amount of creditable corporate income taxes paid by Virgin Islands producers during calendar year 2006 plus the creditable wages paid by the industry during calendar year 2006 to residents of the territory was $2,071,548.
There are no producers in Guam, American Samoa or the Northern Mariana Islands.
The calendar year 2007 Virgin Islands annual allocations, based on the data verified by the Departments, are as follows:
Name of Firm Annual Allocation
Belair Quartz, Inc. ......... 500,000 Hampden Watch Co.,
Inc. ............................ 200,000 Goldex Inc. ................... 50,000 Tropex, Inc. ................... 300,000
The balance of the units allocated to the Virgin Islands is available for new entrants into the program or producers who request a supplement to their allocation.
Joseph A. Spetrini, DAS for Policy and Negotiations, Import Administration, Department of Commerce. Nikolao Pula, Director, Office of Insular Affairs, Department of the Interior. [FR Doc. 07–994 Filed 3–2–07; 8:45 am] BILLING CODE 3510–DS–P and 4310–93–S
VerDate Aug<31>2005 16:34 Mar 02, 2007 Jkt 211001 PO 00000 Frm 00009 Fmt 4703 Sfmt 4703 E:\FR\FM\05MRN1.SGM 05MRN1erjo
nes
on P
RO
DP
C74
with
NO
TIC
ES

16767 Federal Register / Vol. 72, No. 65 / Thursday, April 5, 2007 / Notices
through September 30, 2006. The Department intends to issue assessment instructions to U.S. Customs and Border Protection 15 days after the publication of this notice of rescission of administrative review.
This notice is in accordance with section 777(i) of the Tariff Act of 1930, as amended, and 19 CFR 351.213(d)(4).
Dated: March 23, 2007. Stephen J. Claeys, Deputy Assistant Secretary for Import Administration. [FR Doc. E7–6405 Filed 4–4–07; 8:45 am] BILLING CODE 3510–DS–S
DEPARTMENT OF COMMERCE
International Trade Administration
(A–405–803, A–401–808, A–421–811, A–201– 834)
Purified Carboxymethylcellulose from Finland, Sweden, the Netherlands, and Mexico: Extension of Time Limits for Preliminary Determinations of Antidumping Duty Administrative Reviews
AGENCY: Import Administration, International Trade Administration, Department of Commerce. EFFECTIVE DATE: April 5, 2007. FOR FURTHER INFORMATION CONTACT: Tyler Weinhold, Robert James (Mexico and Finland), or Angelica Mendoza (Sweden and the Netherlands), AD/CVD Operations, Office 7, Import Administration, International Trade Administration, U.S. Department of Commerce, 14th Street and Constitution Avenue, NW, Washington DC 20230; telephone: (202) 482–1121, (202) 482– 0649, and (202) 482–3019, respectively. SUPPLEMENTARY INFORMATION:
Background
On August 30, 2006, the Department published a notice of initiation of an antidumping duty administrative review for, inter alia, Purified Carboxymethylcellulose from Finland, Sweden, the Netherlands, and Mexico for the December 27, 2004, through June 30, 2006, period of review (POR). See Initiation of Antidumping and Countervailing Duty Administrative Reviews and Requests for Revocation in Part, 71 FR 51573 (August 30, 2006). On December 11, 2006, the Department received requests from Aqualon Company, a division of Hercules, Inc. (Petitioner) that a cost investigation be initiated in the review of CMC from Finland, Sweden, and the Netherlands. See Letters from Petitioner dated December 8, 2006. On January 22, 2007,
the Department initiated a sales below cost of production investigation in the instant review of CMC from the Netherlands. See January 22, 2007, memorandum to Richard Weible, regarding Petitioner’s allegation of sales below the cost of production in the review of CMC from the Netherlands. On January 24, 2007, the Department initiated a sales below cost of production investigation in the instant review of CMC from Sweden. See January 24, 2007, memorandum to Richard Weible, regarding Petitioner’s allegation of sales below the cost of production in the review of CMC from Sweden. On February 5, 2007, the Department initiated a sales below cost of production investigation in the instant review of CMC from Finland. See February 5, 2007, memorandum to Richard Weible, regarding Petitioner’s allegation of sales below the cost of production in the review of CMC from Finland. The preliminary results for these administrative reviews are currently due no later than April 2, 2007.
Extension of Time Limits for Preliminary Results
Section 751(a)(3)(A) of the Tariff Act of 1930, as amended (the Act), requires the Department to complete the preliminary results of an administrative review within 245 days after the last day of the anniversary month of an order for which a review is requested. However, if it is not practicable to complete the review within these time periods, section 751(a)(3)(A) of the Act allows the Department to extend the 245 day time period for the preliminary results to 365 days.
The Department has determined it is not practicable to complete these reviews within the statutory time limit because we require additional time to conduct sales below–cost investigations in these administrative reviews and to collect and analyze other information needed for our preliminary determinations. Accordingly, the Department is extending the time limits for completion of the preliminary results of these administrative reviews until no later than July 31, 2007, which is 365 days from the last day of the anniversary month of these orders. We intend to issue the final results in these reviews no later than 120 days after publication of the preliminary results notices.
This notice is issued and published in accordance with sections 751(a)(3)(A) and 777(i)(1) of the Act.
Dated: March 30, 2007. Stephen Claeys, Deputy Assistant Secretary for Import Administration. [FR Doc. E7–6381 Filed 4–4–07; 8:45 am] BILLING CODE 3510–DS–S
DEPARTMENT OF COMMERCE
International Trade Administration
A–449–804
Steel Concrete Reinforcing Bars from Latvia; Final Results of the Sunset Review of Antidumping Duty Order
AGENCY: Import Administration, International Trade Administration, Department of Commerce. SUMMARY: On November 27, 2006, the Department of Commerce (‘‘the Department’’) published a notice of preliminary results of the full sunset review of the antidumping duty order on steel concrete reinforcing bars (‘‘rebar’’) from Latvia pursuant to section 751(c) of the Tariff Act of 1930, as amended (‘‘the Act’’). As a result of this review, the Department finds that revocation of the antidumping duty order would likely lead to the continuation or recurrence of dumping. EFFECTIVE DATE: April 5, 2007. FOR FURTHER INFORMATION CONTACT: Audrey R. Twyman or Brandon Farlander, AD/CVD Operations, Office 1, Import Administration, International Trade Administration, U.S. Department of Commerce, 14th Street & Constitution Avenue, NW, Washington, DC, 20230; telephone: 202–482–3534 and 202–482– 0182, respectively. SUPPLEMENTARY INFORMATION:
Background
On November 27, 2006, the Department published a notice of preliminary results of the full sunset review of the antidumping duty order on rebar from Latvia pursuant to section 751(c) of the Act. See Steel Concrete Reinforcing Bars from Latvia; Preliminary Results of the Sunset Review of Antidumping Duty Order, 71 FR 68544 (November 27, 2006) (‘‘Preliminary Results’’). We provided interested parties an opportunity to comment on our preliminary results. The Department received a case brief from Joint Stock Company Liepajas Metalurgs on January 16, 2007, and a rebuttal brief from the Rebar Trade Action Coalition and its individual producer members Nucor Corporation, CMC Steel Group, and Gerdau Ameristeel, as well as TAMCO Steel, and Cascade Steel Rolling Mills, Inc. on
VerDate Aug<31>2005 17:48 Apr 04, 2007 Jkt 211001 PO 00000 Frm 00006 Fmt 4703 Sfmt 4703 E:\FR\FM\05APN1.SGM 05APN1jlent
ini o
n P
RO
D1P
C65
with
NO
TIC
ES

16768 Federal Register / Vol. 72, No. 65 / Thursday, April 5, 2007 / Notices
January 22, 2007. A hearing was not held because none was requested.
Scope of the Order The product covered by this order is
all steel concrete reinforcing bars sold in straight lengths, currently classifiable in the Harmonized Tariff Schedule of the United States (‘‘HTSUS’’) under item numbers 7214.20.00, 7228.30.8050, 7222.11.0050, 7222.30.0000, 7228.60.6000, 7228.20.1000, or any other tariff item number. Specifically excluded are plain rounds (i.e., non– deformed or smooth bars) and rebar that has been further processed through bending or coating.
HTSUS subheadings are provided for convenience and customs purposes. The written description of the scope of the order is dispositive.
Analysis of Comments Received All issues raised in this sunset review
are addressed in the ‘‘Issues and Decision Memorandum for the Sunset Review of the Antidumping Duty Order on Steel Concrete Reinforcing Bars from Latvia; Final Results,’’ to David M. Spooner, Assistant Secretary for Import Administration, dated March 29, 2007 (‘‘Decision Memo’’), which is hereby adopted by this notice. The issues discussed in the Decision Memo include the likelihood of continuation or recurrence of dumping and the magnitude of the margin likely to prevail if the antidumping duty order were revoked. Parties can find a complete discussion of all issues raised in this sunset review and the corresponding recommendations in this public memorandum, which is on file in room B–099 of the main Department building. In addition, a complete version of the Decision Memo can be accessed directly on the Web at http:// ia.ita.doc.gov/frn/index.html. The paper copy and electronic version of the Decision Memo are identical in content.
Final Results of Review The Department determines that
revocation of the antidumping duty order on rebar from Latvia is likely to lead to a continuation or recurrence of dumping at the following weighted– average margins:
Manufacturers/Pro-ducers/Exporters
Weighted–Average Margin (Percentage)
Joint Stock Company Liepajas Metalurgs 17.21
All Others .................. 17.21
This notice serves as a final reminder to parties subject to administrative protective order (‘‘APO’’) of their responsibility concerning the
disposition of proprietary material disclosed under APO in accordance with 19 CFR 351.305. Timely notification of return/destruction of APO materials or conversion to judicial protective order is hereby requested. Failure to comply with the regulations and the terms of an APO is a sanctionable violation.
This sunset review and notice are in accordance with sections 751(c), 752, and 777(i)(1) of the Act.
Dated: March 29, 2007. David M. Spooner, Assistant Secretary for Import Administration. [FR Doc. E7–6398 Filed 4–4–07; 8:45 am] BILLING CODE 3510–DS–S
DEPARTMENT OF COMMERCE
International Trade Administration
(C–357–813)
Honey from Argentina: Notice of Rescission of Countervailing Duty Administrative Review
AGENCY: Import Administration, International Trade Administration, U.S. Department of Commerce. EFFECTIVE DATE: April 5, 2007. FOR FURTHER INFORMATION CONTACT: Elfi Blum, AD/CVD Operations, Office 6, Import Administration, International Trade Administration, U.S. Department of Commerce, 14th Street and Constitution Avenue, NW, Washington DC 20230; telephone: (202) 482–0197. SUPPLEMENTARY INFORMATION:
Background On December 1, 2006, the Department
of Commerce (‘‘the Department’’) published a notice of opportunity to request an administrative review of the countervailing duty order on Honey from Argentina. See Antidumping or Countervailing Duty Order, Finding, or Suspended Investigation; Opportunity to Request Administrative Review, 71 FR 69543 (December 1, 2006). On December 29, 2006, the American Honey Producers Association and the Sioux Honey Association (petitioners) timely requested that the Department conduct an administrative review of the countervailing duty order on honey from Argentina for the period January 1, 2006 through December 31, 2006. Shortly thereafter, the Department published a notice of the initiation of the countervailing duty administrative review of honey from Argentina for the period January 1, 2006 through December 21, 2006. See Initiation of Antidumping and Countervailing Duty
Administrative Reviews, 72 FR 5005 (February 2, 2007). On March 9, 2007, petitioners withdrew their request for this administrative review of the countervailing duty order of honey from Argentina. No other party requested an administrative review of this countervailing duty order.
Rescission of Review
The Department’s regulations at section 351.213(d)(1) provide that the Department will rescind an administrative review if the party that requested the review withdraws its request for review within 90 days of the date of publication of the notice of initiation of the requested review, or withdraws its request at a later date if the Department determines that it is reasonable to extend the time limit for withdrawing the request. Petitioners, the only requestors of this review, submitted their request for withdrawal in a timely manner. Therefore, the Department is rescinding the administrative review of the countervailing duty order on honey from Argentina for the period January 1, 2006 through December 31, 2006. The Department intends to issue assessment instructions to U.S. Customs and Border Protection within 15 days of publication of this notice.
Notification Regarding APOs
This notice also serves as a reminder to parties subject to administrative protective orders (APO) of their responsibility concerning the return or destruction of proprietary information disclosed under APO in accordance with section 351.305 of the Department’s regulations, which continues to govern business proprietary information in this segment of the proceeding. Timely written notification of the return/destruction of APO materials or conversion to judicial protective order is hereby requested. Failure to comply with the regulations and terms of an APO is a violation which is subject to sanction.
This notice is issued and published in accordance with sections 751(a)(1) and 777(i)(1) of the Tariff Act of 1930, as amended, and section 351.213(d)(4) of the Department’s regulations.
Dated: March 30, 2007.
Stephen J. Claeys, Deputy Assistant Secretary for Import Administration. [FR Doc. E7–6385 Filed 4–4–07; 8:45 am]
BILLING CODE 3510–DS–S
VerDate Aug<31>2005 17:48 Apr 04, 2007 Jkt 211001 PO 00000 Frm 00007 Fmt 4703 Sfmt 4703 E:\FR\FM\05APN1.SGM 05APN1jlent
ini o
n P
RO
D1P
C65
with
NO
TIC
ES

EXPLANATION OF COMMISSION DETERMINATIONS ON ADEQUACYin
Certain Steel Concrete Reinforcing Bar from Belarus, China,Indonesia, Korea, Latvia, Moldova, Poland, and Ukraine
Inv. Nos. 873-875, 877-880 and 882 (Review)
On November 6, 2006, the Commission determined that it should proceed to full reviewsin the subject five-year reviews pursuant to section 751(c)(3)(B) of the Tariff Act of 1930, asamended, 19 U.S.C. §1675(c)(3)(B).
The Commission unanimously determined that the domestic interested party groupresponse to the notice of institution was inadequate in these reviews. The Commission receivedresponses to the notice of institution filed jointly on behalf of the Rebar Trade Action Coalition,a trade association comprised of domestic producers Nucor Corp., Commercial Metals Co., andGerdau Ameristeel Corp., and two other domestic producers, Cascade Steel Inc., and TAMCOSteel (collectively “domestic interested parties”). However, domestic interested parties failed toprovide individual production or association data as required by the notice of institution andCommission Rule 207.62(a) in their joint response and did not respond to a subsequent requestby the Commission to remedy this deficiency. The Commission therefore determined that thedomestic interested party individual responses and group response were inadequate.
The Commission received an adequate individual response from the followingrespondent interested parties: Republican Unitary Enterprise (“Byelorussian Steel Works”), aproducer of steel concrete reinforcing bar (“rebar”) in Belarus; Joint Stock Co. LiepajasMetalurgs, a producer of rebar in Latvia; JSCC Moldova Steel Works, a producer of rebar inMoldova; and Mittal Steel Kryvij Rih, a producer and exporter of rebar in Ukraine. Each ofthese respondent interested parties accounted for a significant share of the production of subjectmerchandise in their respective countries. Therefore, the Commission found that the respondentinterested party group responses were adequate with respect to the orders on rebar from Belarus,Latvia, Moldova, and Ukraine.
The Commission did not receive a response from any respondent interested parties in thereviews concerning subject imports from China, Indonesia, Korea, and Poland. It thereforedetermined that the respondent interested party group response for these countries was notadequate.
Although the Commission found that the domestic interested parties group response wasinadequate in these reviews and that the respondent interested parties group response fromChina, Indonesia, Korea, and Poland were inadequate, it found that other circumstanceswarranted conducting full reviews. Specifically, there is a question of whether appropriatecircumstances exist to conduct a regional industry analysis in these reviews. The Commissionalso noted that, while the domestic interested parties’ individual responses were inadequate,producers accounting for a significant share of domestic production expressed their willingnessto participate in these reviews by providing information to the Commission. Finally, withrespect to China, Indonesia, Korea, and Poland, the Commission voted to conduct full reviews

2
concerning subject imports from these countries to promote administrative efficiency in light ofthe Commission’s determination to conduct full reviews of orders on subject imports from theother four countries in these grouped reviews. Therefore, the Commission unanimously voted toconduct full reviews in these group reviews.
A record of the Commissioners’ votes is available from the Office of the Secretary and atthe Commission's web site (www.usitc.gov).

B-1
APPENDIX B
HEARING WITNESSES

B-3
CALENDAR OF PUBLIC HEARING
Those listed below appeared as witnesses at the United States International Trade Commission’shearing:
Subject: Steel Concrete Reinforcing Bar from Belarus, China, Indonesia,Korea, Latvia, Moldova, Poland, and Ukraine
Inv. Nos.: 731-TA-873-875, 877-880, and 882 (Review)
Date and Time: May 10, 2007 - 9:30 a.m.
Sessions were held in connection with these investigations in the Main Hearing Room, 500 E Street(room 101), SW, Washington, D.C.
OPENING REMARKS:
In Support of Continuation of Orders (Alan H. Price,Wiley Rein LLP)
In Opposition to Continuation of Orders (John M. Gurley,Arent Fox LLP; and William E. Perry, Garvey Schubert Barer)
In Support of Continuation of Antidumping Duty Orders:
Wiley Rein LLPWashington, D.C.on behalf of
Rebar Trade Action Coalition (“RTAC”)TAMCO SteelCascade Steel, Inc.
D. Michael Parrish, Executive Vice President,Nucor Corp.

B-4
In Support of Continuation of Antidumping Duty Orders (continued):
Louis T. Miller, Speed Pulpit Operator, Nucor SteelBirmingham, Inc.
Jim Fritsch, Executive Vice President, CMC Steel Group
J. Neal McCullochs, Group Vice President, GerdauAmeristeel
Martin Koch, President, Southwestern Suppliers Inc.
Seth T. Kaplan, Principal, The Brattle Group
Alan H. Price )John R. Shane ) – OF COUNSELDaniel B. Pickard )
In Opposition to Continuation of Antidumping Duty Orders:
Garvey Schubert BarerWashington, D.C.on behalf of
Joint Stock Company Liepajas Metalurgs (“LM”)
Alex Zaharin, Vice Chairman, LM
Kirill Polovenko, IT Director, LM
David Phelps, President, American Institute forInternational Steel, Inc.
William E. Perry ) – OF COUNSELRonald M. Wisla )

B-5
In Opposition to Continuation of Antidumping Duty Orders (continued):
Arent Fox LLPWashington, D.C.on behalf of
Mittal Steel Kryvih Rih
Kenneth R. Button, PhD, Senior Vice President,Economic Consulting Services, LLC
Jennifer Lutz, Senior Economist, EconomicConsulting Services, LLC
John M. Gurley ) – OF COUNSELDiana Dimitriuc Quaia )
Troutman Sanders LLPWashington, D.C.on behalf of
Hyundai Steel Company (“Hyundai”)
Donald B. Cameron ) – OF COUNSEL
REBUTTAL/CLOSING REMARKS:
In Support of Continuation of Orders (Alan H. Price,Wiley Rein LLP)
In Opposition to Continuation of Orders (John M. Gurley,Arent Fox LLP; and William E. Perry, Garvey Schubert Barer)


C-1
APPENDIX C
SUMMARY DATA


Table C-1Rebar: Summary data concerning the total U.S. market, 2001-06
(Quantity=short tons, value=1,000 dollars, unit values, unit labor costs, and unit expenses are per short ton; period changes=percent except where noted)Reported data Period changes
Item 2001 2002 2003 2004 2005 2006 2001-06 2001-02 2002-03 2003-04 2004-05 2005-06
U.S. consumption quantity: Amount . . . . . . . . . . . . . . . . . . . . 7,735,092 7,368,986 8,492,487 8,718,690 8,868,598 9,875,423 27.7 -4.7 15.2 2.7 1.7 11.4 U.S. producers' share (1) . . . . . . 77.6 83.4 88.1 77.2 83.6 75.1 -2.5 5.7 4.7 -10.9 6.5 -8.5 Importers' share (1): Belarus . . . . . . . . . . . . . . . . . . . 0.0 0.0 0.0 0.0 0.0 0.0 0.0 0.0 -0.0 0.0 0.0 0.0 China . . . . . . . . . . . . . . . . . . . . 0.0 0.0 0.0 0.0 0.0 0.0 -0.0 -0.0 -0.0 0.0 -0.0 -0.0 Korea . . . . . . . . . . . . . . . . . . . . 1.5 0.0 0.0 0.0 0.1 0.0 -1.5 -1.5 0.0 0.0 0.1 -0.1 Latvia . . . . . . . . . . . . . . . . . . . . 0.4 0.6 0.6 1.4 0.4 0.0 -0.4 0.2 -0.0 0.8 -1.0 -0.4 Poland . . . . . . . . . . . . . . . . . . . 0.3 0.0 0.0 0.1 0.0 0.0 -0.3 -0.3 0.0 0.1 -0.1 0.0 Subtotal . . . . . . . . . . . . . . . . . 2.3 0.7 0.6 1.5 0.5 0.0 -2.3 -1.7 -0.1 0.9 -1.0 -0.5 All other sources . . . . . . . . . . . 20.1 16.0 11.3 21.4 15.9 24.9 4.8 -4.1 -4.6 10.0 -5.5 9.0 Total imports . . . . . . . . . . . . . 22.4 16.6 11.9 22.8 16.4 24.9 2.5 -5.7 -4.7 10.9 -6.5 8.5
U.S. consumption value: Amount . . . . . . . . . . . . . . . . . . . . 2,000,487 1,873,951 2,394,862 3,920,696 4,128,649 4,957,637 147.8 -6.3 27.8 63.7 5.3 20.1 U.S. producers' share (1) . . . . . . 80.6 85.3 88.2 76.4 85.0 78.1 -2.5 4.7 2.8 -11.8 8.7 -6.9 Importers' share (1): Belarus . . . . . . . . . . . . . . . . . . . 0.0 0.0 0.0 0.0 0.0 0.0 0.0 0.0 -0.0 0.0 0.0 0.0 China . . . . . . . . . . . . . . . . . . . . 0.0 0.0 0.0 0.0 0.0 0.0 -0.0 -0.0 -0.0 0.0 -0.0 -0.0 Korea . . . . . . . . . . . . . . . . . . . . 1.3 0.0 0.0 0.0 0.1 0.0 -1.3 -1.3 0.0 0.0 0.1 -0.1 Latvia . . . . . . . . . . . . . . . . . . . . 0.3 0.6 0.6 1.1 0.4 0.0 -0.3 0.2 0.0 0.5 -0.7 -0.4 Poland . . . . . . . . . . . . . . . . . . . 0.3 0.0 0.0 0.1 0.0 0.0 -0.3 -0.3 0.0 0.1 -0.1 0.0 Subtotal . . . . . . . . . . . . . . . . . 2.0 0.6 0.6 1.1 0.4 0.0 -2.0 -1.3 -0.0 0.5 -0.7 -0.4 All other sources . . . . . . . . . . . 17.4 14.0 11.2 22.5 14.5 21.9 4.4 -3.4 -2.8 11.3 -7.9 7.3 Total imports . . . . . . . . . . . . . 19.4 14.7 11.8 23.6 15.0 21.9 2.5 -4.7 -2.8 11.8 -8.7 6.9
U.S. imports from: Belarus: Quantity . . . . . . . . . . . . . . . . . . 0 2,820 0 0 0 0 (2) (2) -100.0 (2) (2) (2)
Value . . . . . . . . . . . . . . . . . . . . 0 577 0 0 0 0 (2) (2) -100.0 (2) (2) (2)
Unit value . . . . . . . . . . . . . . . . . ----- $205 ----- ----- ----- ----- (2) (2) (2) (2) (2) (2)
Ending inventory quantity . . . . 0 0 0 0 0 0 (2) (2) (2) (2) (2) (2)
China: Quantity . . . . . . . . . . . . . . . . . . 47 21 0 169 60 3 -92.7 -55.4 -100.0 (2) -64.1 -94.3 Value . . . . . . . . . . . . . . . . . . . . 23 13 0 173 18 4 -80.6 -42.4 -100.0 (2) -89.5 -75.3 Unit value . . . . . . . . . . . . . . . . . $492 $635 ----- $1,027 $299 $1,303 164.9 29.1 (2) (2) -70.9 335.5 Ending inventory quantity . . . . 0 0 0 0 0 0 (2) (2) (2) (2) (2) (2)
Korea: Quantity . . . . . . . . . . . . . . . . . . 118,469 0 0 0 5,516 0 -100.0 -100.0 (2) (2) (2) -100.0 Value . . . . . . . . . . . . . . . . . . . . 26,314 0 0 0 2,262 0 -100.0 -100.0 (2) (2) (2) -100.0 Unit value . . . . . . . . . . . . . . . . . $222 ----- ----- ----- $410 ----- (2) (2) (2) (2) (2) (2)
Ending inventory quantity . . . . 0 0 0 0 0 0 (2) (2) (2) (2) (2) (2)
Latvia: Quantity . . . . . . . . . . . . . . . . . . 33,662 45,904 50,522 121,881 36,646 0 -100.0 36.4 10.1 141.2 -69.9 -100.0 Value . . . . . . . . . . . . . . . . . . . . 6,761 10,720 14,316 42,001 15,059 0 -100.0 58.6 33.5 193.4 -64.1 -100.0 Unit value . . . . . . . . . . . . . . . . . $201 $234 $283 $345 $411 ----- (2) 16.3 21.3 21.6 19.3 (2)
Ending inventory quantity . . . . 0 0 0 0 0 0 (2) (2) (2) (2) (2) (2)
Poland: Quantity . . . . . . . . . . . . . . . . . . 26,884 0 0 7,303 0 129 -99.5 -100.0 (2) (2) -100.0 (2)
Value . . . . . . . . . . . . . . . . . . . . 5,943 0 0 2,789 0 50 -99.2 -100.0 (2) (2) -100.0 (2)
Unit value . . . . . . . . . . . . . . . . . $221 ----- ----- $382 ----- $387 75.3 (2) (2) (2) (2) (2)
Ending inventory quantity . . . . 0 0 0 0 0 0 (2) (2) (2) (2) (2) (2)
Subtotal (subject): Quantity . . . . . . . . . . . . . . . . . . 179,061 48,746 50,522 129,352 42,222 133 -99.9 -72.8 3.6 156.0 -67.4 -99.7 Value . . . . . . . . . . . . . . . . . . . . 39,042 11,310 14,316 44,963 17,339 54 -99.9 -71.0 26.6 214.1 -61.4 -99.7 Unit value . . . . . . . . . . . . . . . . . $218 $232 $283 $348 $411 $411 88.6 6.4 22.1 22.7 18.1 0.1 Ending inventory quantity . . . . 0 0 0 0 0 0 (2) (2) (2) (2) (2) (2)
All other sources: Quantity . . . . . . . . . . . . . . . . . . 1,551,751 1,177,809 962,562 1,861,470 1,410,136 2,454,275 58.2 -24.1 -18.3 93.4 -24.2 74.0 Value . . . . . . . . . . . . . . . . . . . . 348,890 263,224 269,131 881,861 600,627 1,084,640 210.9 -24.6 2.2 227.7 -31.9 80.6 Unit value . . . . . . . . . . . . . . . . . $225 $223 $280 $474 $426 $442 96.6 -0.6 25.1 69.4 -10.1 3.8 Ending inventory quantity . . . . 22,489 17,440 13,882 68,956 21,575 53,870 139.5 -22.5 -20.4 396.7 -68.7 149.7 All sources: Quantity . . . . . . . . . . . . . . . . . . 1,730,812 1,226,554 1,013,084 1,990,822 1,452,358 2,454,407 41.8 -29.1 -17.4 96.5 -27.0 69.0 Value . . . . . . . . . . . . . . . . . . . . 387,932 274,535 283,447 926,824 617,966 1,084,694 179.6 -29.2 3.2 227.0 -33.3 75.5 Unit value . . . . . . . . . . . . . . . . . $224 $224 $280 $466 $425 $442 97.2 -0.1 25.0 66.4 -8.6 3.9 Ending inventory quantity . . . . 22,489 17,440 13,882 68,956 21,575 53,870 139.5 -22.5 -20.4 396.7 -68.7 149.7
Table continued on next page.
C-3

Table C-1--ContinuedRebar: Summary data concerning the total U.S. market, 2001-06
(Quantity=short tons, value=1,000 dollars, unit values, unit labor costs, and unit expenses are per short ton; period changes=percent except where noted)Reported data Period changes
Item 2001 2002 2003 2004 2005 2006 2001-06 2001-02 2002-03 2003-04 2004-05 2005-06
U.S. producers': Average capacity quantity . . . . . 7,886,652 7,993,078 8,424,774 8,154,261 8,367,112 8,615,640 9.2 1.3 5.4 -3.2 2.6 3.0 Production quantity . . . . . . . . . . 6,146,866 6,354,037 7,501,223 7,076,073 7,541,574 7,704,871 25.3 3.4 18.1 -5.7 6.6 2.2 Capacity utilization (1) . . . . . . . . 77.9 79.5 89.0 86.8 90.1 89.4 11.5 1.6 9.5 -2.3 3.4 -0.7 U.S. shipments: Quantity . . . . . . . . . . . . . . . . . . 6,004,280 6,142,432 7,479,403 6,727,868 7,416,240 7,421,016 23.6 2.3 21.8 -10.0 10.2 0.1 Value . . . . . . . . . . . . . . . . . . . . 1,612,555 1,599,417 2,111,414 2,993,872 3,510,682 3,872,943 140.2 -0.8 32.0 41.8 17.3 10.3 Unit value . . . . . . . . . . . . . . . . . $269 $260 $282 $445 $473 $522 94.3 -3.0 8.4 57.6 6.4 10.2 Export shipments: Quantity . . . . . . . . . . . . . . . . . . *** *** *** *** *** *** *** *** *** *** *** *** Value . . . . . . . . . . . . . . . . . . . . *** *** *** *** *** *** *** *** *** *** *** *** Unit value . . . . . . . . . . . . . . . . . *** *** *** *** *** *** *** *** *** *** *** *** Ending inventory quantity . . . . . 601,153 617,597 441,762 619,492 533,925 597,345 -0.6 2.7 -28.5 40.2 -13.8 11.9 Inventories/total shipments (1) . *** *** *** *** *** *** *** *** *** *** *** *** Production workers . . . . . . . . . . 3,967 3,827 3,897 3,719 3,909 4,066 2.5 -3.5 1.8 -4.6 5.1 4.0 Hours worked (1,000s) . . . . . . . 8,438 8,093 8,938 8,149 8,390 8,650 2.5 -4.1 10.4 -8.8 3.0 3.1 Wages paid ($1,000s) . . . . . . . . 211,855 215,541 237,579 238,024 265,621 284,103 34.1 1.7 10.2 0.2 11.6 7.0 Hourly wages . . . . . . . . . . . . . . . $25.11 $26.63 $26.58 $29.21 $31.66 $32.85 30.8 6.1 -0.2 9.9 8.4 3.8 Productivity (tons/1,000 hours) . 728.5 785.1 839.3 868.3 898.9 890.8 22.3 7.8 6.9 3.5 3.5 -0.9 Unit labor costs . . . . . . . . . . . . . $34.47 $33.92 $31.67 $33.64 $35.22 $36.87 7.0 -1.6 -6.6 6.2 4.7 4.7 Net sales: Quantity . . . . . . . . . . . . . . . . . . 6,190,355 6,338,939 7,615,292 7,016,005 7,533,213 7,742,037 25.1 2.4 20.1 -7.9 7.4 2.8 Value . . . . . . . . . . . . . . . . . . . . 1,657,996 1,654,343 2,137,694 3,029,572 3,531,181 4,006,813 141.7 -0.2 29.2 41.7 16.6 13.5 Unit value . . . . . . . . . . . . . . . . . $268 $261 $281 $432 $469 $518 93.2 -2.6 7.6 53.8 8.6 10.4 Cost of goods sold (COGS) . . . . 1,455,311 1,503,097 1,946,966 2,398,760 2,717,517 2,965,198 103.8 3.3 29.5 23.2 13.3 9.1 Gross profit or (loss) . . . . . . . . . 202,685 151,246 190,728 630,812 813,665 1,041,615 413.9 -25.4 26.1 230.7 29.0 28.0 SG&A expenses . . . . . . . . . . . . . 92,777 84,938 125,026 164,402 192,145 213,854 130.5 -8.4 47.2 31.5 16.9 11.3 Operating income or (loss) . . . . 109,908 66,308 65,702 466,410 621,520 827,761 653.1 -39.7 -0.9 609.9 33.3 33.2 Capital expenditures . . . . . . . . . 61,609 43,782 70,159 84,896 128,049 146,048 137.1 -28.9 60.2 21.0 50.8 14.1 Unit COGS . . . . . . . . . . . . . . . . . $235 $237 $256 $342 $361 $383 62.9 0.9 7.8 33.7 5.5 6.2 Unit SG&A expenses . . . . . . . . . $15 $13 $16 $23 $26 $28 84.3 -10.6 22.5 42.7 8.9 8.3 Unit operating income or (loss) . $18 $10 $9 $66 $83 $107 502.2 -41.1 -17.5 670.5 24.1 29.6 COGS/sales (1) . . . . . . . . . . . . . 87.8 90.9 91.1 79.2 77.0 74.0 -13.8 3.1 0.2 -11.9 -2.2 -3.0 Operating income or (loss)/ sales (1) . . . . . . . . . . . . . . . . . . 6.6 4.0 3.1 15.4 17.6 20.7 14.0 -2.6 -0.9 12.3 2.2 3.1
(1) "Reported data" are in percent and "period changes" are in percentage points. (2) Not applicable.
Note.--Financial data are reported on a fiscal year basis and may not necessarily be comparable to data reported on a calendar year basis. Because of rounding, figures may not add to the totals shown.Unit values and shares are calculated from the unrounded figures. No imports from Indonesia, Moldova, or Ukraine were reported during the period.
Source: Compiled from data submitted in response to Commission questionnaires and from official Commerce statistics.
C-4
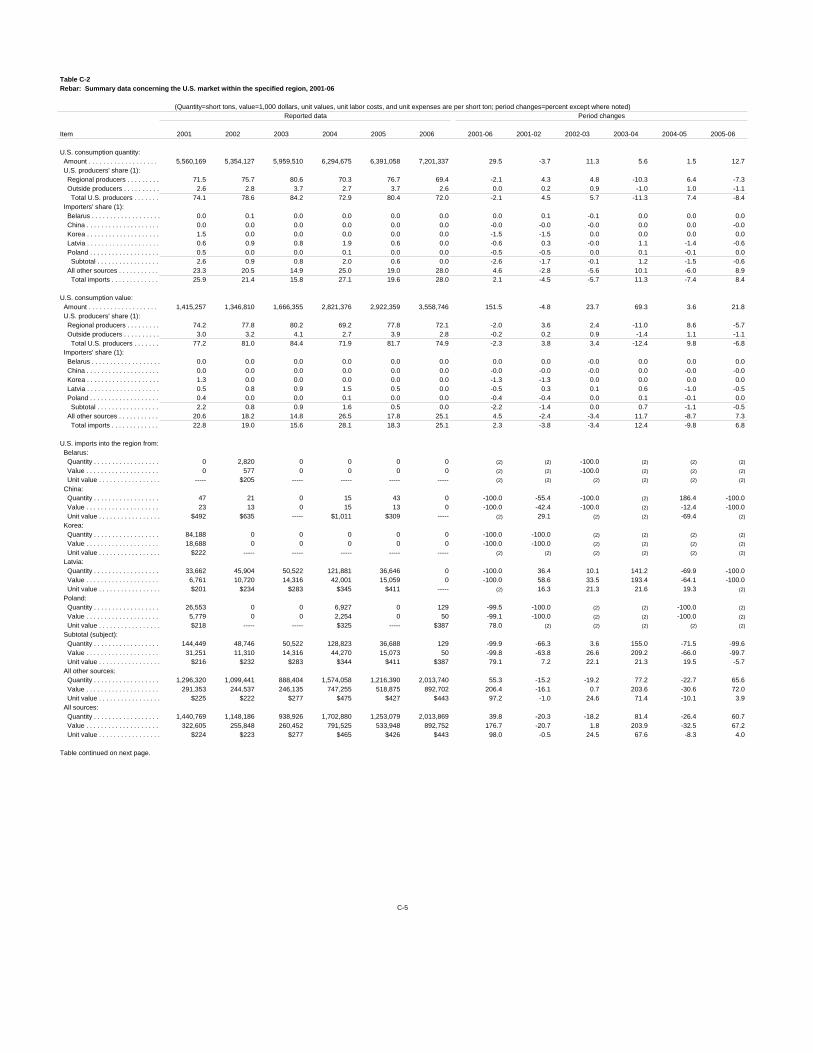
Table C-2Rebar: Summary data concerning the U.S. market within the specified region, 2001-06
(Quantity=short tons, value=1,000 dollars, unit values, unit labor costs, and unit expenses are per short ton; period changes=percent except where noted)Reported data Period changes
Item 2001 2002 2003 2004 2005 2006 2001-06 2001-02 2002-03 2003-04 2004-05 2005-06
U.S. consumption quantity: Amount . . . . . . . . . . . . . . . . . . . . 5,560,169 5,354,127 5,959,510 6,294,675 6,391,058 7,201,337 29.5 -3.7 11.3 5.6 1.5 12.7 U.S. producers' share (1): Regional producers . . . . . . . . . 71.5 75.7 80.6 70.3 76.7 69.4 -2.1 4.3 4.8 -10.3 6.4 -7.3 Outside producers . . . . . . . . . . 2.6 2.8 3.7 2.7 3.7 2.6 0.0 0.2 0.9 -1.0 1.0 -1.1 Total U.S. producers . . . . . . . 74.1 78.6 84.2 72.9 80.4 72.0 -2.1 4.5 5.7 -11.3 7.4 -8.4 Importers' share (1): Belarus . . . . . . . . . . . . . . . . . . . 0.0 0.1 0.0 0.0 0.0 0.0 0.0 0.1 -0.1 0.0 0.0 0.0 China . . . . . . . . . . . . . . . . . . . . 0.0 0.0 0.0 0.0 0.0 0.0 -0.0 -0.0 -0.0 0.0 0.0 -0.0 Korea . . . . . . . . . . . . . . . . . . . . 1.5 0.0 0.0 0.0 0.0 0.0 -1.5 -1.5 0.0 0.0 0.0 0.0 Latvia . . . . . . . . . . . . . . . . . . . . 0.6 0.9 0.8 1.9 0.6 0.0 -0.6 0.3 -0.0 1.1 -1.4 -0.6 Poland . . . . . . . . . . . . . . . . . . . 0.5 0.0 0.0 0.1 0.0 0.0 -0.5 -0.5 0.0 0.1 -0.1 0.0 Subtotal . . . . . . . . . . . . . . . . . 2.6 0.9 0.8 2.0 0.6 0.0 -2.6 -1.7 -0.1 1.2 -1.5 -0.6 All other sources . . . . . . . . . . . 23.3 20.5 14.9 25.0 19.0 28.0 4.6 -2.8 -5.6 10.1 -6.0 8.9 Total imports . . . . . . . . . . . . . 25.9 21.4 15.8 27.1 19.6 28.0 2.1 -4.5 -5.7 11.3 -7.4 8.4
U.S. consumption value: Amount . . . . . . . . . . . . . . . . . . . . 1,415,257 1,346,810 1,666,355 2,821,376 2,922,359 3,558,746 151.5 -4.8 23.7 69.3 3.6 21.8 U.S. producers' share (1): Regional producers . . . . . . . . . 74.2 77.8 80.2 69.2 77.8 72.1 -2.0 3.6 2.4 -11.0 8.6 -5.7 Outside producers . . . . . . . . . . 3.0 3.2 4.1 2.7 3.9 2.8 -0.2 0.2 0.9 -1.4 1.1 -1.1 Total U.S. producers . . . . . . . 77.2 81.0 84.4 71.9 81.7 74.9 -2.3 3.8 3.4 -12.4 9.8 -6.8 Importers' share (1): Belarus . . . . . . . . . . . . . . . . . . . 0.0 0.0 0.0 0.0 0.0 0.0 0.0 0.0 -0.0 0.0 0.0 0.0 China . . . . . . . . . . . . . . . . . . . . 0.0 0.0 0.0 0.0 0.0 0.0 -0.0 -0.0 -0.0 0.0 -0.0 -0.0 Korea . . . . . . . . . . . . . . . . . . . . 1.3 0.0 0.0 0.0 0.0 0.0 -1.3 -1.3 0.0 0.0 0.0 0.0 Latvia . . . . . . . . . . . . . . . . . . . . 0.5 0.8 0.9 1.5 0.5 0.0 -0.5 0.3 0.1 0.6 -1.0 -0.5 Poland . . . . . . . . . . . . . . . . . . . 0.4 0.0 0.0 0.1 0.0 0.0 -0.4 -0.4 0.0 0.1 -0.1 0.0 Subtotal . . . . . . . . . . . . . . . . . 2.2 0.8 0.9 1.6 0.5 0.0 -2.2 -1.4 0.0 0.7 -1.1 -0.5 All other sources . . . . . . . . . . . 20.6 18.2 14.8 26.5 17.8 25.1 4.5 -2.4 -3.4 11.7 -8.7 7.3 Total imports . . . . . . . . . . . . . 22.8 19.0 15.6 28.1 18.3 25.1 2.3 -3.8 -3.4 12.4 -9.8 6.8
U.S. imports into the region from: Belarus: Quantity . . . . . . . . . . . . . . . . . . 0 2,820 0 0 0 0 (2) (2) -100.0 (2) (2) (2)
Value . . . . . . . . . . . . . . . . . . . . 0 577 0 0 0 0 (2) (2) -100.0 (2) (2) (2)
Unit value . . . . . . . . . . . . . . . . . ----- $205 ----- ----- ----- ----- (2) (2) (2) (2) (2) (2)
China: Quantity . . . . . . . . . . . . . . . . . . 47 21 0 15 43 0 -100.0 -55.4 -100.0 (2) 186.4 -100.0 Value . . . . . . . . . . . . . . . . . . . . 23 13 0 15 13 0 -100.0 -42.4 -100.0 (2) -12.4 -100.0 Unit value . . . . . . . . . . . . . . . . . $492 $635 ----- $1,011 $309 ----- (2) 29.1 (2) (2) -69.4 (2)
Korea: Quantity . . . . . . . . . . . . . . . . . . 84,188 0 0 0 0 0 -100.0 -100.0 (2) (2) (2) (2)
Value . . . . . . . . . . . . . . . . . . . . 18,688 0 0 0 0 0 -100.0 -100.0 (2) (2) (2) (2)
Unit value . . . . . . . . . . . . . . . . . $222 ----- ----- ----- ----- ----- (2) (2) (2) (2) (2) (2)
Latvia: Quantity . . . . . . . . . . . . . . . . . . 33,662 45,904 50,522 121,881 36,646 0 -100.0 36.4 10.1 141.2 -69.9 -100.0 Value . . . . . . . . . . . . . . . . . . . . 6,761 10,720 14,316 42,001 15,059 0 -100.0 58.6 33.5 193.4 -64.1 -100.0 Unit value . . . . . . . . . . . . . . . . . $201 $234 $283 $345 $411 ----- (2) 16.3 21.3 21.6 19.3 (2)
Poland: Quantity . . . . . . . . . . . . . . . . . . 26,553 0 0 6,927 0 129 -99.5 -100.0 (2) (2) -100.0 (2)
Value . . . . . . . . . . . . . . . . . . . . 5,779 0 0 2,254 0 50 -99.1 -100.0 (2) (2) -100.0 (2)
Unit value . . . . . . . . . . . . . . . . . $218 ----- ----- $325 ----- $387 78.0 (2) (2) (2) (2) (2)
Subtotal (subject): Quantity . . . . . . . . . . . . . . . . . . 144,449 48,746 50,522 128,823 36,688 129 -99.9 -66.3 3.6 155.0 -71.5 -99.6 Value . . . . . . . . . . . . . . . . . . . . 31,251 11,310 14,316 44,270 15,073 50 -99.8 -63.8 26.6 209.2 -66.0 -99.7 Unit value . . . . . . . . . . . . . . . . . $216 $232 $283 $344 $411 $387 79.1 7.2 22.1 21.3 19.5 -5.7 All other sources: Quantity . . . . . . . . . . . . . . . . . . 1,296,320 1,099,441 888,404 1,574,058 1,216,390 2,013,740 55.3 -15.2 -19.2 77.2 -22.7 65.6 Value . . . . . . . . . . . . . . . . . . . . 291,353 244,537 246,135 747,255 518,875 892,702 206.4 -16.1 0.7 203.6 -30.6 72.0 Unit value . . . . . . . . . . . . . . . . . $225 $222 $277 $475 $427 $443 97.2 -1.0 24.6 71.4 -10.1 3.9 All sources: Quantity . . . . . . . . . . . . . . . . . . 1,440,769 1,148,186 938,926 1,702,880 1,253,079 2,013,869 39.8 -20.3 -18.2 81.4 -26.4 60.7 Value . . . . . . . . . . . . . . . . . . . . 322,605 255,848 260,452 791,525 533,948 892,752 176.7 -20.7 1.8 203.9 -32.5 67.2 Unit value . . . . . . . . . . . . . . . . . $224 $223 $277 $465 $426 $443 98.0 -0.5 24.5 67.6 -8.3 4.0
Table continued on next page.
C-5

Table C-2--ContinuedRebar: Summary data concerning the U.S. market within the specified region, 2001-06
(Quantity=short tons, value=1,000 dollars, unit values, unit labor costs, and unit expenses are per short ton; period changes=percent except where noted)Reported data Period changes
Item 2001 2002 2003 2004 2005 2006 2001-06 2001-02 2002-03 2003-04 2004-05 2005-06
U.S. regional producers': Average capacity quantity . . . . . 5,551,138 5,687,574 5,866,111 5,760,559 5,863,662 6,116,290 10.2 2.5 3.1 -1.8 1.8 4.3 Production quantity . . . . . . . . . . 4,252,563 4,472,788 5,089,855 4,897,577 5,195,599 5,426,079 27.6 5.2 13.8 -3.8 6.1 4.4 Capacity utilization (1) . . . . . . . . 76.6 78.6 86.8 85.0 88.6 88.7 12.1 2.0 8.1 -1.7 3.6 0.1 U.S. shipments within the region: Quantity . . . . . . . . . . . . . . . . . . 3,973,962 4,055,496 4,802,331 4,423,373 4,901,788 4,998,517 25.8 2.1 18.4 -7.9 10.8 2.0 Value . . . . . . . . . . . . . . . . . . . . 1,049,843 1,047,928 1,337,181 1,952,326 2,274,582 2,567,108 144.5 -0.2 27.6 46.0 16.5 12.9 Unit value . . . . . . . . . . . . . . . . . $264 $258 $278 $441 $464 $514 94.4 -2.2 7.8 58.5 5.1 10.7 U.S. shipments outside the region: Quantity . . . . . . . . . . . . . . . . . . 328,409 340,383 384,011 370,460 341,984 376,581 14.7 3.6 12.8 -3.5 -7.7 10.1 Value . . . . . . . . . . . . . . . . . . . . 90,046 89,352 108,524 163,724 164,493 203,004 125.4 -0.8 21.5 50.9 0.5 23.4 Unit value . . . . . . . . . . . . . . . . . $274 $263 $283 $442 $481 $539 96.6 -4.3 7.7 56.4 8.8 12.1 Export shipments: Quantity . . . . . . . . . . . . . . . . . . *** *** *** *** *** *** *** *** *** *** *** *** Value . . . . . . . . . . . . . . . . . . . . *** *** *** *** *** *** *** *** *** *** *** *** Unit value . . . . . . . . . . . . . . . . . *** *** *** *** *** *** *** *** *** *** *** *** Ending inventory quantity . . . . . 366,847 428,665 325,883 426,645 366,923 414,605 13.0 16.9 -24.0 30.9 -14.0 13.0 Inventories/total shipments (1) . *** *** *** *** *** *** *** *** *** *** *** *** Production workers . . . . . . . . . . 2,635 2,609 2,590 2,482 2,593 2,739 3.9 -1.0 -0.7 -4.2 4.5 5.6 Hours worked (1,000s) . . . . . . . 5,617 5,559 5,905 5,632 5,611 6,052 7.7 -1.0 6.2 -4.6 -0.4 7.8 Wages paid ($1,000s) . . . . . . . . 134,824 139,834 150,379 154,854 165,826 184,669 37.0 3.7 7.5 3.0 7.1 11.4 Hourly wages . . . . . . . . . . . . . . . $24.00 $25.15 $25.47 $27.50 $29.55 $30.52 27.1 4.8 1.2 8.0 7.5 3.3 Productivity (tons/1,000 hours) . 757.1 804.6 862.0 869.6 926.0 896.7 18.4 6.3 7.1 0.9 6.5 -3.2 Unit labor costs . . . . . . . . . . . . . $31.70 $31.26 $29.54 $31.62 $31.92 $34.03 7.3 -1.4 -5.5 7.0 0.9 6.6 Net sales: Quantity . . . . . . . . . . . . . . . . . . 4,314,344 4,412,317 5,130,869 4,914,478 5,161,392 5,478,984 27.0 2.3 16.3 -4.2 5.0 6.2 Value . . . . . . . . . . . . . . . . . . . . 1,137,102 1,144,308 1,414,388 2,074,882 2,365,696 2,789,490 145.3 0.6 23.6 46.7 14.0 17.9 Unit value . . . . . . . . . . . . . . . . . $264 $259 $276 $422 $458 $509 93.2 -1.6 6.3 53.2 8.6 11.1 Cost of goods sold (COGS) . . . . 1,009,807 1,039,787 1,299,180 1,668,707 1,825,527 2,075,643 105.5 3.0 24.9 28.4 9.4 13.7 Gross profit or (loss) . . . . . . . . . 127,295 104,521 115,208 406,175 540,170 713,847 460.8 -17.9 10.2 252.6 33.0 32.2 SG&A expenses . . . . . . . . . . . . . 74,139 67,258 104,823 141,204 159,781 185,135 149.7 -9.3 55.9 34.7 13.2 15.9 Operating income or (loss) . . . . 53,156 37,263 10,385 264,971 380,389 528,712 894.6 -29.9 -72.1 2451.4 43.6 39.0 Capital expenditures . . . . . . . . . 41,378 37,686 61,872 69,110 108,742 114,695 177.2 -8.9 64.2 11.7 57.3 5.5 Unit COGS . . . . . . . . . . . . . . . . . $234 $236 $253 $340 $354 $379 61.9 0.7 7.4 34.1 4.2 7.1 Unit SG&A expenses . . . . . . . . . $17 $15 $20 $29 $31 $34 96.6 -11.3 34.0 40.6 7.7 9.2 Unit operating income or (loss) . $12 $8 $2 $54 $74 $96 683.2 -31.5 -76.0 2563.8 36.7 30.9 COGS/sales (1) . . . . . . . . . . . . . 88.8 90.9 91.9 80.4 77.2 74.4 -14.4 2.1 1.0 -11.4 -3.3 -2.8 Operating income or (loss)/ sales (1) . . . . . . . . . . . . . . . . . . 4.7 3.3 0.7 12.8 16.1 19.0 14.3 -1.4 -2.5 12.0 3.3 2.9
U.S. shipments into the region by outside U.S. producers: Quantity . . . . . . . . . . . . . . . . . . 145,438 150,445 218,253 168,422 236,191 188,951 29.9 3.4 45.1 -22.8 40.2 -20.0 Value . . . . . . . . . . . . . . . . . . . . 42,810 43,034 68,723 77,524 113,829 98,886 131.0 0.5 59.7 12.8 46.8 -13.1 Unit value . . . . . . . . . . . . . . . . . $294 $286 $315 $460 $482 $523 77.8 -2.8 10.1 46.2 4.7 8.6
(1) "Reported data" are in percent and "period changes" are in percentage points. (2) Not applicable.
Note1.--Financial data are reported on a fiscal year basis and may not necessarily be comparable to data reported on a calendar year basis. Because of rounding, figures may not add to the totals shown.Unit values and shares are calculated from the unrounded figures. No imports from Indonesia, Moldova, or Ukraine were reported during the period.
Note2.--The specified region includes 30 states (Alabama, Arkansas, Connecticut, Delaware, Florida, Georgia, Illinois, Indiana, Kentucky, Louisiana, Maine, Maryland, Massachusetts, Michigan, Mississippi, Missouri,New Hampshire, New Jersey, New York, North Carolina, Ohio, Pennsylvania, Rhode Island, South Carolina, Tennessee, Texas, Vermont, Virginia, West Virginia, and Wisconsin), plus Puerto Rico and the District of Columbia.
Source: Compiled from data submitted in response to Commission questionnaires and from official Commerce statistics.
C-6

Table C-3Rebar: Summary data concerning the U.S. market outside the specified region, 2001-06
(Quantity=short tons, value=1,000 dollars, unit values, unit labor costs, and unit expenses are per short ton; period changes=percent except where noted)Reported data Period changes
Item 2001 2002 2003 2004 2005 2006 2001-06 2001-02 2002-03 2003-04 2004-05 2005-06
U.S. consumption quantity: Amount . . . . . . . . . . . . . . . . . . . . 2,174,923 2,014,859 2,532,977 2,424,015 2,477,540 2,674,086 23.0 -7.4 25.7 -4.3 2.2 7.9 U.S. producers' share (1): Regional producers . . . . . . . . . 15.1 16.9 15.2 15.3 13.8 14.1 -1.0 1.8 -1.7 0.1 -1.5 0.3 Outside producers . . . . . . . . . . 71.6 79.2 81.9 72.8 78.2 69.4 -2.1 7.7 2.7 -9.1 5.3 -8.7 Total U.S. producers . . . . . . . 86.7 96.1 97.1 88.1 92.0 83.5 -3.1 9.4 1.0 -9.0 3.8 -8.4 Importers' share (1): Belarus . . . . . . . . . . . . . . . . . . . 0.0 0.0 0.0 0.0 0.0 0.0 0.0 0.0 0.0 0.0 0.0 0.0 China . . . . . . . . . . . . . . . . . . . . 0.0 0.0 0.0 0.0 0.0 0.0 0.0 0.0 0.0 0.0 -0.0 -0.0 Korea . . . . . . . . . . . . . . . . . . . . 1.6 0.0 0.0 0.0 0.2 0.0 -1.6 -1.6 0.0 0.0 0.2 -0.2 Latvia . . . . . . . . . . . . . . . . . . . . 0.0 0.0 0.0 0.0 0.0 0.0 0.0 0.0 0.0 0.0 0.0 0.0 Poland . . . . . . . . . . . . . . . . . . . 0.0 0.0 0.0 0.0 0.0 0.0 -0.0 -0.0 0.0 0.0 -0.0 0.0 Subtotal . . . . . . . . . . . . . . . . . 1.6 0.0 0.0 0.0 0.2 0.0 -1.6 -1.6 0.0 0.0 0.2 -0.2 All other sources . . . . . . . . . . . 11.7 3.9 2.9 11.9 7.8 16.5 4.7 -7.9 -1.0 8.9 -4.0 8.7 Total imports . . . . . . . . . . . . . 13.3 3.9 2.9 11.9 8.0 16.5 3.1 -9.4 -1.0 9.0 -3.8 8.4
U.S. consumption value: Amount . . . . . . . . . . . . . . . . . . . . 585,231 527,142 728,506 1,099,321 1,206,289 1,398,892 139.0 -9.9 38.2 50.9 9.7 16.0 U.S. producers' share (1): Regional producers . . . . . . . . . 15.4 17.0 14.9 14.9 13.6 14.5 -0.9 1.6 -2.1 -0.0 -1.3 0.9 Outside producers . . . . . . . . . . 73.5 79.5 81.9 72.8 79.4 71.8 -1.7 6.1 2.4 -9.1 6.6 -7.6 Total U.S. producers . . . . . . . 88.8 96.5 96.8 87.7 93.0 86.3 -2.6 7.6 0.4 -9.2 5.3 -6.8 Importers' share (1): Belarus . . . . . . . . . . . . . . . . . . . 0.0 0.0 0.0 0.0 0.0 0.0 0.0 0.0 0.0 0.0 0.0 0.0 China . . . . . . . . . . . . . . . . . . . . 0.0 0.0 0.0 0.0 0.0 0.0 0.0 0.0 0.0 0.0 -0.0 -0.0 Korea . . . . . . . . . . . . . . . . . . . . 1.3 0.0 0.0 0.0 0.2 0.0 -1.3 -1.3 0.0 0.0 0.2 -0.2 Latvia . . . . . . . . . . . . . . . . . . . . 0.0 0.0 0.0 0.0 0.0 0.0 0.0 0.0 0.0 0.0 0.0 0.0 Poland . . . . . . . . . . . . . . . . . . . 0.0 0.0 0.0 0.0 0.0 0.0 -0.0 -0.0 0.0 0.0 -0.0 0.0 Subtotal . . . . . . . . . . . . . . . . . 1.3 0.0 0.0 0.1 0.2 0.0 -1.3 -1.3 0.0 0.1 0.1 -0.2 All other sources . . . . . . . . . . . 9.8 3.5 3.2 12.2 6.8 13.7 3.9 -6.3 -0.4 9.1 -5.5 6.9 Total imports . . . . . . . . . . . . . 11.2 3.5 3.2 12.3 7.0 13.7 2.6 -7.6 -0.4 9.2 -5.3 6.8
U.S. imports outside the region from: Belarus: Quantity . . . . . . . . . . . . . . . . . . 0 0 0 0 0 0 (2) (2) (2) (2) (2) (2)
Value . . . . . . . . . . . . . . . . . . . . 0 0 0 0 0 0 (2) (2) (2) (2) (2) (2)
Unit value . . . . . . . . . . . . . . . . . ----- ----- ----- ----- ----- ----- (2) (2) (2) (2) (2) (2)
China: Quantity . . . . . . . . . . . . . . . . . . 0 0 0 154 18 3 (2) (2) (2) (2) -88.4 -80.8 Value . . . . . . . . . . . . . . . . . . . . 0 0 0 158 5 4 (2) (2) (2) (2) -96.9 -9.0 Unit value . . . . . . . . . . . . . . . . . ----- ----- ----- $1,029 $275 $1,303 (2) (2) (2) (2) -73.3 374.0 Korea: Quantity . . . . . . . . . . . . . . . . . . 34,281 0 0 0 5,516 0 -100.0 -100.0 (2) (2) (2) -100.0 Value . . . . . . . . . . . . . . . . . . . . 7,626 0 0 0 2,262 0 -100.0 -100.0 (2) (2) (2) -100.0 Unit value . . . . . . . . . . . . . . . . . $222 ----- ----- ----- $410 ----- (2) (2) (2) (2) (2) (2)
Latvia: Quantity . . . . . . . . . . . . . . . . . . 0 0 0 0 0 0 (2) (2) (2) (2) (2) (2)
Value . . . . . . . . . . . . . . . . . . . . 0 0 0 0 0 0 (2) (2) (2) (2) (2) (2)
Unit value . . . . . . . . . . . . . . . . . ----- ----- ----- ----- ----- ----- (2) (2) (2) (2) (2) (2)
Poland: Quantity . . . . . . . . . . . . . . . . . . 331 0 0 376 0 0 -100.0 -100.0 (2) (2) -100.0 (2)
Value . . . . . . . . . . . . . . . . . . . . 164 0 0 534 0 0 -100.0 -100.0 (2) (2) -100.0 (2)
Unit value . . . . . . . . . . . . . . . . . $496 ----- ----- $1,421 ----- ----- (2) (2) (2) (2) (2) (2)
Subtotal (subject): Quantity . . . . . . . . . . . . . . . . . . 34,612 0 0 530 5,534 3 -100.0 -100.0 (2) (2) 944.9 -99.9 Value . . . . . . . . . . . . . . . . . . . . 7,790 0 0 692 2,267 4 -99.9 -100.0 (2) (2) 227.3 -99.8 Unit value . . . . . . . . . . . . . . . . . $225 ----- ----- $1,308 $410 $1,303 479.1 (2) (2) (2) -68.7 218.2 All other sources: Quantity . . . . . . . . . . . . . . . . . . 255,431 78,368 74,158 287,412 193,745 440,535 72.5 -69.3 -5.4 287.6 -32.6 127.4 Value . . . . . . . . . . . . . . . . . . . . 57,537 18,687 22,996 134,606 81,752 191,938 233.6 -67.5 23.1 485.4 -39.3 134.8 Unit value . . . . . . . . . . . . . . . . . $225 $238 $310 $468 $422 $436 93.4 5.9 30.0 51.0 -9.9 3.3 All sources: Quantity . . . . . . . . . . . . . . . . . . 290,043 78,368 74,158 287,942 199,279 440,538 51.9 -73.0 -5.4 288.3 -30.8 121.1 Value . . . . . . . . . . . . . . . . . . . . 65,327 18,687 22,996 135,299 84,019 191,943 193.8 -71.4 23.1 488.4 -37.9 128.5 Unit value . . . . . . . . . . . . . . . . . $225 $238 $310 $470 $422 $436 93.4 5.9 30.0 51.5 -10.3 3.3
Table continued on next page.
C-7

Table C-3--ContinuedRebar: Summary data concerning the U.S. market outside the specified region, 2001-06
(Quantity=short tons, value=1,000 dollars, unit values, unit labor costs, and unit expenses are per short ton; period changes=percent except where noted)Reported data Period changes
Item 2001 2002 2003 2004 2005 2006 2001-06 2001-02 2002-03 2003-04 2004-05 2005-06
U.S. outside producers': Average capacity quantity . . . . . 2,335,514 2,305,504 2,558,663 2,393,702 2,503,450 2,499,350 7.0 -1.3 11.0 -6.4 4.6 -0.2 Production quantity . . . . . . . . . . 1,894,303 1,881,249 2,411,368 2,178,496 2,345,975 2,278,792 20.3 -0.7 28.2 -9.7 7.7 -2.9 Capacity utilization (1) . . . . . . . . 81.1 81.6 94.2 91.0 93.7 91.2 10.1 0.5 12.6 -3.2 2.7 -2.5 U.S. shipments within the region: Quantity . . . . . . . . . . . . . . . . . . 145,438 150,445 218,253 168,422 236,191 188,951 29.9 3.4 45.1 -22.8 40.2 -20.0 Value . . . . . . . . . . . . . . . . . . . . 42,810 43,034 68,723 77,524 113,829 98,886 131.0 0.5 59.7 12.8 46.8 -13.1 Unit value . . . . . . . . . . . . . . . . . $294 $286 $315 $460 $482 $523 77.8 -2.8 10.1 46.2 4.7 8.6 U.S. shipments outside the region: Quantity . . . . . . . . . . . . . . . . . . 1,556,471 1,596,108 2,074,808 1,765,613 1,936,277 1,856,967 19.3 2.5 30.0 -14.9 9.7 -4.1 Value . . . . . . . . . . . . . . . . . . . . 429,857 419,103 596,987 800,298 957,777 1,003,945 133.6 -2.5 42.4 34.1 19.7 4.8 Unit value . . . . . . . . . . . . . . . . . $276 $263 $288 $453 $495 $541 95.8 -4.9 9.6 57.5 9.1 9.3 Export shipments: Quantity . . . . . . . . . . . . . . . . . . *** *** *** *** *** *** *** *** *** *** *** *** Value . . . . . . . . . . . . . . . . . . . . *** *** *** *** *** *** *** *** *** *** *** *** Unit value . . . . . . . . . . . . . . . . . *** *** *** *** *** *** *** *** *** *** *** *** Ending inventory quantity . . . . . . 234,306 188,932 115,879 192,847 167,002 182,740 -22.0 -19.4 -38.7 66.4 -13.4 9.4 Inventories/total shipments (1) . . *** *** *** *** *** *** *** *** *** *** *** *** Production workers . . . . . . . . . . 1,332 1,218 1,307 1,237 1,316 1,327 -0.4 -8.6 7.3 -5.4 6.4 0.8 Hours worked (1,000s) . . . . . . . . 2,821 2,534 3,033 2,517 2,779 2,598 -7.9 -10.2 19.7 -17.0 10.4 -6.5 Wages paid ($1,000s) . . . . . . . . 77,031 75,707 87,200 83,170 99,795 99,434 29.1 -1.7 15.2 -4.6 20.0 -0.4 Hourly wages . . . . . . . . . . . . . . . $27.31 $29.88 $28.75 $33.04 $35.91 $38.27 40.2 9.4 -3.8 14.9 8.7 6.6 Productivity (tons/1,000 hours) . 671.5 742.4 795.0 865.5 844.2 877.1 30.6 10.6 7.1 8.9 -2.5 3.9 Unit labor costs . . . . . . . . . . . . . $40.66 $40.24 $36.16 $38.18 $42.54 $43.63 7.3 -1.0 -10.1 5.6 11.4 2.6 Net sales: Quantity . . . . . . . . . . . . . . . . . . 1,876,011 1,926,622 2,484,423 2,101,527 2,371,821 2,263,053 20.6 2.7 29.0 -15.4 12.9 -4.6 Value . . . . . . . . . . . . . . . . . . . . 520,894 510,035 723,306 954,690 1,165,485 1,217,323 133.7 -2.1 41.8 32.0 22.1 4.4 Unit value . . . . . . . . . . . . . . . . . $278 $265 $291 $454 $491 $538 93.7 -4.7 10.0 56.0 8.2 9.5 Cost of goods sold (COGS) . . . . 445,504 463,310 647,786 730,053 891,990 889,555 99.7 4.0 39.8 12.7 22.2 -0.3 Gross profit or (loss) . . . . . . . . . 75,390 46,725 75,520 224,637 273,495 327,768 334.8 -38.0 61.6 197.5 21.7 19.8 SG&A expenses . . . . . . . . . . . . . 18,638 17,680 20,203 23,198 32,364 28,719 54.1 -5.1 14.3 14.8 39.5 -11.3 Operating income or (loss) . . . . . 56,752 29,045 55,317 201,439 241,131 299,049 426.9 -48.8 90.5 264.2 19.7 24.0 Capital expenditures . . . . . . . . . 20,231 6,097 8,287 15,785 19,307 31,352 55.0 -69.9 35.9 90.5 22.3 62.4 Unit COGS . . . . . . . . . . . . . . . . . $237 $240 $261 $347 $376 $393 65.5 1.3 8.4 33.2 8.3 4.5 Unit SG&A expenses . . . . . . . . . $10 $9 $8 $11 $14 $13 27.7 -7.6 -11.4 35.7 23.6 -7.0 Unit operating income or (loss) . $30 $15 $22 $96 $102 $132 336.8 -50.2 47.7 330.5 6.1 30.0 COGS/sales (1) . . . . . . . . . . . . . 85.5 90.8 89.6 76.5 76.5 73.1 -12.5 5.3 -1.3 -13.1 0.1 -3.5 Operating income or (loss)/ sales (1) . . . . . . . . . . . . . . . . . . 10.9 5.7 7.6 21.1 20.7 24.6 13.7 -5.2 2.0 13.5 -0.4 3.9
U.S. shipments outside the region by inside U.S. producers: Quantity . . . . . . . . . . . . . . . . . . 328,409 340,383 384,011 370,460 341,984 376,581 14.7 3.6 12.8 -3.5 -7.7 10.1 Value . . . . . . . . . . . . . . . . . . . . 90,046 89,352 108,524 163,724 164,493 203,004 125.4 -0.8 21.5 50.9 0.5 23.4 Unit value . . . . . . . . . . . . . . . . . $274 $263 $283 $442 $481 $539 96.6 -4.3 7.7 56.4 8.8 12.1
(1) "Reported data" are in percent and "period changes" are in percentage points. (2) Not applicable.
Note1.--Financial data are reported on a fiscal year basis and may not necessarily be comparable to data reported on a calendar year basis. Because of rounding, figures may not add to the totals shown.Unit values and shares are calculated from the unrounded figures. No imports from Indonesia, Moldova, or Ukraine were reported during the period.
Note2.--Outside the specified region includes 20 states (Alaska, Arizona, California, Colorado, Hawaii, Idaho, Iowa, Kansas, Minnesota, Montana, Nebraska, Nevada, New Mexico, North Dakota, Oklahoma,Oregon, South Dakota, Utah, Washington, and Wyoming), plus the U.S. Virgin Islands.
Source: Compiled from data submitted in response to Commission questionnaires and from official Commerce statistics.
C-8

D-1
APPENDIX D
RESPONSES OF U.S. PRODUCERS, U.S. IMPORTERS, U.S. PURCHASERS, AND FOREIGN PRODUCERS
CONCERNING THE SIGNIFICANCE OF THE ANTIDUMPING DUTY ORDERS AND
THE LIKELY EFFECTS OF REVOCATION


D-3
U.S. PRODUCERS’ COMMENTS REGARDING THE SIGNIFICANCE OF THEANTIDUMPING DUTY ORDERS AND THE LIKELY EFFECTS OF REVOCATION
The Commission requested U.S. producers to describe any anticipated changes to the character oftheir operations or organization inside the region relating to the production of rebar in the future ifthe antidumping duty orders covering imports of rebar from Belarus, China, Indonesia, Korea,Latvia, Moldova, Poland, and Ukraine were revoked. (Question II-8a.) The following arequotations from the responses of producers.
Chaparral
***.
CMC
***.
Gerdau
***.
Nucor
***.
SDI
***.
The Commission requested U.S. producers to describe any anticipated changes to the character oftheir operations or organization outside the region relating to the production of rebar in the futureif the antidumping duty orders covering imports of rebar from Belarus, China, Indonesia, Korea,Latvia, Moldova, Poland, and Ukraine were revoked. (Question II-8b.) The following arequotations from the responses of producers.
Cascade
***.
CMC
***.
Gerdau
***.

D-4
TAMCO
***.
The Commission requested U.S. producers to describe the significance of the existing antidumpingorder covering imports of rebar from Belarus, China, Indonesia, Korea, Latvia, Moldova, Poland,and Ukraine in terms of their effect on their firms’ production capacity, production, U.S.shipments, inventories, purchases, employment, revenues, costs, profits, cash flow, capitalexpenditures, research and development expenditures, and asset values inside the region. (QuestionII-9a.) The following are quotations from the responses of producers.
Chaparral
***.
CMC
***.
Gerdau
***.
Nucor
***.
SDI
***.
The Commission requested U.S. producers to describe the significance of the existing antidumpingorder covering imports of rebar from Belarus, China, Indonesia, Korea, Latvia, Moldova, Poland,and Ukraine in terms of their effect on their firms’ production capacity, production, U.S.shipments, inventories, purchases, employment, revenues, costs, profits, cash flow, capitalexpenditures, research and development expenditures, and asset values outside the region. (Question II-9b.) The following are quotations from the responses of producers.
Cascade
***.
Gerdau
***.
TAMCO
***.

D-5
The Commission requested U.S. producers to describe any anticipated changes in their productioncapacity, production, U.S. shipments, inventories, purchases, employment, revenues, costs, profits,cash flow, capital expenditures, research and development expenditures, and asset values relatingto the production of rebar inside the region in the future if the existing antidumping duty order wasrevoked. (Question II-10a.) The following are quotations from the responses of producers.
Chaparral
***.
CMC
***.
Gerdau
***.
Nucor
***.
SDI
***.
The Commission requested U.S. producers to describe any anticipated changes in their productioncapacity, production, U.S. shipments, inventories, purchases, employment, revenues, costs, profits,cash flow, capital expenditures, research and development expenditures, and asset values relatingto the production of rebar outside the region in the future if the existing antidumping duty orderwas revoked. (Question II-10b.) The following are quotations from the responses of producers.
Cascade
***.
CMC
***.
Gerdau
***.
TAMCO
***.

D-6
U.S. IMPORTERS’ COMMENTS REGARDING THE SIGNIFICANCE OF THE ANTIDUMPING DUTY ORDERS AND THE LIKELY
EFFECTS OF REVOCATION
The Commission requested importers to describe any anticipated changes to the character of theiroperations or organization relating to the importation of rebar in the future if the antidumpingduty orders covering imports of rebar from Belarus, China, Indonesia, Korea, Latvia, Moldova,Poland, and Ukraine were revoked. (Question II-4.) The following are quotations from theresponses of importers inside the region.
Arcelor
***.
CCC Steel
***.
CMC
***.
Duferco
***.
Ferromontan
***.
Global Market
***.
Man Ferrostaal
***.
Mitsui
***.
Rio Grande
***.
SEBA
***.

D-7
S & P
***.
Stemcor
***.
TATA
***.
Thyssen Krupp
***.
Voest-Alpine
***.
The Commission requested importers to describe any anticipated changes to the character of theiroperations or organization relating to the importation of rebar in the future if the antidumpingduty orders covering imports of rebar from Belarus, China, Indonesia, Korea, Latvia, Moldova,Poland, and Ukraine were revoked. (Question II-4.) The following are quotations from theresponses of importers outside the region.
Cargill
***.
Century
***.
Dongkuk
***.
Metalsamerica
***.
The Commission requested importers to describe the significance of the existing antidumping dutyorders covering imports of rebar from Belarus, China, Indonesia, Korea, Latvia, Moldova, Poland,and Ukraine in terms of their effect on their imports, U.S. shipments of imports, and inventories. (Question II-12.) The following are quotations from the responses of importers inside the region.
Arcelor
***.

D-8
CCC Steel
***.
CMC
***.
Duferco
***.
Ferromontan
***.
Global Market
***.
Man Ferrostaal Co.
***.
Mitsui
***.
Rio Grande
***.
SEBA
***.
S & P
***.
Stemcor
***.
TATA
***.
Thyssen Krupp
***.

D-9
Voest-Alpine
***.
The Commission requested importers to describe the significance of the existing antidumping dutyorders covering imports of rebar from Belarus, China, Indonesia, Korea, Latvia, Moldova, Poland,and Ukraine in terms of their effect on their imports, U.S. shipments of imports, and inventories. (Question II-12.) The following are quotations from the responses of importers outside the region.
Cargill
***.
Century
***.
Dongkuk
***.
Metalsamerica
***.
The Commission requested importers to describe any anticipated changes in their imports, U.S.shipments of imports, or inventories of rebar in the future if the existing antidumping duty orderswere revoked. (Question II-13.) The following are quotations from the responses of importersinside the region.
Arcelor
***.
CCC Steel
***.
CMC
***.
Duferco
***.
Ferromontan
***.
Global Market
***.
D-10
Man Ferrostaal
***.
Mitsui
***.
Rio Grande
***.
SEBA
***.
S & P
***.
Stemcor
***.
TATA
***.
Thyssen Krupp
***.
Voest-Alpine
***.
The Commission requested importers to describe any anticipated changes in their imports, U.S.shipments of imports, or inventories of rebar in the future if the existing antidumping duty orderswere revoked. (Question II-13.) The following are quotations from the responses of importersoutside the region.
Cargill
***.
Century
***.
Dongkuk
***.

D-11
Metalsamerica
***.
U.S. PURCHASERS’ COMMENTS REGARDING THE SIGNIFICANCE OF THEANTIDUMPING DUTY ORDERS AND THE LIKELY EFFECTS OF REVOCATION
The Commission asked U.S. purchasers to comment on the likely effects of any revocation of theantidumping orders covering rebar from Belarus, China, Korea, Latvia, Indonesia, Moldova, Poland, andUkraine in terms of (1) the purchaser’s future activities, (2) the U.S. market as a whole. Their responsesare as follows.
* * * * * * *
FOREIGN PRODUCERS’ COMMENTS REGARDING THE SIGNIFICANCE OF THEANTIDUMPING DUTY ORDERS AND THE LIKELY EFFECTS OF REVOCATION
The Commission requested foreign producers to describe any anticipated changes to the characterof their operations or organization relating to the production of rebar in the future if theantidumping order covering imports of rebar from Belarus, China, Indonesia, Korea, Latvia,Moldova, Poland, and Ukraine was revoked. (Question II-3.) The following summarizes theanswers of firms.
BMZ
***.
Hyundai
***.
LM
***.
MSKR
***.
MSW
***.

D-12
The Commission requested foreign producers to identify export markets other than the UnitedStates that have been developed as a result of the antidumping duty order from Belarus, China,Indonesia, Korea, Latvia, Moldova, Poland, and Ukraine. (Question II-13.) The following arequotations from the responses of foreign producers.
BMZ
***.
Hyundai
***.
LM
***.
MSKR
***.
MSW
***.
The Commission requested foreign producers to describe the significance of the existingantidumping duty order covering imports of rebar from Belarus, China, Indonesia, Korea, Latvia,Moldova, Poland, and Ukraine in terms of their effect on their firms’ production capacity,production, home market shipments, exports to the United States and other markets, andinventories. (Question II-14.) The following are quotations from the responses of foreignproducers.
BMZ
***.
Hyundai
***.
LM
***.
MSKR
***.
MSW
***.

D-13
The Commission requested foreign producers to describe any anticipated changes in theirproduction capacity, production, home market shipments, exports to the United States and othermarkets, or inventories relating to the production of rebar in the future if the existing antidumpingduty order was revoked. (Question II-15.) The following are quotations from the responses offoreign producers.
BMZ
***.
Hyundai
***.
LM
***.
MSKR
***.
MSW
***.


E-1
APPENDIX E
COMPANY-SPECIFIC TRADE DATA


E-3
Table E-1Rebar: U.S. producers’ capacity, production, and capacity utlization, by mills and by region, 2001-06
* * * * * * *
Table E-2Rebar: U.S. producers’ total U.S. shipments, by mills and by region, 2001-06
* * * * * * *
Table E-3Rebar: U.S. producers’ U.S. shipments within the region, by mills and by region, 2001-06
* * * * * * *
Table E-4Rebar: U.S. producers’ U.S. shipments outside the region, by mills and by region, 2001-06
* * * * * * *
Table E-5Rebar: U.S. producers’ end-of-period inventories, by mills and by region, 2001-06
* * * * * * *
Table E-6Rebar: U.S. producers’ employment-related indicators, by mills and by region, 2001-06
* * * * * * *

F-1
APPENDIX F
RANKING BY OPERATING INCOME MARGINS OF U.S. PRODUCERS OFREBAR WITHIN AND OUTSIDE THE SPECIFIED REGION


F-3
Table F-1Rebar: Ranking of U.S. producers within the specified region by operating income margin, bymills, calendar and fiscal years 2001-06
* * * * * * *
Table F-2Rebar: Ranking of U.S. producers outside the specified region by operating income margin, bymills, calendar and fiscal years 2001-06
* * * * * * *


G-1
APPENDIX G
DATA CONCERNING IMPORTS REPORTED BY U.S. IMPORTERS


G-3
Table G-1Rebar: U.S. imports reported by U.S. importers, by sources and destinations, 2001-06
Item 2001 2002 2003 2004 2005 2006
Quantity (short tons)
Imports from China to destinations--
Inside the region *** *** *** *** *** ***
Outside the region *** *** *** *** *** ***
Total *** *** *** *** *** ***
Imports from Korea to destinations--
Inside the region *** *** *** *** *** ***
Outside the region *** *** *** *** *** ***
Total *** *** *** *** *** ***
Imports from Latvia to destinations--
Inside the region *** *** *** *** *** ***
Outside the region *** *** *** *** *** ***
Total *** *** *** *** *** ***
Imports from Poland to destinations--
Inside the region *** *** *** *** *** ***
Outside the region *** *** *** *** *** ***
Total *** *** *** *** *** ***
Imports from subject sources to destinations--
Inside the region *** *** *** *** *** ***
Outside the region *** *** *** *** *** ***
Total *** *** *** *** *** ***
Imports from all other sources to destinations--
Inside the region 957,258 858,975 677,333 1,322,362 774,208 1,390,285
Outside the region 113,282 56,039 39,127 218,910 195,812 362,051
Total 1,070,539 915,013 716,460 1,541,272 970,020 1,752,336
Total imports to destinations--
Inside the region *** *** *** *** *** ***
Outside the region *** *** *** *** *** ***
Total *** *** *** *** *** ***Table continued on the following page.

G-4
Table G-1--ContinuedRebar: U.S. imports reported by U.S. importers, by sources and destinations,1 2001-06
Item 2001 2002 2003 2004 2005 2006
Value ($1,000)1
Imports from China to destinations--
Inside the region *** *** *** *** *** ***
Outside the region *** *** *** *** *** ***
Total *** *** *** *** *** ***
Imports from Korea to destinations--
Inside the region *** *** *** *** *** ***
Outside the region *** *** *** *** *** ***
Total *** *** *** *** *** ***
Imports from Latvia to destinations--
Inside the region *** *** *** *** *** ***
Outside the region *** *** *** *** *** ***
Total *** *** *** *** *** ***
Imports from Poland todestinations--
Inside the region *** *** *** *** *** ***
Outside the region *** *** *** *** *** ***
Total *** *** *** *** *** ***
Imports from subject sources to destinations--
Inside the region *** *** *** *** *** ***
Outside the region *** *** *** *** *** ***
Total *** *** *** *** *** ***
Imports from all other sources to destinations--
Inside the region 234,930 215,235 210,885 626,768 359,431 660,540
Outside the region 27,245 12,724 11,611 107,365 84,888 164,069
Total 262,176 227,959 222,496 734,133 444,319 824,609
Total imports to destinations--
Inside the region *** *** *** *** *** ***
Outside the region *** *** *** *** *** ***
Total *** *** *** *** *** ***Table continued on the following page.

G-5
Table G-1--ContinuedRebar: U.S. imports reported by U.S. importers, by sources and destinations, 2001-06
Item 2001 2002 2003 2004 2005 2006
Unit value (per short ton)
Imports from China to destinations--
Inside the region *** *** *** *** *** ***
Outside the region *** *** *** *** *** ***
Total *** *** *** *** *** ***
Imports from Korea to destinations--
Inside the region *** *** *** *** *** ***
Outside the region *** *** *** *** *** ***
Total *** *** *** *** *** ***
Imports from Latvia to destinations--
Inside the region *** *** *** *** *** ***
Outside the region *** *** *** *** *** ***
Total *** *** *** *** *** ***
Imports from Poland to destinations--
Inside the region *** *** *** *** *** ***
Outside the region *** *** *** *** *** ***
Total *** *** *** *** *** ***
Imports from subject sources to destinations--
Inside the region *** *** *** *** *** ***
Outside the region *** *** *** *** *** ***
Total *** *** *** *** *** ***
Imports from all other sources to destinations--
Inside the region $245 $251 $311 $474 $464 $475
Outside the region 241 227 297 490 434 453
Average 245 249 311 476 458 471
Total imports to destinations--
Inside the region *** *** *** *** *** ***
Outside the region *** *** *** *** *** ***
Average *** *** *** *** *** ***
1 Landed, duty-paid.
Note.--Because of rounding, figures may not add to totals shown.
Source: Compiled from responses to Commission questionnaires.

G-6
Table G-2Rebar: U.S. shipments of imports reported by U.S. importers, by sources and destinations, 2001-06
Item 2001 2002 2003 2004 2005 2006
Quantity (short tons)
U.S. shipments of imports from China to destinations--
Inside the region *** *** *** *** *** ***
Outside the region *** *** *** *** *** ***
Total *** *** *** *** *** ***
U.S. shipments of imports from Korea to destinations--
Inside the region *** *** *** *** *** ***
Outside the region *** *** *** *** *** ***
Total *** *** *** *** *** ***
U.S. shipments of imports from Latvia to destinations--
Inside the region *** *** *** *** *** ***
Outside the region *** *** *** *** *** ***
Total *** *** *** *** *** ***
U.S. shipments of imports from Poland to destinations--
Inside the region *** *** *** *** *** ***
Outside the region *** *** *** *** *** ***
Total *** *** *** *** *** ***
U.S. shipments of imports from subject sources to destinations--
Inside the region *** *** *** *** *** ***
Outside the region *** *** *** *** *** ***
Total *** *** *** *** *** ***
U.S. shipments of imports from all other sources to destinations--
Inside the region 944,197 842,616 654,341 1,239,524 781,469 1,354,720
Outside the region 116,605 55,976 39,250 215,311 210,227 360,218
Total 1,060,801 898,591 693,591 1,454,835 991,696 1,714,938
Total U.S. shipments of imports to destinations--
Inside the region *** *** *** *** *** ***
Outside the region *** *** *** *** *** ***
Total *** *** *** *** *** ***Table continued on the following page.

G-7
Table G-2--ContinuedRebar: U.S. shipments of imports reported by U.S. importers, by sources and destinations, 2001-06
Item 2001 2002 2003 2004 2005 2006
Value ($1,000)1
U.S. shipments of imports from China to destinations--
Inside the region *** *** *** *** *** ***
Outside the region *** *** *** *** *** ***
Total *** *** *** *** *** ***
U.S. shipments of imports from Korea to destinations--
Inside the region *** *** *** *** *** ***
Outside the region *** *** *** *** *** ***
Total *** *** *** *** *** ***
U.S. shipments of imports from Latvia to destinations--
Inside the region *** *** *** *** *** ***
Outside the region *** *** *** *** *** ***
Total *** *** *** *** *** ***
U.S. shipments of imports from Poland to destinations--
Inside the region *** *** *** *** *** ***
Outside the region *** *** *** *** *** ***
Total *** *** *** *** *** ***
U.S. shipments of imports from subject sources to destinations--
Inside the region *** *** *** *** *** ***
Outside the region *** *** *** *** *** ***
Total *** *** *** *** *** ***
U.S. shipments of imports from all other sources to destinations--
Inside the region 245,796 226,155 210,192 607,819 376,906 665,124
Outside the region 29,562 13,988 13,959 108,510 96,415 169,888
Total 275,359 240,143 224,151 716,329 473,321 835,012
Total U.S. shipments of imports to destinations--
Inside the region *** *** *** *** *** ***
Outside the region *** *** *** *** *** ***
Total *** *** *** *** *** ***Table continued on the following page.

G-8
Table G-2--ContinuedRebar: U.S. shipments of imports reported by U.S. importers, by sources and destinations, 2001-06
Item 2001 2002 2003 2004 2005 2006
Unit value (per short ton)
U.S. shipments of imports from China to destinations--
Inside the region *** *** *** *** *** ***
Outside the region *** *** *** *** *** ***
Total *** *** *** *** *** ***
U.S. shipments of imports from Korea to destinations--
Inside the region *** *** *** *** *** ***
Outside the region *** *** *** *** *** ***
Total *** *** *** *** *** ***
U.S. shipments of imports from Latvia to destinations--
Inside the region *** *** *** *** *** ***
Outside the region *** *** *** *** *** ***
Total *** *** *** *** *** ***
U.S. shipments of imports from Poland to destinations--
Inside the region *** *** *** *** *** ***
Outside the region *** *** *** *** *** ***
Total *** *** *** *** *** ***
Imports from subject sources to destinations--
Inside the region *** *** *** *** *** ***
Outside the region *** *** *** *** *** ***
Total *** *** *** *** *** ***
U.S. shipments of imports from all other sources to destinations--
Inside the region $260 $268 $321 $490 $482 $491
Outside the region 254 250 356 504 459 472
Average 260 267 323 492 477 487
Total U.S. shipments of imports to destinations--
Inside the region *** *** *** *** *** ***
Outside the region *** *** *** *** *** ***
Average *** *** *** *** *** ***
1 Landed, duty-paid.
Source: Compiled from responses to Commission questionnaires.