steel long term final edited - karvy commodities
TRANSCRIPT

STEEL
DYNAMICS & OUTLOOK
COMMODITY DYNAMICS SUPPLY HIGH DEMAND HIGH INPUT COST HIGH OUTPUT PRICE STABLE
RESULT OPERATING MARGINS LOW
LIKELY OUTCOME PRICES HIGH
August 7, 2008

2
Table of Contents Steel ................................................................................................................................................................ 3
Classification of Steel .......................................................................................................................... 3
Methods of Production ................................................................................................................... 7
Steel Industry ‐ Global Scenario ......................................................................................................... 9
Indian Steel – Growth & Performance .......................................................................................... 12
Steel Industry Structure in India ................................................................................................. 15
Indian Sponge Iron Industry ..................................................................................................... 16
Indian Pig Iron Industry ......................................................................................................... 17
Induction Furnace Industry .............................................................................................. 18
Electric Arc Furnace Industry ...................................................................................... 18
Prospects of Indian Steel .................................................................................................................... 19
Demand‐Supply Dynamics ............................................................................................................. 20
Indian Economy Highlights ....................................................................................................... 22
Fundamental Outlook .......................................................................................................................... 23
Technical Outlook .................................................................................................................................. 27

3
Steel Steel is one such material that has played an important role in the development of mankind
in the last century. Today, it is difficult to imagine a world without steel. Steel has become
vital to our everyday life. It is at the root of the quality of life that each of us enjoys today,
helping to shelter us, to feed us and to facilitate both our working day and leisure activities.
We depend on steel for almost everything from our houses and buildings, the cars we drive,
roads, bridges, agricultural equipment, machines—the list is endless.
Steel is superior to others because of its versatility, its strength, and its recyclability. There
are few other materials that can be recycled over and over again without loss of properties.
Even steel created 150 years ago can be recycled today and used in new products and
applications. Steel has a very low production cost. If compared to its nearest competitor,
aluminium, steel requires only 25% of the energy for production. Steel is also been tagged
as an environment friendly metal due to its recyclable nature.
Steel is not a single product. There are currently more than 3,500 different grades of steel
with many different physical, chemical and environmental properties. Approximately, 75%
of modern steels have been developed in the last 20 years. If the Eiffel Tower was to be
rebuilt today, the engineers would only need one‐third of the amount of steel. Modern cars
are built with new steels that are stronger, but up to 25% lighter than in the past.
Today, consumption of steel is also regarded as an indicator of development of a nation. Per
capita steel consumption is now universally accepted as an index of economic development
of a nation. Given its role, steel has established itself as the backbone of any economy.
4
Classification of steel
Crude steel:
The term is internationally used to mean the first solid steel product upon solidification of
liquid steel. In other words, it includes ingots (in conventional mills) and semis (in modern
mills with continuous casting facility). According to International Iron & Steel Institute
(IISI), for statistical purpose, crude steel also includes liquid steel which goes into
production of steel castings.
Saleable steel:
The term is used to designate various types of solid steel products, which are sold to
outside customers for further processing or for direct use/consumption. Therefore, it
includes ingots and/or semis and/or finished steel products. (Liquid steel is normally not
traded).
As per form/shape/size:
a) Liquid steel:
Liquid steel is the immediate hot molten steel product from the steel melting shop (LD
converter/electric arc furnace/electric induction furnace/energy optimizing furnace). It is
further cast into ingots/semis. The by‐product from the steel melting shop is called SMS
slag.
b) Ingot steel (ingots):
Ingots are the primary solid product obtained upon solidification of liquid steel in
conventional, vertical, cast iron moulds, which are intended for rolling into
intermediate/semi‐finished products after re‐heating. Ingots are normally very large and
heavy weighing several tonnes (up to 15‐20 tonnes). Small ingots produced in mini‐steel
plants are called as pencil ingots.
c) Semifinished steel products (semis):
Intermediate solid steel products obtained by hot rolling/forging of ingots (in conventional
process) or by continuous casting of liquid steel are known as semis. These are so called

5
since they are intended for further rolling/forging to produce finished steel products.
Blooms, billets, and slabs are the kinds of semis existing in the industry.
As per finished steel:
Finished steel can be defined as products obtained upon hot rolling/forging of semi‐
finished steel. These cover two broad categories of products, namely, Long products and
Flat products:
a) Long products:
Longs are finished steel products produced normally by hot rolling/forging of
bloom/billets/pencil ingots into useable shape/sizes. These are normally supplied in
straight length/cut length except wire rods, which are supplied in irregularly wound coils.
The long products category mainly consists of bars and rods which form around 40% of the
structure of the steel long section. These are further divided into wire rods, reinforcing
rods, thermo mechanically treated (TMT) steel rebars, cold heading quality wire rods, and
tyre cord wire rods. Other sections of steel long consist of structural and railway materials.
b) Flat products (flat rolled products):
Finished steel thin flat products are produced from slabs/thin slabs in rolling mills using
flat rolls. These are supplied in hot rolled (HR), cold rolled (CR) or in coated condition,
depending on the requirement. Plates, sheets and strips are different types of flat products.
While plates are used for applications such as shipbuilding, etc., HR steel is the most widely
used variety of steel, and other downstream flat products such as CR steel and galvanized
steel are made from it.
HR steel has a variety of applications in the manufacturing sector. It is primarily used for
making pipes and has many direct industrial and manufacturing applications, including
construction of tanks, railway cars, bicycle frames, ships, engineering and military
equipment, automobile and truck wheels, and frames and body parts. Cold rolled steel is
used primarily for precision tubes, containers, bicycles, furniture and for use by the
automobile industry to produce car body panels. Galvanized steel is used for making roofs
in the housing and construction sector.

6
A specific variety of cold rolled sheets / strips with specific chemical composition comes
under the coated products category. Varieties of coated products are available around the
industry like galvanized sheets (coated with zinc metal), tin plate (coated with tin metal),
tin free steel (coated with chromium metal and oxide), etc. Among all the coated products,
galvanized sheets are most popular and are used mainly in roofing, panelling, automobile
bodies, trunks/boxes and others.
Steel as per composition:
a) Alloy steel:
Steel that is produced with intended amount of one or more alloying elements in specified
proportions to impart specific physical, mechanical, metallurgical and electrical properties.
Common alloying elements are manganese, silicon, nickel, lead, copper, chromium,
tungsten, molybdenum, niobium, vanadium, etc.
Some of the common examples of alloy steels include stainless steel, silicon‐electrical steel
and high‐speed steel.
b) Nonalloy / carbon steel/ plain carbon / unalloyed steel:
These steels, by definition, do not contain any alloying element in specified proportions
(i.e., beyond those normally present in commercially produced steel in industry). Non‐
alloy steel is divided into three categories, namely:
Low carbon steel or mild steel (normally containing up to 0.3% carbon)
Medium carbon steel (normally containing 0.3 – 0.6% carbon)
High carbon steel (normally containing more than 0.6% carbon)
Non‐alloy steel constitutes approx. 90% of total steel production, of which mild steel takes
the lion’s share.
c) Special steel:
Steel which requires special care so as to attain the special/desired properties, such as
cleanliness, surface qualities and mechanical/metallurgical properties falls under the
7
special steel category. In layman’s language, all steel other than mild steel fall under the
category of special steel. However, metallurgically speaking, even mild steel/low carbon
steel, i.e., containing less than 0.25%/0.30% carbon may still fall under the category of
special steel if any special property is specified in the steel. Examples are DD / EDD steel,
Forging Quality steel, Free Cutting steel etc.
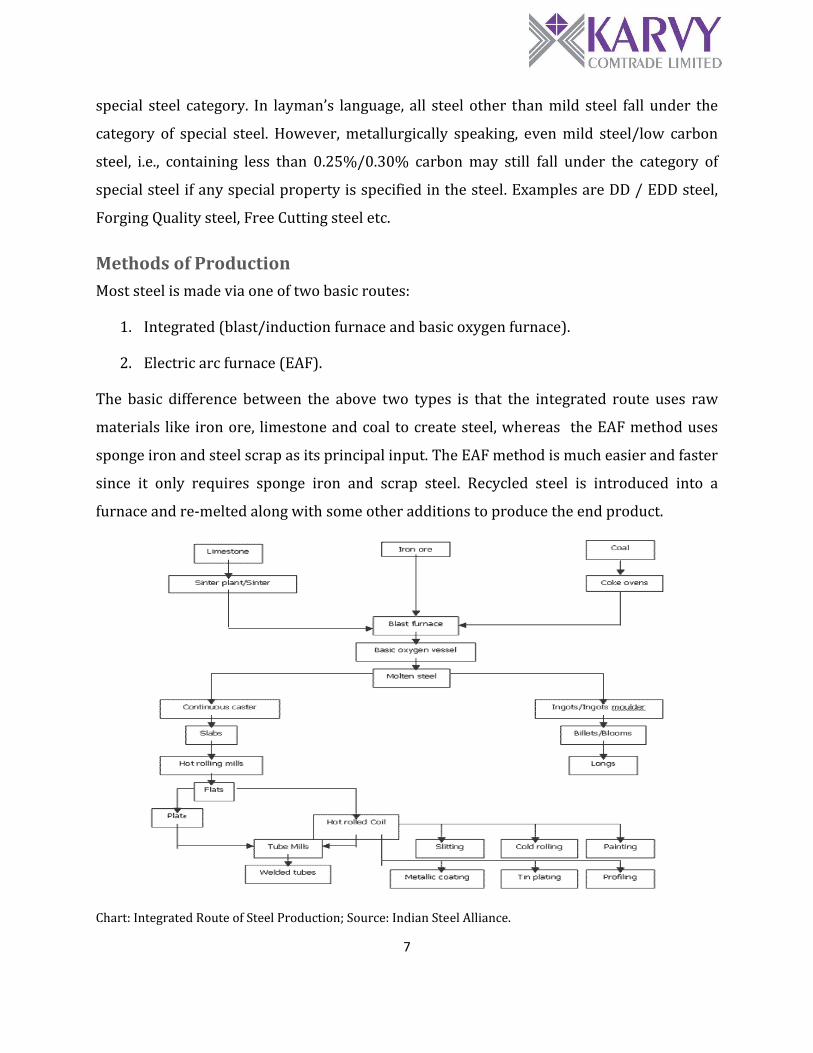
Methods of Production Most steel is made via one of two basic routes:
1. Integrated (blast/induction furnace and basic oxygen furnace).
2. Electric arc furnace (EAF).
The basic difference between the above two types is that the integrated route uses raw
materials like iron ore, limestone and coal to create steel, whereas the EAF method uses
sponge iron and steel scrap as its principal input. The EAF method is much easier and faster
since it only requires sponge iron and scrap steel. Recycled steel is introduced into a
furnace and re‐melted along with some other additions to produce the end product.
Chart: Integrated Route of Steel Production; Source: Indian Steel Alliance.

8
Chart: EAF Route of Steel Production; Source: Indian Steel Alliance.
9
Steel industry: Global scenario The world steel industry is currently going through an extraordinary phase of growth and
all‐round prosperity, fuelled primarily by the frenetic pace of growth in consumption and
production of steel in China. World crude steel production grew from 848 million tonnes in
2001 to approximately 1,344 million tonnes in 2007, recording a compounded annual
growth (CAGR) of 7.31% compared to a mere 2% CAGR recorded between 1995 and 2001.
It has been observed that the steel Industry has grown tremendously in the last one and a
half decade with a strong financial condition. The increasing demand for steel from
developing countries for its infrastructural projects has pushed the companies in this
industry near their operative capacity. The most significant growth in the steel industry
has been observed during the period 1960‐1974 when steel consumption globally doubled.
Between these years, the global steel industry grew at 5.5% per annum. This roaring
market saw a phase of deceleration from the year 1975 which continued until 1982. Post
this period, the continuous fall slowed down and the industry started its upward
movement again from the early 1990s.
The global steel industry is becoming increasingly competitive with every passing day.
From 1960s to late‐1980s, the steel market was dominated by OECD (Organization for
Economic Cooperation and Development) countries, but with the fast emergence of
developing countries like China, India and South Korea in this sector, the OECD countries’
market share has slipped. The main demand creators for the steel industry are
automobiles, construction, infrastructure, oil & gas and container sectors.
From 2001 to 2007, the world steel production and consumption has been growing at a
CAGR of 7.30% and 7.20%, respectively. In 2007, world crude steel output reached 1,344
million metric tonnes (mmt). This is an increase of 7.5% over 2006. The total represents
the highest level of crude steel output in history and it is the fifth consecutive year that
world crude steel production grew by more than 7%.

10
On the other hand, world crude steel consumption for the year 2007 grew by 6.84% to
1,198 million tonnes. The gross surplus of crude steel (output usage) in 2007 accounted for
nearly 10% (146.4 million tonnes) of the total output.
848 850904
9701069
11421244
13441442
757 775815
895974
10261121
11981279
500600700800900100011001200130014001500
2000 2001 2002 2003 2004 2005 2006 2007 2008 (E)
In Million M
etric Tonnes
World Crude Steel Facts
Production Consumption Source: IISI
The major steel‐producing countries include China, Japan, United States, Russia and South
Korea. China remains the driving force behind the strong world production figures and
accounts for almost 36.4% of the total world crude steel output.
43%
19%
11%
9%
6%
5%4% 3%
Major Crude Steel Producers
China
EU
Japan
USA
Russia
India
South Korea
Source: IISI

11
Rank Company Name Production (mmt)1 Arcelor Mittal 116.42 Nippon Steel 35.73 JFE 344 POSCO 31.15 Baosteel 28.66 Tata Steel 26.57 Anshan‐Benxi 23.68 Jiangsu Shagang 22.99 Tangshan 22.810 US Steel 21.5
Top Crude Steel Producers in the World
Source: IISI
In 2007, ArcelorMittal was top ranked among the world’s major steel producers. India’s
Tata Steel emerged as the sixth‐largest steel company producer after it had acquired Corus.
Globally, steel prices have witnessed a sharp rise due to the increased demand and rising
raw material prices, especially for iron ore and coking coal. This, followed with higher
energy and freight charges, has resulted in sharp movement in steel prices. The long‐term
linear trend in steel prices is explained in the following chart.
0
100
200
300
400
500
600
8/12
/200
3
11/12/20
03
2/12
/200
4
5/12
/200
4
8/12
/200
4
11/12/20
04
2/12
/200
5
5/12
/200
5
8/12
/200
5
11/12/20
05
2/12
/200
6
5/12
/200
6
8/12
/200
6
11/12/20
06
2/12
/200
7
5/12
/200
7
8/12
/200
7
11/12/20
07
2/12
/200
8
5/12
/200
8Bloomberg World Iron & Steel Index
Source: Bloomberg
12
Indian steel: Growth and performance At the time of independence in 1947, India had only three steel plants: Tata Iron & Steel
Company, Indian Iron and Steel Company, and Visvesvaraya Iron & Steel, and a few electric
arc furnace based plants. The period until 1947 thus witnessed a small but viable steel
industry in the country, which operated with a capacity of about one million tonne, and was
completely in the private sector. From the fledgling one million tonne capacity status at the
time of independence, India has now risen to become the fifth‐largest crude steel producer
in the world and the largest producer of sponge iron. As per the official estimate, the iron
and steel industry contributes around 2% of the gross domestic product (GDP) and its
weight in the Index of Industrial Production (IIP) is 5.13%. From a negligible global
presence, the Indian steel industry is now acknowledged for its product quality, reflected
by trends of rising exports. Indian companies have also now made a mark in the global
mergers and acquisitions market.
As it traversed its long history during the past 60 years, the Indian steel industry has
responded to the challenges of the highs and lows of business cycles. The first major
change came during the first three Five Year Plans (1952‐1970), when in line with the
economic order of the day, the iron and steel industry was earmarked for state control.
From the mid‐50s to the early 1970s, the government thus set up large integrated steel
plants in the public sector at Bhilai, Durgapur, Rourkela and Bokaro. The policy regime
governing the industry during these years involved:
Licensing of capacity and reservation of large‐scale capacity creation for the
public sector units.
A dual pricing system, price and distribution control for the integrated large‐
scale producers in both private and public sectors, while the rest of the industry
operated in a free market.
Quantitative restrictions and high tariff barriers.
Railway freight equalization policy, to ensure balanced regional industrial
growth.
13
Controls on imports of inputs, including technology, capital goods, mobilization
of finances, and exports.
The large‐scale capacity creation in the public sector during these years contributed to
making India the 10th largest steel producer in the world as crude steel production grew
markedly to nearly 15 million tonnes in the span of a decade from a mere one million tonne
in 1947. But the trend could not be sustained from late‐1970 onwards, as the economic
slowdown adversely affected the pace of growth of the Indian steel industry. However, this
phase was reversed in 1991‐92, when the country replaced the control regime by
liberalization and deregulation in the context of globalization. The provisions of the New
Economic Policy initiated in the early‐1990s impacted the Indian steel industry in many
ways:
Large‐scale capacities were removed from the list of industries reserved for the
public sector.
Licensing requirement for additional capacities was also withdrawn subject to
locational restrictions.
Private sector came to play a prominent role in the overall set up.
Pricing and distribution control mechanisms were discontinued.
Iron and steel industry was included in the high priority list for foreign
investment, implying automatic approval for foreign equity participation up to
50%, subject to the foreign exchange and other stipulations governing such
investments in general. This limit has since been increased to 100%.
Freight equalization scheme was replaced by a system of freight ceiling.
Peak import tariff rates were reduced from more than 100% to about 30%
average, which is now reduced to nil.
Quantitative import restrictions were largely removed. Export restrictions were
withdrawn.

14
The system, therefore, underwent marked changes. For steel makers, opening up of the
economy opened up new channels of procuring their inputs at competitive rates from
overseas markets and also new markets for their products. It also led to greater access to
information on global operations/techniques in manufacturing. This, along with the
pressures of a competitive global market, increased the need to enhance efficiency levels so
as to become internationally competitive. The steel consumer, on the other hand, was now
able to choose items from an array of goods, be it indigenously manufactured or imported.
The National Steel Policy (NSP) was announced in November 2005 as a basic blueprint for
the growth of a self‐reliant and globally competitive steel sector. The Policy sought to
enhance the indigenous steel production to 110 million tonnes per annum by 2019‐20 from
the 2004‐05 level of 38 million tonnes, implying a compounded annual growth rate of
7.3%. The long‐term objective of the National Steel Policy is to ensure that India has a
modern and efficient steel industry of world standards, catering to diversified steel
demand. The focus of the policy is to attain levels of global competitiveness in terms of
global benchmarks of efficiency and productivity.
The National Policy seeks to facilitate the removal of procedural and policy bottlenecks that
affect the availability of production inputs, increased investment in research and
development, and the creation of road, railway and port infrastructure. The policy focuses
on the domestic sector, but also envisages a steel industry growing faster than domestic
consumption, which will enable export opportunities to be realized.
However, while the National Steel Policy indicated production and consumption targets for
2019‐20 at 110 million tonnes and 90 million tonnes, respectively, the Working Group on
Steel Industry set up by the Planning Commission for the 11th Five Year Plan (2007‐12)
has projected a total demand of 70.34 million tonnes for finished steel and a total
production of 80.23 million tonnes of crude steel by the end of the 11th Plan, i.e., 2011‐12.

15
Steel Industry Structure in India The Indian steel industry can be divided into two distinct producer groups:
1. Main/Major producers: Main producers group includes large steel producers with
high levels of backward integration and capacities. Steel Authority of India Limited
(SAIL), Tata Steel Ltd (TSL) and Rashtriya Ispat Nigam Limited (RINL) form this group.
These companies produce steel using the blast furnace/basic oxygen furnace (BF/BOF)
route that uses iron ore, coal/coke as the basic input mix for producing finished steel.
Other major producers such as Essar Steel, Ispat Industries, Jindal Vijaynagar Steel Ltd.
use routes other than BF/BOF for producing steel. Essar Steel and Ispat Industries
employ the electric arc furnace (EAF) route that uses sponge iron, melting scrap or a
mix of both as input. JVSL uses COREX, a revolutionary technology for making steel
using basically iron‐ore and coal.
2. Other producers: This group consists of smaller stand‐alone steel plants that include
producers and processors of steel.
Processors/Re‐rollers: Units producing small quantities of steel (flat/long products)
from materials procured from the market or through their own backward
integration system.
Stand‐alone units making pig iron and sponge iron.
Small producers using scrap‐sponge iron‐pig iron combination produce steel ingots
(for long products) using the electric arc furnace (EAF) or the induction arc furnace
(IAF) route.
The major producers are strategic in nature and account for most of the mild steel
production in the country. The group produces most of the flat steel products in the
country, including hot rolled, cold rolled and galvanised steel. The majors also produce a
small proportion of long products and other special steel being produced in the country.
Other producers account for a majority of long products being produced in the country,
and some of the value‐added flat steel products like cold rolled steel and galvanized steel.

16
Indian sponge iron industry Sponge iron/direct reduced iron/hot briquetted iron is the solid metallic iron product
obtained upon direct reduction of high‐grade iron ore in solid state itself without being
converted into liquid form like that in a blast furnace.
India is the world’s largest producer of sponge iron. The growth of sponge iron, especially
during the last 5‐6 years in terms of capacity and production has been substantial. The
installed capacity of sponge iron increased from 1.52 million tonnes per annum in 1990‐91
to 26.39 million tonnes in 2004‐05. Sponge iron production grew at a CAGR of 22% to
reach a level of 18.35 million tonnes in 2006‐07 compared to 7.86 million tonnes in 2002‐
03. At present, there are 324 sponge iron units installed in the country having a capacity of
26.39 million tonnes per annum. Out of these, there are 321 coal‐based units in operation
with a capacity of 18.40 million tonnes per annum. There are three gas‐based units
covering a capacity of 7.99 million tonnes per annum. The production of sponge iron units
during the last few years is shown as under:
9.8712.53
14.82
18.34
13.9
02468
101214161820
2003‐04 2004‐05 2005‐06 2006‐07 2007‐08 (Apr‐Dec)
In Million Tonnes
India ‐ Sponge Iron Production
5.9
7.89
10.28
13.08
9.88
3.97 4.64 4.54 5.264.02
0
2
4
6
8
10
12
14
2003‐04 2004‐05 2005‐06 2006‐07 2007‐08 (Apr‐Dec)
In Million Tonnes
Sources of Sponge Iron Production
Coal Based Gas Based
5000
10000
15000
20000
25000
30000
12/6/200
51/6/20
062/6/20
063/6/20
064/6/20
065/6/20
066/6/20
067/6/20
068/6/20
069/6/20
0610
/6/200
611
/6/200
612
/6/200
61/6/20
072/6/20
073/6/20
074/6/20
075/6/20
076/6/20
077/6/20
078/6/20
079/6/20
0710
/6/200
711
/6/200
712
/6/200
71/6/20
082/6/20
083/6/20
084/6/20
085/6/20
086/6/20
087/6/20
08
Rupe
es per to
nne
MCX Sponge Iron Prices
0
50
100
150
200
250
USD
/Metric ton
China Import Indian Iron Ore Price
Source: Steel Ministry & Bloomberg

17
Indian pig iron industry Pig iron is the product in solid (lumpy) form obtained upon solidification of hot metal
(liquid iron) in Pig Casting Machine. It is called “pig” or “pig iron” because of its typical
humpy shape. It is one of the basic raw materials required by the foundry and casting
industry for manufacture of various types of castings for the engineering sector. Usha
Martin Industries, Jindal Steel & Power and Ispat Industries have integrated the mini blast
furnace (MBF) and are using the hot metal in the charge‐mix directly for manufacture of
steel through the electric arc furnace. Hospet Steel, a joint venture of Kalyani and Mukand
and Southern Iron and Steel Company (now a part of JSW Steel) have integrated their MBF
with energy optimising furnace for manufacture of steel. The excess hot metal produced by
them supplements the pig iron production. Besides MBF, a COREX plant (alternative to
conventional MBF/ BF) along with downstream steel‐making through basic oxygen furnace
(BOF), which has been commissioned in Karnataka by JSW Steel, also supplements the
production of pig iron. The production of pig iron during the past few years is shown in the
chart below.
3.7643.228
4.6954.993
3.901
0
1
2
3
4
5
6
2003‐04 2004‐05 2005‐06 2006‐07 2007‐08 (Apr‐Dec)
In Million Tonnes
India ‐ Pig Iron Production
Source: Steel Ministry
18
Induction furnace industry India is the first country using “induction melting furnaces” for making mild steel. As a
matter of fact, EAFs are not making mild steel of structural quality for over a decade now.
The bulk of structural quality mild steel for long products is manufactured by induction
melting furnaces. There are several reasons for the popularity of induction melting
furnaces for making steel. They consume less power compared to EAFs; expenditure on
electrode is nil; they use lesser quantity of refractory; and initial investment is less on plant
and equipment. Thus, there are economic advantages in making steel through the induction
furnaces route. During 2006–07, it is estimated that 970 units with a capacity of 19.50
million tonnes were in operation. The total production of induction furnace units
registered a growth of 14% during 2006‐07, producing 15.39 million tonnes against a
production of 13.49 million tonnes in 2005–06, as reported to the Joint Plant Committee.
Electric arc furnace industry Currently, there are 36 electric arc furnace based steel plants operating in the country with
an aggregate capacity of 13.80 million tonnes per annum. Apart from the operating units,
there are around three units that are closed. Production of ingots/concast billets by EAF
units, which have been reporting their production to the Joint Plant Committee, during
2006‐07, was 9.88 million tonnes as compared to 8.43 million tonnes during 2005‐06,
registering a growth of 17%. This sector continues to face challenges of rising cost of
inputs, increasing power tariffs, shortage of power and resource crunch.

19
Prospects of Indian steel The Indian steel industry is on an upswing the world over. Indian steel‐making units, both
in the private and public sectors, remain upbeat about their improved volume of turnover,
capacity utilization, sales and profit margins. A number of MOUs have been signed by major
steel producers, both domestic and international, with the mineral rich states signifying
possibilities of marked increase in both Greenfield and Brownfield production capacities.
While private steel majors like Tata Steel have moved towards a globalised growth strategy
based on mergers and foreign acquisitions, the public sector majors like Steel Authority of
India Limited (SAIL) or Rashtriya lspat Nigam Limited (RINL) have eliminated huge
accumulated losses and become commercially buoyant.
In India, the steel sector is growing at a robust rate with significant increases in both
production and consumption. Crude steel production grew more than 10% annually from
34.71 million tonnes in 2002‐03 to 50.82 million tonnes in 2006‐07. This growth was
driven by both capacity expansion (from 40.41 million tonnes in 2002‐03 to 56.84 million
tonnes in 2006‐07) and improved capacity utilization (from 86% in 2002‐03 to 89% in
2006‐07).
34.71
38.73
43.44
46.46
50.82
39.61
0 10 20 30 40 50 60
2002‐03
2003‐04
2004‐05
2005‐06
2006‐07
2007‐08 (Apr‐Dec)
Units in million tonnes
Crude Steel Production
Source: Steel Ministry
India emerged as the 5th largest crude steel producing country in the world as against 8th
position in 2003. It is expected to become the second‐largest producer of steel in the world
by 2015. The present per capita consumption in the country is only around 35kg against
20
the world average of 150kg, and 400 kg in developed countries, and this reflects the growth
potential the steel industry has in India.
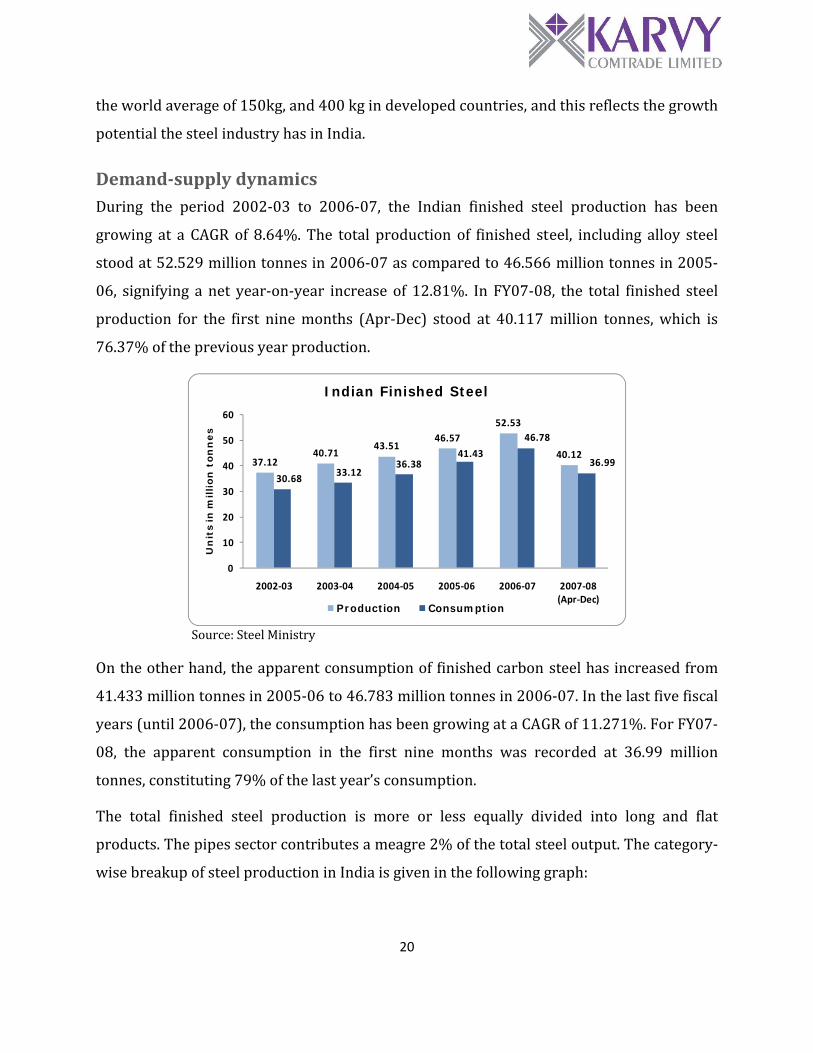
Demandsupply dynamics During the period 2002‐03 to 2006‐07, the Indian finished steel production has been
growing at a CAGR of 8.64%. The total production of finished steel, including alloy steel
stood at 52.529 million tonnes in 2006‐07 as compared to 46.566 million tonnes in 2005‐
06, signifying a net year‐on‐year increase of 12.81%. In FY07‐08, the total finished steel
production for the first nine months (Apr‐Dec) stood at 40.117 million tonnes, which is
76.37% of the previous year production.
37.1240.71
43.5146.57
52.53
40.12
30.6833.12
36.3841.43
46.78
36.99
0
10
20
30
40
50
60
2002‐03 2003‐04 2004‐05 2005‐06 2006‐07 2007‐08 (Apr‐Dec)
Un
its in
million
ton
nes
Indian Finished Steel
Production Consumption
Source: Steel Ministry
On the other hand, the apparent consumption of finished carbon steel has increased from
41.433 million tonnes in 2005‐06 to 46.783 million tonnes in 2006‐07. In the last five fiscal
years (until 2006‐07), the consumption has been growing at a CAGR of 11.271%. For FY07‐
08, the apparent consumption in the first nine months was recorded at 36.99 million
tonnes, constituting 79% of the last year’s consumption.
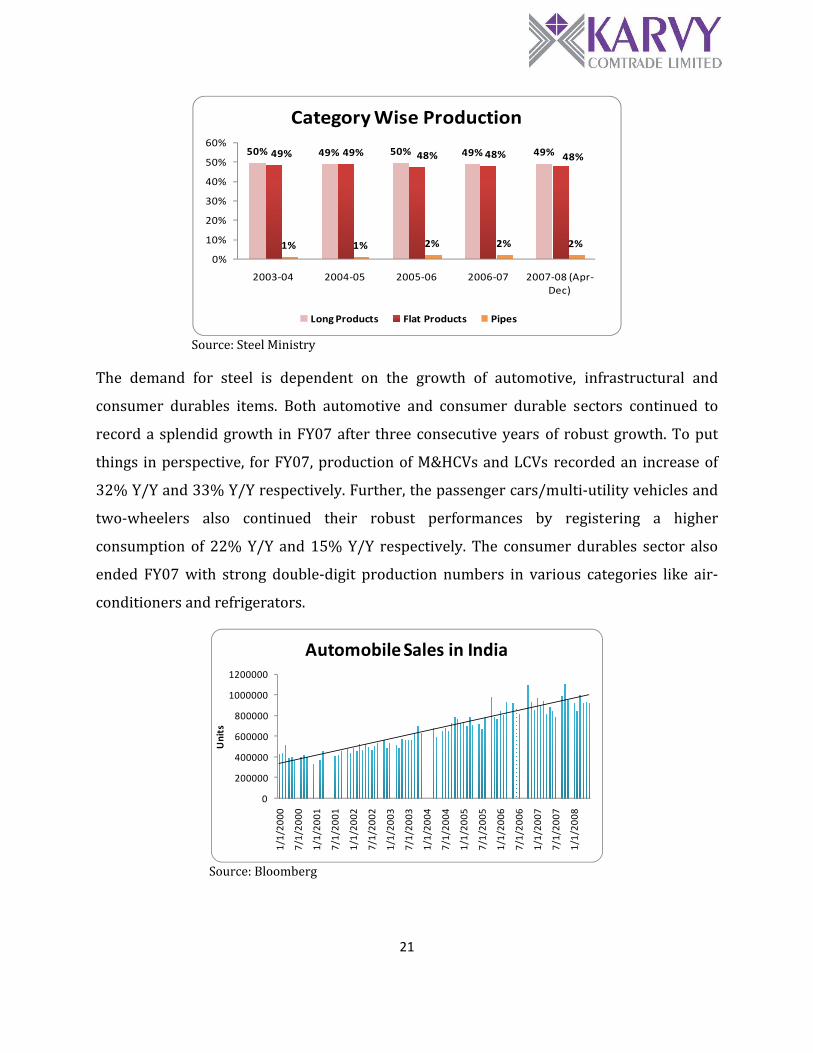
The total finished steel production is more or less equally divided into long and flat
products. The pipes sector contributes a meagre 2% of the total steel output. The category‐
wise breakup of steel production in India is given in the following graph:
21
50% 49% 50% 49% 49%49% 49% 48% 48% 48%
1% 1% 2% 2% 2%
0%
10%
20%
30%
40%
50%
60%
2003‐04 2004‐05 2005‐06 2006‐07 2007‐08 (Apr‐Dec)
Category Wise Production
Long Products Flat Products Pipes
Source: Steel Ministry
The demand for steel is dependent on the growth of automotive, infrastructural and
consumer durables items. Both automotive and consumer durable sectors continued to
record a splendid growth in FY07 after three consecutive years of robust growth. To put
things in perspective, for FY07, production of M&HCVs and LCVs recorded an increase of
32% Y/Y and 33% Y/Y respectively. Further, the passenger cars/multi‐utility vehicles and
two‐wheelers also continued their robust performances by registering a higher
consumption of 22% Y/Y and 15% Y/Y respectively. The consumer durables sector also
ended FY07 with strong double‐digit production numbers in various categories like air‐
conditioners and refrigerators.
0
200000
400000
600000
800000
1000000
1200000
1/1/20
00
7/1/20
00
1/1/20
01
7/1/20
01
1/1/20
02
7/1/20
02
1/1/20
03
7/1/20
03
1/1/20
04
7/1/20
04
1/1/20
05
7/1/20
05
1/1/20
06
7/1/20
06
1/1/20
07
7/1/20
07
1/1/20
08
Units
Automobile Sales in India
Source: Bloomberg

22
In FY07‐08, India has become a net importer of finished steel. In the first nine months (Apr‐
Dec) the imports and exports of finished steel were recorded at 5.32 tonnes and 3.85
million tonnes respectively. From 2002‐03 to 2006‐07, compounded annual growth rate in
steel imports stood at 35.94% and that of exports was at 2.19%.
1.663 1.753
2.293
4.305 4.927
5.3254.5175.207
4.705 4.801 5.242
3.85
0
1
2
3
4
5
6
2002‐03 2003‐04 2004‐05 2005‐06 2006‐07 2007‐08 (Apr‐Dec)
Un
its in
mil
lion t
on
nes
Import & Export - Finished Steel
Import Export
Source: Steel Ministry
Indian economy highlights
Gross domestic production continued to record a growth of 8.8% in the first quarter
of 2008.
Total automobile sales in H1 2008 stood at 5.5 million units compared to the last
year’s figure of 5.39 million units (a gain of 3.47%).
The core industry sector represented by the Finished Steel Production Index has
reported a growth of 5.20% in May (Y/Y). The index carries a weight of 5.13 in
India’s core infrastructure index.
At the same time, coal production index has shown an increase of 8.38% from the
previous year’s figures.
Index of Industrial Production (IIP) recorded a 3.84% growth in May 2008
compared to 10.59% growth in the same period last year.
Construction spending during the quarter ended March 2008 grew 12.6% against
the last year’s figure of 12.2%.

23
0
2
4
6
8
10
12
6/1/20
00
11/1/200
0
4/1/20
01
9/1/20
01
2/1/20
02
7/1/20
02
12/1/200
2
5/1/20
03
10/1/200
3
3/1/20
04
8/1/20
04
1/1/20
05
6/1/20
05
11/1/200
5
4/1/20
06
9/1/20
06
2/1/20
07
7/1/20
07
12/1/200
7
India's Real GDP Growth (%)
‐5
0
5
10
15
20
25
6/1/2000
11/1/2000
4/1/2001
9/1/2001
2/1/2002
7/1/2002
12/1/2002
5/1/2003
10/1/2003
3/1/2004
8/1/2004
1/1/2005
6/1/2005
11/1/2005
4/1/2006
9/1/2006
2/1/2007
7/1/2007
12/1/2007
Indian Construction Sector Growth
100
150
200
250
300
350
4/1/19
94
1/1/19
95
10/1/199
5
7/1/19
96
4/1/19
97
1/1/19
98
10/1/199
8
7/1/19
99
4/1/20
00
1/1/20
01
10/1/200
1
7/1/20
02
4/1/20
03
1/1/20
04
10/1/200
4
7/1/20
05
4/1/20
06
1/1/20
07
10/1/200
7
Industrial Production Index
0
1000
2000
3000
4000
5000
6000
4/1/19
99
10/1/199
9
4/1/20
00
10/1/200
0
4/1/20
01
10/1/200
1
4/1/20
02
10/1/200
2
4/1/20
03
10/1/200
3
4/1/20
04
10/1/200
4
4/1/20
05
10/1/200
5
4/1/20
06
10/1/200
6
4/1/20
07
10/1/200
7
4/1/20
08
Finished Steel Intrastructure Index
Source: Bloomberg
Fundamental outlook The steel industry plays an important role in the economic development of a country. India,
being the 5th largest steel producer in the world, has a share of around 4 percent in world
steel production of 1,344 million metric tonnes. Despite this, the per capita steel
consumption in India is one of the lowest, thus providing the domestic industry with a huge
potential to scale greater heights. The per capita steel consumption in India is around 35kg
as compared to the world average of 150kg, and 300kg and 400kg for China and the US,
respectively.
Strong infrastructure development and economic indicators reflects robust demand for
steel in India. During the 11th Plan (2007‐08 to 2011‐12), the projected investment
towards infrastructure is likely to be Rs20,27,000 crore, an increase of 180% over the 10th
Plan.
International iron ore prices have climbed by 100% and coking coal prices have almost
tripled this year. The effect of this has been observed in both global and domestic markets.
The Indian domestic steel ingot prices have jumped over 50% this year mainly attributed

24
to the spiralling prices of raw materials. The wholesale price index of iron and steel has
jumped by 29.92% this year (until week ended July 5) and inflation soared to a 13‐year
high of 11.91%.
A double‐digit inflation figure has been causing panic in the market as the government
continuously keeps taking measures to calm down prices. A number of fiscal steps have
been taken, such as exempting pig iron, non‐alloy steel, and steel‐making inputs like zinc,
ferro‐alloys and met coke from customs duty; withdrawing DEPB benefits on export of
various categories of steel products; and bringing back railway freight on iron ore from
classification 180 to 170 for domestic steel produce. Moreover, a 15% export duty on long
products and iron ore exports have been imposed and a commitment from primary steel
manufacturers have been taken to hold prices for a period of three months ending July. As a
result, steel producers had rolled back prices of flat products by Rs4,000 per tonne and
Rs2,000 per tonne for structural steel. Most recently, they also agreed to cut down the
prices for steel pipes by 10% after the government agreed to rollback the 15% export duty
on flat products.
However, even after implementing these steps, the government failed to control the prices
as dealers and retail sellers of steel continued to pass on the higher input costs to the final
consumer. An example of this is the rise in mild steel ingot prices which moved to
Rs.37,500 per tonne from its April month lowest level of Rs28,300 per tonne levels.
Following is the outline on trend in steel input costs in 2008 (until July):
Domestic sponge iron (ex‐Raipur) is exchanging hands at Rs28,705 per tonne,
signifying a net gain of 69.7%.
Currently, contract coking coal price is reigning at $300 per tonne, an increase of
200% from $98 per tonne in March and spot prices are hovering at $350 per tonne.
NMDC had raised iron ore prices by 47.5 % with retrospective effect from October 1,
2007. Currently, iron ore prices in the spot market are $110 per tonne FOB India.
China’s import prices (CFR) of Indian iron ore (63% iron content) has moved
slightly lower by 2.63% to US$185 per tonne levels.

25
Baosteel, China’s largest steel maker, have agreed for a hike of 79.88% and 95% on
their long‐term iron ore fines and lumps prices, respectively, thus clearly pointing
out the supply tightness in the iron ore market.
Benchmark Australian Newcastle spot thermal coal prices are quoting at US$181.30
per metric tonne, up 103% in 2008.
The Baltic Dry Index (BDI), which is the main indicator for commodity freight rates,
has averaged at 8556 levels in 1H 2008, up 61% compared to the figures in 1H
2007.
Baseload German Power has increased by 42% to over 88 euros per mega watt hour
(MWH).
The robust demand for steel in India followed with the rising input costs is likely to
pressurize the steel companies to pass on the additional costs to the consumers. This is the
likely scenario once the steel company’s voluntary commitment to hold prices ends in July.
Rising input costs is adversely impacting the operating margins of steel companies. Though
primary steel producers have better margins on account of larger capacities, it will be
difficult for secondary and smaller players to hold the prices. Meanwhile, Steel Authority of
India Limited (SAIL) issued a written advisory to its dealers and long‐term contract
customers and warned of punitive action in case of any violation of its stipulations. In its
advisory, SAIL has asked its MoU dealership customers to limit their retail margins to
within Rs1,200 a tonne over the price at which they have procured the products from it.
To add, following were the statements made by major steel giants:
SAIL Chairman, SK Roongta ‐ “We have been able to register growth because we
increased output of value‐added steel and improved efficiencies. But fixed costs are
increasing. We need to raise prices to maintain margins.''
Tata Steel Managing Director, B Muthuraman ‐ “There is every justification to increase
steel prices since the industry cannot go for capacity expansion at the current profit
margins.”
26
Tata Steel Managing Director, B Muthuraman ‐ “Domestic steel prices are Rs15, 000 to
Rs20, 000 lower than international prices.”
JSW Steel Director (Finance), Sheshagiri Rao ‐ "Price movements are a result of
movements in companies’ cost structure. We are surely going to review steel prices in
August. But we are yet to decide whether the price movement would be upwards or
downwards."
Bhushan Steel Director (Finance), Nitin Johri ‐ "If primary steel firms go ahead with a
price increase, we will also raise prices of our products as we will be under pressure with
mounting price of everything from crude oil to iron ore, coking coal and electricity,"
Steel Secretary, R.S. Pandey ‐ "As long as inflation is high, as long as steel's contribution to
inflation is high, the government will deliberate and find out what best could be done."
Considering all the factors, prices are likely to move higher in the medium to long
term (from end of Q3 08). In the near short term, there are chances of price
correction, in anticipation of the government taking a few measures to control the
spiralling prices. Reports show that the government is already considering imposing an
extra export duty on both long and flat products. It is also evaluating a decision of 20%
export duty on sponge iron (currently 15%). There is a speculation in the market that the
steel industry may face a price band, which, we think, will not happen so as to develop the
industry over a period of time.

27
Technical outlook Mild Steel Ingots prices are taking correction after witnessing a sharp rally which
catapulted prices from 17000 to 37500 levels. The RSI indicator is treading near the
overbought conditions in monthly charts, suggesting that prices may be due for a
correction. The decline in volumes during the recent rally and increasing volumes during
the current fall is giving support to the bearish view in the short term. Lower volumes
usually reflect weak market sentiment for the prevailing trend and the opposite is true for
strong market sentiment.
The daily chart is also looking weak as prices are moving lower after testing the trend
channel resistance at 37,500 levels and failing to breach the same. Prices find first major
support at 30,000 levels, which is the trend channel support. A close below the same may
take prices to 27,800 levels, which is previous swing low. These levels can be a good entry
point for long term buying for targets of 45,000.
Though the long term trend continues to be bullish, we expect prices to take good
correction before continuing the journey northwards.

28
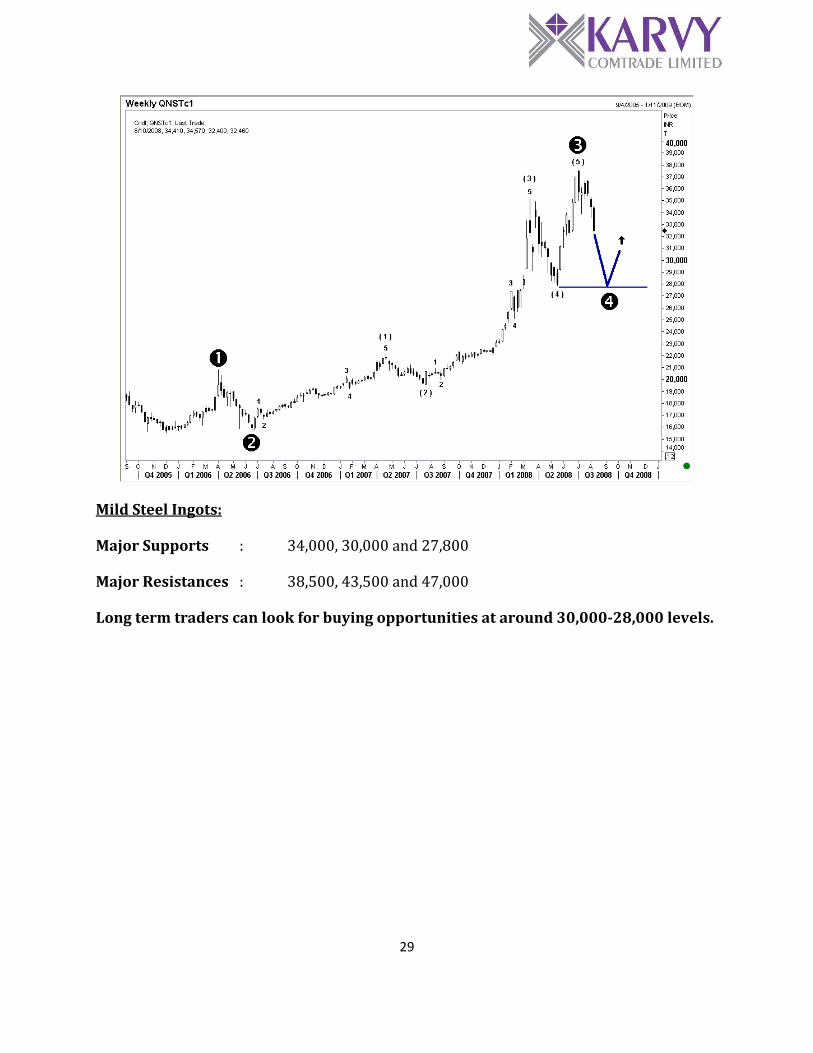
Elliot Wave Count
Primary Wave 3 – The primary wave 3 seems to have completed its move higher and we
feel that primary wave 4 is in formation. Generally the target for wave 4 of a greater degree
is considered to be the bottom made by wave 4 of immediately lesser degree. So in this case
the probable target for primary wave 4 can be the bottom made by intermediate wave 4 i.e.
27,800 levels. However this is only a guiding principle to assess the probable target, but not
a hard and fast rule.
29
Mild Steel Ingots:
Major Supports : 34,000, 30,000 and 27,800
Major Resistances : 38,500, 43,500 and 47,000
Long term traders can look for buying opportunities at around 30,00028,000 levels.
30
To unsubscribe please mail us at [email protected]
Disclaimer
The report contains the opinions of the author that are not to be construed as investment advice. The author, directors and other employees of Karvy, and its affiliates, cannot be held responsible for the accuracy of the information presented herein or for the results of the positions taken based on the opinions expressed above. The above‐mentioned opinions are based on the information which is believed to be accurate and no assurance can be given for the accuracy of this information. There is risk of loss in trading in derivatives. The author, directors and other employees of Karvy and its affiliates cannot be held responsible for any losses in trading.
Commodity derivatives trading involve substantial risk. The valuation of the underlying may fluctuate, and as a result, clients may lose their entire original investment. In no event should the content of this research report be construed as an express or an implied promise, guarantee or implication by, or from, Karvy Comtrade that you will profit or that losses can, or will be, limited in any manner whatsoever. Past results are no indication of future performance. The information provided in this report is intended solely for informative purposes and is obtained from sources believed to be reliable. Information is in no way guaranteed. No guarantee of any kind is implied or possible where projections of future conditions are attempted.
We do not offer any sort of portfolio advisory, portfolio management, or investment advisory services. The reports are only for information purposes and not to be construed as investment advice.
For a detailed disclaimer please go to following URLs:
http://www.karvycomtrade.com/disclaimer.asp
http://www.karvycomtrade.com/riskDisclaimer.asp