steering committee meeting #4 - houstontx.gov
TRANSCRIPT

STEERING COMMITTEE MEETING #4


Kingwood Area Mobility StudyLake Houston Redevelopment Authority
(TIRZ #10)
Steering Committee Meeting # 4Date: September 23, 2014

Introduction
Introduction
Remarks by Stan Sarman/Council Member Dave Martin

Recap
PROJECT KICKOFF
FINAL REPORT
COLLECTION & REVIEW OF DATA
EVALUATION OF EXISTING CONDITIONS
STEERING COMMITTEE MEETING #2
STAKEHOLDER MEETING # 1
STEERING COMMITTEE MEETING #3
ANALYSIS & IDENTIFY SOLUTIONS
STEERING COMMITTEE MEETING #4
STAKEHOLDER MEETING # 2
AGENCY COORDINATION
STEERING COMMITTEE MEETING #5
STEERING COMMITTEE MEETING #1September 23, 2014

Update
E-mails
Survey
Improvement Options and Analysis
This information will be posted on the website

GOALS & MOE’S-Recap
GOALS Obtain community input
Improve mobility – short and long term
Maintain same or better quality of life
Identify funding sources
Educate public regarding funding sources
Plan for future
Safety
Possible transit for aging population
Pedestrian facilities as part of Street Improvements
Public transportation
Trolley system – not typical METRO bus
Quick fixes
MOE’S
Less congestion
Decrease delay/travel time
Pedestrian safety/bicycle safety
Vehicular safety
Cost effectiveness
Schedule
Regulatory impacts
Environmental impacts including Tree Impacts

New Developments
Known Developments
Kings Creek Mixed Use – 2014 Opening Year
Kingwood Parc Medical Office – 2015 Opening Year
Watercrest Kingwood Senior Apartments – 2015 Opening Year
Kings Crossings Retail – 2017 Opening Year
Royal Brook Residential - 2018 Opening Year
Woodridge Forest Development – 2018 Opening Year
Riverpoint Village – 2018 Opening Year
New Caney Middle School – 2014 Opening Year
Background Growth Rate of 2% per year up to 2020
Approximately 4,000 trip-ends during peak hour due to these additional developments

Planned/Funded/Scheduled Roadway and Other Infrastructure Improvements

Public Input – E-mails and Survey
111 E-mail Comments as of September 17, 2014
30 E-mail comments since our last Steering Committee Meeting # 3
Still receiving e-mails
1,075 surveys
Survey closed on June 30, 2014

Suggested Improvements by Citizens and Feasibility
Reversible lanes on Kingwood Drive
Woodland Hills Connection to Hamblen
Innovative Improvements such as roundabouts, diverging diamonds, and All-way stops
Other intersection Improvements including signal timing improvements
Maintain green band for peak directions by eliminating off-peak left-turns
Direct Connector from Kingwood Drive to US 59
Widen both Kingwood Drive and Northpark Drive
Not Feasible
Analyzed
Not Feasible
Analyzed
Analyzed
Analyzed
Analyzed

Suggested Improvements by Citizens and Feasibility
Coordinate with Union Pacific on Rail Road timings and
restrict rail timings during peak hours
Widen Hamblen Road to 4-Lanes
Connection to Huffman to the east
Woodland Hills Connection through FM 1960 and ultimately
to BW 8
Not Feasible
Analyzed
Coordinated
Not Feasible

Survey Discussion
Question 1: Which Category best describes your interest?
94% of the people identified themselves as local residents

Question 2
497
320
287
222195 193
170144
0
100
200
300
400
500
600
Kingwood/494
Kingwood/West LakeHouston
Northpark/494
Kingwood/Woodland
Hills
Kingwood/Royal Forest
Kingwood/ChesnutRidge
Kingwood/Green Oak
Kingwood/HW 59
Num
ber
of R
espo
nses
Intersection
Q2: Which locations or intersections in Kingwood do you think have the most traffic issues?

Question 3What transportation-related issues in the Kingwood area concern you the most?
41
31
2319
11
051015202530354045
SAFETY141
6647 47 45
020406080100120140160
CONGESTION
53
23
15 1410
0
10
20
30
40
50
60
ENVIRONMENTAL CONCERNS & ALTERNATIVE
TRANSPORTATION

Question 3
96
40
2520
14
0
20
40
60
80
100
120
INTERSECTIONS63
5550
35
24
0
10
20
30
40
50
60
70
ROADS

Question 4 to 9
Walking and Biking

Question 10
155
132127 123
112 108
91
76 72
5951
41 3933
0
20
40
60
80
100
120
140
160
180
Q.10 What do you think should be done to roadways in the Kingwood area to improve mobility?
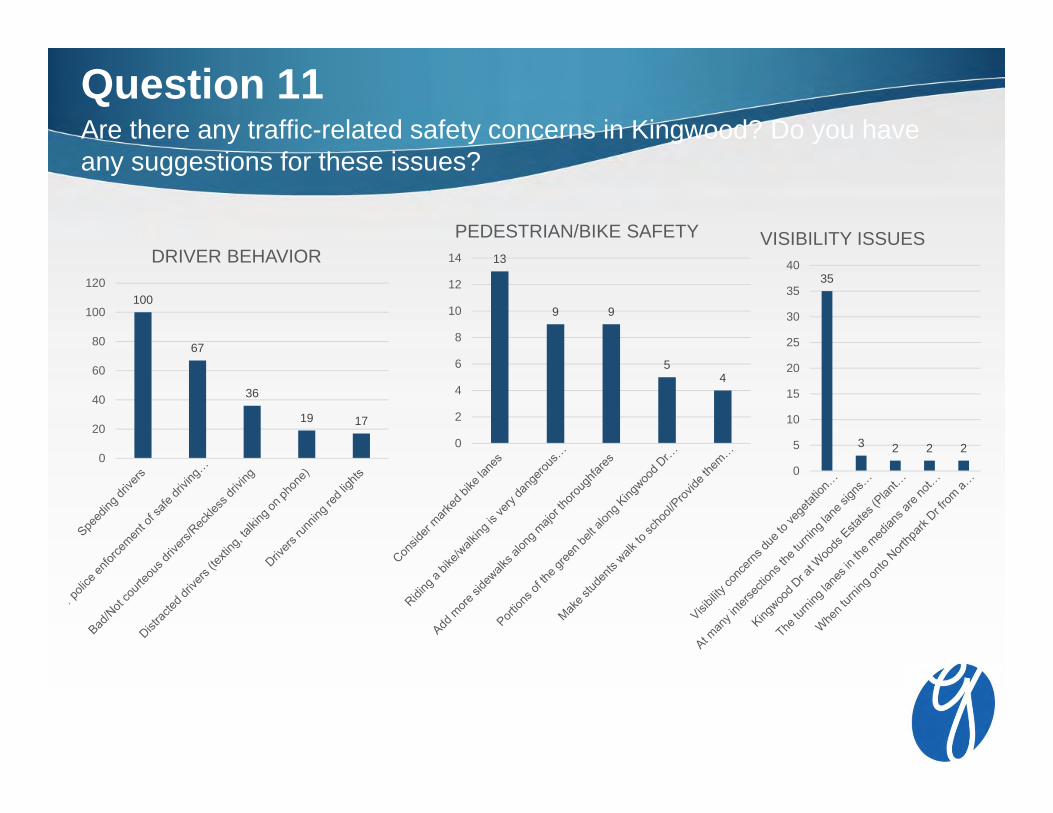
Question 11Are there any traffic-related safety concerns in Kingwood? Do you have any suggestions for these issues?
100
67
36
19 17
0
20
40
60
80
100
120
DRIVER BEHAVIOR35
3 2 2 2
0
5
10
15
20
25
30
35
40
VISIBILITY ISSUES13
9 9
54
0
2
4
6
8
10
12
14
PEDESTRIAN/BIKE SAFETY

Question 12
63% of the people are willing to sacrifice trees for savings of at least 10 minutes
23% are not willing to sacrifice any trees
14% are undecided

Concerns by Location/Intersection

Travel Time Data
Field Collected Travel Times
AM Peak (Westbound)
On Kingwood Drive from High Valley to US 59 SB Frontage Road = 16.8 Min
PM Peak (Eastbound)
On Kingwood Drive from US 59 SB Frontage Road to High Valley = 18.4 Min
Synchro Model
AM Peak (Westbound)
On Kingwood Drive from High Valley to US 59 SB Frontage Road = 17.7 Min
PM Peak (Eastbound)
On Kingwood Drive from US 59 SB Frontage Road to High Valley = 20.3 Min

Speed DataKingwood High School (Westbound)
Peak Period Total <25 mph 26-35 mph 36 to 45 mph >45 mph
6:30 AM to 7:45 AM
1,739 446 433 583 277
2:30 PM to 3:15 PM
1,503 242 406 572 283
School Zone Flasher Timings
6:40 AM to 7:40 AM and 2:30 PM to 3:15 PM
Posted Speed 40 mph; School Zone Speed = 25 mph
85th Percentile Speed
49.2 mph (DAILY BASIS)
Kingwood High School (Eastbound)
Peak Period Total <25 mph 26-35 mph 36 to 45 mph >45 mph
6:30 AM to 7:45 AM
973 348 532 91 2
2:30 PM to 3:15 PM
893 379 466 47 1
School Zone Flasher Timings
6:40 AM to 7:40 AM and 2:30 PM to 3:15 PM
Posted Speed 45 mph; School Zone Speed = 25 mph
85th Percentile Speed
35 mph (DAILY BASIS)

Speed Data
Creekwood Middle School (Southbound)
Peak Period Total <20 mph 20-30 mph 30 to 45 mph >45 mph
7:45 AM to 9:00 AM
1,157 205 726 211 15
3:30 PM to 4:30 PM
1,233 197 522 493 21
School Zone Flasher Timings
7:50 AM to 8:50 AM and 3:40 PM to 4:25 PM
Posted Speed 45 mph; School Zone Speed = 20 mph
85th Percentile Speed
44.1 mph (DAILY BASIS)
Creekwood Middle School (Northbound)
Peak Period Total <20 mph 20-30 mph 30 to 45 mph >45 mph
7:45 AM to 9:00 AM
1,353 373 541 439 0
3:30 PM to 4:30 PM
1,277 519 353 394 11
School Zone Flasher Timings
7:50 AM to 8:50 AM and 3:40 PM to 4:25 PM
Posted Speed 45 mph; School Zone Speed = 20 mph
85th Percentile Speed
40.3 mph (DAILY BASIS)

311 Calls – Signal Repair
33 3331
2624
2117 16
14
0
5
10
15
20
25
30
35
Num
ber
of 3
11 C
alls
Cross Street
Kingwood Drive 311 Calls - Jan to May 2014
32
14
9
0
5
10
15
20
25
30
35
Rock Springs Dr. Woodland Hills Dr. W. Lake Houston Pkwy
Num
ber
of 3
11 C
alls
Cross Street
Northpark Drive 311 Calls - Jan To May 2014

COH MTFP Thresholds
City of Houston MTFP volume thresholds
2-Lanes = 14,000 to 16,000 vehicles/day
4-Lanes = 30,000 to 33,000 vehicles/day
6-Lanes = 40,000 to 45,000 vehicles/day
Kingwood Drive from US 59 to Woodland Hills Drive-Exceeded the threshold (Current Data=37K to 41K per day)
Northpark Drive from US 59 to Woodland Hills Drive-Exceeded the threshold (Current Data=35K per day)
West Lake Houston Parkway from Kingwood Drive to Bridge (south) – (Current Data=31K/day)

Improvement Alternatives
1. Intersection Improvements
2. Left-Turn Prohibition in Off-Peak Direction
A. 6-Lane Kingwood Drive only
B. 6-Lane Northpark Drive only
C. Direct Connector from Kingwood Drive to US 59 only
D. Direct Connector from Northpark Drive to US 59 only
E. 6-Lane Kingwood Drive with direct connector from Kingwood Drive to US 59
F. 6-Lane Northpark Drive with direct connector from Northpark Drive to US 59
G. 6-Lane Kingwood Drive, 6-Lane Northpark Drive, Direct Connector from Kingwood Drive to US 59, and Direct Connector from Northpark Drive to US 59
H. Woodland Hills Drive Extension to Hamblen Road
I. Widening of Kingwood Drive and Northpark Drive
J. Underpass on Kingwood Drive @ Loop 494/Rail Road
K. Underpass on Northpark Drive @ Loop 494/Rail Road

Option 1: Intersection Improvements
Traffic Signal Timing Coordination
New Traffic Signal at Northpark Drive & Hidden Pines/Woodridge Parkway
EBR at Northpark Drive & Hidden Pines
EBR at Northpark Drive & West Lake Houston Parkway
NBR at West Lake Houston Parkway & Kings Crossings Drive
NBR at Kingwood Drive & Sorters Road
EBR and WBR at Kingwood Drive & Loop 494
NBR at Kingwood Drive & Royal Forest Drive
EBR at Kingwood Drive & Green Oak Drive

Option 1: Intersection Improvements
EBR at Kingwood Drive & Trailwood Village Drive
NBR & SBR at Kingwood Drive & Chestnut Ridge Road
EBR, WBR, EBL, WBL at Kingwood Drive & Woodland Hills Drive
EBR at Kingwood Drive & Willow Terrace
EBL at Hamblen Road & Forest Cove Drive
Widening of Mills Branch Road from North of Kingwood Drive to Royal Brook Residential (New Development), north of Northpark Drive

Option 1: Intersection Improvements

Total Delay (in 2014):
Before: 1,176 Hours (AM); 1,963 Hours (PM)
After: 988 Hours (AM); 1,552 Hours (PM)
Reduction: 16% (AM); 21% (PM)
Total Delay (in 2020):
Before: 1,689 Hours (AM); 2,849 Hours (PM)
After: 1,302 Hours (AM); 2,131 Hours (PM)
Reduction: 23% (AM); 25% (PM)
Cost of Improvements = $16.35 Million
Crash Reduction = 52.50%
Tree Impacts = < 10%
Number of Intersections at LOS E/F with Improvements (2014) = 10
Number of Intersections at LOS E/F with Improvements (2020) = 20
Option 1: Intersection Improvements

Option 2: Left Turn Prohibition in Off-Peak
On Kingwood Drive Only
At 12 locations on Kingwood Drive, additional left-turns and acceleration lanes are required for restricted left-turns to turn around.
Total Delay (in 2014):
Before: 1,176 Hours (AM); 1,963 Hours (PM)
After: 1,032 Hours (AM); 1,700 Hours (PM)
Reduction: 12% (AM); 13% (PM)
Total Delay (in 2020):
Before: 1,689 Hours (AM); 2,849 Hours (PM)
After: 1,560 Hours (AM); 2,596 Hours (PM)
Reduction: 7.5% (AM); 9% (PM)
Cost = $6.4 Million
Tree Impacts = <10%
Crash Reduction = 30%
• Number of Intersections at LOS E/F with Improvements (2014) = 10
• Number of Intersections at LOS E/F with Improvements (2020) = 20

Alternative A

Alternative A
Total Delay (in 2020):
Before: 1,689 Hours (AM); 2,849 Hours (PM)
After: 1,081 Hours (AM); 1,845 Hours (PM)
Reduction: 36% (AM); 35% (PM)
Cost of Improvements = $31.3 Million
Crash Reduction = 60%
Tree Impacts = < 10%
Number of Intersections at LOS E/F = 9
Pros: Reduces Travel Time, Congestion, Already funded
Cons: Some tree impacts

Alternative B

Alternative B
Total Delay (in 2020):
Before: 1,689 Hours (AM); 2,849 Hours (PM)
After: 1,146 Hours (AM); 1,895 Hours (PM)
Reduction: 32% (AM); 34% (PM)
Cost of Improvements = $27.1 Million
Crash Reduction = 30%
Tree Impacts = < 10%
Number of Intersections at LOS E/F with Improvements (2020) = 12
Pros: Reduces Travel Time and Congestion
Cons: Some tree impacts, multiple agency coordination, Montgomery County Roadway, Funding not readily available
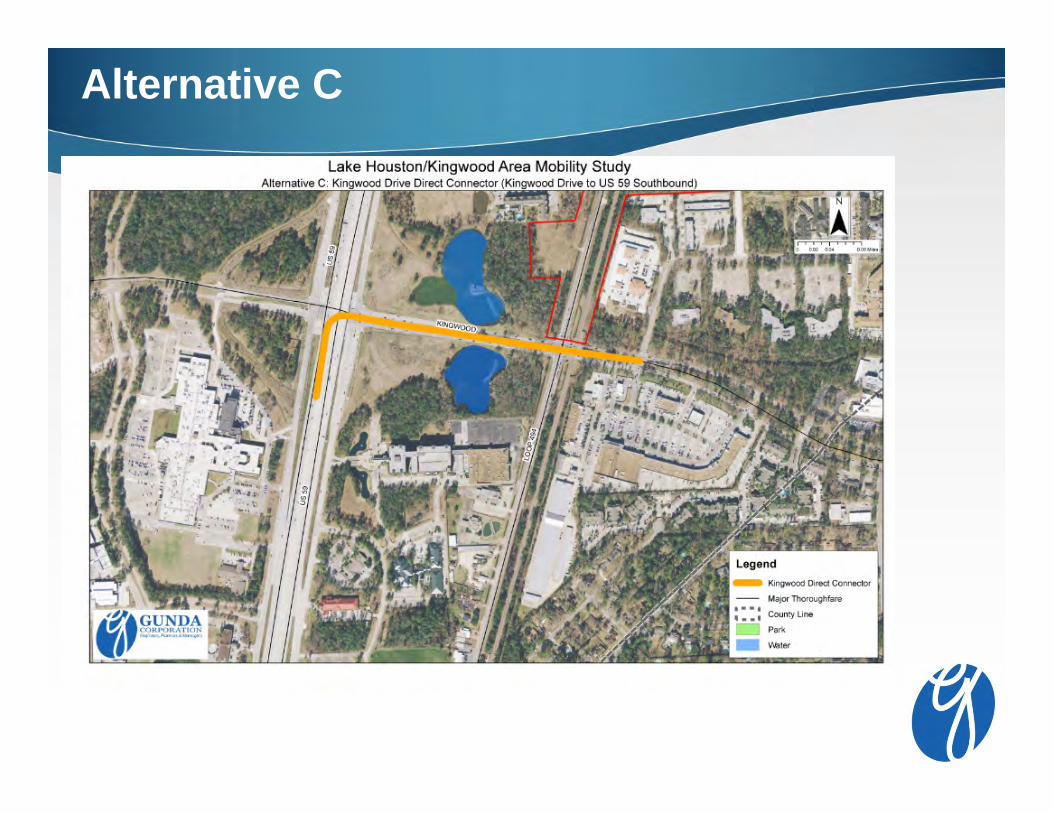
Alternative C

Alternative C
Total Delay (in 2020):
Before: 1,689 Hours (AM); 2,849 Hours (PM)
After: 1,432 Hours (AM); 2,265 Hours (PM)
Reduction: 15% (AM); 21% (PM)
Cost of the Improvement: $50.72 Million
Tree Impacts: <10%
Crash Reduction = 15%
Number of Intersections at LOS E/F with Improvements (2020) = 15
Pros: Reduces Travel Time, Congestion, by eliminating turning movements at LP 494 and US 59
Cons: Some tree impacts, High Cost, Aesthetics, Environmental Clearances

Alternative D

Alternative D
Total Delay (in 2020):
Before: 1,689 Hours (AM); 2,849 Hours (PM)
After: 1,536 Hours (AM); 2,274 Hours (PM)
Reduction: 9% (AM); 20% (PM)
Cost of the Improvement: $50.52 Million
Tree Impacts: <10%
Crash Reduction: 15%
Number of Intersections at LOS E/F with Improvements (2020) = 12
Pros: Reduces Travel Time, Congestion at Loop 494 near rail road
Cons: Some tree impacts, High Cost, Aesthetics, Environmental Clearances

Alternative E

Alternative E
Total Delay (in 2020):
Before: 1,689 Hours (AM); 2,849 Hours (PM)
After: 1,043 Hours (AM); 1,816 Hours (PM)
Reduction: 38% (AM); 36% (PM)
Cost of the Improvement: $82 Million
Tree Impacts: <10%
Crash Reduction: 60%
Number of Intersections at LOS E/F with Improvements (2020) = 6
Pros: Reduces Travel Time and Congestion, Already funded for widening
Cons: Some tree impacts, High Cost, Aesthetics, TxDOT coordination, Environmental Clearances for over pass

Alternative F

Alternative F
Total Delay (in 2020):
Before: 1,689 Hours (AM); 2,849 Hours (PM)
After: 1,010 Hours (AM); 1,816 Hours (PM)
Reduction: 40% (AM); 36% (PM)
Cost of the Improvement: $77.6 Million
Tree Impacts: <10%
Crash Reduction: 30%
Number of Intersections at LOS E/F with Improvements (2020) = 8
Pros: Reduces Travel Time, Congestion
Cons: Some tree impacts, High Cost, Aesthetics, TxDOT coordination, Environmental Clearances for over pass, multiple agency coordination, Montgomery County Road
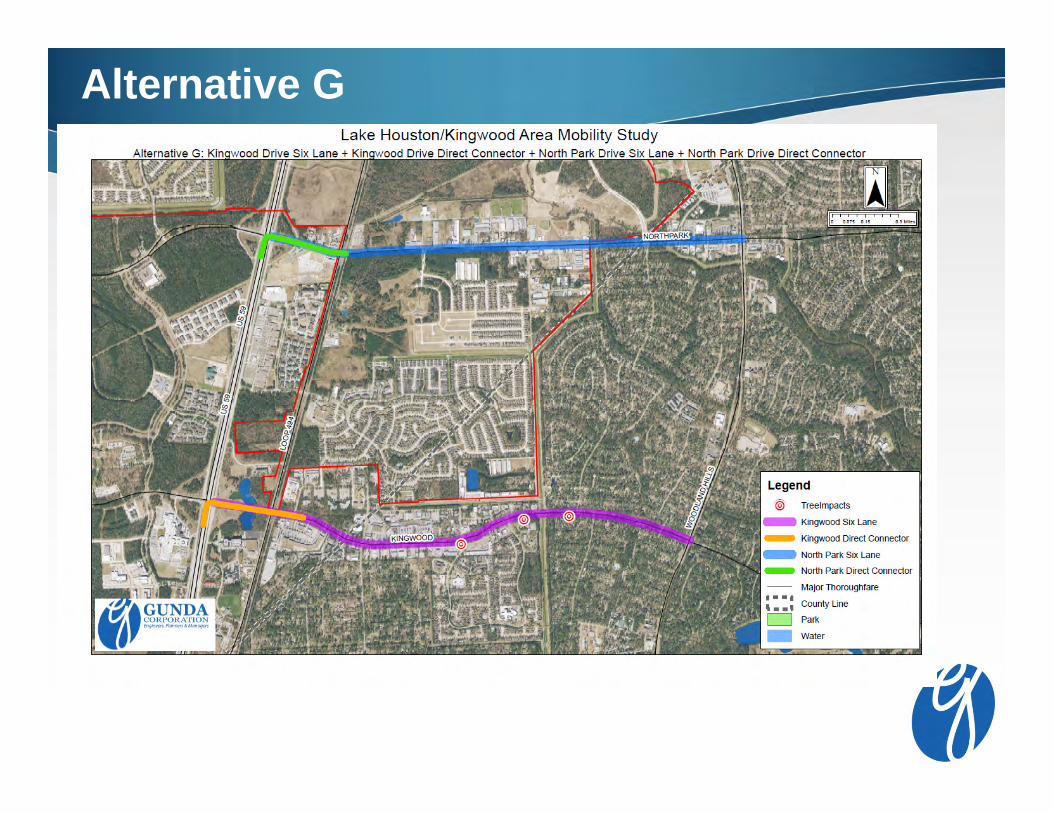
Alternative G

Alternative G
Total Delay (in 2020):
Before: 1,689 Hours (AM); 2,849 Hours (PM)
After: 795 Hours (AM); 1,690 Hours (PM)
Reduction: 53% (AM); 41% (PM)
Cost of the Improvement: $159.64 Million
Tree Impacts: <10%
Crash Reduction: 70%
Number of Intersections at LOS E/F with Improvements (2020) = 0
Pros: Reduces Travel Time, Congestion, Already funded for widening
Cons: Some tree impacts, High Cost, Aesthetics, TxDOT coordination, Environmental Clearances for over pass, Cost Prohibitive, Multiple Agency Coordination
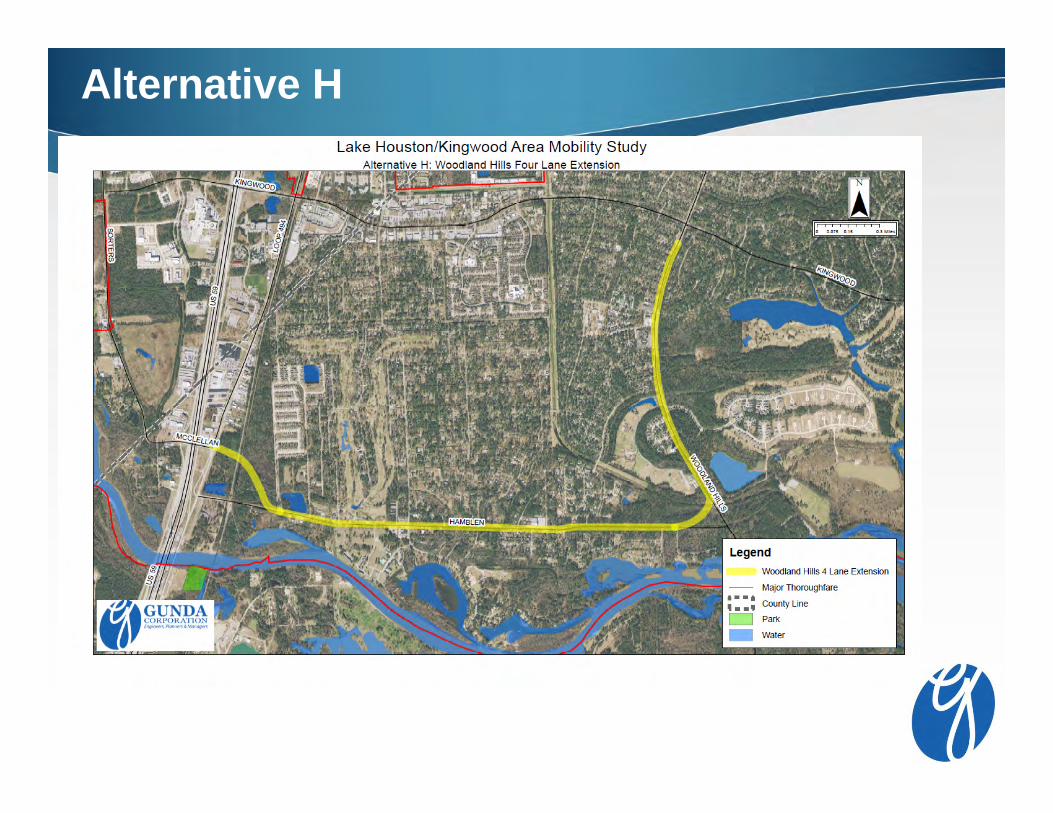
Alternative H
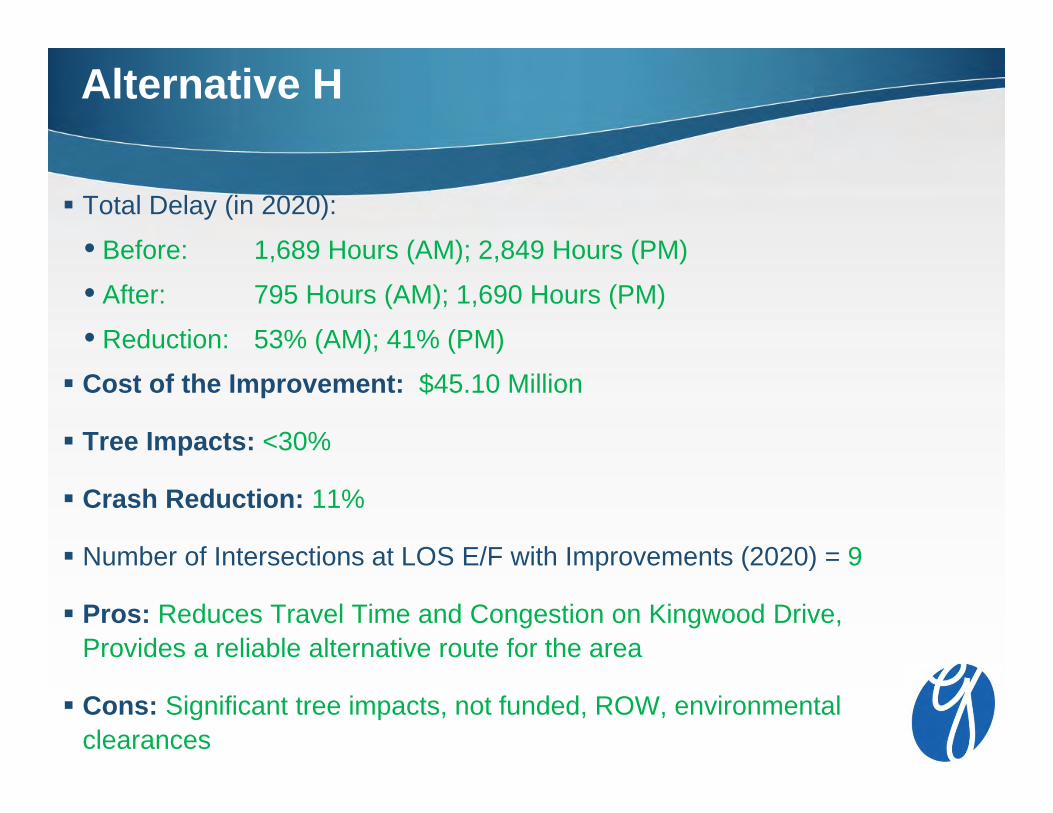
Alternative H
Total Delay (in 2020):
Before: 1,689 Hours (AM); 2,849 Hours (PM)
After: 795 Hours (AM); 1,690 Hours (PM)
Reduction: 53% (AM); 41% (PM)
Cost of the Improvement: $45.10 Million
Tree Impacts: <30%
Crash Reduction: 11%
Number of Intersections at LOS E/F with Improvements (2020) = 9
Pros: Reduces Travel Time and Congestion on Kingwood Drive, Provides a reliable alternative route for the area
Cons: Significant tree impacts, not funded, ROW, environmental clearances

Alternative I

Alternative I
Total Delay (in 2020):
Before: 1,689 Hours (AM); 2,849 Hours (PM)
After: 951 Hours (AM); 1,759 Hours (PM)
Reduction: 44% (AM); 38% (PM)
Cost of the Improvement: $58.4 Million
Tree Impacts: <10%
Crash Reduction: 70%
Number of Intersections at LOS E/F with Improvements (2020) = 3
Pros: Reduces Travel Time and Congestion, Partly funded
Cons: More tree impacts, multiple agency coordination, need to identify funding for Northpark Road

Alternative J

Alternative J
Total Delay (in 2020):
Before: 1,689 Hours (AM); 2,849 Hours (PM)
After: 1,467 Hours (AM); 2,282 Hours (PM)
Reduction: 13% (AM); 20% (PM)
Cost of the Improvement: TBD
Tree Impacts: <10%
Crash Reduction: 7.5%
Number of Intersections at LOS E/F with Improvements (2020) = 8
Pros: Reduces Travel Time and congestion at Loop 494 near Railroad
Cons: Some tree impacts, all trees between US 59 & Loop 494, TXDOT and UP Rail Road Coordination, Impact to Retail Driveway at Royal Forest Drive

Alternative K

Alternative K
Total Delay (in 2020):
Before: 1,689 Hours (AM); 2,849 Hours (PM)
After: 1,554 Hours (AM); 2,288 Hours (PM)
Reduction: 8% (AM); 20% (PM)
Cost of the Improvement: TBD
Tree Impacts: <10%
Crash Reduction: 7.5%
Number of Intersections at LOS E/F with Improvements (2020) = 12
Pros: Reduces Travel Time and congestion at Loop 494 near Railroad
Cons: Some tree impacts, all trees between US 59 & Loop 494, TXDOT and UP Rail Road Coordination.

Scoring Criteria
Scoring MOE’s
Scoring Goals
Weighting Factors
Improvements/GoalsCommunity
Input
Improve Mobility (Short-Term & Long-Term) Maintain
Same or Better
Quality of Life
Identify Funding Sources
Safety
Transit
Pedestrian Facilities
Total ScorePlan for Future
Public Transportation
Quick Fixes Trolley System
Category Code A B C D E F G A to G
Weighting Factor 0 30 25 5 30 5 5 100

Hands on Exercise
Review each improvement Option and assign score for each option
Based on the weighting factors, the score will be calculated
Higher the score, better the option

Next Steps
Stakeholder Meeting #2 – October 14, 2014 @ 5:30 PM
Open House Format with Exhibits at Stations
Next Steering Committee Meeting Date: November 18, 2014 @ 6:00 PM
Survey Summary and data will be posted on the website http://gundacorp.com/kingwood-mobility/

Questions?