steinway musical instruments, inc
TRANSCRIPT

STEINWAY MUSICAL INSTRUMENTS, INC.
ANNUAL REPORT 1997
Brought to you by Global Reports
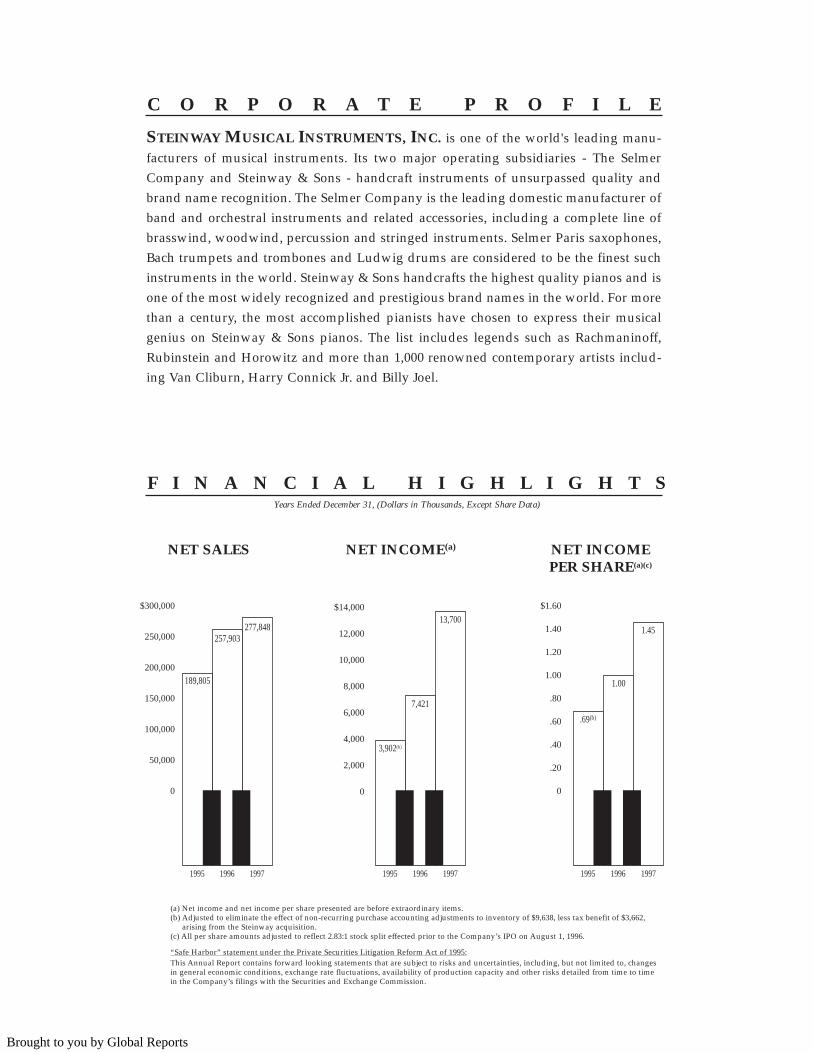
F I N A N C I A L H I G H L I G H T SYears Ended December 31, (Dollars in Thousands, Except Share Data)
(a) Net income and net income per share presented are before extraordinary items.(b) Adjusted to eliminate the effect of non-recurring purchase accounting adjustments to inventory of $9,638, less tax benefit of $3,662,
arising from the Steinway acquisition.(c) All per share amounts adjusted to reflect 2.83:1 stock split effected prior to the Company’s IPO on August 1, 1996.
“Safe Harbor” statement under the Private Securities Litigation Reform Act of 1995:This Annual Report contains forward looking statements that are subject to risks and uncertainties, including, but not limited to, changesin general economic conditions, exchange rate fluctuations, availability of production capacity and other risks detailed from time to timein the Company’s filings with the Securities and Exchange Commission.
$300,000
250,000
200,000
150,000
100,000
50,000
0
$14,000
12,000
10,000
8,000
6,000
4,000
2,000
0
$1.60
1.40
1.20
1.00
.80
.60
.40
.20
0
NET SALES NET INCOME(a) NET INCOMEPER SHARE(a)(c)
C O R P O R A T E P R O F I L E
STEINWAY MUSICAL INSTRUMENTS, INC. is one of the world's leading manu-facturers of musical instruments. Its two major operating subsidiaries - The SelmerCompany and Steinway & Sons - handcraft instruments of unsurpassed quality andbrand name recognition. The Selmer Company is the leading domestic manufacturer ofband and orchestral instruments and related accessories, including a complete line ofbrasswind, woodwind, percussion and stringed instruments. Selmer Paris saxophones,Bach trumpets and trombones and Ludwig drums are considered to be the finest suchinstruments in the world. Steinway & Sons handcrafts the highest quality pianos and isone of the most widely recognized and prestigious brand names in the world. For morethan a century, the most accomplished pianists have chosen to express their musicalgenius on Steinway & Sons pianos. The list includes legends such as Rachmaninoff,Rubinstein and Horowitz and more than 1,000 renowned contemporary artists includ-ing Van Cliburn, Harry Connick Jr. and Billy Joel.
1995
189,805
257,903277,848
1996 1997 1995 1996 1997 1995 1996 1997
3,902(b)
7,421
13,700
.69(b)
1.00
1.45
Brought to you by Global Reports

T O O U R S H A R E H O L D E R S
Steinway Musical Instruments, Inc.began 1997 on a high note. Having justcompleted a record year in 1996, wewere named "Company of the Year" bythe music industry's leading publica-tion, The Music Trades. This award rec-ognized "overall performance, quality,value-added products, a well-executedpromotional program and disciplineddistribution which generated the mostimpressive results in the entire musicindustry." Expectations for 1997 wereunderstandably high and we arepleased to report to you that our resultswere even better than we had hoped.
1997 HIGHLIGHTS
• Record net sales for 1997 totaled $277.8 million, an increase of$19.9 million or 8% over 1996.
• Net income rose 85% to $13.7 million or $1.45 per share, up from $1.00 per share before extraordinaryitems in 1996.
• Gross margins increased to 33.6%from 32.7%.
• Operating margins increased to14.0% from 12.8%.
YEAR IN REVIEWThe upward momentum in sales
and profits in 1997 was led bya very robust U.S. market. Ourdomestic promotional strategiescontinued to produce strong results.
Steinway & Sons, in particular, hasdeveloped a number of consumer pro-motions for its dealer network that con-tinue to generate dramatic sales results.Our mid-priced Boston line of pianos isnow the fastest-growing piano linein the world. Unit shipments wereup more than 33% for the year.
Selmer had an equally impressiveyear. Our products were named as the"Band Instrument Line of the Year" byMusical Merchandise Review. Selmerachieved record sales and cashflow results and gained overallmarket share in a very competitiveenvironment.
Our performance in 1997 reflects thesuperior quality of our products andthe dedication of our craftspeople andmanagers.
FAVORABLE DEMOGRAPHICTRENDS IN CONSUMERMARKETS
The Company is well positioned tobenefit from very favorable demo-graphic trends which will continueover the course of the next five to tenyears. The band instrument businesswill benefit from the increase in thenumber of school-age children. This"echo boom", as educators describe it,is already impacting school systems.Since one in ten eleven-year olds inthe U.S. takes up a musical instru-ment, school population growthtranslates directly into a highly pre-dictable business opportunity forSelmer. Similarly, for Steinway & Sons,favorable age and affluence trendsin the U.S. are adding to the demandfor Steinway pianos.
INSTITUTIONAL SALESThe institutional piano business in
the United States provides significantopportunity for growth. Our marketshare has risen steadily since 1995, aswe implemented innovative financingprograms that help educational insti-tutions replace older pianos. Over thelast two years our focused marketingefforts and these new financing pro-grams have doubled our business inthis segment and we look forward togrowth in 1998 and beyond.
GROWTH THROUGHACQUISITION
The past year was highlighted by thesuccessful integration of EmersonMusical Instruments, Inc. which weacquired early in 1997. We are pleasedto report that during the first year ofoperations with us, Emerson achieveda 20% increase in sales. During 1998 wewill be actively looking at music com-panies worldwide for potential acquisi-tions. We will use excess cash flow toacquire only companies that representgood value for our shareholders andprovide strategic growth opportunities.
INTERNATIONAL EXPANSIONWe see great opportunity for growth
in Europe, Asia and South America. InFebruary 1997, Steinway & Sonsannounced a new marketing sub-sidiary to expand distribution of ourpianos in Japan, one of the world'slargest and most developed pianomarkets. While current economic con-ditions in Asia are challenging, ourlong-term expectations for this marketremain high. Similarly, in Europe andSouth America, we are in the begin-ning stages of improving and expand-ing marketing and distribution. Whilethis effort will take a number of yearsto implement fully, it should result insignificant long-term sales increases.
In closing, with our increasedresources, talented management team,dedicated craftspeople and a clearvision for the future, Steinway is poisedto grow profitably and successfully. Wewelcome the many challenges andexciting opportunities that lie ahead aswe continue to focus on growth andincreasing shareholder value.
Dana D. MessinaChief Executive Officer
Kyle R. KirklandChairman of the Board
1
Brought to you by Global Reports

S E L M E R
woodwinds and brasswinds were introduced during the
year. The acquisition of Emerson underscored Selmer's
commitment to increasing its presence in the flute market.
While demographics for school-age children remain
highly favorable, participation in a band must still com-
pete against computers, sports and other entertain-
ment/educational activities. Accordingly, in addition to
funding industry-wide activities, Selmer recently
retained a highly respected music educator and lecturer
to act as its Education Director. His role is to pioneer
presentations for pre-band parents on the benefits
of music education for their children.
ORCHESTRAL INSTRUMENTS
String programs continue to grow based on parent per-
ception of orchestra as a higher intellectual activity.
Glaesel's advertising and recruiting materials tapped into
this theme. Strategic use of the Glaesel and Wm. Lewis
brands allowed the Company to position itself in several
market niches. The added value of Glaesel's "shop adjust-
ed" instruments continues as a unique selling point.
Production capacity was expanded to support this grow-
ing business by adding manufacturing space.
PERCUSSION INSTRUMENTS
Despite a highly competitive worldwide market for
percussion instruments, musician recognition of the
Ludwig and Musser names remains strong. Although
specialized, the new high-tech M58 Musser/Piper vibe
received considerable acclaim for its innovation.
Successful introduction of Ludwig Rocker Elite Series
Drums and Accent Outfits strengthened the Company's
presence in middle and entry-level market segments.
Ludwig drums can be seen and heard on tours by
well-known rock groups such as Van Halen, Yes, and
Cheap Trick.
EAR IN REVIEW
Selmer continued the extraordinary
performance that it has enjoyed for the
past several years, resulting in yet anoth-
er record year in terms of sales and prof-
its. A 5% increase in units shipped fueled an increase in
sales of $11.0 million or 9% to $132.5 million.
Contributing to this improvement was the successful
integration of the Company's latest acquisition -
Emerson Musical Instruments, Inc. The combination of
Emerson's high quality flutes and piccolos and Selmer's
outstanding distribution network produced an impres-
sive 20% increase in Emerson's sales.
BAND INSTRUMENTS
Capturing the coveted "Band Instrument Line of the
Year" award, as voted by dealers across the country for
Musical Merchandise Review, highlighted another extreme-
ly successful year. Strong demand and increased
production allowed the Selmer and Bach divisions to
achieve record results in 1997. Improved efficiency result-
ed from installation of computer-assisted technology
throughout Selmer's manufacturing facilities. Ratification
of a new three-year contract with the United Auto
Workers ensured the stable labor relations necessary to
building high-quality musical instruments.
Direct mail and newsletter campaigns reaching music
educators, school administrators, professionals, stu-
dents and amateurs created greater awareness and
demand for Selmer and Bach instruments. The
Company's band instrument web site received over
three million hits. Professional Selmer and Bach
endorsers presented 547 educational clinics and perfor-
mances at schools and universities, demonstrating
Selmer's commitment to music education as well as
showcasing the instruments. Nine new models in both
Y
2
Brought to you by Global Reports

(Center Box)Thomas T. Burzycki
President-The Selmer Company
3
Brought to you by Global Reports

S T E I N W A Y & S O N S
opportunity for increased sales lies in the educational
institution market - where virtually every top-ranked
institution wants the quality and the recruiting prestige
of Steinway instruments. With the introduction of new
financing programs, growth in the institutional segment
has been dramatic. Institutional sales now represent
nearly 15% of total domestic shipments, up from 7% just
a few years ago. Steinway plans to increase this sizable,
recession-resistant market segment to approximately
25% of domestic sales in the years ahead.
INTERNATIONAL EXPANSION
Long-term, significant future growth can be seen
coming from Europe, Asia and Latin America. Rising
worldwide consumer confidence and strong regional
economies will help sustain demand for Steinway prod-
ucts. To meet this demand Steinway & Sons is improv-
ing and expanding its international distribution net-
work. For example, in 1997 our new Japanese subsidiary
appointed 23 new dealers as part of a well-planned
drive to expand distribution to multiple consumer mar-
kets in one of the world's largest piano markets. While
these new international markets will take some time to
fully develop, solid worldwide sales growth will be
achievable over the long-term.
BUILDING THE RESTORATION SERVICEBUSINESS
In 1997, a major long-term strategic growth objective
was established - the aggressive pursuit and expansion
of the used Steinway restoration business. Currently, the
Restoration Center in Steinway's New York factory is the
largest rebuilder of pre-owned Steinway pianos in the
world. The plan over the next three years is to double
this highly profitable business.
EAR IN REVIEW
1997 and indeed the past five years
have been outstanding for both
Steinway pianos and the mid-priced
Boston piano line. Very favorable age
and affluence trends have added to the demand for our
superior quality instruments. Overall, this strong and
continuing demand combined with comprehensive,
and innovative marketing programs resulted in
Steinway & Sons' highest domestic shipments in
60 years. In fact, the 2,277 Steinway grand pianos
shipped in the Americas during 1997 represent a 69%
increase in sales since 1992.
During 1997 worldwide shipments increased nearly 6%
over 1996. Boston shipments were up an impressive 33%.
The resulting increase in sales of $9.0 million or 7% to
$145.3 million was achieved despite the negative impact of
$7.9 million on foreign sales from currency translation.
Greater efficiencies associated with higher levels of pro-
duction coupled with reduced costs for the Boston line
improved gross margins from 31.5% in 1996 to 33.4% in
1997.
DOMESTIC & INSTITUTIONAL MARKET
GROWTH
Steinway & Sons is well positioned to benefit from
very favorable demographic trends which will continue
during the course of the next five to ten years. As the
baby boom generation matures into its peak earning
years, more and more of these adults will reward them-
selves and their families by trading up and investing in
new Steinway and Boston pianos. In addition to contin-
ued growth in this core consumer market, a golden
Y
4
Brought to you by Global Reports

(Center Box)Bruce A. Stevens
President-Steinway & Sons
5
Brought to you by Global Reports

S E L E C T E D F I N A N C I A L D A T A(Dollars in Thousands, Except Share Data)
Predecessor (1) Company
Period Year Ended December 31,
1/1/93 - 8/11/93 -8/10/93 12/31/93 1994 1995(2) 1996 1997
INCOME STATEMENT DATA:Net sales $ 57,171 $ 34,339) $101,114 $189,805) $257,903 $277,848Gross profit 17,955 5,484) 31,661 50,218) 84,235 93,281Earnings (loss) from operations 5,520 (1,640) 12,472 13,102) 33,020 38,932Net income (loss) before
extraordinary item 1,405 (3,109) 2,922 (2,074) 7,421 13,700Income (loss) per share before
extraordinary item:Basic --- (2.07) 1.95 (1.36) 1.00 1.45Diluted --- (2.07) 0.52 (1.36) 1.00 1.45
BALANCE SHEET DATA(at period end):Total assets $ 95,349 $ 88,970) $185,524 $263,796) $265,366 $266,708Total debt 65,053 71,369) 62,057 174,039) 118,391 115,457
(1) On August 10, 1993, the Company purchased substantially all of the assets and certain liabilities of (1) The Selmer Company, L.P.(2) The Company acquired Steinway in May 1995.
F I N A N C I A L C O N T E N T S
Management's Discussion and Analysis of Financial Condition and Results of Operations 7
Independent Auditors' Report 10
Consolidated Balance Sheets 11
Consolidated Statements of Operations 12
Consolidated Statements of Stockholders' Equity 13
Consolidated Statements of Cash Flows 14
Notes to Consolidated Financial Statements 15
Market and Dividend Information Inside Back Cover
6
Brought to you by Global Reports

IntroductionThe following discussion provides an assessment of
the results of operations and liquidity and capitalresources for the Company and should be read in con-junction with the consolidated financial statements ofthe Company and the notes thereto included else-where in this report.
OverviewThe Company, through its Steinway and Selmer
subsidiaries, is one of the world's leading manufactur-ers of musical instruments. The Company's net salesand earnings from operations improved 7.7% and17.9%, respectively, for 1997 compared to 1996. TheCompany believes that these operating performanceimprovements have resulted from implementation ofthe Company's strategy to capitalize on its strongbrand names and leading market positions. TheCompany's net sales of $277.8 million for the yearended December 31, 1997 were comprised of Steinwaypiano sales of $145.3 million and Selmer band andorchestral instrument sales of $132.5 million.
Steinway's piano sales are influenced by generaleconomic conditions in the United States and Europe,demographic trends and general interest in music andthe arts. Steinway's operating results are primarilyaffected by grand piano sales. Given the total numberof grand pianos sold by Steinway in any year (3,134sold in 1997), a decrease of a relatively few number ofunits being sold by Steinway can have a materialimpact on the Company's business and operatingresults. Domestic grand piano unit shipments haveincreased 27% from 1994 to 1997, largely attributableto the economic recovery in the United States as wellas increased selling and marketing efforts. Grandpiano unit shipments to international markets haveremained relatively flat over the same period reflect-ing the weakness of the European economies. In 1997,approximately 60% of Steinway's sales were in theUnited States, 28% in Europe and the remaining 12%primarily in Asia.
Selmer student instrument sales are strongly influ-enced by trends in school enrollment and general atti-tudes toward music and the arts. The school instru-ment business is generally resistant to macroeconomiccycles and strongly correlated to the number of schoolchildren in the United States, which is expected togrow steadily through 2005. Beginner instrumentsaccounted for 74% of Selmer's unit shipments and 51%of instrument revenues in 1997 with advanced and pro-fessional instruments representing the balance.
Band and orchestral instrument unit shipmentshave grown an average of 4% a year, and sales havegrown an average of 10% a year, since 1994. The unitand sales growth is the result of management's effortsto capitalize on the favorable demographic trends andthe generally positive attitudes toward music educa-tion by parents. Efforts have included increasing pro-duction capacity to meet the growing demand for itsproducts and directing marketing programs towardthe school-age population.
Although the Company cannot accurately predictthe precise effect of inflation on its operations, it doesnot believe that inflation has had a material effect onsales or results of operations in recent years. Sales tocustomers outside the United States represent approx-imately 30% of consolidated sales, with Steinway'sinternational sales accounting for over 71% of theseinternational sales. A significant portion of Steinway'sinternational sales originate from its German manu-facturing facility, resulting in sales, cost of sales andrelated operating expenses denominated in Deutschemarks. While currency translation has affected inter-national sales, cost of sales and related operatingexpenses, it has not had a material impact on operat-ing income. The Company utilizes financial instru-ments such as forward exchange contracts and curren-cy options to reduce the impact of exchange rate fluc-tuations on firm and anticipated cash flow exposuresand certain assets and liabilities denominated in cur-rencies other than the functional currency. TheCompany does not purchase currency related financialinstruments for purposes other than exchange raterisk management.
The Company's effective tax rates vary dependingon the relative proportion of foreign to U.S. income(foreign income generally bears higher rates of tax)and absorption of foreign tax credits in the U.S. In1997, U.S. income increased relative to foreign incomeand the rate of credit absorption increased slightly.This shift in income combined with certain tax savingstrategies reduced the Company's effective tax ratefrom 53% in 1996 to 48% in 1997.
Results of OperationsIn May 1995, Selmer acquired Steinway for approx-
imately $104.0 million. The acquisition was accountedfor as a purchase for financial reporting purposes. Theconsolidated financial statements of the Company asof and for the year ending December 31, 1995 includethe effects of the acquisition as well as the results ofoperations for Steinway for the period May 25, 1995 toDecember 31, 1995.
MANAGEMENT' S DISCUSSION AND ANALYSIS OF FINANCIALCONDITION AND RESULTS OF OPERATIONS
7
Brought to you by Global Reports

In August 1996, the Company completed an initialpublic offering of its ordinary common stock whichraised approximately $63.1 million. After deductingexpenses of approximately $2.3 million, the Companyused the net proceeds from the offering to repay $54.6million of senior secured notes and related prepaymentpenalties of $4.5 million.
In January 1997, the Company acquired Emersonfor approximately $2.0 million, including assumed lia-bilities of $0.4 million. The acquisition was accountedfor as a purchase for financial reporting purposes.
Fiscal Year 1997 Compared to Fiscal Year 1996
Net Sales - Net sales increased $19.9 million (7.7%)to $277.8 million in 1997. Piano sales increased $8.9million (6.6%) despite the negative impact of $7.9 mil-lion from foreign currency translation. Total pianoshipments increased nearly 19%, comprised of a 33%increase in Boston units and a 6% increase in Steinwayunits. Band and orchestral instrument sales increased$11.0 million (9.0%) in 1997. Emerson contributed $2.9million of the band sales increase. Total instrumentshipments increased 5% for the year.
Gross Profit - Gross profit increased $9.0 million(10.7%) to $93.3 million. Gross margins increased to33.6% in 1997 compared to 32.7% in 1996. Thisimprovement is primarily due to greater efficienciesassociated with higher levels of piano productioncombined with a yen driven reduction in costs of theBoston piano line of approximately $2.1 million.
Operating Expenses - Operating expenses increased$3.1 million (6.1%) to $54.3 million in 1997. Additionaloperating costs associated with new subsidiaries totaled$1.6 million in 1997. After adjusting for these additionalexpenses, operating costs increased only 3.1% over 1996.Overall, operating expenses decreased as a percentageof sales from 19.9% in 1996 to 19.6% in 1997.
Earnings from Operations - Earnings from operationsincreased by $5.9 million (17.9%) to $38.9 million in1997. These improved earnings resulted fromincreased sales combined with improved gross profitmargins and firm control over operating expenses.
Net Interest Expense - Net interest expense decreased$4.3 million (25.3%) to $12.8 million in 1997. Thisdecrease represents the savings realized from theretirement of the Company's senior secured notes inSeptember 1996.
Fiscal Year 1996 Compared to Fiscal Year 1995
Net Sales - Net sales increased $68.1 million (35.9%)to $257.9 million in 1996. Steinway sales contributed$55.4 million of this increase, reflecting the impact of afull year's results in 1996 versus the seven monthsincluded in 1995. Selmer sales increased $12.7 million(11.6%) with instrument unit growth of 4.1% repre-senting $2.8 million of the increase. The balance of theincrease relates to price increases and a favorable mixof higher priced instruments.
Gross Profit - Gross profit increased $34.0 million(67.7%) to $84.2 million. Steinway contributed $26.6million of this increase, the majority of which is attrib-utable to the full year's sales impact noted above. Inaddition, 1995 results were affected by $9.6 million inadditional cost of sales relating to the fair value adjust-ment of Steinway's inventory effected upon its acqui-sition. Selmer gross profit increased $7.5 million(22.1%) in 1996, reflecting the increase in sales. Grossmargins increased to 32.7% in 1996 compared to 26.5%in 1995 primarily as a result of having fully absorbedthe $9.6 million Steinway inventory acquisition adjust-ment during 1995.
Operating Expenses - Operating expenses increased$14.1 million (38.0%) to $51.2 million in 1996. Steinwayoperating expenses accounted for $12.7 million of theincrease. Selmer operating expenses increased $1.2million (6.3%) to $20.7 million, but decreased as a per-centage of sales from 17.8% in 1995 to 17.0% in 1996.Overall, operating expenses remained under 20.0% ofsales for both 1995 and 1996.
Earnings from Operations - Earnings from operationsincreased by $19.9 million (152.0%) to $33.0 million in1996. The impact of Steinway's full year results in 1996combined with the negative effect on 1995 earningsassociated with the $9.6 million inventory acquisitionadjustment accounted for $13.7 million of thisimprovement. The remaining $6.2 million increase inearnings represents the contribution from Selmer'sincreased sales level.
Net Interest Expense - Net interest expense increased$2.8 million (19.3%) to $17.1 million in 1996. Thisincrease was a product of the additional five monthsthat the $110 million in Steinway acquisition debt wasoutstanding offset by the savings realized from theearly extinguishment of $55 million in senior securednotes accomplished with the proceeds of theCompany's initial public offering in August 1996.
MANAGEMENT' S DISCUSSION AND ANALYSIS OF FINANCIALCONDITION AND RESULTS OF OPERATIONS
8
Brought to you by Global Reports

Liquidity and Capital ResourcesThe Company has relied primarily upon cash pro-
vided by operations, supplemented as necessary byseasonal borrowings under its working capital line, tofinance its operations, repay long-term indebtednessand fund capital expenditures.
Cash provided by operations was $6.7 million in1995, $5.9 million in 1996 and $13.8 million in 1997.Major acquisitions have been financed through theissuance of long-term debt. Cash provided from theissuance of $105.0 million of senior subordinated notesfunded the Steinway acquisition in 1995.
Capital expenditures in 1995, 1996 and 1997 were$3.2 million, $5.2 million and $5.6 million, respectively.These capital expenditures were primarily used for pur-chasing new machinery and building improvements.The Company expects to increase its level of capitalexpenditures in the future as it modernizes its equip-ment and renovates its facilities in order to expand itsproduction capacity and piano restoration services.
Consistent with industry practice, Selmer sellsband instruments almost entirely on credit utilizingthe two financing programs described below. Theseprograms create large working capital requirementsduring the year when band instrument receivable bal-ances reach highs of approximately $55-60 million inAugust and September, and lows of approximately$25-30 million in January and February. The financingoptions, intended to assist dealers with the seasonali-ty inherent in the industry and to facilitate the rent-to-own programs offered to students by many retailers,also allow Selmer to match its production and deliveryschedules. Selmer offers the following two forms offinancing to qualified band instrument dealers:
a) Receivable dating: Purchases made from Januarythrough September have payment due in October.Purchases made from October to December have pay-ment due in January. Dealers are offered discounts forearly payment.
b) Note receivable financing: Qualified dealers may con-vert open accounts to a note payable to Selmer. Thenote program is offered in January and October, andcoincides with the receivable dating program. Thenote receivable is secured by dealer inventories andreceivables. The majority of notes receivable are pur-chased by a third-party financial institution, on a fullrecourse basis. The Company's current arrangement,which allows the financial institution to purchase, atits option, up to an aggregate of $15.0 million of notesreceivable per year, expires in 2000. Net notes receiv-
able sales generated approximately $11.8 million and$15.1 million in cash in 1996 and 1997, respectively.
Unlike many of its competitors in the piano indus-try, Steinway does not provide extended financingarrangements to its dealers. To facilitate long-termfinancing required by some dealers, Steinway hasarranged for financing through a third-party providerwhich generally involves no guarantee by Steinway.
The Company's domestic, seasonal borrowingrequirements are accommodated through a commit-ted, revolving credit facility with a domestic bank (the"Facility"). The Facility provides the Company with apotential borrowing capacity of up to $60.0 million,based on eligible accounts receivable and inventory.Borrowings are secured by a first lien on theCompany's domestic inventory, receivables, and fixedassets. As of December 31, 1997, no amounts were out-standing, and availability was approximately $50.3million. The Facility currently bears interest at theEurodollar rate plus 2.5% and expires March 31, 2000.Open account loans with foreign banks also providefor borrowings by Steinway's foreign subsidiaries ofup to 25 million Deutsche marks.
At December 31, 1997, the Company's total out-standing indebtedness amounted to $115.5 million, con-sisting of $110.0 million of 11% senior subordinatednotes and $5.5 million of notes payable to foreign banks.Cash interest paid was $17.7 million and $13.5 millionin 1996 and 1997, respectively. All of the Company'sdebt agreements contain covenants that place certainrestrictions on the Company, including its ability toincur additional indebtedness, to make investments inother entities, and to pay cash dividends.
The Board of Directors of the Company approved ashare repurchase program in November 1997. Theprogram authorizes management to make discre-tionary repurchases of its ordinary common stock upto a limit of $25 million. Shares purchased will beheld as treasury shares to be used for corporatepurposes. During 1997, 85,900 shares were repur-chased under the program at a cost of $1.9 million.
The Company has conducted a review of its com-puter systems to identify those areas that could beaffected by the "Year 2000" issue. The Companypresently believes the Year 2000 problem will not posesignificant operational problems and the cost of reme-diating any identified problems is not anticipated tobe material to its financial position or results of opera-tions either in the aggregate or in any given year.
Management believes that cash on hand, togetherwith cash flow anticipated from operations and avail-
9
Brought to you by Global Reports

able borrowings under the Facility, will be adequate tomeet debt service requirements, fund continuing capi-tal requirements and satisfy working capital and gen-eral corporate needs through the next twelve months.
New Accounting PronouncementsIn 1997, the Company adopted Statement of
Financial Accounting Standards (SFAS) No. 128,"Earnings Per Share". Prior to 1997, the Company com-puted income (loss) per common share using the meth-ods outlined in Accounting Principles Board OpinionNo. 15, Earnings Per Share, and its interpretations.Previously reported income (loss) per common share foryears prior to 1997 did not differ materially from thatcomputed using SFAS 128.
In June 1997, the Financial Accounting StandardsBoard (FASB) released SFAS No. 130, "ReportingComprehensive Income", which the Company will berequired to adopt in 1998. SFAS 130 requires that theCompany provide a prominent display of the compo-nents of items of other comprehensive income. Theonly item that the Company currently records as othercomprehensive income is the change in cumulative
translation adjustment resulting from changes inexchange rates and the effect of those changes upontranslation of the financial statements of theCompany's foreign operations. Adoption will nothave an effect on reported results of operations orfinancial position.
In June 1997, the FASB released SFAS No. 131,"Disclosures about Segments of an Enterprise andRelated Information". SFAS 131 requires that a compa-ny disclose segmented information about its business-es based upon the way in which management overseesand evaluates the results of such businesses. TheCompany has elected to early adopt the provisions ofSFAS 131 in 1997.
In February 1998, the FASB released SFAS No. 132,"Employer's Disclosures about Pensions and OtherPostretirement Benefits", which the Company will berequired to adopt in 1998. SFAS 132 will require addi-tional disclosure concerning changes in the Company'spension obligations and assets and eliminates certainother disclosures no longer considered useful.Adoption will not have any effect on reported results ofoperations or financial position.
To the Board of Directors and Stockholders of Steinway Musical Instruments, Inc.
We have audited the accompanying consolidated financial statements of Steinway Musical Instruments,Inc. and subsidiaries as of December 31, 1996 and 1997 and for each of the three years in the period endedDecember 31, 1997. These financial statements are the responsibility of the Company's management. Ourresponsibility is to express an opinion on these financial statements based on our audits.
We conducted our audits in accordance with generally accepted auditing standards. Those standardsrequire that we plan and perform the audit to obtain reasonable assurance about whether the financialstatements are free of material misstatement. An audit includes examining, on a test basis, evidence sup-porting the amounts and disclosures in the financial statements. An audit also includes assessing theaccounting principles used and significant estimates made by management, as well as evaluating the over-all financial statement presentation. We believe that our audits provide a reasonable basis for our opinion.
In our opinion, such consolidated financial statements present fairly, in all material respects, the finan-cial position of Steinway Musical Instruments, Inc. and subsidiaries as of December 31, 1996 and 1997,and the results of their operations and their cash flows for each of the three years in the period endedDecember 31, 1997 in conformity with generally accepted accounting principles.
I N D E P E N D E N T A U D I T O R S ' R E P O R T
DELOITTE & TOUCHE LLPBoston, MassachusettsFebruary 27, 1998 10
MANAGEMENT' S DISCUSSION AND ANALYSIS OF FINANCIALCONDITION AND RESULTS OF OPERATIONS
Brought to you by Global Reports

December 31, December 31,1996 1997
ASSETSCurrent assets:
Cash $ 223,277) $ 555,271)Accounts, notes and leases receivable, net of allowance for
bad debts of $7,120 and $7,504 in 1996 and 1997, respectively 45,563) 47,377)Inventories 82,950) 87,954)Prepaid expenses and other current assets 2,867) 4,832)Deferred tax asset 5,696) 6,188)
Total current assets 140,353) 151,622)
Property, plant and equipment, net 62,101) 58,629)Other assets, net 26,291) 22,891)Cost in excess of fair value of net assets acquired, net of accumulated
amortization of $1,894 and $2,734 in 1996 and 1997, respectively 36,621) 33,566)
TOTAL ASSETS $ 265,366) $ 266,708)
LIABILITIES AND STOCKHOLDERS’ EQUITYCurrent liabilities:
Notes payable and current portion of long-term debt $ 222,354) $ 223,338)Accounts payable 6,453) 5,668)Other current liabilities 28,913) 31,423)
Total current liabilities 37,720) 40,429)
Long-term debt 116,037) 112,119)Deferred taxes 30,003) 26,279)Non-current pension liability 13,728) 12,120)Total liabilities 197,488) 190,947)
Commitments and contingent liabilities
Stockholders’ equity:Class A common stock, $.001 par value, authorized 5,000,000 shares,
477,953 shares issued and outstanding ---) ---)Common stock, $.001 par value, authorized 90,000,000 shares, 8,944,984
and 8,889,641 shares outstanding in 1996 and 1997, respectively 9) 9)Additional paid-in capital 68,729) 69,206)Retained earnings 792) 14,492)Accumulated translation adjustment (1,652) (6,030)Treasury stock ---) (1,916)
Total stockholders’ equity 67,878) 75,761)
TOTAL LIABILITIES AND STOCKHOLDERS’ EQUITY $ 265,366) $ 266,708)
See notes to consolidated financial statements.
C O N S O L I D A T E D B A L A N C E S H E E T SDECEMBER 31, (Dollars in Thousands ,Except Share Data)
11
Brought to you by Global Reports

C O N S O L I D A T E D S T A T E M E N T S O F O P E R A T I O N SYEARS ENDED DECEMBER 31, (Dollars in Thousands, Except Share Data)
1995 1996 1997
Net sales $ 189,805) $ 257,903) $ 277,848)Cost of sales 139,587) 173,668) 184,567)
Gross profit 50,218) 84,235) 93,281)
Operating expenses:Sales and marketing 21,001) 29,206) 32,441)Provision for doubtful accounts 797) 760) 742)General and administrative 11,612) 16,363) 17,531)Amortization 3,041) 4,388) 3,869)Other expense 665) 498) (234)
Total operating expenses 37,116) 51,215) 54,349)
Earnings from operations 13,102) 33,020) 38,932)
Other (income) expense:Other income, principally interest and late charges (583) (763) (728)Interest and amortization of debt discount 14,923) 17,870) 13,504)
Other expense, net 14,340) 17,107) 12,776)
Income (loss) before income taxes (1,238) 15,913) 26,156)
Provision for income taxes 836) 8,492) 12,456)
Income (loss) before extraordinary item (2,074) 7,421) 13,700)
Extraordinary item - early extinguishmentof debt (net of tax benefit of $2,640) ---) 4,368) ---)
Net income (loss) $11(2,074) $ 223,053) $ 213,700)
Basic income (loss) per share:Income (loss) before extraordinary item $111(1.36) $ 2221.00) $ 2221.45)Extraordinary item ---) (.59) ---)Net income (loss) $111(1.36) $ 2222.41) $ 2221.45)
Diluted income (loss) per share:Income (loss) before extraordinary item $111(1.36) $ 2221.00) $ 2221.45)Extraordinary item ---) (.59) ---)Net income (loss) $111(1.36) $ 2222.41) $ 2221.45)
Weighted average shares:Basic 1,524,663) 7,418,580) 9,426,122)Diluted 1,524,663) 7,418,580) 9,458,841)
See notes to consolidated financial statements.
12
Brought to you by Global Reports

CONSOLIDATED STATEMENTS OF STOCKHOLDERS' EQUITYYEARS ENDED DECEMBER 31, (Dollars in Thousands)
Additional Retained AccumulatedPreferred Common Paid in Earnings Translation Treasury
Stock Stock Warrants Capital (Deficit) Adjustment Stock
Balance, January 1, 1995 $ 1) $--- $ 2,335) $24,999 $22(187) $2(,105) $221,---)
Net loss (2,074)
Foreign currency translationadjustment 19)
Issuance of 297,150 shares ofcommon stock 630
Balance, December 31, 1995 1) --- 2,335) 5,629 (2,261) 124) ---)
Net income 3,053)
Foreign currency translationadjustment (1,776)
Issuance of 3,570,000 sharesof common stock 4 60,769
Conversion of preferred stockand warrants (1) 5 (2,335) 2,331
Balance, December 31, 1996 ---) 9 ---) 68,729 792) (1,652) ---)
Net income 13,700)
Foreign currency translationadjustment (4,378)
Issuance of 30,557 shares ofcommon stock 477
Purchase of 85,900 shares oftreasury stock (1,916)
Balance, December 31, 1997 $ ---) $ 9 $ 333---) $69,206 $14,492) $(6,030) $(1,916)
See notes to consolidated financial statements.13
Brought to you by Global Reports

1995 1996 1997
Cash flows from operating activities:Net income (loss) $22(2,074) $223,053) $213,700)Adjustments to reconcile net income (loss) to cash
flows from operating activities:Depreciation and amortization 7,739) 10,970) 10,581)Provision for doubtful accounts 797) 760) 742)Deferred tax benefit (5,083) (3,123) (3,012)Early extinguishment of debt ---) 4,368) ---)Other 370) 274) 143)Changes in operating assets and liabilities:
Accounts, notes and leases receivable (4,203) (4,606) (3,098)Inventories 7,664) (5,786) (7,298)Prepaid expense and other current assets (701) (127) (909)Accounts payable 1,354) (1,712) (685)Accrued expenses 800) 1,856) 3,671)
Cash flows from operating activities 6,663) 5,927) 13,835)
Cash flows from investing activities:Capital expenditures (3,162) (5,199) (5,634)Proceeds from disposals of fixed assets 51) 51) 44)Changes in other assets (1,801) 109) (1,772)Business acquisition (net of cash acquired) (102,790) ---) (1,606)
Cash flows from investing activities (107,702) (5,039) (8,968)
Cash flows from financing activities:Borrowing under lines of credit 147,993) 195,222) 227,185)Repayments under lines of credit (148,486) (196,754) (228,304)Proceeds from issuance of long-term debt 110,000) 4,717) ---)Proceeds from issuance of stock 630) 60,773) 477)Purchase of treasury stock ---) ---) (1,916)Repayments of long-term debt (5,772) (64,823) (882)
Cash flows from financing activities 104,365) (865) (3,440)
Effects of foreign exchange rate changes on cash )---) (452) 567)
Increase (decrease) in cash 3,326) (429) 1,994)Cash, beginning of year 380) 3,706) 3,277)
Cash, end of year $2(23,706) $223,277) $225,271)
Supplemental cash flow informationInterest paid $2(13,399) $217,665) $213,508)Income taxes paid $2(25,532) $211,145) $213,751)
See notes to consolidated financial statements.
C O N S O L I D A T E D S T A T E M E N T S O F C A S H F L O W SYEARS ENDED DECEMBER 31, (Dollars in Thousands)
14
Brought to you by Global Reports

N O T E S T O C O N S O L I D AT E D F I N A N C I A L S TAT E M E N T SYEARS ENDED DECEMBER 31, 1995, 1996 AND 1997 (Dollars in Thousands, Except Share Data)
(1) Nature of Business
Steinway Musical Instruments, Inc. and subsidiaries(the "Company") is one of the world's leading manufac-turers of musical instruments. The Company, through itswholly-owned subsidiaries The Steinway PianoCompany, Inc. (Steinway) and The Selmer Company,Inc. (Selmer), manufactures and distributes productswithin the musical instrument industry. Steinway pro-duces the highest quality piano in the world and has oneof the most highly recognized and prestigious brandnames. Selmer is the leading domestic manufacturer ofband and orchestral instruments and related accessories,including a complete line of brasswind, woodwind, per-cussion and stringed instruments. Selmer Paris saxo-phones, Bach trumpets and trombones and Ludwigsnare drums are considered by many to be the finestsuch instruments in the world. In May 1995, Selmer pur-chased the assets of Steinway for approximately $104million. In January 1997, the Company purchased theassets of Emerson Musical Instruments, Inc. for approx-imately $2.0 million. Each acquisition has been account-ed for as a purchase for financial reporting purposes.The consolidated financial statements of the Companyinclude the results of operations for each business sinceits date of acquisition.
(2) Summary of Significant Accounting Policies
Use of Estimates - The preparation of financial state-ments in conformity with generally accepted accountingprinciples necessarily requires management to makeestimates and assumptions that affect the reportedamounts of assets and liabilities and the reportedamounts of revenues and expenses during the reportingperiod. Actual results could differ from those estimates.
Principles of Consolidation - The consolidated financialstatements of the Company include the accounts of all ofits direct and indirect wholly-owned subsidiaries,including Selmer and Steinway. Significant intercompa-ny balances have been eliminated in consolidation.
Revenue Recognition - Revenue is generally recog-nized upon shipment. The Company provides for theestimated costs of warranties at the time of sale.
Income Taxes - Income taxes are provided using anasset and liability approach to financial accounting andreporting for income taxes. Deferred income tax assetsand liabilities are computed annually for differencesbetween the financial statement and tax bases of assetsand liabilities that will result in taxable or deductibleamounts in the future based on enacted tax laws and
rates applicable to the periods in which the differencesare expected to affect taxable income. Valuationallowances are established when necessary to reducedeferred tax assets to the amount expected to be real-ized. Income tax expense is the tax payable or refund-able for the period plus or minus the change during theperiod in deferred tax assets and liabilities.
Inventories - Inventories are stated at the lower ofcost, determined on a first-in, first-out basis, or market.In May 1995, Steinway inventories were adjusted up byapproximately $9,638 to reflect their fair market valueon the date of acquisition. Cost of sales for the yearended December 31, 1995 included the impact of thisadjustment.
Depreciation and Amortization - Property, plant andequipment are recorded at cost or at fair value in thecase of assets acquired through business acquisitions.Depreciation is provided using the straight-line methodover the estimated useful lives of the respective assets.Leasehold improvements are amortized using thestraight-line method over the estimated useful lives ofthe improvements or the remaining term of the respec-tive lease, whichever is shorter. Estimated useful livesare as follows:
Building and improvements 15-30 yearsLeasehold improvements 5-15 yearsMachinery, equipment and tooling 3-10 yearsOffice furniture and fixtures 3-10 yearsConcert and artist and rental pianos 15 years
Cost in excess of fair value of net assets acquired isamortized over 40 years. Trademarks acquired arerecorded at appraised value and are amortized over 10years. Deferred financing costs are amortized on astraight-line basis over the repayment periods of theunderlying debt.
The Company periodically evaluates the recover-ability of its long-lived assets by comparison of theexpected future undiscounted cash flows expected to begenerated by those assets to their carrying value. Todate, no impairment losses have been noted or recordedas a result of this evaluation process.
Foreign Currency Translation - Assets and liabilities ofnon-U.S. operations are translated into U.S. dollars atyear-end rates, and revenues and expenses at averagerates of exchange prevailing during the year. The resultingtranslation adjustments are reported as a separate compo-nent of stockholders' equity. Foreign currency transactiongains and losses are recognized in income currently.
15
Brought to you by Global Reports
Foreign Exchange Contracts - The Company entersinto foreign exchange contracts as a hedge against for-eign currency transactions. Gains and losses arisingfrom fluctuations in exchange rates are recognized at theend of each reporting period. Such gains and lossesdirectly offset the foreign exchange gains or lossesassociated with the hedged receivable or payable. Gainsand losses on foreign exchange contracts which exceedthe related balance sheet or firm purchase commitmentexposure are included in foreign currency gain or loss inthe statement of operations.
Stock-based Compensation - The Company accountsfor stock-based awards to employees using the intrinsicvalue method in accordance with Accounting PrinciplesBoard (APB) Opinion No. 25, "Accounting for StockIssued to Employees".
Income (Loss) per Common Share - In 1997, theCompany adopted Statement of Financial AccountingStandards (SFAS) No. 128, "Earnings Per Share". Prior to1997, the Company computed income (loss) per com-mon share using the methods outlined in APB OpinionNo. 15, "Earnings Per Share", and its interpretations.Previously reported income (loss) per common share foryears prior to 1997 did not differ materially from thatcomputed using SFAS 128.
Under SFAS 128, basic income (loss) per commonshare is computed using the weighted average numberof common shares outstanding during each year.Diluted income (loss) per common share reflects theeffect of the Company's outstanding options (using thetreasury stock method), except where such items wouldbe antidilutive.
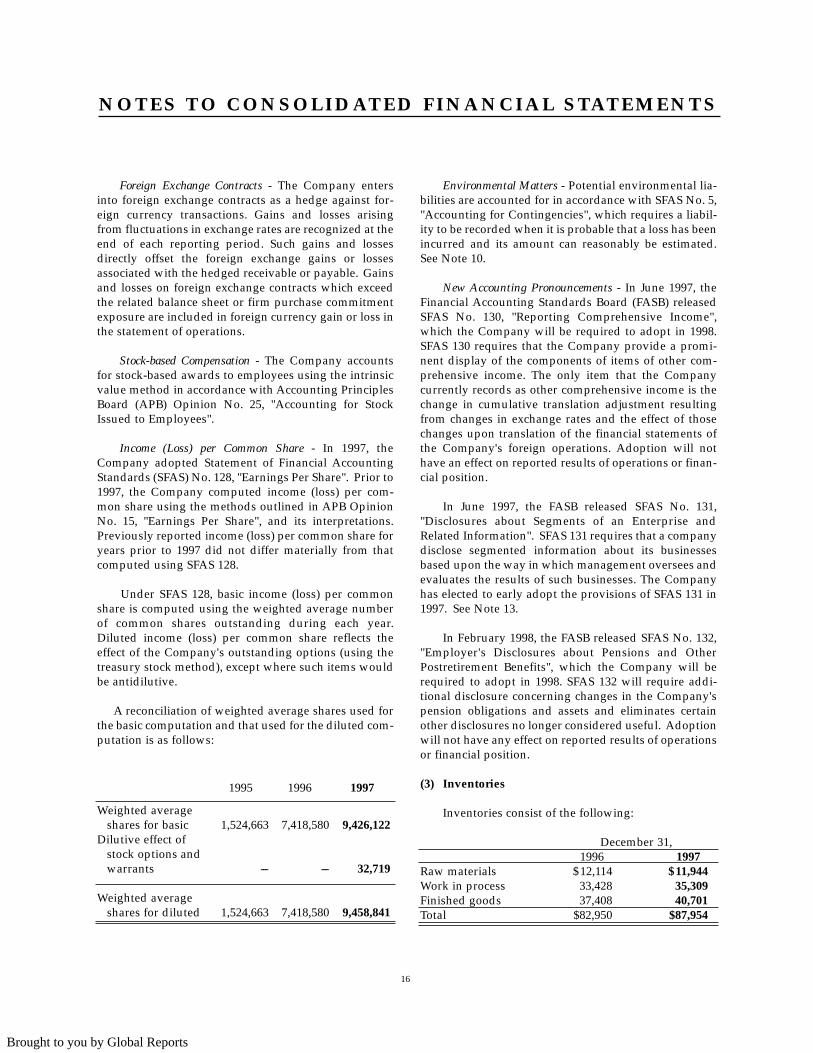
A reconciliation of weighted average shares used forthe basic computation and that used for the diluted com-putation is as follows:
1995 1996 1997
Weighted averageshares for basic 1,524,663 7,418,580 9,426,122
Dilutive effect ofstock options andwarrants --- --- 32,719
Weighted averageshares for diluted 1,524,663 7,418,580 9,458,841
Environmental Matters - Potential environmental lia-bilities are accounted for in accordance with SFAS No. 5,"Accounting for Contingencies", which requires a liabil-ity to be recorded when it is probable that a loss has beenincurred and its amount can reasonably be estimated.See Note 10.
New Accounting Pronouncements - In June 1997, theFinancial Accounting Standards Board (FASB) releasedSFAS No. 130, "Reporting Comprehensive Income",which the Company will be required to adopt in 1998.SFAS 130 requires that the Company provide a promi-nent display of the components of items of other com-prehensive income. The only item that the Companycurrently records as other comprehensive income is thechange in cumulative translation adjustment resultingfrom changes in exchange rates and the effect of thosechanges upon translation of the financial statements ofthe Company's foreign operations. Adoption will nothave an effect on reported results of operations or finan-cial position.
In June 1997, the FASB released SFAS No. 131,"Disclosures about Segments of an Enterprise andRelated Information". SFAS 131 requires that a companydisclose segmented information about its businessesbased upon the way in which management oversees andevaluates the results of such businesses. The Companyhas elected to early adopt the provisions of SFAS 131 in1997. See Note 13.
In February 1998, the FASB released SFAS No. 132,"Employer's Disclosures about Pensions and OtherPostretirement Benefits", which the Company will berequired to adopt in 1998. SFAS 132 will require addi-tional disclosure concerning changes in the Company'spension obligations and assets and eliminates certainother disclosures no longer considered useful. Adoptionwill not have any effect on reported results of operationsor financial position.
(3) Inventories
Inventories consist of the following:
December 31,1996 1997
Raw materials $12,114 $11,944Work in process 33,428 35,309Finished goods 37,408 40,701Total $82,950 $87,954
16
N O T E S T O C O N S O L I D AT E D F I N A N C I A L S TAT E M E N T S
Brought to you by Global Reports

(4) Property, Plant and Equipment, Net
Property, plant and equipment consists of thefollowing:
December 31,1996 1997
Land $17,835 $16,914Building and improvements 20,080 19,691Leasehold improvements 779 1,318Machinery, equipment
and tooling 19,526 22,036Office furniture and fixtures 5,033 5,629Concert and artist and
rental pianos 11,470 10,740Construction in progress 1,282 1,832
76,005 78,160Less accumulated depreciation
and amortization 13,904 19,531
Total $62,101 $58,629
(5) Other Assets, Net
Other assets consist of the following:
December 31,1996 1997
Trademarks $21,746 $20,146Deferred financing costs 8,504 8,504Other assets 2,044 2,897
32,294 31,547Less accumulated amortization 6,003 8,656
Total $26,291 $22,891
(6) Other Current Liabilities
Other current liabilities consist of the following:
December 31,1996 1997
Accrued payroll andrelated benefits $12,547 $13,118
Current portion of pensionliability 1,823 1,978
Accrued promotional expenses 2,834 2,600Accrued warranty expense 1,855 2,102Accrued income taxes 1,547 1,622Accrued interest 1,512 1,513Other accrued expenses 6,795 8,490
Total $28,913 $31,423
(7) Income Taxes
The components of the provision for income tax areas follows:
Year Ended December 31,1995 1996 1997
U.S. Federal:Current $12,439) $15,726) $19,361)Deferred (1,684) (935) (1,114)
U.S. State and local:Current 574) 712) 1,256)Deferred (321) (197) (147)
Foreign:Current 2,906) 5,177) 4,851)Deferred (3,078) (1,991) (1,751)
Total $11,836) $18,492) $12,456)
The Company's provision for income tax differedfrom that using the statutory U.S. federal rate as follows:
Year Ended December 31,1995 1996 1997
Statutory federal rateapplied to earningsbefore income taxes $ (433) $ 5,570 $19,155
Increase (decrease) in income taxesresulting from:Foreign income taxes(net of federal benefit) (172) 2,092 2,040
State income taxes (netof federal benefit) (49) 477 726
Valuation allowance onforeign tax credits 1,277)
Other 213) 353 535
Provision for income tax $ (836) $ 8,492 $12,456
17
Brought to you by Global Reports

The components of net deferred taxes are asfollows:
December 31,1996 1997
Deferred tax assets:Uniform capitalization
adjustment to inventory $2(2,084) $2(2,453)Allowance for doubtful accounts 1,198) 1,538)Accrued expenses and other
current assets and liabilities 4,357) 4,484)Foreign tax credits 18,777) 14,488)Other 130) ---)Valuation allowances (15,113) (12,091)
Total deferred tax assets 11,433) 10,872)
Deferred tax liabilities:Pension contributions (1,586) (1,635)Fixed assets (21,570) (18,770)Intangibles (12,584) (10,558)
Total deferred tax liabilities (35,740) (30,963)
Net deferred taxes $(24,307) $(20,091)
Valuation allowances provided relate to excess for-eign tax credits generated over expected credit absorp-tion. Of these valuation allowances, $6,373 relate to theacquisition of Steinway. Should the related tax benefits berecognized in the future, the effect of removing the valu-ation allowances would generally be a decrease in good-will. During 1996, changes in valuation allowances werecaused in part by the write-off of $3,842 of expired foreigntax credits and a reduction of $345 caused by foreigncurrency translation, offset by additional valuationallowances of $2,566 for current year credits generated forwhich realization does not appear likely. During 1997,valuation allowances decreased primarily due to thewrite-off of expired foreign tax credits. Foreign tax creditcarryforwards expire in varying amounts through 2002.
(8) Notes Payable and Long Term Debt
Notes payable and long-term debt consists of thefollowing:
December 31,1996 1997
Senior Debt, bearing interest atthe Eurodollar rate plus 2.5%due March 31, 2000 (8.65%and 8.45%) $112,573 $33333---
11% senior subordinated notes,due May 15, 2005 110,000 110,000
Note payable to a foreign bank,due in monthly installmentsof principal and interest ofDM 127 ($71 at theDecember 31, 1997 exchangerate) through June 1, 2001 atan interest rate of 6.25% 4,454 2,967
Open account loans, payableon demand to a foreign bank 1,364 2,490
Total 118,391 115,457Less current portion 2,354 3,338
Long-term debt $116,037 $112,119
Scheduled maturities of long-term debt as ofDecember 31, 1997 are as follows:
Amount1998 $113,3381999 8482000 8482001 4232002 ---Thereafter 110,000Total $115,457
The open account loans provide for borrowings byforeign subsidiaries of up to DM 25,000 ($14,000 at theDecember 31, 1997 exchange rate) payable on demand. Aportion of the open account loan can be converted into amaximum of 1,000 GBP ($1,650 at the December 31, 1997exchange rate) for use by the Company's UK subsidiaryand 363,000 yen ($2,780 at the December 31, 1997exchange rate) for use by the Company's Japanese sub-sidiary. Demand borrowings bear interest at rates of 6.0to 6.5% for the Deutsche mark loans, 8.0% for Britishpounds sterling loans, and 1.45% for Japanese yen loans.Term borrowings bear interest at Libor plus .75%.
18
N O T E S T O C O N S O L I D AT E D F I N A N C I A L S TAT E M E N T S
Brought to you by Global Reports

The Company's domestic, seasonal borrowingrequirements are accommodated through a seniorrevolving credit facility with a domestic bank (the"Facility"). The Facility provides the Company with apotential borrowing capacity of up to $60.0 million,based on eligible accounts receivable and inventory bal-ances. The Facility, as amended on January 1, 1997, bearsinterest at the Eurodollar rate plus 2.5%. Borrowings arecollateralized by the Company's domestic accountsreceivable, inventory and fixed assets. As of December31, 1997, no amounts were outstanding, and availabilitywas approximately $50.3 million.
In August 1996, the Company completed an initialpublic offering of its ordinary common stock whichraised approximately $63.1 million. After deductingexpenses of approximately $2.3 million, the Companyused the net proceeds from the offering to repay $54.6million of senior secured notes and related prepaymentpenalties of $4.5 million.
All of the Company's debt agreements contain cer-tain financial covenants which, among other things,require the maintenance of certain financial ratios andnet worth, place certain limitations on additional bor-rowings and capital expenditures, and prohibit the pay-ment of cash dividends. The Company is in compliancewith all such covenants.
(9) Stockholders' Equity
In August 1996, the Company completed an initialpublic offering of 3,570,000 shares of its ordinary com-mon stock. In conjunction with the offering, all of theCompany's outstanding preferred stock was convertedto ordinary common stock and the expiration date forexercising outstanding warrants was accelerated, so thatno preferred stock or warrants remained outstanding onDecember 31, 1996.
The Company's common stock is comprised of twoclasses: Class A and Ordinary. With the exception of dis-parate voting power, both classes are substantially iden-tical. Each share of Class A common stock entitles theholder to 98 votes. Holders of ordinary common stockare entitled to one vote per share. Class A common stockshall automatically convert to ordinary common stock if,at any time, the Class A common stock is not owned byan original Class A holder.
Employee Stock Purchase Plan - Under the 1996employee stock purchase plan (the "Purchase Plan"), theCompany is authorized to issue over a period of tenyears up to 500,000 shares of ordinary common stock toits employees, nearly all of whom are eligible to partici-pate. Under the terms of the Purchase Plan, the Boardmay make an annual offering to employees allowingthem to have up to 5% of their annual base earningswithheld through periodic payroll deductions to pur-chase the stock. The purchase price of the stock is equalto 85% of the lower of the market value at the date ofoffering or at the end of each twelve month offeringperiod. During 1997, the Company issued 29,557shares under the Purchase Plan.
Stock Plan - The 1996 stock plan (the "Stock Plan")provides for the granting of stock options (includingincentive stock options and non-qualified stockoptions), stock appreciation rights, and other stockawards to certain key employees, consultants and advi-sors of the Company and its subsidiaries. Commonstock reserved for issuance under the Stock Plan is778,250 shares.
Activity under the Stock Plan and the Purchase Planas of December 31, 1996 and 1997, and changes duringthe years ending on those dates is as follows:
1996 1997Weighted Weighted
Number Average Number Averageof Exercise of Exercise
Options Price Options PriceOutstanding at
beginning of year --- 566,990) $18.94Granted 566,990 $18.94 65,297) 19.15Exercised --- (30,557) 15.62Canceled, forfeited or
expired --- (15,000) 19.00Outstanding at end
of year 566,990 $18.94 586,730) $19.14
Options exercisableat year end --- 108,300)
Weighted average fairvalue of options grantedduring the year $6.11 $5.99
19
Brought to you by Global Reports

The following table sets forth information regarding options outstanding at December 31, 1997:
Weighted Average
Range of Number Exercise PriceNumber Exercise Currently Exercise Remaining for Currently
of Options Prices Exercisable Price Life (Years) Exercisable
12,730 $18.30 to 21.94 --- $18.30 .6 ---574,000 $18.65 to 21.94 108,300 19.16 8.6 $19.00
586,730 108,300 $19.14 8.4 $19.00
Stock-based Compensation Expense - As described inNote 2, the Company uses the intrinsic value method tomeasure compensation expense associated with grantsof stock options to employees. Had the Company usedthe fair value method to measure compensation, report-ed net income and net income per share would havebeen as follows:
1996 1997Income before
extraordinary item $7,126 $13,005Net income 2,758 13,005Basic income per
common share:Before extraordinary item $71.96 $371.38Net income .37 1.38
Diluted income percommon share:
Before extraordinary item $77.96 $371.37Net income .37 1.37
The fair value of options on their grant date, includ-ing the valuation of the option feature implicit in thePurchase Plan, was measured using the Black/Scholesoption pricing model. Key assumptions used to applythis pricing model are as follows:
1996 1997Range of risk-free
interest rates 5.64 - 6.36% 5.57% - 6.18%Range of expected
life of option grants( in years) 1 to 6 1 to 6
Expected volatility ofunderlying stock 16.4% 16.4%
The fair value of option grants made in 1996 and1997 pursuant to the Stock Plan were $6.15 and $7.61,respectively, per option. The fair value of grants madepursuant to the Purchase Plan, including the option fea-ture, were $4.04 and $4.95 in 1996 and 1997, respectively.
It should be noted that the option pricing modelwas designed to value readily tradable options with rel-atively short lives. The options granted to employees arenot tradable and have contractual lives of up to tenyears. However, management believes that the assump-tions used to value the options and the model appliedyield a reasonable estimate of the grants' "fair value" asthat term is defined by SFAS No. 123 "Accounting forStock-Based Compensation".
(10) Commitments and Contingent Liabilities
Lease Commitments - The Company has entered intovarious operating leases for certain facilities and equip-ment, some of which have noncancelable terms, expir-ing at various times through 2016 with various renewaloptions. Minimum lease payments under noncancelableleases for the years ending December 31, are as follows:
Amount1998 $22,8911999 3,3922000 3,2662001 3,0122002 2,742Thereafter 13,950Total $29,253
Rent expense was $2,202, $3,176 and $3,145 for theyears ended December 31, 1995, 1996 and 1997, respec-tively.
Notes Receivable Sold with Recourse - The Companysells notes receivable on a recourse basis to a commercialfinance company under a three-year facility. Pursuant tothe terms of the facility, the commercial finance compa-ny may, at its option, purchase at any one time up to anaggregate principal amount of $15 million of theCompany's notes receivable. The Company receivedproceeds of approximately $11.8 and $15.1 million fromthe sales of such notes for the years ended December 31,
20
N O T E S T O C O N S O L I D AT E D F I N A N C I A L S TAT E M E N T S
Brought to you by Global Reports

1996 and 1997, respectively. Approximately $7.1 and$9.2 million of these notes remain outstanding as ofDecember 31, 1996 and 1997, respectively.
Environmental Matters - Certain environmental mat-ters are pending against the Company, which mightresult in monetary damages, the amount of which, ifany, cannot be determined at the present time. PhilipsElectronics, a previous owner of the Company, hasagreed to hold the Company harmless from any finan-cial liability arising from these environmental matterswhich were pending as of December 29, 1988.Management believes that these matters will not have amaterial adverse impact on the Company's results ofoperations or financial condition.
Litigation - In the ordinary course of its business, theCompany is party to various legal actions that manage-ment believes are routine in nature and incidental to theoperation of its business. While the outcome of suchactions cannot be predicted with certainty, managementbelieves that, based on the experience of the Companyin dealing with these matters, the ultimate resolution ofthese matters will not have a material adverse impact onthe business, financial condition and results of opera-tions or prospects of the Company.
(11) Retirement Plans
Domestic Plans - The Company has a noncontributo-ry defined benefit pension plan (the "Selmer Plan") inwhich all eligible employees may participate. OnDecember 31, 1995, Steinway's defined benefit pensionplan was merged with the Selmer Plan. The Company'sfunding policy is to contribute the minimum requiredcontribution for each plan year by the fifteenth day ofthe month following each quarter plus the balance of theminimum required contribution for the plan year by thefollowing September 15. Plan assets are invested pri-marily in common stocks and fixed income securities.
The components of net pension expense are as fol-lows:
Year Ended December 31,1995 1996 1997
Service cost - benefitsearned during the year $1,651 $1837 $1,943
Interest cost on projectedbenefit obligation 739 1,102 1,355
Return on plan assets (993) (1,776) (3,121)Net amortization 621 814 2,069Net pension expense $1,018 $1977 $1,246
The funded status of the pension plan is as follows:
December 31,1996 1997
Accumulated benefit obligation(including vested benefit obligation of approximately$14,175 and $17,469 atDecember 31, 1996 and 1997,respectively) $14,711) $19,683)
Projected benefit obligation $15,620) $20,678)Plan assets at fair value 14,883) 19,066)Projected benefit obligation
in excess of plan assets 737) 1,612)Unrecognized net gain 1,097) 1,051)Unrecognized prior service cost (776) (2,010)Recognition of minimum liability 629)
Net accrued pension cost 1,058) 1,282)Less amount currently payable 1,058) 1,282)
Net long-term accrued pension cost $2222---) $2222---)
The projected benefit obligation was determinedusing an assumed discount rate of 7.5% and 7.0% in 1996and 1997, respectively. The assumed long-term rate ofcompensation increase was 4%. The assumed long-termrate of return on plan assets was 8.5%.
The Company also sponsors 401(k) retirement sav-ings plans for eligible employees. Discretionary employ-er contributions, as determined annually by the Board ofDirectors, are made to one of these plans. The 1996 and1997 contribution approximated $327 and $368, respec-tively.
The Company provides postretirement health careand life insurance benefits to eligible hourly retirees andtheir dependents. The health care plan is contributory,with retiree contributions adjusted every three years aspart of a union contract agreement. The plans areunfunded and the Company pays part of the health carepremium and the full amount of the life insurance cost.
Effective January 1, 1994 the Company adoptedSFAS No. 106, "Employers' Accounting forPostretirement Benefits Other Than Pensions". SFAS No.106 requires recognition, during employees' service withthe Company, of the cost of their retiree health and lifeinsurance benefits. In accordance with the Statement,the Company has elected to recognize this change inaccounting over a twenty-year period.
21
Brought to you by Global Reports
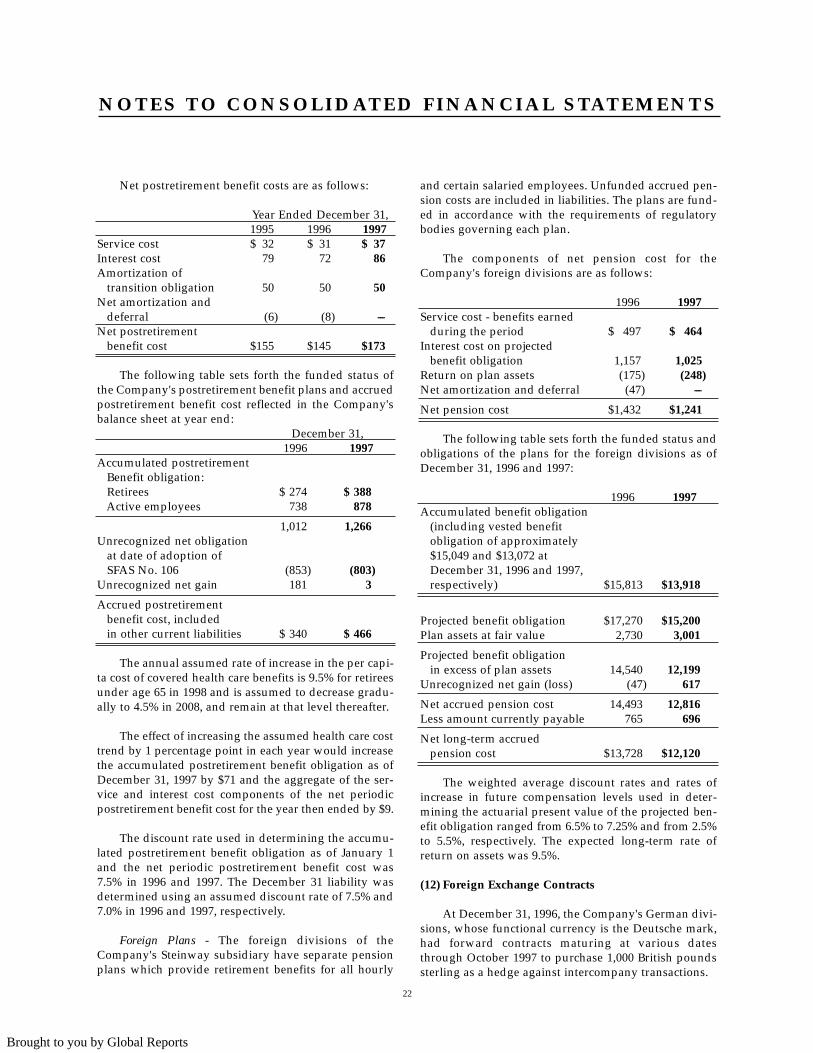
Net postretirement benefit costs are as follows:
Year Ended December 31,1995 1996 1997
Service cost $132) $131) $137Interest cost 79) 72) 86Amortization of
transition obligation 50) 50) 50Net amortization and
deferral (6) (8) ---Net postretirement
benefit cost $155) $145) $173
The following table sets forth the funded status ofthe Company's postretirement benefit plans and accruedpostretirement benefit cost reflected in the Company'sbalance sheet at year end:
December 31,1996 1997
Accumulated postretirementBenefit obligation:Retirees $(274( $(388(Active employees 738( 878(
1,012( 1,266(Unrecognized net obligation
at date of adoption ofSFAS No. 106 (853) (803)
Unrecognized net gain 181( 3(
Accrued postretirementbenefit cost, includedin other current liabilities $(340( $(466(
The annual assumed rate of increase in the per capi-ta cost of covered health care benefits is 9.5% for retireesunder age 65 in 1998 and is assumed to decrease gradu-ally to 4.5% in 2008, and remain at that level thereafter.
The effect of increasing the assumed health care costtrend by 1 percentage point in each year would increasethe accumulated postretirement benefit obligation as ofDecember 31, 1997 by $71 and the aggregate of the ser-vice and interest cost components of the net periodicpostretirement benefit cost for the year then ended by $9.
The discount rate used in determining the accumu-lated postretirement benefit obligation as of January 1and the net periodic postretirement benefit cost was7.5% in 1996 and 1997. The December 31 liability wasdetermined using an assumed discount rate of 7.5% and7.0% in 1996 and 1997, respectively.
Foreign Plans - The foreign divisions of theCompany's Steinway subsidiary have separate pensionplans which provide retirement benefits for all hourly
and certain salaried employees. Unfunded accrued pen-sion costs are included in liabilities. The plans are fund-ed in accordance with the requirements of regulatorybodies governing each plan.
The components of net pension cost for theCompany's foreign divisions are as follows:
1996 1997Service cost - benefits earned
during the period $1,497) $1,464)Interest cost on projected
benefit obligation 1,157) 1,025)Return on plan assets (175) (248)Net amortization and deferral (47) ---)
Net pension cost $1,432) $1,241)
The following table sets forth the funded status andobligations of the plans for the foreign divisions as ofDecember 31, 1996 and 1997:
1996 1997Accumulated benefit obligation
(including vested benefitobligation of approximately$15,049 and $13,072 atDecember 31, 1996 and 1997,respectively) $15,813) $13,918
Projected benefit obligation $17,270) $15,200Plan assets at fair value 2,730) 3,001
Projected benefit obligationin excess of plan assets 14,540) 12,199
Unrecognized net gain (loss) (47) 617
Net accrued pension cost 14,493) 12,816Less amount currently payable 765) 696
Net long-term accruedpension cost $13,728) $12,120
The weighted average discount rates and rates ofincrease in future compensation levels used in deter-mining the actuarial present value of the projected ben-efit obligation ranged from 6.5% to 7.25% and from 2.5%to 5.5%, respectively. The expected long-term rate ofreturn on assets was 9.5%.
(12) Foreign Exchange Contracts
At December 31, 1996, the Company's German divi-sions, whose functional currency is the Deutsche mark,had forward contracts maturing at various datesthrough October 1997 to purchase 1,000 British poundssterling as a hedge against intercompany transactions.
22
N O T E S T O C O N S O L I D AT E D F I N A N C I A L S TAT E M E N T S
Brought to you by Global Reports

At December 31, 1997, these instruments, maturingat various dates through December 1998, consisted offorward contracts and purchased options to sell 430,900Japanese yen and 1,060 British pounds sterling and tobuy 3,195 U.S. dollars. The Company uses only pur-chased options as part of this hedging program.
(13) Segment Information
The Company has elected to early adopt the provi-sions of SFAS No. 131 "Disclosures about Segments of anEnterprise and Related Information" in 1997. SFAS 131requires that a company disclose segmented informa-tion about its businesses based upon the way in which
management oversees and evaluates the results of suchbusinesses. Consistent with this approach, the Companyhas identified two distinct and reportable segments: thepiano segment and the band and orchestral instrumentsegment. The Company considers these two segmentsreportable under SFAS 131 criteria as they are managedseparately and the operating results of each segment areregularly reviewed and evaluated separately by theCompany's senior management.
The accounting policies of each segment are thesame as those described in Note 2. Intercompany trans-actions are generally recorded at cost plus a predeter-mined markup.
1995 Piano Segment Band and Orchestral Segment Other & ConsolUS Germany Other Total US Other Total Elim Total
Revenues from externalcustomers $43,352) $33,718 $13,828) $180,898) $104,917 $3,990 $108,907 $ ---) $189,805)
Interest revenue ---) 21 1) 22) 561 --- 561 ---) 583)Interest expense 5,209) 426 138) 5,773) 9,150 --- 9,150 ---) 14,923)Depreciation and amortization 2,650) 1,864 79) 4,593) 3,146 --- 3,146 ---) 7,739)Income tax expense (benefit) (2,014) 222 69) (1,723) 2,530 29 2,559 ---) 836)Segment net income (loss) (4,057) (1,346) 131) (5,272) 3,138 60 3,198 ---) (2,074)Capital expenditures 810) 603 70) 1,483) 1,639 40 1,679 ---) 3,162)Segment assets 93,613) 80,101 3,682) 177,396) 190,101 3,496 193,597 (107,197) 263,796)
1996 Piano Segment Band and Orchestral Segment Other & ConsolUS Germany Other Total US Other Total Elim Total
Revenues from externalcustomers $77,245) $52,538 $16,531) $136,314) $118,030 $3,559 $121,589 $ ---) $257,903)
Interest revenue ---) 60 4) 64) 8,888 --- 8,888 (8,189) 763)Interest expense 8,904) 750 (127) 9,527) 19,257 --- 19,257 (10,914) 17,870)Depreciation and amortization 4,553) 3,070 126) 7,749) 3,205 15 3,220 1) 10,970)Income tax expense (benefit) (838) 3,501 276) 2,939) 4,611 17 4,628 925) 8,492)Segment net income (loss)
before extraordinary items (1,458) 1,234 407) 183) 5,548 26 5,574 1,664) 7,421)Extraordinary items ---) --- ---) ---) 4,368 --- 4,368 ---) 4,368)Capital expenditures 1,832) 264 59) 2,155) 3,044 --- 3,044 ---) 5,199)Segment assets 91,451) 75,117 4,866) 171,434) 260,353 3,057 263,410 (169,478) 265,366)
1997 Piano Segment Band and Orchestral Segment Other & ConsolUS Germany Other Total US Other Total Elim Total
Revenues from externalcustomers $91,173) $40,575 $13,531) $145,279) $128,780 $3,789 $132,569 $ ---) $277,848)
Interest revenue -) 141 20) 161) 567 - 567 ---) 728)Interest expense 9,269) 225 283) 9,777) 19,228 - 19,228 (15,501) 13,504)Depreciation and amortization 4,577) 2,621 164) 7,362) 3,173 14 3,187 32) 10,581)Income tax expense 1,544) 2,358 430) 4,332) 2,492 61 2,553 5,571) 12,456)Segment net income (loss) (577) 2,018 721) 2,162) 2,277 110 2,387 9,151) 13,700)Capital expenditures 1,919) 389 276) 2,584) 3,013 - 3,013 37) 5,634)Segment assets 89,502) 60,595 9,046) 159,143) 273,651 2,721 276,372 (168,807) 266,708)
The following tables present information about the Company's operating segments:
23
Brought to you by Global Reports

(14) Disclosures about Fair Values of Financial(15) Instruments
The following disclosures of the estimated fair val-ues of financial instruments are made in accordancewith the requirements of SFAS No. 107 "Disclosuresabout Fair Values of Financial Instruments". The esti-mated fair values have been developed using appropri-ate methodologies; however, considerable judgment isrequired to develop these estimates. Accordingly, theestimates presented herein are not necessarily indicativeof amounts that could be realized in a current marketexchange. Use of different assumptions or methodolo-gies could have a significant effect on these estimates.
1996 1997Net Carrying Estimated Net Carrying Estimated
Value Fair Value Value Fair ValueFinancial liabilities
Notes payable andlong term debt $118,391 $128,401) $115,457 $125,266
Foreign currencycontracts 0 (143) 0 350
The carrying amount of cash, accounts, notes andleases receivable, and accounts payable approximate fairvalue because of the short maturity of these instruments.
The estimated fair value of existing notes payableand long-term debt is based on rates currently availableto the Company for debt with similar terms and remain-ing maturities.
The estimated fair value of foreign currency con-tracts (used for hedging purposes) has been determinedas the difference between the current spot rate and thecontract rate multiplied by the notional amount of thecontract or upon the estimated fair value of purchasedoption contracts. The net carrying value of these con-tracts approximates zero as any gains or losses on thecontracts is generally offset by losses or gains on therelated hedged asset or liability.
(15) Related Party Transactions
The principals of Kirkland Messina LLC, a merchantbanking firm, control 84% of the voting power of theCompany's common stock. Kirkland Messina LLC
received payments of $750 in 1995 for arranging thefinancing and acting as financial advisor to the Companyin connection with the Steinway acquisition and $1.0 mil-lion in 1996 for arranging, negotiating and obtainingwaivers and other required consents in connection withthe Company's initial public offering. In addition, begin-ning in 1996, Kirkland Messina LLC and its principalsreceived annual payments of $400 for ongoing manage-ment and other services to the Company.
(16) Quarterly Financial Data (Unaudited)
The following is a summary of unaudited results ofoperations (in thousands except per share data) for theyears ended December 31, 1996 and 1997.
Year Ended December 31, 1996First Second Third Fourth
Quarter Quarter Quarter Quarter
Net sales $ 69,049 $ 64,367 $ 61,460) $ 63,027Gross profit 21,720 20,967 19,662) 21,886
Net income beforeextraordinary item 1,581 1,710 1,200) 2,930
Extraordinary item --- --- (4,368) ---
Net income (loss) $6 1,581 $ 61,710 $ (3,168) $ 62,930
Income (loss) percommon share,basic and diluted:Income before
extraordinary item $ 333.27 $ 333.29 $ 333.14) $ 333.31Extraordinary item --- --- (.52) ---
Net income (loss) $ 333.27 $ 333.29 $333(.38) $ 333.31
Weighted averagecommon shares,basic and diluted 5,957,127 5,957,127 8,337,127 9,422,937
Year Ended December 31, 1997First Second Third Fourth
Quarter Quarter Quarter QuarterNet sales $ 73,726 $ 69,775 $ 64,554) $ 69,793Gross profit 23,621 23,041 21,246) 25,373Net income $ 73,438 $6 3,466 $ 62,702) $ 64,094
Basic income percommon share $ 333.36 $ 333.37 $ 333.29) $ 333.43
Diluted incomeper common share .36 .37 .28) .43
Weighted averagecommon shares:Basic 9,422,937 9,422,937 9,438,852) 9,419,763Diluted 9,422,937 9,422,937 9,504,485) 9,527,650
24
N O T E S T O C O N S O L I D AT E D F I N A N C I A L S TAT E M E N T S
Brought to you by Global Reports

Kyle R. Kirkland Chairman of the Board and Director
Dana D. Messina Chief Executive Officer and Director
Thomas T. Burzycki President-Selmer and Director
Bruce A. Stevens President-Steinway and Director
Dennis M. Hanson Chief Financial Officer
Michael R. Vickrey Executive Vice President
Thomas Kurrer Managing Director, Steinway-Germany
Peter McMillan Director; Executive Vice President and ChiefInvestment Officer of SunAmerica Investments, Inc.
General CounselMilbank, Tweed, Hadley & McCloy
Independent AuditorsDeloitte & Touche LLP
Transfer Agent And RegistrarContinental Stock Transfer & Trust Company
SEC Form 10-KA copy of the Company’s Annual Report on Form 10-K, as filed with the Securities
and Exchange Commision, will be supplied without charge to any shareholder uponwritten request to the office of Investor Relations, Steinway Musical Instruments, Inc.,800 South Street, Suite 425, Waltham, MA 02154-1439, or via the internet atwww.steinwaymusical.com.
Market and Dividend InformationThe ordinary common stock of the Company began trading in August 1996 (subsequent
to an initial public offering) on the New York Stock Exchange (“NYSE”) under the sym-bol “LVB”. The following table sets forth for the period indicated, the high and low clos-ing sales price per share of the ordinary common stock as reported on the NYSE. Prior tothe offering in August 1996, no established public trading market existed.
High LowFiscal Year Ended December 31, 1996
Third Quarter $19.00 $16.38Fourth Quarter 18.38 16.13
Fiscal Year Ended December 31, 1997First Quarter $19.88 $17.00Second Quarter 19.63 15.25Third Quarter 24.25 19.19Fourth Quarter 25.00 22.00
The Company’s common stock is comprised of two classes: Class A and Ordinary. Withthe exception of disparate voting power, both classes are substantially identical. As ofFebruary 27, 1998, there were 276 holders of record and approximately 1,700 beneficalowners of the Company’s ordinary common stock and two holders of record of the ClassA common stock.
The Company has paid no dividends since its inception and intends to continue its pol-icy of retaining earnings to finance future growth. See Note 8 of Notes to ConsolidatedFinancial Statements regarding limitations on the payment of dividends.
O F F I C E R S A N D D I R E C T O R S
DE
SIG
N:G
RE
CO
& E
MM
I G
RO
UP,
INC
. N
.Y./M
ASS
.
Brought to you by Global Reports

STEINWAY MUSICAL INSTRUMENTS, INC.
Brought to you by Global Reports