stephen anak nyambar
TRANSCRIPT

LONG STORAGE AS WATER SOURCE FOR SARAWAK RIVER
BASIN
Stephen Anak Nyambar
Bachelor of Engineering with Honours
(Civil Engineering)
2009
Faculty of Engineering
Faculty of Resource Science and Technology

UNIVERSITI MALAYSIA SARAWAK
R13a
BORANG PENGESAHAN STATUS TESIS
Judul: LONG STORAGE AS WATER SOURCE FOR SARAWAK RIVER BASIN
SESI PENGAJIAN: 2008/2009
Saya STEPHEN ANAK NYAMBAR
(HURUF BESAR)
mengaku membenarkan tesis * ini disimpan di Pusat Khidmat Maklumat Akademik, Universiti Malaysia Sarawak
dengan syarat-syarat kegunaan seperti berikut:
1. Tesis adalah hakmilik Universiti Malaysia Sarawak.
2. Pusat Khidmat Maklumat Akademik, Universiti Malaysia Sarawak dibenarkan membuat salinan untuk
tujuan pengajian sahaja.
3. Membuat pendigitan untuk membangunkan Pangkalan Data Kandungan Tempatan.
4. Pusat Khidmat Maklumat Akademik, Universiti Malaysia Sarawak dibenarkan membuat salinan tesis ini
sebagai bahan pertukaran antara institusi pengajian tinggi.
5. ** Sila tandakan ( ) di kotak yang berkenaan
SULIT (Mengandungi maklumat yang berdarjah keselamatan atau kepentingan
Malaysia seperti yang termaktub di dalam AKTA RAHSIA RASMI 1972).
TERHAD (Mengandungi maklumat TERHAD yang telah ditentukan oleh organisasi/
badan di mana penyelidikan dijalankan).
TIDAK TERHAD
Disahkan oleh
(TANDATANGAN PENULIS) (TANDATANGAN PENYELIA)
Alamat tetap: Lot 5241, Jalan Maigold,
Phase 3C, Taman Desa Senadin
98000 Miri Sarawak MR. CHARLES BONG HIN JOO
Nama Penyelia
Tarikh: Tarikh:
CATATAN * Tesis dimaksudkan sebagai tesis bagi Ijazah Doktor Falsafah, Sarjana dan Sarjana Muda.
** Jika tesis ini SULIT atau TERHAD, sila lampirkan surat daripada pihak berkuasa/organisasi
berkenaan dengan menyatakan sekali sebab dan tempoh tesis ini perlu dikelaskan sebagai
SULIT dan TERHAD.

This Final Year Project attached here:
Title : Long storage as water source for Sarawak River basin
Student Name : Stephen Anak Nyambar
Matric No : 15327
has been read and approved by:
__________________________ ______________________
Mr. Charles Bong Hin Joo Date
(Supervisor)

Dedicated to my beloved parents and all of my friends
Thank you for your support

ACKNOWLEDGEMENT
First of all, I would like to express my heartiest appreciation and gratefulness
to my supervisor, Mr. Charles Bong for his advice, guidance and support throughout
this research.
I would like to take this opportunity to express my sincere gratitude to my
beloved parents and loved ones for their continual love, advice, moral and financial
support. I also would like to thank my close friends, course-mates and family
members for their help and support in accomplishing this research.
Finally, I also would like to thank these agencies for giving their full
cooperation in guiding me towards completing my Final Year Project: Department of
Irrigation and Drainage Sarawak (DIDS), Kuching Water Board (KWB) and
Sarawak River Board (SRB). Thank you very much.

ABSTRACT
This study was used to analyze the capacities of water needs for Kuching City
that calculated from two major daily usages such as treated water demand and
flushing water demand in Sarawak River basin. It also used to determine the capacity
of available water supply at this basin based on the area selected. The area of this
study will be divided into two locations consist of Git at Sarawak River Kiri and
Buan Bidi at Sarawak River Kanan while the study of water demand sources
including the capacities of water produced from Batu Kitang Treatment Plant and
also the total discharge used for flushing operations at Kuching Barrage. These
locations were selected based on the factor of the location suitability to construct a
long storage, locations of water level recorder stations and the maximum water level
height of the selected river. The analyses of the Sarawak River basin include the
analysis of mean daily stage water level at Buan Bidi Station and Git Station, river
cross sections and the suitable location to construct a long storage. Rippl’s Diagram
method or mass curve method was used to determine the required water storage of
the selected river. The capacity of the required water storage obtained from this
analysis would be used as a design consideration of the proposal to construct a long
storage in Sarawak River basin.

ABSTRAK
Kajian ini bertujuan untuk mengalisis jumlah kandungan air bagi keperluan
Bandaraya Kuching yang dikira berdasarkan dua kegunaan utama harian dan jumlah
air yang diperlukan untuk operasi perbersihan air sungai di Sungai Sarawak basin.
Kajian ini juga bertujuan untuk mengenalpasti jumlah kandungan air yang terdapat di
basin ini berdasarkan kawasan yang telah ditetapkan. Kawasan kajian ini terbahagi
kepada dua lokasi terdiri daripada Git di Sungai Sarawak Kiri dan Buan Bidi di
Sungai Sarawak Kanan manakala kajian untuk kandungan sumber air keperluan
daripada penghasilan air terawat daripada Pusat Rawatan Air Batu Kitang dan juga
jumlah pengaliran air semasa operasi pembersihan air sungai di “Kuching Barrage”.
Lokasi tersebut telah dipilih berdasarkan faktor kesesuaian lokasi untuk membina
“long storage”, lokasi stesen perakam paras air dan ketinggian paras air maksima di
stesen yang telahpun ditetapkan. Analisis terhadap basin Sungai Sarawak
termasuklah analisis untuk purata peringkat harian paras air di Stesen Buan Bidi dan
Stesen Git, keratan rentas sungai dan lokasi yang sesuai untuk membina “long
storage”. “Rippl’s Diagram method” dan “Mass Curve method” digunakan untuk
mengenalpasti simpanan air diperlukan di lokasi yang telah ditetapkan. Kandungan
air diperlukan bagi sungai tersebut akan digunakan sebagai faktor pertimbangan
dalam merekabentuk “long storage” di basin Sungai Sarawak.

TABLE OF CONTENTS
Page(s)
Acknowledgement i
Abstract ii
Abstrak iii
List of Table vii
List of Figure viii
List of Abbreviation x
CHAPTER 1 INTRODUCTION
1.1 General Overview 1
1.2 Problem statement 3
1.3 Objective 3
1.4 Scope of work 4
1.5 Outline of the project 4
CHAPTER 2 LITERATURE REVIEW
2.1 Water 5
2.1.1 Recorded volume of treated water
used in Kuching City
5
2.1.2 Water treatment plant in Sarawak
River
7
2.2 Water Regulation Structures in Sarawak
River Basin
9
2.2.1 Batu Kitang Submersible Weir 10
2.2.2 Kuching Barrage 12
2.2.3 Bengoh Dam 16
2.3 Water Issues in Sarawak River Basin 19
2.3.1 Impacts of Kuching Barrage
flushing and flooding operations
19
2.4 Studies on Water Balance Analysis 20
2.4.1 Usage of Water Balance Analysis in 20

determine the water storage
2.5 Method to solve Water Crisis 29
2.5.1 Use of Long storage to solve water
crisis
29
2.5.2 Rippl’s Diagram method or Mass
Curve method
33
CHAPTER 3 METHODOLOGY
3.1 Introduction 42
3.2 Data Collection 44
3.2.1 Analysis water level data 45
3.2.2 Analysis water demands volume 45
3.2.3 Plotting mass curve diagram 47
3.2.4 Analysis mass curve diagram 48
3.2.5 Determine proposed long storage
stretch.
49
3.2.6 Results and analysis 50
3.2.7 Discussions 50
3.2.8 Conclusion 50
CHAPTER 4 RESULTS, ANALYSIS AND DISCUSSIONS
4.1 Introduction 51
4.2 Determination of analyses stations 51
4.3 Analyses period determination 52
4.4 Water Level Determination 53
4.5 Discharge determination 53
4.6 Discharge unit conversion 54
4.7 Water demand calculation 57
4.8 Treated water 58
4.8.1 Discharge of water at Batu Kitang
Treatment Plant
58

4.8.2 Cumulative maximum monthly
discharge
60
4.8.3 Cumulative average monthly
discharge
61
4.8.4 Cumulative minimum monthly
discharge
62
4.8.5 Discharge of flushing operations at
Kuching Barrage
63
4.9 Water demand discharge comparison 64
4.9.1 Comparison between maximum
water demand discharge and
available water supply discharge
65
4.9.2 Comparison between average water
demand discharge and available
water supply discharge
67
4.9.3 Comparison between minimum
water demand discharge and
available water supply discharge
68
4.10 Mass Curve 70
4.10.1 Selecting location for long storage 72
4.10.2 Proposed long storage at Sarawak
River Kanan
77
4.10.3 Long storage structure design 78
CHAPTER 5 CONCLUSION AND
RECOMMENDATIONS
5.1 Conclusion 81
5.2 Recommendation 83
REFERENCES 84
APPENDICES 87

LIST OF TABLES
Page(s)
Table 1: Water production around Kuching till year 2003 6
Table 2: Data and computations for the reservoir capacity 39
Table 3: Location, type of data collected and equipment used to collect data 44
Table 4: Total monthly water level of Git station and Buan Bidi station in year
2001
48
Table 5: Station and rating curve equation 54
Table 6: Average daily water production in 2001 at Batu Kitang Treatment plant 58
Table 7: Maximum daily discharge for water demand in year 2001 65
Table 8: Average daily discharge for water demand in year 2001 67
Table 9: Minimum daily discharge for water demand in year 2001 68
Table 10: Characteristic of proposed long storage at Sarawak River Kanan 77

LIST OF FIGURES
Page(s)
Figure 1: Sarawak River (Sungai Sarawak) basin 2
Figure 2: Initial bounded area of water supply in Kuching City 8
Figure 3: Batu Kitang Water Treatment Plant main building 9
Figure 4: Imagery of Batu Kitang Treatment Plant and Batu Kitang
submersible weir
10
Figure 5: Submersible weir at Sungai Sarawak Kiri downstream Batu Kitang
Treatment plant
11
Figure 6: Armour stones at Batu Kitang submersible weir 12
Figure 7: Locality plan of Kuching Barrage 13
Figure 8: Discharge through barrage gates during flushing operation 14
Figure 9: Side view of ship lock along side of the barrage 15
Figure 10: Layout of Sarawak barrage with a ship lock 15
Figure 11: Side view of 5 radial gates at Kuching Barrage 16
Figure 12: View of Bengoh dam construction site 18
Figure 13: Model of Bengoh Dam structures 18
Figure 14: Cumulative Frequency Distribution of Wet Weather Storage
Requirements, Briar Chapel Subdivision
26
Figure 15: Groundwater and Lake Level for Selected Wells in the Study Area 28
Figure 16: Annual water budget of Devils Lake 28
Figure 17: Location of Indramayu City 30
Figure 18: The Bojongsari long storage is located at Sub District Indramayu 31
Figure 19: Bojongsari Storage Pumped for Home Industry 31
Figure 20: Source of water from drainage channel of Margawati Long storage 32
Figure 21: Storage Water Pumped For Irrigation 33
Figure 22: Mass curve and water demand lines 34
Figure 23: Reservoir capacity-yield estimation 35
Figure 24: Rippl diagram for storage analysis 37
Figure 25: Alternative mass for storage analysis 41
Figure 26: Methodology flow chart 43
Figure 27: Location of water level and water level recorder station selected 44
Figure 28: Kuching Barrage during flushing operation in low tide 47

Figure 29: Mass curve diagram 48
Figure 30: Elevation of proposed long storage at Sarawak River 49
Figure 31: Cumulative monthly discharge at Buan Bidi station in year 2001 55
Figure 32: Cumulative monthly discharge at Git station in year 2001 56
Figure 33: Cumulative discharge of Batu Kitang Treatment Plant in year 2001 60
Figure 34: Cumulative average monthly discharge of Batu Kitang Treatment
Plant in year 2001
61
Figure 35: Cumulative minimum monthly discharge of Batu Kitang Treatment
Plant in year 2001
62
Figure 36: Cumulative monthly discharge of Kuching Barrage in year 2001 64
Figure 37: Cumulative maximum discharge of water demand and available
water supply discharge
66
Figure 38: Cumulative average discharge of water demand and available water
supply discharge
67
Figure 39: Cumulative minimum discharge of water demand and available
water supply discharge
69
Figure 40: Mass curve 71
Figure 41: Location of proposed long storage at Sarawak River Kanan 73
Figure 42: Upstream cross section 74
Figure 43: Downstream cross section 75
Figure 44: Layout of proposed checkgate structures at Sarawak River Kanan 79

LIST OF ABBREVIATIONS
DEM - Digital Elevation Model
DIDS - Department of Irrigation and Drainage Sarawak
GIS - Geographic Information System
KWB - Kuching Water Board
MLD - Mega Liter per day
PET - Potential Evapotranspiration
SRBM - Sarawak River Board Management
SRO - Surface Runof
SWAT - Soil and Water Assessment Tools
TSS - Total Suspended Solid

CHAPTER 1
INTRODUCTION
1.1 General Overview
Sarawak is the largest state in Malaysia and has almost 2.47 million of residents.
Some of these residents live at the coastal areas of Sarawak. In Sarawak itself, there
are almost 21 major river basins in all the areas. The area of Sarawak River basin is
about 2375 km2 and the total length of the main river is about 120 km. The selected
area for this study was focus on the Sarawak River basin. Sarawak River is one of the
river basins which are located in the south of Sarawak. Sarawak River flows through
the City of Kuching dividing it into two major rivers called Sarawak River Kiri
(Sungai Sarawak Kiri) and Sarawak River Kanan (Sungai Sarawak Kanan).
The importance of Sg. Sarawak is to provide a water supply to all the major
parts in Kuching City. The water will be processed at Water Treatment Plant at Batu
Kitang before it is distributed to the other places. It provides water drinking water
supply and also for daily use at the resident area houses, shop houses, schools, office
buildings and factories. Besides, it’s important as a navigation channel in Kuching in
order to develop an interesting port in this city. Kuching Port is one of the largest
ports in Malaysia. The river also used as water-related sport activities that can attract
tourist into our country such as Sarawak Regatta. It also functions as flood mitigation
during wet season. Sarawak River collects water from the drain and also the small
rivers that are connected to this river before it flows to the downstream.

Figure 1: Sarawak River (Sungai Sarawak) basin (DIDS, 2008)
1.2 Problem Statement
The problem that might occurred in Sarawak River during the dry season is the
amount of water storage is low and not enough to support the water demand in
Kuching City such as water drinking supply and flushing water source. The amount
of water demand will be increase due to the increase of population growth in this
city. Besides that, it will also affect the navigation activities in this river and also the

economy of this city. The reason is because it will decrease the number of ship that
could use this river during dry season. Other than that, the river activities cannot be
done because of the low level of water in this river. The number tourists that come to
this city may be decrease because of the river activities is one of the medium that can
attract peoples into this country.
1.3 Objective
The purpose of this study is to investigate and study the Sarawak River basin
before selecting the suitable location of long storage as water source for the basin
and to reduce the water problem during dry season. Besides, it is also to investigate
the capacity of water needed during dry season and the capacity of water in Sarawak
River. Other than that, to make sure that the water demand in this city is enough to
support the entire daily used of the resident.
1.4 Scope of Work
This study will be carried out at Sarawak River (Sg. Sarawak).The scope of
work of this study are:
a) To study the water demand or water requirement of Sarawak River.
b) To study the capacity of the water store in Sarawak River.
c) To study the suitable location to construct the long storage in Sarawak River.

1.5 Outline of the Project
The further information about the details of the Sarawak River will be explained
in the next chapter. The information will be referred to the results of the research that
have been done about Sarawak River basin. The literature will covered all the facts
that related to the objective given.

CHAPTER 2
LITERATURE REVIEW
2.1 Water
Water is the most common marvelous substance on our earth. Almost 70
percent of our earth surfaces were covered by water. It is the only substance on earth
that can be presented naturally into three forms such as liquid, solid and gas. Water
can be reused over and over again (Wurbs and James, 2002). In rural areas, the
sources of water are obtained from nearby rivers, community wells, or irrigation
ditches Almost 92 percent of the urban population and only 68 percent of rural
population has access to water service based on the estimated value (Levinson,
2007). In Sarawak, water is used as one of the major development assets. It is about
460 billion m3 of available water and other 41.2% is evaporate to the atmosphere
which 52.3% and 6.5% appears as surface runoff and goes to recharge ground water
respectively. There is about 3500 to 4000 mm of the average rainfall in Sarawak
(Memon and Mohamed, 1999).
2.1.1 Recorded volume of treated water used in Kuching City
The existing water capacity in Kuching is about 786 mega liters per day (MLD)
in the year of 2007 and the total volume of the water demand used is about 635 MLD
and the amount of water is expected to last until 2010. The water demand will be

increase due to the increase of population in Kuching City. The number of
population in Kuching is about 810,000 including Kuching City North, Kuching City
South and Padawan consist of 3rd
mile, 7th
mile and 10th
(Mail, 2007). The Water
Works Web Team (2003) has reported that the capacities of water supplies produce
in Kuching are as shown in the following table:
Table 1: Water production around Kuching till year 2003 (Mail, 2007)
Location of water treatment plant Average daily production , (MLD)
ASAJAYA 8
SERIAN 9
SIMUNJAN 5
SEBUYAU 3.2
BALAI RINGIN 1.95
GEDONG 1.364
TEBAKANG 0.955
TEBEDU 0.655
TRIBOH 0.273

2.1.2 Water treatment plant in Sarawak River
Batu Kitang Treatment Plant is a treatment plant that situated at Sungai Sarawak
Kiri which is 750 m away from the river (Salim et al, 2008). Batu Kitang is located
about 40 miles from the sea (KWB, 2008). The water was pumped and treated at
Batu Kitang Treatment Plant before distributed into many locations in Kuching City.
This plant has been constructed since year 1957 and in the middle of the year 1995,
the average daily production of this plant had already exceeded 190 MLD. There is
about 64000 consumers were supplied by this treated water demand (Salim et al,
2008). Recently, Batu Kitang has been supplies almost 98% of the total water
production for Kuching City. There are more than 90% of the areas in Kuching City
that have the benefit of treated water supply with the estimated population is about
530000. In year 2000, the average of daily consumption increased 1.5% from 265
MLD to 269 MLD in 2001. Initially the total area of supply in Kuching is only 44.8
km2 (17.3 sq. miles). This area will be increase for every year to provide the water
demand for new development. The area of supply was increase into 90.7 km2 (35 sq.
miles) and 225 km2 (87 sq. miles) in year 1963 and 1973. In year 1998, the water
supply area increase into 730 km2 (282 sq. miles) (KWB, 2008). (Figure 2) and
(Figure 3) shows the bounded area of water supply in Kuching City that directly
distributed from Batu Kitang Water Treatment Plant and also a view of Batu Kitang
Water Treatment Plant main building.

Figure 2: Initial bounded area of water supply in Kuching City (KWB, 2009)

Figure 3: Batu Kitang Water Treatment Plant main building (KWB, 2008)
2.2 Water Regulation Structures in Sarawak River Basin
As we know earlier, there are a few existing structures in Sarawak Basin such as
Batu Kitang Water Treatment Plant, Kuching Barrage and also the latest project that is
still in progress is Bengoh Dam. All of these structures have a major function to
Kuching City in order to give a better life to the people in this area. Besides that, it also
used to overcome some of the problem that is really related to the water crisis.

2.2.1 Batu Kitang Submersible Weir
Weir is known as a dam in a river that used to stop and raise the water levels. It
also used in some of laboratory analysis and in practically, it used for measuring
discharge in open channels for more than 200 years (Chaundry, 1993). The example of
existing weir structures in Sarawak River basin was located at Sungai Sarawak Kiri.
This weir (Figure 4) was constructed across Sungai Sarawak Kiri and situated at the
downstream of Batu Kitang Treatment Plant. The figure below shows the location of the
weir and also Batu Kitang Treatment Plant.
Figure 4: Imagery of Batu Kitang Treatment Plant and Batu Kitang submersible weir
(Salim et al, 2008)
BATU KITANG
TREATMENT PLANT
BATU KITANG
SUBMERSIBLE WEIR

The purpose of this submersible weir is to raise the level of water in order to
increase the safe yield to 484 MLD for the secure until the year of 2010.It was start to be
operated since July 2005. This weir (Figure 5 & 6) can be raised up the water level up to
4 m and the height from the river bed to crest level is +1.50 m. The top layer of the river
face was supported by 0.6 m thick of armour stone with the thickness size not less than
1.20 m while for the downriver face was supported by 1.4 m thick of armour stone and
armour stones in the range of 1.80 to 2.80 m filled at 250 m down the river bed concrete
(Salim et al, 2008). The following figure will be shown the submersible weir at Sungai
Sarawak Kiri.
Figure 5: Submersible weir at Sungai Sarawak Kiri downstream Batu Kitang
Treatment plant (Salim et al, 2008)

Figure 6: Armour stones used in constructed Batu Kitang submersible weir structures
(Salim et al, 2008)
2.2.2 Kuching Barrage
Barrage is also one of the examples of low dam that consist of a few gates that are
constructed across the Sarawak River. Barrage is use to control the water levels in order
to divert the flow of the water into a storage canal for the irrigation activities, power
generation, domestic and industrials water demand and also to control tidal season of the
river (Law, 2007).The river saline intrusion reduced by Kuching Barrage where is
located downstream at Pending (Salim et al, 2008). This barrage was constructed in
August 1998 in order to control river water from cause the flood in Kuching. The level

of water at the upstream of Sarawak River is fully control by Kuching Barrage after the
two causeways that are constructed over the Sungai Sarawak and Sungai Santubong. It
will used to the transport of muddy sediments to the foreshores of Santubong and Damai
(Law, 2007). The following figure shows the locality plan of Kuching Barrage.
Figure 7: Locality plan of Kuching Barrage (SRB, 2008)
The barrage also used to prevent saline intrusion of the river and to avoid the water
from the sea from flooding in the Sarawak River. The structures of this barrage consist
of 5 radial gates with width length 25 meters each. There are also ship locks along side
of the barrage used to maintain the level of the water and reserved for the river traffic
(Figure 9 & Figure 10). During flushing and flooding-in, the five gates (Figure 11) will
lifted up in 1.0 meter high and it provides the total cross section of 125 m2 (Figure 8). It
can maintain enough water demand volume for Batu Kitang Treatment Plant that

supplies treated water to Kuching City. Batu Kitang is located 15 km from the barrage.
The flushing operation will be carried out during low tide and the flooding-in was
carried out during high tide for every Monday, Wednesday and Friday (Law, 2007). The
flooding-in operation is used to provide enough water levels for the ship yard
maintenance activities at the upstream of Sarawak River. This operation will affect the
quality of water that will be pump by Batu Kitang Water Treatment Plant and because of
this the operation only maximum for 1 hour. This problem almost the same happen to
the water quality during dry season in this area (Law, 2007).
Figure 8: Discharge through barrage gates during flushing operation (Law, 2007)
1 meter

Figure 9: Side view of ship lock along side of the barrage
Figure 10: Layout of Sarawak barrage with a ship lock (Law, 2007)

Figure 11: Side view of 5 radial gates at Kuching Barrage
2.2.3 Bengoh Dam
Bengoh dam is situated almost 1.5 km from Kampung Bengoh and about 56.5 km
from Kuching City. There is about four Bidayuh villages have moved into the new
places before this project start. The four villages are including Kampung Pain Bujong,
Kampung Rejoi, Kampung Taba Sait and Kampung Semban. The total area that covered
by this dam is about 1560 hectares and will be store 144.1 million cubic meters of water
and it will increasing the capacity of water that produce in Batu Kitang from 786 to 2047
mega litres per day (MLD) (Mail, 2007).

According to Public Utilities Minister, Dato Sri Awang Tengah Ali Hassan,
Bengoh Dam is constructed in order to increase the capacity of water storage so that it
can support the large population in Kuching City because without this structure the
water supply source will not enough in coming years due to the increase of water
demand where the number of population is about 810000 in year 2006. Bengoh dam will
take 40 months to complete and it take cost RM310 million for the project. This project
was started in 2007 and may be finish in 2009. After the dam is completed, the area of
water supply will be increase from Kuching City into Samarahan areas until 2030. The
cost to construct this dam was cheaper because it was located near Batu Kitang Water
Treatment Plant. The quality of the water that produce by this dam is under control
because it was located far from the industrials areas in Kuching City (Mail,
2007).(Figure 12) and (Figure 13) will shows the view of Bengoh dam construction site
and view of Bengoh Dam structures.

Figure 12: View of Bengoh dam construction site
Figure 13: Bengoh Dam (KWB, 2009)

2.3 Water Issues in Sarawak River Basin
There are several types of water issues in Sarawak River basin. All these issues
need to be considered before constructing long storage. General issues that always
happen in most of the river in our country are water pollution. The main factor that can
affect the water pollution is the increase of population growth. Almost one thirds of the
world population that currently lives in countries have been experience the water stress
and this ratio will be increase into two thirds in year 2025. Other than high population
growth, the other factor that can cause the water pollution is untreated sewage in certain
part of the region. Besides that, agriculture effluents and mine waste also the factors that
cause the water pollution. In Sarawak River itself, the impact of Kuching Barrage is one
of these issues that are related to the flushing and flooding operations, problem during
drought season and salinity effects. All of these issues may be affecting the physical and
chemical properties of the river.
2.3.1 Impacts of Kuching Barrage flushing and flooding operations
Flushing and flooding operations that have been carried out at Kuching Barrage will
cause the degree of turbulences at downstream and also upstream of this barrage. The
amounts of total suspended solids (TSS) have been measured to know the intensities of
turbulence of the water. The higher of TSS value, the higher was the intensity of the
turbulence. Usually, the smaller materials from the soils of the riverbanks and riverbed
will corrode during the flushing and flooding-in operations. Every location of riverbank

has different soil compositions. One of the factors that can produce turbulence during
flushing and flooding are the characteristics of riverbank and riverbed materials. During
flushing operations, the positive discharges have been occurred and the negative
discharges occurred during flooding operations (Law, 2007).
2.4 Studies on Water Balance Analysis
Water balance is use to measure the amount of inputs and outputs of water and to
estimate the volume of water storage in particular watershed. Water balance
measurement can be used to estimate earthen storages and seepage rates. The water
balance is carried out by calculating the inputs, outputs and storage changes of the water
in some places such as agricultural field, watershed, or continent surface. Precipitation is
the major input and evapotranspiration is the major output of water balance. Water
balance methodology can be use to review water needs for irrigation and other water-
related issues (Ham, 2002).
2.4.1 Usage of Water Balance Analysis in determine the water storage
According to the research in applied long-term annual water balance analysis of the
Lena River, the annual water balance can be calculated by using water balance for a
hydrological year is compute by the following equation (Ham, 2002):
U= P – R- E (1)

Where, U=Water storage in the basin
P=Precipitation
R=Runoff
E=Evaporation
The indicator U shows that the value of U will be change due to the change in the
volume of water stored snow cover and ice. In dry season, it will be melting and it
converts into surface runoff in each hydrological year (Ham, 2002).
The study on water balance analysis also used in the determination of wet weather
storage requirements for the Briar Chapel project. The water balance use in this study is
for a 98 years record of climatic station. The wet weather storage was computed by
calculating the water balance analysis using the following equation (Lappala, 2004):
St = St-1+ [Inflowt]-[Outflowt]; or (2)
St = St-1 + [Qt* t + AR*PCPt/12]-[IA + AR* EVPt/12] (3)

Where:
St = Storage required at the end of period t, Ac-ft;
St-1 = Storage required at end of previous period, Ac-ft;
AR = Surface area of area draining to all storage cells, Ac;
PCPt = Precipitation during period t, inches;
Qt = Flow of reclaimed water, Ac-ft/day
= 750000 galloons/day/7.48 galloons/ft3/43560 ft
3/Ac-ft
= 2.301 Ac-ft/day;
t = time between period t and t-1, in days
= no of day for each month;
IA = Allowable irrigation during period, ac-ft
= Ax*(PETt + SROt + GWOXt + PCPt)/12
Ax = Total sprayfield area, acres =450 acres
EVPt = Evapotranspiration from free water surface during day t = 0.6*PET,
inches;
PETt = Potential evapotranspiration for period t, inches;
SROt = Surface runoff for period t, inches; and
GWOXt = Drainage to groundwater for soil Area x during period t, inches.

The surface Runoff (SRO) will be calculated by using daily or shorter duration
rainfall volumes. There are two different method provided by Soil and Water
Assessment Tools (SWAT) model to calculate the surface runoff. It can be calculate by
using a modified SCS Curve Number method (daily time) or by using Green or Ampt
infiltration method (shorter time). The Briar Chapel watershed has preferred to use SCS
Curve Number method to calculate the surface runoff. The precipitations values can be
obtain either by measure or generate the values using SWAT precipitation generator.
Precipitation for wet day can be calculated by using the following equation (Lappala,
2004):
= + 2. .mon
monmon
day
g
ggSDN 11
66
3
(4)
Where,
day = Generated daily Precipitation;
month = mean precipitation for month containing day;
month = standard deviation for monthly precipitation for month containing day;
day = Standard Normal Deviate for day
= 2). 2);
= where, 2 and 1 are random numbers between 0.0 and 0.1; and
mon = skew coefficient for daily precipitation for month containing day.

The potential Evapotranspiration (PET) was calculated by using the Hargreaves equation
as shown below (Lappala, 2004):
PET= o = 0.0023 o (TMAX + TMIN) 0.5
(TAVG + 17.8) (5)
Where,
= Latent heat of vaporization of water, MJ/kg;
o = Potential Evapotranspiration (PET), mm/day;
o = Extraterrestrial solar radiation, MJ/m2/day;
TMAX and TMIN = Maximum and Minimum daily air temperature, oC; and
TAVG = Mean air temperature for the simulation day, oC.
If the daily value was missing, the temperature in the above equation will be calculated
by using the following equation (Lappala, 2004):
Tmx = month + month (6)
Tmm = month + month (7)
Hday = month + month (8)

Where,
Tmx = daily maximum temperature, oC
Tmm = daily minimum temperature, oC;
Hday = daily minimum solar radiation, MJ/m2
month = Mean daily maximum temperature in month containing day oC;
month = standard deviation of daily maximum temoerature oC;
month = Mean daily solar radiation in month containing day MJ/m2;
month = Standard deviation of daily solar radiation in month containing
day, MJ/m2
= (Hmx- month)/4
where,
Hmx = maximum solar radiation that can reach
earth’s surface on a
given day, MJ/m2;
= residual for maximum temperature on a given
day;
= residual for minimum temperature on a given
day;
= residual for solar radiation on a given day.

This study also computes the monthly water balance analysis including the wet and
dry periods in 98 years history. This analysis have been used a design flow equal to
750000 gallons per day of reclaimed water (Lappala, 2004). The graph of cumulative
frequency distribution of wet weather storage requirements shows in the next figure:
Figure 14: Cumulative Frequency Distribution of Wet Weather Storage
Requirements, Briar Chapel Subdivision (Lappala, 2004)
In other studies, water balance analysis also can be determined by using spatial
water balance analysis. This study use to estimate the stocks of water budget from

remotely-sensed data and estimate the change in storage for selected years and compare
estimated values to observed values (Melesse et al, 2006).
The area of spatial water balance study is covered the area of Devils Lake Basin in
northeastern North Dakota. The hydrometeorological analysis and spatial water balance
analysis requires the data from Remotely-sensed data (Langsat images), topography
(digital elevation model, DEM), meteorological (precipitation and air temperature),
hydrologic (lake stage) and also GIS layers (soils and watershed boundary). The
information from spatial water balance analysis will present the distribution of the
different components of hydrologic cycle on a spatial basis and it requires geographic
information system (GIS) (Melesse et al, 2006).
The hydrometeorological analysis has shown the seasonal variability of the basin
by consider the snowmelt and rain falling on the wet soils. By analysis of this variability,
the water balance for spring and summer was computed. There are nine groundwater
monitoring wells selected in this basin to show a close interaction between groundwater
and the lake. From this data, a graph water level (m) versus year has been plotted. All
the data will be used to calculate the water balance for the basin and the estimated
volume storage will be shown in the figure below (Melesse et al, 2006):

Figure 15: Groundwater and Lake Level for Selected Wells in the Study Area
(Melesse et al, 2006)
Figure 16: Annual water budget of Devils Lake (Melesse et al, 2006)

2.5 Method to solve Water Crisis
Water crisis is known as problem faced to get enough water supplies that cause by
many factors such as drought season and high population growth. One of the methods
that could be use to overcome the water crisis in Sarawak River basin is by construct a
long storage at that river. The further explanation about the usage of long storage will be
discussed in the following chapter.
2.5.1 Use of Long storage to solve water crisis
Long storage is the easy method to overcome the water crisis because its costs
that will is cheaper than constructing a dam. Besides that, the maintenance and
operation of the storage are less expensive and it is easy to carry out. The long storage
also has a various function to our daily use. Long storages have been developed in
Indonesia and the examples of this long storage are Bojongsari and Margawati long
storages. Bojongsari long storage is being use to supply water to the Public Water
Supply of Indramayu City (Figure 17).

Figure 17: Location of Indramayu City (Barmawi, 2007)
Besides that, it also use for water recreation, fishing and home industries to the
surrounding areas in this City. The water from Cimanuk River pumped into Bojongsari
long storage to supply enough water for the storage. The water will be pump from the
water storage into the industries area. The figures below show the view of Bojongsari
long storage and how the water pumped for home industry (Barmawi, 2007).

Figure 18: The Bojongsari long storage is located at Sub District Indramayu
(Barmawi, 2007)
Figure 19: Bojongsari Storage Pumped for Home Industry (Barmawi, 2007)

The next example of long storage is Margawati long storage. This long storage is
located at Pekandangan Village, Indramayu Sub District. Margawati long storage used to
supply the water for irrigation and also for fish pond at Pekandangan Village. The
capacity of this long storage is about 60000 m3 of water. The source of water of this long
storage is from the irrigation drainage channel (Figure 18) that supplies the water to the
long storage (Barmawi, 2007). The water pumped from the long storage into the
irrigation network (Figure 20).
Figure 20: Source of water from drainage channel of Margawati Long storage
(Barmawi, 2007)

Figure 21: Storage Water Pumped For Irrigation (Barmawi, 2007)
2.5.2 Rippl’s Diagram method or Mass Curve method
Rippl’s Diagram method is one of the earliest methods that used for estimating of
the reservoir storage size. This method is a simple method and easy to understand the
data analysis procedures. The assumption that will be made is the capacity of the
reservoir is full at the beginning of calculation if the record begins with drought period.
The cumulative curve of stream flow in monthly data constructed for the proposed
reservoir location. The water demands line is the cumulative demand (supply) lines for
that particular period (Imre et al, 2002). (Figure 22) will be shown the mass curves and
water demand lines for the graph of cumulative flows versus time.

Figure 22: Mass curve and water demand lines (Imre et al, 2002)
The cumulative demand lines were tangential to the mass curve line and the value
of K1 and K2 would be the design capacity of the proposed reservoir. The maximum
differences between the inflow and the water demand are equal to the critical drawdown
time period (Imre et al, 2002). The next figure below shows the reservoir capacity-yield
estimation.

Figure 23: Reservoir capacity-yield estimation (Imre et al, 2002)
According to Gupta (1989), storage can be divided into two different types. When
the demands for water can be satisfied by holding some of the high flow each year for
release during a later period of low flow, it is seasonal or “within-year” storage.
However, if there is not enough high flow every year to raise the flow to desired level,
extra water must be stored during wetter years to release during dry years. This termed
“over-year” or “carryover” storage.
There are two methods use to analyze the reservoir storage capacity. The first method
called the sequential mass-curve method and the other one is nonsequential mass-curve
method. The example of sequential mass-curve method is Rippl methods. This method
will be considered the most critical period of recorded flow especially during drought
period. The required storage capacity can be calculated by using the following equation
(Gupta, 1989):

S = maximum (It – Ot ) (9)
Where, S = required storage capacity
Ot = reservoir output or draft (yield) during period
It = inflow during period
The required storage can be obtained by doing the analysis on the capacity of the
inflow and also the outflow of the study area. The cumulative value of the inflow
and outflow will be plot in a graph cumulative volume (cfs-days) versus month (Gupta,
1989). The example of the graph will shows in the (Figure 24):

Figure 24: Rippl diagram for storage analysis (Gupta, 1989)

The cumulative values of inflow, It will be accumulated separately with the
cumulative values of outflow, Ot as a mass yield curve as shown in the above graph in
figure 19. The yield curve will be in straight line and give an equal slope if the draft rate
is constant. Each of this yields curve will represents the total of water demand and
evaporation. A parallel line will be drawn at each high point of inflow yield curve. The
required storage will be determined by calculating the maximum value of vertical
distance between the parallel yield line and the mass inflow curve. If there is more than
one parallel line drawn parallel with each other (line AE and line CE), assume that the
upper line (line AE) as the maximum point when the reservoir is full. The vertical line
will be drawn from the upper parallel line to the inflow yield curve and this will
represent the volume of the required storage of this reservoir (Gupta, 1989).
In other way, the storage of the reservoir can be shown by plotting the graph of
difference of successive accumulated values of inflow and yield ( versus
time, t. This will be shown in Figure 15. This method also known as modified mass
diagram with calculating the value of storage from the graph. The volume of the storage
will be determined by calculating the maximum vertical difference of the yield curve. In
analytical process, the reservoir size is calculated by determining arithmetically the
maximum accumulated difference using the following equation (Gupta, 1989):
S = H - L (10)

Where,
S= Storage
H= highest value
L=lowest value
Table 2: Data and computations for the reservoir capacity (Gupta, 1989)
(1) (2) (3) (4) (5) (6) (7) (8) (9)
Mont
h
Inflo
w
(cfs)
Outflo
w
(cfs)
Total
Outflo
w
(cfs)
Inflow
Volum
e,
It (cfs-
day)
Outflo
w
Volum
e,
Ot (cfs-
day)
Cumulati
ve Inflow
∑It (cfs-
day)
Cumulati
ve
Outflow
∑Ot (cfs-
day)
Differen
ce
∑It-∑Ot
(cfs-
day)
Apr. 141 90 110 4230 3300 4230 3300 +930
May 310 92 112 9610 3472 13840 6772 7068
June 18 92 112 542 3360 14382 10132 4250
July 56 93 113 1736 3505 16118 13637 2481
Aug. 40 90 110 1240 3410 17358 17047 311
Sept. 135 90 110 4050 3300 21408 20347 1061
Oct. 160 90 110 4950 3410 26358 23757 2601
Nov. 221 89 109 6630 3270 32988 27027 5961
Dec. 85 89 109 2635 3379 35623 30406 5217
Jan. 0 89 109 0 3379 35623 33785 1838

Feb. 0 91 111 0 3108 35623 36893 -1270
Mar. 241 90 110 7481 3410 43104 40303 2801
Apr. 359 90 110 10770 3300 53874 43603 10271
May 312 92 112 9672 3472 63546 47075 16471
June 75 92 112 2250 3360 65796 50435 15361
July 50 93 113 1550 3505 67346 53940 13406
Aug. 82 90 113 2542 3505 69888 57445 12443
Sept. 247 90 110 7422 3300 77310 60745 16565
Oct. 198 90 110 6138 3410 83448 64155 19293
Nov. 268 90 110 8040 3300 91488 67455 24033
Dec. 266 89 109 8246 3379 99734 70834 28900
Jan. 305 89 109 9455 3379 109189 74213 35976
The table shows the value of the storage that can be obtained by calculating the
differences between the highest value and the lowest value of inflow volume and
outflow volume of the reservoir as shown in (Figure 25) in the following page.

Figure 25: Alternative mass for storage analysis (Gupta, 1989)

CHAPTER 3
METHODOLOGY
3.1 Introduction
This study was carried out at Sarawak River basin. The total area of Sarawak River
is about 2375 km2 and the total length for the main river is 120 km. Sarawak River is
located at the south of Kuching City which flows through the city and dividing into two
major rivers known as Sarawak River Kanan and Sarawak River Kiri. The area covered
by these studies consists of two locations in Sarawak River basin. The analyses were
based on the discharge of water from the selected station. These studies also considered
the discharge of treated water used for daily activities consist of drinking water, flushing
water demand and irrigation water demand for agricultural activities.
Water demand for agricultural activities had been ignored due to the water pump
stations for irrigation water supplies are mostly used in Samarahan Basin. In order to
determine the discharge of water, the water level data was collected and analyzed. The
purpose of the data analysis is to determine the discharge of water at these stations and
to compare the cumulative discharge with the available water storage. The results from
the analysis show us either the available storage enough to supply water for Kuching
water demand throughout the year and the best location to construct a long storage was
found. Therefore, to study in more details about the hydrological characteristic of

Sarawak River basin, the analysis of the water level, rainfall and water demand will be
carried out. The whole procedures that containing all the process that will be carried out
during the analysis of Sarawak River basin was shown in the following flow chart.
Figure 26: Methodology flow chart
Data Collection
Analysis water demand volume
Analysis water level data
Plotting Mass curve diagram
Results and analysis
Discussion
Determine location of long storage
Analysis Mass curve diagram
Conclusion
Calculate volume of long storage

3.2 Data Collection
In order to determine discharge from the location selected throughout the year, one
year recorded water level data were collected and analyzed. The data had been collected
from Department of Irrigation and Drainage Sarawak (DIDS) for daily water level for
the year of 2001.
Figure 27: Location of water level and water level recorder stations
Table 3: Location, type of data collected and equipment used to collect data
Location Data Equipment
BUAN BIDI Water level Water level recorder
GIT Water level Water level recorder
BUAN
BIDI
GIT
SARAWAK
RIVER

3.2.1 Analysis water level data
The water level data for Sarawak River were collected from two selected water
level recorder stations. These data that had been analyzed are for Git station and Buan
Bidi station. Git station is located at Sarawak River Kiri and Buan Bidi station is located
at Sarawak River Kanan. The water levels were analyzed in order to know the discharge
of water at this location. The water level data were recorded in monthly for the year of
2001. This monthly data will be used to compute the discharge of these stations in one
year time period. The water level of these stations will be converted into discharge by
using rating curve equation for that particular stretch. Water levels data for the year of
2001 are shown in Appendix A and the discharge are shown in Appendix B.
3.2.2 Analysis water demands volume
This water demand is consists of two different categories that are; treated water
supply and flushing operation activities. The water demand data for treated water will be
collected from Kuching Water Board and for flushing operation will be collected from
Kuching Barrage Management. The analysis of treated water consists of the water
production from Batu Kitang Treatment Plant. The water is measured in megalitre per
day (MLD). The second analysis is focus on the flushing operations of Kuching Barrage.
It will be considered the discharge of water from flushing or draining-out operations and
to determine the discharge, the following formula be used.
Q = CLH3/2
(11)
C = 1.78 + 0.24*(H/P) (12)

Where
Q = Discharge, m3/sec
C = Discharge Coefficient
L = Width of Gate, m
H = Height of Water Level, m
P = Sill Height, m
The discharge data will be calculated only for flushing operation because there are
negative values for flooding-in operation. The flushing water demand will be calculated
based on the discharge water for the flushing operations to refreshing the river system if
the water level at barrage was built from +9.50 m to +9.8m. In order to obtain the
discharge of the operation, height of water level (H) and sill height (P) will be
determined. The figure below will shows the height of water level and the height of sill
at the barrage gate.

Figure 28: Kuching Barrage during flushing operation in low tide (Law, 2007)
3.2.4 Plotting mass curve diagram
Mass curve diagram will be plotted from the cumulative discharge of the water
demand versus cumulative daily discharge of available water supply in selected location.
Cumulative flows are computed by added the total monthly discharge of Kuching City
water demand and also discharge of water at this selected location. Mass Curve method
will be used to determine the required storage of the river. Total discharge for Kuching
water demand and available storage at Sarawak River will be compared and analyzed
before design the proposal of long storage in Sarawak River basin.
H
P
Barrage gate
Gate opening

Figure 29: Mass curve diagram
3.2.3 Analysis mass curve diagram
There are two cumulative lines produce from the mass curve diagram. These lines
consist of cumulative discharge for water demand and cumulative discharge for
available storage. The possibility either the selected location of proposed long storage
can support the needs of water from Sarawak River or not can be determined based on
the different between line of water demand slope and the line of available water supply.
The best location to construct long storage will be selected from both locations. The
capacity of discharge will be compared in order to determine the suitable location to
construct the long storage.
Time, month
Water demand line
Cumulative discharge, cumec-days
Water demand slope
Water demand rate line
Mass curve

3.2.5 Determine proposed long storage stretch.
Long storage is the stretch of river that used to store certain amount of water to
support the water demands at selected area. Therefore, the stretch of river will be
selected to construct long storage in Sarawak River. The stretch will be selected based
on the location where the water level data was recorded. Taking into consideration of the
river cross sections, the estimated capacity of proposed long storage will be calculated.
The elevation of long storage will be shown in the following figure.
Figure 30: Elevation of proposed long storage at Sarawak River
Upstream Downstream
Length of storage = 14.5 km
Checkgate
Flow direction
Checkgate

3.2.6 Results and analysis
The final results of these analyses had been shown the best location to construct the
long storage in Sarawak River and also the required storage capacity of the proposed
long storage.
3.2.7 Discussions
This section consists of the way and also procedures to find the results of this study.
The assumption and the analyses consideration will be stated and the problems faced
before, during and after the process in determining the data will be discussed. The
method or technique used to overcome the problems also being explained in the
following chapter.
3.2.8 Conclusion
The conclusions consist of all findings from the analysis that have been done in
this study with related to the objective given.

CHAPTER 4
RESULTS, ANALYSIS AND DISCUSSION
4.1 Introduction
In order to select the suitable location to construct a long storage as water source
around Kuching City and determine the total of water demand for the year 2001,
analysis of the water level and water demand had been carried out. These analyses are
focus on Sarawak River basin that has a potential to construct a long storage in order to
support the people’s needs around this city. The analyses had been done based on two
locations selected consist Git station and Buan Bidi station. Git station is located at
Sarawak River Kiri while Buan Bidi station is located at Sarawak River Kanan.
4.2 Determination of analyses stations
In order to select the suitable station for this study, few factors had been
considered. First, the selected stations must have the rating curve equation so that the
water level for that station can directly converted into discharge in cubic meter per
second. Based on the analysis of water level data for Sarawak River basin, only four
stations in Sarawak River are provided with the rating curves which are Buan Bidi
station, Git station, Ma’ang station and Rayu station. To obtain the rating curve, a graph

of the stage versus discharge should be plotted. In order to obtain the discharge, the
velocity of the stream must be measured manually using a current meter and multiplying
the velocity with the cross section of the river. In this study, the available data provided
by the Department of Irrigation and Drainage Sarawak had been analyzed. Both of these
locations are placed in different river but were located at the same basin. To select the
best location for this analysis, the location must not be in the same stretch so that we can
observe the difference in terms of water level and also the discharge capacities for that
river. These two locations had been selected because each one of this station is located at
the upper stream of the river.
4.3 Analyses period determination
The period of this study was focus on one year analysis which is year 2001 for both
of the stations. The analyses of water level had been made based on 10 years recorded
data from the year 1997 to the year 2007. Only one year data that was selected for this
study because it was discovered that some of the water level data from the previous
years are missing and thus it will affect the effectiveness of this study because there are
a lot data need to be estimated. The analyses must consider the available data for water
level for both of the location selected at Sarawak river basin. After considering all of
these factors, year 2001 had been selected for the analysis. There are no missing water
level data found in year 2001 for both stations. These water level data will be shown in
Appendix A.

4.4 Water Level Determination
The water level will show the change in depth of water in wet, dry and normal
season in this basin. This water level had been measured by using water level recorder.
Water level data was recorded in a graph before it was put into a table. In this study, the
water level was recorded in daily mean stage. All these data had been taken from
Department of Irrigation and Drainage Sarawak (DIDS). Data were analyzed in one year
daily recorded water level from two different stations selected. These two stations had
given different water level values throughout the year 2001.
4.5 Discharge determination
After the water levels for the year of 2001 had been collected, it was converted into
discharge that was measured in cubic meter per seconds (m3/s). The discharge values
show the amount of water release per unit time that was calculated in seconds at selected
station. Rating curve equation (Table 5) was used in converting the water level into
discharge in cubic meter per and cumec-days for every month. The total height of water
level (H) for each month had been used to calculate the discharge for every month.

Table 5: Station and rating curve equation
Station Name Rating Curve
BUAN BIDI Q=13.18(H-0.00)1.55
GIT Q=21.42(H-1.35)1.45
4.6 Discharge unit conversion
The water levels were converted into discharge by using the rating curve equation
of that particular station. The unit of discharge was measured in cubic meter per second.
This unit needs to be changed into cumec-day in order to plot a mass curve diagram for
the cumulative of water supply and water demand discharge. Usually, the stream flow
rate in the metric system is in meter cubic per second (m3/s) and it is always written as
cumec-day. Cumec-day is a unit used for a certain amount of discharge calculated in
meter cubic per second for 1 day flow rate. The volume of discharge in (m3/s) will be
converted into cumec-day by dividing the discharge in meter cubic (m3) with 86400 m
3.
The relationship between discharge in meter cubic per second and discharge in cumec-
day will be shown as below:
1 m3/s = [1*60s*60min*24hrs] m
3 = 86400 m
3
1 cumec-day = 86400 m3 = 1 m
3/s

Therefore, the discharge unit for Buan Bidi station, Git station and Batu Kitang
Treatment Plant was directly changed into cumec-day because the stream was
continuously flow for the whole day while for Kuching Barrage, the unit cannot be
simply changed into cumec-day because the operation was carried out only for a few
hours. First, the discharge in meter cubic per second (m3/s) need to be changed into
cubic meter (m3) then divided it with 86400 m
3 in order to get the unit of cumec-day.
The total of monthly discharge for year 2001 were calculated and put into table
Appendix B before the cumulative discharge against time (in month) was plotted for
both stations.
Figure 31: Cumulative monthly discharge at Buan Bidi station in year 2001
The above figure shows the available water supply at Buan Bidi in year 2001.The
volume of discharge was measured in cumec-days per month. From the figure, we can

see that the total of cumulative discharge is 30526.53 cumec-days. The line of
cumulative discharge for this location was plotted in smooth line because most of the
total discharge volume for every month is not much different. There is no critical time
consist of dry season found from the figure.
Figure 32: Cumulative monthly discharge at Git station in year 2001
The above figure is the cumulative discharge in month for Git station for the year of
2001. The water supply line was plotted in order to see the pattern of the cumulative
discharge for that particular strech throught the year. The line of this figure is almost
smooth and straigth due to the less different of total discharge between each month. The
total of cumulative value for all month is about 141257.8 cumec-days.

4.7 Water demand calculation
The main objective of this study is to determine the capacity of water demand used
for Kuching City based on its major sources. From these analyses, we found that only
three major sources of water demand involved in the scope of this study that are water
demand for treated water, flushing operations at Kuching Barrage and the agricultural
activities in this basin area. We ignored the small activities that related to agricultural
activities because most of these activities had been done at Samarahan basin and the
water demand for the irrigation activities had been directly pumped from Samarahan
basin itself. Therefore, the cumulative water demand discharge had been plotted into
graph in order to see the pattern of the graph line before the analysis will be done. The
discharge data for treated water demand consist of mean daily discharge, minimum daily
discharge and maximum daily discharge. We assume that the total of daily discharge is
constant for the whole month. The total monthly discharges are based on the sum of
daily discharge for each month. Whereas for flushing operations, the three conditions
consist of maximum, minimum and average monthly discharge also being considered in
the calculations. Therefore, the total water demand consists of the sum of monthly
discharge for the treated water at Batu Kitang Treatment Plant and Kuching Barrage
flushing operations.

4.8 Treated water
Treated water consists of the water produced from Batu Kitang Treatment Plant.
The data of average daily water produced from this treatment plant in year 2001 shows
in Appendix C was taken from Batu Kitang Water Treatment Plant with the permission
of Kuching Water Board (KWB). The amount of water produced frequently measured in
mega liters per day (MLD). Therefore, in order to get the discharge of the water demand,
the totals of water produced (in MLD) had been converted into cubic meters per second
(m3/
s) and cumec-day. Total of monthly discharges were calculated by multiplying the
amount of daily discharge (in cumec-day) with the numbers of days in every month. The
total discharge will be put into table according to the monthly total discharge of the year
2001.
4.8.1 Discharge of water at Batu Kitang Treatment Plant
Table 6: Average daily water production in 2001 at Batu Kitang Treatment plant
Plants Average daily consumption 2001 (MLD)
Plant 1 (Module 1 and 2) 40.335
Plant 2 (Module 3 and 4) 101.494
Plant 3 (Module 5 and 6) 121.823

Average daily total production 263.652
Min. daily total production 235.620
Max. daily total production 297.659
The above data had been calculated based on the Report of Headworks Operating
Statistics for the year 2001 as shows in Appendix C. These data consist of water
production and consumption of Batu Kitang for the year 2001. The calculations of
average, minimum and maximum daily total production of this plant and the discharge
unit conversion of megaliters to cumec-days will be shown in Appendix D.

4.8.2 Cumulative maximum monthly discharge
Figure 33: Cumulative maximum monthly discharge of Batu Kitang Treatment Plant in
year 2001
The above figure had shows the cumulative maximum monthly discharge at Batu
Kitang Treatment Plant for the year of 2001. These monthly discharges consist of the
maximum daily total production of treated water at this plant. In order to get the total of
monthly discharge for this year, assume that the maximum daily production of the plant
have equal discharge for daily production throughout the whole year. The calculated
value for daily total production of this plant is equal to 3.445 cumec-day. The number of
day in each month will be multiplied with maximum daily total production to get the
total monthly discharge for that month. The graph shows that the total cumulative
maximum monthly discharge is 1257.425 cumec-days. The total monthly discharge will
be shown in Appendix F.

4.8.3 Cumulative average monthly discharge
Figure 34: Cumulative average monthly discharge of Batu Kitang Treatment Plant in
year 2001
The cumulative average monthly discharge of Batu Kitang Treatment Plant shows
in the above figure had been calculated from the mean daily total production of treated
water in year 2001. In this calculation, assume that the total monthly discharge has a
constant flow rate at every month and the straight line shows the total monthly
production for the year of 2001 have equal discharge for the whole year. The mean daily
total production is 3.075 cumec-day and the total cumulative average for monthly
discharge is 1122.375 cumec-days. The total monthly discharge will be shown in
Appendix G.

4.8.4 Cumulative minimum monthly discharge
Figure 35: Cumulative minimum monthly discharge of Batu Kitang Treatment Plant in
year 2001
The above figure shows the cumulative minimum discharge of Batu Kitang
Treatment Plant for the year of 2001. The discharge data calculated in cumec-day for
each of the month for the whole year. The total of cumulative discharge for this year is
equal to 995.355 cumec-day and the minimum discharge is 2.727 cumec-days for daily
total production . Minimum daily total production had been used to calculate the total
monthly discharge of the plant Appendix H.

4.8.5 Discharge of flushing operations at Kuching Barrage
The total discharge values stated in the previous table shows the total monthly
discharge of flushing operations at Kuching Barrage for the year of 2001. The total of
monthly discharge had been calculated by using equation (11) and equation (12). In
order to get the total monthly discharge for each month, we need to consider the average
of upstream levels and downstream levels for each operation every 30 seconds. By using
this data, the discharge coefficient (C) can be calculated. The discharges (in m3/s) were
calculated by multiplying the discharge coefficient with the width of gate (in meter) and
the average of the upstream levels (in meter). In the first stage of the calculation, the
discharge always calculated for every week of the month and the total of monthly
discharge can be obtained by adding all the total weekly discharge for that month. Total
of weekly discharge in cubic meter per second and cumec-days for each gate will be
shown in Appendix I. The next table will be shown the discharge in cumec-day for
flushing operations in year 2001.

Figure 36: Cumulative monthly discharge of Kuching Barrage in year 2001
4.9 Water demand discharge comparison
In this study, we had been considered three catogories of water demand analysis
that are consist of maximum, average and minimum discharge. Maximum discharge of
water demand including the maximum capacity of discharge from Batu Kitang
Treatment Plant and the maximum discharge during flushing operations at Kuching
Barrage. We assume that the total of maximum discharge are constant for the whole
month. (Figure 36) will shows the comparison between maximum water demand and
available water supply from both stations. Average maximum discharge consist of the
mean daily production in a month of the treated water and the average of discharge at
Kuching Barrage. The average water demand rate is constant at each month throughout
the year as shown in. The last catogory of water demand discharge is the minimum

water demand. This consist of the lowest total monthly discharge of water demand in
year 2001.
4.9.1 Comparison between maximum water demand discharge and available
water supply discharge
Table 7: Maximum daily discharge for water demand in year 2001
Discharge station Maximum total monthly Discharge
(cumec-days)
Total
Batu Kitang Treatment
plant
104.785 8715.264
Kuching Barrage 8610.479

Figure 37: Cumulative maximum discharge of water demand and available water supply
discharge
The above figure shows the comparison between water demand discharge and the
available water supply at Git and Buan Bidi for the year of 2001. The water demand line
consists of the maximum demand rate for the whole year 2001 at Kuching City. The
discharge of available water supply lines for Git and Buan Bidi show the capacities of
water available at each stretch throughout the year. As we can see, the demand line is
drawn between Git and Buan Bidi water supply discharge lines. This means that, the
total of maximum water demand discharge is higher than the available water supply
discharge at Buan Bidi and slightly lower than the water supply at Git.

4.9.2 Comparison between average water demand discharge and available water
supply discharge
Table 8: Average daily discharge for water demand in year 2001
Discharge station Average total monthly Discharge (cumec-
days)
Total
Batu Kitang Treatment
plant
93.531 3812.516
Kuching Barrage 3718.985
Figure 38: Cumulative average discharge of water demand and available water supply
discharge

The figure shows the average cumulative discharge of water demand and the actual
water supply discharge for Git and Buan Bidi. The water demand line is intersects with
the Buan Bidi water supply discharge line and this line is much lower than Git discharge
line. Therefore, Git can supply enough water for water demand because the cumulative
discharge line is most higher compared to Buan Bidi discharge line.
4.9.3 Comparison between minimum water demand discharge and available
water supply discharge
Table 9: Minimum daily discharge for water demand in year 2001
Discharge station Minimum total monthly Discharge (cumec-
days)
Total
Batu Kitang Treatment
plant
82.946 86.946
Kuching Barrage 0.000

Figure 39: Cumulative minimum discharge of water demand and available water supply
discharge
The third catogory of water demand is consist of minimum monthly discharge of
the year 2001. The above graph shows the relationship between the three lines that are
water demand, Git and Buan Bidi cumulative discharge lines for every month data
analysis. The demand line is much lower compared to both lines (Git and Buan Bidi).
Therefore, the volume of available water from both locations are enough to provide
water for the water demand of Kuching City.

4.10 Mass Curve
The previous figure had shown the comparison between the water demand
discharge and available water supply discharge for the year of 2001. From the analysis,
we can see that the cumulative discharge line of Git is always high compared to Buan
Bidi. The slope of water demand and available water supply discharge lines had been
considered in order to determine the storage capacity using the Mass Curve or Rippl’s
Diagram method. A constant demand line is drawn tangentially to the hump at the
beginning of cumulative mass curve in order to determine which one of the water supply
location has a possibility to determine the required storage value. Based on the analysis,
the comparison between Git and water demand line for the maximum water demand
discharge can be used to determine the required storage because there is a small gap
between the water demand slope and the cumulative water supply discharge line. It will
be shows in details in (Figure 40).The maximum water demand discharge is the best
comparison to determine the required storage because it considered the highest of water
demand used for the whole month in year 2001. If the storage of water is enough for the
maximum water demand, means that; it also enough to provide enough water for
average and minimum water demand used. The following graph will shows the
relationship between the water demand line and the Git discharge line

Figure 40: Mass curve
Constant demand
line
Required Storage
Mass curve
Critical period
Constant demand rate A
B
A1
B1

4.10.1 Selecting location for long storage
(Figure 40) shows that a line (AB) was drawn tangentially to
the mass curve line (blue line) and parallel to the constant demand rate line (A1B1) in
order to determine the required storage for this river. The slope of constant demand rate
line is 8715.264 cumec-day and it used as a guide line to draw the tangen line (AB).
The capacity of the required storage is the maximum different between the cumulative
water demand line and the cumulative supply (mass curve). From the analysis that had
been done, the total of maximum capacities of required storage needed for the critical
period (May to October) is approximately 100 cumec-day or 8,640,000 m3 for the
whole year 2001. This amount is the capacity of water required to support the needs of
water during critical period. Therefore, a long storage can be constructed to store this
amount of water for Kuching City water demand. The following figures will show the
selected location for a long storage and the upper and downstream of the Sarawak River.
(Figure 42) shows the upstream cross section and (Figure 43) shows the donstream of
the river. The upstream river has the maximum water level width of 149.876 m with the
maximum height of 32.5 m while for the downstream, the maximum water level width is
154.665 m and height is 17.266 m. In order to select the suitable stretch to construct a
long storage, the following factor had been considered;
i. The maximum height of water level can be stored without allow the water to
overflow from the river banks.
ii. The existing structures in the selected location.
iii. Number of channel that will be a channel to supply the water into the long
storage

Figure 41: Location of proposed long storage at Sarawak River Kanan
Checkgate
2
Selalang River Downstrea
m Cross
section
Upstream
Cross
section
Checkgate 1
Checkgate
3
Checkgate
2

Figure 42: Upstream cross section

Figure 43: Downstream cross section

There were 15 minor streams linked to the Sarawak River Kanan long storage
and all these minor streams used as source of water to this storage during the critical
period where 3 checkgates will be constructed at this river consist of Checkgate 1,
Checkgate 2 and Checkgate 3. The purpose of Checkgate 1 is to raising up the water
level in the long storage while Checkgate 2 and 3 used as a separator beween the
long storage and the upstream of the river so that the required amount of water can
be stored. During wet season, all these gates will be opened to allow the water flow
in to the downstream. Gates will be closed if the water levels in Sarawak River
Kanan decrease during normal season. All gates will be closed to in order to stop the
water flow to the downstream and to increase the water levels of the long storage.
The extra amount of water at the upstream of the river and in the storage will be
overflow throught the weir to the downstream if the water levels reach 6 m height.
During dry season, the water will be release from the storage in order to provide
enough water for water demand in Sarawak River basin.Therefore, the calculation of
the total capacity of water can be estimated by calculating the area of river cross
sections in the upstream and downstream of long storage while taking into
consideration of the total areas that will be covered by water during maximum
storage level.

4.10.2 Proposed long storage at Sarawak River Kanan
Based on the previous analysis,the capacity of required storage during the
critical period is 8,640,000 m3. Therefore, in order to store this amount of water, a
long storage is the best way to store a large amount of water with inexpensive
construction cost compared to construct a dam. The suitable location to construct a
long storage had been selected with taking into consideration of the river cross
sections and the volume of water supply can be stored at that strecth. A suggested
location for proposed long storage is located at Sarawak River Kanan basin due to
the factor of available structure at Batu Kitang (Batu Kitang Submersible weir) and
also the proposed of Bengoh Dam at the upper stream of Sarawak River Kiri.The
rough estimation of proposed long storage will be shown in the following table:
Table 10: Characteristic of proposed long storage at Sarawak River Kanan
Capacity ±8,700,000m3
Proposed long storage length ±14,500 m
Upstream width ±149.876 m
Downstream width ±154.665 m
Proposed long storage width ±100 m
Proposed long storage height ±6 m

Based on the long storage characteristic at Table 10, we know that the capacity
of this long storage can be stored up to 8,700,000 m3 of water and it will provide
enough water during the critical period or dry season. The suggested height of the
maximum water level is 6 m approximately while the width is 100 m. This width
length is the maximum distance of the water level at that stretch. Assume that the
river cross section is in rectangular shape and this assumption will be used in
estimating the capacity of the long storage.
4.10.3 Long storage structure design
In this study, the structure design of long storage is not one of the major
objective of this analysis but its only a rough idea in storage design for the future
study. This long storage had been planned to be constructed at Sarawak River Kanan
whereby the upstream of the and the downstream of the storage will be consructed a
checkgate (Figure 41) at both directions. This checkgate consist of one or more flat
sliding gates and there will be a weir on both sides of the gate. The purpose of sliding
gates are to raise the water level in the long storage during dry season and it will be
opened during wet or normal season to allow the water flow throughout the river.
These sliding gates can be adjusted to control the flow of water and also to
increase the height of water in the long storage. The flat sliding gates are hold by two
slender rounded rod called spindles and there will be used two spindles for each gate.
The purpose of weir at both sides of the gate are to maintain the maximum height of
the water level and allow the water to overflow if the water level is more than the
maximum height of the gates. A simple details of these checkgate structure will be
shown in the following figure.

Figure 44: Layout of proposed checkgate structures at Sarawak River Kanan
The above figure had shown the simple layout of checkgates at Sarawak River
Kanan. This structures are design based on the required storage of water during dry
season and also during critical period of the year 2001. As discussed in the previous
chapter, this checkgate will be constructed at both upstream and downstream of river
in order to store a required amount of water in critical period.

The effective depth of the checkgate is the distance between the lower surface
of the weir and the bottom surface of the river. This depth is the maximum depth of
water can be store inside this long storage. The water will flow through both of
weirs if the water reach the maximum level of the storage. The water will be release
out from the storage during the critical period. This long storage can provide enough
water during the maximum critical period of the year.

CHAPTER 5
CONCLUSION AND RECOMMENDATIONS
5.1 Conclusion
The studies of Kuching water demand consist of the analysis of major water
usage in Sarawak River basin for the year of 2001. The analyses had been done are
including the water demand for treated water and water demand for flushing
operations at Sarawak River. Water demand for treated water is calculated from the
yearly report of Batu Kitang Treatment Plant and the flushing water demand is
calculated based on the daily flushing operation schedule of Kuching Barrage. The
total water demands consist of the sum of the discharge from both major activities.
Water demand discharge was divided into three categories that are maximum,
average and minimum discharge. The maximum discharge is the highest discharge of
water for the whole year. The previous analyses show that the maximum discharge of
water demand in year 2001 is 8715.264 cumec-days.
The average discharge water demand is the mean discharge from both
operations throughout the year. The capacity of average minimum discharge
calculated is equal 3812.516 cumec-days. While, the minimum water demand
discharge is the lowest discharge during the operations. According to the result of
these water demand analyses, the minimum discharge is about 82.946 cumec-days
per month.

The second objective of this study is to determine the capacity of water stored in
Sarawak River. Two locations had been selected to conduct these studies that are Git
and Buan Bidi. The capacity of water calculated based on the water level data of both
stations. The capacity of the available water in this location can be determined by
converting the water level into discharge using the rating curve of these stations. The
total monthly discharge for Git and Buan Bidi are 141257.8 and 30526.53
respectively.
The third objective of this study is to determine the suitable location to construct
a long storage at Sarawak River basin. The required storage had been obtained by
plotting the mass curve of Git discharge against the cumulative maximum water
demand. The graph shows that the required storage is 100 cumec-days or 8,640,000
m3. Therefore, the suitable location to store these amounts of water is at Sarawak
River Kanan. The factor of existing structures and Sarawak River Kiri had been
considered and the best location to construct a long storage is the upper stream of
Sarawak River Kanan. This location have a high potential to store a large amount of
water because the characteristic of the river itself.

5.2 Recommendations
i. The further study of water demand analysis can be included the minor
discharge at Sarawak River basin in order to get the accurate results of
Kuching water demand capacity.
ii. The study of available water supply can be carried out at other location at
Sarawak River basin Siniawan, Krokong and Batu Kawa.
iii. The analysis of available water supply also can be carried out by considering
more than one year in order to get the determine the required storage of the
river during dry season.
iv. The survey of the river cross section can be carried out to determine the
actual rating curve of the river.
v. The design of long storage can be tested by using modeling software’s for
Sarawak River basin.
vi. The analysis of proposed long storage can be more accurate by conducting a
practical study at the selected locations. The characteristic of the river can be
determined by measuring the height of river bank and the average width of
the river. The calculations of water capacity will more accurate if the details
of the river cross section can be measured on site by using suitable
equipments.

REFERENCES
Barmawi, M. (2007). “Long storage as water source during dry season in West
Java.” RIVER AND DEVELOPMENT, April 25-27, 2007, Bali, Indonesia.
Research Center for Water Resources, Jl.Ir.H.Juanda193 Bandung 40135,
Indonesia.
Benjamin, Chang Bui How (personal communication. April 27, 2009).
Chaudhry, M.H. (1993). Open-Channel Flow: Rapidly Varied Flow. New Jersey:
Prentice Hall; pp.174-175
GeoSurvey Consultant, Sungai Sarawak Basin Surveyed Maps under Sungai
Sarawak Flood Mitigation Study Project, December 2002 for State
Government of Sarawak, Malaysia.
Goh, Chin Guan (personal communication. April 27, 2009).
Gupta, R.S. (1989). Hydrology and Hydraulic Systems: Storage and Control
Structures. New Jersey: Prentice-Hall; pp. 446-455
Ham, J.M. (2002). “Uncertainty analysis of the water balance technique for
measuring seepage from animal waste lagoons.” Journal of Environment
Quality: 31:1370-1379

Imre V.Nagy., I.V., D.Kofi Ashante-Duah,., Istra’n Zsuffa, (2002). Hydrological
and Operation of Reservoirs: Practical Design Concept and Principles. New
Jersey, Springer, pp. 127-128
Kuching Water Board (KWB). (2009, March 24). Taklimat Ringkas Kepada Pelajar
Tahun Empat Jurusan Kejuruteraan Awam Tahun 4. Presented at Batu Kitang
Treatment Plant main building.
Kuching Water Board Official Website. Area of supply. Retrieved September 22,
2008, from http://www.kwb.gov.my/
Kuching Water Board Website. Area of supply. Retrieved September 13,
2008, from http://www.kwb.gov.my/our%20services/map.jpg
Lappala, E.G. “Water Balance and Wet-Weather Storage Analyses.” 4005 Lake
Springs Court Raleigh, May 11, 2004, North Carolina. Briar Chapel
Development Chatham County, North Carolina, 2004, pp.1-11
Law, P.L., Law, I.N., Lau, H. H., Kho, F. W. L. (2007). “Impacts of barrage Flushing
and flooding in operations on upstream total suspended solids.”
International Journal of Environmental Science: 4 (1): 75-83
Levinson, M. (2007). Integrated water resources management the vital role of
women. Honours Thesis, Dalhousie University Halifax, Nova Scotia; 1-44

Mail, R. (2007, August 5). Bengoh Dam to solve water supply woes. The Borneo
Post Online. Retrieved September 9, 2008, from http://www.
theborneopost.com.
Melesse, M.A.M., Nangia, V., Xixi, Wang. (2006). “Hydrology and Water Balance
of Devils Lake Basin: Part 1 Hydrometeorological Analysis and Lake
Surface Area Mapping.” Journal of Spatial Hydrology: 6(1):121-131
Memon, A. and Mohamed, M, (1999). Water Resource Management in Sarawak,
Malaysia: Water as a resource. Kota Samarahan: Centre for Technology
Transfer & Consultancy, pp. 1-2, 77-80
Salim Said, Putuhena, F.J., Darrien Mah Yau Seng and Lai Sai Hin. “Modeling of a
Hydraulic Structure: Batu Kitang Submersible Weir in Kuching, Sarawak.”
Proceedings of Engineering Conference 2008, 2nd Engineering Conference on
Sustainable Engineering Infrastructures Development & Management
December 18 -19, 2008, Kuching, Sarawak, Malaysia, 2008, pp. 303-335
Sarawak Rivers Board. Design criteria. Retrieved March 28, 2009, from
http://www.srb.sarawak.gov.my/design.htm.
Wahab Hj. Lias (personal communication. April 23, 2009).
Wurbs, R.A. and James, W.P. (2002).Water Resources Engineering: Hydrology.
New Jersey: Prentice Hall, pp. 40-44

APPENDIX A
BUAN BIDI DAILY MEAN STAGE WATER LEVEL REPORT FOR YEAR 2001
Dept. Drainage and Irrigation. Sarawak HYDAY V97 Output 10/02/2009
Station 1301427 Buan Bidi Year 2001
Variable 100.00 Daily Mean Stage (Recorder) in Metre Table Type Level
Figures are for period starting 0000 hours.
Day Jan Feb Mar Apr May Jun Jul Aug Sep Oct Nov Dec Day
1 6.230 1.668 1.767 0.620 0.836 0.664 0.370 1.255 1.121 0.561 0.586 3.437 1
2 2.505 1.227 1.058 0.615 0.741 0.517 0.353 1.128 0.860 0.566 0.663 1.217 2
3 1.858 1.271 1.253 0.807 0.681 0.637 0.350 2.075 1.030 0.626 1.367 1.744 3
4 2.115 1.788 2.237 0.845 0.640 0.596 0.318 1.757 0.816 0.947 0.956 1.052 4
5 1.573 1.421 1.043 0.777 0.576 0.480 0.292 0.962 0.995 0.587 0.695 0.776 5
6 1.113 2.362 0.904 0.824 0.710 0.442 0.276 0.769 0.872 0.681 0.788 0.697 6
7 1.135 1.546 0.838 1.162 1.053 0.729 0.277 0.690 0.974 0.705 0.824 0.651 7
8 1.313 1.565 0.968 0.965 0.889 1.161 0.281 0.642 1.399 0.651 0.827 0.605 8
9 1.297 1.430 0.949 1.517 0.721 0.986 0.265 0.609 1.256 0.682 0.829 0.554 9
10 1.714 1.885 1.032 0.718 0.707 0.613 0.255 0.758 1.031 0.724 1.115 0.532 10
11 1.151 1.534 0.883 0.975 0.581 0.512 0.518 0.665 1.471 0.769 1.055 0.515 11
12 1.126 1.509 0.771 1.171 0.556 0.637 0.345 0.615 1.187 0.796 0.778 0.490 12
13 1.012 2.978 0.848 0.938 0.632 0.695 0.292 0.620 1.101 0.812 0.748 0.473 13
14 0.941 1.874 0.737 1.883 0.814 0.696 0.289 0.600 1.192 0.800 1.248 0.457 14
15 1.922 1.459 0.675 3.171 0.587 0.659 0.388 0.586 1.641 0.769 1.254 0.454 15
16 1.104 4.876 0.618 1.132 0.750 0.675 0.374 0.575 0.958 0.841 1.381 0.574 16
17 2.500 4.175 0.585 0.893 0.729 0.688 0.389 0.562 0.880 0.824 0.822 0.506 17
18 1.485 1.631 0.645 0.895 0.639 0.539 0.358 0.570 0.850 0.823 0.757 0.475 18
19 1.701 1.986 0.621 0.781 0.542 0.464 0.332 0.567 0.791 0.877 0.675 0.457 19
20 1.074 1.144 0.549 0.799 0.499 0.419 0.340 0.565 0.770 0.816 1.921 0.489 20
21 2.182 0.948 0.530 0.723 0.460 0.410 0.426 0.564 1.275 0.750 2.020 0.532 21

22 1.565 0.838 0.664 0.591 0.506 0.398 0.428 0.598 0.800 0.711 1.292 0.507 22
23 2.093 0.776 0.529 1.082 0.604 0.371 0.663 0.593 0.757 0.742 0.867 0.696 23
24 1.965 0.818 0.580 2.245 0.573 0.360 0.702 0.579 0.788 0.746 0.789 0.655 24
25 0.997 0.750 0.570 1.023 0.463 0.567 0.711 0.576 0.801 0.904 0.775 0.893 25
26 0.864 0.840 0.533 0.760 0.419 0.863 0.843 0.575 0.748 0.704 0.631 0.676 26
27 0.766 1.074 0.557 0.823 0.512 0.586 0.614 0.577 0.898 1.035 0.598 0.790 27
28 3.274 3.684 0.496 1.931 0.552 0.491 0.650 0.655 0.599 1.019 0.595 1.662 28
29 1.499 0.459 2.189 0.431 0.421 0.995 0.660 0.624 0.951 0.967 0.841 29
30 1.269 0.447 0.914 0.418 0.402 0.722 0.620 0.600 0.652 2.043 0.815 30
31 2.274 0.451 0.398 1.046 0.896 0.571 0.764 31
Mean 1.730 1.752 0.800 1.126 0.620 0.589 0.467 0.757 0.970 0.763 0.996 0.806
Median 1.499 1.522 0.664 0.905 0.587 0.577 0.370 0.615 0.889 0.750 0.826 0.651
Max.Daily Mean 6.230 4.876 2.237 3.171 1.053 1.161 1.046 2.075 1.641 1.035 2.043 3.437
Min.Daily Mean 0.766 0.750 0.447 0.591 0.398 0.360 0.255 0.562 0.599 0.561 0.586 0.454
Inst.Max 6.805 6.358 3.895 5.336 2.043 2.015 2.069 3.229 2.592 1.763 4.540 4.827
Inst.Min 0.696 0.688 0.413 0.473 0.375 0.329 0.242 0.534 0.515 0.520 0.495 0.431
Summaries ------------------ Notes -------------------
--------- All recorded data is continuous and reliable
Daily Mean 0.942
Ann. Median 0.766
Maximum Minimum
Daily Mean 6.230 0.255
Instant 6.805 0.242

GIT DAILY MEAN STAGE WATER LEVEL REPORT IN YEAR 2001
Dept. Drainage and Irrigation. Sarawak HYDAY V97 Output 10/02/2009
Station 1302428 Git Year 2001
Variable 100.00 Daily Mean Stage (Recorder) in Metre Table Type Level
Figures are for period starting 0000 hours.
Day Jan Feb Mar Apr May Jun Jul Aug Sep Oct Nov Dec Day
1 7.490 4.151 3.138 2.805 2.584 2.207 1.882 2.523 1.862 2.243 2.828 3.088 1
2 3.813 3.311 2.920 2.352 2.606 2.376 1.859 2.418 1.816 2.112 2.430 2.462 2
3 3.454 3.053 2.799 2.775 2.383 2.103 1.836 2.713 1.748 2.077 2.480 2.259 3
4 3.711 3.840 3.564 2.599 2.461 2.132 1.823 3.934 1.736 2.586 4.075 2.163 4
5 2.883 3.307 2.840 3.118 2.634 2.040 1.815 2.436 1.720 2.761 3.275 2.101 5
6 2.686 4.056 2.547 2.526 2.463 2.087 1.810 2.150 1.712 2.259 3.067 2.035 6
7 2.692 3.018 2.587 2.515 3.012 2.389 1.799 2.040 1.719 2.176 3.134 1.988 7
8 2.812 2.866 2.911 2.490 2.969 2.658 1.787 1.983 2.511 2.480 3.003 1.977 8
9 2.556 2.896 4.053 3.128 2.429 2.976 1.779 1.938 2.371 2.377 3.417 1.932 9
10 2.912 3.661 3.694 2.427 2.377 2.285 1.791 2.405 2.091 2.151 2.928 1.901 10
11 2.497 3.710 3.397 3.334 2.269 2.188 1.840 2.111 2.323 2.047 3.789 1.918 11
12 2.401 3.135 2.918 3.254 2.253 2.574 1.843 1.977 2.133 1.987 3.214 2.133 12
13 2.431 4.176 3.598 2.561 2.336 2.751 1.811 1.916 1.959 1.939 2.613 1.905 13
14 2.308 3.207 3.313 2.571 2.468 2.555 1.782 1.884 1.899 1.920 2.707 1.920 14
15 3.384 2.911 3.222 5.012 2.217 2.480 1.800 1.853 3.892 1.892 2.927 1.990 15
16 2.520 7.253 2.644 3.456 2.691 2.604 1.829 1.835 2.391 1.928 2.820 2.154 16
17 2.729 5.394 2.473 2.740 2.361 2.401 1.840 1.814 2.135 2.099 2.459 2.017 17
18 2.970 3.408 2.479 2.579 2.299 2.188 1.916 1.795 2.083 1.941 2.407 2.074 18
19 3.359 3.656 2.422 2.871 2.216 2.099 1.853 1.783 2.196 2.093 2.720 2.095 19
20 2.812 2.943 2.447 3.340 2.152 2.047 1.913 1.772 2.407 2.688 3.238 2.556 20
21 4.157 2.686 2.280 3.074 2.087 2.016 1.871 1.760 2.588 2.906 2.565 2.277 21
22 3.462 2.529 2.773 2.580 2.144 1.985 1.945 1.793 2.603 2.292 2.380 2.340 22
23 3.480 2.438 2.724 2.547 2.350 1.953 2.530 1.795 2.492 2.299 2.425 2.230 23
24 3.221 2.382 2.714 3.251 2.175 1.933 2.069 1.862 2.603 2.618 2.302 3.257 24
25 2.590 2.350 2.413 2.672 2.136 1.925 1.955 1.890 2.340 3.022 2.185 3.146 25
26 2.405 2.763 2.606 2.493 2.058 2.089 2.594 1.805 2.158 2.589 2.135 4.351 26
27 2.307 2.788 2.534 2.676 2.052 2.097 2.067 1.800 2.331 3.499 2.361 3.950 27
28 4.214 4.828 2.661 3.929 2.036 2.007 1.949 1.927 2.212 2.594 3.804 3.383 28

29 3.243 2.345 3.179 2.056 1.943 2.257 1.844 2.057 3.210 4.596 4.198 29
30 2.713 2.442 2.593 2.089 1.936 1.993 1.886 2.467 3.608 3.031 3.234 30
31 4.051 2.429 2.019 2.978 1.813 3.571 2.799 31
Mean 3.170 3.454 2.835 2.915 2.335 2.234 1.962 2.047 2.218 2.450 2.911 2.511
Median 2.883 3.171 2.714 2.708 2.299 2.117 1.853 1.886 2.177 2.292 2.824 2.163
Max.Daily Mean 7.490 7.253 4.053 5.012 3.012 2.976 2.978 3.934 3.892 3.608 4.596 4.351
Min.Daily Mean 2.307 2.350 2.280 2.352 2.019 1.925 1.779 1.760 1.712 1.892 2.135 1.901
Inst.Max 8.889 9.465 4.863 7.142 4.439 3.871 3.691 5.102 5.531 5.292 6.928 5.588
Inst.Min 2.260 2.293 2.227 2.306 1.993 1.898 1.762 1.754 1.704 1.880 2.106 1.871
Summaries ------------------ Notes -------------------
--------- All recorded data is continuous and reliable
Daily Mean 2.580
Ann. Median 2.431
Maximum Minimum
Daily Mean 7.490 1.712
Instant 9.465 1.704

APPENDIX B
Total monthly discharge of Git station Buan Bidi station in year 2001
Month
Discharge (cumec-days)
Buan Bidi station Git station
January 6316.805 16259.940
February 5501.590 15882.310
March 1911.241 13795.820
April 3085.587 13695.380
May 1287.458 10362.260
June 1130.140 9247.017
July 829.788 8008.896
August 1754.384 8528.512
September 2448.779 9149.174
October 1775.984 11124.760
November 2551.264 13667.710
December 1933.505 11535.980
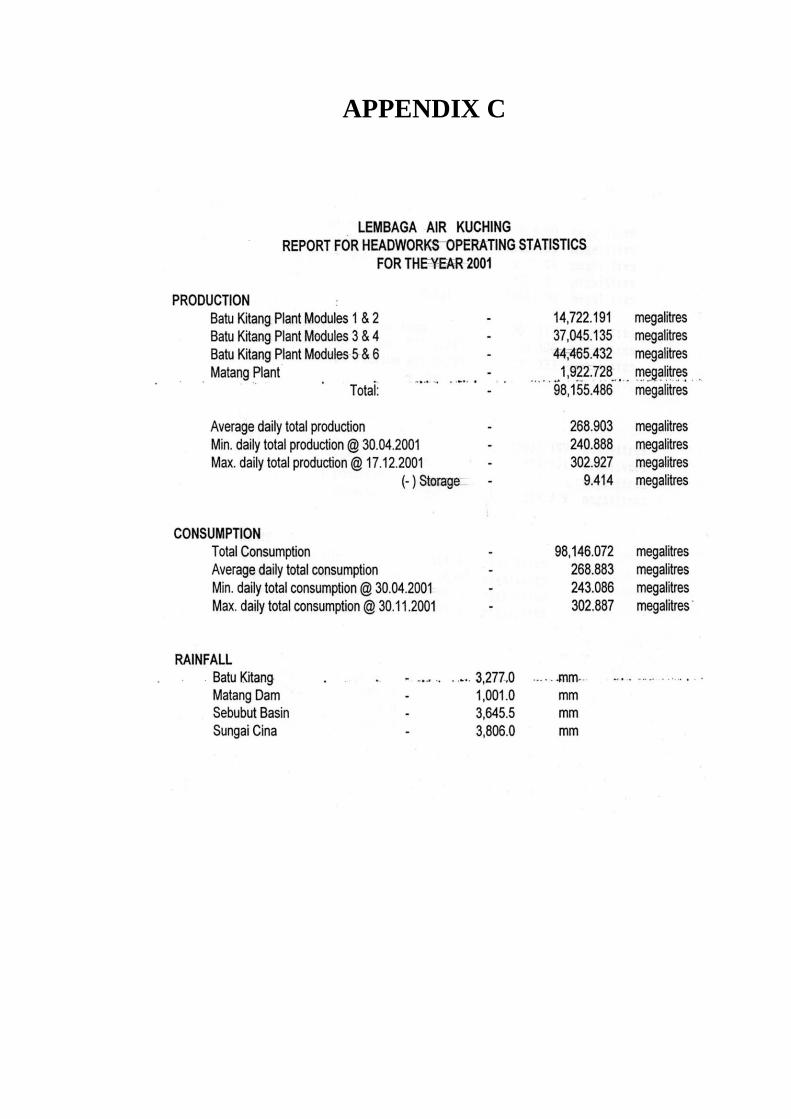
APPENDIX C

1) Calculating average daily total production of Batu Kitang Treatment Plant
Total = 98155.486 megaliters
Matang Plant = 1922.728 megaliters
Average daily total production of Batu Kitang Treatment Plant
= 98155.486 - 1922.728
= 96232.758/365
= 263.652 megaliters
2) Calculating minimum daily total production of Batu Kitang Treatment Plant
Total = 98155.486 megaliters
Matang Plant = 1922.728 megaliters
Minimum daily total production for two plants = 240.888 megaliters
The minimum daily total production of Batu Kitang Treatment Plant can be
calculated as below
Matang = 1922.728 megaliters (assume it produced the constant value)
= 240.888*365
= 87924.120 megaliters per year
= 87924.120 - 1922.728
= 86001.392 (total discharge of Batu Kitang per year)
= 86001.392/365
= 235.620 megaliters (daily total production of Batu Kitang)

2) Calculating maximum daily total production of Batu Kitang Treatment Plant
Total = 98155.486 megaliters
Matang Plant = 1922.728 megaliters
Maximum daily total production for two plants = 302.927 megaliters
The maximum daily total production of Batu Kitang Treatment Plant can be
calculated as below
Matang = 1922.728 megaliters (assume it produced the constant value)
= 302.927*365
= 110568.355 megaliters per year
= 110568.355 - 1922.728
= 108645.627 (total discharge of Batu Kitang per year)
= 108645.627/365
= 297.659 megaliters (daily total production of Batu Kitang)

APPENDIX D
CALCULATION OF DAILY TOTAL PRODUCTION OF BATU KITANG
TREATMENT PLAN
1) MAXIMUM DAILY TOTAL PRODUCTION
2)
AVERAGE DAILY TOTAL PRODUCTION
3)
MINIMUM DAILY TOTAL PRODUCTION
= 235.620MLD
= 235620000 liters/day
= 235620 m3/day
= 235620*(1/24*1/60*1/60) m3/s
= 2.727 m3/s ~ 2.727 cumec-day
= 263.652MLD
= 267652000 liters/day
= 267652 m3/day
= 267652*(1/24*1/60*1/60) m3/s
= 3.075 m3/s ~ 3.075 cumec-day
= 297659000MLD
= 297659 liters/day
= 297659 m3/day
= 297659*(1/24*1/60*1/60) m3/s
= 3.445 m3/s ~ 3.445 cumec-day

APPENDIX F
Total maximum monthly discharge in year 2001 at Batu Kitang Treatment
Plant
Month Discharge (cumec-days)
January 106.795
February 96.46
March 106.795
April 103.35
May 106.795
June 103.35
July 106.795
August 106.795
September 103.35
October 106.795
November 103.35
December 106.795

APPENDIX G
Total average monthly discharge in year 2001 at Batu Kitang Treatment Plant
Month Discharge (cumec-days)
January 95.325
February 86.100
March 95.325
April 92.250
May 95.325
June 92.250
July 95.325
August 95.325
September 92.250
October 95.325
November 92.250
December 95.325

APPENDIX H
Total Minimum monthly discharge in year 2001 at Batu Kitang Treatment
Plant
Month Discharge (cumec-days)
January 84.537
February 76.356
March 84.537
April 81.81
May 84.537
June 81.81
July 84.537
August 84.537
September 81.81
October 84.537
November 81.81
December 84.537

APPENDIX I
Total monthly discharge (in m3/s) of flushing operation at Kuching Barrage
Month Discharge (cumec-days)
January 8610.479
February 9119.142
March 4332.066
April 5080.936
May 6566.069
June 2115.604
July -
August 1186.783
September -
October 4033.422
November 1282.92
December 2300.397