steps to solving inactivity - ukactive | · pdf file2 steps to solving inactivity november...
TRANSCRIPT

Steps to solving inactivity#turnthetide
Untitled-1 1 11/11/2014 08:58:23

Steps to solving inactivity | November 20142 www.ukactive.com
Acknowledgements
We would like to thank all of the local authorities, physical activity providers and wide range of members and stakeholders who provided us with the support and information for this report.
We would also like to thank Public Health England, the Local Government Association, the County Sports Partnership Network and all the partners that supported the Moving More, Living More regional events that were held to turn the tide of physical inactivity in July 2014.
A particular acknowledgement must go to Public Health England for commissioning the ukactive Research Institute and the National Centre for Sport and Exercise Medicine in Sheffield to carry out the National Review which has been drawn on in this report.
ConnectWe encourage anyone with a role to play in turning the tide of inactivity to engage with us.Twitter: @_ukactiveFacebook: Get ukactiveLinkedIn: ukactiveEmail: [email protected]
Support us: #turnthetide
Untitled-1 2 11/11/2014 08:58:24

Contents
Foreword by David Stalker, Chief Executive Officer, ukactive 4Comment by The Rt Hon David Cameron MP, Prime Minister 5Introduction 6-7Key findings 8Recommendations 9National pictureLevels of inactivity in EnglandReview of physical activity programmes in England
10-1112-13
Evidence gapCommentary from the ukactive Research InstituteNesta levelsA practical guideRegional analysisNationalNorth WestNorth EastWest MidlandsYorkshire and the HumberEast MidlandsEast of EnglandSouth EastLondonSouth West
14-15
16-19
2122-2324-2526-2728-2930-3132-3334-3536-3738-39
United KingdomScotland, Wales and Northern Ireland 40-41AnnexesAnnex A - Methodology 43-44Annex B - References 45-46Annex C - Tables of socio-economic deprivationMost deprivedMore deprived AverageLess deprivedLeast deprived
4748495051
Annex D - Full national rankings data table 52-57
Steps to solving inactivity | November 2014 www.ukactive.com 3
Untitled-1 3 11/11/2014 08:58:24

Steps to solving inactivity | November 20144 www.ukactive.com
Foreword
David StalkerChief Executive Officer, ukactive
“We are not going to be able to solve the inactivity pandemic overnight but these are exciting times for anyone with a passion for improving the health of the nation by getting more people, more active, more often.”David Stalker, CEO, ukactive
Turning the tide of physical inactivity will take years, if not decades, to fully achieve. Yet in just a single year since we called for collaborative action to tackle the issue head on, as a top tier public health priority, we have made remarkable progress.
Through a strategic partnership between ukactive, Public Health England, the Local Government Association, the County Sports Partnership Network and partners, we delivered the first ever set of regional events on inactivity reaching 700 people across the country.
These events successfully brought the activity sector together with public health professionals and local government leads to discuss the provision of physical activity services at a local level based on the growing needs of the population. They will be held again early next year ahead of the next commissioning cycle.
Beyond that, the government have launched the cross-departmental initiative “Moving More, Living More” and the “Cycling Delivery Plan”; Public Health England have established a national framework with an ambition to get “Everybody Active, Every Day”; Sport England have extended the “Get Healthy, Get Active” fund; and NHS England have specifically identified inactivity in their “Five Year Forward Review”; all of which seek to help solve the inactivity pandemic.
Local authorities have also responded positively. Despite budgetary pressures, funding cuts and the inheritance of challeniging contracts from PCTs, over the past year, they have nearly doubled the amount that they have allocated to physical activity from their public health grant. This is part of a move towards more focused preventative care and wider integration of physical activity within public health services such as health checks, smoking cessation and weight management.
As I look ahead, I have no doubt that this integration will continue to expand into different areas; with greater requirements put into leisure contracts on the delivery of specific public health outcomes; further integration between public health and adult social care in pursuit of shared health improvement independent of later life; deeper integration between clinical commissioning groups and public health teams in local authorities; and, even more integration of public health into wider policy settings such as transport, planning and education.
These developments will bring challenges and opportunities for the physical activity sector. An increase in focus and investment will bring increased expectations that investment will have an impact and that the sector can improve health and wellbeing in a measurable way.
I am certain that the positive steps that we have taken in the past 12 months have been inhibited by a lack of robust, clinically relevant and academically sound evidence to show the value and importance of what thousands of organisations are delivering every day across the UK.
Can we take the next step and start proving our role and value in delivering physical activity to improve public health?
This report aims to support this transition and provide practical guidance as we have such an important part to play. We are not going to be able to solve the inactivity pandemic overnight but these are exciting times for anyone with a passion for improving the health of the nation by getting more people, more active, more often.
We hope you will continue to join us on the journey – as a member, partner, stakeholder or friend.
Untitled-1 4 11/11/2014 08:58:26

Prime Minister
I welcome this report from ukactive as further evidence of the need to tackle physical inactivity. This is why the work of ukactive is so important.
I am delighted that local authorities are leading the way by starting to prioritise physical activity services in their local areas and in accordance to the local needs of their residents.
The Government has made it clear through our “Moving More, Living More” initiative that departments will work together, with the Mayor of London’s teams, to embed physical activity into the DNA of the nation as part of the long term physical activity legacy from the 2012 Games.
The Prime MinisterThe Rt Hon, David Cameron MP
“I welcome this report from ukactive as further evidence of the need to tackle physical inactivity. This is why the work of ukactive is so important.”The Rt Hon, David Cameron MPPrime Minister
Steps to solving inactivity | November 2014 www.ukactive.com 5
Untitled-1 5 11/11/2014 08:58:26
Steps to solving inactivity | November 20146 www.ukactive.com
Introduction“Steps to solving inactivity”
“Steps to solving inactivity” presents new findings and puts forward compelling evidence on what is needed to help solve the inactivity epidemic in the UK.
It draws on official government data to show that 29 per cent of people in England are classed as physically inactive.1 This means that more than one in four people fail to achieve 30 minutes of moderate intensity activity per week, even though they can do it in three ten minute bites.
The report reveals that local authorities across the country have responded by nearly doubling the amount of public health grant funding they have allocated to tackling the issue between 2013/14 and 2014/15.2 This represents a shift from 2 per cent to 4 per cent of top-tier public health grants.3
It follows ukactive’s last publication “Turning the tide of inactivity” which established the scale of the inactivity crisis in England for the first time and raised the issue as a top tier public health concern.4 It received support from government, local authorities and the activity sector.
“Steps to solving inactivity” provides an updated analysis of physical inactivity at both a local and national level. It examines the latest rates of inactivity in each top tier local authority and provides examples of activity interventions currently being delivered in those local areas.
It seeks to support local authorities, public health professionals and the wider activity sector to strengthen the impact of their physical activity programmes, interventions and services by highlighting existing gaps in provision and sharing guidance on how to achieve best practice at a national level.
The report draws on the government-backed Standards of Evidence developed by Nesta, a leading social innovation charity and grant provider,5 to offer practical guidance on how best to prove that an intervention is having a positive impact so that it can be scaled up. Ultimately it sets out a series of steps to help solve the inactivity epidemic in the UK.
The scale of physical inactivity
Our analysis of the government’s latest physical activity survey shows that 29 per cent of people in England fail to achieve 30 minutes of moderate intensity activity per week within a 28-day period. This is the case even though they can achieve that half an hour in three 10-minute bites.6
These figures show more than one in four of the population is currently classed as inactive and fall into the Chief Medical Officer’s (CMO) “high risk” health category.7 Projections made in 2012 indicate an increase in inactivity in the UK by a further 15 per cent by 2030.8
The implications of this are stark. Inactivity is the fourth largest cause of disease and disability, and directly contributes to one in six deaths in the UK.9 This makes it as dangerous as smoking.10
Evidence shows that those not achieving the CMO’s recommended levels of activity are at a much greater risk of up to 20 non-communicable diseases including heart disease, type 2 diabetes, hypertension, obesity, dementia and other mental health conditions.11
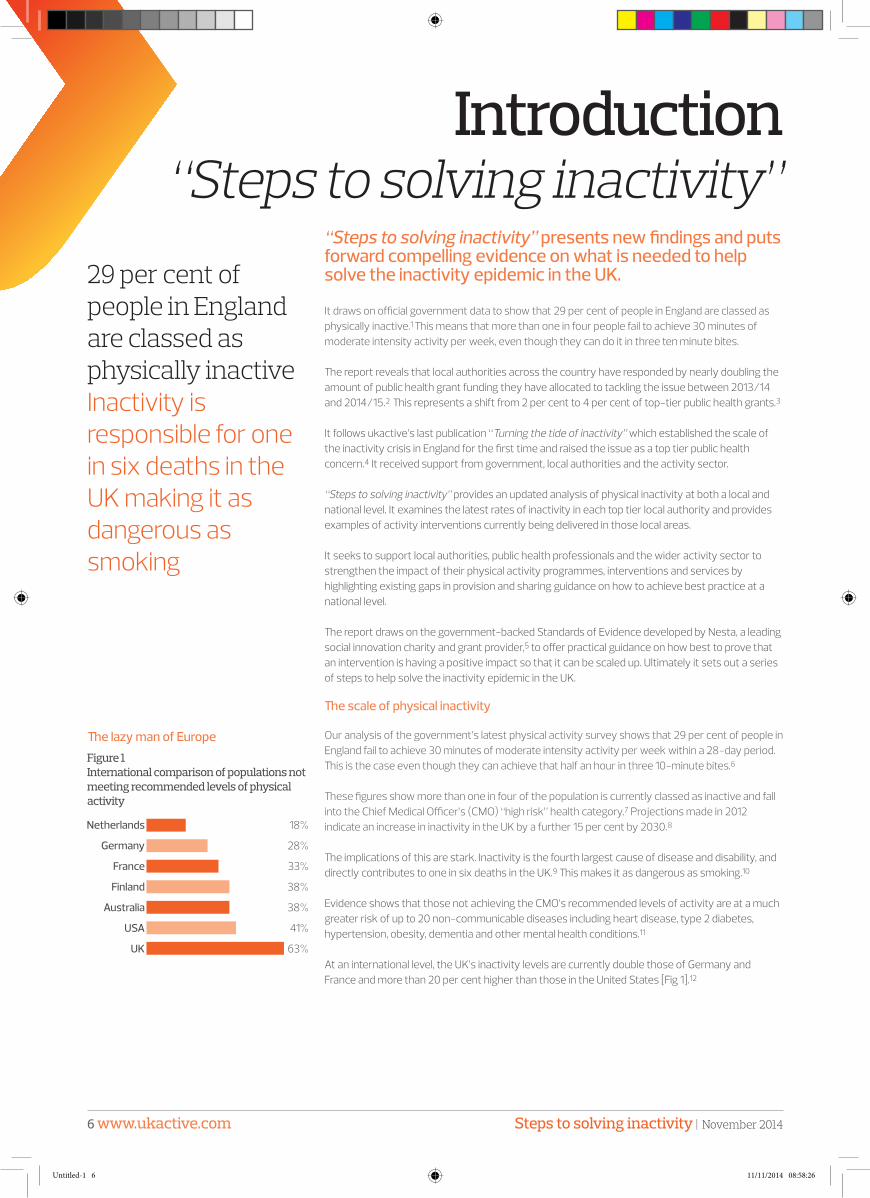
At an international level, the UK’s inactivity levels are currently double those of Germany and France and more than 20 per cent higher than those in the United States [Fig 1].12
29 per cent of people in England are classed as physically inactiveInactivity is responsible for one in six deaths in the UK making it as dangerous as smoking
18+28+33+38+38+41+63Figure 1International comparison of populations not meeting recommended levels of physical activity
The lazy man of Europe
Netherlands
Germany
France
Finland
Australia
USA
UK
18%
28%
33%
38%
38%
41%
63%
Untitled-1 6 11/11/2014 08:58:26

Turning the tide
This report analyses the most recent government surveys, publishes new information obtained from Freedom of Information (FOI) responses and presents the findings of the largest national review of physical activity interventions of its kind.13 It is the second in a series of publications that aim to develop the knowledge base and support the campaign to turn the tide of inactivity.
“Steps to solving inactivity” reveals that local authorities are responding by nearly doubling their allocated investment in the area, an increase from 2 per cent to 4 per cent of top tier public health grant funding.14 This is despite ongoing budgetary pressures, significant funding cuts and the inheritence of complicated public health contracts inherited by PCTs.
Local authority responses to FOI requests show that 70 per cent have increased their public health grant spend on inactivity interventions in the past year.15 It is part of a broader move towards preventative care and integration of services across health, leisure and adult social care.
This is the biggest increase in allocated spend amongst all the top tier public health issues in 2014/1516 and sits alongside other local government spending commitments to promote physical activity through sport and recreation (£905 million), open spaces (£797 million) and active travel (exact figures not available).
To turn the tide of inactivity, there must be a continued focus and investment on interventions that target physically inactive groups at a population level.
This investment must be increased to meet the clear need and fall in line with other top tier public health areas such as sexual health (36 per cent), drug misuse (31 per cent) and smoking (9 per cent) within the public health grant.17 It must also be supported by a greater understanding of what works to bring about such complicated behaviour change at an industrial scale.
Progress being made
The government have supported the drive by launching the cross-departmental initiative “Moving More, Living More” as part of the activity legacy to the 2012 Games.18 It included the first ever set of regional events on the issue, delivered by ukactive, Public Health England, the Local Government Association, the County Sports Partnership Network and partners.19
In addition, Public Health England has launched the “Everybody Active, Every Day” framework;20
Sport England has opened the “Get Healthy, Get Active” fund;21 the government has initiated the “Cycling Delivery Plan”;22 the Department of Health “Responsibility Deal Physical Activity Network” continues to grow;23 NHS England specifically identified physical inactivity in the “Five Year Forward Review;”24 and the Local Government Association has called for a funding injection in activity programmes through their manifesto “Investing in our Nation’s Future.”25
Steps to solving inactivity
Physical inactivity has in principle been established as a top tier public health concern and is starting to be prioritised at both a local and national level. However, more concerted, long term action and investment is needed.
One of the key issues that requires immediate attention is the current lack of objective evidence that physical activity interventions have to demonstrate impact. This was made clear by a national review of activity interventions undertaken by the ukactive Research Institute and the National Centre for Sport and Exercise Medicine in Sheffield on behalf of Public Health England.26
A total of 952 responses were submitted from a wide range of programmes making it the largest national review of physical activity interventions of its kind. The criteria used in the review highlighted gaps in routine data collection, evaluation and research for physical activity. This is inhibiting the scalability and wider commissioning of physical activity interventions.
“Steps to solving inactivity” seeks to provide practical guidance on how to strengthen the evidence base and scale up programmes in line with Nesta’s government-backed Standards of Evidence. It sets out a series of steps to help solve the inactivity epidemic in the UK.
“Labour’s ambition is to make physical activity the core business of Government. I support the work of ukactive on this important issue.”The Rt Hon Andy Burnham MP,Shadow Secretary of State for Health
Steps to solving inactivity | November 2014 www.ukactive.com 7
Untitled-1 7 11/11/2014 08:58:26

Steps to solving inactivity | November 20148 www.ukactive.com
Key findings
Levels of inactivity
» 29 per cent of people in England are classed as physically inactive which means that more than one in four people fail to achieve 30 minutes of moderate intensity physical activity per week
» Inactivity is the fourth largest cause of disease and disability and directly contributes to one in six deaths in the UK making it as dangerous as smoking
» Inactivity levels in the UK are double those of Germany and France and more than 20 per cent higher than those in the United States
Allocated spend on inactivity
» Local authorities have nearly doubled the amount of public health funding that they have allocated to tackling physical inactivity between 2013/14 and 2014/15
» 70 per cent of local authorities have increased their allocated public health budget spend on physical activity in 2014/15
» Spend on inactivity still represents the smallest proportion of public health grants (four per cent) in comparison to the other top tier public health areas: sexual health (36 per cent), alcohol misuse (30 per cent) and smoking cessation (9 per cent)
Evidence gap
» A total of 952 physical activity programmes, delivered in schools, workplaces, leisure centres, health and fitness clubs, outdoor settings, primary care sites and community venues, were submitted to a recent national review
» Analysis of these physical activity programmes found that they are impacting the activity levels of up to 3.5 million people annually
» The criteria used in the review highlighted a gap in the routine data collection, evaluation and research for physical activity
The UK’s inactivity levels are double those of Germany and FranceAnd more than 20 per cent higher than those in the United States
Untitled-1 8 11/11/2014 08:58:26

RecommendationsGovernment
» Improve the collation, coordination and breadth of physical inactivity data for adults and children within a single UK-wide framework
» Increase investment into researching physical inactivity interventions that can be applied to every day settings including leisure, transport, planning and education
» Establish a UK-wide framework to support the development of a more data-oriented approach to measuring outcomes and benchmark progress across the physical activity sector
Local authorities
» Prioritise and resource physical inactivity interventions to the same level as other top tier public health risks
» Ensure physical activity provision is integrated into planning and implementation across areas such as public health, social care, education, environmental planning and transport policies
» Require all Health and Wellbeing Boards to have a designated physical activity champion, who will specifically work to ensure its appropriate integration and provision based on local needs
The activity sector » Design and implement programmes with a focus on engaging inactive people and providing inclusive services aimed at reducing health inequalities
» Implement routine data collection at base line, exit and follow up for programmes to demonstrate impact in the short and long term
» Use the data that has been collected to shape and refine physical activity programmes, interventions and services
“To really solve this inactivity pandemic we need big, bold policy changes that include legislation, incentivisation and wide scale investment across the public, private and third sector.”Fred Turok, Chairman of ukactive
Steps to solving inactivity | November 2014 www.ukactive.com 9
Untitled-1 9 11/11/2014 08:58:27

Steps to solving inactivity | November 201410 www.ukactive.com
National picture
Lowest levels of inactivity Percentage of
inactive adults (%)
Richmond upon Thames 16.34
Wandsworth 19.45
Leeds 21.05
Lambeth 21.22
Bedford 21.98
Rutland 22.33
Wokingham 22.53
York 22.70
Kingston upon Thames 22.71
Bracknell Forest 23.05
Oxfordshire 23.07
Brighton and Hove 23.18
Bath and North East Somerset 23.36
Surrey 23.53
Windsor and Maidenhead 23.71
Highest Levels of Inactivity Percentage of
Inactive Adults (%)
Sandwell 36.34
Nottingham 36.40
Sunderland 36.40
Dudley 36.70
Bolton 36.93
Enfield 36.95
Oldham 36.96
Knowsley 37.07
North Lincolnshire 37.07
Hartlepool 37.30
Stoke-on-Trent 37.95
Tameside 38.06
Blackpool 38.21
Barking and Dagenham 38.82
Newham 39.17
Findings
Our analysis shows that 29 per cent of people in England are classed as physically inactive.27 This means that more than one in four people fail to achieve 30 minutes of moderate intensity activity per week, even though they can achieve that half an hour in three ten-minute bites.28
Evaluation of the data by local authority area shows that the London Borough of Newham has the highest level of inactivity in England, with 39 per cent of its residents classed as inactive. Richmond upon Thames, also in London, has the lowest with 16 per cent inactive [Tables 1 and 2].
There is a noticeable regional variance in inactivity levels across England. In the North West, 32 per cent of people are physically inactive compared to 27 per cent in the South East [Figure 3].
Review
The relationship between levels of inactivity, socio-economic deprivation and premature mortality continue to be clear.
13 out of the 15 most inactive local authorities all sit in the ‘most deprived’ or ‘more deprived’ socio-economic quantiles. The most deprived areas are on average 33 per cent inactive compared to 25 per cent in the least deprived areas [Table 1 and 2]. 29
The average number of premature deaths per 100,00 people per year in the most inactive local authorities was 433. In the least inactive local authorities it was 317.30 Inactivity is directly responsible for one in six premature deaths; 37,000 every year.31
Implication
Local authorities have nearly doubled the amount of public health funding that they have allocated to tackling the issue between 2013/14 and 2014/15.32
This represents the biggest increase in allocated spend amongst all the top tier public health issues, shifting from 2 per cent to 4 per cent of public health budgets [Figure 2].33
Sunderland City Council has made the biggest jump in physical activity spending from 2013/14 to 2014/15. It has increased from £36,174 (0.3 per cent of its public health budget) to £1,849,000 (16 per cent).34 36 per cent of residents in Sunderland City Council are classed as inactive.35
Overall, investment in physical activity remains small in comparison to other public health services such as sexual health (36 per cent), alcohol misuse (30 per cent) and smoking cessation (9 per cent) within local authority public health budgets.36
Table 2
Least inactive 15 local authorities
Most inactive 15 local authorities
Levels of inactivity in England
Table 1
Most deprived More deprived Average Less deprived Least deprived
Best performing
Most challenged
Untitled-1 10 11/11/2014 08:58:27

North West
North East
West Midlands
Yorkshire and the Humber
East Midlands
London
South West
East of England
South East
32%
32%
32%
30%
29%
29%
28%
28%
27%
Figure key
Figure 2Levels of inactivity in England
Our recommendations
» Government: Improve the collation, coordination and breadth of physical inactivity data for adults and children within a single UK-wide framework
» Local authorities: Prioritise and resource physical inactivity interventions to the same level as other top tier public health risks
» The activity sector: Design and implement programmes with a focus on engaging inactive people and providing inclusive services aimed at reducing health inequalities
More than one in four people are currently classed as physically inactive 13 out of the 15 most inactive local authorities all sit in the ‘most deprived’ or ‘more deprived’ socio-economic quantiles
North - South divide
Steps to solving inactivity | November 2014 www.ukactive.com 11
Untitled-1 11 11/11/2014 08:58:28

Steps to solving inactivity | November 201412 www.ukactive.com
National pictureReview of physical activity programmes in England
Background
It has been evidenced time and again that physical activity can be as powerful in the prevention, management and treatment of diseases as many other medical interventions.37
Since the work of Jerry Morris and his colleagues in the 1950s, who showed that London bus drivers (who were sedentary during working hours) were at an increased risk of cardiovascular disease when compared with their conductors (who were active during working hours), the delivery of physical activity has developed and been refi ned.38
Th e health impact of activity is now beyond doubt. A physically active lifestyle will help prevent up to 20 non-communicable diseases including heart disease, type 2 diabetes, hypertension, obesity, dementia and other mental health conditions.39
Th ose who lead inactive lifestyles are at much greater risk of developing these conditions and consequently fall into the CMO’s “high risk” health category.
National survey
Despite this, the recent UK Parliament All Party Commission on Physical Activity Report stated that it is currently almost impossible to tell which physical activity interventions have been successful and which have failed. It indicated that the majority are not objectively assessed or evaluated over a suffi cient time-frame.40
Th is point was evidenced in more detail by a national review of physical activity interventions undertaken by the ukactive Research Institute and the National Centre for Sport and Exercise Medicine in Sheffi eld on behalf of Public Health England.41
A total of 952 responses were submitted to the review from a wide range of physical activity programmes being delivered across the country. Th ese are impacting the activity levels of up to 3.5 million people annually. Settings include schools, workplaces, leisure centres, health and fi tness clubs, outdoor settings, primary care sites and community venues.
Th e criteria used in the review highlighted the gaps in routine data collection, evaluation and research for physical activity. A limited number of programmes were able to categorically prove that they had brought about their desired outcome directly (independently of other possible factors) and evidenced a positive eff ect on participants that was greater than a competing intervention or no intervention at all.
Evidence gap
An evidence gap has emerged between laboratory-based research studies that have proved the eff ectiveness of physical activity in controlled environments and the real world delivery of physical activity interventions.
Across the sector, there continues to be a speculative reliance on self-reporting of physical activity, use of crude outcome measures such as body weight and a general absence of clinically relevant data being captured to prove public health impact.42
Th is is a matter that is inhibiting the scalability and wider commissioning of physical activity programmes. It appears to be the case when compared to other public health interventions that are better evidenced and more widely invested in such as smoking cessation programmes.
For full details of the national review “Identifying ‘what works’ for local physical activity interventions” visit the ukactive Research Institute website: www.researchinstitute.ukactive.com.43
A total of 952 physical activity programmes were submitted to the national reviewTh ey are being delivered in a range of settings including schools, leisure centres and workplaces across the UK
� ���� �� ���� �� ������School214(11%)
Workplace111(6%)
Local authority leisure facility415(21%)
Private facility192(10%)Home based
81(4%)
Outdoor323(16%)
Community venue
383(19%)
Primary care setting
89(5%)
Other184(9%)
�� �� �� �� �� �� �� ���� �� �� ��89(5%)
Figure 3Settings of physical activity programmes submitted in England
Activity delivery in range of settings
Untitled-1 12 11/11/2014 08:58:29

“Th e criteria used in the review highlighted gaps in routine data collection, evaluation and research for physical activity.”Dr Robert Copeland, National Centre for Sport and Exercise Medicine in Sheffi eld
Rest of the UKNorth EastEast MidlandsWest MidlandsYorkshire and the HumberEast of EnglandNorth WestSouth WestSouth EastLondon
5.13%7.07%8.21%8.67%9.18%9.81%11.9%11.9%
13.9%14.3%
� �� �� �� �� �� Local authority 368(33%)
Central government73(6%)
Clinical Commissioninggroup74 (7%)
Charity125(11%)
Private170(15%)
Other324(29%)� �� � � �� � �� � �� � � �� � �� � �� � �� � �� � �� � �� � � �� � �� � �� � �� � �� � �� � �� � � �� � �� � �� � �� � �� � �� � �� � �� � �� � �� � �� � �� � �� � �� � �� � �� � �� � �� � �� � �� � �� � �� � �� � �� � �� � �� � �� � �� � �� � �� � �� � �� �� �� �� �� �� �� �� �� �� �� �� �� �� �� �� �� �� �� �� �� �� �� �� �� �� �� �� �� �� �� �� �� �� � �� � �� � �� � �� � �� � �� � �� � �� � �� � �� � �� � �� � �� � �� � �� � �� � �� � �� � �� � �� � �� � �� � �� � �� � �� � �� � �� � �� � �� � �� � �� � � �� � �� � �� � �� � �� � �� � �� � �� � �� � �� � �� � �� � �� � �� � �� � �� � �� � �� � �� � �� � �� � �� � �� � �� � �� � �� � �� � �� � �� � �� � �� � �� �� �� �� �� �� �� �� � �� � � �� � � �� � �� � �� � � �� � �� � �� � � �� � �� � �� � � �� � �� � �� � �� � �� � �� � �� � �� � �� � �� � �� � �� � �� � �� � �� � �� � �� � �� � �� � �� � �� � �� � �� � �� � �� � �� � �� � �� � �� � �� � �� � � �� � �� � �� � �� � �� � �� � �� � �� � �� � �� � �� � �� � �� � �� � �� � �� � �� � �� � �� � �� � �� � �� � �� � �� � �� � �� � �� � �� � �� � �� � �� � � �� � �� � �� � �� � �� � �� � �� � �� � �� � �� � �� � �� � �� � �� � �� � �� � �� � �� � �� � �� � �� � �� � �� � �� � �� � �� � �� � �� � �� � �� � �� � � �� � �� � �� � �� � �� � �� � �� � �� � �� � �� � �� � �� � �� � �� � �� � �� � �� � �� � �� � �� � �� � �� � �� � �� � �� � �� � �� � �� � �� � �� � �� � �� �� �� �� �� �� �� �� �� �� �� �� �� ��
Figure 4Funding types for the physical activity programmes submitted
Figure 5Number of physical activity programmes submitted to the national review by region
Our recommendations
» Government: Increase investment into researching physical inactivity interventions that can be applied to every day settings including transport, planning and education
» Local authorities: Ensure physical activity provision is integrated into planning and implementation across areas such as public health, social care, education, environmental planning and transport policies
» Th e activity sector: Implement routine data collection at base line, exit and follow up for programmes to demonstrate impact in the short and long term
Public, private and third sector funding
Physical activity programmes in England
Steps to solving inactivity | November 2014 www.ukactive.com 13
Untitled-1 13 11/11/2014 08:58:33

Steps to solving inactivity | November 201414 www.ukactive.com
Nesta Standards of Evidence
One way to support the development and scalability of physical activity programmes nationally is to use existing evaluation criteria such as Nesta’s government-backed Standards of Evidence which are widely used in public health settings [Full breakdown from p.16 - p.19].
The Nesta Standards of Evidence are on a 1 to 5 scale with Level 1 representing a low threshold, appropriate to very early–stage innovations. As the levels are progressed, it is expected that data is collected to isolate the impact of the intervention, that findings are validated externally, and then at Level 5, demonstrable evidence that the programme or service can be delivered at multiple locations and still deliver a strong, positive impact. In other words, it is scalable [Figure 5].
These criteria were used to assess the level of evidence supporting the 952 physical activity programmes that were submitted to the national review that the ukactive Research Institute and the National Centre for Sport and Exercise Medicine in Sheffield undertook on behalf of Public Health England.
Benefits of Nesta Standards of Evidence
Nesta’s Standards of Evidence reflect universally accepted criteria of scientific research. They are based around key principles such as causality (e.g. does the intervention actually bring about the desired outcome or do these outcomes result from other factors that are not directly attributable to the intervention itself) and scalability (e.g. would/could the intervention work if delivered by a different person to a different group at a different place).
They are ranked on a numerical 1-5 scale allowing quantitative comparisons between interventions, including rankings and classifications both within and between sectors. This enables us to answer key questions such as “which are the most evidence-based interventions being delivered?”
The Standards of Evidence also allow comparisons within interventions that give quantitative indication of change over time. This allows us to assess whether the evidence-base for any one intervention has grown since a previous assessment.
Nesta’s Standards of Evidence provide a clear framework for developing impact. If an intervention is currently rated at Level 3, the actions required to step up towards a future Level 4 rating, and therefore towards a more evidence-based intervention, are clear.
Whilst to many researchers such criteria might be self-evident, to many practitioners and providers, this is invaluable information in developing evidenced-based interventions and scaling up their programmes.
Limitations of Nesta Standards of Evidence
There are, however, limitations to the Standards of Evidence. The data required to meet Nesta criteria can be expensive in terms of time, equipment and expertise. Resources allocated to data capture could, and perhaps should, be better employed in the delivery of care. Meeting the Nesta criteria could therefore present many with a legitimate ethical and/or business dilemma.
Nesta criteria rate evidence, not effectiveness. The providers of many entirely effective interventions might be unable for economic or other reasons, to provide any evidence to support this effectiveness. Strict adherence to the Nesta criteria could provide misleading information and be especially problematic for small, new or unique interventions.
Whilst the mechanisms and effects of many interventions are generally simple to investigate, others are far more problematic. For example, it may be difficult to recruit a control group to assess the direct impact of an active travel scheme that is based around environmental changes in infrastructure. There are also ethical issues around withholding beneficial treatment to those being used in control groups for interventions being delivered in primary care settings.
“An evidence gap has emerged between lab-based research and community based interventions being delivered in the real world.”Dr Chris Beedie, Principal Investigator of the ukactive Research Institute
Evidence gapCommentary from the ukactive Research Institute
Our recommendations
» Government: Establish a UK-wide framework to support the development of a more data-oriented approach to measuring outcomes and benchmark progress and across the physical activity sector
» Local authorities: Require all Health and Wellbeing Boards to have a designated physical activity champion, who will specifically work to ensure its appropriate integration and provision based on local needs
» The activity sector: Use the data that has been collected to shape and refine physical activity programmes, interventions and services
Untitled-1 14 11/11/2014 08:58:33

Level 1You can describe
what you do and why it matters, logically,
coherently and convincingly
Level 2You can capture data that shows a positive
change but you cannot confi rm you caused this
Level 3You can demonstrate
causality using a control or comparison group
Level 4You have one +
independent evaluations that confi rms these
conclusions
Level 5You have manuals,
systems and procedures to ensure consistent
replication and positive impact
For more information see Puttick and Ludlow (2012) Standards of Evidence for Impact Investing; http://www.nesta.org.uk/publications/standards-evidence-impact-investing
Strength of the evidence
By using the Nesta Standards of Evidence to benchmark physical activity programmes, we are able to reveal that all of the 952 submissions were able to describe the importance of their programme and therefore met the initial requirement set out by Nesta - Level 1.
Only a limited number were able to move beyond this and provide more detailed data to support these conclusions such as qualitative and quantitative measurements, continued professional development (CPD) provision and proof of scalability.
Two programmes had completed a randomised control trial which evidenced causality and objectively demonstrated positive impact on participants. Another six were in the process of performing randomised control trials through independent evaluations but no programme was classed beyond Level 3.
Th e process brought to light the huge range and number of people and organisations currently running physical activity programmes in England. It also highlighted how few were able to evidence their impact and scale up their programmes to reach those in need across the country. Th is is a limiting factor for those that have such ambitions.
Steps to improving the evidence base
Th e following pages introduce the Standards of Evidence in more detail and outline how they can be applied to physical activity programmes being delivered in a range of diff erent settings.
Each level is introduced and practical guidance is provided on how to achieve the next step. Real world case studies taken from the national review submissions are used to outline how each standard is met and how each can be progressed.
By moving through the steps, the quality of evidence improves. Th is begins with a sound rationale, and culminates in interventions that have a tangible, replicable and scalable impact upon physical activity levels and health outcomes.
Th ese principles can be used to support the development of a more data-oriented approach to reporting processes and measuring outcomes in the physical activity sector, in the same way that they are being used across other public health settings by a range of government departments.
To close the gap between lab-based theory and real world delivery, a UK-wide framework can benchmark progress and support the development of evidence including the demonstration of impact, causality and scalability.
A failure to meet the required standards will continue to inhibit the scalability and wider commissioning of physical activity services. Th e practical steps outlined will provide the evidence-based bedrock upon which solving the inactivity epidemic in the UK can be based.
Figure 6Nesta Standards of Evidence
“A failure to meet the required standards will continue to inhibit the scalability and wider commissioning of physical activity.”Professor Greg Whyte OBE, Chair of the ukactive Research Institute
100 +3+0+0Figure 6Classifi cation of responses to the nation-al review based on Nesta’s Standards of Evidence Level 1 & 2
Level 3
Level 4
Level 5
950
2
0
0
Evidence gap in physical activity
Stepping up
Steps to solving inactivity | November 2014 www.ukactive.com 15
Untitled-1 15 11/11/2014 08:58:33

Steps to solving inactivity | November 201416 www.ukactive.com
Nesta levelsNesta Level 1
Camden Active Spaces
Health and social benefi ts have been taken into account alongside the design of the Active Spaces and by securing a research grant with University College London (UCL). Th e Active Spaces project will seek to provide robust evidence of any outcomes.
UCL are measuring the impact of Active Spaces on altering physical activity levels in young people. Measurements such as those highlighted above are being taken at baseline, post build and one-year on to ascertain sustainable outcomes associated with the Active Space. Researchers are using Actigraphs to measure a young person’s physical activity levels over a 7-day period alongside an activity diary and will be exporting this data for analysis. Baseline data has been collected in 500 young people but no analysis has been done to date.
Evaluations are being undertaken by UCL in the Active Spaces sites incorporating data from 2 secondary schools and 5 primary schools. A control group at a Camden Primary school will be used and quantitative and qualitative data captured (including use of Actigraph data) to ascertain anomalies/impact directly associated with the intervention.
Questionnaires, focus groups, one-on-one interviews
Body mass index, cardiorespiratory fi tness, psychological outcomes, sit and reach, standing jump, grip test
Th e intention of this project is to increase physical activity in young people with the aim of having a positive impact on the obesity levels of this group in Camden. Th e project centres on building bespoke ‘spaces’ that are refl ective of local communities and that inspire Camden residents to be more active. Training and development is being used to ‘activate’ the spaces and will be centred on providing individuals within schools and local communities to support structured and unstructured activity programmes.
If robust outcomes can be demonstrated by this project, there is the potential that future funding could be secured and potentially Active Spaces could be placed in community settings.
Impact
Scalability
Quantitative measurementsQualitative measurements
Nesta Level 1Th ere is a clear articulation of aims, objectives and rationale. Data is being collected that refl ects the dependant variable i.e. what the intervention is aiming to achieve.
Nesta Level 2 Th is intervention has clearly expressed how it intends to move to Level 2 i.e. capture data that show positive impact. Th e outcomes from data currently being collected will be used to determine what eff ect is being made.
Nesta Level 3Level 3 requires proof that you are causing the impact, and not an external infl uence. In this case a local facility not associated with the interventions also being measured and will be used to (potentially) identify causality.
Nesta Level 4To confi rm the positive impact (L2), and causality (L3) an independent view of the data is required. In this instance funding has been secured so that University College London can validate any data collected, and support the subsequent analysis.
Nesta Level 5Level 5 involves repeating the level of analysis and evaluation above, but in multiple locations so that fi ndings can be replicated elsewhere i.e. you can be confi dent that where ever you run the intervention, the eff ects will be consistent.
Description
To achieve the Level 1 Standard of Evidence, you should be able to provide a logical reason, or set of reasons, for why your intervention could have an impact and why that would be an improvement on the current situation.
Th is is about identifying the need for your intervention e.g. the continuing rise in physical inactivity and subsequent health concerns, and articulating why and how what you have developed will address the issue e.g. converting disused spaces into hubs for activity will provide increased opportunity to be active.
How to generate the evidence
You can do this by drawing upon existing data and your previous experiences in the area. Highlighting what makes your initiative diff erent and innovative is essential. Below is a case study of the Camden Active Spaces programme which is being delivered in London. Th is programme currently meets the criteria for Nesta level 1. Th e boxes below detail how it meets these criteria and the steps which are being taken to move up the Nesta scale.
A practical guide
SummaryYou can describe what you
do and why it matters, logically, coherently and
convincingly
Untitled-1 16 11/11/2014 08:58:34
Nesta Level 2
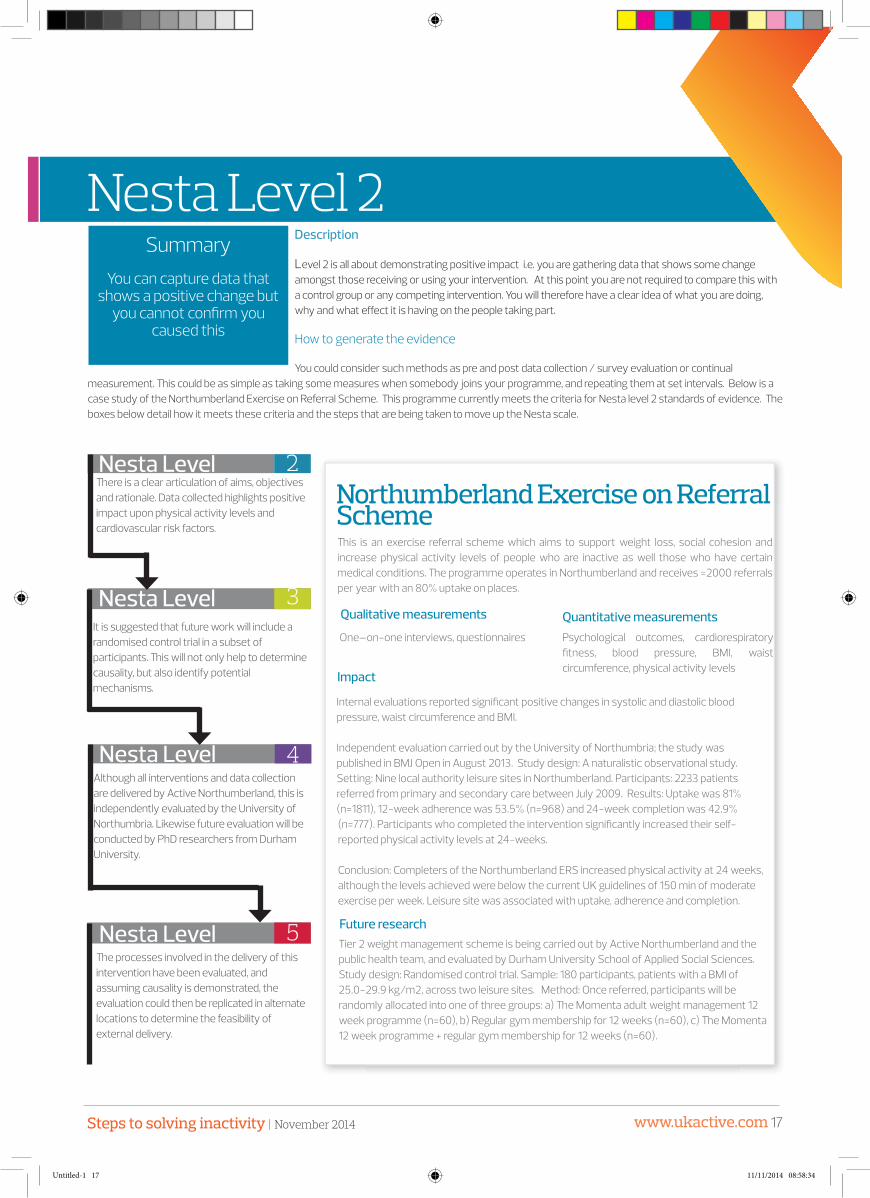
Northumberland Exercise on Referral Scheme
Internal evaluations reported signifi cant positive changes in systolic and diastolic blood pressure, waist circumference and BMI.
Independent evaluation carried out by the University of Northumbria; the study was published in BMJ Open in August 2013. Study design: A naturalistic observational study. Setting: Nine local authority leisure sites in Northumberland. Participants: 2233 patients referred from primary and secondary care between July 2009. Results: Uptake was 81% (n=1811), 12-week adherence was 53.5% (n=968) and 24-week completion was 42.9% (n=777). Participants who completed the intervention signifi cantly increased their self-reported physical activity levels at 24-weeks.
Conclusion: Completers of the Northumberland ERS increased physical activity at 24 weeks, although the levels achieved were below the current UK guidelines of 150 min of moderate exercise per week. Leisure site was associated with uptake, adherence and completion.
One–on-one interviews, questionnaires Psychological outcomes, cardiorespiratory fi tness, blood pressure, BMI, waist circumference, physical activity levels
Th is is an exercise referral scheme which aims to support weight loss, social cohesion and increase physical activity levels of people who are inactive as well those who have certain medical conditions. Th e programme operates in Northumberland and receives ≈2000 referrals per year with an 80% uptake on places.
Tier 2 weight management scheme is being carried out by Active Northumberland and the public health team, and evaluated by Durham University School of Applied Social Sciences. Study design: Randomised control trial. Sample: 180 participants, patients with a BMI of 25.0-29.9 kg/m2, across two leisure sites. Method: Once referred, participants will be randomly allocated into one of three groups: a) Th e Momenta adult weight management 12 week programme (n=60), b) Regular gym membership for 12 weeks (n=60), c) Th e Momenta 12 week programme + regular gym membership for 12 weeks (n=60).
Impact
Future research
Quantitative measurementsQualitative measurements
Description
Level 2 is all about demonstrating positive impact i.e. you are gathering data that shows some change amongst those receiving or using your intervention. At this point you are not required to compare this with a control group or any competing intervention. You will therefore have a clear idea of what you are doing, why and what eff ect it is having on the people taking part.
How to generate the evidence
You could consider such methods as pre and post data collection / survey evaluation or continual measurement. Th is could be as simple as taking some measures when somebody joins your programme, and repeating them at set intervals. Below is a case study of the Northumberland Exercise on Referral Scheme. Th is programme currently meets the criteria for Nesta level 2 standards of evidence. Th e boxes below detail how it meets these criteria and the steps that are being taken to move up the Nesta scale.
Nesta Level 2Th ere is a clear articulation of aims, objectives and rationale. Data collected highlights positive impact upon physical activity levels and cardiovascular risk factors.
Nesta Level 3It is suggested that future work will include a randomised control trial in a subset of participants. Th is will not only help to determine causality, but also identify potential mechanisms.
Nesta Level 4Although all interventions and data collection are delivered by Active Northumberland, this is independently evaluated by the University of Northumbria. Likewise future evaluation will be conducted by PhD researchers from Durham University.
Nesta Level 5Th e processes involved in the delivery of this intervention have been evaluated, and assuming causality is demonstrated, the evaluation could then be replicated in alternate locations to determine the feasibility of external delivery.
SummaryYou can capture data that
shows a positive change but you cannot confi rm you
caused this
Steps to solving inactivity | November 2014 www.ukactive.com 17
Untitled-1 17 11/11/2014 08:58:34

Steps to solving inactivity | November 201418 www.ukactive.com
Nesta Level 3
Les Mills UK
Th e ability of the programmes to deliver health benefi ts has been tracked according to the American College of Sport Medicine’s activity guidelines. Les Mills International have published the results of this in a peer reviewed journal; the paper evaluates a multi-modal group exercise programme, this was a 30 week group fi tness intervention study which demonstrated the eff ectiveness of group fi tness in reducing the cardiovascular risk in sedentary individuals.
Evaluation conducted by Pennsylvania State University in collaboration with Les Mills International and published in peer-reviewed journals. Paper 1: Group fi tness intervention. Research aims: Evaluation of whether a multi-modal group fi tness intervention could produce physiological health benefi ts. Results: Statistically signifi cant reduction in body mass, fat percentage, cholesterol, LDL-C, triglycerides and elevations in oxygen consumption, lean body mass percentage and HDL-C compared to baseline measurements. Conclusion: Group fi tness minimises attrition and maximises health benefi ts to reduce risk of cardiovascular disease. Paper 2: Research aims: Investigate the health eff ects of high intensity training in a group fi tness environment. Sample: 84 healthy trained adults. Method: Sample randomly split into high intensity interval training (GRIT) program and moderate intensity training (FIT) program (control). Results: GRIT group signifi cantly reduced body mass, triglyceride concentration and increased lean body percentage, glucose tolerance, maximal oxygen consumption and strength.
One–on-one interviews, questionnaires.
BMI, blood pressure, cholesterol, cardiorespiratory fi tness, psychological outcomes, body composition changes via DEXA, strength gains and glucose levels.
Les Mills group fi tness classes support a variety of groups to increase physical activity levels as well supporting weight loss and social cohesion. Facilities pay a license fee to operate the programmes and many clubs have been running these programmes for up to 20 years. Les Mills estimates that there are 21,564,712 attendances (non-unique) per annum across the UK.
Th e programme delivery, instructor training and club support strategies have been designed to be fully scalable. Les Mills classes are currently being delivered in more than 15,000 clubs and gyms and across over 80 countries.
Future work will focus on increasing the population samples tested.
Impact
Evaluation
Scalability
Future work
Quantitative measurementsQualitative measurements
Description
Th e key to Level 3 is proving that it is your intervention that is causing any positive changes you have identifi ed at Level 2. Th is means that you can demonstrate that your intervention is causing the impact, by showing less impact amongst those who don’t receive the product/service
How to generate the evidence
Any robust methods using a control group (or another well justifi ed method such as a competing intervention) that begin to isolate the impact of the product / service. Random selection of participants strengthens evidence at this level. Below are case studies of Les Mills UK and Project ACE. Th ese are examples of physical activity programmes which diff er considerably in the delivery environment and target group, however both of these programmes currently meet the criteria for Nesta level 3 standards of evidence. Th is would have been infl uenced by the fact that they have been part of funded research trials. Th e boxes below detail how these programmes meet the criteria and the steps that are being taken to move up the Nesta scale.
Nesta Level 3Les Mills have identifi ed a way of making physical activity fun and engaging, whilst supporting signifi cant areas in public health such as weight loss and social cohesion.
Impact has been documented in peer-reviewed publications, and in comparison with a control condition (competing intervention). Improvements are reported in body composition, cholesterol levels, glucose tolerance, and fi tness.
Nesta Level 4Both examples of Level 3 Standards of Evidence (Les Mills UK and Project ACE) have published their evaluations in peer reviewed academic journals. Th is is testament to the design that has been included in the evaluation.
To progress to Nesta Level Four an independent analysis of data collected is required that does not involve members of delivery team.
Nesta Level 5Both case studies provided, although very diff erent, provide examples of the development and scaling of interventions.
Les Mills provides an excellent example of the way in which an exercise intervention can be delivered in multiple locations. As is highlighted in the case study, the task is now to replicated the level of evaluation across these large numbers of participants and delivery locations.
SummaryYou can demonstrate
causality using a control or comparison group
Untitled-1 18 11/11/2014 08:58:34

Nesta Level 4 Nesta Level 5
Project ACE
Evaluation was funded by the MRC-led Lifelong Health and Well-being Initiative and showed considerable impact on the health and social outcomes of the participants. ACE participants signifi cantly increased their confi dence and felt more supported to be active. 82% of the intervention group reported increased autonomy, 42% felt an increase in relatedness and 81% reported a perceived increase in competence. 55% of the intervention group reported an increase in vitality compared to 22% of the control group. In terms of social well-being 68% reported an increase (42% of the control group) and 59% reported an increase in Life Satisfaction (50% of the control group). 57% felt that life was more worthwhile at six months than at baseline, compared to 0% of the control group.Evaluation was completed by the University of Bath, and presented in over 20 academic publications / conference presentations / communications.
Activities diary, satisfaction with life, the Resilience Scale, the Vitality Scale, Basic needs satisfaction, the Ageing Well Profi le, focus groups and interviews.
Physical activity levels (using accelerometers), physical function, psychological outcomes.
ACE is an intervention programme in which retired volunteers (Activators) promote physical activity amongst older adults. ACE began in 2013 as a research project developed by researchers at the University of Bath, Bristol and the University of West England and is currently being rolled out across Bristol by the charitable organisation LinkAge.
Th e programme can be operated by a range of providers, its volunteering model results in very low delivery costs and it can be delivered anywhere in the UK. LinkAge are now in the process of rolling it out in new areas. LinkAge will continue to measure the impact of the programme to add to the ACE research base. Future steps include evaluating (a) its eff ectiveness and cost eff ectiveness and (b) rolling it out on a larger scale.
Impact
Scalability
Quantitative measurementsQualitative measurements
DescriptionLevel 4 essentially validates the positive impact and causality that has been shown in Levels 2 & 3 via an independent evaluation of data that has been collected. As part of
this you should be able to explain why and how your intervention is having the impact you have observed and evidenced so far.
How to generate the evidence: At this stage a robust independent evaluation that investigates and validates the nature of so the impact is required. Th is might include endorsement via commercial standards, industry kitemarks etc. or partnering with research or academic institutions. You will need documented standardisation of delivery and processes and costs of production.
Nesta Level 3Project ACE is focused on activating elderly participants by utilising community volunteers. Impact has been demonstrated, in comparison with a control group (receiving no intervention) in areas such as confi dence, vitality, self reliance, and life satisfaction. Th ese are all highly relevant areas to the population being tested.
Nesta Level 4An independent evaluation conducted by an external University or body not associated with the delivery of the interventions is required to progress to Level 4.
Both Les Mills and Project ACE intend on conducting larger studies in the future to facilitate evidence gathering (Les Mills) and scalability (ACE).
Nesta Level 5As is alluded to here, Level 5 involves replicating evaluations in multiple locations, and operating in diff erent community settings
Project ACE is now set to begin delivering the intervention to larger numbers – with continual evaluation. By accompanying this activity with systems, manuals, and training Level 5 can be achieved.
Summary
You have one + independent evaluations that confi rms
these conclusions
DescriptionTo be considered Level 5 you must be able to prove that your intervention could be operated by someone else, somewhere else, whilst continuing to have
positive and direct impact on the outcomes required e.g. physical activity levels or health markers. All the while remaining a fi nancially viable proposition.
How to generate the evidence: You would be expected to use methods like multiple replication evaluations, future scenario analysis and fi delity evaluations, to confi rm that delivery and outcome measurements are replicable, and therefore your intervention is scalable.
Summary
You have manuals, systems and procedures to ensure consistent
replication and positive impact
Steps to solving inactivity | November 2014 www.ukactive.com 19
Untitled-1 19 11/11/2014 08:58:35

Steps to solving inactivity | November 201420 www.ukactive.com
Regional analysis
National average
Physical inactivity
Inactivity (previous year)
Average spend (2014/15)
Average spend (% PH grant 2014/15)
Average spend (2013/14)
Average spend (% PH grant 2013/14)
28.86%
28.51%
£480,989
4.19%
£261,791
2.49%
+29 +28 +49 +42 +26 +25 +29 +28 +49 +42 +26 +25
National Average
Regional breakdown
Th e following section provides a regional breakdown of physical inactivity in each of the top-tier local authorities in England; across the North West, North East, Yorkshire and the Humber, West Midlands, East Midlands, East of England, South East, London and the South West.
It presents the latest available data on inactivity levels in each local authority alongside their allocated spend to tackle the issue within public health budgets in 2013/14 and 2014/15.
Our analysis highlights changes over the last 12 months in both inactivity levels and allocation of funding from both local authorities and as a region compared to the national average.
Case studies are also presented from a range of physical activity programmes being delivered in each region including key facts and quotes from local and national stakeholders.
Th e graph key below provides details of each metric that has been assessed alongside the national average.
Physical inactivity Th e percentage of people classed as physically
inactive in the region in 2013 compared to the national
average
Inactivity (previous year) Th e percentage of people classed as physically
inactive in the region in 2012 compared to the national
average
Average spend Th e total amount of public health grant spend
allocated to physical activity for the 2014/15 spending
year
Average spend (% of PH grant) Th e percentage of the public health grant allocated to
physical activity for the 2014/15 spending year
Average spend (2013/14) Th e total amount of public health grant spend on
physical activity allocated in 2013/14
Average spend (% of PH grant
2013/14)
Th e percentage of the public health grant allocated to
physical activity in 2013/14
DNA Data not available
Th e North West is the most inactive region in EnglandAnd the South East is the best performing region with the lowest percentage of inactive people in the country
Inactivity metrics Inactivity and spend analysis over the last two yearsGraph key
Untitled-1 20 11/11/2014 08:58:35

Case studiesNational programmes
Water Babies is a swimming programme for babies and toddlers. Th e swimming lessons progressively develop children’s water skills in line with their physical, mental and emotional development phases.
Th is is a franchising organisation, running 54 businesses across the UK and currently teaches circa 41,000 babies and toddlers each week, which also includes a signifi cant number of children with special needs and other health related conditions.
A large amount of anecdotal evidence exists showing the impact of the programme in improving the overall health and wellbeing of clients. Evaluation of the programme is currently being undertaken by Manchester University.
Key Survey Stats » 952 physical activity programmes
submitted nationally
» Of these 368 receive funding from the
local authority
» Th ere are over 3.5 million people taking
part in these programmes annually
Th e physical activity behaviour change pathway is based on the NHS physical activity care pathway ‘Let’s Get Moving’. It provides an overarching framework for embedding physical activity into cancer care and works to develop sporting opportunities for people with cancer.
Included in this is the delivery of the Get Healthy Get Into Sport Macmillan project and the provision of an evidence based approach to service delivery.
Participants are referred through health professionals, health and well being events, community groups Boots, information centres and charities with a specifi c focus on 50+, black minority and ethnic populations of some areas.
Water Babies
Macmillan Cancer Support “Get Healthy, Get Into Sport”
Key Facts
Setting
Running Length
Funding
Participants per year
School, local authority leisure
facility, private leisure facility,
community venue, primary care
setting
6 - 8 years
Private
More than 25,000
+29 +28 +49 +42 +26 +25
What are the steps to solving inactivity?“People and communities themselves. If we could suffi ciently connect and utilise these assets we would be able to make a fantastic improvement in people’s levels of physical activity. ” Professor Paul Plant, Deputy Director of Public Health England (London)
Key Facts
Setting
Running Length
Funding
Participants per year
Local authority leisure facility,
private leisure facility, home
based, outdoor settings,
community venue, primary care
12 - 18 months
Sport England
500 - 1000
Steps to solving inactivity | November 2014 www.ukactive.com 21
Untitled-1 21 11/11/2014 08:58:36

Steps to solving inactivity | November 201422 www.ukactive.com
North WestOut of nine regions the North West has the highest percentage of people who are physically inactive
National Average: North West Region vs. National Average1
1 For graph key refer to page 20
Physical inactivity
Inactivity (previous year)
Average spend
Average spend (% PH grant)
Average spend (2013/14)
Average spend (% PH grant 2013/14)
32.48%28.86%
31.37%28.51%
£493,331
£480,989
4.32%4.19%
£324,695£261,791
4%
2.49%
Authority name
National rank
Change since last
data
Percentage Inactive (2013)
Physical Activity spend
(2013/14)
Spend as a % of PH grant
(2013/14)
Physical activity spend (2014/15)
Spend as a % of PH grant(2014/15)
Wirral 34 26 DNA DNA £471,000 2.4
Cheshire West and Chester 35 26 DNA DNA £48,000 0.5
Warrington 55 28 DNA DNA £167,000 3
Manchester 73 29 DNA DNA £1,602,953 6.1
Traff ord 76 29 £262,438 4 £349,797 1.9
Bury 81 29 £202,000 4.2 £50,000 1.4
Cheshire East 82 29 £77,500 1 £649,000 7.9
Stockport 83 30 £618,334 6.7 £684,000 7.1
Lancashire 90 30 DNA DNA DNA DNA
Cumbria 98 31 DNA DNA DNA DNA
Sefton 99 32 DNA DNA DNA DNA
St. Helens 102 32 DNA DNA £313,000 3.9
Salford 111 33 DNA DNA £297,000 3.6
Liverpool 112 33 DNA DNA DNA DNA
Halton 115 34 DNA DNA £590,340 7
Rochdale 130 = 36 DNA DNA DNA DNA
Blackburn with Darwen 132 36 £794,485 6.1 DNA DNA
Wigan 135 36 DNA DNA £771,000 5.3
Bolton 140 37 DNA DNA DNA DNA
Oldham 142 37 DNA DNA £600,000 6.3
Knowsley 143 37 DNA DNA £505,000 6.9
Tameside 147 38 DNA DNA DNA DNA
Blackpool 148 38 £250,000 2 DNA DNA
Most deprived More deprived Average Less deprived Least deprived Moved up Moved down +33 +32 +48 +47 +32 +40 ++29 +28 +49 +42 +26 +25 North West Average National Average
Key fi ndings
» Th e North West is now classed as the ‘most inactive’ region in England
» Wirral is the best performing local authority in the region with 26 per cent of its population classed as inactive
» Th e most inactive local authority in the North West is Blackpool with 38 per cent of people classed as inactive
Untitled-1 22 11/11/2014 08:58:36
Case studiesKey FactsSetting
Running Length
Funding
Participants per year
Local authority leisure facility, home-based, outdoor settings, community venue, primary care settings
10+ years
Local authority
1,000 - 5,000
Key FactsSetting
Running Length
Funding
Participants per year
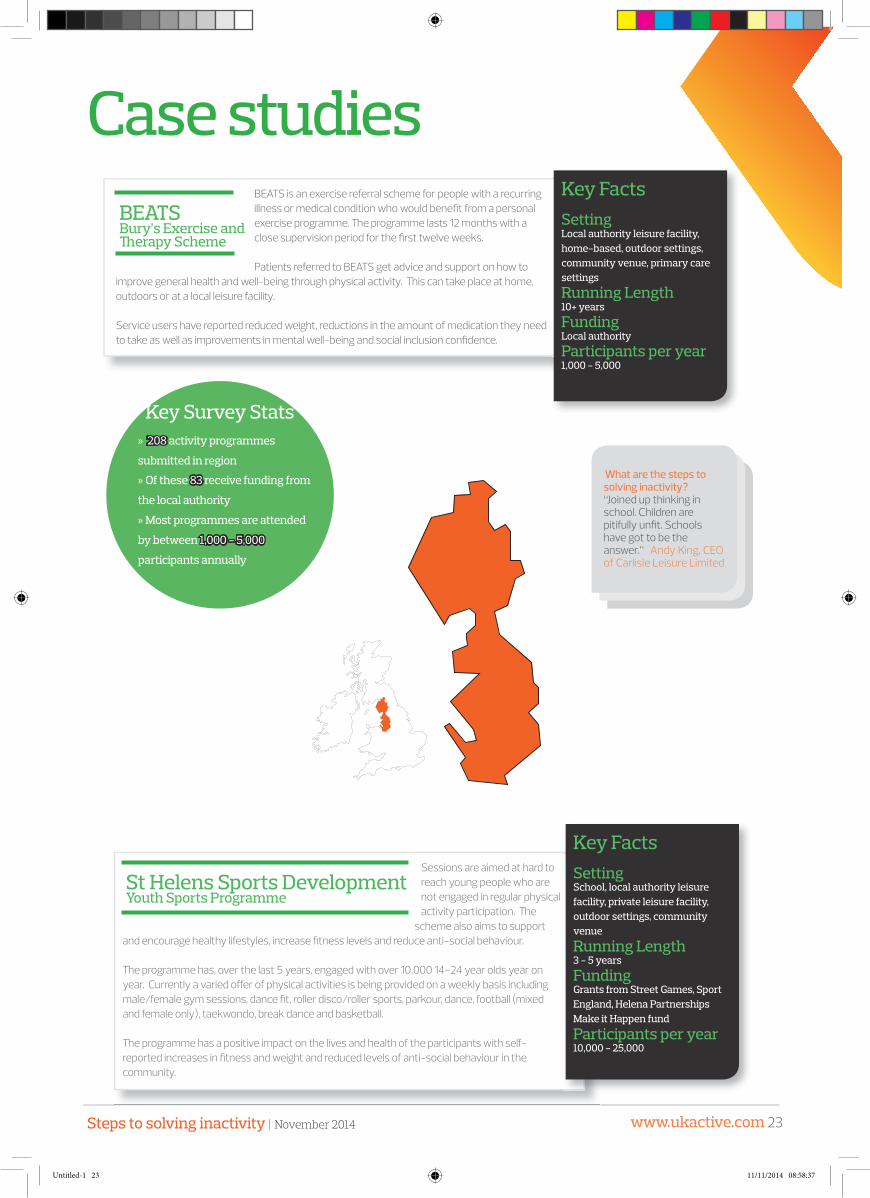
BEATS is an exercise referral scheme for people with a recurring illness or medical condition who would benefi t from a personal exercise programme. Th e programme lasts 12 months with a close supervision period for the fi rst twelve weeks.
Patients referred to BEATS get advice and support on how to improve general health and well-being through physical activity. Th is can take place at home, outdoors or at a local leisure facility.
Service users have reported reduced weight, reductions in the amount of medication they need to take as well as improvements in mental well-being and social inclusion confi dence.
Sessions are aimed at hard to reach young people who are not engaged in regular physical activity participation. Th e
scheme also aims to support and encourage healthy lifestyles, increase fi tness levels and reduce anti-social behaviour.
Th e programme has, over the last 5 years, engaged with over 10,000 14-24 year olds year on year. Currently a varied off er of physical activities is being provided on a weekly basis including male/female gym sessions, dance fi t, roller disco/roller sports, parkour, dance, football (mixed and female only), taekwondo, break dance and basketball.
Th e programme has a positive impact on the lives and health of the participants with self-reported increases in fi tness and weight and reduced levels of anti-social behaviour in the community.
BEATSBury’s Exercise and Th erapy Scheme
St Helens Sports DevelopmentYouth Sports Programme
School, local authority leisure facility, private leisure facility, outdoor settings, community venue
3 - 5 years
Grants from Street Games, Sport England, Helena Partnerships Make it Happen fund
10,000 - 25,000
» 208 activity programmes
submitted in region
» Of these 83 receive funding from
the local authority
» Most programmes are attended
by between 1,000 - 5,000
participants annually
What are the steps to solving inactivity?“Joined up thinking in school. Children are pitifully unfi t. Schools have got to be the answer.” Andy King, CEO of Carlisle Leisure Limited
Key Survey Stats
Steps to solving inactivity | November 2014 www.ukactive.com 23
Untitled-1 23 11/11/2014 08:58:37

Steps to solving inactivity | November 201424 www.ukactive.com
North EastOut of nine regions the North East has the second highest percentage of people who are physically inactive
Authority name
National rank
Change since
last data
Percentage Inactive(2013)
Physical Activity spend (2013/14)
Spend as a % of PH grant(2013/14)
Physical activity spend
(2014/15)
Spend as a % of PH grant(2014/15)
Northumberland 33 26 £93,146 1.7 £206,000 3.2
Newcastle upon Tyne 72 29 £822,957 5.7 DNA DNA
Stockton-on-Tees 74 29 £12,426 0.1 £698,000 9.2
North Tyneside 77 29 DNA DNA £50,195 0.5
Redcar and Cleveland 79 29 £402,000 9.8 DNA DNA
Gateshead 86 29 £209,938 3.4 £220,000 3.5
County Durham 106 32 DNA DNA DNA DNA
Darlington 116 34 £103,000 2 DNA DNA
South Tyneside 122 34 DNA DNA DNA DNA
Middlesbrough 126 35 DNA DNA £668,000 8
Sunderland 138 36 £36,174 0.3 £1,849,000 16.3
Hartlepool 145 37 £154,000 2.5 DNA DNA
North East Average National Average
National Average: North East Region vs. National Average1
1 For graph key refer to page 20
Physical inactivity
Inactivity (previous year)
Average spend
Average spend (% PH grant)
Average spend (2013/14)
Average spend (% PH grant 2013/14)
+32 +31 +61 +68 +22 +32 +29 +28 +48 +42 +26 +25 +32 +31 +61 +68 +22 +32 +29 +28 +48 +42 +26 +25 +32 +31 +61 +68 +22 +32 +29 +28 +48 +42 +26 +25 +32 +31 +61 +68 +22 +32 Key fi ndings
» Just over 30 per cent of the population in the North East is classed as physically inactive
» Northumberland is the best performing local authority in the region with 26 per cent of its population classed as inactive
» Hartlepool is the most inactive local authority in the North East with 37 per cent of its population classed as physically inactive
31.72%28.86%
30.49%28.51%
£615,000
£480,989
6.18%4.19%
£255,075£261,791
2.73%
2.49%
Most deprived More deprived Average Less deprived Least deprived Moved up Moved down
What are the steps to solving inactivity?“Engaging with local community groups. Asking them questions on what they want and what they need. Conducting this analysis with the community themselves. Identifying the best form of intervention needed and working with them to sustain it.” Louise Bulmer, Active Lifestyles Offi cer at Tone Leisure Limited
Untitled-1 24 11/11/2014 08:58:37

Case studiesKey Facts
Setting
Running Length
Funding
Participants per year
Th is programme targets whole communities and runs a series of walks using the Nordic walking technique in local communities.
Th e scheme locates an area where there is a need for Nordic Walking, then a 12 week pilot is delivered. From this pilot a volunteer / instructor is found who would like to access the training & keep the session running.
Th e 12 week pilot programme showed that improvements were made in both physical measurements, hours slept and level of activity undertaken. In addition participants reported benefi ts in ‘general fi tness’, ‘improved mobility’ and ‘feeling more relaxed/ less stressed’ were the most evident physical improvements. Many participants also emphasised the improvements in /awareness of posture.
WOW is a 45ft mobile fi tness suite and lifestyle resource. As a consequence of the WOW truck visits across the County (500,000 population) in blocks
of 12-14 weeks, a network of 16 legacy ‘wellbeing hubs’ have been developed to date - and more are on their way.
Th e WOW visit is a catalyst to a programme of support to a community for a locally cultivated programme of activity. Th is is developed by the community, for their community. Th e scheme aims to increase physical activity in remote and deprived communities.
Th e programme has been independently evaluated by Helmepark Ltd who were commissioned by the PCT/Public Health Team. Th e 2 year evaluation, in which WOW particularly focused upon those at risk of CVD, identifi ed 2385 new recruits in that period, of which 67% retained exercising at 6mths. A two year independent evaluation led by Helmepark Ltd, commissioned by Public Health Team, which specifi cally focused upon the economic outcomes linked solely to CVD, illustrated that for those with a risk of CVD there was a return on investment to the NHS and the community of £7.11 for every £1.
Get Active Nordic Walking
Wellness on Wheels (WOW)and the Legacy Network
Workplace, outdoor settings,
community venue
1 - 2 years
Local authority
5,000 - 10,000
Key Facts
Setting
Running Length
Funding
Participants per year
Community settings
6 - 8 years
Local authority
1,000 - 5,000
» 125 activity programmes submitted
in region
» Of these, 36 receive funding from the
local authority
» Most programmes are attended
by more than 25,000 participants
annually
Key Survey Stats
Steps to solving inactivity | November 2014 www.ukactive.com 25
Untitled-1 25 11/11/2014 08:58:38
Steps to solving inactivity | November 201426 www.ukactive.com
Yorkshire and the Humber
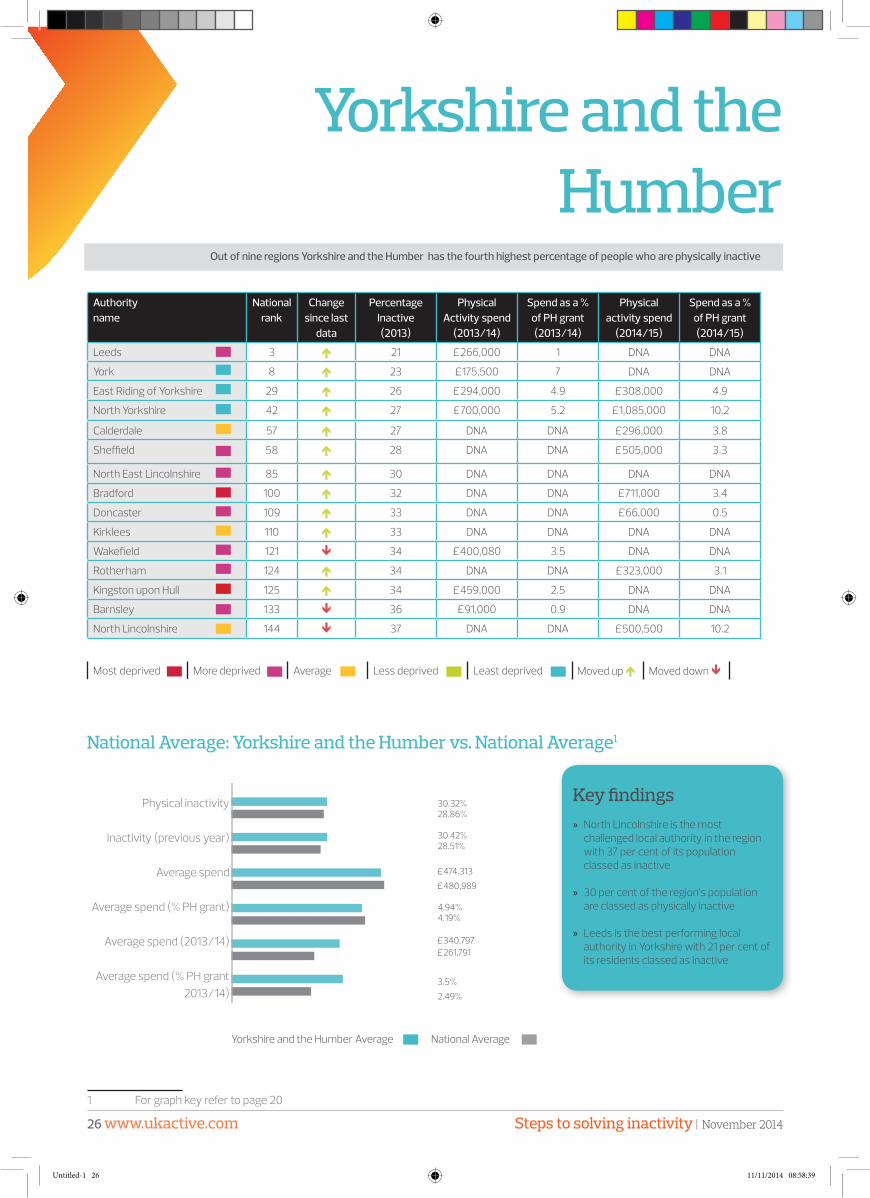
Out of nine regions Yorkshire and the Humber has the fourth highest percentage of people who are physically inactive
Authority name
National rank
Change since last
data
Percentage Inactive(2013)
Physical Activity spend
(2013/14)
Spend as a % of PH grant(2013/14)
Physical activity spend
(2014/15)
Spend as a % of PH grant(2014/15)
Leeds 3 21 £266,000 1 DNA DNA
York 8 23 £175,500 7 DNA DNA
East Riding of Yorkshire 29 26 £294,000 4.9 £308,000 4.9
North Yorkshire 42 27 £700,000 5.2 £1,085,000 10.2
Calderdale 57 27 DNA DNA £296,000 3.8
Sheffi eld 58 28 DNA DNA £505,000 3.3
North East Lincolnshire 85 30 DNA DNA DNA DNA
Bradford 100 32 DNA DNA £711,000 3.4
Doncaster 109 33 DNA DNA £66,000 0.5
Kirklees 110 33 DNA DNA DNA DNA
Wakefi eld 121 34 £400,080 3.5 DNA DNA
Rotherham 124 34 DNA DNA £323,000 3.1
Kingston upon Hull 125 34 £459,000 2.5 DNA DNA
Barnsley 133 36 £91,000 0.9 DNA DNA
North Lincolnshire 144 37 DNA DNA £500,500 10.2
Yorkshire and the Humber Average National Average
National Average: Yorkshire and the Humber vs. National Average1
1 For graph key refer to page 20
Physical inactivity
Inactivity (previous year)
Average spend
Average spend (% PH grant)
Average spend (2013/14)
Average spend (% PH grant 2013/14)
+30 +30 +47 +41 +34 +35 +29 +28 +48 +42 +26 +25 +30 +30 +47 +41 +34 +35 +29 +28 +48 +42 +26 +25 +30 +30 +47 +41 +34 +35 +29 +28 +48 +42 +26 +25 +30 +30 +47 +41 +34 +35 Key fi ndings » North Lincolnshire is the most
challenged local authority in the region with 37 per cent of its population classed as inactive
» 30 per cent of the region’s population are classed as physically inactive
» Leeds is the best performing local authority in Yorkshire with 21 per cent of its residents classed as inactive
30.32%28.86%
30.42%28.51%
£474,313
£480,989
4.94%4.19%
£340,797£261,791
3.5%
2.49%
Most deprived More deprived Average Less deprived Least deprived Moved up Moved down
Untitled-1 26 11/11/2014 08:58:39

Case studies
Key Facts
Setting
Running Length
Funding
Participants per year
Leeds Let’s Get Active is a programme of free gym and swim sessions as well as beginner running, family sports activities and health walks. Th e main aim of LLGA is to support
inactive people to become active. LLGA provides a supportive environment for those new to or returning to activity and supports those with medical conditions, those at risk of social isolation and those wanting to lose weight.
LLGA has currently (July 2014) seen around 90,000 visits which have included gym, swim, group activity classes and community activities. It has been estimated that each activity costs on average £4. Th is would mean that currently around £360,000 has been saved by LLGA members in Leeds participating in the scheme. Data is currently being analysed by Leeds Metropolitan University, the project’s research partner. Th is will include analysis of IPAQ at baseline compared with IPAQ at follow up alongside participation data.
Th e aim of Do Something Diff erent is to support adults with learning and physical disabilities to improve their health and wellbeing through increasing their physical activity levels.
Sessions vary from multi-sports including badminton, archery, wheelchair sports to rebound therapy, table tennis and much more. Participants are recruited through various methods including Learning Disability nurses, Adult Social Service and Adult Prevention Services.
Evidence so far shows that as a result of more opportunities being off ered by the programme, participants are increasing the amount of physical activity they are taking part in. Feedback gathered from participants, support workers, family members and coaches includes improved transferable skills such as self-esteem, mobility, co-ordination, listening skills, social interaction, confi dence, willingness to trying new activities. Participants have reported improvement in their health and wellbeing.
Leeds Let’s Get Active
Do Something Diff erentLocal authority leisure facility,
outdoor settings, community
venue
1 - 2 years
Local authority
100 -250
Key FactsSetting
Running Length
Funding
Participants per year
School, local authority leisure facility, home based, outdoor settings, community venue, primary care setting
10+ years
Local authority, central government
33,000
» 161 activity programmes submitted
in region
» Of these, 55 receive funding from the
local authority
» Most programmes are attended
by more than 25,000 participants
annually
What are the steps to solving inactivity?“Th e health sector. Th ere are thousands of doctors and nurses that interact with people every day but don’t get the message out enough about the benefi ts of physical activity. Use the health sector more to promote the message of activity..” Jeremy White, Director of Public Health at Sheffi eld City Council Key Survey Stats
Steps to solving inactivity | November 2014 www.ukactive.com 27
Untitled-1 27 11/11/2014 08:58:39

Steps to solving inactivity | November 201428 www.ukactive.com
West MidlandsOut of nine regions the West Midlands has the third highest percentage of people who are physically inactive
Authority name
National rank
Change since
last data
Percentage Inactive(2013)
Physical Activity spend
(2013/14)
Spend as a % of PH grant
(2013/14)
Physical activity spend
(2014/15)
Spend as a % of PH grant
(2014/15)
Herefordshire 40 27 £211,620 4.5 £79,184 1.9
Worcestershire 48 27 £320,000 2.6 £487,100 3.7
Warwickshire 64 28 £61,000 0.5 £81,000 1.2
Staff ordshire 69 28 DNA DNA £401,000 1.6
Shropshire 70 28 DNA DNA DNA DNA
Solihull 71 29 DNA DNA £94,000 1.7
Walsall 94 31 DNA DNA DNA DNA
Birmingham 108 33 £2,464,778 4.8 £4,500,000 8.7
Coventry 117 34 £379,178 3.1 £163,430 1.4
Telford and Wrekin 118 34 DNA DNA £617,440 11.7
Wolverhampton 131 36 DNA DNA DNA DNA
Sandwell 136 36 £108,300 1.2 DNA DNA
Dudley 139 37 £730,000 6.8 £700,000 6.1
Stoke-on-Trent 146 38 £464,000 3.4 £161,550 1.5
West Midlands Average National Average
National Average: West Midlands Region vs. National Average1
1 For graph key refer to page 20
Physical inactivity
Inactivity (previous year)
Average spend
Average spend (% PH grant)
Average spend (2013/14)
Average spend (% PH grant 2013/14)
+31 +32 +72 +39 +32 +33 +29 +28 +48 +42 +26 +25 +31 +32 +72 +39 +32 +33 +29 +28 +48 +42 +26 +25 +31 +32 +72 +39 +32 +33 +29 +28 +48 +42 +26 +25 +31 +32 +72 +39 +32 +33 National Average: West Midlands Region vs. National Average1
Key fi ndings » Th e West Midlands is the only region in England to have decreased its levels of inactivity (albeit very slightly) meaning it is no longer the most
inactive region in the country
» Herefordshire is the best performing local authority in the region with 27 per cent of its population classed as inactive
» Th e local authority with the highest levels of inactivity in the West Midlands is Stoke-on-Trent with 38 per cent of its residents classed as physically inactive
31.81%28.86%
32.02%28.51%
£728,470
£480,989
3.97%4.19%
£324,695£261,791
3.3%
2.49%
Most deprived More deprived Average Less deprived Least deprived Moved up Moved down
What are the steps to solving inactivity?“Th e way we programme our current facilities. How do we open the doors to facilities to engage those who don’t use them. Get really good people out to get in touch with their communities.” Carl Bennett, Senior Health Improvement Specialist at Stoke on Trent City Council Public Health Directorate
Untitled-1 28 11/11/2014 08:58:40

Case studiesTh e Sustrans Connect2 project aims to encourage healthier, cheaper and cleaner journeys by transforming everyday travel across the UK.
In Worcester, in order to improve walking and cycling links to the city centre, creation of Diglis Bridge and the creation of quality routes around the riverside which has in turn created a 3.5km traffi c free riverside loop. A further 11km of traffi c free paths have been created or improved, giving access to this loop, together with just under 4km of quiet-road or shared-use footway links.
Th is project, which has seen major improvements to the cycling and walking infrastructure in Worcester, was delivered over a fi ve-year programme concluding in March 2013 However the programme is still promoted in the local area and there are plans to extend its reach. Th is local network has transformed the opportunities for active travel, enabling people to incorporate physical activity into their daily lives. It is estimated to carry over 3.3 million walking and cycling trips a year. In user surveys, 70% of users said the scheme had helped them to increase their levels of physical activity and 40% planned to walk more in the next 12 months.
Sustrans Connect2 Scheme Worcester
Key Facts
Setting
Running Length
Funding
Participants per year
Outdoor
6 - 8 years
Local authority, central
government, charity
Over 3,000,000
Key Survey Stats » 152 activity programmes
submitted in region
» Of these, 52 receive funding from
the local authority
» Most programmes are attended
by more than 25,000 participants
annually
Birmingham Be Active is a partnership initiative between Birmingham City Council and the three Birmingham PCT’s, aimed at increasing physical activity levels among Birmingham
residents through providing free access to public leisure centres, green space and structured chronic disease management services.
Th e programme is currently under review and development to consider the inclusion of wider determinants of health, e.g. smoking, NHS health checks, specialist weight management etc. Th e programme is already a population level approach but support is provided to other areas that are considering developing a similar model. An evaluation conducted by Birmingham University found 89% of participants increased their activity levels to moderately active or very active over 3 months. A costs benefi t analysis found the net benefi t of Be Active to be positive.
Birmingham Be ActiveKey Facts
Setting
Running Length
Funding
Participants per year
School, local authority leisure
facility, home based, outdoor
settings, community venue,
primary care setting
3 - 5 years
Local authority
150,000
Steps to solving inactivity | November 2014 www.ukactive.com 29
Untitled-1 29 11/11/2014 08:58:41

Steps to solving inactivity | November 201430 www.ukactive.com
East MidlandsOut of nine regions the East Midlands has the fi fth highest percentage of people who are physically inactive
Authority name
National rank
Change since last
data
Percentage Inactive (2013)
Physical Activity spend
(2013/14)
Spend as a % of PH grant(2013/14)
Physical activity spend
(2014/15)
Spend as a % of PH grant(2014/15)
Rutland 6 22 DNA DNA £43,000 6.5
Northamptonshire 30 26 DNA DNA £103,000 0.6
Nottinghamshire 52 27 £107,000 0.4 DNA DNA
Leicestershire 54 27 DNA DNA DNA DNA
Derbyshire 67 28 £808,583 4.1 £931,000 4.5
Lincolnshire 68 28 DNA DNA £1,049,000 5.1
Derby 75 29 DNA DNA DNA DNA
Leicester 128 35 £172,500 1 £933,000 6.7
Nottingham 137 36 DNA DNA DNA DNA
East Midlands Average National Average
National Average: East Midlands vs. National Average1
1 For graph key refer to page 20
Physical inactivity
Inactivity (previous year)
Average spend
Average spend (% PH grant)
Average spend (2013/14)
Average spend (% PH grant 2013/14)
+29 +28 +61 +47 +13 +18 +29 +28 +48 +42 +26 +25 +29 +28 +61 +47 +13 +18 +29 +28 +48 +42 +26 +25 +29 +28 +61 +47 +13 +18 +29 +28 +48 +42 +26 +25 +29 +28 +61 +47 +13 +18 Key fi ndings
» 29 per cent of the population in the East Midlands is classed as physically inactive which is slightly below the national average
» Rutland is the best performing local authority in the region with 22 per cent of its population classed as inactive
» Nottingham is the most inactive local authority with a total of 36 per cent of inactive residents
28.94%28.86%
28.83%28.51%
£611,000
£480,989
4.71%4.19%
£139,750£261,791
1.8%
2.49%
What are the steps to solving inactivity?“People. People sharing the message, being role models and encouraging and supporting other people to be more physically active.” Bob Laventure, BHF National Centre for Physical Activity & Health at Loughborough
Most deprived More deprived Average Less deprived Least deprived Moved up Moved down
Untitled-1 30 11/11/2014 08:58:41

Case studiesTh e B-You programme aims to ensure 50% of service users come from the 7 most deprived wards in the city of Derby.
Activities are delivered in the postcodes these wards fall in ensuring transport and access is not an issue i.e. within GP surgeries, community building and health care centres. Th e programme is fl exible, sustainable and free and involves local people within the decision making and design of the service.
Positive impacts have been observed by the participants and include reduced BMI, increased physical activity levels, and improved health and wellbeing.
B-YouLivewell
Key Facts
Setting
Running Length
Funding
Participants per year
Workplace, local authority leisure
facility, community venue
1 - 2 years
Local authority
1,000 - 5,000
Key Facts
Setting
Running Length
Funding
Participants per year
Th is project is a network of 5 Community Smarter Travel Hubs which are funded
through the Department of Transport’s Local Sustainable Transport Fund (LSTF) supported by local contributions from s106 and public health.
Each Hub has a dedicated Neighbourhood Smarter Travel Coordinator who work in their local community to deliver an intervention programme of locally focused sustainable travel events, activities and services, many of which take innovative approaches to promoting and supporting the take up of cycling through a range of tailored events, advice, training and cycle skills sessions.
Th e value of the Hubs programme is having a range of locally promoted activities and events on off er to the community with co-ordinated promotion, rather than isolated services. A core objective of the Hubs programme is to promote sustainable travel choices including getting more people walking and cycling more often. Th e 2013 TravelRight North survey reports an increase in walking and cycling activity in the area (up to 39% from 27%) compared with 2012 survey data.
Community Smarter Travel Hubs
School, local authority leisure
facility, outdoor settings,
community venue
1 - 2 years
Local authority, central
government
10,000 - 25,000
» 144 activity programmes
submitted in region
» Of these, 40 receive funding from
the local authority
» Most programmes are attended
by more than 25,000 participants
annually
Key Survey Stats
Steps to solving inactivity | November 2014 www.ukactive.com 31
Untitled-1 31 11/11/2014 08:58:42

Steps to solving inactivity | November 201432 www.ukactive.com
East of England Out of nine regions the East of England has the second lowest percentage of people who are physically inactive
Authority name
National rank
Change since last
data
Percentage Inactive(2013)
Physical activity spend
(2013/14)
Spend as a % of PH grant(2013/14)
Physical activity spend
(2014/15)
Spend as a % of PH grant(2014/15)
Bedford 5 22 £42,140 1.08 DNA DNA
Cambridgeshire 21 25 £278,000 1.79 £321,000 1.45
Hertfordshire 23 25 DNA DNA DNA DNA
Suff olk 43 27 £131,000 0.60 £349,000 1.90
Essex 53 27 £110,000 0.70 DNA DNA
Norfolk 59 28 DNA DNA £625,000 3.05
Central Bedfordshire 66 28 £0 0 DNA DNA
Southend-on-Sea 89 30 DNA DNA DNA DNA
Luton 96 31 £0 0 £80,000 8.90
Peterborough 101 32 £300,110 4.24 £177,434 3.40
Th urrock 104 32 £247,000 5.70 DNA DNA
East of England Average National Average
National Average: East of England vs. National Average1
1 For graph key refer to page 20
Physical inactivity
Inactivity (previous year)
Average spend
Average spend (% PH grant)
Average spend (2013/14)
Average spend (% PH grant 2013/14)
+28 +28 +35 +31 +11 +14 +29 +28 +48 +42 +26 +25 +28 +28 +35 +31 +11 +14 +29 +28 +48 +42 +26 +25 +28 +28 +35 +31 +11 +14 +29 +28 +48 +42 +26 +25 +28 +28 +35 +31 +11 +14 Key fi ndings
» Th e East of England is now the second best performing region in England behind the South East
» Th e best performing local authority is Bedford with 22 per cent of people classed as inactive
» Th urrock is the most challenged local authority in the region with 32 per cent of its population classed as inactive
28.02%28.86%
28.02%28.51%
£351,491
£480,989
3.18%4.19%
£110,047£261,791
1.4%
2.49%
What are the steps to solving inactivity?“Open space. Because there is no cost but we need to work closely with other colleagues in local authorities to ensure that areas of green space are safe, accessible and are a pleasant place to be.” Debra Richardson, Head of Preventative Health Commissioning, Public Health Core Team at Bedford Borough Council
Most deprived More deprived Average Less deprived Least deprived Moved up Moved down
Untitled-1 32 11/11/2014 08:58:42

Case studiesKey Facts
Setting
Running Length
Funding
Participants per year
Key Facts
Setting
Running Length
Funding
Participants per year
Th is is an ongoing programme of walks, funded by the County Council, Public Health Hertfordshire and District and Borough Councils.
Th ere are 3 seasonal programmes published throughout the year to provide a variety of walks. Health Walks are free, which therefore makes them accessible to all. Th e programme is aimed at communities which are subject to health inequalities, and therefore targets populations of people who would most benefi t from taking regular exercise as a preventative measure to improving their health.
Between April 2012 and the end of March 2013, 1730 walkers took part in Health Walks. Between April 2013 and the end of March 2014 2189 walkers took part. Th is is an increase of 27% in participation year on year.
Fit Villages provides local communities with the opportunity to run subsidised sporting and physical activity sessions from local facilities. Th e project targets people living in rural areas and aims to reduce barriers and increase accessibility to sport and physical activity and
make it a central part of local community life.
Participants are provided with the opportunity to engage with the activity programme at a reduced cost and without transport, time and environmental concerns – all reasons cited as obstructions to quality activity provision in rural areas.
Following local advertising, a volunteer co-ordinator is recruited in the village. Th ese coordinators carry out a survey (supplied by Fit Villages) in their village to establish what activity the local population would like – what time of day, day of the week etc. Th e activity chosen must be driven by the desires of the villagers.
Th is impact is recorded via questionnaires, with positive feedback recorded and around 80% of the activities continuing beyond the original funded sessions.
Hertfordshire Health Walks
Fit Villages
Outdoor
10+ years
Local authority, public health
Hertfordshire
1,000 - 5,000
Community venue
3 - 5 years
Local authority, Sport England
1,000 - 5,000
» 172 activity programmes
submitted in region
» Of these, 55 receive funding from
the local authority
» Most programmes are attended
by more than 25,000 participants
annually
Key Survey Stats
Steps to solving inactivity | November 2014 www.ukactive.com 33
Untitled-1 33 11/11/2014 08:58:43

Steps to solving inactivity | November 201434 www.ukactive.com
South EastOut of nine regions the South East has the lowest percentage of people who are physically inactive
Authority name
National rank
Change since last data
Percentage Inactive (2013)
Physical activity spend
(2013/14)
Spend as a % of PH grant(2013/14)
Physical activity spend
(2014/15)
Spend as a % of PH grant(2014/15)
Wokingham 7 23 £31,000 0.3 £94,000 4.8
Bracknell Forest 10 = 23 £0 0 £0 0
Oxfordshire 11 23 £80,000 0.4 £135,000 0.6
Brighton and Hove 12 23 £348,932 2 £305,000 2.3
Surrey 14 24 £0 0 £75,000 1.1
Windsor and Maidenhead 15 24 DNA DNA DNA DNA
Buckinghamshire 18 24 £110,000 1.4 DNA DNA
Milton Keynes 26 25 £39,060 0.6 £46,500 4.3
West Sussex 32 26 £84,000 0.6 £591,645 3.6
Southampton 41 27 DNA DNA £189,000 2.3
Hampshire 45 27 £173,000 0.8 DNA DNA
West Berkshire 49 27 £86,000 1.9 DNA DNA
Kent 60 28 DNA DNA £1,272,000 4
East Sussex 62 28 DNA DNA £668,089 4.2
Reading 88 30 £49,000 0.9 £323,000 5.6
Slough 95 31 £25,000 0.5 £80,000 2.2
Isle of Wight 103 32 DNA DNA DNA DNA
Portsmouth 105 32 DNA DNA DNA DNA
Medway 134 36 £540,111 8 £743,000 8.9
South East Average National Average
National Average: South East Region vs. National Average1
1 For graph key refer to page 20
Physical inactivity
Inactivity (previous year)
Average spend
Average spend (% PH grant)
Average spend (2013/14)
Average spend (% PH grant 2013/14)
+27 +26 +37 +34 +12 +13 +29 +28 +48 +42 +26 +25 +27 +26 +37 +34 +12 +13 +29 +28 +48 +42 +26 +25 +27 +26 +37 +34 +12 +13 +29 +28 +48 +42 +26 +25 +27 +26 +37 +34 +12 +13 Key fi ndings
» Wokingham remains the best performing local authority in the South East with 23 per cent of its residents classed as inactive
» Six of the 15 best performing local authorities are in the South East
» Medway is the most challenged local authority in the region with 36 per cent of its residents classsed as inactive
27.01%28.86%
26.47%28.51%
£370,186
£480,989
3.38%4.19%
£120,469£261,791
1.35%
2.49%
Most deprived More deprived Average Less deprived Least deprived Moved up Moved down
Untitled-1 34 11/11/2014 08:58:43
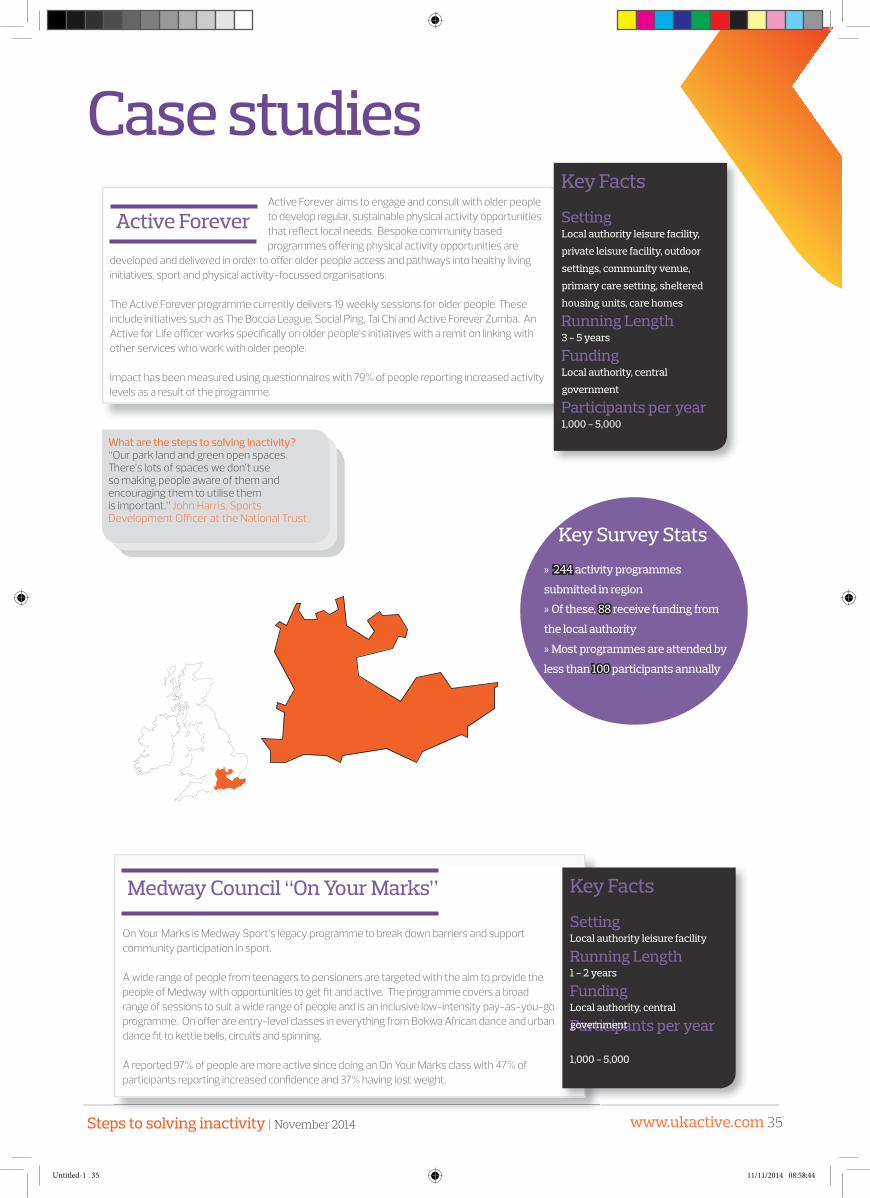
Case studiesKey Facts
Setting
Running Length
Funding
Participants per year
Key Facts
Setting
Running Length
Funding
Participants per year
Active Forever aims to engage and consult with older people to develop regular, sustainable physical activity opportunities that refl ect local needs. Bespoke community based programmes off ering physical activity opportunities are
developed and delivered in order to off er older people access and pathways into healthy living initiatives, sport and physical activity-focussed organisations.
Th e Active Forever programme currently delivers 19 weekly sessions for older people. Th ese include initiatives such as Th e Boccia League, Social Ping, Tai Chi and Active Forever Zumba. An Active for Life offi cer works specifi cally on older people’s initiatives with a remit on linking with other services who work with older people.
Impact has been measured using questionnaires with 79% of people reporting increased activity levels as a result of the programme.
On Your Marks is Medway Sport’s legacy programme to break down barriers and support community participation in sport.
A wide range of people from teenagers to pensioners are targeted with the aim to provide the people of Medway with opportunities to get fi t and active. Th e programme covers a broad range of sessions to suit a wide range of people and is an inclusive low-intensity pay-as-you-go programme. On off er are entry-level classes in everything from Bokwa African dance and urban dance fi t to kettle bells, circuits and spinning.
A reported 97% of people are more active since doing an On Your Marks class with 47% of participants reporting increased confi dence and 37% having lost weight.
Active Forever
Medway Council “On Your Marks”
Local authority leisure facility,
private leisure facility, outdoor
settings, community venue,
primary care setting, sheltered
housing units, care homes
3 - 5 years
Local authority, central
government
1,000 - 5,000
Local authority leisure facility
1 - 2 years
Local authority, central
government
1,000 - 5,000
» 244 activity programmes
submitted in region
» Of these, 88 receive funding from
the local authority
» Most programmes are attended by
less than 100 participants annually
What are the steps to solving inactivity?“Our park land and green open spaces. Th ere’s lots of spaces we don’t use so making people aware of them and encouraging them to utilise them is important.” John Harris, Sports Development Offi cer at the National Trust
Key Survey Stats
Steps to solving inactivity | November 2014 www.ukactive.com 35
Untitled-1 35 11/11/2014 08:58:44

Steps to solving inactivity | November 201436 www.ukactive.com
LondonAuthority name
National rank
Change since last data
Percentage Inactive(2013)
Physical activity spend (2013/14)
Spend as a % of PH grant
(2013/14)
Physical activity spend
(2014/15)
Spend as a % of PH grant(2014/15)
Richmond upon Th ames 1 16 £139,100 3.2 £123,000 2.5
Wandsworth 2 19 £283,000 1 £646,000 3.5
Lambeth 4 21 DNA DNA DNA DNA
Kingston upon Th ames 9 22 £330,000 5.9 £339,000 5.9
Merton 17 24 DNA DNA DNA DNA
Lewisham 22 25 £155,800 1.1 DNA DNA
Hammersmith and Fulham 24 25 £84,000 0.6 DNA DNA
Bromley 27 26 £409,000 5.4 £295,000 4.1
Islington 28 26 £175,000 0.9 £175,000 0.9
Westminster 31 26 DNA DNA DNA DNA
Sutton 36 26 £80,000 1.5 DNA DNA
Hackney 38 27 £777,745 4 DNA DNA
Barnet 39 27 DNA DNA DNA DNA
Southwark 47 27 £331,000 1.8 £264,000 1.5
Waltham Forest 50 27 DNA DNA DNA DNA
Haringey 51 27 £214,000 1.4 £635,000 4.1
Camden 56 28 DNA DNA £560,949 4.6
Croydon 65 28 £282,000 2 £278,558 1.8
Hounslow 78 29 £117,500 1.4 £160,000 1.7
Redbridge 80 29 DNA DNA DNA DNA
Kensington and Chelsea 84 30 £84,000 0.6 DNA DNA
Harrow 91 31 DNA DNA DNA DNA
Hillingdon 93 = 31 £55,449 0.7 DNA DNA
Greenwich 97 31 DNA DNA £526,000 5.4
Ealing 107 33 £221,000 1.8 £459,000 4.7
Bexley 113 33 DNA DNA £81,000 1.4
Tower Hamlets 114 34 £228,164 1.2 £264,495 1.2
Havering 119 34 DNA DNA £66,000 1.3
Brent 127 35 DNA DNA £1,411,000 10.1
Enfi eld 141 37 DNA DNA £187,000 2.1
Barking and Dagenham 149 39 DNA DNA DNA DNA
Newham 150 39 £216,000 3.1 £2,100,000 15.6
London Average National Average
Out of nine regions London has the fourth lowest percentage of people who are physically inactive
National Average: South East Region vs. National Average For graph key refer to page 2028 +27 +47 +40 +23 +21 +29 +28 +48 +42 +26 +25 National Average: South East Region vs. National Average +29 +28 +48 +42 +26 +25 28 +27 +47 +40 +23 +21 +29 +28 +48 +42 +26 +25 28 +27 +47 +40 +23 +21 National Average: South East Region vs. National Average For graph key refer to page 20
Key fi ndings
» Four of the ten best performing local authorities in England are located in London
» Th e Borough of Newham is the most inactive in England
» It has responded by increasing its allocated spend on physical activity in 2014/15 which is now 15.6 per cent of its public health budget
28.52%28.86%
27.53%28.51%
£476,176
£480,989
4.04%4.19%
£232,357£261,791
2.16%
2.49%
Most deprived More deprived Average Less deprived Least deprived Moved up Moved down
Physical inactivity
Inactivity (previous year)
Average spend
Average spend (% PH grant)
Average spend (2013/14)
Average spend (% PH grant 2013/14)
Untitled-1 36 11/11/2014 08:58:45

Case studiesKey Facts
Setting
Running Length
Funding
Participants per year
Key Facts
Setting
Running Length
Funding
Participants per year
Hackney Personal Bests is a sports and healthy lifestyle programme inspired by the Olympic & Paralympic games.
Personal Bests uses sports to enthuse and encourage individuals to try, take part and improve. Th e inspirational message that accompanies the programme is ‘Be the best you can be’.
Th e programme was fi rst delivered in 2008 and targeted schools identifi ed by the School Sports Partnership as having low levels of school sport provision. Th is increased to 26 schools in 2009 and up to 42 schools in 2012. During the fi rst session, the children set their baseline score in a series of Olympic and Paralympic based athletic disciplines. Th e programme is currently targeting 45 schools with approximately 3000 children taking part and is delivered over four sessions to entire year groups from years 3-6.
Community Champions projects are based on social housing estates. Volunteers are recruited and trained to become “Champions” and promote
health. Th ey conduct a survey with residents about their health concerns and organise and run a range of activities which respond to residents’ suggestions.
Activities include exercise classes in the community centre, football groups for kids, walking groups, healthy eating classes, community fun days and training using outdoor gyms.
A social return on investment analysis showed that for every £1 invested there was a return of £5.50. Physical activity increased for residents and for volunteer champions from “some of the time” to “most of the time”. 33% of residents reported waist size reduction of “one size” and average weight loss of 3.7kg. 38% of champions reported waist size reduction of one size and average weight loss of 4kg.
Hackney Personal Bests
Community Champions
School
6 - 8 years
Local authority
1,000 - 5,000
Outdoor settings, community
venue
3 - 5 years
Local authority
5,000 - 10,000
» 252 activity programmes
submitted in region
» Of these, 101 receive funding from
the local authority
» Most programmes are attended by
between 1,000 - 5,000 participants
annually
What are the steps to solving inactivity?“Using resources eff ectively. Th ere are lots of resources out there but it’s more about bringing them together and making sure that we use them effi ciently; transport, funds, public health, sports development teams and others.” Ruth Shaw, Public Health and Wellbeing at the Royal Borough of Greenwich
Key Survey Stats
Steps to solving inactivity | November 2014 www.ukactive.com 37
Untitled-1 37 11/11/2014 08:58:45

Steps to solving inactivity | November 201438 www.ukactive.com
South WestOut of nine regions the South West has the second lowest proportion of adults who are physically inactiveOut of nine regions the South West has the third lowest percentage of people who are physically inactive
Authority name
National rank
Change since last
data
Percentage Inactive(2013)
Physical activity spend
(2013/14)
Spend as a % of PH
grant(2013/14)
Physical activity spend
(2014/15)
Spend as a % of PH grant
(2014/15)
Bath and North East Somerset 13 23 £40,900 0.8 £209,000 4.7
Poole 16 24 £427,300 3 DNA DNA
Devon 19 25 £169,000 1.2 DNA DNA
South Gloucestershire 20 25 £192,196 4.9 £211,000 3.6
Wiltshire 25 25 £19,000 1.2 £387,000 6.5
Somerset 37 26 DNA DNA DNA DNA
North Somerset 44 27 DNA DNA £152,000 2
Gloucestershire 46 27 DNA DNA £995,000 6.6
Dorset 61 28 DNA DNA DNA DNA
Bournemouth 63 28 £427,300 3 DNA DNA
Cornwall 87 30 £289,000 2.1 £285,000 2.1
Bristol 92 31 DNA DNA £357,884 1.8
Plymouth 120 34 £200,562 2.3 £259,000 2.8
Torbay 123 34 DNA DNA £22,000 0.8
Swindon 129 35 DNA DNA £159,000 2.6
South West Average National Average
National Average: South East Region vs. National Average1
1 For graph key refer to page 20
Physical inactivity
Inactivity (previous year)
Average spend
Average spend (% PH grant)
Average spend (2013/14)
Average spend (% PH grant 2013/14)
+28 +27 +30 +35 +23 +23 +29 +28 +48 +42 +26 +25 +28 +27 +30 +35 +23 +23 +29 +28 +48 +42 +26 +25 +28 +27 +30 +35 +23 +23 +29 +28 +48 +42 +26 +25 +28 +27 +30 +35 +23 +23 Key fi ndings
» Th e average level of physical inactivity in local authorities in the South West region is 28 per cent
» Bath and North East Somerset has replaced Bournemouth as the best performing local authority in the region, with 23 per cent of its population classed as inactive
» Swindon is the most challenged local authority in the region with 35 per cent of its population classed as inactive
28.23%28.86%
27.06%28.51%
£303,668
£480,989
3.35%4.19%
£223,528£261,791
2.3%
2.49%
Most deprived More deprived Average Less deprived Least deprived Moved up Moved down
Untitled-1 38 11/11/2014 08:58:46

Case studiesKey Facts
Setting
Running Length
Funding
Participants per year
Key Facts
Setting
Running Length
Funding
Participants per year
Playing Out started with a residents’ association opening up one street for play. Th ey received a small amount of funding from NHS Bristol in 2010 to expand and have since gone on to secure core funding from public health and project monies from the Local
Sustainable Transport Fund and Play England.
Children and residents are provided with the opportunity to be physically active on their street through play by limiting vehicular traffi c during the after school period for a 2 hour period up to once a week.
Evaluation was carried out by the University of Bristol. 66 children aged 2 to 13yrs wore GPS and accelerometers during playing out events on 2 residential streets after school between 4 and 5pm. Children were outside approximately 70% of the time during the street closure monitoring period. Th is compares to less than 20% usually spent outdoors during this time period on an average school day by Bristol children of a similar age. Children spent 30% of their time outside during Playing Out sessions in moderate to vigorous physical activity (MVPA) and another 15% in light activity. Th is compares to on average 5% of time indoors spent in MVPA during this time of day for children of a similar age.
SHINE is a physical activity programme for the 50+ age group.
Th e main objectives are to increase physical activity levels through the provision of sessions across the Wokingham Borough. Th rough increasing physical activity levels SHINE is able to work on social inclusion and other health improvements (weight loss etc.).
Positive outcome measures have been observed such as improvements in health, reducing the use of walking aids, increased social involvement, self-worth and confi dence.
Playing Out
SHINESome Health Improvement Need Exercise
Outdoor settings
3 - 5 years
Local authority
1,000 - 5,000
Local authority leisure facility,
private leisure facility, outdoor
settings, community venue
3 - 5 years
Local authority
1,000 - 5,000
» 208 activity programmes
submitted in region
» Of these, 54 receive funding from
the local authority
» Most programmes are attended
by more than 25,000 participants
annually
What are the steps to solving inactivity?“Our working environment. Getting big employers to encourage their staff to be more active and have better facilities for that.” Tony Hurley, Head of Leisure & Commissioning, at West Dorset District Council
Key Survey Stats
Steps to solving inactivity | November 2014 www.ukactive.com 39
Untitled-1 39 11/11/2014 08:58:47

Steps to solving inactivity | November 201440 www.ukactive.com
United Kingdom
“We want to ensure that we capitalise on this golden opportunity for Scotland to achieve lasting change.”Shona Robison, Scottish Minister for Sport and the Commonwealth Games
Country Men Women
England 40% 28%
Northern Ireland 33% 28%
Wales 36% 23%
Scotland 43% 32%
The percentage of adults meeting the Chief Medical Officer guidelines on physical activ-ity in the UK from the Report “Start Active, Stay Active” published in 2011
Table 5
United Kingdom
Data for adult levels of physical inactivity does not exist for Scottish, Welsh and Northern Irish local authorities in a comparable format to local authorities in England. Therefore, it is not possible to compare levels of inactivity across the UK.
However, the governments of these three countries have been working alongside their partners to create a healthier and more active United Kingdom.
In recent years, each of the three Home Nations has taken steps to solve the inactivity pandemic by creating either a strategy, a piece of legislation or a national ambition to increase the number of people who are physically active enough to benefit their health.
Scotland
In 2012, the Scottish Health Survey found that 67 per cent of men and 58 per cent of women were meeting the Chief Medical Officer guidelines of 150 minutes moderate physical activity per week. This measurement included metrics such as walking and time spent active at work.44
Scotland was one of the first countries in Europe to introduce a national strategy to specifically tackle physical inactivity in 2003.45
It has built on this by launching a renewed strategy “A More Active Scotland” as part of its pledge to establish a lasting legacy from the Commonwealth Games hosted in Glasgow in 2014.46
This sets out a long term implementation plan across key sectors and includes a new national walking and active travel plan and a focus on greater integration of physical activity pathways throughout the health and social care system.
According to “A More Active Scotland” report, inactivity is costing the NHS in Scotland over £91 million per year and is responsible for more than 2,500 premature deaths annually.47
Activity in the UK
Untitled-1 40 11/11/2014 08:58:47

“The Welsh government and external partners are working together to put increased physical activity at the heart of our drive to improve our nation’s health. Early signs are encouraging.”Ken Skates, Welsh Minister for Culture, Sport and Tourism
Wales
The “Active Adults Survey” carried out by Ipsos Mori and published by the Welsh government in 2014, found that 30 per cent of adults in Wales are failing to undertake ‘any’ sport or physical recreation activity in a week.48
The survey revealed that in the most inactive areas, almost 40 per cent of adults were not doing ‘any’ sport or physical recreation activity. This included Newport where this was the case for 36 per cent of its population and Rhonda Cyan Taf where it applied to 39 per cent of residents.49
The Welsh government has pressed ahead with several key pieces of legislation which are leading the way in Europe on population-wide promotion of physical activity. Last year, they launched Europe’s first active travel legislation which requires local authorities to incorporate active travel policies into transport considerations by law.50
In the first agreement of its kind, the Welsh NHS Confederation and Sport Wales also recently signed a Memorandum of Understanding (MoU) to create a healthier and more equal Wales.51 This MoU, which will initially cover the next three years, sets out six areas of cooperation including:
• Working together to support the people of Wales to enjoy more active, more equal and healthier lives
• Working to encourage people to look after their own health and thereby take care of the health of future generations
• Working to foster a co-productive relationship with the people of Wales • Working together to support the drive for a mass shift in public thinking about their health • Exchanging information of mutual interest • Developing joint areas of work that promote ‘sport for all’ and encourage participation across
the life span52
Northern Ireland
The Northern Irish executive has developed two cross-government strategies to tackle the inactivity epidemic they are facing.
They have recently set out both the “Northern Ireland Strategy for Sport & Physical Recreation 2009-2019” 53and “A Fitter Future for All: A framework for addressing and preventing obesity in Northern Ireland 2012 – 2021.” 54
The combined ambition of the Northern Ireland executive and its partners is for a physically active lifestyle to be ‘the norm’ by 2021.55
There are also specific ambitions to increase participation in sport and recreation amongst disabled people by 6 per cent and to have 45,000 trained and qualified volunteer coaches and instructors to supply the increased demand in physical activity opportunities.56
Northern Ireland leads in its long standing focus on access to facilities and spatial planning within the development of its sport and physical activity strategy. By 2019, they want to ensure that all policy related to urban planning and open space includes physical activity, sport and recreation.57
“With the support of all those interested in sport and physical recreation we will meet the challenges and make the most of the opportunity before us to leave a lasting and sustainable legacy for Northern Ireland.”Nelson McCausland, MLA Minister for the Department of Culture, Arts and Leisure
Scotland, Wales and Northern Ireland
Steps to solving inactivity | November 2014 www.ukactive.com 41
Untitled-1 41 11/11/2014 08:58:47
Steps to solving inactivity | November 201442 www.ukactive.com
Annexes
Annex A - Methodology
Annex B - References
Annex C - Tables of socio-economic deprivation
Most deprivedMore deprivedAverageLess deprivedLeast deprived
Annex D - Full national rankings data table
43-44
45-46
4748495051
52-57
Untitled-1 42 11/11/2014 08:58:47

Methodology Annex A
InactivityPercentage of physically active and inactive peopleDescription:
Data on physical inactivity for 2012 was provided for the first time in the Public Health Outcomes Framework Data Tool. It was collated by Sport England and the Department of Health’s Active People Survey, having included a new methodology for ‘inactive adults’ for the past two years. It has been updated for the year 2013 with data collected between April 2013 - April 2014.
The data in the Public Health Outcomes Framework is referred to as indicator 2.13ii, ‘percentage of active and inactive adults - inactive adults’. The national average for England has been calculated as the weighted mean of the levels of inactivity in all top tier local authority areas in England in relation to the individual population weighting of each area.
The Chief Medical Officer defines physical inactivity as participation in less than 30 minutes of moderate intensity physical activity per week. The Active People Survey classes someone as physically inactive when a respondent aged 16 and over, with valid responses to questions on physical activity, states that they are doing less than 30 “equivalent” minutes of at least moderate intensity physical activity per week in bouts of 10 minutes or more in the previous 28 days expressed as a percentage of the total number of respondents aged 16.
The activities included in this are sport and active recreation (i.e. leisure time fitness), recreational cycling and walking, cycling and walking for active travel purposes, dance and gardening. Methodology: Bespoke telephone questionnaire collected data on frequency of participation in sport and active recreation during the previous 28 days.
Start date: 2005Frequency of survey: Survey 1: 2005-6; Survey 2: 2007-8; Survey 3: 2008; Survey 4: 2009-10; Survey 5: 2010-11; Survey 6: 2011-12; Survey 7: 2012-13 Survey 8: 2013-14Most recent full year results: 2013Commissioned by: Sport EnglandCoverage: Adult 16+yrs in England
Source: http://www.phoutcomes.info/public-health-outcomes-framework#gid/1000049/par/E12000004
Premature deathsPremature deaths per 100,000Description: Sourced from Public Health England, the premature mortality data is based on directly standardised rates. This special measure of mortality makes allowances for the fact that death rates are higher in older populations and adjusts for differences in the age make up of different areas, enabling an accurate comparison.
Source: http://longerlives.phe.org.uk/
SpendInvestment in programmes that tackle physical inactivityDescription:
This data has been obtained from original Freedom of Information responses received between August 2014 and October 2014 as well as official government data. The FOI responses cover the amount of spending attributed towards programmes and services to increase physical activity for the spending year 2014/15 from local authority budgets to tackle top-tier public health issues. 99 of the 150 local authorities responded within the allocated time, however due to some inconsistencies with data, or some confusion from the local authority about how or where funding should be classified, only 88 were used in this report.
To provide comparable figures, local authorities were also asked to supply their levels of spending on sexual health, smoking, alcohol misuse, drug misuse and obesity. When combined with their spending on physical activity, this provides total top tier public health spending on interventions cited in this report.
Steps to solving inactivity | November 2014 www.ukactive.com 43
Untitled-1 43 11/11/2014 08:58:47

Steps to solving inactivity | November 201444 www.ukactive.com
To calculate the percentage, each of the above public health concerns were totalled and then divided into each spending category.
For top-line figures on local authority public health spending at a national level, the government’s own budget forecasting documents both for the 2014/15 spending year and the 2013/14 spending year have been used, and can be accessed below.
These documents provide details of the level of funding attributed towards physical activity programmes (both for adults and children), compared with funding for other top-tier public health concerns. These ‘top-tier’ concerns are referred to throughout this report and include the following areas:
Sexual health, drug misuse, alcohol misuse, smoking cessation, obesity, physical activity
Sources: https://www.whatdotheyknow.com/user/jack_stanson/profile
https://www.gov.uk/government/uploads/system/uploads/attachment_data/file/365581/RA_Budget_2014-15_Statistical_Release.pdf
https://www.gov.uk/government/uploads/system/uploads/attachment_data/file/225884/RA_Budget_2013-14_Statistical_Release_-_FINAL__2_.pdf
Socio-economic deprivationDeprivation statusOn the mortality rank tables, these five socio-economic groups are described as: ‘least deprived’, ‘less deprived’, ‘average’, ‘more deprived’ and ‘most deprived’.
These classifications are taken from Public Health England. Deprivation covers a broad range of issues and refers to unmet needs caused by a lack of resources of all kinds, not just financial.
Source: http://longerlives.phe.org.uk/mortality-rankings#are//par/E92000001
Views and opinions of key stakeholders:As part of the Moving More, Living More regional events held in July 2014, interviews were conducted with a range of key local and national stakeholders. A number of the quotes captured feature in this report.
Untitled-1 44 11/11/2014 08:58:47

References Annex BIntroduction1. Active People Survey, Department of Health and Sport England, (2013), Public Health Outcomes Framework indicator 2.13i & 2.13ii - http://www.phout-comes.info/public-health-outcomes-framework#gid/1000042/pat/6/ati/102/page/9/par/E12000004/are/E06000015
2. Local Authority Revenue Expenditure and Financing: 2014-15 Budget, England, Department for Communities and Local Government (2014), Local Au-thortity Revenue Expenditure and Financing 2013 - 14 Budget, England, Department for Communities and Local Government (2013) -https://www.gov.uk/government/uploads/system/uploads/attachment_data/file/225884/RA_Budget_2013-14_Statistical_Release_-_FINAL__2_.pdf - https://www.gov.uk/government/uploads/system/uploads/attachment_data/file/365581/RA_Budget_2014-15_Statistical_Release.pdf
3. Local Authority Revenue Expenditure and Financing: 2014-15 Budget, England, Department for Communities and Local Government (2014), Local Authortity Revenue Expenditure and Financing 2013 - 14 Budget, England, Department for Communities and Local Government (2013)
4. Turning the tide of inactivity, ukactive, (2014) - http://ukactive.com/downloads/managed/Turning_the_tide_of_inactivity.pdf
5. Nesta (2014) - http://www.nesta.org.uk/?gclid=CjwKEAjww8eiBRCE7qvK9Z7W_DgSJABfOjf2eKUMJ3wRcoK5WMHqNOMqm7tdgtHWi336xQM-fSvCGaBoCj3Lw_wcB
6. Active People Survey (2013)
7. Active People Survey (2013)
8. Designed to Move, Nike, (2012) - http://www.designedtomove.org/language-tunnel?next=/
9. Everybody Active, Every Day, Public Health England, (2014) - https://www.gov.uk/government/uploads/system/uploads/attachment_data/file/366112/Framework_23_Oct.pdf
10. Everybody Active, Every Day, Public Health England, (2014) - https://www.gov.uk/government/uploads/system/uploads/attachment_data/file/366112/Framework_23_Oct.pdf
11. Start Active, Stay Active, The Department of Health (2011) - https://www.gov.uk/government/uploads/system/uploads/attachment_data/file/216370/dh_128210.pdf
12. 122 World Health Organization member states and a specific criteria for inactivity, World Health Organisation Data Repository, (2008) - http://apps.who.int/gho/data/node.imr
13. Identifying ‘what works’ for local physical activity interventions, Public Health England, ukactive Research Institute and The National Centre for Sport and Exercise Medicine in Sheffield, (2014) - http://researchinstitute.ukactive.com/home
14. Local Authority Revenue Expenditure and Financing: 2014-15 Budget, England, Department for Communities and Local Government (2014)
15. Freedom of Information Requests to 150 local authorities in England, (2014) - https://www.whatdotheyknow.com/user/jack_stanson/profile
16. Local Authority Revenue Expenditure and Financing: 2014-15 Budget, England, Department for Communities and Local Government (2014) and Local Authortity Revenue Expenditure and Financing 2013 - 14 Budget, England, Department for Communities and Local Government (2013)
17. Local Authority Revenue Expenditure and Financing: 2014-15 Budget, England, Department for Communities and Local Government (2014)
18. Moving More, Living More, Cabinet Office, (2014) - https://www.gov.uk/government/publications/moving-more-living-more-olympic-and-paralympic-games-legacy
19. Moving More, Living More regional fora, ukactive, Public Health England, Local Government Association and County Sports Part-nership Network, (2014)- http://www.local.gov.uk/documents/10180/11443/Moving+More,%20Living+More+Regional+Forum+Ju-ly+2014/27171598-60a0-417b-b9de-cbc807dff9a9
20. Everybody Active, Every Day, Public Health England, (2014) - https://www.gov.uk/government/uploads/system/uploads/attachment_data/file/366112/Framework_23_Oct.pdf
21. Get Healthy, Get Active, Sport England, (2014) - http://www.sportengland.org/funding/our-different-funds/get-healthy,-get-active/
22. Cycling Delivery Plan, Department for Transport, (2014) - https://www.gov.uk/government/uploads/system/uploads/attachment_data/file/364791/141015_Cycling_Delivery_Plan.pdf
23. Responsibility Deal Physical Activity Network, Department of Health, (2012) - https://responsibilitydeal.dh.gov.uk/category/physicalactivity-net-work/
24. Five Year Forward View for the NHS, NHS England, (2014) - http://www.england.nhs.uk/wp-content/uploads/2014/10/5yfv-web.pdf
25. Investing in our Nation’s Future, Local Government Association, (2014) - http://www.local.gov.uk/documents/10180/6341755/LGA+Cam-paign+2014+-+100+Days/8255560f-7c96-432f-bbfe-514d3734a204
26. Identifying ‘what works’ for local physical activity interventions, (2014)
National Picture27. Active People Survey (2013)
Steps to solving inactivity | November 2014 www.ukactive.com 45
Untitled-1 45 11/11/2014 08:58:48

Steps to solving inactivity | November 201446 www.ukactive.com
28. Active People Survey (2013)
29. Longer Lives, Public Health England, (2014) - http://longerlives.phe.org.uk/
30. Longer Lives (2014)
31. Network of Public Health Observatories, Health Impact of Physical Inactivity (2013) - http://www.apho.org.uk/resource/view.aspx?RID=123459
32. Local Authority Revenue Expenditure and Financing: 2014-15 Budget, England, Department for Communities and Local Government (2014)
33. Local Authority Revenue Expenditure and Financing: 2014-15 Budget, England, Department for Communities and Local Government (2014)
34. Freedom of Information Requests to 150 local authorities in England, (2014)
35. Freedom of Information Requests to 150 local authorities in England, (2014)
36. Local Authority Revenue Expenditure and Financing: 2014-15 Budget, England, Department for Communities and Local Government (2014)
37. Vina, J., Sanchis‐Gomar, F., Martinez‐Bello, V., & Gomez‐Cabrera, M. C. (2012). Exercise acts as a drug; the pharmacological benefits of exercise. British jour-nal of pharmacology, 167(1), 1-12
38. Morris JN, Heady JA, Raffle PAB, Roberts CG, Parks JN. Coronary heart disease and physical activity of work. Lancet 1953;ii:1053–57; 1111–20
39. Pedersen, B. K., & Saltin, B. (2006). Evidence for prescribing exercise as therapy in chronic disease. Scandinavian journal of medicine & science in sports, 16(S1), 3-63
40. http://parliamentarycommissiononphysicalactivity.files.wordpress.com/2014/04/apcopa-final.pdf
41. Identifying ‘what works’ for local physical activity interventions, (2014)
42. Beedie, C., Mann, S., & Jimenez, A. (2014). Community Fitness Center-Based Physical Activity Interventions: A Brief Review. Current sports medicine reports, 13(4), 267-274.
43. Identifying ‘what works’ for local physical activity interventions, (2014)
United Kingdom44. Scottish Health Survey for adults, Scottish Government, (2012) - http://www.scotland.gov.uk/Topics/Statistics/Browse/Health/scottish-health-survey
45. Let’s Make Scotland More Active, Scottish Government, (2003) - http://www.scotland.gov.uk/Publications/2003/02/16324/17895
46. A More Active Scotland: Building a Legacy from the Commonwealth Games, Scottish Government (2014) - http://www.scotland.gov.uk/Re-source/0044/00444577.pdf
47. A More Active Scotland: Building a Legacy from the Commonwealth Games (2014)
48. Active Adults Survey, Welsh Assembly, (2014) - http://www.sportwales.org.uk/research--policy/surveys-and-statistics/active-adults-survey.aspx
49. Active Adults Survey (2014)
50. The Active Travel Wales Act, Welsh Assembly, (2013) - http://wales.gov.uk/consultations/transport/active-travel-design-guidance/?lang=en
51. Sport and Preventative Health MOU, Sport Wales (2014) - http://www.sportwales.org.uk/news--events/news--events/our-news/latest-news/sport-and-health-join-forces-in-preventative-action.aspx?lang=en&
52. Sport and Preventative Health MOU (2014)
53. Northern Ireland Strategy for Sport and Physical Recreation 2009-2019, Northern Ireland Exectutive (2009) - http://www.dcalni.gov.uk/sport_matters.pdf
54. A Fitter Future for All, Northern Ireland Executive (2012) - http://www.dhsspsni.gov.uk/framework-preventing-addressing-overweight-obesi-ty-ni-2012-2022.pdf
55. Northern Ireland Strategy for Sport and Physical Recreation 2009-2019 (2009)
56. Northern Ireland Strategy for Sport and Physical Recreation 2009-2019 (2009)
57. Northern Ireland Strategy for Sport and Physical Recreation 2009-2019 (2009)
Untitled-1 46 11/11/2014 08:58:48
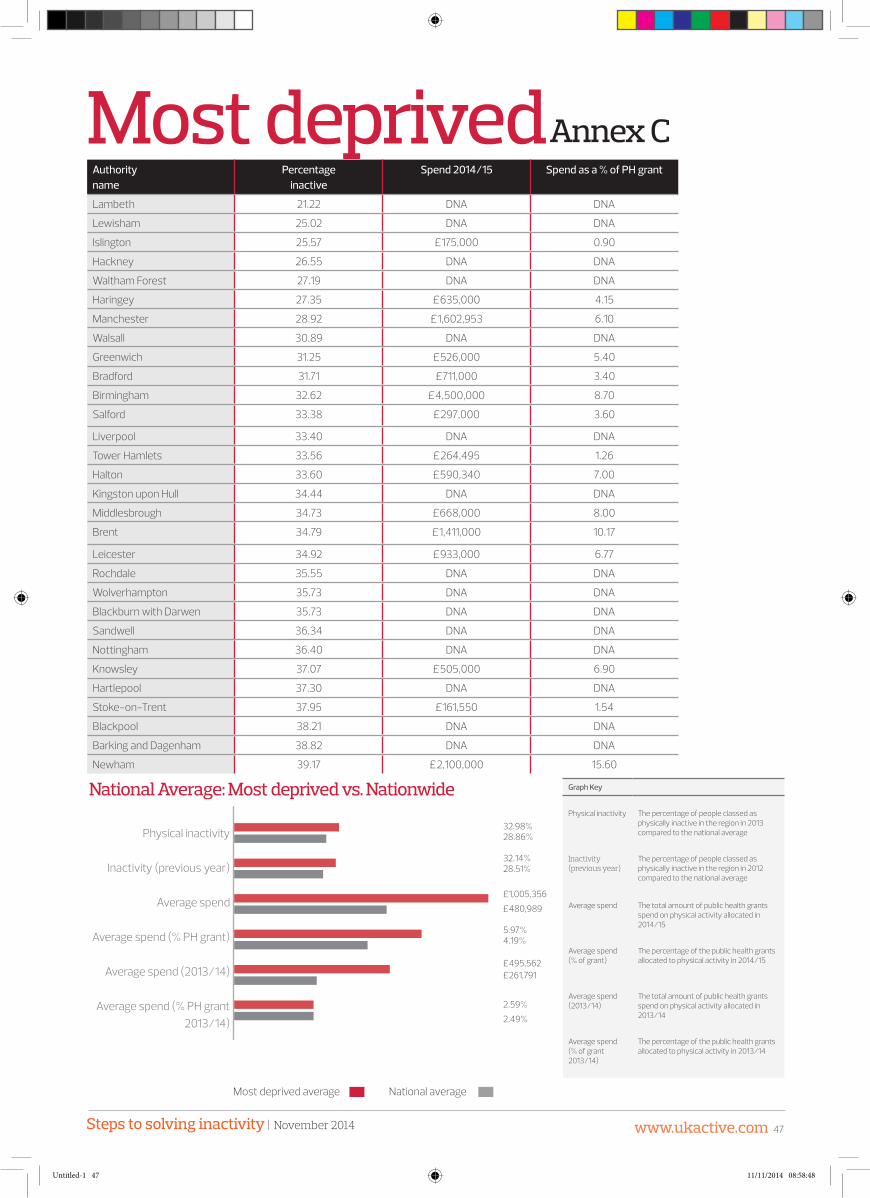
Steps to solving inactivity | November 2014 www.ukactive.com 47
National Average: Most deprived vs. Nationwide
Most deprivedAuthority name
Percentageinactive
Spend 2014/15 Spend as a % of PH grant
Lambeth 21.22 DNA DNA
Lewisham 25.02 DNA DNA
Islington 25.57 £175,000 0.90
Hackney 26.55 DNA DNA
Waltham Forest 27.19 DNA DNA
Haringey 27.35 £635,000 4.15
Manchester 28.92 £1,602,953 6.10
Walsall 30.89 DNA DNA
Greenwich 31.25 £526,000 5.40
Bradford 31.71 £711,000 3.40
Birmingham 32.62 £4,500,000 8.70
Salford 33.38 £297,000 3.60
Liverpool 33.40 DNA DNA
Tower Hamlets 33.56 £264,495 1.26
Halton 33.60 £590,340 7.00
Kingston upon Hull 34.44 DNA DNA
Middlesbrough 34.73 £668,000 8.00
Brent 34.79 £1,411,000 10.17
Leicester 34.92 £933,000 6.77
Rochdale 35.55 DNA DNA
Wolverhampton 35.73 DNA DNA
Blackburn with Darwen 35.73 DNA DNA
Sandwell 36.34 DNA DNA
Nottingham 36.40 DNA DNA
Knowsley 37.07 £505,000 6.90
Hartlepool 37.30 DNA DNA
Stoke-on-Trent 37.95 £161,550 1.54
Blackpool 38.21 DNA DNA
Barking and Dagenham 38.82 DNA DNA
Newham 39.17 £2,100,000 15.60
Annex C
Most deprived average National average
Physical inactivity
Inactivity (previous year)
Average spend
Average spend (% PH grant)
Average spend (2013/14)
Average spend (% PH grant 2013/14)
+33 +32 +80 +59 +49 +25 +29 +28 +48 +42 +26 +25 +33 +32 +80 +59 +49 +25 +29 +28 +48 +42 +26 +25 +33 +32 +80 +59 +49 +25 +29 +28 +48 +42 +26 +25 +33 +32 +80 +59 +49 +25 32.98%28.86%
32.14%28.51%
£1,005,356
£480,989
5.97%4.19%
£495,562£261,791
2.59%
2.49%
Graph Key
Physical inactivity Th e percentage of people classed as physically inactive in the region in 2013 compared to the national average
Inactivity (previous year)
Th e percentage of people classed as physically inactive in the region in 2012 compared to the national average
Average spend Th e total amount of public health grants spend on physical activity allocated in 2014/15
Average spend (% of grant)
Th e percentage of the public health grants allocated to physical activity in 2014/15
Average spend (2013/14)
Th e total amount of public health grants spend on physical activity allocated in 2013/14
Average spend (% of grant 2013/14)
Th e percentage of the public health grants allocated to physical activity in 2013/14
Untitled-1 47 11/11/2014 08:58:48
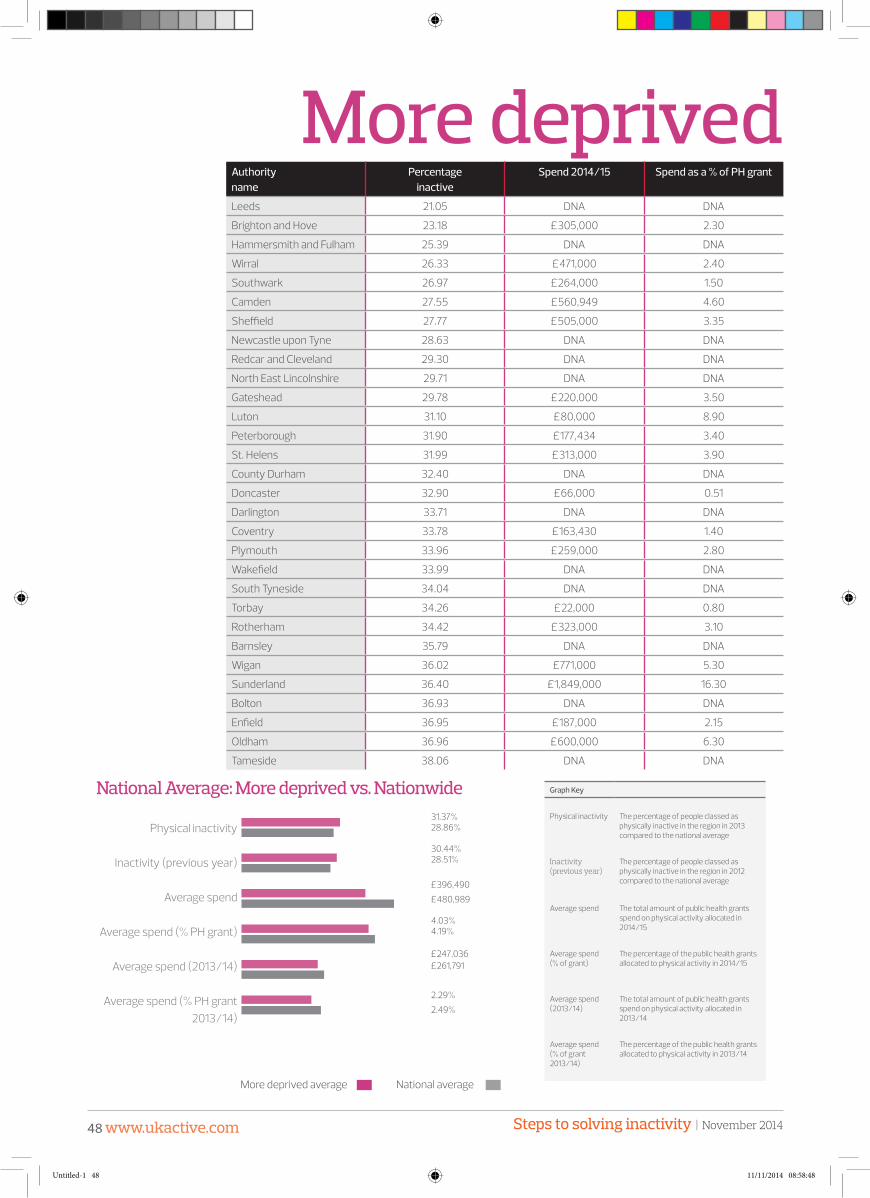
Steps to solving inactivity | November 201448 www.ukactive.com
National Average: More deprived vs. Nationwide
More deprivedAuthority name
Percentageinactive
Spend 2014/15 Spend as a % of PH grant
Leeds 21.05 DNA DNA
Brighton and Hove 23.18 £305,000 2.30
Hammersmith and Fulham 25.39 DNA DNA
Wirral 26.33 £471,000 2.40
Southwark 26.97 £264,000 1.50
Camden 27.55 £560,949 4.60
Sheffield 27.77 £505,000 3.35
Newcastle upon Tyne 28.63 DNA DNA
Redcar and Cleveland 29.30 DNA DNA
North East Lincolnshire 29.71 DNA DNA
Gateshead 29.78 £220,000 3.50
Luton 31.10 £80,000 8.90
Peterborough 31.90 £177,434 3.40
St. Helens 31.99 £313,000 3.90
County Durham 32.40 DNA DNA
Doncaster 32.90 £66,000 0.51
Darlington 33.71 DNA DNA
Coventry 33.78 £163,430 1.40
Plymouth 33.96 £259,000 2.80
Wakefield 33.99 DNA DNA
South Tyneside 34.04 DNA DNA
Torbay 34.26 £22,000 0.80
Rotherham 34.42 £323,000 3.10
Barnsley 35.79 DNA DNA
Wigan 36.02 £771,000 5.30
Sunderland 36.40 £1,849,000 16.30
Bolton 36.93 DNA DNA
Enfield 36.95 £187,000 2.15
Oldham 36.96 £600,000 6.30
Tameside 38.06 DNA DNA
More deprived average National average
Physical inactivity
Inactivity (previous year)
Average spend
Average spend (% PH grant)
Average spend (2013/14)
Average spend (% PH grant 2013/14)
+31+30+39+40+24+22+29+28+48+42+26+25 31.37%28.86%
30.44%28.51%
£396,490
£480,989
4.03%4.19%
£247,036£261,791
2.29%
2.49%
Graph Key
Physical inactivity The percentage of people classed as physically inactive in the region in 2013 compared to the national average
Inactivity (previous year)
The percentage of people classed as physically inactive in the region in 2012 compared to the national average
Average spend The total amount of public health grants spend on physical activity allocated in 2014/15
Average spend (% of grant)
The percentage of the public health grants allocated to physical activity in 2014/15
Average spend (2013/14)
The total amount of public health grants spend on physical activity allocated in 2013/14
Average spend (% of grant 2013/14)
The percentage of the public health grants allocated to physical activity in 2013/14
Untitled-1 48 11/11/2014 08:58:48
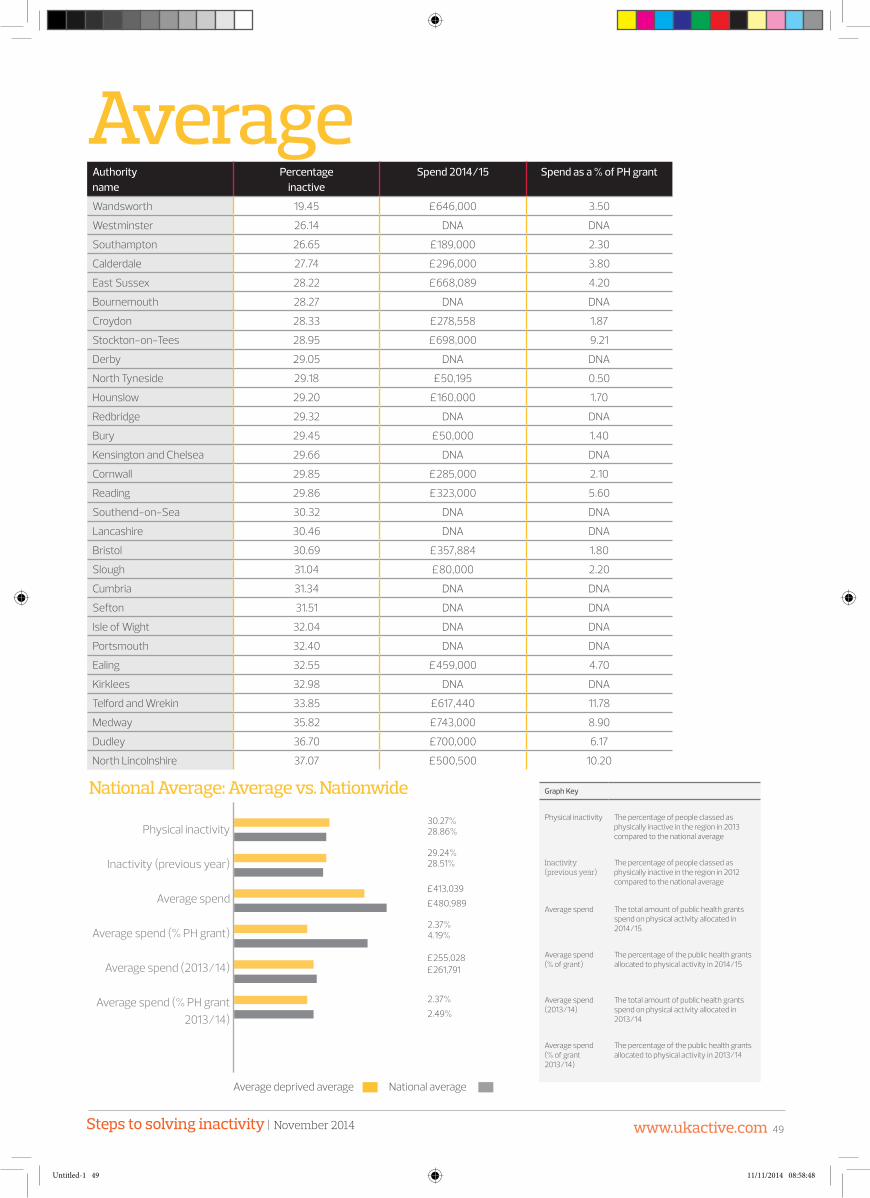
Steps to solving inactivity | November 2014 www.ukactive.com 49
National Average: Average vs. Nationwide
Average Authority name
Percentageinactive
Spend 2014/15 Spend as a % of PH grant
Wandsworth 19.45 £646,000 3.50
Westminster 26.14 DNA DNA
Southampton 26.65 £189,000 2.30
Calderdale 27.74 £296,000 3.80
East Sussex 28.22 £668,089 4.20
Bournemouth 28.27 DNA DNA
Croydon 28.33 £278,558 1.87
Stockton-on-Tees 28.95 £698,000 9.21
Derby 29.05 DNA DNA
North Tyneside 29.18 £50,195 0.50
Hounslow 29.20 £160,000 1.70
Redbridge 29.32 DNA DNA
Bury 29.45 £50,000 1.40
Kensington and Chelsea 29.66 DNA DNA
Cornwall 29.85 £285,000 2.10
Reading 29.86 £323,000 5.60
Southend-on-Sea 30.32 DNA DNA
Lancashire 30.46 DNA DNA
Bristol 30.69 £357,884 1.80
Slough 31.04 £80,000 2.20
Cumbria 31.34 DNA DNA
Sefton 31.51 DNA DNA
Isle of Wight 32.04 DNA DNA
Portsmouth 32.40 DNA DNA
Ealing 32.55 £459,000 4.70
Kirklees 32.98 DNA DNA
Telford and Wrekin 33.85 £617,440 11.78
Medway 35.82 £743,000 8.90
Dudley 36.70 £700,000 6.17
North Lincolnshire 37.07 £500,500 10.20
Average deprived average National average
Physical inactivity
Inactivity (previous year)
Average spend
Average spend (% PH grant)
Average spend (2013/14)
Average spend (% PH grant 2013/14)
30 +29 +41 +23 +25 +23 +29 +28 +48 +42 +26 +25 30 +29 +41 +23 +25 +23 +29 +28 +48 +42 +26 +25 30 +29 +41 +23 +25 +23 +29 +28 +48 +42 +26 +25 30 +29 +41 +23 +25 +23 30.27%28.86%
29.24%28.51%
£413,039
£480,989
2.37%4.19%
£255,028£261,791
2.37%
2.49%
Graph Key
Physical inactivity Th e percentage of people classed as physically inactive in the region in 2013 compared to the national average
Inactivity (previous year)
Th e percentage of people classed as physically inactive in the region in 2012 compared to the national average
Average spend Th e total amount of public health grants spend on physical activity allocated in 2014/15
Average spend (% of grant)
Th e percentage of the public health grants allocated to physical activity in 2014/15
Average spend (2013/14)
Th e total amount of public health grants spend on physical activity allocated in 2013/14
Average spend (% of grant 2013/14)
Th e percentage of the public health grants allocated to physical activity in 2013/14
Untitled-1 49 11/11/2014 08:58:48

Steps to solving inactivity | November 201450 www.ukactive.com
National Average: Less deprived vs. Nationwide
Less deprivedAuthority name
Percentageinactive
Spend 2014/15 Spend as a % of PH grant
Bedford 21.98 DNA DNA
Poole 24.15 DNA DNA
Devon 24.85 DNA DNA
Milton Keynes 25.43 £46,500 4.30
Northamptonshire 26.08 £103,000 0.60
Northumberland 26.26 £206,000 3.26
Cheshire West and Chester 26.36 £48,000 0.50
Sutton 26.47 DNA DNA
Somerset 26.49 DNA DNA
Barnet 26.59 DNA DNA
Herefordshire 26.60 £79,184 1.90
Suffolk 26.77 £349,000 1.90
Worcestershire 27.03 £487,100 3.70
Nottinghamshire 27.38 DNA DNA
Warrington 27.52 £167,000 3.00
Norfolk 27.79 £625,000 3.05
Kent 28.06 £1,272,000 4.00
Derbyshire 28.40 £931,000 4.50
Lincolnshire 28.46 £1,049,000 5.17
Staffordshire 28.49 £401,000 1.62
Shropshire 28.49 DNA DNA
Solihull 28.59 £94,000 1.70
Trafford 29.09 £349,797 1.90
Stockport 29.57 DNA DNA
Harrow 30.54 DNA DNA
Hillingdon 30.70 DNA DNA
Thurrock 32.36 DNA DNA
Bexley 33.47 £81,000 1.40
Havering 33.96 £66,000 1.34
Swindon 35.44 £159,000 2.60
Less deprived average National average
Physical inactivity
Inactivity (previous year)
Average spend
Average spend (% PH grant)
Average spend (2013/14)
Average spend (% PH grant 2013/14)
28+27+37+25+20+26+29+28+48+42+26+25 28.11%28.86%
27.66%28.51%
£373,799
£480,989
2.57%4.19%
£200,515£261,791
2.64%
2.49%
Graph Key
Physical inactivity The percentage of people classed as physically inactive in the region in 2013 compared to the national average
Inactivity (previous year)
The percentage of people classed as physically inactive in the region in 2012 compared to the national average
Average spend The total amount of public health grants spend on physical activity allocated in 2014/15
Average spend (% of grant)
The percentage of the public health grants allocated to physical activity in 2014/15
Average spend (2013/14)
The total amount of public health grants spend on physical activity allocated in 2013/14
Average spend (% of grant 2013/14)
The percentage of the public health grants allocated to physical activity in 2013/14
Untitled-1 50 11/11/2014 08:58:48

Steps to solving inactivity | November 2014 www.ukactive.com 51
Least deprived
National Average: Least deprived vs. Nationwide
Authority name
Percentageinactive
Spend 2014/15 Spend as a % of PH grant
Richmond upon Thames 16.34 £123,000 2.50
Rutland 22.33 £43,000 6.50
Wokingham 22.53 £94,000 4.80
York 22.70 DNA DNA
Kingston upon Thames 22.71 £339,000 5.90
Bracknell Forest 23.05 £0 0.00
Oxfordshire 23.07 £135,000 0.60
Bath and North East Somerset
23.36 £209,000 4.70
Surrey 23.53 £75,000 1.10
Windsor and Maidenhead 23.71 DNA DNA
Merton 24.24 DNA DNA
Buckinghamshire 24.35 DNA DNA
South Gloucestershire 24.89 £211,000 3.60
Cambridgeshire 24.94 £321,000 1.45
Hertfordshire 25.31 DNA DNA
Wiltshire 25.43 £387,000 6.50
Bromley 25.56 £295,000 4.10
East Riding of Yorkshire 25.89 £308,000 4.95
West Sussex 26.18 £591,645 3.60
North Yorkshire 26.67 £1,085,000 10.20
North Somerset 26.80 £152,000 2.00
Hampshire 26.89 DNA DNA
Gloucestershire 26.90 £995,000 6.60
West Berkshire 27.19 DNA DNA
Essex 27.43 DNA DNA
Leicestershire 27.45 DNA DNA
Dorset 28.07 DNA DNA
Warwickshire 28.33 £81,000 1.20
Central Bedfordshire 28.38 DNA DNA
Cheshire East 29.47 £649,000 7.90
Least deprived average National average
Physical inactivity
Inactivity (previous year)
Average spend
Average spend (% PH grant)
Average spend (2013/14)
Average spend (% PH grant 2013/14)
+25+24+32+41+14+20+29+28+48+42+26+25 25.12%28.86%
24.17%28.51%
£320,718
£480,989
4.12%4.19%
£149,949£261,791
2.04%
2.49%
Graph Key
Physical inactivity The percentage of people classed as physically inactive in the region in 2013 compared to the national average
Inactivity (previous year)
The percentage of people classed as physically inactive in the region in 2012 compared to the national average
Average spend The total amount of public health grants spend on physical activity allocated in 2014/15
Average spend (% of grant)
The percentage of the public health grants allocated to physical activity in 2014/15
Average spend (2013/14)
The total amount of public health grants spend on physical activity allocated in 2013/14
Average spend (% of grant 2013/14)
The percentage of the public health grants allocated to physical activity in 2013/14
Untitled-1 51 11/11/2014 08:58:48

Steps to solving inactivity | November 201452 www.ukactive.com
Full national rankings
Local authority name National Rank
Physically inactive (%)
Inactivity (previous
year)
Physical Activity spend
(2013/14)
Spend as a % of PH grant(2013/14)
Physical activity spend
(2014/15)
Spend as a % of grant
(2014/15)
Richmond upon Thames 1 16.34 20.03 £139,100 3.20% £123,000 2.50%
Wandsworth 2 19.45 22.76 £283,000 1% £646,000 3.50%
Leeds 3 21.05 26.85 £266,000 1% DNA DNA
Lambeth 4 21.22 21.72 DNA DNA DNA DNA
Bedford 5 21.98 25.62 £42,140 1.08% DNA DNA
Rutland 6 22.33 24.25 DNA DNA £43,000 6.50%
Wokingham 7 22.53 18.23 £31,000 0.31% £94,000 4.80%
York 8 22.70 23.67 £175,500 7% DNA DNA
Kingston upon Thames 9 22.71 22.77 £330,000 5.90% £339,000 5.90%
Bracknell Forest 10 23.05 22.66 £0 0 £0 0.00%
Oxfordshire 11 23.07 22.18 £80,000 0.40% £135,000 0.60%
Brighton and Hove 12 23.18 24.90 £348,932 2% £305,000 2.30%
Bath and North East Somerset 13 23.36 22.91 £40,900 0.80% £209,000 4.70%
Surrey 14 23.53 23.11 £0 0% £75,000 1.10%
Windsor and Maidenhead 15 23.71 20.20 DNA DNA DNA DNA
Poole 16 24.15 28.90 £427,300 3% DNA DNA
Merton 17 24.24 31.55 DNA DNA DNA DNA
Buckinghamshire 18 24.35 25.79 £110,000 1.40% DNA DNA
Devon 19 24.85 25.97 £169,000 1.20% DNA DNA
South Gloucestershire 20 24.89 22.80 £192,196 4.90% £211,000 3.60%
Cambridgeshire 21 24.94 22.76 £278,000 1.79% £321,000 1.45%
Lewisham 22 25.02 29.18 £155,800 1.10% DNA DNA
Hertfordshire 23 25.31 25.38 DNA DNA DNA DNA
Hammersmith and Fulham 24 25.39 20.79 £84,000 0.60% DNA DNA
Wiltshire 25 25.43 24.42 £19,000 1.20% £387,000 6.50%
Milton Keynes 26 25.43 28.97 £39,060 0.67% £46,500 4.30%
Bromley 27 25.56 24.08 £409,000 5.47% £295,000 4.10%
Islington 28 25.57 20.07 £175,000 0.90% £175,000 0.90%
East Riding of Yorkshire 29 25.89 26.36 £294,000 4.90% £308,000 4.95%
Northamptonshire 30 26.08 28.08 DNA DNA £103,000 0.60%
Annex D Table key
Authority name The name of the local authority
National rank 150 local authorities ranked in order of inactivity (no. 1 is the least inactive, no. 150 is the most inactive)
Physical inactivity The percentage of people classed as physically inactive in the region in 2013 compared to the national average
Inactivity (previous year) The percentage of people classed as physically inactive in the region in 2012 compared to the national average
Average spend The total amount of public health grants spend on physical activity allocated in 2014/15
Average spend (% PH grants) The percentage of the public health grants allocated to physical activity in 2014/15
Average spend (2013/14) The total amount of public health grants spend on physical activity allocated in 2013/14
Average spend (% of grants 2013/14)
The percentage of the public health grants allocated to physical activity in 2013/14
Untitled-1 52 11/11/2014 08:58:49

Steps to solving inactivity | November 2014 www.ukactive.com 53
Local authority name National Rank
Physically inactive (%)
Physically inactive (2012)
Physical Activity spend
(2013/14)
Spend as a % of PH grant(2013/14)
Physical activity spend
(2014/15)
Spend as a % of grant (2014/15)
Westminster 31 26.14 28.44 DNA DNA
West Sussex 32 26.18 25.60 £84,000 0.65% £591,645 3.60%
Northumberland 33 26.26 27.74 £93,146 1.72% £206,000 3.26%
Wirral 34 26.33 28.83 DNA DNA £471,000 2.40%
Cheshire West and Chester 35 26.36 26.43 DNA DNA £48,000 0.50%
Sutton 36 26.47 23.15 £80,000 1.51% DNA DNA
Somerset 37 26.49 27.30 DNA DNA DNA DNA
Hackney 38 26.55 30.20 £777,745 4.02% DNA DNA
Barnet 39 26.59 26.11 DNA DNA DNA DNA
Herefordshire 40 26.60 29.22 £211,620 4.54% £79,184 1.90%
Southampton 41 26.65 30.87 DNA DNA £189,000 2.30%
North Yorkshire 42 26.67 27.15 £700,000 5.20% £1,085,000 10.20%
Suffolk 43 26.77 27.03 £131,000 0.60% £349,000 1.90%
North Somerset 44 26.80 29.17 DNA DNA £152,000 2.00%
Hampshire 45 26.89 24.12 £173,000 0.80% DNA DNA
Gloucestershire 46 26.90 25.15 DNA DNA £995,000 6.60%
Southwark 47 26.97 26.32 £331,000 1.80% £264,000 1.50%
Worcestershire 48 27.03 26.44 £320,000 2.69% £487,100 3.70%
West Berkshire 49 27.19 25.51 £86,000 1.90% DNA DNA
Waltham Forest 50 27.19 28.36 DNA DNA DNA DNA
Haringey 51 27.35 26.40 £214,000 1.46% £635,000 4.15%
Nottinghamshire 52 27.38 27.98 £107,000 0.48% DNA DNA
Essex 53 27.43 26.96 £110,000 0.70% DNA DNA
Leicestershire 54 27.45 25.97 DNA DNA DNA DNA
Warrington 55 27.52 26.15 DNA DNA £167,000 3.00%
Camden 56 27.55 29.32 DNA DNA £560,949 4.60%
Calderdale 57 27.74 30.02 DNA DNA £296,000 3.80%
Sheffield 58 27.77 30.41 DNA DNA £505,000 3.35%
Table key
Authority name The name of the local authority
National rank 150 local authorities ranked in order of inactivity (no. 1 is the least inactive, no. 150 is the most inactive)
Physical inactivity The percentage of people classed as physically inactive in the region in 2013 compared to the national average
Inactivity (previous year) The percentage of people classed as physically inactive in the region in 2012 compared to the national average
Average spend The total amount of public health grants spend on physical activity allocated in 2014/15
Average spend (% PH grants) The percentage of the public health grants allocated to physical activity in 2014/15
Average spend (2013/14) The total amount of public health grants spend on physical activity allocated in 2013/14
Average spend (% of grants 2013/14)
The percentage of the public health grants allocated to physical activity in 2013/14
Untitled-1 53 11/11/2014 08:58:49

Steps to solving inactivity | November 201454 www.ukactive.com
Local authority name National Rank Physically inactive
(%)
Physically inactive (2012)
Physical Activity spend
(2013/14)
Spend as a % of PH grant
(2013/14)
Physical activity spend
(2014/15)
Spend as a % of grant (2014/15)
Norfolk 59 27.79 27.56 DNA DNA £625,000 3.05%
Kent 60 28.06 27.46 DNA DNA £1,272,000 4.00%
Dorset 61 28.07 28.07 DNA DNA DNA DNA
East Sussex 62 28.22 26.57 DNA DNA £668,089 4.20%
Bournemouth 63 28.27 20.41 £427,300 3% DNA DNA
Warwickshire 64 28.33 27.00 £61,000 0.50% £81,000 1.20%
Croydon 65 28.33 29.79 £282,000 2% £278,558 1.87%
Central Bedfordshire 66 28.38 28.03 £0 0 DNA DNA
Derbyshire 67 28.40 28.27 £808,583 4.14% £931,000 4.50%
Lincolnshire 68 28.46 29.00 DNA DNA £1,049,000 5.17%
Staffordshire 69 28.49 30.01 DNA DNA £401,000 1.62%
Shropshire 70 28.49 28.44 DNA DNA DNA DNA
Solihull 71 28.59 25.91 DNA DNA £94,000 1.70%
Newcastle upon Tyne 72 28.63 25.63 £822,957 5.77% DNA DNA
Manchester 73 28.92 40.24 DNA DNA £1,602,953 6.10%
Stockton-on-Tees 74 28.95 29.57 £12,426 0.16% £698,000 9.21%
Derby 75 29.05 28.47 DNA DNA DNA DNA
Trafford 76 29.09 24.75 £262,438 4% £349,797 1.90%
North Tyneside 77 29.18 27.30 DNA DNA £50,195 0.50%
Hounslow 78 29.20 29.30 £117,500 1.40% £160,000 1.70%
Redcar and Cleveland 79 29.30 28.73 £402,000 9.80% DNA DNA
Redbridge 80 29.32 29.52 DNA DNA DNA DNA
Bury 81 29.45 27.87 £202,000 4.20% £50,000 1.40%
Cheshire East 82 29.47 25.45 £77,500 1.04% £649,000 7.90%
Stockport 83 29.57 25.87 £618,334 6.70% DNA DNA
Kensington and Chelsea 84 29.66 20.72 £84,000 0.65% DNA DNA
North East Lincolnshire 85 29.71 29.49 DNA DNA DNA DNA
Gateshead 86 29.78 33.61 £209,938 3.40% £220,000 3.50%
Table key
Authority name The name of the local authority
National rank 150 local authorities ranked in order of inactivity (no. 1 is the least inactive, no. 150 is the most inactive)
Physical inactivity The percentage of people classed as physically inactive in the region in 2013 compared to the national average
Inactivity (previous year) The percentage of people classed as physically inactive in the region in 2012 compared to the national average
Average spend The total amount of public health grants spend on physical activity allocated in 2014/15
Average spend (% PH grants) The percentage of the public health grants allocated to physical activity in 2014/15
Average spend (2013/14) The total amount of public health grants spend on physical activity allocated in 2013/14
Average spend (% of grants 2013/14)
The percentage of the public health grants allocated to physical activity in 2013/14
Untitled-1 54 11/11/2014 08:58:49

Steps to solving inactivity | November 2014 www.ukactive.com 55
Local authority name
National Rank
Physically inactive (%)
Physically inactive (2012)
Physical Activity spend
(2013/14)
Spend as a % of PH grant
(2013/14)
Physical activity spend
(2014/15)
Spend as a % of grant (2014/15)
Cornwall 87 29.85 28.78 £289,000 2.18% £285,000 2.10%
Reading 88 29.86 26.83 £49,000 0.90% £323,000 5.60%
Southend-on-Sea 89 30.32 32.75 DNA DNA DNA DNA
Lancashire 90 30.46 30.41 DNA DNA DNA DNA
Harrow 91 30.54 24.76 DNA DNA DNA DNA
Bristol 92 30.69 28.38 DNA DNA £357,884 1.80%
Hillingdon 93 30.70 29.79 £55,449 0.70% DNA DNA
Walsall 94 30.89 33.39 DNA DNA DNA DNA
Slough 95 31.04 37.58 £25,000 0.55% £80,000 2.20%
Luton 96 31.10 35.88 £0 0 £80,000 8.90%
Greenwich 97 31.25 33.09 DNA DNA £526,000 5.40%
Cumbria 98 31.34 29.94 DNA DNA DNA DNA
Sefton 99 31.51 31.20 DNA DNA DNA DNA
Bradford 100 31.71 37.67 DNA DNA £711,000 3.40%
Peterborough 101 31.90 27.67 £300,110 4.24% £177,434 3.40%
St. Helens 102 31.99 30.49 DNA DNA £313,000 3.90%
Isle of Wight 103 32.04 29.39 DNA DNA DNA DNA
Thurrock 104 32.36 29.08 £247,000 5.70% DNA DNA
Portsmouth 105 32.40 33.05 DNA DNA DNA DNA
County Durham 106 32.40 29.34 DNA DNA DNA DNA
Ealing 107 32.55 29.14 £221,000 1.80% £459,000 4.70%
Birmingham 108 32.62 34.27 £2,464,778 4.80% £4,500,000 8.70%
Doncaster 109 32.90 32.69 DNA DNA £66,000 0.51%
Table key
Authority name The name of the local authority
National rank 150 local authorities ranked in order of inactivity (no. 1 is the least inactive, no. 150 is the most inactive)
Physical inactivity The percentage of people classed as physically inactive in the region in 2013 compared to the national average
Inactivity (previous year) The percentage of people classed as physically inactive in the region in 2012 compared to the national average
Average spend The total amount of public health grants spend on physical activity allocated in 2014/15
Average spend (% PH grants) The percentage of the public health grants allocated to physical activity in 2014/15
Average spend (2013/14) The total amount of public health grants spend on physical activity allocated in 2013/14
Average spend (% of grants 2013/14)
The percentage of the public health grants allocated to physical activity in 2013/14
Untitled-1 55 11/11/2014 08:58:49

Steps to solving inactivity | November 201456 www.ukactive.com
Local authority name National Rank
Physically inactive (%)
Physically inactive (2012)
Physical Activity spend
(2013/14)
Spend as a % of PH grant
(2013/14)
Physical activity spend
(2014/15)
Spend as a % of grant (2014/15)
Kirklees 110 32.98 31.65 DNA DNA DNA DNA
Salford 111 33.38 39.07 DNA DNA £297,000 3.60%
Liverpool 112 33.40 31.63 DNA DNA DNA DNA
Bexley 113 33.47 30.71 DNA DNA £81,000 1.40%
Tower Hamlets 114 33.56 28.62 £228,164 1.20% £264,495 1.26%
Halton 115 33.60 31.34 DNA DNA £590,340 7.00%
Darlington 116 33.71 28.61 £103,000 2% DNA DNA
Coventry 117 33.78 36.81 £379,178 3.10% £163,430 1.40%
Telford and Wrekin 118 33.85 30.45 DNA DNA £617,440 11.78%
Havering 119 33.96 30.49 DNA DNA £66,000 1.34%
Plymouth 120 33.96 27.59 £200,562 2.30% £259,000 2.80%
Wakefield 121 33.99 28.46 £400,080 3.50% DNA DNA
South Tyneside 122 34.04 33.50 DNA DNA DNA DNA
Torbay 123 34.26 33.32 DNA DNA £22,000 0.80%
Rotherham 124 34.42 33.57 DNA DNA £323,000 3.10%
Kingston upon Hull 125 34.44 36.07 £459,000 2.50% DNA DNA
Middlesbrough 126 34.73 30.12 DNA DNA £668,000 8.00%
Brent 127 34.79 30.15 DNA DNA £1,411,000 10.17%
Leicester 128 34.92 34.24 £172,500 1% £933,000 6.77%
Swindon 129 35.44 32.68 DNA DNA £159,000 2.60%
Rochdale 130 35.55 34.12 DNA DNA DNA DNA
Wolverhampton 131 35.73 34.39 DNA DNA DNA DNA
Blackburn with Darwen 132 35.73 36.95 £794,485 6.10% DNA DNA
Table key
Authority name The name of the local authority
National rank 150 local authorities ranked in order of inactivity (no. 1 is the least inactive, no. 150 is the most inactive)
Physical inactivity The percentage of people classed as physically inactive in the region in 2013 compared to the national average
Inactivity (previous year) The percentage of people classed as physically inactive in the region in 2012 compared to the national average
Average spend The total amount of public health grants spend on physical activity allocated in 2014/15
Average spend (% PH grants) The percentage of the public health grants allocated to physical activity in 2014/15
Average spend (2013/14) The total amount of public health grants spend on physical activity allocated in 2013/14
Average spend (% of grants 2013/14)
The percentage of the public health grants allocated to physical activity in 2013/14
Untitled-1 56 11/11/2014 08:58:49
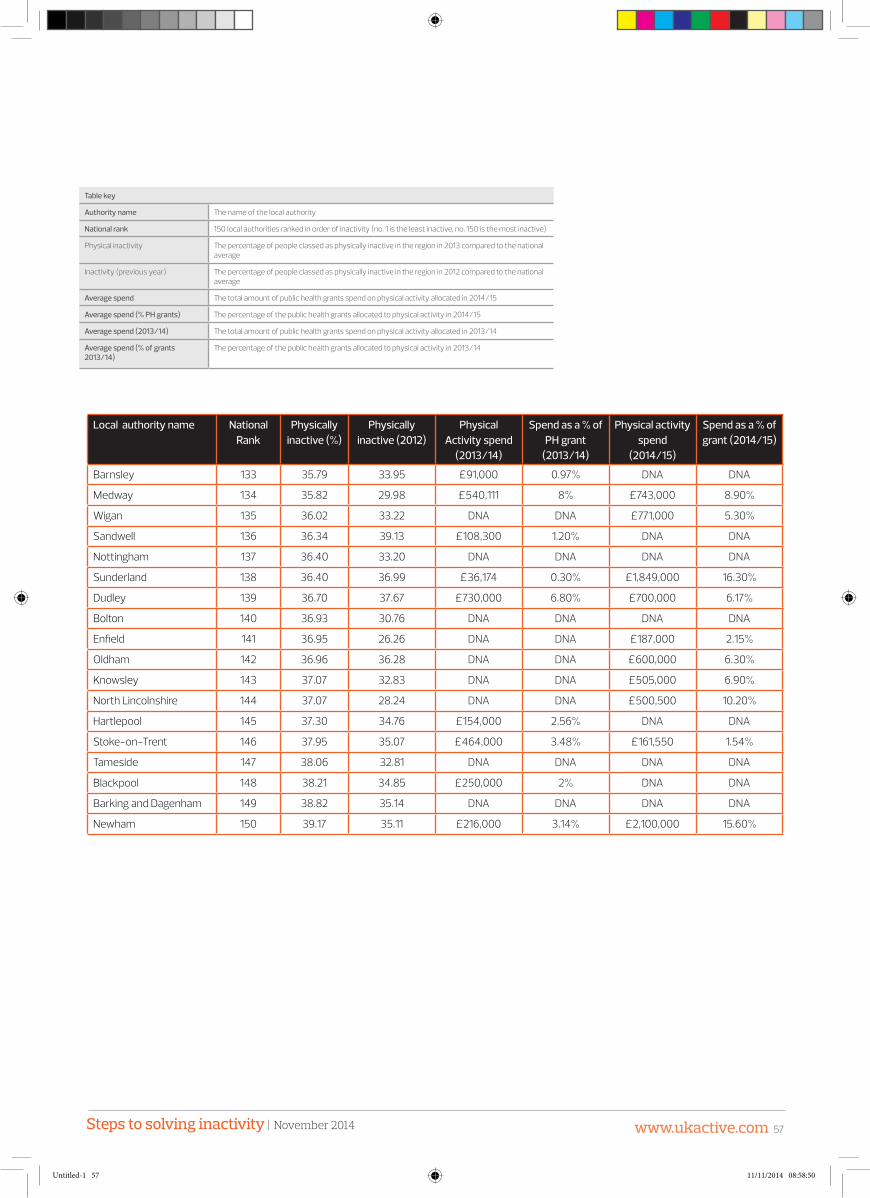
Steps to solving inactivity | November 2014 www.ukactive.com 57
Local authority name National Rank
Physically inactive (%)
Physically inactive (2012)
Physical Activity spend
(2013/14)
Spend as a % of PH grant
(2013/14)
Physical activity spend
(2014/15)
Spend as a % of grant (2014/15)
Barnsley 133 35.79 33.95 £91,000 0.97% DNA DNA
Medway 134 35.82 29.98 £540,111 8% £743,000 8.90%
Wigan 135 36.02 33.22 DNA DNA £771,000 5.30%
Sandwell 136 36.34 39.13 £108,300 1.20% DNA DNA
Nottingham 137 36.40 33.20 DNA DNA DNA DNA
Sunderland 138 36.40 36.99 £36,174 0.30% £1,849,000 16.30%
Dudley 139 36.70 37.67 £730,000 6.80% £700,000 6.17%
Bolton 140 36.93 30.76 DNA DNA DNA DNA
Enfield 141 36.95 26.26 DNA DNA £187,000 2.15%
Oldham 142 36.96 36.28 DNA DNA £600,000 6.30%
Knowsley 143 37.07 32.83 DNA DNA £505,000 6.90%
North Lincolnshire 144 37.07 28.24 DNA DNA £500,500 10.20%
Hartlepool 145 37.30 34.76 £154,000 2.56% DNA DNA
Stoke-on-Trent 146 37.95 35.07 £464,000 3.48% £161,550 1.54%
Tameside 147 38.06 32.81 DNA DNA DNA DNA
Blackpool 148 38.21 34.85 £250,000 2% DNA DNA
Barking and Dagenham 149 38.82 35.14 DNA DNA DNA DNA
Newham 150 39.17 35.11 £216,000 3.14% £2,100,000 15.60%
Table key
Authority name The name of the local authority
National rank 150 local authorities ranked in order of inactivity (no. 1 is the least inactive, no. 150 is the most inactive)
Physical inactivity The percentage of people classed as physically inactive in the region in 2013 compared to the national average
Inactivity (previous year) The percentage of people classed as physically inactive in the region in 2012 compared to the national average
Average spend The total amount of public health grants spend on physical activity allocated in 2014/15
Average spend (% PH grants) The percentage of the public health grants allocated to physical activity in 2014/15
Average spend (2013/14) The total amount of public health grants spend on physical activity allocated in 2013/14
Average spend (% of grants 2013/14)
The percentage of the public health grants allocated to physical activity in 2013/14
Untitled-1 57 11/11/2014 08:58:50
For further information call 020 7400 8600 or email: [email protected]
#turnthetide
Twitter: @_ukactiveFacebook: Get ukactiveLinkedIn: ukactive
ukactive, 4th and 5th floor, 26-28 Bedford Row, London, WC1R 4HE | www.ukactive.com
Untitled-1 58 11/11/2014 08:58:50