steps - · pdf filepublisher, with the ... ms. arlene o. cruz ... steps vol. 2 2014 preface...
TRANSCRIPT

1
STEPSVol. 2 2014

2
Scholarly Technical Education Publication Series
3
STEPSVol. 2 2014
Scholarly Technical Education Publication Series (STEPS)
4
Scholarly Technical Education Publication Series
Copyright Colombo Plan Staff College (CPSC) Manila, Philippines, 2013
ISSN: 2244-6982
No part of this work may be reproduced, stored in a retrieval system, or transmitted in any form or by any means, electronic, mechanical, photocopying, microfilming, recording or otherwise, without written permission from the Publisher, with the exception of any material supplied specifically for the purpose of being used by the purchaser of the book.
The views and opinions expressed in this book are those of the contributors/authors and do not necessarily reflect the views and policies of CPSC and the Governing Board of CPSC from their respective member governments.
CPSC does not guarantee the accuracy of the data included in this publication and accepts no responsibility for any consequence of their use.
Published by Colombo Plan Staff College (CPSC) Bldg. Block C DepEd Complex, Meralco Ave. Pasig City, Philippines E-mail: [email protected] Website: www.cpsctech.org
EDITORIAL BOARD
Editor-in-Chief Dr. Mohammad Naim Yaakub
EditorsDr. Hazrat Hussain
Dr. Godelyn M. HisoleDr. G. KulanthaivelDr. Zulkifli Zakaria
EDITORIAL TEAM
Editorial StaffMs. Arlene O. Cruz
Mr. Rae Emmanuel Echaveria
Graphics & Layout DesignMs. Aba Bernadine Lim
Multimedia SupportFelix Sibal
Zarina Ann Villahermosa
5
STEPSVol. 2 2014
Preface
This second issue of the STEPS inspires us to keep the momentum of providing our stakeholders with academic information and insights from various technical and vocational education and training (TVET) institutions, professionals and enthusiasts. This issue proves that we have gone a long way since the maiden issue-a first-ever CPSC journal publication-had been launched and released last fiscal year.
This issue compiles mostly original research-based papers from some polytechnics and Colleges in CPSC member countries while others are articles exposing and discussing issues and concerns in the TVET systems in particular countries in the Asia Pacific Region. Selected papers in this issue expound and take closer look on issues such as green initiatives; institutional productivity; TVET teachers’ burnout; students’ perspectives on soft skills; influence on study success in engineering, innovative behaviors; female participation in TVET; and sustainable development.
On behalf of the Editorial Board of STEPS let me place on record through this page, our sincerest thanks, first, to all the authors who submitted their papers for review by the Editorial Board. We received quite a number of papers for review for this issue showing great interest from university professors, academicians, TVET administrators and professionals from CPSC member countries. The Editorial Board had undertaken thorough review of all the papers submitted and selected this issue’s line-up which best observed highest standards of academic research and article wtiting.
Secondly, we thank the author-contributors of the selected papers for this issue for patiently going through our suggestions and working hand in hand with us in further enhancing their papers. Their perseverance to further improve their papers encouraged us to pursue our aspirations for quality outputs in the journal.Our gratitude goes to all the authors of this latest issue who truthfully desired to academically contribute to the exchange of new ideas and insights in seeking to be part of the knowledge building on TVET.
Lastly, my great appreciation to all the members of the Editorial Board for putting their heads together in conscientiously examining papers submitted, providing insightful recommendations to authors in improving their papers, selecting the best papers and for vigorously working together to come up with this issue’s line-up of papers which have achieved quality standards of a journal.
We encourage more active participation of more TVET academicians, professionals and practitioners in this endeavor of CPSC as we thread our way towards a more progressive Asia Pacific Region through TVET.
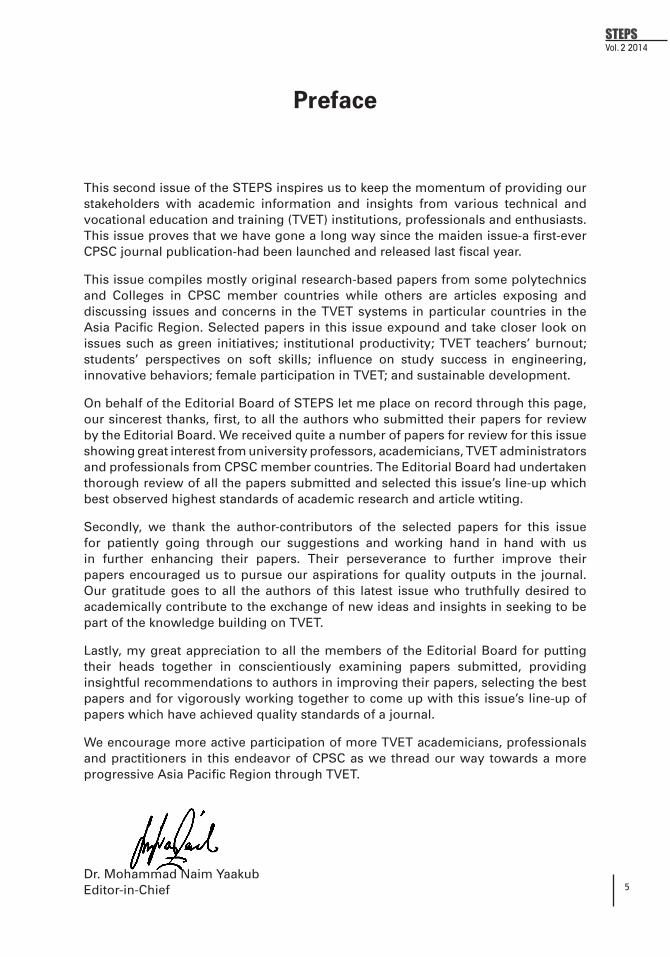
Dr. Mohammad Naim YaakubEditor-in-Chief

6
Scholarly Technical Education Publication Series
7
STEPSVol. 2 2014
Table of Contents
Preface 5
Government of Malaysia’s Initiatives for Green Economy and the TVET Response 9
Mohlis bin JaafarRoslee bin Yahya Hazrat Hussain
Green Environmental Management: Carlos Hilado Memorial State College Practices 27
Eduardo G. SaysonMa. Teresa B. Ballados
Hindering Factors of Female Participation in TVET in Nepal 43
Ram Hari Lamichhane
Level of Institutional Productivity and Organizational Climate of Carlos Hilado Memorial State Colleges Basis for Institutional Productivity Plan 51
Vanessa Joy Z. Judith
Promoting Innovative Behavior among Polytechnic Faculty Through Psychological Empowerment 71
Tengku Ahmad Badrul Shah bin Raja Hussin Nik Azida binti Abd Ghani Aziz Zuddin bin Othman
Teachers’ Burnout in Polytechnics of State of Uttar Pradesh in India and its Analysis 83
Suresh K. Dhameja Varun Singh
Factors Influencing the Implementation of Student-Centered Learning in Malaysian TVET Institutions 95
Nik Azida binti Abd Ghani Tengku Ahmad Badrul Shah bin Raja Hussin Nor Asiah binti Ab Ghani Tengku M A Siti Rohani binti Hj. Ali
Soft Skills in Polytechnic: Students’ Perspectives 107 Riam Chau Mai
Interest Development and Influence on Study Success in Engineering: Case Studies of Malaysia and Australia 123
Maizam Alias Aini Nazura Paimin

8
Scholarly Technical Education Publication Series
9
STEPSVol. 2 2014 Government of Malaysia’s
Initiative for Green Economy and the TVET Response
Mohlis bin JaafarDirector GeneralDepartment of Polytechnic EducationMinistry of Education, [email protected]
Roslee bin YahyaPoliteknik Kota Kinabalu, [email protected]
Hazrat HussainFaculty Consultant CPSC, Manila, [email protected]
Abstract
Sustainable development is a development strategy that manages the finances, physical assets, natural environment and human resources to improve the wealth and qulity of life for a long term period. In economic context, sustainable development has been appreciated to be crucial and applicable for many countries, and Malaysia is no exception. One of the National Green Technology Policy Strategic thrusts is to intensify human capital development in sustainable development. The motivation should be the ability to supply green technology initiatives for the demand of the local and global markets, creation of opportunities and contributing to the growth of the national economy.
Today, the knowledge of TVET is a precious key indicator of the effort for sustainable growth to be maintained in the present and future situations. The expanding knowledge and new technologies at the workplace demanded for the new types of skills in green technologies and TVET has to be responsive to take up its share of the challenge. Hence, as a TVET implementer, Malaysian polytechnics should take the initiative to be responsible in giving public awareness towards sustainable development through short and long term sustainable integration development programs in order to produce competitive and excellent human resources.
Keywords: Sustainable development, TVET, Initiative and planning stage.
Background
In 2005, the United Nations launched the Decade for Education for Sustainable Development that aims to provide an opportunity for refining and promoting the vision of and transition to sustainable development – through all forms of education, public awareness and training. This agreement also targets to develop an enhanced

10
Government of Malaysia’s Initiative for Green Economy and the TVET Response
profile to the importance of education and learning in the sustainable development concept. The integration of education towards sustainable development has been emphasized in the subsequent international conferences such as the United Nations Comission on Environmen and Development (UNCED) conferences held in Stockholm (1972) and in Rio de Janeiro, Brazil (1992). The UNCED conference in 1992 outlined a comprehensive action plan (Agenda 21) which includes the principles to support the government of a country and other institutions in implementing the policies and programs of sustainable development. Agenda 21 also expresses the importance of education in order to accomplish sustainable development as stated in UNCED, 1992; “Education is critical for promoting sustainable development and improving the capacity of the people to address sustainable development issues”
National and Regional Policies on Green Technology
Developed countries have been able to intensify their efforts to integrate green technology applications into their way of life as the world entered the new millennium. Malaysia, a country that targets to reach the “developed” status by 2020, is not an exception in integrating sustainable development practices and concepts in the overall economic practice. The revolution of green technology in Malaysia is developing after the establishment of the Ministry of Energy, Green Technology and Water (KeTTHA) in April 9, 2009 with the vision to be the industry leader in the sustainable development of energy, the national water and green technology product and services. Since then, the Malaysian government has expedited efforts to plan, formulating programs and align policies to promote green technology as the government agenda to lead a new iniative addressing global issues on environmental pollution, ozone depletion, global warming and other issues related.
National Green Technology Policy
Malaysia launched the National Green Technology Policy (NGTP) in July 2009 in conformance to the overall trend to adopt sustainable development practices. It targets to provide a direction and motivation for Malaysians to continuously enjoy good quality living and healthy environment through the reduction of the carbon footprint without compromising economic growth. According to the Economic Planning Unit of the Prime Minister’s Office of the Government of Malaysia (2009), this policy aims to:
1. To reduce the energy usage rate and at the same time increase economic growth.
2. To facilitate the growth of the Green Technology industry and enhance its contribution to the national economy.
3. To increase national capability and capacity for innovation in Green Technology development and enhance Malaysia’s competitiveness in Green Technology in the global arena.
4. To ensure sustainable development and conserve the environment for future generations.
5. To enhance public education and awareness on Green Technology and encourage its widespread use.

11
STEPSVol. 2 2014
Based on sound economic and social principles, with the aspirations of the Malaysians in mind, NGTP was established based on four pillars namely:
• Energy
In the long run, the plan seeks to attain energy sufficiency while promoting its efficient use to the direct and indirect consumers
• Environment
The plan seeks that economic activities will minimize the adverse impact on the environment
• Economy
The plan foresees that national development will be enhanced through the efficient use of technological advancements.
• Social
The plan aims to promote a higher quality of life for all Malaysians in the present and future generations.
Green Technology and the Tenth Malaysia Plan
The Tenth Malaysia Plan spanning from 2011 to 2015 will focus on 12 National Key Economic Areas or NKEAs which have potential to generate high income. For economic sectors not listed as NKEAs, such as green technology, automotive, aerospace and logistics, the development of these sectors will continue to be driven by relevant ministries, agencies and councils.
Under the 10th MP, the Government has introduced the AFFIRM framework of Awareness, Faculty, Finance, Infrastructure, Research and Marketing which outlined the government’s approach towards creating a comprehensive ecosystem for environmental sustainability.
• Awareness: This concept of the framework introduces the need for allMalaysians to accept the shared responsibility of environmental protection and conservation. This policy directs households, offices and industries to segregate their wastes and also encourages them to save on utilities such as electricity. Cooperative efforts will also be pursued with the private sector and civil society organizations to raise consciousness on this need.
• Faculty:Thegovernmentwillmakeaneffort to integrategreentechnologyand practices in the curriculum of schools and institutes of higher learning.
• Finance: Schemes and incentives will be offered to businesses adoptinggreen technology in their operations. A soft loan grant of 1.5 million MYR will be offered to jumpstart the implementation of sustainable development practices. On top of that, tax incentives and breaks will be offered to building contractors and designers who will opt to design environment-friendly buildings and infrastructure.
12
Government of Malaysia’s Initiative for Green Economy and the TVET Response
• Infrastructure: Part of the government’s long term plan is to create greencommunities in Putrajaya and Cyberjaya. These communities will spearhead the adoption of guidelines aimed in reducing the carbon footprint as compared to other townships.
• Research: As a part of its overall development scheme, the governmentwill ensure that research, development and commercialization initiatives on green technology will gain ground through partnerships with local research centres and institutes. Foreign expertise will also be tapped to assist local efforts, keeping into mind the adoption of the global standards for sustainable development.
• Marketing:ThroughKeTTAtogetherwithStandardandIndustrialResearchInstitute of Malaysia (SIRIM), the government will expedite the development of a national eco-labelling scheme and standards. These standards, adopting international standards for labelling and identifying green technology products and services, will be in support of the government’s green procurement initiative. It will also aim in assisting local manufacturers to develop their local industries and at the same time take into account their potential impact to the environment.
• IncreaseMalaysia’scompetitiveness.
Green Technology Initiatives & Programs in Malaysia
Various green technology initiatives have been created by the government through the years in line with the efforts of the country to achieve a “developed country” status by the year 2020. The establishment of KeTTHA has provided landmark achievements in the usage of green technology applications for governmental, economic and social activities and initiatives. Some of these are the following:
National Green Technology Council & Climate Change
The National Green Technology Council and Climate Change on the ministry level were established in 2009 to facilitate the coordination among government ministries, agency and private sector and key stakeholders on green initiatives. The Council is supported by a steering committee to formulate policies, identifies strategic issues, coordinates, monitors and evaluates in the development of the National Green Technology Policy and Green Technology programs at national level. Another agency, the Malaysian Green Tech Agency (GTAC) was tasked to coordinate and implement the Green Technology Initiatives and programs of the Malaysian government and to work closely with the National Green Technology Council.
Green Technology Infrastructure Masterplan
The Green Technology Roadmap, formulated by the National Green Technology Council and the Malaysian Green Tech Agency, was created to guide Malaysia in becoming a low carbon green growth economy. The action plan consisted of a baseline study on six identified sector which are: energy, building, transportation, water and waste management, manufacturing and information communication

13
STEPSVol. 2 2014
technology with the purpose of the baseline is to identify the current status application of Green Technology. The second phase of the action plan will cover the design of the Low Carbon Economy action plan which will cover major economic sectors and to develop detailed guidelines to make the National Green Technology Policy a reality.
Green Technology Financing Scheme (GTFS)
The Green Technology Financing Scheme (GTFS) was introduced in Malaysia in 2010 as a way to attract the industry sector in adopting environment-friendly operations and practices, as well as adopt the green technology approach in their innovations. The scheme was given an allocation of RM 1.5 billion for the producers and users of green technology. For producers, the maximum loan that can be provided is RM50 million and RM10 million for user companies. In 2010, a total of 219 projects were certified green. Of the total, 76 projects with total funding deals worth RM1.016 billion were offered funding from financial institutions involved. (Budget Speech 2010, announced Oct: 2009).
The 2nd Strategic thrust in NGTP outline the needs of a conducive environment which focused on economic aspects in green technology. With the growth of the green technology industry in mind, the industry partners involved in the scheme would supply green technology products to the local and global markets, create jobs and contribute towards the national economy to fulfil the objectives of the Green Technology Policy.
As a sign of commitment in creating an environment conducive to the development of a green technology, the Malaysian government has extended the funding with an additional allocation of funds by RM 2 billion.
Low Carbon Cities Framework (LCCF)
KeTTHA, in collaboration with the GreenTech Malaysia and the Malaysian Institute of Planners in 2010-11, has developed the Low Carbon Cities Framework (LCCF) that takes into consideration the framework and assessment of the cities for their conversion as places that generate low carbon emissions. This document can assist local authorities, developers and city planners in the development of townships to reduce their emission levels by 40%, which is concurrent to the government’s target of 40% carbon emission intensity reduction measured by GDP per capita by the year 2020 as compared to 2005 levels (Koyoto, 2009).
It is a system that measures the level of carbon emissions based on a performance criteria such as: (1) Urban environment, (2) Urban infrastructure, (3) Building and (4) Urban transportation.
LCCF can be used to promote application and development of the green technology in Malaysia and help strengthen and improve sustainability of the community towards creating green and sustainable practices, thus contributing to the reduction of GHG emissions. Currently, KeTTHA is working with 13 strategic partners and plan 5 pilot projects in cooperation with local authorities and stakeholders to enhance and promote the application of this LCCF.
14
Government of Malaysia’s Initiative for Green Economy and the TVET Response
Electric Vehicle Infrastructure Roadmap Masterplan
One of the initiatives is promoting the use of electric vehicles in order to reduce the use of fossil fuels including diesel. This also include cooperation with electric vehicle manufacturers to implement a pilot program on electric vehicles for passenger vehicles. The program is being implemented in the area around Bukit Bintang, Kuala Lumpur to get the technical data and the views of the public in preparing the Master Plan Electric Vehicles (Electric Vehicle Masterplan) starting in 2013.
MyHIJAU Program
In addition, the Ministry is also developing an integrated program to enhance and develop green products and services in Malaysia. The program, known as MyHIJAU Program consists of four sub-programs which will include the production stage up to the stage it is marketed, the MyHIJAU SME & Entrepreneurs, MyHIJAU Labeling, MyHIJAU Directory and MyHIJAU Acquisition.The main objective of this program is to coordinate and streamline all development initiatives, green products and services in Malaysia, to develop the capacity and skills of the industry, especially Small and Medium Enterprises and local entrepreneurs in the production of green products more competitive and increase community awareness and knowledge about the importance conservation of the environment through the concept of sustainable production and consumption (Green Prosect Asia: 2014).The support of buying green or eco-friendly product / service will be the top choice among consumers in the future.
Renewable Energy
Renewable Energy (RE) was announced as the fifth fuel in the energy supply mix. In the year 2005, it has contributed at least 5% of the country’s total electricity demand, and it is projected to even rise as the years pass. A lot of efforts are being done to encourage the utilization of renewable energy resources such as biomas, biogas, solar, mini hydro for energy generation.
A program to increase the awareness of the RE and energy are conducted by the Centre of Education and Training in Renewable Energy and Energy Efficiency (CETREE) as announced in the 8th Malaysian Plan (2000).
Renewable Energy (RE) Act and Sustainable Energy Development Authority Act
In April 2010 the government approved the RE Policy and Action Plan, RE Act and Sustainable Energy Development Authority Act. The Feed in Tariff mechanism have been introduced in December 2011. RE Capacity is expected to increase from 73 MW in 2011 to 2,080 MW in 2020. By 2030, RE generation is estimated to grow to about 3,000 MW.
The Ministry of Energy, Green Technology and Water and the Ministry of Education together with the Ministry of Human Resources will work together to produce a system of grading and certifications mechanism for competent personnel in GT.
15
STEPSVol. 2 2014
Green Jobs Program The target to shift towards the green jobs initiative is consistent with Malaysia’s Vision 2020- a vision aimed in achieving a high-income status by emphasizing inclusive and sustainable growth. The Ministry of Energy, Green Technology and Water (KeTTHA), the government agency that is tasked to carry such responsibility, considers “green technology” as product, equipment or systems which minimize environmental degradation, have low or zero green house gas emissions, are safe to use for all forms of life, minimize the use of energy and resources and promote the use of renewable sources for energy.
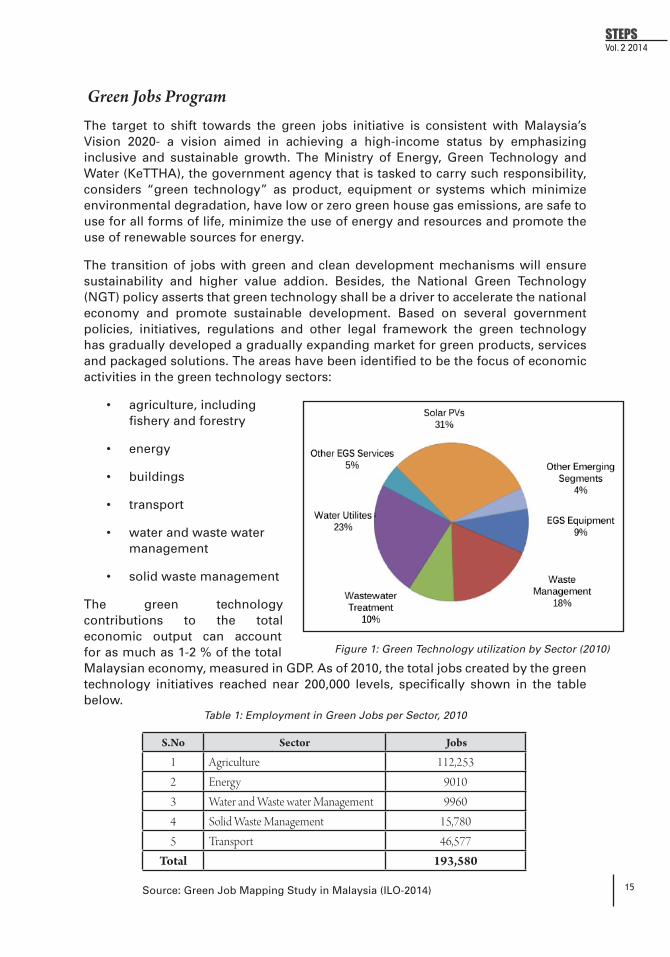
The transition of jobs with green and clean development mechanisms will ensure sustainability and higher value addion. Besides, the National Green Technology (NGT) policy asserts that green technology shall be a driver to accelerate the national economy and promote sustainable development. Based on several government policies, initiatives, regulations and other legal framework the green technology has gradually developed a gradually expanding market for green products, services and packaged solutions. The areas have been identified to be the focus of economic activities in the green technology sectors:
• agriculture,includingfishery and forestry
• energy
• buildings
• transport
• waterandwastewatermanagement
• solidwastemanagement
The green technology contributions to the total economic output can account for as much as 1-2 % of the total Malaysian economy, measured in GDP. As of 2010, the total jobs created by the green technology initiatives reached near 200,000 levels, specifically shown in the table below.
Figure 1: Green Technology utilization by Sector (2010)
S.No Sector Jobs
1 Agriculture 112,2532 Energy 90103 Water and Waste water Management 99604 Solid Waste Management 15,7805 Transport 46,577
Total 193,580
Table 1: Employment in Green Jobs per Sector, 2010
Source: Green Job Mapping Study in Malaysia (ILO-2014)

16
Government of Malaysia’s Initiative for Green Economy and the TVET Response
The budget announcement for 2014 made some encouraging steps in enhancing green growth initiatives. Some of the approved projects include the: (1) National Carbon Reporting Program or My Carbon, (2) tax exemption for green jobs and services, (3) National Conservation Fund, (4) Investment Tax allowance & tax exemption for green technology products and services, (5) Establishment of Malaysian Green Foundation (6) Conduct of regular energy audit of public buildings, and (7) Exploration of energy saving schemes such as the installation of solar panels and the replacement of ordinary light bulbs with energy-efficient LED lights are some of the initiatives that will promote investment in green growth and will open more green jobs to the labor market.
With the success in increasing the allocation in the budget and improved policy decisions, it is projected that investement in green technology will escalate which in turn will translate into additional employment opportunities. Agencies in-charge of developing personnel such as the Ministry of Human Resources should be able to cope with a higher demand on green technology courses in higher education and technical education systems in the country through capacity building, updated curriculum and adoption of modern methods of imparting knowledge through simulations and real-life on-the-job training.
Some of the initiatives taken by the department of polytechnic education and other related organizations have been encapsulated in the following discussion.
Green Technology Initiatives Integrated in TVET Programs/ Activities
Strategic thrust 3 of the National Green Technology Plan (NGTP) specifically indicated that the government needs to intensify the human capital development in green technology through the increase in training and education programs, integration of courses and topics under green technology into the national school syllabus (vocational and technical), and the increase of the number of modules and courses related to green technology in both public and private higher education institutes. It also advocates for programs and schemes focused on enhancing competency of the semi-skilled labor through further development programs and assert the certification mechanism for competent personnel in green technology areas.
The integration of green topics will provide the primary knowledge and hands on experience on GT elements at a very young age. It is also to preare more undergraduates or postgraduate level qualified workforce in the field of GT so as to meet the demand of the green jobs labor force in the country.
Apart from the integration and development of curricula for skills related to new and emerging green technologies i.e Solar Panel Packaging, wind turbine installation, hydroelectric power technician etc., the policy direction advocate for financial support for students that pursue green technology programs and fiscal incentives for institution that offer programs in green technologies. It also campaigns an increased role on TVET agencies to enhance the employability of personnel who have the competencies in green technology.
Apart from integrating/introducing new green technology concepts and programs, thrust area 4 specifically identified the need to establish strong linkages with the
17
STEPSVol. 2 2014
different research institutes and industries to increase the network of academic and technical know-how that aims to put forward innovations in the field of green technology.
During the Malaysia GreenTech Awards, held on 13 October 2013, the Deputy Prime Minister, Tan Sri Muhyiddin Yassin suggested to the Ministry of Education to plan a syllabus and course related to the green technology development. Not only that, he also suggested the local and private institutions to offer more green technology development courses to fulfill the market needs in Malaysia. The ministry of education has conducted a measurements analysis and curriculum related to green technology in primary and secondary schools. As a result of the analysis it was found that the integration of green topic is not comprehensive and should be updated.
KeTTHA has been working with the Department of Skill Development, Ministry of Human Resources (MoHR) to develop the Green Jobs Roadmap for the country. The creation of the Green Jobs Roadmap is for the development of criteria documents consist of the Occupational Analysis (OA) and the National Competency Standard (NCS) and National Occupational Skills Standard (NOSS) on Green Technology. OA and NCS documents have approve by the MoHR by 2010. International Labor Organisation (ILO) also helped out in providing a “roadmap” for green jobs in Malaysia.
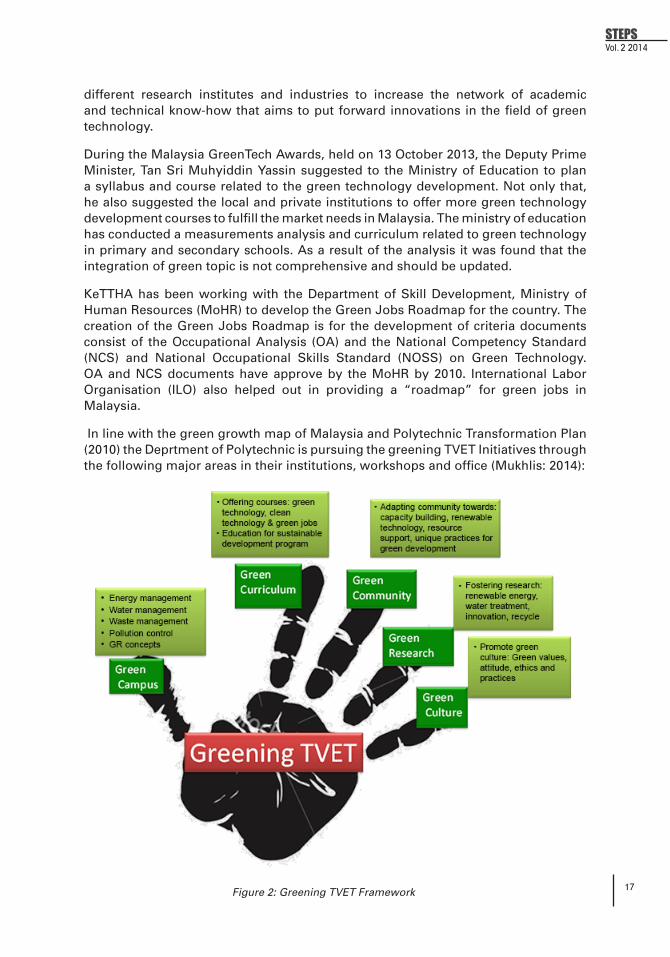
In line with the green growth map of Malaysia and Polytechnic Transformation Plan (2010) the Deprtment of Polytechnic is pursuing the greening TVET Initiatives through the following major areas in their institutions, workshops and office (Mukhlis: 2014):
Figure 2: Greening TVET Framework

18
Government of Malaysia’s Initiative for Green Economy and the TVET Response
While pursuing the above five major greening initiatives, the DPE continues to pursue the conversion of their operations into greener types through the application of basic principles of Reuse, Recycle, Reduce, Repair, Recycle and Rethink.
Malaysian polytechnics have taken awareness actions towards green technology and developed programs and activities within the organization through the years. Some of the green technology initiatives that were integrated into polytechnic programs include:
• Newprogramofferedrelatedtoenvironmentalprotection
• Embeddinggreentechnologyelementsinthecurriculum
• Stafftrainingongreentechnology
• Strengtheninggreentechnologymodulesintheexistingprograms
• Collaborationwithindustries
• Sustainableenergymanagement
In accordance to the National Green Technology Policy, the former Director General of the Department Polytechnic Education (DPE) of the Ministry of Education (formerly known as Ministry of Higher Education), Dato’ Hj Imran Idris supported the idea of introducing the green technology in the polytechnic courses in Malaysia. Since the introduction of a new cabinet portfolio and the establishment of KeTTHA in 2010, this initiative has been moving in a remarkable pace, with the recent achievement of its introduction to the Polytechnic Transformation Roadmap (2010-2020)
Program development in the based on green technology has been introduced via new programs offered in the polytechnic such as Diploma in Environmental Engineering in 2003. Few more programs are developed to increase the skilled workforce in green technology industries such as:
• DiplomainEnvironmentEngineering(WasteWaterTreatment),
• DiplomainElectricalEngineering(GreenEnergy)
• DiplomainElectricalEngineering(EnergyEfficiency)
• DegreeinEngineeringTechnology(SustainableandTechnology)
These programs are intended to produce a workforce that is sensitive to the issues of environmental management, environmental laws and regulation and environmental protection.
Industry collaboration is advantageous to polytechnics. This is implemented through advisory committee, curriculum development, industry dialogue, internship programs; work based learning programs, employability and entreprenuership programs etc. As for the green technology industry, the polytechnics are collaborating with Proton Holdings to design a curriculum on Advanced Diploma in Automotive Design and Manufacturing Development curriculum which focuses on the latest development in the design and manufacturing of vehicles.
Embedding generic concepts, skill and sustainable development attitudes in the new and current program has been applied in polytecnics through revising and aligning
19
STEPSVol. 2 2014
the curriculum in accordance to Malaysian Qualification Framework (MQF). MQF was established as a framework in Malaysia’s declaration about its qualifications and their quality in relation to its education system.
MQF is an instrument that develops and classifies qualifications based on a set of criteria that are approved nationally and are benchmarked against international best practices, and which clarifies the earned academic levels, learning outcomes of study areas and credit system based on student academic load. These criteria are accepted and used for all qualifications awarded by recognized higher education providers. Hence, MQF integrates and links with all national qualifications.
Revision and realignment processes include incorporating core competencies and strengthening green technology modules in existing programs such as Diploma in Building Service Engineering, Diploma in Civil Engineering, Food Technology, Agrotechnology and Bio-Industry, Tourism and Hospitality. All the programs have included new modules on green technology such as environmental science, water and waste water engineering and management and environmental pollution and control, etc.
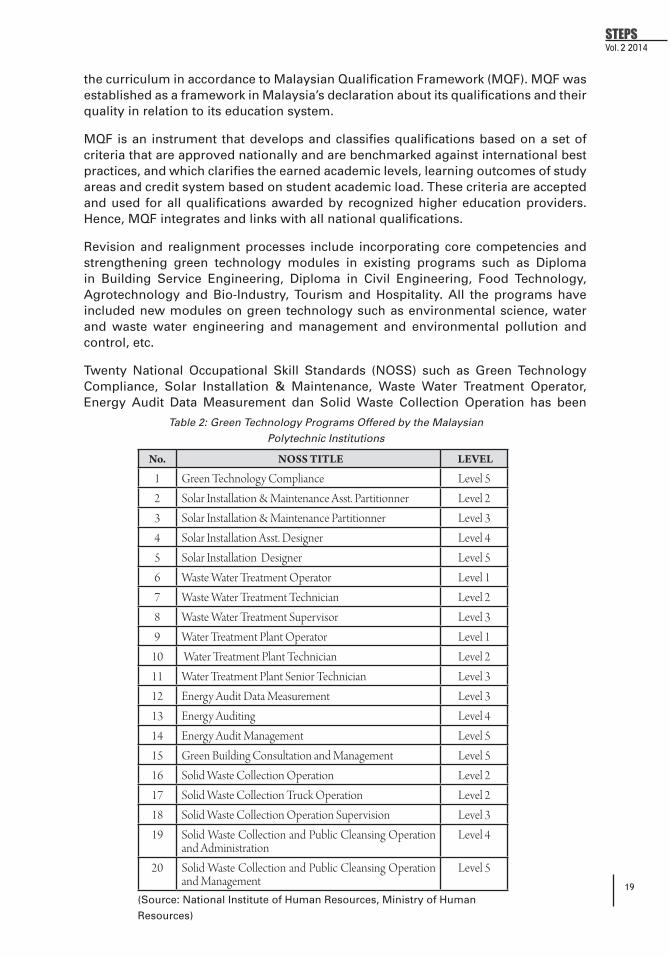
Twenty National Occupational Skill Standards (NOSS) such as Green Technology Compliance, Solar Installation & Maintenance, Waste Water Treatment Operator, Energy Audit Data Measurement dan Solid Waste Collection Operation has been
No. NOSS TITLE LEVEL
1 Green Technology Compliance Level 52 Solar Installation & Maintenance Asst. Partitionner Level 23 Solar Installation & Maintenance Partitionner Level 34 Solar Installation Asst. Designer Level 45 Solar Installation Designer Level 56 Waste Water Treatment Operator Level 17 Waste Water Treatment Technician Level 28 Waste Water Treatment Supervisor Level 39 Water Treatment Plant Operator Level 1
10 Water Treatment Plant Technician Level 211 Water Treatment Plant Senior Technician Level 312 Energy Audit Data Measurement Level 313 Energy Auditing Level 414 Energy Audit Management Level 515 Green Building Consultation and Management Level 516 Solid Waste Collection Operation Level 217 Solid Waste Collection Truck Operation Level 218 Solid Waste Collection Operation Supervision Level 319 Solid Waste Collection and Public Cleansing Operation
and AdministrationLevel 4
20 Solid Waste Collection and Public Cleansing Operation and Management
Level 5
Table 2: Green Technology Programs Offered by the Malaysian
Polytechnic Institutions
(Source: National Institute of Human Resources, Ministry of Human
Resources)
20
Government of Malaysia’s Initiative for Green Economy and the TVET Response
developed by the Department of Skills Development. The other 68 green technology NOSS are to be developed in the future (JPM 2013). These documents become references for TVET institutions in designing their courses and programs related to green technology. As a major initiative, the Ministry of Human Resources Development has come up with standardized training program as their National Ocuppational Skill Standards (NOSS) in the following green technology trades.
The Ministry of Energy, Green Technology and Water and the MoE together with MoHR will work together to produce a system of grading and certification mechanisms for competent personnel in GT. To produce a holistic graduate as mentioned in National Educational Philosophies, Soft Skill module is taught across all the programs of study in polytechnics. This module includes communication skills, professional ethics, positive personality, environmental issues such as environmental sustainability, pollution, recycle, reuse of materials and equipment maintenance.
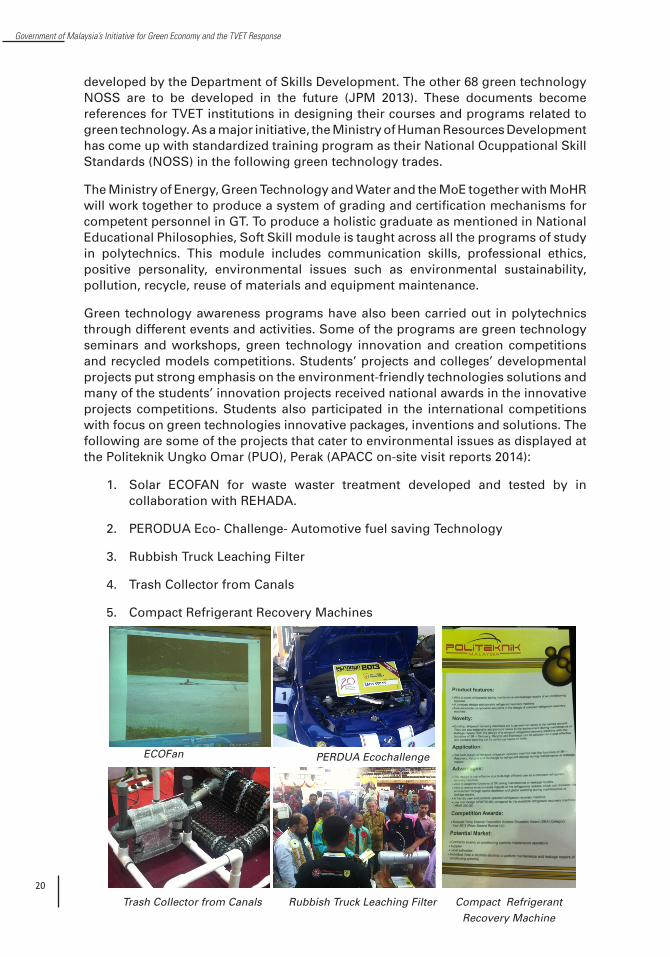
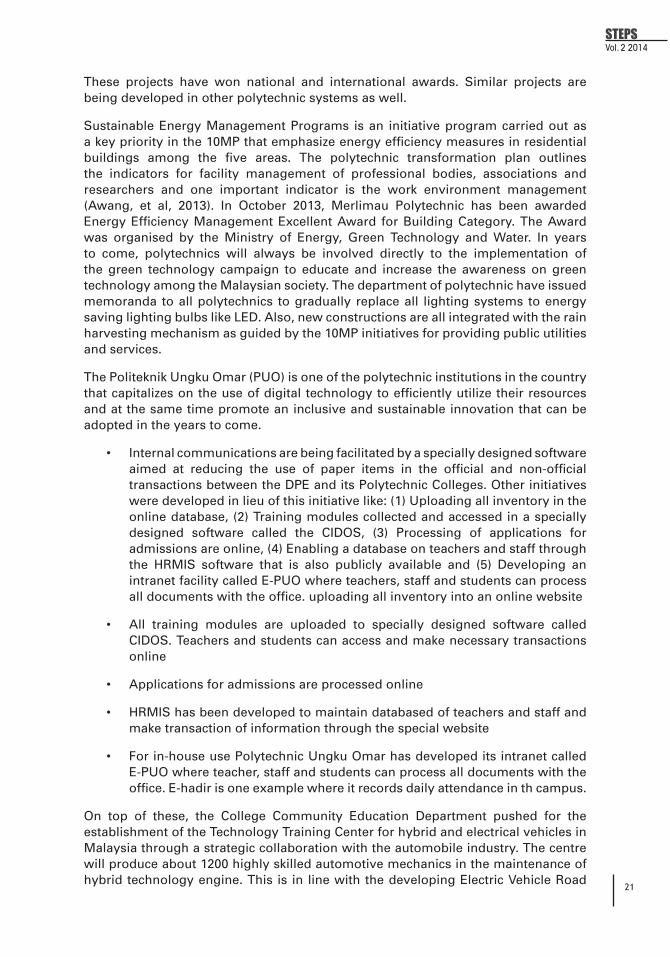
Green technology awareness programs have also been carried out in polytechnics through different events and activities. Some of the programs are green technology seminars and workshops, green technology innovation and creation competitions and recycled models competitions. Students’ projects and colleges’ developmental projects put strong emphasis on the environment-friendly technologies solutions and many of the students’ innovation projects received national awards in the innovative projects competitions. Students also participated in the international competitions with focus on green technologies innovative packages, inventions and solutions. The following are some of the projects that cater to environmental issues as displayed at the Politeknik Ungko Omar (PUO), Perak (APACC on-site visit reports 2014):
1. Solar ECOFAN for waste waster treatment developed and tested by in collaboration with REHADA.
2. PERODUA Eco- Challenge- Automotive fuel saving Technology
3. Rubbish Truck Leaching Filter
4. Trash Collector from Canals
5. Compact Refrigerant Recovery Machines
ECOFan PERDUA Ecochallenge
Trash Collector from Canals Rubbish Truck Leaching Filter Compact Refrigerant
Recovery Machine
21
STEPSVol. 2 2014
These projects have won national and international awards. Similar projects are being developed in other polytechnic systems as well.
Sustainable Energy Management Programs is an initiative program carried out as a key priority in the 10MP that emphasize energy efficiency measures in residential buildings among the five areas. The polytechnic transformation plan outlines the indicators for facility management of professional bodies, associations and researchers and one important indicator is the work environment management (Awang, et al, 2013). In October 2013, Merlimau Polytechnic has been awarded Energy Efficiency Management Excellent Award for Building Category. The Award was organised by the Ministry of Energy, Green Technology and Water. In years to come, polytechnics will always be involved directly to the implementation of the green technology campaign to educate and increase the awareness on green technology among the Malaysian society. The department of polytechnic have issued memoranda to all polytechnics to gradually replace all lighting systems to energy saving lighting bulbs like LED. Also, new constructions are all integrated with the rain harvesting mechanism as guided by the 10MP initiatives for providing public utilities and services.
The Politeknik Ungku Omar (PUO) is one of the polytechnic institutions in the country that capitalizes on the use of digital technology to efficiently utilize their resources and at the same time promote an inclusive and sustainable innovation that can be adopted in the years to come.
• Internalcommunicationsarebeingfacilitatedbyaspeciallydesignedsoftwareaimed at reducing the use of paper items in the official and non-official transactions between the DPE and its Polytechnic Colleges. Other initiatives were developed in lieu of this initiative like: (1) Uploading all inventory in the online database, (2) Training modules collected and accessed in a specially designed software called the CIDOS, (3) Processing of applications for admissions are online, (4) Enabling a database on teachers and staff through the HRMIS software that is also publicly available and (5) Developing an intranet facility called E-PUO where teachers, staff and students can process all documents with the office. uploading all inventory into an online website
• All training modules are uploaded to specially designed software calledCIDOS. Teachers and students can access and make necessary transactions online
• Applicationsforadmissionsareprocessedonline
• HRMIShasbeendevelopedtomaintaindatabasedofteachersandstaffandmake transaction of information through the special website
• Forin-houseusePolytechnicUngkuOmarhasdevelopeditsintranetcalledE-PUO where teacher, staff and students can process all documents with the office. E-hadir is one example where it records daily attendance in th campus.
On top of these, the College Community Education Department pushed for the establishment of the Technology Training Center for hybrid and electrical vehicles in Malaysia through a strategic collaboration with the automobile industry. The centre will produce about 1200 highly skilled automotive mechanics in the maintenance of hybrid technology engine. This is in line with the developing Electric Vehicle Road

22
Government of Malaysia’s Initiative for Green Economy and the TVET Response
map for Malaysia (Kothandabhani, 2011). This initiative complies with the National Green Technology policy to promote the hybrid vehicle in the Malaysian automotive industry which will be dominated the market by 2015.
Other Issues
The development of the world talent in sustainable development requires a comprehensive and inclusive national effort from the public sector, private and society. During the Malaysian 10th Plan Period, the country will strive to adopt an integrated human capital and talent development framework. This approach will develop Malaysians throughout their entire cycle life, from early childhood education until their working adult lives.
To facilitate this, some of these issues are to be urgently addressed
1. Raising the skills of Malaysian to increase the employability
One of the strategies to raise the skills of the Malaysian graduate is to increase his/her access to the technical education and vocational training. The TVET provider must strive to increase the enrollement rate significantly and further achieve the improvement in the quality of training modules, facilities and personnel. In line with this, some of the strategies can be explored. Specifically, Malaysian TVET has to address the following concerns
a. Improvement in the perception of TVET to the general public
b. Attracting more skilled personnel as TVET trainers and developing their capabilities through the years.
c. Upgrading the present TVET curriculum quality aligned with the requirements of the industry requirement
d. Streamlining the delivery of TVET through the reduction of bureaucratic red tape and other challenges that hamper the fast delivery of services
2. Reforming the labor market to transform Malaysia into high income country
Reflecting on the present situation that shows a low level of Malaysians that have achieved higher educational qualification, there is a need to further create opportunities to upgrade the skills of the existing workforce and strive to empower them to further contribute into the health of the economy. The government targets to have 33% of the workforce employed in the higher skilled job bracket and up to 50% in 2020.
The Recognition of prior learning (RPL) program must be extended to formally recognize experiences of the workers as well as encouraging life long learning among the workers.

23
STEPSVol. 2 2014
Challenges in Implementing the Green Technology
Envisioning a country that invests heavily on green technology for a sustainable future has some challenges, particularly because the plans are currently in their initial stages of implementation. Some of the possible challenges are the following:
a. Changing the mindset of the public;
In order to change the mindset of the public the government has to provide initatives that will further raise awareness and promotion of the significance, benefits and contributions of adopting into green technology practices. It should also be started on the most basic phase of education until the tertiary level.
b. Lack of knowledge and expertise
Malaysia is dependent on other developed nations for their expertise in green technology. The country needs to enhance their expertise on green technology particularly: the capacity building in specific areas of concern, green technology as a solution to specified problems and economic driver and commercialization and development efforts targeting the needs of local inventors and innovators.
c. Improving the value and supply chain
One of the major challenges for green technology projects are the bottlenecks in the value and supply chains, resulting to the slow approval of funds for the development of the projects. The government can explore providing considerations to firms adopting green technology practices, as well as streamlined guidelines that will enable easier transactions.
d. Coming up with feasible fiscal and financial GT development incentives
The Government has started some basic and promotional fiscal and financial incentives to spur GT development. KeTTHA is in the midst of conducting 2 major studies to assess and identify the scope of fiscal incentives and financial assistance to scale up the development of the GT industry.
e. Promoting more research and development efforts;
KeTTHA plans to enhance Research, Development, Innovation and Commercialisation (RDIC) through:
• financialgrantsorassistance
• establishmentofaneffectivecoordinatingagencyforRDIandCenterofExcellence or agency for RDI and Center of Excellence or new research institute for GT development.
• smart partnership between the government, industries and researchinstitutions
• strong linkages between local research institutions and internationalcenters of excellence in GT RDI.

24
Government of Malaysia’s Initiative for Green Economy and the TVET Response
f. Crafting a comprehensive, viable and doable GT roadmap
The Government should be able to craft a Green Technology Roadmap to guide Malaysia towards a low carbon economy focused on introducing sustainable operation practices on energy, wastewater, building, transportation, manufacturing and ICT.
g. Duplication of tasks and jurisdictional implications;
There is a need to encourage a greater form of collaboration among ministries, agencies, the private sector and all other stakeholders in implementing policies. There is a need to mitigate overlapping of tasks and jurisdictional implications amongst government stakeholders to facilitate an easier flow of transactions and minimize ineffectiveness and iefficiency.
h. Increasing GT Corporate Social Responsibility (CSR)
The business community should realize the crucial role it plays in facilitating social change and thus, should contribute substantially in the development efforts to enhance a community or locality. Currently, CSR activities are not implemented substantially, and concerns such as fund contribution and sustainability of operations after the project should be further enhanced.
i. Gradual minimizing of government subsidies in energy and water sectors.
Current energy subsidies and low water tariff which do not reflect cost of supply is counter productive to green technology efforts. The government should make the necessary steps to reduce government intervention (in the form of subsidies) in energy and water sectors and should push for market-driven operations that is dependent on the level of supply and demand in the market.
j. Political will
The policies proposed by the different sectors would prove meaningless if there is no political and social will among the business leaders and politicians. They, of all people, should spearhead the necessary changes and should be open in adapting into current needs and requirements.
Conclusion
Malaysia has been very active in pursuing a sustainable future through the integration of sustainable development in its economic plans. Many policies, legislations and promotional activities have been put into place to foster green growth as an alternative economic growth engine for the nation. However, a lot has to be done by all parties concerned in spearheading the green technology initiatives and making sure that its effects are felt by all sectors of the society.
Strategic partnerships and collaborative efforts need to be explored, with main focus on the development of the human capital especially by the TVET stystem. The existence of properly skilled human capital is the main driver of instituting the green
25
STEPSVol. 2 2014
practices in all operations for the delivery of services and manufacturing activities. The trend should now go beyond conferences and meetings.
TVET needs to go out for multi-faceted adaptation of green initiatives i.e from policy focus to integrating into curricular programs and to the extent of model institutions as sample of best green practicing institution. The practice of focusing students’ creativity toward green solutions to community problems needs to reinforce. It has to be kept in mind also that winning the support of the Malaysian public is very crucial for the success of these initiatives, and the achievements will definitely cause a significant impact the standard of living of Malaysians and to the rest of the world as well.
TVET needs to strengthen efforts beyond what has been discussed in this paper. We need to define a model green TVET institutional management and should strive to cover the whole gamut of green practices in the industry and other economic spectrum of life through TVET training programs for skill development.
References
1. Asia Pacific Accreditation and Certification Commission (2014). Politeknik Ungku Omar Onsite Visit Report: February, 2014.
2. Awang, M. et al (2013). “Transformation of Malaysian Polytechnics Inevitabilities Facilities Management Competencies”. Journal of Global Management. Volume 5. Number 1. p.2-20.
3. Green Prospects Asia (2012). MyHIJAU Program. Retrieved on May 31, 2014 from http://www.greenprospectsasia.com
4. International Labor Organization (2014). “Green Job Maping in Malaysias: An Overview Based on Initial Desk Research”. Retrieved on June 10, 2014 from: http://www.ilo.org/asia/whatwedo/publications/WCMS_239640/lang-en/ index.htm.
5. JPK, (29 July 2013). Daftar NOSS terkini. Retrieved from http://www.dsd.gov.my/index.php/ms/perkhidmatan3/perkhidmatan/noss.
6. Kementerian Pendidikan Malaysia (2014). Laporan Perungusan Aset Suku KetigaTahun 2013. Retrieved on May 14, 2014 from: http://politeknik.gov.my/dokumen/files/JPAK%20POLI%20bil%2032013.pdf
7. KeTTHA. (2009). Dasar Teknologi Hijau Negara (DTHN). Retrieved on May 31, 2014 from http://www.kettha.gov.my/content/definisi.
8. Mothi A., Kothandabhani, S.K (2011). Electric Vehicle Roadmap for Malaysia. Presented at the 1st Malaysian-German Sustainable Automobility Mobility Conference, Shangri-La Hotel, Kuala Lumpur, Malaysia. 18 October 2011.
9. Muhammad Fendi Mustafa (2012). GreenTech Malaysia, Low Carbon Cities Framework and Assessment System, Retrieved on February 13, 2014 from: http://www.jpbdselangor.gov.my/Laporan/mampan/KETTHA.pdf

26
Government of Malaysia’s Initiative for Green Economy and the TVET Response
10. Mohlis Bin Jaafar (2014). Amanat Tahun 2014, Politeknik Cekal Mendepani Cabaran”. Kementerian Pendidikan Malaysia.
11. Omar, A. (2012). “National Occupational Skills Standards for Green Technology Malaysia” Retrieved on May 14, 2014 from: http://apgreenjobs.ilo.org/resources/national-ocupational-skills standards-for-green technology-malaysia
12. The Economic Planning Unit, Prime Minister’s Secretariat (2010). Tenth Malaysian Plan 2011-2015. Putrajaya.

27
STEPSVol. 2 2014 Green Environmental
Management: Carlos Hilado Memorial State College Practices
Eduardo G. SaysonVice President for Research, Extension, IP and Training
Ma. Teresa B. BalladosChairperson, Graduate Studies
Carlos Hilado Memorial State College-Fortune Town Campus, Philippines
Abstract
This study was aimed to assess the green environmental management practices of the Carlos Hilado Memorial State College (CHMSC), covering its four campuses, the: Alijis, Binalbagan, Fortune Towne, and Talisay CHMSC campus. Descriptive-correlational survey research method was used and a standardized questionnaire was employed as data gathering instrument. The total number of respondent were 126 people, which include administrators, faculty members, and staff personnel of the College. Findings of the study revealed that as a whole, the institution in general seldom observed the green environmental management, and the four campuses have significantly the same practices. The institution as a whole had weak green organizational culture, poor green physical facilities, and poor green curriculum. However, respondents assessed the elements of green environmental management as a very important practice in order to achieve a Green Institution. Their perception on the importance of green environmental management was highly significant despite being segregated and classified according to sex and types of respondent, while they significantly differed in terms of campuses. There was a significant relationship between the College’s green environmental management practices and the importance of green environmental management in achieving a Green Institution.
Keywords: green environmental management practices, CHMSC, green organizational culture, green physical facilities, green curriculum
Introduction
Sustainable development is focusing on creating and implementing processes, systems, programs and practices vital in protecting the natural environment. Based on the concept of Growald (2010), responsible use and protection of the natural world is without question essential to sustainability. Likewise, he emphasized that sustainability is not just living, thriving, or an environmental issue, but is a human issue. The call for sustainable development requires formulating alternative solutions that give emphasis on reducing resource utilization, minimizing waste, observing green purchasing policy, preventing pollution, greening structures and buildings and continuously improving green environmental programs.
As stated by Rom (2012), global warming and climate change is the major challenge facing earth, youth, and future generations. Global climate change is now recognized
28
Green Environmental Management: Carlos Hilado Memorial State College Practices
as an impending worldwide emergency. With so many natural calamities happening in different countries which resulted to destruction of so many lives and properties, it is deemed necessary to adopt different green environmental management practices. Today, various green environmental management practices have been implemented by different nations, government and private organizations particularly academic institutions in order to attain sustainability.
Academic institutions, like CHMSC has the key role in realizing sustainable development through embracing the green concept and implementing effective green environmental management practices. Spilde (2010) stressed that community colleges are expected to play a leadership role in educating and training the workforce for the green economy. Goyal (2013) mentioned that an organization of today cannot succeed in the present competitive environment if it does not follow the current management practices effectively and efficiently.
CHMSC’s vision is GREEN CHMSC Excels (Excellence, Competence and Educational Leadership in Science and Technology) focusing on green sustainable development (CHMSC Five-Year Development Plan). The drive of everyone in the College should be directed by this vision. Moreover, one of the research agenda of the College is concentrated on climate change and green and clean technology (CHMSC Research Manual) which is relevant to the present study.
Primarily, this research was conducted to assess the green environmental practices of the college which dealt on green organizational culture, green physical facilities, and green curriculum and to determine if there are weak areas that need to be given corrective measures and interventions in order to ensure that the College is moving towards the right direction of becoming a Green Institution.
Review of Related Literature
Achieving sustainable development is one of the major concerns of the world today. Countries are focusing on how to maintain and preserve the natural environment that future generations could also experience and enjoy living in it. Different organizations and individuals have great responsibility to realize it. However, the course towards sustainable development entails effective management and high commitment of all participants. It involves clear and concrete vision and positive values.
Vision, according to Salvador et al. (2010) directs and focuses us towards the future and becomes the framework for what we want to create and thus guide us in making choices and commitments. It is a portrait of the future to which people can commit. It is the articulation of values, and it empowers and inspires people to do a job and to contribute ideas or actions beyond themselves. Communicating the vision to all key personnel is very important.
The organizational culture can be developed through written statements about organization’s mission and philosophy (Robbins & Judge, 2011), which is similar to the idea of Newstrom (2011) that philosophy, values, vision, mission, and goals exist in a hierarchy of increasing specificity help create a recognizable organizational culture. Likewise, organizational culture is a system of shared values (what is important) and beliefs (how things work) that shape a company’s people, organizational structures, and control systems to produce behavioral norms (the way we do things around here).
29
STEPSVol. 2 2014
A viable and productive organizational culture can be strengthened and sustained. However, it cannot be built or assembled, instead it must be cultivated, encouraged and fertilized (Dess, et al., 2010).
Goyal (2013) emphasized that in order to carry out Green Management in the organization effectively and efficiently participation of employee must be received. Further, he stressed that organization of today should understand that it is more economical to go green than to continue adding harmful chemicals to the environment. When companies go “green”, they often find that the benefits extend beyond the environment. Eco-friendly strategies can also help attract young talent and reduce costs. For many successful firms, environmental values are now becoming a central part of their cultures and management processes. (Dess, et al., 2010).
According to DuBrin (2012), a major corporate thrust toward ethical and socially responsible behavior calls for business firms and not-for-profit organizations to go green, to make a deliberate attempt to create sustainable environment. Furthermore, he cited that going green is an approach to defining and creating processes that are environmentally friendly, economically viable, and pragmatic in long-term. In line with this understanding, green managers should consider the impact of their organization on the natural environment (Robbins & Coulter, 2012).
Robbins and Coulter (2012) furthermore discussed the shade of green model which describe the different environmental approaches that organization may take. The first approach is the legal (or light green) approach, organizations exhibit little environmental sensitivity by obeying laws, rules, and regulations without legal challenge and that is the extent of their being green. Also Stoner et al. (2005) point out that if an organization can invent a technology or a process to make it more efficient and satisfy environmental organizations, then it will have an advantage.
As an organization becomes more sensitive to environmental issues, it may adopt the market approach, and respond to environmental preferences of customers. Whatever customers demand in terms of environmentally friendly products will be what the organization provides.
The third approach is the stakeholder approach, organizations work to meet the environmental demands of multiple stakeholders such as employees, suppliers, or community. In addition, Stoner et al. (2005) specified that it involves paying attention to recyclable material in consumer packaging, educating employees on environmental issues, participating in community effort to clean up the environment, and appealing to investors who want to invest in green companies.
Finally, if an organization pursues an activist (or dark green) approach, it looks for ways to protect the earth’s natural resources. The activist approach reflects the highest degree of environmental sensitivity and illustrates social responsibility. The authors also mentioned that the Belgian company, a factory (the world’s first ecological one) has an engineering marvel with a huge grass roof that keeps things cool in summer and warm in winter and a water treatment system that runs on wind and solar energy. Another way that organizations show commitment to being green is through pursuing standards developed by the nongovernmental International Organization for Standardization (ISO). Organizations that aim to be compliant to the ISO 14000 (environmental management) standards must develop a total management
30
Green Environmental Management: Carlos Hilado Memorial State College Practices
system for meeting environmental challenges. In other words, it must minimize the effects of its activities on the environment and continually improve its environmental performance.
Similarly, the dark green approach should begin to experiment by adopting environmental values that tell people should live in a manner that is more in harmony with the earth. Increased concern about natural environment means that new human relationships must enter the organizational equation, and the move from cost-benefit thinking to the sustainable development concept means that the time frame has changed to become more immediate (Stoner et al., 2005).
Going green necessitates solid waste management. According to Uriarte (2008), it which involves all activities pertaining to the control of generation, storage, transfer and transport, treatment and processing, and disposal of solid wastes in accordance with the best principles of public health, economics, engineering, conservation, aesthetic, and other environmental considerations. He further cited that effective waste management includes five levels of priorities: prevention, reduction, recycling, treatment, and disposal. Among the priorities, prevention contributes the most and disposal the least toward solving solid waste problem. Moreover, the reuse of certain products for purposes other than the original intended purpose can certainly result in reducing the amount of materials to be discarded and the use of larger containers reduces the total amount of materials used for packaging. Also, the use of proper container can have significant impact on the collection system as well as on health and sanitation. Republic Act No. 9003 (Ecological Solid Waste Management Act of 2000) provides the requirements for the segregation and storage of solid waste which states that there shall be a separate container for each type of waste from all sources, and the solid waste container depending on its use shall be properly marked or identified for on-site collection as “compostable”, “non-recyclable”, “recyclable” or “special waste”.
Academic institutions play an important role in building and enhancing environmental awareness of the stakeholders. However, according to David (2010), schools at the undergraduate level are doing a poor job of educating students on environmental issues. Furthermore, he emphasized that business schools should address environmental issues more in their curricula and he point up that failure of the school to provide adequate coverage of natural environment issues and decisions in students’ training could make them less attractive to employers.
Research Design and Methodology
The present study utilized the descriptive-correlational survey research method. It adopted a standardized questionnaire as data-gathering tool. The instrument was developed by the Environmental Studies Institute of Miriam College and it was used for Green Audit. The questionnaire is composed of two parts: Part I contained items to obtain the profile of the respondents and Part II included items which describe the elements of green environmental management in the area of organizational culture, physical facilities, and curriculum. There were a total of 126 respondents, which included administrators, faculty members, and staff personnel of currently employed in the College. Stratified-systematic sampling method was utilized to determine the samples.

31
STEPSVol. 2 2014
In the statistical treatment of the data, the mean was applied to determine the green environmental management practices of the College and the perceived importance of green environmental management in achieving Green Institution. T-test and One-Way Analysis of Variance (ANOVA) were used to measure the significant difference in the practices, and Pearson Product Moment (PPM) was employed to test the significant relationship between the College’s green environmental management practices and the importance of green environmental management in achieving a Green Institution. Table 1 illustrating the Green Environmental Management Practices, and Table 2 showing the Degree of Importance of the Green Environmental Management were used as guide in the analysis and interpretation of data:
Table 1: Green Environmental Management Practices
Scale Category Verbal Description Mean Score
3 Always Practiced (AP) Never failed to practice 2.33 – 3.002 Seldom Practiced (SP) Frequently missed to practice 1.67 - 2.321 Not Practiced (NP) Never practiced 1.00 - 1.66
Scale Category Verbal Description Mean Score
3 Very Important (VI) Needed to the highest extent 2.33 – 3.002 Important (I) Needed to the moderate extent 1.67 - 2.321 Least Important (LP) Needed to the lowest extent 2.33 – 3.00
Table 2: Degree of Importance of the Green Environmental Management
Results and Discussions
The results on the green environmental management practices of the College and the perceived importance of the green practices in achieving a green campus were discussed in this section.
Green Environmental Management Practices of the College in Terms of the Areas of Organizational Culture, Physical Facilities, and Curriculum
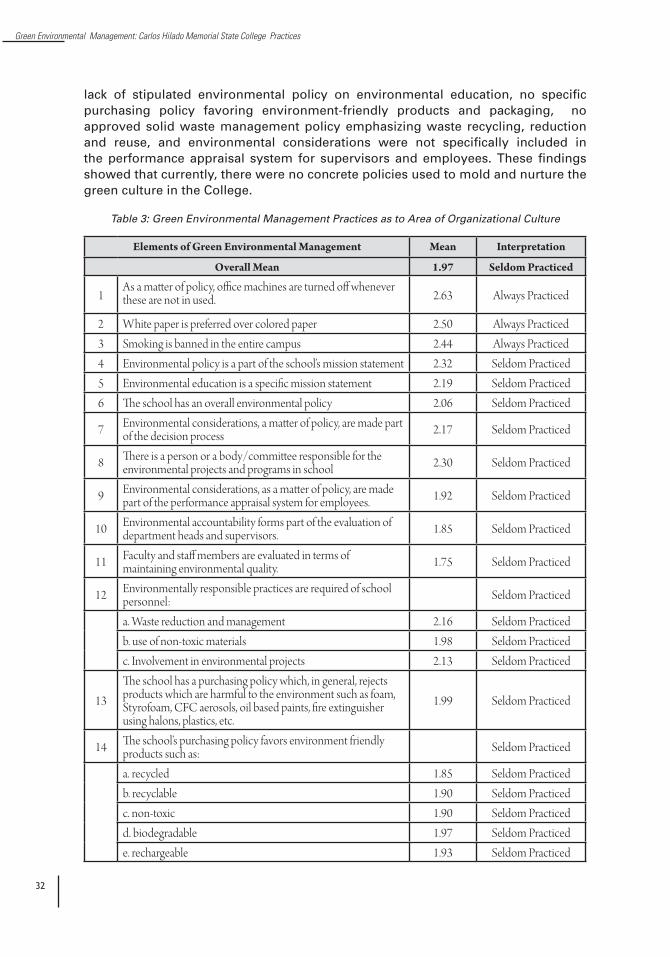
As reflected in Table 3, the College seldom practices green environmental management since their responses only registered a mean of 1.97, which is interpreted that it frequently missed to adopt the green culture.
Table 3 shows that out of the 50 elements of the green organizational culture identified, only four (4) were always practiced: (1) employees never missing to turn off office machines whenever these are not in use, (2) preferring white papers over colored papers for printing, and (3) banning of smoking in the entire campus. These characteristics have the mean scores of 2.63, 2.50, and 2.44, respectively.
The rest of the characteristics mentioned were seldom practiced by the respondents. This reflects the poor state of the green culture of the college as shown in the absence of environmental policy as a part of the school’s mission statement. There was also a notable absence of overall institutional green environmental management policies,
32
Green Environmental Management: Carlos Hilado Memorial State College Practices
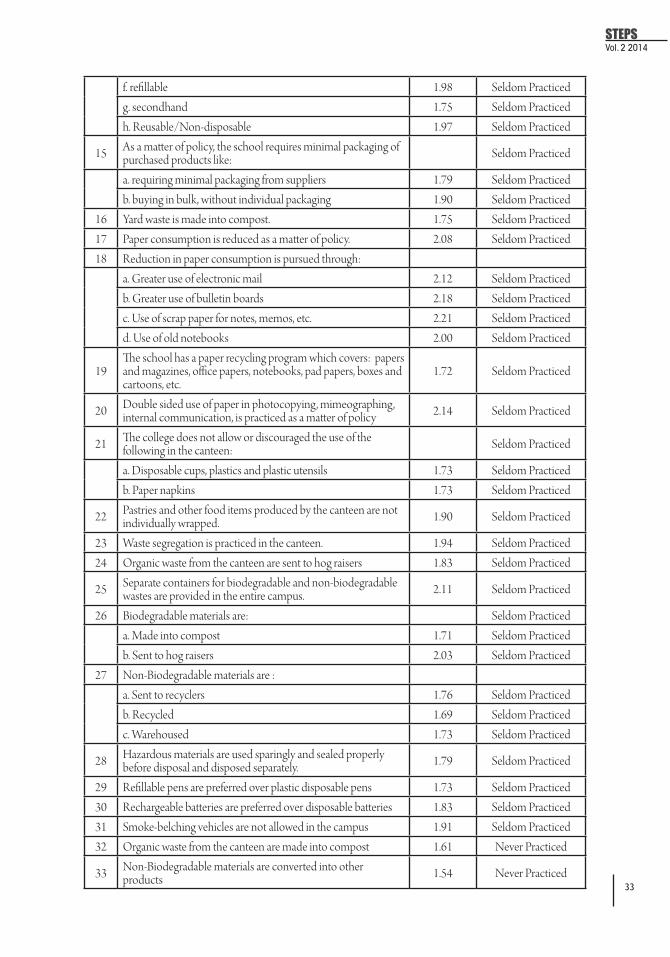
lack of stipulated environmental policy on environmental education, no specific purchasing policy favoring environment-friendly products and packaging, no approved solid waste management policy emphasizing waste recycling, reduction and reuse, and environmental considerations were not specifically included in the performance appraisal system for supervisors and employees. These findings showed that currently, there were no concrete policies used to mold and nurture the green culture in the College.
Table 3: Green Environmental Management Practices as to Area of Organizational Culture
Elements of Green Environmental Management Mean Interpretation
Overall Mean 1.97 Seldom Practiced
1As a matter of policy, office machines are turned off whenever these are not in used. 2.63 Always Practiced
2 White paper is preferred over colored paper 2.50 Always Practiced3 Smoking is banned in the entire campus 2.44 Always Practiced4 Environmental policy is a part of the school’s mission statement 2.32 Seldom Practiced5 Environmental education is a specific mission statement 2.19 Seldom Practiced6 The school has an overall environmental policy 2.06 Seldom Practiced
7 Environmental considerations, a matter of policy, are made part of the decision process 2.17 Seldom Practiced
8 There is a person or a body/committee responsible for the environmental projects and programs in school 2.30 Seldom Practiced
9 Environmental considerations, as a matter of policy, are made part of the performance appraisal system for employees. 1.92 Seldom Practiced
10 Environmental accountability forms part of the evaluation of department heads and supervisors. 1.85 Seldom Practiced
11 Faculty and staff members are evaluated in terms of maintaining environmental quality. 1.75 Seldom Practiced
12 Environmentally responsible practices are required of school personnel: Seldom Practiced
a. Waste reduction and management 2.16 Seldom Practicedb. use of non-toxic materials 1.98 Seldom Practicedc. Involvement in environmental projects 2.13 Seldom Practiced
13The school has a purchasing policy which, in general, rejects products which are harmful to the environment such as foam, Styrofoam, CFC aerosols, oil based paints, fire extinguisher using halons, plastics, etc.
1.99 Seldom Practiced
14 The school’s purchasing policy favors environment friendly products such as: Seldom Practiced
a. recycled 1.85 Seldom Practicedb. recyclable 1.90 Seldom Practicedc. non-toxic 1.90 Seldom Practicedd. biodegradable 1.97 Seldom Practicede. rechargeable 1.93 Seldom Practiced
33
STEPSVol. 2 2014
f. refillable 1.98 Seldom Practicedg. secondhand 1.75 Seldom Practicedh. Reusable/Non-disposable 1.97 Seldom Practiced
15 As a matter of policy, the school requires minimal packaging of purchased products like: Seldom Practiced
a. requiring minimal packaging from suppliers 1.79 Seldom Practicedb. buying in bulk, without individual packaging 1.90 Seldom Practiced
16 Yard waste is made into compost. 1.75 Seldom Practiced17 Paper consumption is reduced as a matter of policy. 2.08 Seldom Practiced18 Reduction in paper consumption is pursued through:
a. Greater use of electronic mail 2.12 Seldom Practicedb. Greater use of bulletin boards 2.18 Seldom Practicedc. Use of scrap paper for notes, memos, etc. 2.21 Seldom Practicedd. Use of old notebooks 2.00 Seldom Practiced
19The school has a paper recycling program which covers: papers and magazines, office papers, notebooks, pad papers, boxes and cartoons, etc.
1.72 Seldom Practiced
20 Double sided use of paper in photocopying, mimeographing, internal communication, is practiced as a matter of policy 2.14 Seldom Practiced
21 The college does not allow or discouraged the use of the following in the canteen: Seldom Practiced
a. Disposable cups, plastics and plastic utensils 1.73 Seldom Practicedb. Paper napkins 1.73 Seldom Practiced
22 Pastries and other food items produced by the canteen are not individually wrapped. 1.90 Seldom Practiced
23 Waste segregation is practiced in the canteen. 1.94 Seldom Practiced24 Organic waste from the canteen are sent to hog raisers 1.83 Seldom Practiced
25 Separate containers for biodegradable and non-biodegradable wastes are provided in the entire campus. 2.11 Seldom Practiced
26 Biodegradable materials are: Seldom Practiceda. Made into compost 1.71 Seldom Practicedb. Sent to hog raisers 2.03 Seldom Practiced
27 Non-Biodegradable materials are :a. Sent to recyclers 1.76 Seldom Practicedb. Recycled 1.69 Seldom Practicedc. Warehoused 1.73 Seldom Practiced
28 Hazardous materials are used sparingly and sealed properly before disposal and disposed separately. 1.79 Seldom Practiced
29 Refillable pens are preferred over plastic disposable pens 1.73 Seldom Practiced30 Rechargeable batteries are preferred over disposable batteries 1.83 Seldom Practiced31 Smoke-belching vehicles are not allowed in the campus 1.91 Seldom Practiced32 Organic waste from the canteen are made into compost 1.61 Never Practiced
33 Non-Biodegradable materials are converted into other products 1.54 Never Practiced
34
Green Environmental Management: Carlos Hilado Memorial State College Practices
The organizational culture can be developed through written statements about organization’s mission and philosophy (Robbins & Judge, 2011), which is similar to the idea of Newstrom (2011) that philosophy, values, vision, mission, and goals exist in a hierarchy of increasing specificity help create a recognizable organizational culture. The literature supports the need of the College to promote and develop green culture through setting a well-defined vision, mission, objectives, and effective institutional green environmental management policies. The College should also ensure that these policies are effectively communicated and well-embraced by the whole institution. Goyal (2013) emphasized that in order to carry out Green Management in the organization effectively and efficiently, employees’ participation must be received. Further, he stressed that organizations of today should understand that it is more economical to go green than to continue adding harmful chemicals to the environment.
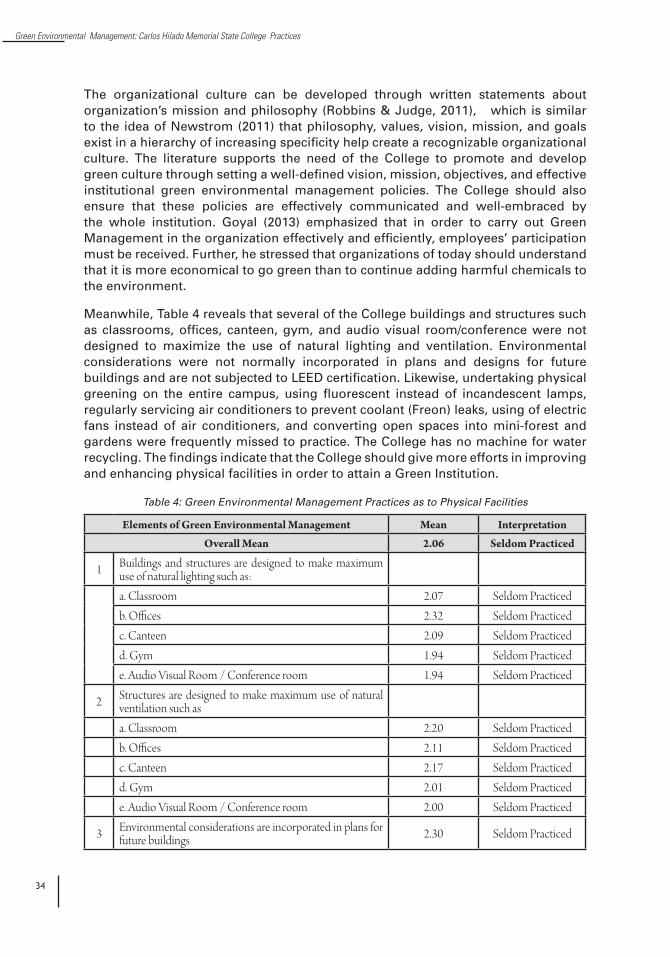
Meanwhile, Table 4 reveals that several of the College buildings and structures such as classrooms, offices, canteen, gym, and audio visual room/conference were not designed to maximize the use of natural lighting and ventilation. Environmental considerations were not normally incorporated in plans and designs for future buildings and are not subjected to LEED certification. Likewise, undertaking physical greening on the entire campus, using fluorescent instead of incandescent lamps, regularly servicing air conditioners to prevent coolant (Freon) leaks, using of electric fans instead of air conditioners, and converting open spaces into mini-forest and gardens were frequently missed to practice. The College has no machine for water recycling. The findings indicate that the College should give more efforts in improving and enhancing physical facilities in order to attain a Green Institution.
Table 4: Green Environmental Management Practices as to Physical Facilities
Elements of Green Environmental Management Mean Interpretation
Overall Mean 2.06 Seldom Practiced
1 Buildings and structures are designed to make maximum use of natural lighting such as:a. Classroom 2.07 Seldom Practicedb. Offices 2.32 Seldom Practicedc. Canteen 2.09 Seldom Practicedd. Gym 1.94 Seldom Practicede. Audio Visual Room / Conference room 1.94 Seldom Practiced
2 Structures are designed to make maximum use of natural ventilation such asa. Classroom 2.20 Seldom Practicedb. Offices 2.11 Seldom Practicedc. Canteen 2.17 Seldom Practicedd. Gym 2.01 Seldom Practicede. Audio Visual Room / Conference room 2.00 Seldom Practiced
3 Environmental considerations are incorporated in plans for future buildings 2.30 Seldom Practiced
35
STEPSVol. 2 2014
4 The campus features open spaces for mini-forests, gardens, etc. 2.22 Seldom Practiced
5 Physical greening is undertaken on the entire campus 2.26 Seldom Practiced6 The school uses fluorescent bulbs instead of incandescent 2.00 Seldom Practiced
7 Air conditioners are serviced regularly to prevent coolant (Freon) leaks 1.89 Seldom Practiced
8 Electric Fans are used instead of air conditioners whenever possible 2.19 Seldom Practiced
9 The college has machine for water recycling 1.33 Never Practiced
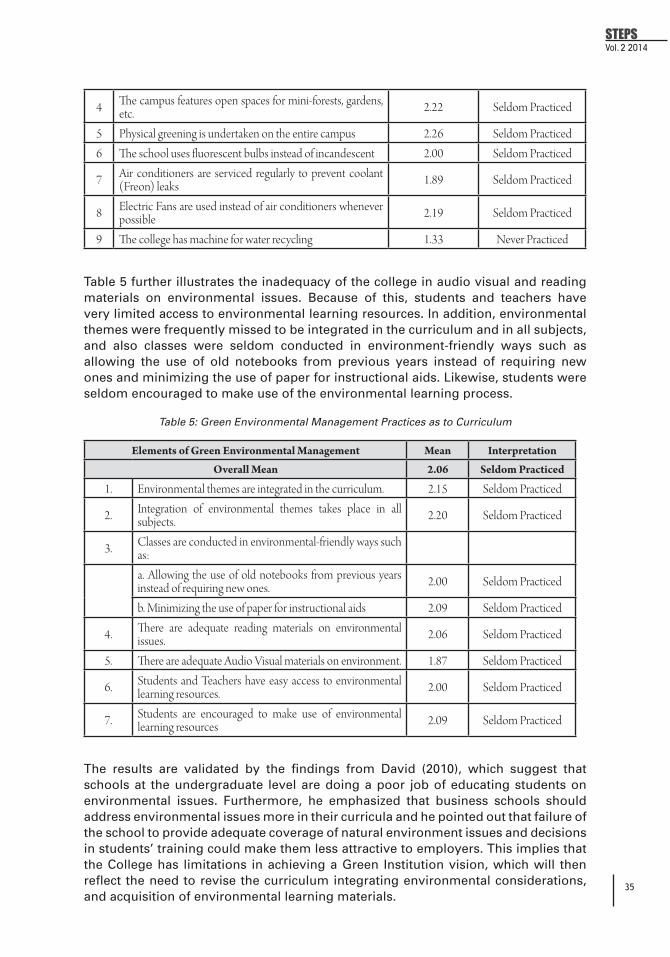
Table 5 further illustrates the inadequacy of the college in audio visual and reading materials on environmental issues. Because of this, students and teachers have very limited access to environmental learning resources. In addition, environmental themes were frequently missed to be integrated in the curriculum and in all subjects, and also classes were seldom conducted in environment-friendly ways such as allowing the use of old notebooks from previous years instead of requiring new ones and minimizing the use of paper for instructional aids. Likewise, students were seldom encouraged to make use of the environmental learning process.
Table 5: Green Environmental Management Practices as to Curriculum
Elements of Green Environmental Management Mean Interpretation
Overall Mean 2.06 Seldom Practiced
1. Environmental themes are integrated in the curriculum. 2.15 Seldom Practiced
2. Integration of environmental themes takes place in all subjects. 2.20 Seldom Practiced
3. Classes are conducted in environmental-friendly ways such as:a. Allowing the use of old notebooks from previous years instead of requiring new ones. 2.00 Seldom Practiced
b. Minimizing the use of paper for instructional aids 2.09 Seldom Practiced
4. There are adequate reading materials on environmental issues. 2.06 Seldom Practiced
5. There are adequate Audio Visual materials on environment. 1.87 Seldom Practiced
6. Students and Teachers have easy access to environmental learning resources. 2.00 Seldom Practiced
7. Students are encouraged to make use of environmental learning resources 2.09 Seldom Practiced
The results are validated by the findings from David (2010), which suggest that schools at the undergraduate level are doing a poor job of educating students on environmental issues. Furthermore, he emphasized that business schools should address environmental issues more in their curricula and he pointed out that failure of the school to provide adequate coverage of natural environment issues and decisions in students’ training could make them less attractive to employers. This implies that the College has limitations in achieving a Green Institution vision, which will then reflect the need to revise the curriculum integrating environmental considerations, and acquisition of environmental learning materials.

36
Green Environmental Management: Carlos Hilado Memorial State College Practices
Green Environmental Management Practices of the College as a Whole and When Classified According to Campus
The elements of green environmental management practices were seldom practiced by the whole institution as reflected in the data shown in Table 6 with mean score of 2.00. The data revealed that all campuses observed the same practices in the areas of green culture, green physical facilities, and green curriculum.
Table 6: Green Environmental Management Practices of the College as a whole and when classified
according to campus
Variable Mean Std. Deviation Interpretation
Overall 2.00 .388 Seldom PracticedCampusAlijis 2.07 .394 Seldom PracticedBinalbagan 2.00 .355 Seldom PracticedFortune Towne 1.85 .409 Seldom PracticedTalisay 2.03 .393 Seldom Practiced
Importance of Green Environmental Management in Achieving Green Institution as a Whole and When Employees are Grouped According to Sex, Campus and Types of Respondent
All the elements of green environmental management practices as specified in Table 7 were generally assessed by the employees as very important in achieving a Green Institution. When they were categorized by sex, both males and females assessed these elements as very important. The same perception was obtained when they were classified into campus. As to types of respondent, employees belonging to administration, faculty, and staff obtained the same results. The results were supported by the findings of McShane (2012) that organizational culture defines what is important and unimportant in the company and consequently directs everyone in the organization toward the “right way” of doing things. To develop a culture, Robbins & Judge (2011) cited that top managers’ actions set the general climate, including what is an acceptable behavior and what is not. The data implied that generally, employees’ attitude towards green environmental management were positive. Based on the concept of McShane (2012), organizational culture consisted of shared values and assumptions and those values guide our preferences for outcomes or courses of action in a variety of situations.

37
STEPSVol. 2 2014
Table 7: Perceived Importance of Green Environmental Management Practices as to Whole and as
to Variables
Variable Mean Std. Deviation Interpretation
Overall 2.71 .366 Very ImportantSex Male 2.70 .361 Very ImportantFemale 2.71 .372 Very ImportantCampus Alijis 2.66 .409 Very Important Binalbagan 2.68 .372 Very Important Fortune Towne 2.36 .316 Very Important Talisay 2.86 .234 Very ImportantTypes of Respondent Administration 2.82 .372 Very Important Faculty 2.70 .354 Very Important Staff 2.63 .386 Very Important
The data in Table 8 illustrates that there was no significant difference in the practices of each campus on green environmental management at five (5) percent significance level. This implied that regardless of their geographical location and curricular offerings, they still observed the same practices which support the findings that each campus had a weak green organizational culture, poor green physical facilities, and poor green curriculum.
Table 8: Mean Perception of Green Environmental Management Practices as to Grouped
Variables Mean Sig. (2- tailed) Status of Ho Interpretation
Alijis 2.07 Binalbagan 2.00 Fortune Towne 1.85 Talisay 2.03
.244 Accept No Significant Difference
Perceived Importance of Green Environmental Management Practices between Sex, Types of Respondents and Location of Campuses
As to the perceived importance of the green environmental management practices as defined in the elements stated in Table 1, the data in Table 9 indicated that there were no significant differences in variables sex and types of respondents with p-values of .516 and .201. However, in variable campus there was significant difference with p-value of .000. The data showed that respondents had the same perception of the importance of the green environmental management in achieving Green Institution regardless of their sex and irrespective of whether they function as administration, faculty or staff. If grouped according to different campuses however, their perception of the importance of green practices significantly varied.
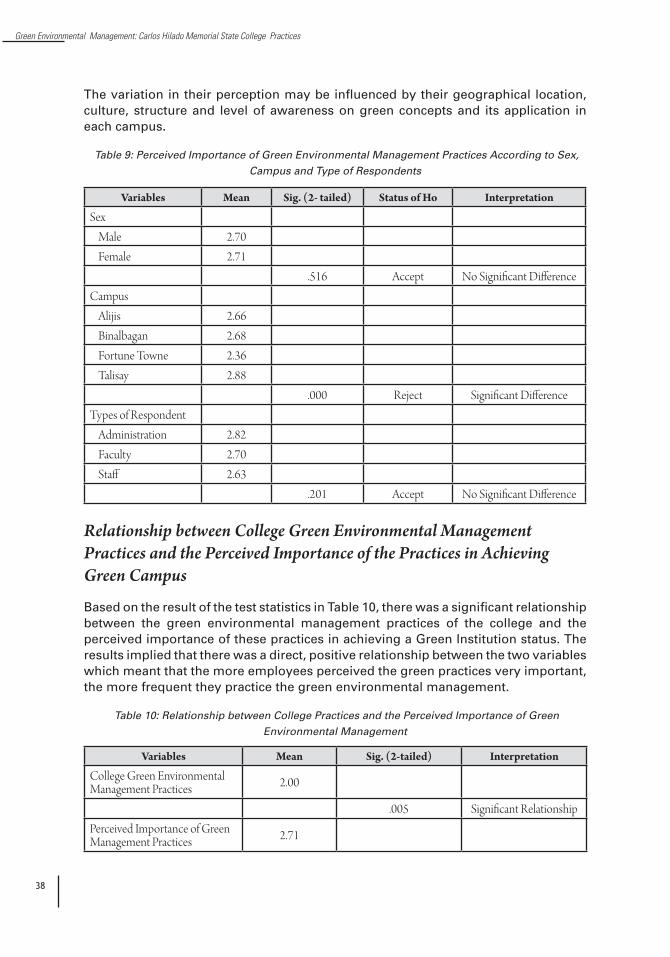
38
Green Environmental Management: Carlos Hilado Memorial State College Practices
The variation in their perception may be influenced by their geographical location, culture, structure and level of awareness on green concepts and its application in each campus.
Table 9: Perceived Importance of Green Environmental Management Practices According to Sex,
Campus and Type of Respondents
Variables Mean Sig. (2- tailed) Status of Ho Interpretation
Sex Male 2.70 Female 2.71
.516 Accept No Significant DifferenceCampus Alijis 2.66 Binalbagan 2.68 Fortune Towne 2.36 Talisay 2.88
.000 Reject Significant DifferenceTypes of Respondent Administration 2.82 Faculty 2.70 Staff 2.63
.201 Accept No Significant Difference
Relationship between College Green Environmental Management Practices and the Perceived Importance of the Practices in Achieving Green Campus
Based on the result of the test statistics in Table 10, there was a significant relationship between the green environmental management practices of the college and the perceived importance of these practices in achieving a Green Institution status. The results implied that there was a direct, positive relationship between the two variables which meant that the more employees perceived the green practices very important, the more frequent they practice the green environmental management.
Table 10: Relationship between College Practices and the Perceived Importance of Green
Environmental Management
Variables Mean Sig. (2-tailed) Interpretation
College Green Environmental Management Practices 2.00
.005 Significant RelationshipPerceived Importance of Green Management Practices 2.71

39
STEPSVol. 2 2014
Conclusions
The following were conclusions of the study based on the results, findings and implications:
1. As reflected in the weak green organizational culture, poor green physical facilities, and poor green curriculum, the College with its network of four campuses provided less priority to green environmental management. Results showed conformity in their practices with no significant difference between the four campuses in their green practices, which implies that the green environmental management does not differ based on location.
2. Employees in general give a high value to green environmental management in attaining the goal of the College of becoming a Green Institution by perceiving all elements in the green environmental management as very important.
3. Perception of the respondents on the importance of green practices was not that significant despite being classified into different sex and types of respondent. This would imply that the importance of green practices is perceived without any stark deviations regardless of sex and types of respondents. Differences in campus location made an impact on the perceptions, which would reflect that each of the four campuses of CHSMC have varying degrees of implementation and compliance to green environmental policies.
4. The green environmental management was seldom practiced by the institution. There was also an observed gap in the results in which the employees perceive that green practices are very important yet they seldom practice green environmental management in the workplace.
5. There is a significant relationship between the College green environmental management practices and the perceived importance of these green practices in achieving a Green Institution. Therefore, the more employees perceived the green practices as very important, the more frequent they practice the green environmental management.
Recommendations
The following are the recommendations formulated to improve the green environmental management practices of the College:
1. There should be proper institutional arrangements and policies for green environmental management.
2. There is a need to cultivate and nurture the green culture in all aspects of the institution to insure realization of the College’s vision: GREEN CHMSC Excels.
3. Formulation of green programs with budget allocation.
4. The College should conduct a series of orientation programs in each of its campuses to increase awareness of its employees on green concepts and its applications with emphasis on green practices.

40
Green Environmental Management: Carlos Hilado Memorial State College Practices
5. Employees should be allowed to embrace the green culture through proper motivation and effective communication by the College.
6. Increase the number of personnel who are trained on green environmental management implementation and monitoring to effectively implement and monitor College-wide green programs.
7. Enhance the annual Performance Evaluation and Appraisal System by integrating environmental considerations as one of the Key Performance Index.
8. Improve the procurement policies and processes, and expand the number of prospective suppliers who can provide environment-friendly materials and supplies through on-line system.
9. Redesign and remodel the existing buildings and structures that would maximize the use of natural elements which could result to reduction in electricity consumption and costs
10. The College should integrate green concept and design in future building plans.
11. Office machines and equipment should have regular maintenance and check.
12. The College should allocate a substantial amount for the acquisition of machine for water recycling which would lead to reduction in water consumption and cost.
13. Review and revise the curriculum integrating environmental considerations. The teaching methodology should be modified by emphasizing on green learning and application so that students will give more value on the importance of green practices in their daily lives.
References
1. David, F. R. (2011). Strategic Management: Concepts and Cases. (13th ed.). Upper Saddle River, NJ: Prentice Hall
2. Dess, G. G. et.al. (2010). Strategic Management: Creating Competitive Advantages. (5th ed.). New York: McGraw-Hill/Erwin.
3. DuBrin, A. J. (2012). Essentials of Management. (9th ed.). Boston, MA: Cengage Learning.
4. Goyal, Monika (2013). Future Outlook of Green Management Practices. IOSR Journal of Business and Management. Retrieved on June 10, 2014 from iosrjouornals.org/iosr-Ibm/papers/Vol14-issue6/J01466872.pdf?id…
5. Growald, Danny (2010). The Future of Sustainability: Redefining the American Dream. In: Schwartz, J. C. (Ed.). (2010). Green Careers in Energy.Peterson’s. pp.14-16
41
STEPSVol. 2 2014
6. McShane, S.L. & Vonn Glinow, M.A. (2012). Organizational Behavior. (6th ed.). New York: Irwin/McGraw-Hill.
7. Newstrom, J. W. (2011). Organizational Behavior: Human Behavior at Work. (13th ed.). Boston, MA: McGraw-Hill.
8. Republic Act No. 9003. Ecological Solid Waste Management Act of 2000.
9. Robbins, S. P. & Coulter, M. (2012). Management. (11th ed.). Boston, MA: Prentice Hall.
10. Robbins, S. P. & Judge,T. A. (2011). Organizational Behavior. (14th ed.) Upper Saddle River, N.J.: Prentice Hall.
11. Rom, W. N. (2012). Environmental Policy an Public Health: Air Pollution, Global Climate Change, and Wilderness. (1st ed.). San Francisco: JohnWiley & Sons, Inc.
12. Schwartz, J. C. (Ed.). (2010). Green Careers in Energy. Peterson’s.
13. Salvador, S.M. et al. (2010). Corporate Social Responsibility and Good Governance. (2nd ed.). Allen Adrian Books Inc.
14. Spilde, Mary F. T. (2010). Role of Community Colleges in Creating a Workforce for the Green Economy. In: Schwartz, J. C. (Ed.). (2010). Green Careers in Energy. Peterson’s. pp.17-20.
15. Stoner, J. A. et al. (2005). Management. America: Prentice-Hall, Inc..
16. Uriarte, F. A. (2008). Solid Waste Management: Principles and Practices.Philippines: The University of the Philippines Press.

42
Scholarly Technical Education Publication Series

43
STEPSVol. 2 2014 Hindering Factors of
Female Participation in TVET in Nepal
Ram Hari LamichhaneMember Secretary (CEO)Council for Technical Education & Vocational Training (CTEVT), Nepal Email: [email protected]
Abstract
This paper highlights the status of women in technical and vocational education and training (TVET) and the five major factors hindering access of women to TVET which include: educational attainment, involvement in household work, male dominance, lack of access to information and financing. Based on the literatures gathered, women’s contribution to the socio economic development of the country is of equal levels compared to the males but their participation in TVET is not encouraging. It is also found out that the participation of women is high in the rural public technical schools compared to the urban technical schools. There is a high women participation in the private technical schools, particularly in the health services sector. Meanwhile, the participation of women in vocational training is higher than in technical education. Women’s access to TVET facilities are hampered due to illiteracy, more involvement in household work and lack of financial capability.
The conventional perception towards women is a drawback in enhancing access of women in technical education and vocational training programs. Thus, measures to overcome these problems such as women-focused education programs in all levels must be pursued. The use of appropriate mediums and approaches to disseminate information about these programs, as well as the expansion of financial options must be explored.
Keywords: women participation, women-focused education, equal opportunities
Introduction
Women and men make equal contributions to the Nepalese economic and social development, but women are not getting equal opportunities in education and other sectors. There are 51.6 percent females and 48.4 percent males in Nepal (CBS, 2012). In the labor force, their involvement in domestic work and agriculture is about 80% and the involvement of women in the public sector service and other development sectors is about 8 %.
Despite the existence of several programs targeted to improve the lives of women, their social status has not been that encouraging particularly in the field of education. In spite of several years of concerted efforts and different approaches of TVET adherents in improving the TVET systems, the participation of women could not be maximized because their access to TVET programs is almost impossible. This is supported by a research article of Subedi (2005) which stated that generally, women and other disadvantaged groups have had little opportunity in TVET. According to
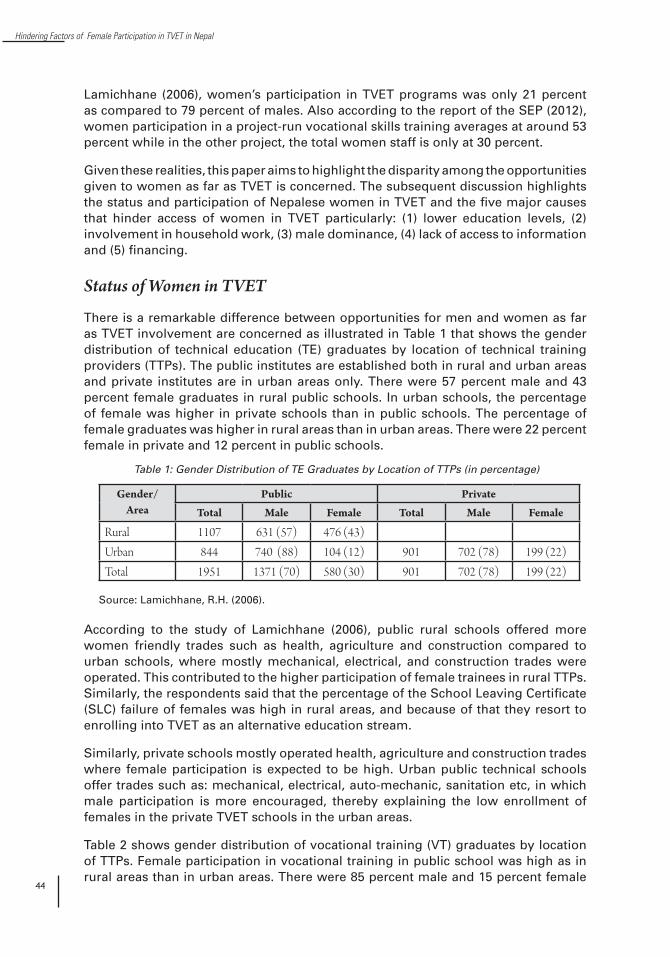
44
Hindering Factors of Female Participation in TVET in Nepal
Lamichhane (2006), women’s participation in TVET programs was only 21 percent as compared to 79 percent of males. Also according to the report of the SEP (2012), women participation in a project-run vocational skills training averages at around 53 percent while in the other project, the total women staff is only at 30 percent.
Given these realities, this paper aims to highlight the disparity among the opportunities given to women as far as TVET is concerned. The subsequent discussion highlights the status and participation of Nepalese women in TVET and the five major causes that hinder access of women in TVET particularly: (1) lower education levels, (2) involvement in household work, (3) male dominance, (4) lack of access to information and (5) financing.
Status of Women in TVET
There is a remarkable difference between opportunities for men and women as far as TVET involvement are concerned as illustrated in Table 1 that shows the gender distribution of technical education (TE) graduates by location of technical training providers (TTPs). The public institutes are established both in rural and urban areas and private institutes are in urban areas only. There were 57 percent male and 43 percent female graduates in rural public schools. In urban schools, the percentage of female was higher in private schools than in public schools. The percentage of female graduates was higher in rural areas than in urban areas. There were 22 percent female in private and 12 percent in public schools.
Gender/ Area
Public Private
Total Male Female Total Male Female
Rural 1107 631 (57) 476 (43)Urban 844 740 (88) 104 (12) 901 702 (78) 199 (22)Total 1951 1371 (70) 580 (30) 901 702 (78) 199 (22)
Table 1: Gender Distribution of TE Graduates by Location of TTPs (in percentage)
Source: Lamichhane, R.H. (2006).
According to the study of Lamichhane (2006), public rural schools offered more women friendly trades such as health, agriculture and construction compared to urban schools, where mostly mechanical, electrical, and construction trades were operated. This contributed to the higher participation of female trainees in rural TTPs. Similarly, the respondents said that the percentage of the School Leaving Certificate (SLC) failure of females was high in rural areas, and because of that they resort to enrolling into TVET as an alternative education stream.
Similarly, private schools mostly operated health, agriculture and construction trades where female participation is expected to be high. Urban public technical schools offer trades such as: mechanical, electrical, auto-mechanic, sanitation etc, in which male participation is more encouraged, thereby explaining the low enrollment of females in the private TVET schools in the urban areas.
Table 2 shows gender distribution of vocational training (VT) graduates by location of TTPs. Female participation in vocational training in public school was high as in rural areas than in urban areas. There were 85 percent male and 15 percent female

45
STEPSVol. 2 2014
vocational training graduates in rural areas. In urban areas, there were 91 percent males and 9 percent females in both public and private technical schools. The female participation in Skills Development Training Centers (SDTCs) was more than in other schools. There were 54 percent male and 46 percent female graduates.
TradesPublic TS Private TS SDTCs
TE VT TE VT TE VT
Construction 48 (8) 22 (19) 31 (16) 1(0.5) - -Agriculture 143 (25) 59 (50) 8 (4) 46 (90.5) - -Mechanical - - - - - -Electrical and Electronics 96 (17) 36 (31) - 4 (8) - 77 (7)Other (Health, Beauty Parlour and sewing) 293 (50) - 160 (80) - - 1077 (93)
Total 580 117 199 51 - 1154
Table 3: Female Graduates in TVET by Trades and TTPs (in percentage)
Source: Lamichhane, R.H. (2006).
Gender/ Area
Public Private SDTCs
Total Male Female Total Male Female Total Male Female
Rural 531 450(85)
81(15) - - - - - -
Urban 392 356(91)
36(9) 542 491
(91)51(9) 2514 1360 1154
(46)
Total 923 806(87)
117(13) 542 491
(91)51(9) 2514 1360
(54)1154(46)
Table 2: Gender Distribution of VT Graduates by Location of TTPs (in percentage)
Source: Lamichhane, R.H. (2006).
Lamichhane (2006) further indicated that public and private schools conducted similar kinds of vocational training and technical education. Therefore, the justification of female participation in urban and rural areas was similar to technical education as mentioned above. Female participation in SDTCs was greater than in other schools because SDTCs run more women friendly trades e.g., beauty parlor, sewing and knitting etc., and provided free tuition with training allowance. Similarly, SDTCs have standard operational calendar for vocational training programs, which was lacking in private and public technical schools. People were aware of the training information of SDTCs and more females participated than in other schools. Private schools run vocational training programs only if they got support from donors.
Table 3 presents the status of female graduates in different trades by nature of training providers. The health, agriculture, and electrical and electronics trades had higher percentage of female graduates in technical education in both public and private institutes. In public institute, there were 50 percent, 25 percent and 17 percent of the total female graduates in technical education in health, agriculture and electrical and electronics, respectively. There were no female graduates in mechanical trades. Similarly, there was high percentage of females in agriculture trade in vocational training in both private and public institutes that was 50 percent and 90.5 percent, respectively. In SDTCs, more females (93%) were in beauty parlor and stitching training than in other profession. There was no female participation in construction and mechanical trades.

46
Hindering Factors of Female Participation in TVET in Nepal
According to the study (Lamichhane, 2006), females participated in easier and softer skills than in hard and risky ones. Therefore, their participation was higher in health, beauty parlor, sewing and agriculture related training than in mechanical and construction. This finding was consistent with the findings of Nepal Human Development Report (2004, p. 52) and Sharma and Dhungel (2002). The above research reports emphasizes that women were confined to socially accepted and culturally prescribed occupations, and they had to perform household work, reproductive functions and unpaid agricultural activities as three major tasks.
Causes of Hindering Female Participation
The low education level of women is one of the major causes hindering their access to TVET programs. The average literacy rate is about 56 percent in Nepal. Out of that, female literacy is just 43 percent. As far as literacy rate is concerned, about 69 percent of the economically active population of Nepal is illiterate (CBS, 2001). This can pose some risks and problems since most of the offered TVET programs require at least the completion of primary level education or above. The training achievements do not only rely on the candidate's interest, because the skill-training programs are targeted to persons with academic degrees (SLC level education). People who lack skills or relevant qualifications, therefore, do not meet the basic requirements in entering TVET. Technical and vocational training requires basic levels of literacy and numeracy and an understanding of basic scientific concepts. Without proper training and comprehension, outputs will not be satisfactory.
Educated trainees often benefited more from training programs than their less educated peers. Therefore, basic education should be a pre-requisite to obtain entry into technical training programs (DFID, 1993). According to the journal (African Economic Outlook, 2010), “Gender inequalities in technical education and vocational training (TVET) reflect the lower enrollment rates of women in secondary education generally. Countries where women account for fewer than 15 per cent of TVET enrollment include Eritrea, Ethiopia, Malawi, Namibia, Niger and Uganda. For this group of countries, the share of TVET enrollment in overall secondary enrolment is less than 5 per cent, and the proportion of girls is low not only in technical and vocational education but throughout the entire education system.”
The second important cause hindering access of women in TVET program is their high involvement in daily household work. In Nepal, especially in the rural areas, women have to perform daily household work in addition to farm work and child care. Some of the household chores performed by women include: (1) preparations for cooking, (2) carrying water and fuel, (3) cooking, (4) cleaning and (5) washing clothes. Being a daughter in the family, a young girl also has to perform such activities. In urban areas, women have to do those activities in addition to their other jobs which added to the physical and mental strain. In addition, the TVET Journal (Sharma, 2005) indicated that women were forced to spend most of their working hours in carrying water and fuel, which made their working days longer. One of the key factors that limits access was the time spent by rural poor in development activities to meet their everyday needs (ILO, 1998). Therefore, despite their willingness to participate in TVET and other education programs, women are being hindered by day to day household activities.
47
STEPSVol. 2 2014
The third important cause hindering access of women in TVET program is male dominance. In the Nepalese society, most of the people feel that TVET programs are for men and not for women. This stereotype was further exacerbated by the nature of the programs such as carpentry, plumbing and sanitation, welding, furniture maker, scaffolding, shuttering carpentry, steel fixture, mechanical, auto mechanic, electrical, and commercial cooking, in which physical strength and endurance is required. There are only a few trade which are oriented for women such as healthcare servicing, caregiving, housekeeping and some agriculture related programs. Because of the programs’ nature women hesitate to participate. One of the major findings of the study regarding the reasons for low female participation in technical education was heavy physical work demand and the physical structure of the female (Sharma, 2000). Similarly, other international studies have also recognized this problem. According to (Zuga, 1999), “Even though women today have an increased opportunity to enroll in technology education programs, the vast majority still chose not to”, signaling that there are some training practices that are not suited to the needs of women trainees.
Women perceive technology education as a male domain in which they do not belong and feel even more so after having taken a technology education course. The question of whether technology educators can address this lack of participation without first understanding the differences between men’s and women’s choice of studies is investigated using feminist analysis.” (Zuga, 1999 p.1)
The fourth important cause hindering access of women in TVET programs is lack of access to information. Information related to TVET programs are published mostly in national newspapers and radios, which are deemed to be inaccessible to women and are not readily understood by illiterate women. This exposes an apparent lack of several alternative sources of information in the rural areas that will cater for the illiterate sectors of the society, particularly women since most of the relevant information serves only the bigger urban areas and district headquarters.
A study on access of TVET (Lamichhane, 2006), identified the lack of information as a major cause of lesser female participation in TVET. Similarly, a field verification and monitoring reports of different TVET projects (SEP, 2012, & Lamichhane, 2013) highlighted that the lack of information about training and scholarship to people living in the remote areas of the country is the major cause of low female and disadvantaged group participation in training programs.
Another factor hindering access of women in TVET programs is financing. TVET programs are quite costly so, underprivileged people would have concerns in financing for it. For example, the total cost of Staff Nurse Course is about $7000 while 3-month vocational skills training cost is about $300 which is quite a huge amount for poor women. Considering the geographical distance of training institutions TVET cost becomes more expensive. In addition to this, the traditional concept towards women also led the parents to believe that there is no need to invest much on their daughter’s education. Furthermore any kind of financing institutions are not available in the country to provide loan to TVET students and even if there is, they provide on collateral basis only. In Nepal, ownership of land and buildings belongs mostly to men, in this case women would not be able to present any collateral in applying for loan. It is interesting to note, however, that some TVET programs have been running without tuition fees especially for women and disadvantaged groups. But still, poor women cannot participate due to high cost of living and transportation. This issue

48
Hindering Factors of Female Participation in TVET in Nepal
is supported in the study conducted by the British Council (The Economist, 2013) which mentioned the availability of funds in training and education as one of the key challenges in TVET in South Asia.
Initiatives Taken to Increase Female Participation
Given the scenario above, Nepal has taken various initiatives to increase female participation in TVET. The following are the major initiatives undertaken:
1. Policy intervention: Since 2000 AD, all periodic economic plans formulated by the Nepalese government focused on the access of female and disadvantaged group in TVET. Similarly, TVET Policy 2007 and 2012 has mentioned access and equity of female as a key policy intervention.
2. Women Friendly Environment: The Government of Nepal and CTEVT have proposed and implemented a program to provide access to women (at least 33 %) through the creation of acts, laws, bylaws and guidelines that ensures the inclusivity and participation of women in TVET programs. In a landmark step, CTEVT has circulated an order to all technical schools to construct female toilets to facilitate the sanitary needs of female TVET students. Similarly, capacity building efforts in developing and enhancing TVET knowledge and skills of more female teachers/instructors are provided and are given priority giving due importance to the role of female instructors who are responsible for providing training to female students.
3. Program and Project Intervention: The Nepalese government, through CTEVT, has implemented different projects targeting to enhance female participation in vocational skills training. One of these projects is the Skills for Employment Project (SEP), which targeted a total of 62,000 graduates and at least 50% of them are female. At the end of the project, 53 percent of the female graduates received vocational training and about 60% of them were employed (SEP, 2012). Similarly, the program entitled “Enhanced Vocational Education and Training (EVENT)” project has been running since 2011. This program targeted 45,000 graduates, with at least 30% of them are female. Another project, “Skills for Development Project (SDP)” has started from 2013 targeting 46,000 graduates (40% female). In supporting inclusivity to other disadvantaged sectors of the society, the Nepalese government has initiated direct program intervention to bring Muslim and dalit* girls into TVET by providing full scholarship opportunities since 2010. Now in its third year, this project benefits approximately 100 girls per year.
Conclusions and Recommendations
Despite several efforts and focused programs, participation of women in TVET is still negligible compared to the size of women population. There are notable improvements though, in some women friendly vocational training, health and agriculture related technical education. Women’s access in TVET could bring remarkable contributions to the development of the country, but existing factors continued to be barriers in their involvement in TVET programs. Therefore, a more focused and deeper insight
*Dalit - is a designation for a group of people traditionally regarded as untouchable

49
STEPSVol. 2 2014
on this issue as well as meaningful measures must be undertaken to encourage women’s access in TVET.
There are several measures to overcome such causes of women’s lack of access in TVET programs. First of all, there should be women-focused education programs to increase their access in all kinds of education. Second, TVET program should be implemented with flexible time schedule to ensure their participation while attending to household work. Awareness programs must be carried out to provide information on and promote the importance of education to females. Third, TVET programs should be designed and developed considering the demands and needs of the women, which will resolve issues concerning male-dominated TVET. Fourth, TVET programs should be affordable for women to be provided with opportunity to avail of TVET. Finally, TVET programs should be implemented on a mobile basis which also means opening more TVET institutions in many parts of the country not only in capital and major cities. Based on the aforementioned suggestions, the following framework of actions has been recommended.
Key Areas Major Actions Time Frame Responsible
Enhance Education Level • Providefreeeducationforgirls• Conduct adult literacy campaign
classes• ConductdifferentlevelsofTVET
targeting femaleBalance between learning opportunities and household work
• Conduct awareness program formen to share household activities
• Conductvocationalskills trainingon flexible timing
• Focus on mobile training ratherthan institutional
Immediate
Mid-term
Ministry of Women
Development, MoE and CTEVT
Empower women to minimize male domination
• Conduct awareness to empowerwomen
• Sharingofresponsibilitiesbybothgender
• Bring gender friendly affirmativeactions
• Organize different empowermentprograms
Immediate
Mid-term
Government
Access of Information • Prepareinformationdisseminationplan
• Use appropriate media/methodsto provide information even in rural areas
• Conduct periodicmonitoring oninformation dissemination
Immediate CTEVT
Financing • EstablishTVETFund• Provide finance in a coordinated
way• Take affirmative actions to
finance for female targeted TVET programs
Mid and Long-Term
Ministry of Finance, MoE and CTEVT
Table 4: Framework of Actions
50
Hindering Factors of Female Participation in TVET in Nepal
References
1. African Economic Outlook. (2010). Access to technical and vocational education in Africa. Retrieved April 24, 2010, from http://www.africaneconomicoutlook.org/en/in-depth/developing-technical-and-vocational-education-in-africa
2. CBS. (2012). National report of population census 2011. Kathmandu: CBS.
3. DFID. (1993). Education and the development the issues and the evidence-education research. Retrieved April 25, 2010 from http://www.dfid.gov.uk/AboutDFID/Education/research/library/html/dep06e/ch14.htm
4. ILO. (1998). Wasted time: the price of poor access – employment sector. Retrieved April 25, 2010 from http://www.ilo.org/public/english/employment/start/poldev/papers/1998/wasted/wt_ch1-2.htm
5. Lamichhane, R. H. (2006). Participation of poor disadvantaged group in technical education and vocational training in Nepal. Unpublished doctoral dissertation. Kathmandu University, Kathmandu, Nepal
6. Lamichhane, R. H. (2013). A training need assessment for carpet industry in Nepal. Kathmandu: Goodweave Foundation.
7. SEP. (2012). Project completion report. Skills for Employment Project (SEP), Kathmandu, Nepal.
8. Sharma, A. (2000). Female participation in technical education in Nepal. Unpublished doctoral dissertation, Southern Illinois University, Carbondale, USA.
9. Sharma, A. & Dhungel, D. (2003). A study of women friendly employable training for school dropout girls and women. Kathmandu: Training for Employment Project (TfE).
10. Sharma, T.N. (2005). Connecting technical education and vocational training with employment in Nepal: current problems, issues and trends. A paper published in TVET Development Journal. Vol. 1 (9). Kathmandu: CTVET
11. Subedi, B. S. (2005). Overview of technical education and vocational training
policies of Nepal. Kathmandu: Training for Employment Project
12. The Economist. (2013 September). Skills development in South Asia. The Economist Intelligence Unit.
13. Zuga, K. F. (1999). Journal of Technology Education, Vol. 10, No. 1.Charlottesville: Digital Library Archives. Virginia Polytechnic Institute and State University. Retrieved April 24, 2010 from: http://scholar.lib.vt.edu/ejournals/JTE/v10n2/ zuga.html
51
STEPSVol. 2 2014 Level of Institutional Productivity
and Organizational Climate of Carlos Hilado Memorial State Colleges: Basis for Institutional Productivity Plan
Vanessa Joy Z. Judith FacultyCarlos Hilado Memorial State College- Alijis Campus, [email protected]
Abstract
This study identified the level of institutional productivity and organizational climate of Carlos Hilado Memorial State College (CHMSC) as the basis for institutional productivity plan. Specifically, it determined the level of institutional productivity in terms of instruction, research, extension and production and the type of organizational climate as perceived by the participants when taken as a whole and grouped according to certain variables. The study included 137 or 66 percent of the permanent faculty employed in school year 2012-2013. Data were gathered using the researcher- made questionnaire, the institutional productivity questionnaire and the organizational climate questionnaire. The organizational climate of the participants was a combination of controlled, closed, autonomous and open climate. Also, institutional productivity did not significantly differ in terms of civil status, sex, educational attainment, length of service and academic rank. Institutional productivity in terms of instruction, research, extension and production was found to be significantly related to organizational climate. The researcher concluded that: Carlos Hilado Memorial State College’s institutional productivity was very satisfactory; in terms of organizational climate, it is a combination of controlled, autonomous, closed and open climate and regardless of organizational climate, institutional productivity in terms of instruction, research, extension and production was very satisfactory.
Keywords: Institutional Productivity, Institutional Productivity Plan, Organizational Climate, Carlos Hilado Memorial State College, Negros Occidental, Philippines
Introduction
Society is composed of many different kinds of institutions, such as health, religious and educational institutions to just name a few. An institution has been created, whenever people join together in some sort of formal structure to achieve an objective. Now more than ever, institutions of higher education face pressure from stakeholders to provide evidence of productivity and efficiency of its operations (CHED, 2003).
A productive school system is exemplified by the quality of its education through excellence in instruction, research, production and community service (Glomo, 2012). Evidently, an institution has its own culture, traditions and methods of action, which determine the climate or atmosphere within which the people work. An institution tends to attract, motivate, lead and keep people who fit its atmosphere, so that its patterns are to some extent perpetuated. This atmosphere is something intangible;
52
Level of Institutional Productivity and Organizational Climate...
it is a property of the institution as a whole which gives that institution its distinct personality.
The status and correlation of these two factors of Institutional Productivity and Organizational Climate will be of interest in determining the directions and future plans that an institution will set in order to respond to stakeholders’ demand for evidence of productivity and efficiency in its operations. With the growing concern to determine the level of productivity and the kind of organizational climate of CHMSC as the basis for Institutional Productivity Plan, hence, this research was conducted.
Statement of the Problem
The research aims to determine the following research questions:
1. What is the level of institutional productivity in terms of instruction, research, extension, and production as perceived by the respondents when they are taken as a whole and grouped according to civil status, sex, educational attainment, length of service and academic rank?
2. Is there a significant difference in the level of institutional productivity when the respondents are taken as a whole and grouped according to the variables mentioned?
3. What are the types of organizational climate, underlying the level of institutional productivity, as perceived by the respondents when taken as a whole and grouped according to civil status, sex, educational attainment, length of service and academic rank?
4. Is there a significant relationship between the level of institutional productivity and organizational climate?
Hypotheses
The following null hypotheses were formulated:
1. There is no significant difference in the level of institutional productivity when the respondents are taken as a whole and grouped according to civil status, sex, educational attainment, length of service and academic rank.
2. There is no significant difference in the organizational climate of the institution when the respondents are taken as a whole and grouped according to civil status, sex, educational attainment, length of service and academic rank.
3. There is no significant relationship between the level of institutional productivity and organizational climate.
Review of Related Literature
This section presents both the conceptual and research literature that will help the investigation needed to focus, to give direction and clarity to the study. The literature reviewed provides the researcher the insights into the subject matter of
53
STEPSVol. 2 2014
the present study. It also provides the researcher information and materials needed in the formulation and development of the data gathering instrument. It focuses on the following: Institutional Productivity, Research and Extension, Instruction and Production. Related studies are also included to enrich the study.
On Institutional Productivity
There are various approaches on how to measure institutional productivity especially of state colleges and universities in the Philippines. According to CHED “a State University shall perform all the four functions of instruction, research, outreach and production; and offer a full range of baccalaureate, master’s, doctoral and post-doctoral programs in various disciplines provided said programs meet CHED requirements and standards” (CHED, 2003).
Alexander in his paper “Changing the Face of Accountability” stated that “with greater expectations being placed on it, higher education is being obliged to examine itself or be examined by others. This observation reflects the increasing societal requirement that colleges and universities must become responsive to national economic needs and governmental demands for increased performance” (Alexander, 2000). He further pointed out how governments would turn to quality higher education in enhancing the productivity and economic strength of the nation.
On Organizational Climate
Gilmer (1986) as noted by Hoy and Miskel (1991) defined organizational climate as the total environment quality within an organization that distinguishes the organizations from other organizations and influences the behavior of the people in the organization. School climate, on the other hand, refers to the teacher’s perceptions of the general work environment of the school. It is the relatively enduring quality of the school environment that is experienced by the participants that affect their behavior and is based on their collective perceptions of behavior in school.
Kidd, Crawford and Riches (1997), cited organizational climate as a concept that refers to the different cultures or qualities possessed by organizations regardless of whether the structure is hierarchical and bureaucratic or informal or dynamic. Likewise, whether risk- taking or not, the use of individual initiative is encouraged or frowned upon.
Climate Types
The most well-known conceptualization and measurement of organizational climate in school is pioneered by Halpin and Croft (1963). They developed an instrument, the Organizational Climate Descriptive Questionnaire (OCDQ) to identify organizational climate of schools based on teacher-teacher, and teacher-principal interactions. The different climate types are open, autonomous, controlled, familiar, paternal and closed climate.
Open Climate is a climate that depicts a situation in which the teachers enjoy friendly relations with each other and obtain considerable satisfaction and are sufficiently motivated to overcome difficulties and frustrations.
54
Level of Institutional Productivity and Organizational Climate...
Autonomous Climate is a climate which has for its distinguishing feature the almost complete freedom that the leader gives to the teachers to provide their own structure-for-interaction so that they can find ways within the group for satisfying their social needs.
Controlled Climate is a type of climate which is characterized by diligence and hard work. Even though the administrator does not model commitment, hard work is overemphasized to the extent that little or no time is given to social life. Nonetheless, teachers are committed to their work and spend considerable time on paper work. Thus, in most cases, there is little time to interact with one another.
Familiar Climate is a type of climate which depicts a laissez-faire atmosphere. The principal is concerned about maintaining friendly atmosphere at the expense of task accomplishment. Thus, a considerable percentage of teachers are not committed to their primary assignment. Some who are committed resent the way the principal runs the college, they do not share same views with the principal and their colleagues. As a result, those who are not committed, form a clique because they are of the same attitude, they become friends.
Paternal Climate is a type of climate which depicts an atmosphere where the principal is very hardworking but has no effect on the staff, to them hard work is not a popular term.
Closed Climate represents the “antithesis of the open climate”. There is no emphasis on the accomplishment; rather the principal stresses on routine, trivial and unnecessary paper work to which teachers minimally respond. The principal is strict and rigid in behavior. He/she is inconsiderate, unsupportive and unresponsive.
Research Methodology
The study utilized the descriptive research method of research. This method involves collecting data in order to test hypothesis or answer questions concerning the current work status of the participants of the study (Gay, 1992). It also utilized the annual report from the research office on productivity for further analysis of data and results.
The participants of this study were 137 permanent faculty members of CHMSC employed in the academic year 2012-2013 in the following campuses: (1) CHMSC- Talisay Campus, Talisay City; (2) CHMSC- Binalbagan Campus, Binalbagan; (3) CHMSC- Alijis Campus, Bacolod City; and (4) CHMSC- Fortune Town Campus, Bacolod City. Stratified random sampling was employed in the selection of the participants. In this sampling procedure, each unit in the population is identified, and each unit has a known, non-zero chance of being in the sample. This is used when the population has sub- groups (strata) that are of interest. The 137 permanent faculty members of CHMSC, were categorized according to civil status, sex, educational attainment, length of service and academic rank.
The researcher – made questionnaire was utilized in this study. This consisted of three parts. These are: the Personal Data Sheet, the Institutional Productivity Questionnaire and Organizational Climate Questionnaire. To establish the validity of the instrument, a panel of three juror experts in the field of research, testing, psychology and

55
STEPSVol. 2 2014
guidance were requested to validate the content of the questionnaire using the criteria developed by Carter V. Good and Douglas B. Scates.
The questionnaires were pilot tested among 17 faculty of CHMSC Fortune Town Campus. The statistical tool used to determine the reliability and the interval consistency of the two instruments was the alpha coefficient known as Cronbach Alpha. This coefficient is the general form of Kuder – Richardson Approaches (KRZO) used in calculating the reliability of the items that are not scored right versus wrong. The results of the pilot administration were subjected to test reliability using the Statistical Package for the Social Sciences (SPSS) software. The obtained reliability coefficient Cronbach alpha was 0.8133 for the rating scale on Institutional Productivity and 0.8312 for Organizational Climate.
The data gathered for the actual investigation were subjected to appropriate descriptive and inferential statistics. These are: Percentage, Mean, Standard Deviation, Pearson r, t-test and ANOVA.
Results and Discussions
The following presents the data and their corresponding analyses and interpretation. The researcher aimed to investigate through the gathered data the existing level of institutional productivity and organizational climate of CHMSC as the basis for institutional productivity plan of the college with consideration to antecedent variables like civil status, sex, academic rank, highest educational attainment and length of service.
The Level of Institutional Productivity in Instruction of Carlos Hilado Memorial State College
The institutional productivity in instruction of CHMSC as an entire group was “Very Satisfactory” (M-4.09, SD= .62) in terms of instruction. Instruction is one of the functions of higher education institutions which include their continuing quest for excellence and commitment to reasonably high standards of instruction through the quality of their educational programs, outstanding achievements of their students and excellent performance of their graduates particularly in government/board examinations. CHMSC has “Very Satisfactory” performance in the area of instruction. These were supported by the findings from the document analysis, as well as the implications associated from the interpretation of the findings below. Refer to Table 1.
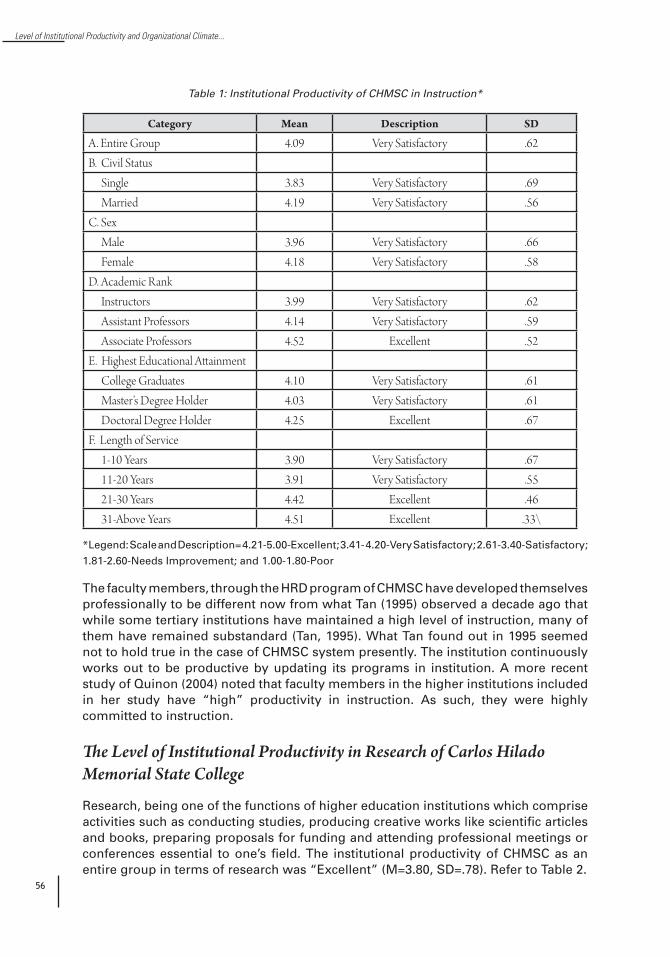
56
Level of Institutional Productivity and Organizational Climate...
*Legend: Scale and Description= 4.21-5.00-Excellent; 3.41- 4.20-Very Satisfactory; 2.61-3.40-Satisfactory;
1.81-2.60-Needs Improvement; and 1.00-1.80-Poor
The faculty members, through the HRD program of CHMSC have developed themselves professionally to be different now from what Tan (1995) observed a decade ago that while some tertiary institutions have maintained a high level of instruction, many of them have remained substandard (Tan, 1995). What Tan found out in 1995 seemed not to hold true in the case of CHMSC system presently. The institution continuously works out to be productive by updating its programs in institution. A more recent study of Quinon (2004) noted that faculty members in the higher institutions included in her study have “high” productivity in instruction. As such, they were highly committed to instruction.
The Level of Institutional Productivity in Research of Carlos Hilado Memorial State College
Research, being one of the functions of higher education institutions which comprise activities such as conducting studies, producing creative works like scientific articles and books, preparing proposals for funding and attending professional meetings or conferences essential to one’s field. The institutional productivity of CHMSC as an entire group in terms of research was “Excellent” (M=3.80, SD=.78). Refer to Table 2.
Category Mean Description SD
A. Entire Group 4.09 Very Satisfactory .62B. Civil Status Single 3.83 Very Satisfactory .69 Married 4.19 Very Satisfactory .56C. Sex Male 3.96 Very Satisfactory .66 Female 4.18 Very Satisfactory .58D. Academic Rank Instructors 3.99 Very Satisfactory .62 Assistant Professors 4.14 Very Satisfactory .59 Associate Professors 4.52 Excellent .52E. Highest Educational Attainment College Graduates 4.10 Very Satisfactory .61 Master’s Degree Holder 4.03 Very Satisfactory .61 Doctoral Degree Holder 4.25 Excellent .67F. Length of Service 1-10 Years 3.90 Very Satisfactory .67 11-20 Years 3.91 Very Satisfactory .55 21-30 Years 4.42 Excellent .46 31-Above Years 4.51 Excellent .33\
Table 1: Institutional Productivity of CHMSC in Instruction*
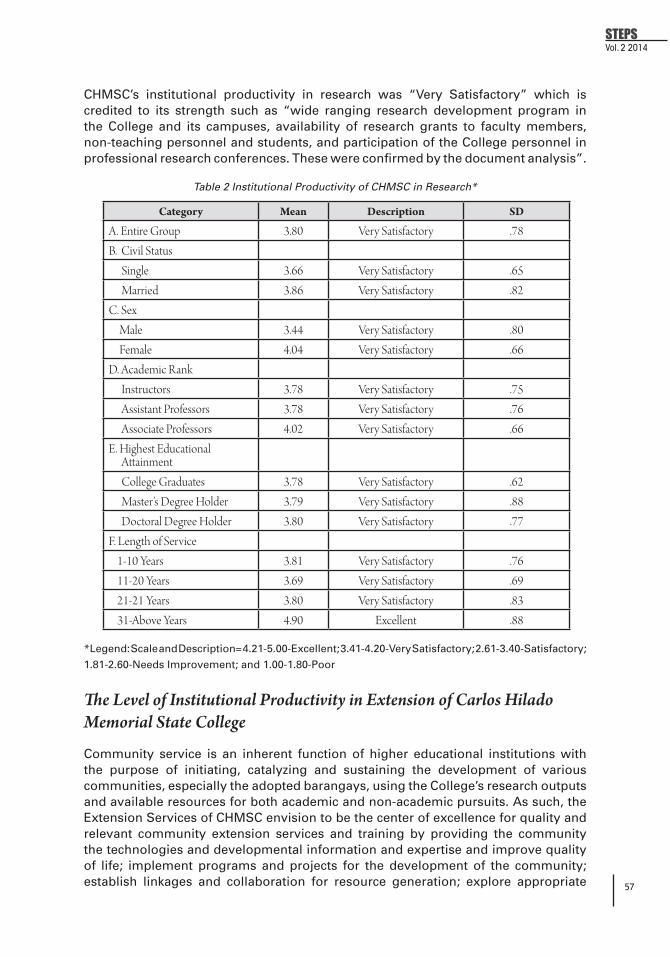
57
STEPSVol. 2 2014
CHMSC’s institutional productivity in research was “Very Satisfactory” which is credited to its strength such as “wide ranging research development program in the College and its campuses, availability of research grants to faculty members, non-teaching personnel and students, and participation of the College personnel in professional research conferences. These were confirmed by the document analysis”.
Table 2 Institutional Productivity of CHMSC in Research*
Category Mean Description SD
A. Entire Group 3.80 Very Satisfactory .78B. Civil Status Single 3.66 Very Satisfactory .65 Married 3.86 Very Satisfactory .82C. Sex Male 3.44 Very Satisfactory .80 Female 4.04 Very Satisfactory .66D. Academic Rank Instructors 3.78 Very Satisfactory .75 Assistant Professors 3.78 Very Satisfactory .76 Associate Professors 4.02 Very Satisfactory .66E. Highest Educational Attainment College Graduates 3.78 Very Satisfactory .62 Master’s Degree Holder 3.79 Very Satisfactory .88 Doctoral Degree Holder 3.80 Very Satisfactory .77F. Length of Service 1-10 Years 3.81 Very Satisfactory .76 11-20 Years 3.69 Very Satisfactory .69 21-21 Years 3.80 Very Satisfactory .83 31-Above Years 4.90 Excellent .88
*Legend: Scale and Description= 4.21-5.00-Excellent; 3.41-4.20-Very Satisfactory; 2.61-3.40-Satisfactory;
1.81-2.60-Needs Improvement; and 1.00-1.80-Poor
The Level of Institutional Productivity in Extension of Carlos Hilado Memorial State College
Community service is an inherent function of higher educational institutions with the purpose of initiating, catalyzing and sustaining the development of various communities, especially the adopted barangays, using the College’s research outputs and available resources for both academic and non-academic pursuits. As such, the Extension Services of CHMSC envision to be the center of excellence for quality and relevant community extension services and training by providing the community the technologies and developmental information and expertise and improve quality of life; implement programs and projects for the development of the community; establish linkages and collaboration for resource generation; explore appropriate
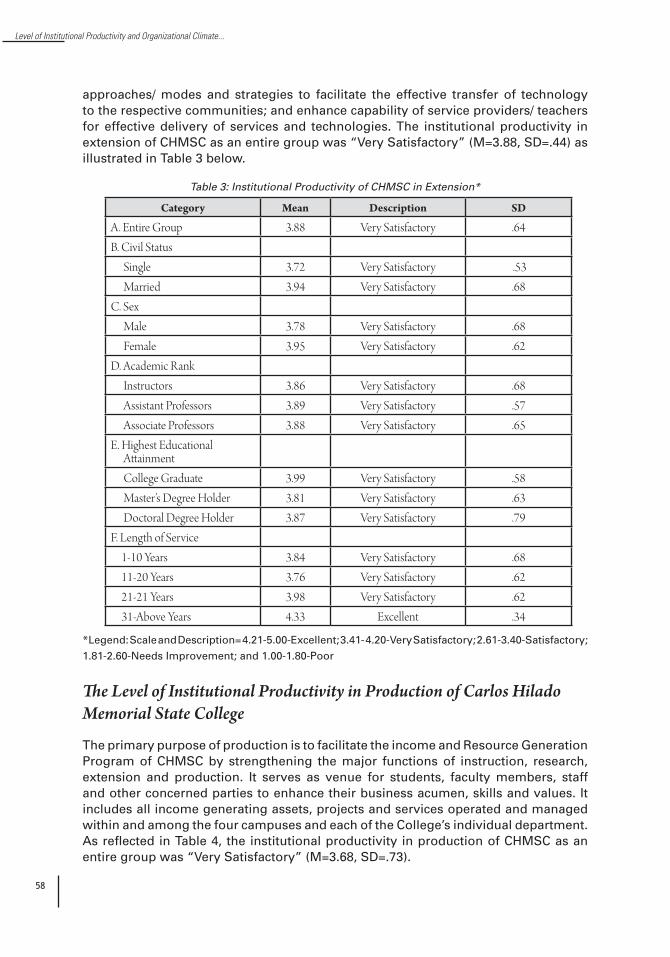
58
Level of Institutional Productivity and Organizational Climate...
approaches/ modes and strategies to facilitate the effective transfer of technology to the respective communities; and enhance capability of service providers/ teachers for effective delivery of services and technologies. The institutional productivity in extension of CHMSC as an entire group was “Very Satisfactory” (M=3.88, SD=.44) as illustrated in Table 3 below.
Table 3: Institutional Productivity of CHMSC in Extension*
Category Mean Description SD
A. Entire Group 3.88 Very Satisfactory .64B. Civil Status Single 3.72 Very Satisfactory .53 Married 3.94 Very Satisfactory .68C. Sex Male 3.78 Very Satisfactory .68 Female 3.95 Very Satisfactory .62D. Academic Rank Instructors 3.86 Very Satisfactory .68 Assistant Professors 3.89 Very Satisfactory .57 Associate Professors 3.88 Very Satisfactory .65E. Highest Educational Attainment College Graduate 3.99 Very Satisfactory .58 Master’s Degree Holder 3.81 Very Satisfactory .63 Doctoral Degree Holder 3.87 Very Satisfactory .79F. Length of Service 1-10 Years 3.84 Very Satisfactory .68 11-20 Years 3.76 Very Satisfactory .62 21-21 Years 3.98 Very Satisfactory .62 31-Above Years 4.33 Excellent .34
*Legend: Scale and Description= 4.21-5.00-Excellent; 3.41- 4.20-Very Satisfactory; 2.61-3.40-Satisfactory;
1.81-2.60-Needs Improvement; and 1.00-1.80-Poor
The Level of Institutional Productivity in Production of Carlos Hilado Memorial State College
The primary purpose of production is to facilitate the income and Resource Generation Program of CHMSC by strengthening the major functions of instruction, research, extension and production. It serves as venue for students, faculty members, staff and other concerned parties to enhance their business acumen, skills and values. It includes all income generating assets, projects and services operated and managed within and among the four campuses and each of the College’s individual department. As reflected in Table 4, the institutional productivity in production of CHMSC as an entire group was “Very Satisfactory” (M=3.68, SD=.73).

59
STEPSVol. 2 2014
Table 4: Institutional Productivity of CHMSC in Production*
Category Mean Description SD
A. Entire Group 3.68 Very Satisfactory .73B. Civil Status Single 3.55 Very Satisfactory .62 Married 3.73 Very Satisfactory .77C. Sex Male 3.56 Very Satisfactory .79 Female 3.77 Very Satisfactory .69D. Academic Rank Instructor 3.63 Very Satisfactory .68 Assistant Professor 3.75 Very Satisfactory .73 Associate Professor 3.81 Very Satisfactory .87E. Highest Educational Attainment College Graduate 3.83 Very Satisfactory .60 Master’s Degree Holder 3.59 Very Satisfactory .73 Doctoral Degree Holder 3.67 Very Satisfactory .95F. Length of Service 1-10 Years 3.61 Very Satisfactory .66 11-20 Years 3.58 Very Satisfactory .69 21-21 Years 3.81 Very Satisfactory .84
Institutional Productivity in Instruction of the College
The computer-processed Analysis of Variance (ANOVA) and the t- test were used to determine whether or not there exist significant differences in the institutional productivity in instruction in CHMSC when grouped as to civil status, sex, educational attainment, academic rank, highest educational attainment and length of service. The results are presented in Tables 6 and 7.
Table 5 shows the statistical difference in the institutional productivity when the teachers in CHMSC were grouped according to civil status, sex, educational attainment, academic rank, highest educational attainment and length of service.
Table 5: t- test Results for the Difference Between Institutional Productivity in Instruction
among Civil Status and Sex
Category MeanMean
Differencet
valueDf 2 tailed sig.
Statistical Decision
A. Civil Status -.36 3.21 135 .002 Ho Rejected Single 3.83 Married 4.19B. Sex -.22 2.07 135 .040 Ho Rejected Male 3.96 Female 4.18

60
Level of Institutional Productivity and Organizational Climate...
Results of the t-test revealed that there was a significant difference in the institutional productivity in instruction of the teachers in CHMSC when the teachers were grouped according to civil status [t=(135)=.3.21, p=..002], and sex [t=(135)=2.07,p=.040)]. The study has sufficient evidence to reject the null hypothesis that states that there is no significant difference in the organizational climate of the institution when the respondents are taken as a whole and grouped according to civil status and sex. This implies that institutional productivity among civil statuses and genders indeed differ.
Table 6 shows the difference in the institutional productivity in instruction when the teachers in CHMSC were grouped according to educational attainment, length of service and academic rank.
Table 6: ANOVA Test Results for the Difference Between Institutional Productivity in Instruction and
Educational Attainment, Length of Service and Academic Rank
The ANOVA Results of the Difference in the Institutional Productivity in Instruction in the CHMSC when the Teachers were grouped as to Selected Variables.
F results revealed that there was no significant difference in the perceived institutional productivity in instruction in CHMSC when the teachers were grouped according to educational attainment. When grouped as to (F=[2, 134]=1.120],p=.9.028), length of service (F=[3,133]=.000,p=.000) and academic rank (F=[2,134]=p=4.252), there was a significant difference. For the two latter classifications, the null hypothesis which states that there is no significant difference in the organizational climate of the institution when the respondents are taken as a whole and grouped according to civil status, sex, educational attainment, length of service and academic rank is thereby rejected. This implies that differences in educational attainment does not really factor into the organizational climate since the staff members are considered to be qualified in their jobs.
Institutional Productivity in Research of the College
The computer- processed Analysis of Variance (ANOVA) and the t- test were used to determine whether there is enough evidence to reject the null hypothesis if the
Category MeanMean
Differencet
valueDf 2 tailed sig.
Statistical Decision
A. Educational Attainment Between Groups .856 2 .428 1.120 .329 Ho Accepted Within Groups 51.190 134 .382 Total 52.046 136B. Length of Service Ho Rejected Between Groups 8.806 3 2.935 9.028 .000 Within Groups 43.240 133 .325 Total 52.046 136C. Academic Rank Ho Rejected Between Groups 3.106 2 1.553 4.252 .016 Within Groups 48.940 134 .365 Total 52.046 136
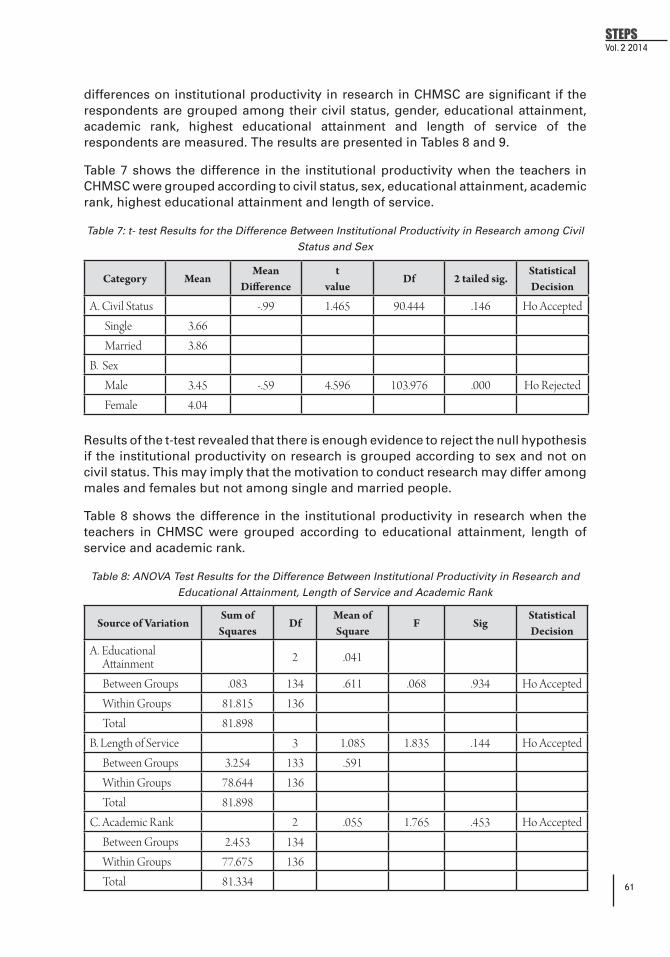
61
STEPSVol. 2 2014
differences on institutional productivity in research in CHMSC are significant if the respondents are grouped among their civil status, gender, educational attainment, academic rank, highest educational attainment and length of service of the respondents are measured. The results are presented in Tables 8 and 9.
Table 7 shows the difference in the institutional productivity when the teachers in CHMSC were grouped according to civil status, sex, educational attainment, academic rank, highest educational attainment and length of service.
Table 7: t- test Results for the Difference Between Institutional Productivity in Research among Civil
Status and Sex
Category MeanMean
Differencet
valueDf 2 tailed sig.
Statistical Decision
A. Civil Status -.99 1.465 90.444 .146 Ho Accepted Single 3.66 Married 3.86B. Sex Male 3.45 -.59 4.596 103.976 .000 Ho Rejected Female 4.04
Results of the t-test revealed that there is enough evidence to reject the null hypothesis if the institutional productivity on research is grouped according to sex and not on civil status. This may imply that the motivation to conduct research may differ among males and females but not among single and married people.
Table 8 shows the difference in the institutional productivity in research when the teachers in CHMSC were grouped according to educational attainment, length of service and academic rank.
Table 8: ANOVA Test Results for the Difference Between Institutional Productivity in Research and
Educational Attainment, Length of Service and Academic Rank
Source of VariationSum of
SquaresDf
Mean of Square
F SigStatistical Decision
A. Educational Attainment 2 .041
Between Groups .083 134 .611 .068 .934 Ho Accepted Within Groups 81.815 136 Total 81.898B. Length of Service 3 1.085 1.835 .144 Ho Accepted Between Groups 3.254 133 .591 Within Groups 78.644 136 Total 81.898C. Academic Rank 2 .055 1.765 .453 Ho Accepted Between Groups 2.453 134 Within Groups 77.675 136 Total 81.334
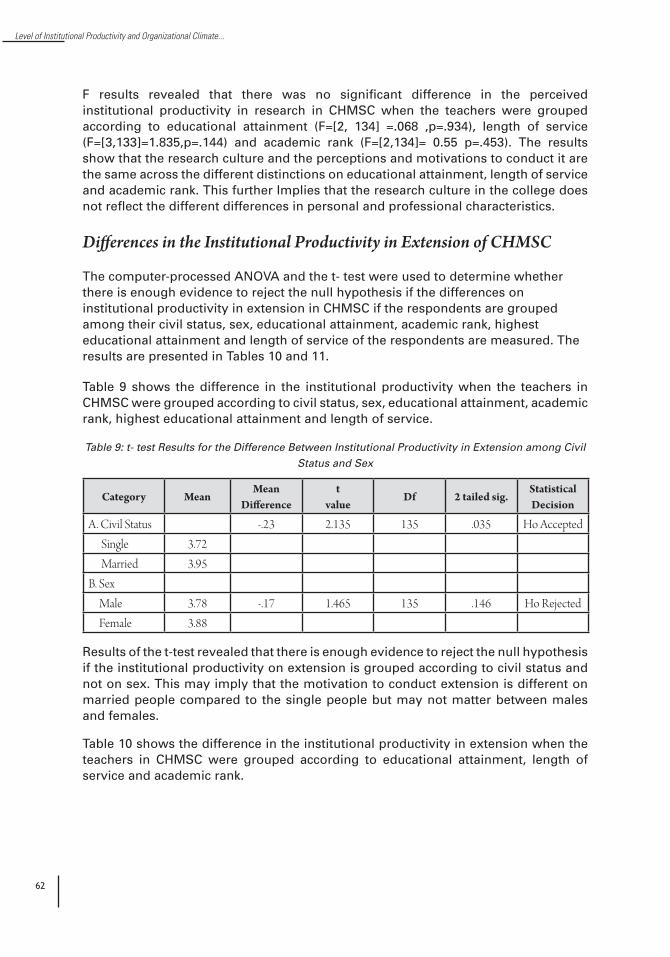
62
Level of Institutional Productivity and Organizational Climate...
F results revealed that there was no significant difference in the perceived institutional productivity in research in CHMSC when the teachers were grouped according to educational attainment (F=[2, 134] =.068 ,p=.934), length of service (F=[3,133]=1.835,p=.144) and academic rank (F=[2,134]= 0.55 p=.453). The results show that the research culture and the perceptions and motivations to conduct it are the same across the different distinctions on educational attainment, length of service and academic rank. This further Implies that the research culture in the college does not reflect the different differences in personal and professional characteristics.
Differences in the Institutional Productivity in Extension of CHMSC
The computer-processed ANOVA and the t- test were used to determine whether there is enough evidence to reject the null hypothesis if the differences on institutional productivity in extension in CHMSC if the respondents are grouped among their civil status, sex, educational attainment, academic rank, highest educational attainment and length of service of the respondents are measured. The results are presented in Tables 10 and 11.
Table 9 shows the difference in the institutional productivity when the teachers in CHMSC were grouped according to civil status, sex, educational attainment, academic rank, highest educational attainment and length of service.
Table 9: t- test Results for the Difference Between Institutional Productivity in Extension among Civil
Status and Sex
Category MeanMean
Differencet
valueDf 2 tailed sig.
Statistical Decision
A. Civil Status -.23 2.135 135 .035 Ho Accepted Single 3.72 Married 3.95B. Sex Male 3.78 -.17 1.465 135 .146 Ho Rejected Female 3.88
Results of the t-test revealed that there is enough evidence to reject the null hypothesis if the institutional productivity on extension is grouped according to civil status and not on sex. This may imply that the motivation to conduct extension is different on married people compared to the single people but may not matter between males and females.
Table 10 shows the difference in the institutional productivity in extension when the teachers in CHMSC were grouped according to educational attainment, length of service and academic rank.

63
STEPSVol. 2 2014
Table 10: ANOVA Test Results for the Difference Between Institutional Productivity in Extension and
Educational Attainment, Length of Service and Academic Rank
F results revealed that there is enough evidence to accept the null hypothesis in the perceived institutional productivity in extension in CHMSC when the teachers were grouped according to educational attainment (F=[2, 134] =.985 ,p=.376), length of service (F=[3,133]=1.153,p=.330) and academic rank (F=[3,133]= 1.213 p=.345).
Institutional Productivity in Production of CHMSC
The computer- processed Analysis of Variance (ANOVA) and the t- test were used to determine whether or not there exist significant differences in the institutional productivity in production CHMSC when grouped according to civil status, sex, educational attainment, academic rank, highest educational attainment and length of service. The results are presented in Tables 11 and 12.
Table 11 shows the t-test results in the institutional productivity when the teachers in CHMSC were grouped according to civil status, sex, educational attainment, academic rank, highest educational attainment and length of service.
Table 11: t- test Results for the Difference Between Institutional Productivity in Production among
Civil Status and Sex
Source of VariationSum of
SquaresDf
Mean of Square
F SigStatistical Decision
A.Educational Attainment Between Groups .816 2 .408 .985 .376 Ho Accepted Within Groups 55.532 134 .414 Total 56.348 136B. Length of Service Between Groups 1.428 3 .476 1.153 .330 Ho Accepted Within Groups 54.920 133 .413 Total 56.348 136C. Academic Rank Between Groups 1.344 3 .409 1.213 .345 Ho Accepted Within Groups 55.545 133 .455 Total 58.676 136
Category Mean Mean Difference t value Df 2 tailed sig.Statistical Decision
A. Civil Status Single 3.55 -.87 1.486 135 .141 Ho Accepted Married 3.74B. Sex 3.56 -.21 1.660 135 .099 Ho Rejected Male 3.77 Female

64
Level of Institutional Productivity and Organizational Climate...
Results of the t-test revealed that there is no enough proof to reject the null hypothesis when the teachers are grouped according to civil status [t=(135)=1.486, p=.141], and sex [t=(135)=1.660,p=.099). This means that sex and civil status differences will not matter in the amount of production (as measured in the income generating activities) brought in the college.
Table 12 shows the difference in the institutional productivity in production when the teachers in CHMSC were grouped according to educational attainment, length of service and academic rank.
Table 12: ANOVA Test Results for the Difference Between Institutional Productivity in Production and
Educational Attainment, Length of Service and Academic Rank
Source of VariationSum of
SquaresDf
Mean of Square
F SigStatistical Decision
A. Educational Attainment Between Groups 1.533 2 .767 1.431 .243 Ho Accepted Within Groups 71.780 134 .536 Total 73.313 136B. Length of Service Between Groups 1.596 3 .532 .987 .401 Ho Accepted Within Groups 71.717 133 .539 Total 73.313 136C. Academic Rank Between Groups .657 2 .328 .606 .547 Ho Accepted Within Groups 72.656 134 .542 Total 73.313 136
Variable Institutional Productivity
Organizational Climate Statistical Decision
Organizational Climate 1 .594*** Significant
F results revealed that there is enough evidence to accept the null hypothesis in the perceived institutional productivity in extension in CHMSC when the teachers were grouped according to educational attainment (F=[2, 134] =1.431 ,p=.243), length of service (F=[3,133]=.987,p=.401) and academic rank (F=[2,134]= .606 p=..547).
The Relationship Between Institutional Productivity and Organizational Climate in Carlos Hilado Memorial State College
The result of the correlational analysis using Pearson r revealed that a significant relationship exists between institutional productivity and organizational climate. The r value is 1 and .594 for organizational climate at .05. thus, organizational climate is a contributing factor for institutional productivity. Table 13 presents the relationship between institutional productivity and organizational climate.
Table 13: Relationship between Institutional Productivity and Organizational Climate
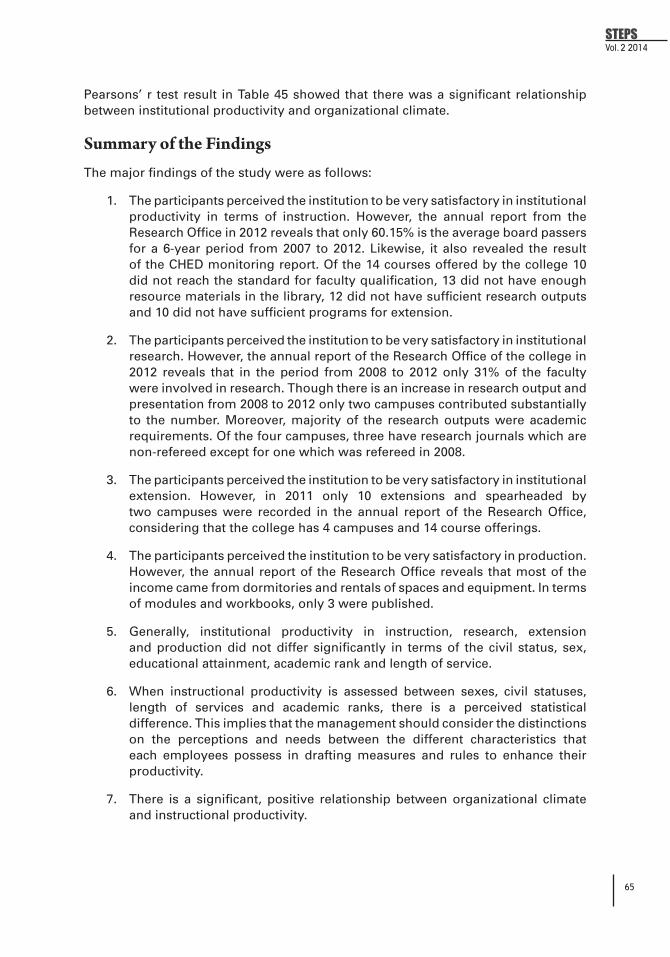
65
STEPSVol. 2 2014
Pearsons’ r test result in Table 45 showed that there was a significant relationship between institutional productivity and organizational climate.
Summary of the FindingsThe major findings of the study were as follows:
1. The participants perceived the institution to be very satisfactory in institutional productivity in terms of instruction. However, the annual report from the Research Office in 2012 reveals that only 60.15% is the average board passers for a 6-year period from 2007 to 2012. Likewise, it also revealed the result of the CHED monitoring report. Of the 14 courses offered by the college 10 did not reach the standard for faculty qualification, 13 did not have enough resource materials in the library, 12 did not have sufficient research outputs and 10 did not have sufficient programs for extension.
2. The participants perceived the institution to be very satisfactory in institutional research. However, the annual report of the Research Office of the college in 2012 reveals that in the period from 2008 to 2012 only 31% of the faculty were involved in research. Though there is an increase in research output and presentation from 2008 to 2012 only two campuses contributed substantially to the number. Moreover, majority of the research outputs were academic requirements. Of the four campuses, three have research journals which are non-refereed except for one which was refereed in 2008.
3. The participants perceived the institution to be very satisfactory in institutional extension. However, in 2011 only 10 extensions and spearheaded by two campuses were recorded in the annual report of the Research Office, considering that the college has 4 campuses and 14 course offerings.
4. The participants perceived the institution to be very satisfactory in production. However, the annual report of the Research Office reveals that most of the income came from dormitories and rentals of spaces and equipment. In terms of modules and workbooks, only 3 were published.
5. Generally, institutional productivity in instruction, research, extension and production did not differ significantly in terms of the civil status, sex, educational attainment, academic rank and length of service.
6. When instructional productivity is assessed between sexes, civil statuses, length of services and academic ranks, there is a perceived statistical difference. This implies that the management should consider the distinctions on the perceptions and needs between the different characteristics that each employees possess in drafting measures and rules to enhance their productivity.
7. There is a significant, positive relationship between organizational climate and instructional productivity.
66
Level of Institutional Productivity and Organizational Climate...
Conclusions
In view of the findings, the following conclusions were drawn:
1. Carlos Hilado Memorial State College’s institutional productivity was only satisfactory. This means that the college has a good rating in these core areas according to participants’ perception, however, the annual report from the research office indicated that there is still room for improvement to achieve an excellent rating.
2. The organizational climate of CHMSC is related to its productivity. CHMSC’s organizational climate is a combination of controlled, autonomous, closed and open climate. This means that some teachers enjoy friendly relations with each other and obtain considerable satisfaction and are sufficiently motivated to overcome difficulties and frustration. Others feel complete freedom that the leader gives to them to provide their own structure- for- interaction so that they can find ways within the group for satisfying their social needs. Others feel they want to achieve at the expense of social – needs satisfaction and others obtain little satisfaction in respect to either task – achievement or social needs.
Recommendations
In view of the findings and conclusions of the study, the following are recommended in order to develop an effective and efficient institutional productivity plan:
On Institutional Productivity
1. In terms of productivity in instruction, CHMSC should be able to strengthen certain foundations for excellence in education. First is to qualify more faculty for every course offered by the college. It is likewise important that the library should be able to upgrade and increase its collections so as to respond to the academic requirements of each course offered by the College. Research and extension should be more visible in the curriculum design of the college. There is also a need to improve the review program of the College for those courses that requires board exams so as to increase the passing percentage of the College.
2. Encourage, if not require, the faculty members to do research in order to increase the percentage of faculty members who are involved in research and to serve as foundation for more productivity and well-studied extension programs. This means more incentive should be provided to those who do research work in terms of financial assistance and professional growth.
3. The extension program of each campus should explore more possibilities for College’s involvement in the community around it. Let the Extensions Office work hand in hand with the Research Office in identifying and recognizing these possibilities.
67
STEPSVol. 2 2014
4. For institutional productivity, there should be a common discernment by the stakeholders on what particular area can the College increase its productivity while not sacrificing its core competence but in fact strengthening it in the process. Each campus should be able to contribute to this. Faculty members should also be encouraged to come up with workbooks and modules not only to contextualize the textbooks but at the same time to contribute as a source of income for the College.
5. The College should be actively involved in accreditation process to benchmark with other state universities and colleges in the country and even beyond and to serve as guide in aiming for excellence in institutional productivity.
On Organizational Climate
1. Since organizational climate correlates with productivity, CHMSC must maintain a conducive organizational climate where teachers would feel comfortable and would consider the institution as a place where they like to be. Organizational thrusts and policies must be well communicated while organizational standards must be flexible enough to give them more room for improvement and considerations.
2. As organizational climate affects institutional productivity, it is interesting to note that there are some who perceive the atmosphere in the institution as closed climate which somehow affects the rating of productivity. Though high in its rating as very satisfactory, productivity can still achieve a higher rating of excellence if closed climate can be lessen all the more if not totally eradicated. An open climate will eventually encourage a more autonomous climate as trust is being built. In this way the demand of the institution especially in our thrust ‘CHMSC Excels” would be a more enjoyable but a decisive journey towards achieving excellent results for every member of the institution.
References
1. Didimus, Fr. N.Y. (2001). “Organizational Climate, Teachers Morale and Teaching Performance in Four Divine Word Schools in East Nusa – Tenggara Province, Indonesia”. Unpublished master’s thesis. De La Salle Univeristy, Manila.
2. Fairweather, James S. (2002). “The Mythologies of Faculty Productivity: Implications for Institutional Policy and Decision Making.” The Journal of Higher Education, Vol. 73, No. 1. Retrieved on May 14, 2014 from http://www.jstor.org/discover/10.2307/1558446.
3. Glomo, D. (2012). “Communication Climate: Its Relation to Institutional Productivity”. Retrieved on February 11, 2013. Available at http://www.academia.edu/2352763/Communication_Climate_Its_Relation_to_ Institutional Productivity.

68
Level of Institutional Productivity and Organizational Climate...
4. Good, C.V. (1973). Dictionary of Education. 3rd ed. McGraw-Hill, Inc.
5. Guthrie, J.W. (1995). Encyclopedia of Education. 2nd ed. Vol. 3. : McMillan Meriam Publishing.
6. Grolier International Encyclopedia. (1996).Connecticut, USA: Grolier Publishing.
7. Hoy, W. K., Miskel, C. G., & Tarter, C. J. (1991). Educational administration: Theory, Research, and Practice.
8. Ilagan, P. (1987). “Organizational Climate of La Salette of Santiago and La Salette of Ramon as Perceived by their Administrators and Teachers During the School Year 1986-1987”. Unpublished doctoral dissertation. De La Salle University, Manila.
9. King, A.F. (2000). “The Changing Face of Accountability: Monitoring and Assessing Institutional Performance in Higher Education.” The Journal of Higher Education, Vol. 71, No. 4. Retrieved on May 12, 2014 from http://www.jstor.org/discover/10.2307/2649146.
10. Kline P.A. (1996). Handbook of Test Construction, Introduction to Psychometric Design. London: Methuen and Company Ltd..
11. Lee, V. E., Dedrick, R. F., & Smith, J. B. (1991). The effect of the social organization of schools on teachers’ efficacy and satisfaction. Sociology of Education. Retrieved on April 26, 2014 from http://www.jstor.org/discover/10.2307/2112851.
12. Lunenburg, F. C. and Ornstein. AC (1991). School management and organization.
13. Ong, M.G. (1997). “Organizational Climate at Paglaum College”. Unpublished master’s thesis. West Negros University, Bacolod City.
14. Parcon, T. (2008). “Organizational Climate of University of San Agustin”. Unpublished master’s thesis. University of San Agustin, Iloilo City.
15. Philippines. Commission on Higher Education. (2003). Towards Rationalizing Philippine Higher Education: Proceedings of the Symposium on the Rationalization of the Philippine Higher Education System: 18-19 September 2003, Manila Hotel, Philippines. Commission on Higher Education.
16. Prasetyo, V.W. (1980). “Leadership Behavior and Organizational Climate in Widya Mandala Catholic University in Surbaya – Indonesia. Unpublished master’s thesis. De La Salle University, Manila.
17. Sergiovanni, T., et al. (2001). Educational Governance and Administration. 5th ed. CA: Wadsworth, Thomson Learning Inc.
18. The Merriam-Webster Concise School and Office Dictionary. (1991). Meriam and Webster Bookstore Inc.: Manila.

69
STEPSVol. 2 2014
19. Toledano, M.S. (2007). “Organizational Climate of Colegio de San Agustin – Bacolod: Its Impact on the Level of Job Satisfaction of the Teaching Personnel for Academic Year 2006-2007”. Unpublished master’s thesis. University of San Agustin, Iloilo City.
20. Victoriano, J. (2007). “Organizational Climate and Faculty Performance: Their Influence of the Instructional Goal Attainment of John B. Lacson Colleges Foundation”. Unpublished doctoral dissertation. University of San Agustin, Iloilo City.

70
Level of Institutional Productivity and Organizational Climate...
71
STEPSVol. 2 2014 Promoting Innovative Behavior
Among Polytechnic Faculty Through Psychological Empowerment
Tengku Ahmad Badrul Shah bin Raja HussinSenior Lecturer [email protected]
Nik Azida binti Abd GhaniHead, Research and Innovation Unit [email protected]
Ungku Omar Polytechnic, Ipoh, Perak, Malaysia
Aziz Zuddin bin OthmanPrincipal Assistant Director, Training & Career Development SectionDepartment of Polytechnic Education, Putrajaya, [email protected]
Abstract
Innovative behavior has been identified as an important behavioral outcome of psychological empowerment. Despite considerable attention accorded on innovation, studies in innovative behavior in polytechnic setting remains an important issue. This study attempts to gain insight on the association of the two variables in the academia from two polytechnics in Malaysia. The sample size of the study comprises 272 lecturers from various technical and commerce departments. This study was also intended to confirm the reliability and validity of the psychological empowerment scale. First- and second-order confirmatory factor analyses backed the existence of the four dimensions of psychological empowerment, meaning, competence, autonomy and impact in the context of Malaysian polytechnic. The fit indices indicate that the models were acceptable. The correlation analysis showed that psychological empowerment had a positive significant relationship with innovative behavior. The results indicated that all the dimensions of the psychological empowerment except meaning had positive relationships with innovative behavior. Regression analysis showed that impact was the most outstanding predictor of innovative behavior of the faculty members. This paper also discusses the practical implications of the findings.
Keywords: psychological empowerment, innovative behavior, first- and second order confirmatory factor analyses.
Introduction
There has been evidence of the rising need for innovative behavior among the academia of polytechnic to compromise with the transformational agenda inspired by the Ministry of Higher Education of Malaysia to become the leader among the technical and vocational educational training (TVET) providers. Innovative behavior, defined as the intentional creation, introduction and application of new ideas helps to improve the performance of the role, group and organization (Janssen,

72
Promoting Innovative Behavior Among Polytechnic Faculty Through...
2000). Innovative behavior leads faculty to create, adopt and develop new teaching approaches and methods to facilitate teaching and learning. Nevertheless, the academia needs to be supported and encouraged to innovate and be given the ability to take control of their own situation to be able to reach the expected stage of innovativeness. The ability of the individual to take control of one’s own situation is termed as psychological empowerment (Spreitzer, 1995a). It has been found that empowered employees ameliorate their performance by finding innovative ways of managing daily chores such as generating innovative proposals in designs and recovering from errors (Fernandez & Moldogaziev, 2012).
Psychological empowerment has been described as the participatory process of enhancing the feeling of self-efficacy among employees through the identification of condition that brings about greater control at the individual level (Midgley & Dowling, 1978). Another view is that psychological empowerment attenuates the state of powerlessness by formal organizational practices and informal techniques of giving self-efficacy information (Conger & Kanungo, 1988). The construct of psychological empowerment centres on the process through which employees are able to bring about positive development in their environment (Wilke & Speer, 2011).
As empowerment has been identified as having significant contribution in predicting innovative behavior (Knol & Van Linge, 2009), it is essential to understand the insight provided by psychological empowerment. Based on the Thomas and Velthouse (1990) and Spreitzer (1995a) conceptualization of psychological empowerment, this study attempts to examine the linkage between psychological empowerment and innovative behavior of faculty members in the TVET higher learning institutions. Thomas and Velthouse (1990) posit that psychological empowerment focuses on the perception of employee on empowerment whereby an employee feels empowered when he/she observes his/her work environment as providing opportunities for individual behavior. In situations where traditional bureaucratic social structures exist, employees would not experience empowerment due to substantial stringency in their workplace (Fernandez & Moldogaziev, 2012). Empowering employees in the workplace involves providing employees with access to information, organizational support, resources and opportunity to learn and develop (Wilke & Speer, 2011).
Literature Review
Conceptualization of Psychological Empowerment
Thomas and Velthouse (1990) conceptualized empowerment in terms of changes in cognitive variables which set the level of motivation of employees. Thomas and Velthouse (1990) and Conger and Kanungo (1988) postulate that psychological empowerment is an internal cognitive state characterized by amplified intrinsic task motivation or enhanced feeling of self-efficacy which comprises four different sub-elements, meaning, competence, autonomy and impact. These sub-elements or dimensions are considered to be the core for psychological empowerment in the workplace.
Meaning is defined as the value of work goal and purpose, in relation to the individual’s own value and standard. Meaning is also defined as the value of work
73
STEPSVol. 2 2014
goal and purpose as perceived by the individual, relative to his own personal mission and expectation (Spreitzer, 1995b). Employee will feel that their works are important when the organizational mission and goal concur with their own value system (Spreitzer, 1995b).
Through the competence dimension, empowered employees feel that they are efficient and able to influence their work and organization meaningfully (Spreitzer, 1995b). Competence refers to the self-efficacy specific to work i.e. ability of an employee to perform his/her job tasks with the required knowledge and skill (Spreitzer, 1995b). Impact refers to the extent that an employee feels that his work can make a difference on the overall goal achievement (Thomas & Velthouse, 1990) and how far an employee believes that he/she can influence the strategic output, management and operation in the workplace (Spreitzer, 1995b). In conclusion, psychological empowerment can be defined as the feeling of being facilitated to carry out tasks in the workplace according to individual’s own value and standard or to influence the work outcome by having autonomy and competence.
Moreover, empowerment is a dynamic phenomenon that is influenced by the context surrounding an individual, therefore, the feeling of empowerment can be encouraged or constrained by the things that happen in the environment (Woodman, Sawyer & Griffith, 1993). Further, empowered employees also seem to improve their performance by working smarter or by exploring more advance methods of carrying out daily routines (Fernandez & Moldogaziev, 2012).
Conceptualization of Innovative Behavior
Being a multidimensional construct, innovative behavior can be defined as the ignition, promotion and realization of new ideas in the intended work role (Janssen, 2000). On the other hand, innovative work behavior as the creation, introduction and application of new ideas intended to improve the performance of the role, group and organization. In other literature, innovative behavior has been characterized as the individual’s openness to new ideas and decision making to adopt an innovation, free from the influence of the experiences of other employees (Elsbach & Kramer, 2003).
In business survival and sustainability, innovation is one of the elements that serves as effective tools (Yu, Yu & Yu, 2013). Innovations which include rethinking and changing underlying principles of work are new and potentially suitable products or processes developed to help reform the status quo (Messmann & Mulder, 2012). Kheng and Mahmood (2013) posit that innovative individuals think distinctively about products, services and processes and go to the extent of learning new ways of doing things. Business companies consider innovation as one of the ways of competitive edge and organizational success (Mohd Hassan, 2010). Lastly, Mumford (2000) argued that individual innovative behavior is affected by an individual, the group, and the organization.
Relation between Empowerment and Innovative Behavior
The significance of innovation in organizations have led to the recognition of successful leadership as a possible method (Abbas, Iqbal, Waheed & Riaz, 2012). Abbas et al. (2012) conducted a survey in the field of education involving employees
74
Promoting Innovative Behavior Among Polytechnic Faculty Through...
in schools, colleges and universities. Their results indicated that leadership was significantly related with four elements of innovative behavior namely promotion, idea generation, work commitment and idea implementation. They suggested that innovative practices by leadership and high ranked academia can foster innovative work behavior among teachers.
Li, Feng, Liu and Cheng (2014) looked from the social-exchange theory which viewed that individuals who feel that their organization has fullfilled their obligations will reciprocate them by displaying behaviors that are beneficial to the organization. One of the essential ways individuals would give back is by demonstrating innovative behavior. Their studies found that psychological contract fulfillment was positively associated with both innovative behavior of the bank supervisors. While another study among nurse educators teaching baccalaureate nursing programs in the United States by Hebenstreit (2012) found that there was a significant and positive correlation between empowerment and innovative behavior. She also concluded that there were significant differences in the degree of perceived innovative behavior were associated with age, academic rank, employment status, and tenure status. Other literature suggests that innovation is positively associated to perfomance in government (Borins, 2001).
As empowerment has been identified having significant contribution in predicting innovative behavior (Knol & Van Linge, 2009), it is essential to understand the insight provided by psychological empowerment. Thomas and Velthouse (1990) posit that psychological empowerment focuses on the perception of employee on empowerment whereby an employee feels empowered when he/she observes his/her work environment as providing opportunities for individual behavior. In situations where traditional bureaucratic social structures exist, employees would not experience empowerment due to substantial stringency in their workplace (Fernandez & Moldogaziev, 2012). Empowering employees in the workplace involves providing employees with access to information, organizational support, resources and opportunity to learn and develop (Wilke & Speer, 2011). The feeling of psychologically empowered can be enhanced by changing the psychological environment or climate (Thomas and Velthouse, 1990). Such conditions contribute to the innovative behavior. Based on the Thomas and Velthouse (1990) and Spreitzer (1995a) conceptualization of psychological empowerment, this study attempts to examine the linkage between psychological empowerment and innovative behavior of faculty members in the TVET higher learning institutions.
Hypotheses
In view of the reviewed literatures provided above, the following are the proposed hypothesis for this paper.
Hypothesis 1: Psychological empowerment dimensions (competence, autonomy, impact and meaning) are positively correlated with innovative behavior.
Hypothesis 2 : There are significant effects of psychological empowerment dimensions (competence, autonomy, impact and meaning) on innovative behavior.
75
STEPSVol. 2 2014
Methodology
This cross-sectional survey study was administrated in two polytechnics in Peninsular Malaysia. A total of 272 lecturers were chosen randomly from various departments to fill in the questionnaires. Data gathered were analyzed using the computer-assisted Statistical Programme for Social Sciences (SPSS) for Windows version 19.0. Statistical analyses conducted include reliability tests, descriptive analysis and correlations. The scores from these subscales were averaged to form the mean score for psychological empowerment and innovative behavior for each respondent. First- and second-order confirmatory factor analyses were also conducted to verify that psychological empowerment comprises four dimensions (meaning, competence, autonomy and impact).
Research Instruments
Measurement items for psychological empowerment were adopted from the Spreitzer’s 12-item psychological empowerment scale. The scale contains items in four components, meaning, competence, autonomy and impact. A seven-point Likert scale ranging from (1) ‘strongly disagree’ to (7) ‘strongly agree’ was used in the instrument. For measuring innovative behavior, Janssen’s nine items innovative behavior scale was administered on the respondents. This scale, which has to be rated on also a seven-point Likert scale, comprises three subscales, ignition, promotion and realization of new ideas. To supplement the accuracy of the instruments used in the study, reliability tests were conducted for each of the four subscales of psychological empowerment as well as the three subscales of innovative behavior.
Results and Analysis
Confirmatory Factor Analysis
First-order confirmatory factor analysis was carried out to examine the appropriateness of the items measuring each construct. Each construct was measured using three-item statements. The four dimensions of psychological empowerment under study were shown in Figure 1. The factor loadings, which depict the correlations between items and constructs, were found to be between 0.64 and 0.93. These values were above the cut-off value of 0.4 as recommended by Nunnally (1978). It was therefore decided that all of the 12 items were retained in the measurement scale.
Next, second-order confirmatory factor analysis was conducted to confirm that psychological empowerment comprises four dimensions. Second-order factor analysis examines the correlations between first-order factors and produces a factor-pattern matrix that denotes the weights given to the first-order factor scores in establishing the second-order factor (Browne & Cudeck, 1993). The results of the second-order confirmatory factor analysis are shown in Figure 2.
The goodness-of-fit indices shown in Figure 2 also indicate that the model was acceptable. Even though the RMSEA value (0.094) was above the value of 0.08

76
Promoting Innovative Behavior Among Polytechnic Faculty Through...
recommended for a reasonable error of approximation, it was still below 0.1, the cut-off value for a model to be employed (Marsh & Hocevar, 1985). The chi-square/df ratio of 3.388 which stood between 2 and 5 indicated that the model was considered as reasonable fit (Bentler & Bonette, 1980). The values of NFI and TLI (0.916 and 0.919 respectively) were close to 1 and above 0.9. These values also indicate a good fit (Carless, 2004).
Figure 1. First-order Confirmatory Factor Analysis

77
STEPSVol. 2 2014
Figure 2. Second-order Confirmatory Factor Analysis
Correlation Analyses
Correlation analyses were carried out to analyze the association between all four dimensions of psychological empowerment and innovative behavior. The correlation values in Table 1 suggest that there is a positive significant relationship between psychological empowerment and innovative behavior (r = 0.321) at 0.01 level. The results also indicate that all of the dimensions of psychological empowerment with the exception of meaning have positive significant relationships with innovative behavior with coefficient values of 0.169 (competence), 0.207 (autonomy) and 0.388 (impact). Meaning, however, shows a positive coefficient (r = 0.081) but no significant relationship with innovative behavior. Despite that, there is a relatively weak

78
Promoting Innovative Behavior Among Polytechnic Faculty Through...
correlation between values except for autonomy and psychological empowerment (0.812) and competence and psychological empowerment (0.721). This suggests that among the factors mentioned, the association between these factors are highly explainable. Based on the significant values, Hypothesis 1 was partially accepted.
Hence, any increase in competence, autonomy and impact may be associated with the increase in innovative behavior. Similarly, any reduction in the three dimensions of psychological empowerment may be associated with the reduction in innovative behavior. Nevertheless, the correlation coefficients do not reveal the causal effect of psychological empowerment on innovative behavior.
PE Meaning Competence Autonomy Impact Innovative Behaviour
PE 1 0.598** 0.721** 0.812** 0.686** 0.321**Meaning 0.598** 1 0.544** 0.284** 0.064 0.081Competence 0.721** 0.544** 1 0.487** 0.193** 0.169**Autonomy 0.812** 0.284** 0.487** 1 0.459** 0.207**Impact 0.686** 0.064 0.193** 0.459** 1 0.388**Innovative Behaviour 0.321** 0.081 0.169** 0.207** 0.388** 1
Correlation is significant at 0.01 level
Table 1: Correlation Analyses
Regression Analysis
Regression analysis was conducted to study the effect of psychological empowerment on innovative behavior. The results of the regression analysis are displayed in Table 2. The regression values denote that only the dimension of impact (0.375) had significant effect on innovative behavior. The rest of the dimensions (meaning, competence and autonomy) did not have significant effect on innovative behavior. These results partially supported Hypothesis 2 which states that there are significant effects of psychological empowerment dimensions (competence, autonomy, impact and meaning) on innovative behavior. Accordingly, the dimension of impact was found to be the most significant predictor of innovative behavior. In other words, management may consider increasing the perception of lecturers on the dimension of impact to enhance innovative behavior among lecturers.
Unstandardized Coefficients Standardized Coefficients
B Std. Error Beta t Sig.
(Constant) 1.879 .584 3.217 .001Meaning .008 .093 .006 .088 .930Competence .154 .112 .101 1.377 .170Autonomy -.017 .078 -.016 -.222 .825Impact .371 .063 .375 5.925 .000
Table 2: Regression Analyses

79
STEPSVol. 2 2014
Conclusion and Recommendations
This study verified the reliability and validity of the psychological empowerment scale by using first- and second-order confirmatory factor analyses. The correlation analysis found that psychological empowerment has significant relationship with innovative behavior while the regression analysis shows that the dimension of impact was the most significant predictor of innovative behavior. Therefore, innovative behavior may be considered as one of the behavioral outcomes of psychological empowerment.
This study confirmed the validity and reliability of the psychological empowerment scale developed by Spreitzer in the work context of polytechnics. This finding was consistent with the empirical study of Carless (2004). Management ought to evaluate the level of psychological empowerment at their institution to get information on the lecturers’ perception about the structure of psychological empowerment. The management should also examine each dimension of psychological empowerment and play active role to increase psychological empowerment by focusing on dimensions that are poorly evaluated by lecturers.
To empower employees in the workplace, employees should be given access to information, organizational support, resources and opportunity to learn and develop (Stewart, McNulty, Griffin & Fitzpatrick, 2010). Lecturers should also be given opportunity to attend courses, seminars and training to increase their knowledge and skills. Discussions and forum can also be organized from time to time to facilitate the sharing of knowledge and brainstorming among lecturers. Open channel of communication such as periodic publication, emails and forums can facilitate the flow of needed information and increase the level of lecturers’ skills and knowledge.
As impact was found to be the most significant predictor of innovative behavior, the management may increase the perceived impact by facilitating employees to feel that their work can affect the overall goal achievement of polytechnic. The management should provide more opportunities to employees to be involved in decision making so that they feel that they are able to influence the strategic output, management and operation in the workplace. Participation in decision making may not only stimulate innovative ideas, but may also facilitate transformational leadership development
(Agin & Gibson, 2010).
A limitation of this study is that it was carried out in only two polytechnics in Peninsular Malaysia. Future researchers should gather more samples from other polytechnics or higher education institutions in order to warrant generalizations made to all polytechnics or higher education institutions in the country. Future studies should also consider antecedents to psychological empowerment or other factors of innovative behavior supported by extensive literature review.
References
1. Abbas, G. , Iqbal J., Waheed, A. & Riaz, M. N. (2012). Relationship between transformational leadership style and innovative work behavior in educational institutions. Journal of Behavioral Sciences, 22(3): 18-32.
2. Agin, E. & Gibson, T. (2010). Developing innovative culture. T + D, 64(7): 52-55.
80
Promoting Innovative Behavior Among Polytechnic Faculty Through...
3. Bentler, P. M. & Bonett, D. G. (1980). Significance tests and goodness of fit in the analysis of covariance structures. Psychological Bulletin, 88: 588-606.
4. Borins, S. (2001). Encouraging innovation in the public sector. Journal of Intellectual Capital 2:310-19.
5. Browne, M. W. & Cudeck, R. (1993). Alternative ways of assessing model fit. In Bollen K. A. & Long J. S. (Eds.). Testing structural equation models. Newbury, California: Sage Publications.
6. Carless, S. A. (2004). Does psychological empowerment mediate the relationship between psychological climate and job satisfaction? Journal of Business and Psychology, 18(4): 405–425.
7. Conger, J. A. & Kanungo, R. N. (1988). The empowerment process: Integrating theory and practice. Academy of Management Review, 13(3): 471-482.
8. Elsbach, K. D. & Kramer, R. M. (2003). Assessing creativity in Hollywood pitch meetings: Evidence for a dual-process model of creativity judgments. Academy of Management Journal, 46: 283-301.
9. Fernandez, S. & Moldogaziev, T. (2012). Using employee empowerment to encourage innovative behavior in the public sector. Journal of Public Administration Research and Theory, 23: 155-167.
10. Hebenstreit, J. J. (2012). Nurse educator perceptions of structural empowerment and innovative behavior. Nursing Education Research, 33(5): 297-301.
11. Janssen, O. (2000). Job demands, perceptions of effort-reward fairness and innovative work behavior. Journal of Occupational and Organizational Psychology, 73: 287–302.
12. Kheng, Y. K. & Mahmood, R. (2013). The relationship between pro-innovation organizational climate, leader-member exchange and innovative work behavior: A study among the knowledge workers of the knowledge intensive business services in malaysia. Business Management Dynamics, 2(8): 15-30.
13. Knol, J. & Van Linge, R. (2009). Innovative behavior: the effect of structural and psychological empowerment on nurses. Journal of Advanced Nursing, 65(2): 359-370.
14. Li, H., Feng, Z., Liu C. & Cheng, D. (204). The impact of relative leader-member exchange on employees’ work behaviors as mediated by psychological contract fulfillment. Social Behavior and Personality, 42(1):79-88
15. Marsh, H. W. & Hocevar, D. (1985). Application of confirmatory factor analysis to the study of self-concept: First- and higher-order factor models and their invariance across groups. Psychological Bulletin, 97:562-582.
81
STEPSVol. 2 2014
16. Messmann, G., & Mulder, R. H. (2012). Development of a measurement instrument for innovative work behavior as a dynamic and context-bound construct. Human Resource Development International. 15 (1): 43–59.
17. Midgley, D. F. & Dowling, G. R. (1978), Innovativeness: The concept and its measurement. Journal of Consumer Research, 4(1): 229-242.
18. Mohd. Hassan Jafri (2010). Organizational commitment and employee’s innovative behavior. A study in retail sector. Journal of Management Research. 10 (1): 62-68.
19. Mumford, M. D. (2000). Managing creative people: Strategies and tactics for innovation. Human Resource Management Review, 10: 313-3512.
20. Nunnally, J. C. (1978). Psychometric theory. New York: McGraw Hill.
21. Spreitzer, G. M. (1992). When organizations dare: The dynamics of psychological empowerment in the workplace. UMI Microform Number 3011067. Ann Arbor: Bell & Howell Information and Learning Company.
22. Spreitzer, G. M. (1995a). An empirical test of a comprehensive model of intrapersonal empowerment in the workplace. American Journal of Community Psychology, 23 (5): 601-629.
23. Spreitzer, G. M. (1995b). Psychological empowerment in the workplace: Dimension, measurement, and validation. Academy of Management Journal, 38(5): 1442-1465.
24. Stewart, J. G., McNulty, S. R., Griffin, M. T. Q. & Fitzpatrick, J. J. (2010). Psychological empowerment and structural empowerment among nurse practitioners. Journal of the American Academy of Nurse Practitioners, 22(1): 27-34.
25. Thomas, K. W. & Velthouse, B. A. (1990). Cognitive elements of empowerment: An “interpretive” model of intrinsic task motivation. The Academy of Management Review, 15(4): 666-681.
26. Wilke A. L. & Speer P. W. (2011). The mediating influence of organizational characteristics in the relationship between organizational type and relational power: an extension of psychological empowerment research. Journal of Community Psychology, 39(8): 972–986.
27. Woodman, R. W. Sawyer, J. E. & Griffin, R. W. (1993). Toward a theory of organizational creativity. Academy of Management Review, 18: 293-321.
28. Yu, C. & Yu, T. & Yu, C. (2013). Knowledge sharing, organizational climate and nnovative behavior: A cross-level analysis of effects. Social behavior and Personality, 41(1): 143-156.

82
Scholarly Technical Education Publication Series
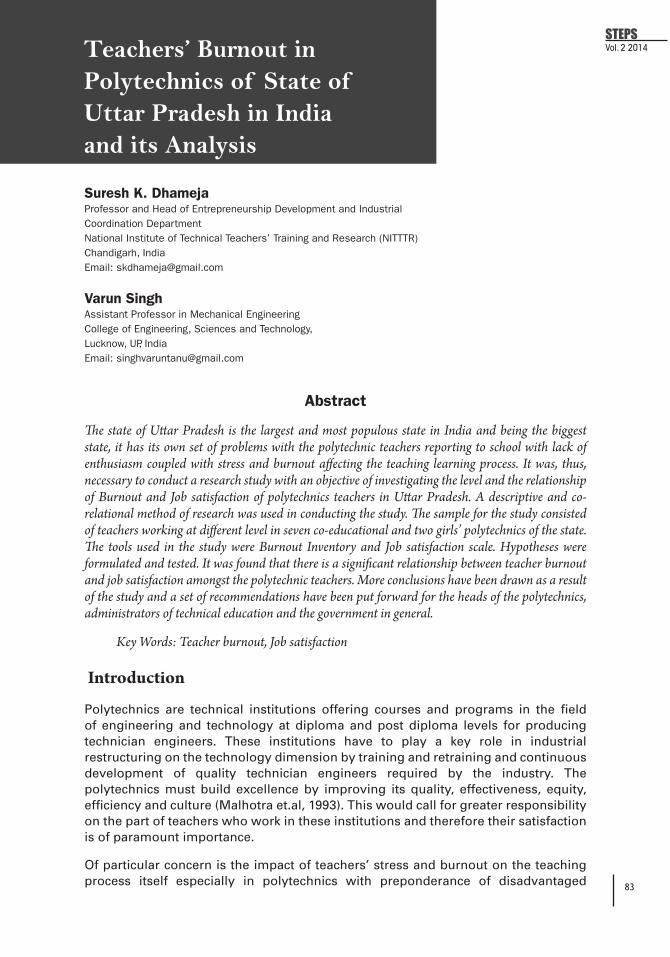
83
STEPSVol. 2 2014 Teachers’ Burnout in
Polytechnics of State of Uttar Pradesh in India and its Analysis
Suresh K. DhamejaProfessor and Head of Entrepreneurship Development and Industrial Coordination DepartmentNational Institute of Technical Teachers’ Training and Research (NITTTR)Chandigarh, IndiaEmail: [email protected]
Varun SinghAssistant Professor in Mechanical EngineeringCollege of Engineering, Sciences and Technology,Lucknow, UP, IndiaEmail: [email protected]
Abstract
The state of Uttar Pradesh is the largest and most populous state in India and being the biggest state, it has its own set of problems with the polytechnic teachers reporting to school with lack of enthusiasm coupled with stress and burnout affecting the teaching learning process. It was, thus, necessary to conduct a research study with an objective of investigating the level and the relationship of Burnout and Job satisfaction of polytechnics teachers in Uttar Pradesh. A descriptive and co-relational method of research was used in conducting the study. The sample for the study consisted of teachers working at different level in seven co-educational and two girls’ polytechnics of the state. The tools used in the study were Burnout Inventory and Job satisfaction scale. Hypotheses were formulated and tested. It was found that there is a significant relationship between teacher burnout and job satisfaction amongst the polytechnic teachers. More conclusions have been drawn as a result of the study and a set of recommendations have been put forward for the heads of the polytechnics, administrators of technical education and the government in general.
Key Words: Teacher burnout, Job satisfaction
Introduction
Polytechnics are technical institutions offering courses and programs in the field of engineering and technology at diploma and post diploma levels for producing technician engineers. These institutions have to play a key role in industrial restructuring on the technology dimension by training and retraining and continuous development of quality technician engineers required by the industry. The polytechnics must build excellence by improving its quality, effectiveness, equity, efficiency and culture (Malhotra et.al, 1993). This would call for greater responsibility on the part of teachers who work in these institutions and therefore their satisfaction is of paramount importance.
Of particular concern is the impact of teachers’ stress and burnout on the teaching process itself especially in polytechnics with preponderance of disadvantaged

84
Teachers’ Burnout in Polytechnics of State of Uttar Pradesh in India and its Analysis
students who can ill-afford deterioration in teacher's motivation and commitment. The consequences of teacher burnout extend beyond dissatisfaction or tension, as burnout appears to be a main factor in teachers’ decision to leave the profession in many countries. Thus, measuring the levels of burnout in the educational context is necessary in case we wish to employ preventive and restorative strategies to tackle the phenomenon early. It is in this context that such a study for the polytechnic teachers in the largest state of India, namely Uttar Pradesh was conceived and conducted.
Objectives of the Study
• To investigate the level of Burnout and Job satisfaction of teachers inpolytechnics of Uttar Pradesh
• ToinvestigatetherelationshipofBurnoutwithJobsatisfactionofteachersinpolytechnics of Uttar Pradesh
• Toinvestigatetherelationshipofageandexperiencewithburnoutofteachersin polytechnics of Uttar Pradesh
• Toinvestigatethedifferenceinburnoutofmaleandfemaleteachers
• Toinvestigatethedifferenceinburnoutofteachersteachingengineeringandnon-engineering subjects
Hypotheses
Five hypotheses were formulated for the study:
1. There is no significant relationship between teacher burnout and job satisfaction in Polytechnics of Uttar Pradesh.
2. There is no significant relation between age and burnout; and between experience and burnout among teachers in the polytechnics of Uttar Pradesh.
3. There is no significant relationship between job satisfaction and age; and job satisfaction and experience of teachers working in the polytechnics of Uttar Pradesh.
4. There is no significant difference between burnout of male and female teachers of Polytechnics of Uttar Pradesh.
5. More of the non-engineering teachers in the polytechnics of Uttar Pradesh are burnout than engineering teachers.
Methods and Procedure
Research Design
Since the study was concerned with determining relationships of burnout with job satisfaction, age, gender, experience and discipline of teaching; a descriptive and co-relational method of research was used in conducting the study.

85
STEPSVol. 2 2014
Sample
The sample of the study consisted of gazetted teaching staff, working at the level of lecturers, Senior Lecturers, HODs and Principals working in the 7 co-educational and 2 girls polytechnics of Uttar Pradesh. A sample of 160 teachers, both male and female, was selected based on convenience sampling out of about 236 teachers working in these 9 polytechnics of Uttar Pradesh.
The teachers constituting the sample possess M.E., B.E., B.Sc. (Tech.) or equivalent, Diploma Technical Teaching (TTTI) or M.A./M.Sc./M.Com. qualifications. The sample included teachers in the age up to 30 years, (58 No.); more than 30 to 45 years (58 No.); and above 45 years (44 No.); male teachers (132 No.); and female teachers (28 No.); 1 to 5 years of experience (52 No.); more than 5 to 15 years of experience (59) and above 15 years of experience (49 No.); engineering discipline teachers (128 No.); and non-engineering discipline teachers (32 No.).
Table 1 shows the breakup of the sample taken for the study:
Table 1: Break-up of Sample
Sr. No. Name of Polytechnic in Uttar Pradesh state
No. of Teachers in position in Polytechnic
No. of Teachers taken for Study
1 G.B. Polytechnic, Lucknow 35 21
2 Hewett Polytechnic. Lucknow 5 33 Jawaharlal Nehru Polytechnic ,Kanpur 15 94 Lucknow Polytechnic Lucknow 20 145 Sanjay Gandhi Polytechnic, Jagdishpur 20 166 Sri Ram Devi Ramdayal Tripathi Mahila
Polytechnic, Govind Nagar, Kanpur (West)40 31
7 United Institute of Designing, Kanpur 31 238 Prasad polytechnic, Lucknow 35 239 Government Girls polytechnic, Lucknow 35 20
TOTAL 236 160
Tools Used
The following tools were used for the study:
• Burnout Inventory (1986),developedandstandardizedbyMenonandDutt(1996) on the lines of Meshach Burnout Inventory, was used to measure teacher’s burnout
• Jobsatisfactionscale,developedbyChandel(1978)wasusedtomeasurejobsatisfaction of teachers.
• Aninformationschedulewaspreparedtogatherthedatarelatedtoage,sex,experience, qualifications, marital status, designation, discipline of teaching etc.
86
Teachers’ Burnout in Polytechnics of State of Uttar Pradesh in India and its Analysis
Description of Tools
(I) Burnout Inventory by Menon and Dutt (1996):
Burnout Inventory by Menon and Dutt (1996), prepared on the lines of Meshach Burnout Inventory (MBI 1986), was used to measure teacher burnout. This questionnaire consisted of 40 statements (out of which 28 statements are worded in positive direction and 12 statements are worded in negative direction). The total score is the summation of all the positive and negative items score. The minimum score obtained can be zero and maximum 240 and other scores ranging in between. In data processing all items shall be scored so that a high score on the burnout scale would indicate a higher level of self reported burnout. Reliability obtained for the whole burnout scale by test- retest method was 0.82.
(II) Teacher’s Job Satisfaction Scale by Chandel (1978):
Teachers’ job satisfaction scale by Chandel was developed in the Indian situation for people engaged in different jobs. The scale was planned for self administering individual or group test. It was constructed keeping in view three aspects (1) Personal (2) Job related (3) Social.
The scale consisted of 24 items covering the vast areas of job satisfaction or dissatisfaction. The reliability of the test as a whole had been reported as +0.942 which was based on the test-retest method. This value of reliability must be treated as fairly high. Item wise test-retest correlations were found to be between +0.621 and +0.950. All the values of the co-efficient of correlation were significant at 0.01 level of significance. It was found that the scale had good face validity and content validity. In cross validity it was found that relationship between the two groups (from two populations) had +0.69 which means that the relationship between the results or the two situations was positive and high.
(III) Information schedule:
An information schedule was designed to elicit the requisite information i.e. name, sex, age, marital status, present designation, details of promotion, educational qualifications, total years of teaching experience, number of years of industrial experience, if any, and, address.
Statistical Analysis of Data:
Descriptive Statistics:
Mean (M), median (Md), mode (Mo) and standard deviation (SD) were computed to study the general nature of data with respect to Burn-out score and Job-Satisfaction score. Skew- ness (SK) and Kurtosis (Ku) were also worked out to see the trend of departure of the sample distribution from the normal probability curve.
Inferential Statistics
Co-efficient of correlation (r) and t-test were also computed to test the hypotheses.
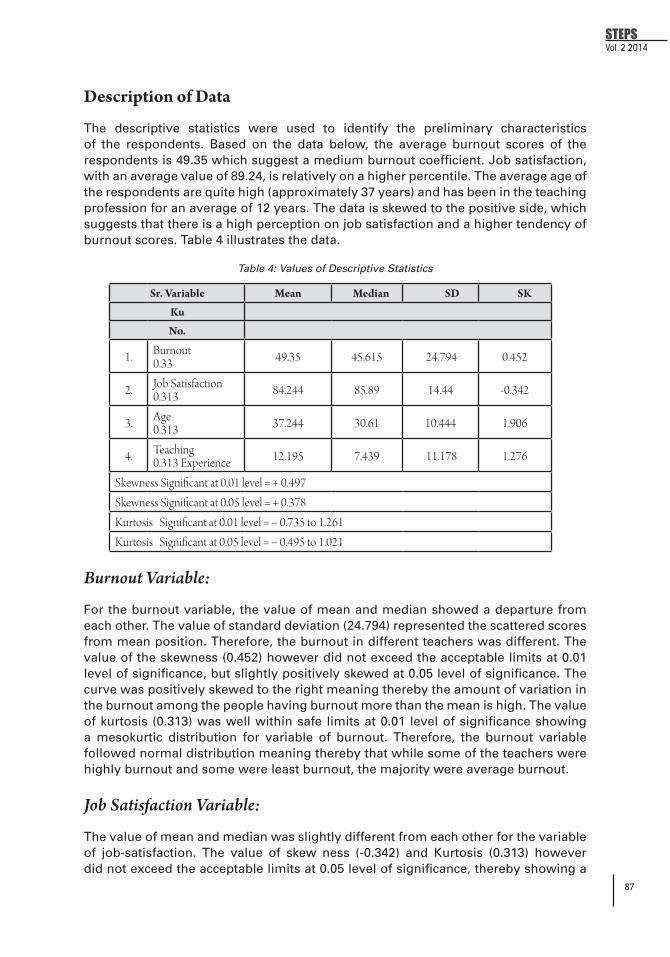
87
STEPSVol. 2 2014
Description of Data
The descriptive statistics were used to identify the preliminary characteristics of the respondents. Based on the data below, the average burnout scores of the respondents is 49.35 which suggest a medium burnout coefficient. Job satisfaction, with an average value of 89.24, is relatively on a higher percentile. The average age of the respondents are quite high (approximately 37 years) and has been in the teaching profession for an average of 12 years. The data is skewed to the positive side, which suggests that there is a high perception on job satisfaction and a higher tendency of burnout scores. Table 4 illustrates the data.
Table 4: Values of Descriptive Statistics
Sr. Variable Mean Median SD SK
Ku
No.
1. Burnout0.33 49.35 45.615 24.794 0.452
2. Job Satisfaction0.313 84.244 85.89 14.44 -0.342
3. Age 0.313 37.244 30.61 10.444 1.906
4. Teaching0.313 Experience 12.195 7.439 11.178 1.276
Skewness Significant at 0.01 level = + 0.497Skewness Significant at 0.05 level = + 0.378Kurtosis Significant at 0.01 level = − 0.735 to 1.261Kurtosis Significant at 0.05 level = − 0.495 to 1.021
Burnout Variable:
For the burnout variable, the value of mean and median showed a departure from each other. The value of standard deviation (24.794) represented the scattered scores from mean position. Therefore, the burnout in different teachers was different. The value of the skewness (0.452) however did not exceed the acceptable limits at 0.01 level of significance, but slightly positively skewed at 0.05 level of significance. The curve was positively skewed to the right meaning thereby the amount of variation in the burnout among the people having burnout more than the mean is high. The value of kurtosis (0.313) was well within safe limits at 0.01 level of significance showing a mesokurtic distribution for variable of burnout. Therefore, the burnout variable followed normal distribution meaning thereby that while some of the teachers were highly burnout and some were least burnout, the majority were average burnout.
Job Satisfaction Variable:
The value of mean and median was slightly different from each other for the variable of job-satisfaction. The value of skew ness (-0.342) and Kurtosis (0.313) however did not exceed the acceptable limits at 0.05 level of significance, thereby showing a

88
Teachers’ Burnout in Polytechnics of State of Uttar Pradesh in India and its Analysis
mesokurtic distribution for this variable. Thus, the job satisfaction variable followed normal distribution curve, meaning thereby that some of the teachers were highly satisfied, some were least satisfied but the majority had average job satisfaction.
Age Variable:
The value of mean and median was different from each other for the variable of age. The values of skewness (1.906) is significant at 0.01 level of significance, thereby showing skewed and mesokurtic (ku = 0.313) distribution for this variable. The amount of variation in age among the teachers having age more than the mean was high.
Teaching Experience:
The value of mean and median was different from each other for the variable of teaching experience. Value of skewness (1.276) is however, significant at 0.01 level of significance, thereby showing a skewed and mesokurtic (0.313) distribution for this variable.
To conclude, the value of mean, median, standard deviation, skewness and kurtosis for the various variables did not show large variations and there was not much departure from normality. Thus, the data can be considered appropriate for computing further statistical analysis.
Analysis of Data and Discussion of Results
Here the product moment correlation computed between variables of burnout and job satisfaction; burnout and age; burnout and teaching experience; job satisfaction and age; job satisfaction and teaching experience; and age and teaching experience have been presented and statistically significant results have been discussed. The values of ‘t’ have been computed to determine the significant difference in burnout among different age groups and different teaching experience. The values of product moment correlations are given in Table 5
Table 5: Product Moment Correlations
* Significant at 0.01 level of significance, df = 158
** Significant at 0.05 level of significance, df = 158
Variables ‘r’
Burnout and job satisfaction − 0.532 *Burnout and age − 0.085Burnout and teaching experience − 0. 094Job satisfaction and age 0. 158 **Job satisfaction and teaching experience 0. 158 **
89
STEPSVol. 2 2014
Interpretation and Discussion of Results of Correlations:
Burnout and Job Satisfaction:
The co-efficient of correlation between burnout and job satisfaction was found to be negatively significant (-0.532) at 0.01 level: thus; burnout has negative and significant relationship with job satisfaction. Hence, the hypothesis that there is no significant relationship between burnout and job satisfaction stands rejected. The studies conducted by David (1990) and Sadek (1991) also support the above finding. The teachers who have no difficulty in adjusting to the work environment feel satisfied and are less burnout. As the job satisfaction declines; burnout increases.
Ogresta et al. (2008) in their study also examined the correlation between burnout and job satisfaction dimensions and found that burnout syndrome dimensions were significantly correlated with the work climate satisfaction. While emotional exhaustion and depersonalization were moderately correlated with work climate satisfaction, personal accomplishment and work climate satisfaction were correlated to a low but significant degree.
Burnout and Age:
The value of correlation (-0.085) shows a negative but insignificant relationship between burnout and age. This means the extent of burnout is same irrespective of differences in age. Hence; the hypothesis that there is no significant relationship between burnout and age stands retained. The results are in line with the findings of a study by Randall (2007) who in his study involving a sample of 340 Anglican clergy in England and Wales concluded that the age is negatively correlated with the emotional exhaustion and depersonalization subscales of burnout.
Burnout and Teaching Experience:
The value of correlation (-0.094) shows a negative but insignificant relationship between burnout and teaching experience. This means the extent of burnout remains the same irrespective of differences in teaching experience. Hence, the hypothesis that, there is no significant relationship between teaching and burnout stands accepted. The findings are similar to a study by Bayani et.al. (2013) who found no difference in burnout between teachers with less teaching experience and teacher with more teaching experience.
Job Satisfaction and Age:
The value of correlation (0.158) shows a positive and significant relationship between job satisfaction and age at 0.05 level. This means that age has positive and significant relationship with job satisfaction therefore; the hypothesis that there is no relationship between job satisfaction and age stands rejected.
This finding is supported by the findings of David (1990) and Sadek (1991). A major reason for high job satisfaction of older teachers is their adjustment to the work environment and feeling of satisfaction; whereas the younger teachers find difficulty in adjusting to the work environment.
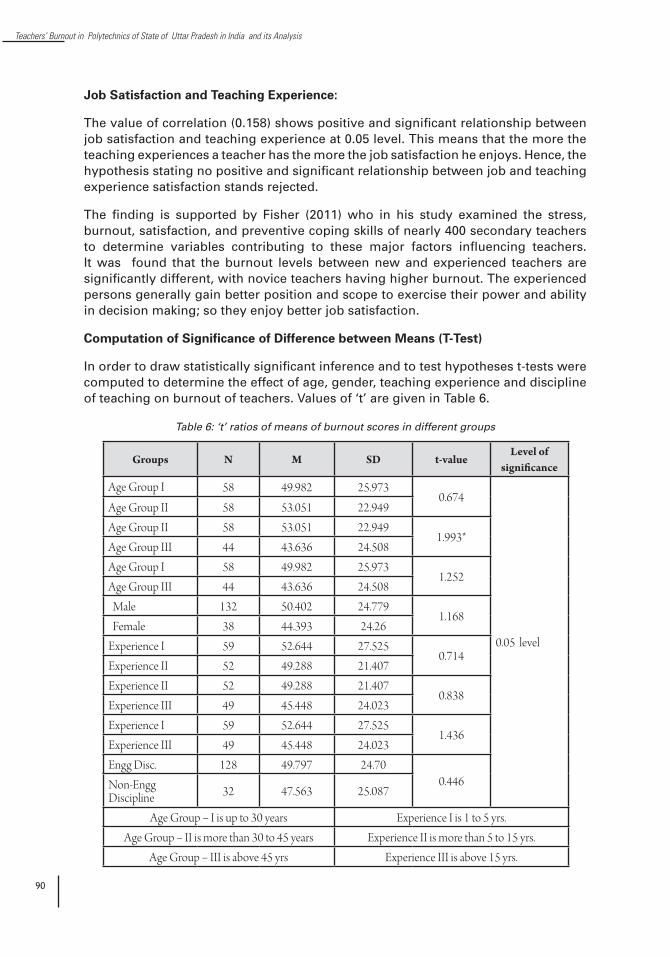
90
Teachers’ Burnout in Polytechnics of State of Uttar Pradesh in India and its Analysis
Job Satisfaction and Teaching Experience:
The value of correlation (0.158) shows positive and significant relationship between job satisfaction and teaching experience at 0.05 level. This means that the more the teaching experiences a teacher has the more the job satisfaction he enjoys. Hence, the hypothesis stating no positive and significant relationship between job and teaching experience satisfaction stands rejected.
The finding is supported by Fisher (2011) who in his study examined the stress, burnout, satisfaction, and preventive coping skills of nearly 400 secondary teachers to determine variables contributing to these major factors influencing teachers. It was found that the burnout levels between new and experienced teachers are significantly different, with novice teachers having higher burnout. The experienced persons generally gain better position and scope to exercise their power and ability in decision making; so they enjoy better job satisfaction.
Computation of Significance of Difference between Means (T-Test)
In order to draw statistically significant inference and to test hypotheses t-tests were computed to determine the effect of age, gender, teaching experience and discipline of teaching on burnout of teachers. Values of ‘t’ are given in Table 6.
Table 6: ‘t’ ratios of means of burnout scores in different groups
Groups N M SD t-valueLevel of
significance
Age Group I 58 49.982 25.9730.674
0.05 level
Age Group II 58 53.051 22.949Age Group II 58 53.051 22.949
1.993*Age Group III 44 43.636 24.508Age Group I 58 49.982 25.973
1.252Age Group III 44 43.636 24.508 Male 132 50.402 24.779
1.168 Female 38 44.393 24.26Experience I 59 52.644 27.525
0.714Experience II 52 49.288 21.407Experience II 52 49.288 21.407
0.838Experience III 49 45.448 24.023Experience I 59 52.644 27.525
1.436Experience III 49 45.448 24.023Engg Disc. 128 49.797 24.70
0.446Non-Engg Discipline 32 47.563 25.087
Age Group − I is up to 30 years Experience I is 1 to 5 yrs.Age Group − II is more than 30 to 45 years Experience II is more than 5 to 15 yrs.
Age Group − III is above 45 yrs Experience III is above 15 yrs.

91
STEPSVol. 2 2014
Interpretation and Discussion of Results:
The T−ratio for burnout of age group II and III was found to be significant (1.993) at 0.05 level of significance. This means teachers in age group II (i.e. 31 to 45 years of age) were more burnout than those in the age group III (above 45 yrs). The finding is supported by findings of Sadek (1991) which states that there is indeed a higher tendency for the younger faculty to experience burnout than those in the profession for many years. To keep the burnout level low of the teachers in age group II (31 to 45 yrs), government/administrators should initiate necessary steps, so that the teachers should not have any stress in adjusting to the work environment and feel satisfied. Steps may be giving promotion and other benefits in time; ensuring good work environment etc.
The t-ratio for burnout of male and female teachers was found to be insignificant (1.168) indicating that both male and female teachers are equally burnout while the t-ratio for burnout of teachers with different experiences were found to be insignificant (0.714, 0.838 and 1.436) indicating that the teachers with different experiences are also experiencing equal levels of burnout. Meanwhile, the t-ratio for burnout of engineering discipline and non-engineering discipline was found to be insignificant (0.446). Here, the teachers teaching both engineering and non-engineering disciplines are also experiencing the same levels of burnout, as both are working in the same environment.
Conclusion
On the basis of findings of the study, it can be concluded that:
• Thereisasignificantrelationshipbetweenteacherburnoutandjobsatisfactionin polytechnics of Uttar Pradesh.
• A significant and positive relationship was found between job satisfactionand age. Similar correlations were also observed between job satisfaction and experience, and between age and experience.
• The significance of difference in experiences in burnout of teachers withdifferent teaching experiences was found to be insignificant.
• Itwasfoundthatthereisnosignificantdifferenceinburnoutbetweenburnoutof male and female teacher of polytechnics of Uttar Pradesh.
• The significance of difference between means of burnout of engineeringteachers and non engineering teachers was found to be insignificant. Here also both are equally burnout, as both are working in same work environment.
Recommendations
• Since the younger teachers tend to be more dissatisfied than their olderpeers. There is a need to increase job satisfaction of younger and newly appointed teachers by making the teaching profession more attractive and lucrative. Proper facilities and guidance should be provided to encourage these teachers to stay on their jobs for a long time. They should also be
92
Teachers’ Burnout in Polytechnics of State of Uttar Pradesh in India and its Analysis
assured of timely promotional opportunities and greater degree of freedom in decision making.
• Lack of leadership qualities amongst the top management often results injob dissatisfaction and consequently burnout amongst the teachers for want of clear direction. It is in this context that it is recommended that the administrators of technical education should provide management training programs to the principals to develop in them the qualities of leadership.
• Administrators of technical education institutions should also haveperiodic psychological examinations during the service period of teachers. The Government should set up guidance and counseling centers in the polytechnics to deal with emotional problems of the teachers.
• The Principal, as head of the institution, should initiate action to lead theteachers towards achievement of educational goals. He/She must infuse trust among the teachers and develop a warm and friendly relationship with them, which can lead to high job satisfaction among teachers. Principals should take steps to eliminate or reduce factors that result in teacher’s disengagement. This view is also supported by a study conducted by Raj, Tilak and Lalita (2013) who found that the level of satisfaction between both the government and private school teachers is low regarding “opinion counts in the organization”. The authors of the study recommend that, “authorities should arrange regular formal meetings with teachers to consider their suggestions and also try to value it”.
• In increasing job satisfaction and reducing ‘burnout’, the principal shouldencourage and promote social activities among teachers. The institutions can have social clubs with facilities for indoor and outdoor games for teachers and their families. A free, fair and open climate in the institute can certainly result in higher educational achievements and higher job satisfaction and low burnout among teachers.
• Appreciationandrecognitionofteachers’achievementsshouldbeensured.State awards should be instituted for teachers whose students excel in their respective subjects in the state council examinations.
• Thegovernmentshouldprovidestaffdevelopment incentives for teachers.Scholarships should be given and teachers must be motivated to enhance their education by giving study leaves and/or paid study leaves where necessary. Teachers, who improve their educational qualification, should be recognized through award of increments or promotion.
• Education administrators (i.e. Director, Secretary and Commissioner) mustvisit the polytechnics on regular basis to make personal contact with the teachers to encourage them and to alleviate their genuine grievances.

93
STEPSVol. 2 2014
References
1. Bayani Ali Asghar, Hossein Bagheri, Ali Bayani (2013), Influence of Gender, Age, and Years of teaching experience on Burnout, Scholars Research Library; ISSN 0976-1233, Annals of Biological Research, 4 (4):239-243
2. Chukwuemeka, S.M. (1990), ‘An Examination of Teacher Stress and Burnout concerning Teachers’ Opinion towards Teaching as a Profession’, Dissertation Abstract Int. Vol .51, No.6 , pp.1865
3. David, C.S. (1990), ‘An Analysis of Stress, Burnout and Job Satisfaction among Respiratory Care Practitioners in Georgia’, Dissertation Abstract Vol .51, No.3, pp.831
4. Farber, B.A. (1991), ‘Crisis in Education: Stress and Burnout in the American Teacher’, Jossey–bass Social and Behavioral Science Series, San Francisco
5. Fisher, M. H. (2011). Factors Influencing Stress, Burnout, and Retention of Secondary Teachers: Current Issues in Education, 14(1). Retrieved from http://cie.asu.edu/
6. Malhotra, M.M., Subramanian, R., Krishnamurthy, S and Dhir, BM. (1993), ‘Towards Excellence in Polytechnic Education – Perspectives for the Year 2000 and Beyond’, TTTI Chandigarh
7. Maslach, C. & Jackson, S.E. (1986). Maslach Burnout Inventory: Second Edition. Palo Alto, CA: Consulting Psychologists Press
8. Maslach, C. (2011). Burnout and engagement in the workplace: New perspectives. European Health Psychologist, 13 (3), 44-47
9. Mulkins, M.T. (1991), ‘An Assessment of Academic Stress and Burnout’, Dissertation Abstract Int (A), Vol. 51 No.8, pp. 2651
10. Ogresta Jelena, Silvia Rusac, Lea Zorec ( 2008), Relation Between Burnout Syndrome and Job Satisfaction Among Mental Health Workers, Journal of Public Health, Croat Med J. 2008; 49:364-74
11. Raj, Tilak; and Lalita (2013), Job Satisfaction among Teachers of Private and Government Schools: A Comparative Analysis, International Journal of Social Science & Interdisciplinary Research, ISSN 2277 3630 IJSSIR, Vol. 2 (9)
12. Randall, Kelvin J. (2007), Examining the relationship between burnout and age among Anglican clergy in England and Wales, Journal on Mental Health, Religion & Culture, Volume 10, Issue 1, pages 39-46
13. Sadek S.A. (1991), ‘Stress Job Satisfaction and Burnout of Waivered/Bilingual and English only Teachers’, Dissertation Abstract Vol. 52 No.3, pp.745

94
Scholarly Technical Education Publication Series
95
STEPSVol. 2 2014 Factors Influencing the
Implementation of Student-
Centered Learning in Malaysian
TVET Institutions
Nik Azida binti Abd GhaniHead, Research and Innovation [email protected]
Tengku Ahmad Badrul Shah bin Raja HussinAssoc. [email protected]
Politeknik Ungku Omar, Malaysia
Nor Asiah binti Ab GhaniDepartment of Commerce Politeknik Kota Bharu, [email protected]
Tengku MA Department of Community MedicineUniversiti Sains Malaysia, [email protected]
Siti Rohani binti Hj. AliDepartment of CommercePoliteknik Tuanku Sultanah Bahiyah, [email protected]
Abstract
The quality of technical and vocational education and training (TVET) provider and the program it offers is assessed by the learning outcomes or ability of students to carry out their expected roles and responsibility in society. Outcome-based education, that emphasizes the use of the student-centered learning (SCL) has been implemented in Malaysian Polytechnics since 2010, particularly in responding to the requirements of the Malaysian Qualifications Framework (MQF) and the need to produce graduates with knowledge, skills and attitude that meet the changing industry needs. This study was conducted mainly to determine the problems faced by faculty members in implementing SCL and identify the levels of SCL implementation, perceived students’ readiness towards SCL and administrative support. The instrument used was adapted and modified from a readiness assessment tool proposed by Mercado (2008). A total of 609 faculty members from 6 Malaysian Polytechnics have participated in the online survey. The findings revealed that SCL implementation was rated at high level while perceived students’ readiness towards SCL and administrative support were rated at moderate level. Problems faced in implementing SCL can be categorized into 3 factors, namely, constraints, competencies of faculty members and environmental conditions. The recommendations encourage polytechnics to explore and practice a more student-oriented teaching strategy and techniques of SCL particularly in large classes. Collaborative efforts among faculty members should
96
Factors Influencing the Implementation of Student- Centered Learning...
be encouraged to reduce duplication and enable more effective sharing of knowledge and skills between seniors and apprentices. SCL can also be considered as an effective approach to encourage deep learning and student learning engagement.
Keywords: Technical and Vocational Education and Training, Student-Centered Learning, Outcome-based Education, Malaysian Polytechnics
Introduction
The quality of TVET providers and the programs they offer is often assessed by the learning outcomes or ability of students to carry out their expected roles and responsibilities in the workplace. One of the reasons for poor employment outcome is the weak link between vocational education and labor market (Martinez-Fernandez & Choi, 2013, p. 165). In the context of Malaysian polytechnics that encourages closer linkages to the industry, the competencies needed in the human capital or workforce provided by polytechnics graduates may be reflected in the curriculum. However, issues of supply and demand of graduates in TVET remain a challenge to polytechnics. In response to the needs to produce graduates with knowledge, skills and attitude that meet the changing industry, outcome-based education (OBE) has been implemented in Malaysian Polytechnics since 2010.
OBE calls for teaching and learning activities that engage students more in their learning or student-centered learning (SCL) instead of traditional teaching and learning activities that are more teacher-centered (Spady, 1994). According to Johnson, Kimball, Melendez, Myers, Rhea and Travis (2009), sources of resistance to implementing SCL pedagogy are individuals attempting the change (lecturers), the administration and the students. Hence, this study was proposed to examine the three aspects in implementing SCL.
Specifically, this study was conducted to achieve the following research objectives:
(1) To identify the levels of SCL implementation, perceived students’ readiness towards SCL and administrative support.
(2) To identify the problems faced by the faculty members in implementing SCL.
Literature Review
It is important to develop students to become educated workers who utilize their knowledge and skills to solve real-world problems and to meet the challenges of a new-world economy (Friedman, 2007). An effective technical and vocational education and training (TVET) system within a country can serve as an impetus to boost the value of the nation and its economy in the global marketplace (MacDonald, Nink & Duggan, 2010). Hence, TVET has to respond to the competence needs of the labor market and create a competent, motivated and adaptable workforce. With this ultimate goal in mind, OBE has been implemented in Malaysian Polytechnics since 2010, particularly responding to the requirements of Malaysian Qualification Agency (MQA) and borrowing the policy from Hong Kong University. In Hong Kong, OBE has been adopted as part of a distinctive approach to quality reform in higher education (Kennedy, 2011).
97
STEPSVol. 2 2014
Outcome-based education is a ‘design down’ approach to curriculum development (Spady, 1994) which start from what students are expected to learn, focus on teaching and learning environment and the usage of assessment to measure the achievement of learning. In OBE, the focus is on what the students should learn expressed in the form of learning outcomes. This learning outcome will guide in the curriculum design (Spady, 1994). OBE is a method of curriculum design and teaching that emphasizes on what the students are able to do after they are taught certain subjects or topics (Acharya, 2003) and not on what the teacher or lecturer wants to achieve (Zakaria & Wan Fadzilah, 2010). Since OBE focuses on what the students should know, understand and become (Zakaria & Wan Fadzilah, 2010), lecturers need to focus on the outcome. The focus on the learning outcomes has changed the emphasis from traditional teacher-centered viewpoint to student-centered learning (Adam, 2004).
According to Davis (2003), in OBE, students are more responsible for their own learning because they are clear about what they are going to achieve. OBE also play an important part in selecting appropriate educational strategies. The educational strategies that should be chosen are those that support the learning outcomes. Therefore, OBE promotes student-centered learning approach to learning and teaching (Davis, 2003).
Student-centered Learning
Lecturing has been a common form of teaching in higher education (Lammers & Murphy, 2002), which is characterized by little student activity (Kember, 2009) or teacher-centered. Teacher-centered approach is primarily concerned with the transmission of knowledge or content, more than on student processing (Harkema & Schout, 2008). It has been a concern to encourage lecturers in higher education institutions to shift from teacher-centered form of learning towards more student-centered approaches (Kember, 2009).
For a learning process to take place, the learners must be responsible for their own learning process as much as the teacher responsible for their teaching. Student-centered learning describes ways of thinking about learning and teaching that emphasize student responsibility for such activities as planning learning, interacting with teachers and other students, researching, and assessing learning (Cannon, 2000). It also concentrates on what learners do, and why they think they are doing it, rather than what the teacher does (Biggs, 1999).
Most researchers agreed that SCL is based on the philosophy that student is at the heart of the learning process (Attard, Di Ioio, Geven & Santa, 2010a) and hence, call for the shift in focus from lecturer to the students. SCL enable learners to develop their own skills and understanding (Department of Education, 1997)in contrast to the traditional teacher-centered that tends to consider students as passive receptors of information that need not to be encouraged to participate actively (Attard et al., 2010a).
SCL focuses on changes in the pedagogical methods used and in making learning and educational processes more flexible to cater for the different types of students, with each students within each group having different needs and points of view (Attard et al., 2010a). Implementation of SCL approach may take the form of group project work, problem-based learning, case analysis, role play, group presentenation, group

98
Factors Influencing the Implementation of Student- Centered Learning...
discussions and other active learning activities.Barriers to student-centered learning in higher education include individual faculty concerns, administrative concerns and student resistance (Johnson et al., 2009). Students should have the readiness towards SCL.
Perceived Students’ Readiness towards SCL
It may be difficult to implement SCL if students are not ready towards SCL. In a student-centered approach, the diversity of characteristics of students is considered (Harkema & Schout, 2008). Many researchers found that students’ active involvement in the learning process enhances learning (Smart & Csapo, 2007). The level of student acceptance of the SCL approach may vary based on prior experiences and the extent to which lecturers are prepared to act as facilitators in the learning process of the students (Attard et al., 2010a).
SCL affects the design and flexibility of curriculum and course content and focuses on the interactivity of the learning process (Attard et al., 2010a). Lecturers should proactively, modify curricula, teaching methods and learning activities and classroom routines to address the diverse needs of individual students and differences in the level of readiness, interest and modes of learning (Tomlinson, 1999). In this particular study, perceived readiness of students towards SCL refers to the readiness of students to undergo SCL as perceived by lecturers.
Administrative Support
To ensure successful implementation of OBE, administrators, educators, parents, lecturers and students must be involved (Acharya, 2003). In Malaysia, the focus on outcome-based education serves national goals because of the links with national higher education strategies (Zakaria & Wan Fadzilah, 2010). Students should be given adequate time and assistance so that each student can reach the maximum potential (Acharya, 2003). Facilities that are needed to successfully implement SCL should also be put in place in the institution.
Although SCL approach is highly pedagogical in nature and should be implemented by individual lecturers, the institutional changes needs to be organized, consistent and transparent (Attard et al., 2010a). Administrators should provide support that may facilitate collegial environment that may help lead to effective teaching and learning (Kardos, Johnson, Peske, Kauffman & Liu, 2001). Administrators may play their role through direct and indirect actions such as providing time, space, and resources for lecturers to work together, and being responsive to lecturers’ changing needs (Zwerger & Greninger, 2012).
Lecturers need to undergo training or professional development in the application of SCL approach as it involves an ongoing reflexive process for the lecturers, in which they are engaged in ‘thinking about their thinking’, in order to improve their conventional teaching pedagogy (Diekelmann & Lampet, 2004) and it requires continuous change, effort, reflection and updating (Attard et al., 2010a). A study conducted by Lavoie and Rosman (2007) finds that faculty development should be included as an important part of the scholarship of teaching and parallel the active student-centered learning used by students to enable lifelong learning among faculty.

99
STEPSVol. 2 2014
In this study, administrative support refers to the commitment of the administrator in providing training and other resources needed to implement SCL.
Problems in Implementing SCL
Factors that may hinder the implementation of SCL in the teaching and learning includes time constraint, resources such as textbooks, language barrier, size of classes and examination assessment requirement (Gladys, Zacharia, Gracious & Nicholas, 2012). SCL may be considered as time consuming, hence compromising the syllabus that needs to be covered (Gladys et al., 2012). In this particular study, factors such as time and financial constraints as well as excessive workload, lack of experience and skills or knowledge in SCL were included.
Methodology
The instrument used in this study was adapted and modified from a readiness assessment tool proposed by Mercado (2008). The instrument which used a Likert scale of 1 (strongly disagree) to 5 (strongly agree), consists of 17 items assessing implementation of SCL, 4 items measuring perceived students’ readiness and 5 items measuring administrative support. Among the items used to measure the construct of implementation of SCL were: (1) I use discussion as a teaching strategy for the subject that I teach, and (2) I facilitate and monitor the suitable interactions among my students. Among the items used to measure the construct of perceived students’ readiness were: (1) I believe that students are able to complete their group assignment with minimum supervision, and (2) I believe that students are able to search for information on their own to solve problems. To measure administrative support, two of the items used were: (1) The institution provides opportunity for professional development to help lecturers implement student-centered learning, and (2) The institution is committed towards SCL.
Convenience sampling method was used as the instrument was distributed online to all faculty members of 6 polytechnics and participation is based on voluntary basis. Within a period of two weeks, the time span allocated for each polytechnic, a total of 609 faculty members from the polytechnicsparticipated in the survey.
Analysis of Results
The results of the data analyses are presented in the sections below.
Demographic Variables
Table 1 shows the profile of the respondents based on their gender and teaching experience. The majority of the respondents (406 lecturers) were female which accounted for two-third of the total respondents. About 32.7% of the respondents had teaching experience between 6 to 10 years, and only 14.1% of the respondents had teaching experience of less than 3 years.

100
Factors Influencing the Implementation of Student- Centered Learning...
Variables Frequency Percent
Gender: Male 203 33.3 Female 406 66.7Teaching experience: Less than 3 years 86 14.1 3 to 5 years 98 16.1 6 to 10 years 199 32.7 11 to 15 years 112 18.4 More than 15 years 114 18.7Polytechnics: PUO 242 39.7 PTSB 74 12.2 PMJ 19 3.1 PKB 122 20.0 PKK 25 4.2 PSMZA 127 20.9
Table 1: Demographic Variables
Reliability Tests
The result of reliability tests on the scales to measure implementation of SCL, perception of lecturers on students’ readiness towards SCL and support by administrator show that Cronbach alpha values were .922, .717 and .868, respectively. Therefore, it can be concluded that internal consistency of the data was achieved.
Levels of SCL Implementation, Perceived Students’ Readiness and Administrative Support
To determine the levels of SCL implementation, perceived students’ readiness towards SCL and administrative support, means and frequency distributions for the three constructs were computed as shown in Table 2. SCL implementation was rated high (mean value of 3.86 from a scale of 5, SD = .54) whileperceived students’ readiness towards SCL and support by administrator were valued at moderate level (mean values of 3.59 and 3.32, respectively, from a scale of 5). The frequency distributions revealed that majority of respondent rated high level of SCL implementation (68.0%) and perceived students’ readiness (53.5%). However, administrative support was rated at moderate level by most of the respondents (65.2%).

101
STEPSVol. 2 2014
Level
Variables High Moderate Low Mean SD
Implementation of SCL 68.0% 31.0% 1.0% 3.86 .54Perceived Students’ Readiness 53.5% 42.5% 3.9% 3.59 .65
Administrative Support 28.2% 65.2% 6.6% 3.32 .66
Table 2: Levels and frequency distributions of variables under study
Descriptive Analysis on Problems in Implementing SCL
Exploratory factor analysis was carried out to analyze the 11 items used to examine the problems faced by faculty members in implementing SCL. Using principal component analysis with Varimax rotation, the items loaded on 3 factors as shown inTable 3. The first factor emphasized on the constraints faced by faculty members in implementing SCL, while the second factor focused on faculty members’ competencies in SCL. The third factor emphasized on the environmental conditions that affect the practicality or suitability of implementing SCL in polytechnics.
ItemsComponents
1 2 3
Time constraint .562Financial constraint .793Facilities constraint .823Excessive workload .660Lack of experience .942Lack of skills .942Lack of knowledge .946Students not ready for SCL .506
Approach not suitable to be implemented .768
Too much curriculum contents to be taught .745
Large class size .553
Table 3: Rotated Component Matrix
Table 4 shows the descriptive analysis on each factor and problems in implementing SCL.Constraints were found as the main factor (mean = 3.91, SD = .68) that hinder the faculty members from implementing SCL, followed by environmental conditions (mean = 3.66, SD = .68). The descriptive analysis of each items revealed that large number of students (mean = 4.08, SD = .941)had been rated as the highest problem in implementing SCL, followed by excessive workload (mean = 4.01, SD = .900) and facilities constraints (mean = 4.00, SD = .838). Approach not suitable to be implemented in polytechnic has been rated lowest (mean = 2.78, SD = 1.018).

102
Factors Influencing the Implementation of Student- Centered Learning...
Items Mean Level SD
Constraints: 3.94 High .923 Time constraint 3.90 High .681 Financial constraint 3.66 Moderate .869 Facilities constraints 4.00 High .838 Excessive workload 4.01 High .900Competencies of faculty members in SCL: 3.53 Moderate .921
Lack of experience 3.59 Moderate .949 Lack of skills 3.59 Moderate .949 Lack of knowledge 3.47 Moderate .954Environmental conditions: 3.66 Moderate .685
Students not ready 3.89 High .872 Approach not suitable to be implemented 2.78 Moderate 1.018
Too much curriculum contents to be taught 3.90 High .999
Large class size 4.08 High .941
Table 4: Descriptive analysis on problems in implementing SCL
Conclusions and Recommendations
Descriptive analysis revealed that SCL implementation was rated high while perceived students’ readiness towards SCL and administrative support were valued at moderate level. Using exploratory factor analysis, the problems faced by faculty members in implementing SCL may be categorized into 3 factors i.e. constraints, competencies of the faculty members in SCL and environmental conditions. Large class size and excessive workload had been found to be the main factors that hinder faculty members from implementing SCL.
Students’ readiness towards SCL, which was rated at moderate level, can be improved by giving students more exposure on more student-oriented teaching and learning techniques. Students may be more receptive if they are more informed about the advantages and effectiveness of SCL. Administrative support, which had been rated at moderate level, may be improved by providing the resources to facilitate SCL implementation and training to equip faculty members with the knowledge and skills needed. Those who have attended training or courses in SCL may also conduct in-house training to others.
Since large class size was considered the major problem in implementing SCL, techniques of SCL in large classes should be explored and practiced. Seminars on SCL best practices may also help the faculty members share their experiences, skills and knowledge to overcome this problem. Excessive workload was also considered a major problem in implementing SCL since faculty members did not have enough time to plan their teaching and learning using SCL. Collaborative efforts among

103
STEPSVol. 2 2014
faculty members may be encouraged to reduce duplicate in efforts and to enable sharing of knowledge and skills especially between seniors and novices.
The biggest challenge in the implementation of SCL is in changing the mindset of students and teachers to better accept the approach (Attard et al., 2010b). Students should be encouraged to participate actively in their learning. Innovative methods of teaching or practical ways in which SCL can be implemented, should be encouraged. Ideas to implement SCL should take into account the diversity of students and the large size of classes. Although the policy of implementation of SCL or OBE in Malaysian polytechnics has been a top-down approach, lecturers who are actually the implementers should have their own initiatives and this should be expanded or spread by means of sharing of best practices and ideas. This is consistent with the statement by Attard el al. (2010b) that both top and bottom levels have different roles to play and neither should be over-emphasized.
SCL, under the philosophy of OBE, may be considered as an effective approach to encourage deep learning and student learning engagement. The factors that may discourage lecturers from implementing SCL should be looked into to enhance the implementation of student-centered learning. The findings of this study provided constructive feedback in the effort to actively implement SCL. Future research should cover more Malaysian polytechnics or other higher education institutions.
References
1. Acharya, C. (2003). Outcome-based education (OBE): A new paradigm for learning. CDTLink, 7(3).
2. Adam, S. (2004). Using learning outcomes: A consideration of the nature, role, application and implications for European education of employing ‘learning outcomes’ at the local, national and international levels. Paper presented at United Kingdom Bologna Seminar, Edinburgh, Scotland. 1 -2 July, 2004.
3. Attard, A., Di Ioio, E., Geven, K. & Santa, R. (2010a).Student centered learning: An insight into theory and practice. Bucharest: Education International.
4. Attard, A., Di Ioio, E., Geven, K. & Santa, R. (2010b).Student centered learning: Toolkit for Students, Staff and Higher Education Institutions. Bucharest: Education International.
5. Biggs, J. B. (1999). Teaching for quality learning at university: What the student does? Buckingham:Society for Research into Higher Education and Open University Press.
6. Cannon, R. & Newble, D. (2000). A guide to improving teaching methods: a handbook for teachers in university and colleges. London: Kogan Page.
7. Davis, M. H. (2003). Outcome-Based Education: Educational Strategies. JVME, 30 (3):227 – 232.

104
Factors Influencing the Implementation of Student- Centered Learning...
8. Department of Education.(1997). Outcome-based education in South Africa.Background Information for Educators. Pretoria: Government Printer.
9. Diekelmann, N. & Lampe, S. (2004). Student-centered pedagogies: Co-creating compelling experiences using the new pedagogies. In Teacher Talk: New pedagogies for nursing, 43, 6: 245 – 247.
10. Friedman, T. (2007). The World is Flat. New York: Farrar, Straus and Giroux.
11. Gladys, Z., Zacharia, N., Gracious, Z. & Nicholas, Z. (2012).The challenges of implementing student-centered instruction in the teaching and learning of secondary school mathematics in a selected district in Zimbabwe.International Journal of Current Research, 4 (5): 145-155.
12. Harkema, S. J. M. &Schout, H. (2008).Incorporating student-centered learning in innovation and entrepreneurship education.European Journal of Education, 43 (4): 513 – 526.
13. Johnson, A., Kimball, R., Melendez, B., Myers, L., Rhea, K. and Travis, B. (2009). Breaking with Tradition: Preparing Faculty to Teach in a Student-Centered or Problem-Solving Environment. Primus, 19(2): 146-160.
14. Kardos, S. M., Johnson, S. M., Peske, H. G., Kauffman, D., & Liu, E. (2001) Counting on colleagues: New teachers encounter the professional cultures of their schools. Educational Administration Quarterly, 37: 296-321.
15. Kember, D. (2009). Promoting Student-centred Forms of Learning across an Entire University. High Education, 58: 1-13
16. Kennedy, K. J. (2011). Conceptualising quality improvement in higher education: policy, theory and practice for outcomes based learning in Hong Kong. Journal of Higher Education Policy and Management, 33 (3): 205 – 218.
17. Lammers, L. J. & Murphy, J. J. (2002). A profile of teaching techniques used in the university classroom. Active Learning in Higher Education, 3(1): 54 – 67. doi: 10.1177/1469787402003001005
18. Lavoie, D. &Rosman, A. J. (2007).Using active student-centered learning-based instructional design to develop faculty and improve course design, delivery and evaluation. In Issues in Accounting Education, 22, 1: 105 – 118.
19. MacDonald, S., Nink, C. & Duggan, S. (2010). Principles and strategies of a successful TVET program. UT: MTC Institute.
20. Martinez-Fernandez, C. and Choi, K. (2013).Skills Development Pathways in Asia. In Rupert Maclean, Shanti Jagannathan and JoukoSarvi (eds.). Skills Development for Inclusive and Sustainable Growth in Developing Asia-Pacific.Technical and Vocational Education and Training: Issues, Concerns and Prospects 19: 155-180.
105
STEPSVol. 2 2014
21. Mercado, C. A. (2008). Readiness assessment tool for an e learning environment implementation.Special Issue of the International Journal of the Computer, the Internet and Management, 16 (SP3), 18.1-18.11.
22. Smart, K. L. &Csapo, N. (2007). Learning by doing: Engaging students through learner-centered activities. Business Communication Quarterly, December 2007: 451 – 457.
23. Spady, W. (1994).Outcomes Based Education: Critical Issues and Answers. American Association of School Administration: Arlington, Virginia.
24. Tomlinson, C. (1999). The differentiated classroom: responding to the needs of all learners.Association for Supervision and Curriculum Development. Alexandria, VA.
25. ZakariaSabarudinand Wan Fadzilah Wan Yusoff. (2010). Outcome-based education in a private HIL: Perceptions of students. Advances in Management, 3(3), 48–51.
26. Zwerger, N. &Greninger, E. (2012). Research: How it supports teaching and learning. ERIC. http://www.eric.ed.gov/PDFS/EJ976473.pdf

106
Scholarly Technical Education Publication Series
107
STEPSVol. 2 2014 Soft Skills in Polytechnic:
Students’ Perspectives
Riam Chau MaiCommerce DepartmentPoliteknik Ungku Omar (PUO)Ipoh, Perak, [email protected]
Abstract
Employers in today’s job market seek for employees who have the ability to integrate their technical knowledge with their acquired soft skills. The integration of soft skills into technical training is crucial in the development of the graduates to be competent in jobs that will enable them to be competitive in the world of work. This has to be prioritized by higher education institutions in the ministry. Thus, necessary measures have been introduced to include the training of soft skills into the mainstream curriculum. Mandated by the Ministry of Education ( formerly Ministry of Higher Education) to inculcate soft skills in polytechnic students, significant steps have been taken by the polytechnic schools to introduce soft skills, one of them is through the Industrial Training Soft Skills (ITSS) module which was launched in 2006.
This paper reports students’ perceptions on the importance of soft skills and perceived level of soft skills competencies, as included in the ITSS module, assessed before and after industrial attachment in various companies. The research involves a survey of 353 pre-industrial training students and 359 post-industrial training students using a 6-point Likert scale. The population consists of students who had undergone the ITSS module from four polytechnics in the northern region of Malaysia (Kedah, Perlis, Penang). It is a combination of established and newly-built polytechnics located reasonably close to industrial zones in this region. Moreover, courses offered in these polytechnics such as: engineering, commerce, hospitality and information technology (IT) represent major courses offered by the Malaysian polytechnic education system. The findings of the study suggested that, generally students were very positive with the importance of soft skills and their soft skills competency. The teamwork, decision making and time management skills are found to be areas where improvements are needed most. The skills relating to communication (both written and oral), learning and interpersonal skills are identified to be needing improvement as well.
Key words: Soft skills, polytechnic, competency, industrial training
Introduction
The mismatch in what students learn in higher education institutions and what they need to know and should be able to do in the workplace is a long ongoing issue. Employers always raise a concern that they are not able to find graduates with the required skills (Dunne & Rawlins, 2000; Hesketh, 2000; Lee, 2003). In Malaysia, graduates are found to lack the necessary skills needed to function effectively at the workplace (Bakar & Hanafi, 2007; Jusoh, Razak, & Chong, 2007; Kamsah, 2006; Shah, 2008; Sidhu, 2011; Woo, 2006). Furthermore, employers and professional bodies
108
Soft Skills in Polytechnic: Students’ Perspectives
worldwide are in consensus that higher education institutions should adapt and change at an even greater pace than in the past in order for them to be able to develop a workforce that is highly skilled and ready to face the challenges of increased global competition (Dunne & Rawlins, 2000; Keep & Mayhew, 1999; Ministry of Higher Education Malaysia, 2006; Ong, Sharma, & Heskin, 2003). On the other hand, Evers et al. (1996) is of the opinion that education is not doing poorer, but it is the skills demanded by employers that have increased.
To be competitive, Malaysia must adopt an education system that is market-driven and able to produce work-ready graduates. In order to orient the educational system into that goal, the teaching and learning systems should be up to date and are capable of developing graduates trained with generic competencies as needed by the job market. This can be acquired through real work experience and other hands-on activities. As mentioned by Coll, Zegward and Hodges (2002), not all skills can be acquired in the classrooms. Some skills are best developed in the workplace via hands-on experience. Indeed, industrial training programs form an essential part towards this end.
Industrial training has been proven to be able to provide students with opportunities for an intensive work-based exposure to a broad range of operations within a company (Crossley, Jamieson, & Brayley, 2007). It can also be considered as a performance measure and as such is thought to be more valid than traditional paper and pencil tests in classrooms (Allen, 2004). In addition, industrial training can be a very effective assessment vehicle in evaluating the quality of academic product. Usually, if employers are satisfied with students’ or graduates’ performance, it is generally assumed that the institution’s curriculum has met or even surpassed the employers’ needs (Verney, Holoviak, & Winter, 2009). Realizing the importance of these findings, the Industrial Training Soft Skills (ITSS) module has been developed and incorporated into polytechnic industrial training program.
The Industrial Training Soft Skills Module (ITSS)
In its first launch, the ITSS module was developed and embedded as part of the industrial training program for Malaysian polytechnic students to enhance immediate practice of the skills learned from school. Feedback forms from industries collected during the students’ industrial training program were used as basis in designing the ITSS module. This collective feedback is also a very precious input for curriculum improvement in order to meet employers’ needs and expectations in the future. Issues such as the lack of practical application as lamented by employers can be minimized and students can develop various applied workplace skills for transition from the classroom to the world of work. As mentioned by Peacock and Ladkin (2002), the industry’s involvement in course design is essential to ensure that the right skills are provided to students. Therefore, the development of soft skills with the participation of the industry as implemented in the ITSS module is projected to be unique and more effective.
The ITSS module consists of generic elements such as positive personality, communication skills, work etiquette, work exposure and report writing. It is offered in the second and third semester for certificate and diploma level students, respectively. This module accounts for one hour credit and students are not allowed to enrol

109
STEPSVol. 2 2014
in industrial training if they have not successfully gone through this module. The objective is to prepare polytechnic students with generic competency for industrial training as well as for employment. During their industrial training, students are evaluated by their employers. Therefore, in investigating the preliminary outcome of the module, perceptions of soft skills competency from both the pre and post- industrial training students are deemed necessary. Students’ self-rating is considered a valuable input in investigating their personal view of soft skills competency before and after real industrial experience. The industrial training is a good training foundation for students to provide a reasonable perception of the importance of soft skills as well as their competency in soft skills. Moreover, students’ real experience can be a valuable contribution in investigating current needs of employers among polytechnic graduates.
CompetencyPrior to examining students’ perceptions on soft skills competency, it would be appropriate to clarify the term ‘competency’ particularly in the context of this study. Studies have defined competency differently according to context. Boyatzis (1982) for example defined competency as “the underlying characteristics of a person which involved a motive, trait, skill, aspect of one’s self-image or social role, or a body of knowledge used and they are generic in nature or can appear in many different work” (p. 21). For Illeris (2008), “the concept of competence was referred to as what a person is actually able to do or achieve” (p.1). However, Woodruffe (1993) argues that these definitions is open to a multitude of interpretations and suggested that competency should refer to a “set of behaviors, skills, knowledge and understanding which are crucial to the effective performance of a position” (p. 29).
The definitions seem to hold a great deal of promise and hardly get away with different interpretations and practices similar to soft skills definition. To add to the impetus, there are also disparity between competency and competence. According to Eraut (1998), the United States (US) literature refers to the term “competency” as a specific capability and “competence” has a more holistic meaning; meanwhile, Australian authors define “competencies” as particular attributes, such as knowledge, skills and attitudes and jointly underlying “competence”. Eventually, in a workplace context, competency is defined as a combination of cognitive skills, personal or behavioral characteristics which are a function of an individual’s personality (Hodges & Burchell, 2003).
In summary, the definitions discussed suggest many interpretations of competency, depending on individual or organizational context and purpose. Of particular importance to the definition is the statement that competencies are concerned with people’s behavior that is relevant to performance in the job and it must result in something observable. Given that there is a variety of definitions and interpretations of competency, thus, if this term is defined in this study. Competency in this study refers to something that a person is capable of doing but not necessarily observable, or what a person knows and can do (adapted from Eraut, 1998). This adapted definition has not fully taken into consideration the issue of observation at the workplace, as the second group of polytechnic students participating in the study are students who have undergone industrial attachment for only five months. This duration is rather short for proper training and experience to take place. Moreover,
110
Soft Skills in Polytechnic: Students’ Perspectives
the real performance of the students may not be portrayed in a short period of time. Students may not have the opportunity to experience work related skills or if it so, various training background might limit their perceptions of competency. This is the uncontrolled variable that is not taken into consideration while conducting this study.
Objectives of the Study
Although the importance of soft skills has been acknowledged by the management strata of Malaysian polytechnics, the in-depth implementation of soft skills training is still new in the Malaysian tertiary education system, particularly in polytechnics. Hence, questions have been raised as to how well the module has been implemented. Not only do we need to determine whether the students have acquired the knowledge on soft skills, we also need to know whether they are applying what they have learned and which areas still need to be improved in the module. Though there are numbers of action research and full research that have been conducted by both the polytechnic and Polytechnic Division on students’ soft skills, there are still complaints received from employers on polytechnic students’ soft skills. This study investigates the perceptions of one of the stakeholders who are directly involved in the ITSS: students who have undergone soft skills training via the ITSS module, with and without industrial training experience.
The objective of this research is to explore students’ perceptions on soft skills implemented and delivered in the ITSS module. The specific objectives are to:
1. Investigate stakeholders’ (students) perceptions on soft skills taught in the ITSS module;
2. Determine perceptions on the extent of generic skills developed at the polytechnics (soft skills competency); and
3. Investigate the extent students are able to transfer and apply the skills learned while undergoing their industrial training.
Methodology
The study looks into the students’ perceptions in relation to the applications of soft skills during industrial training and their awareness on the importance of soft skills. Respondents from both groups consisted of students who have undergone the ITSS module. The first group is composed of students with soft skills and have undergone training but without industrial or real work experience and the second group consisted of students trained using the ITSS module and have gone through industrial training in various organizations at the northern region of Peninsular Malaysia (Kedah, Perlis and Penang). The participants come from four polytechnics in the same region and are studying engineering, commerce, hospitality and information technology (IT). The sample size is calculated from the total population of each discipline base on a model by Krejcie and Morgan (1970). The soft skills elements studied are mainly based on the elements used in the ITSS module apart from the literature. Respondents were asked to respond to questions using Likert scale with six response options; values 1 to 6 are assigned to the responses from important and not important, and incompetent to competent, respectively.
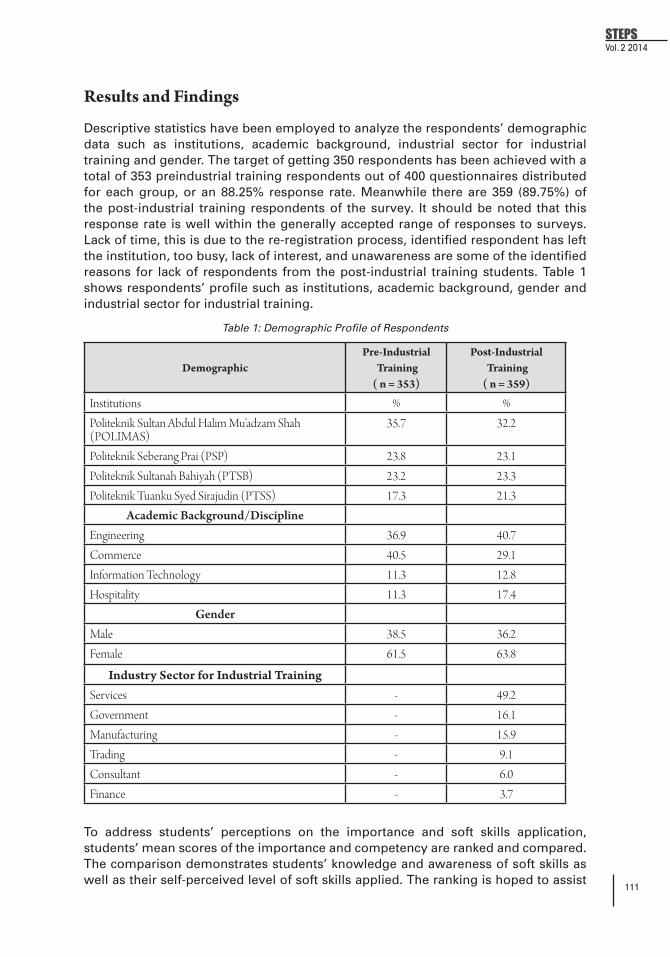
111
STEPSVol. 2 2014
DemographicPre-Industrial
Training ( n = 353)
Post-Industrial Training ( n = 359)
Institutions % %Politeknik Sultan Abdul Halim Mu’adzam Shah (POLIMAS)
35.7 32.2
Politeknik Seberang Prai (PSP) 23.8 23.1Politeknik Sultanah Bahiyah (PTSB) 23.2 23.3Politeknik Tuanku Syed Sirajudin (PTSS) 17.3 21.3
Academic Background/DisciplineEngineering 36.9 40.7Commerce 40.5 29.1Information Technology 11.3 12.8Hospitality 11.3 17.4
GenderMale 38.5 36.2Female 61.5 63.8
Industry Sector for Industrial TrainingServices - 49.2Government - 16.1Manufacturing - 15.9Trading - 9.1Consultant - 6.0Finance - 3.7
Table 1: Demographic Profile of Respondents
Results and Findings
Descriptive statistics have been employed to analyze the respondents’ demographic data such as institutions, academic background, industrial sector for industrial training and gender. The target of getting 350 respondents has been achieved with a total of 353 preindustrial training respondents out of 400 questionnaires distributed for each group, or an 88.25% response rate. Meanwhile there are 359 (89.75%) of the post-industrial training respondents of the survey. It should be noted that this response rate is well within the generally accepted range of responses to surveys. Lack of time, this is due to the re-registration process, identified respondent has left the institution, too busy, lack of interest, and unawareness are some of the identified reasons for lack of respondents from the post-industrial training students. Table 1 shows respondents’ profile such as institutions, academic background, gender and industrial sector for industrial training.
To address students’ perceptions on the importance and soft skills application, students’ mean scores of the importance and competency are ranked and compared. The comparison demonstrates students’ knowledge and awareness of soft skills as well as their self-perceived level of soft skills applied. The ranking is hoped to assist

112
Soft Skills in Polytechnic: Students’ Perspectives
1. Numbers in bracket denote ranking order
2. Likert-type scale for each category under degree of importance: 1= Not Important; 6 = Important
The independent sample t-test is then used to determine if there is a statistically significant difference between the perceptions of the importance of soft skills by the pre-and post-industrial training students. The analysis shows that there is a mixed view in the perceptions of both groups. Five of the items: decision making, teamwork, time management, communication and report writing skills registered a significance value of p<.05, (Appendix 1). This indicates that the disparities in perceptions amongst groups are noteworthy for certain skills only, therefore would imply that interventions must be pursued in order to bridge this gap.
There are also some changes in ranking order between groups noted in the above results. The importance of teamwork as a soft skill element remains to be the priority, indicating that this skill is required regardless of situation or background. The changes in ranking order indicate priority given to those skills particularly by students with real experience. The gaps and changes in ranking determine soft skills that need more emphasis in teaching and learning in the future. Notwithstanding, these differences can be bases for future improvement of the module.
in identifying skills elements most required according to respondents’ perspective. The result is presented as follows:
The Perceptions on the Importance and Perceived Competency Level of Identified Soft Skills
The majority of the students seem positive about the importance of soft skills (Table 2). The highly rated mean indicate overall students’ attentiveness on the importance of soft skills. Of the eight skills ranked by importance, two skills scored mean less than five. The teamwork skills are highly rated, report writing/decision making and leadership are not highly ranked and yields relatively low score by the pre-and post-industrial training (M = 4.95 and 5.02), respectively.
Soft Skills ElementsMean Importance Mean
Difference(B-A)
Ranking Difference
(A-B)Pre (A) Post (B)
Teamwork 5.12(1) 5.29 (1) 0.16 (2) 0Learning and Interpersonal 5.6 (2) 5.11(5) 0.05(6) -3Time Management 5.05(3) 5.20(2) 0.15(3) 1Problem Solving 5.03(4) 5.06(7) 0.03(7) -3Communication 5.02(5) 5.02(5) 0.12(5) 2Leadership 5.00(6) 5.02(8) 0.02(8) -2Decision Making 4.95(7) 5.12(4) 0.17(1) 3Report Writing 4.95(8) 5.07(6) 0.12(4) 2
Table 2: Students’ Perception on the Importance of Identified
Soft Skills Elements (n = 353: 359)
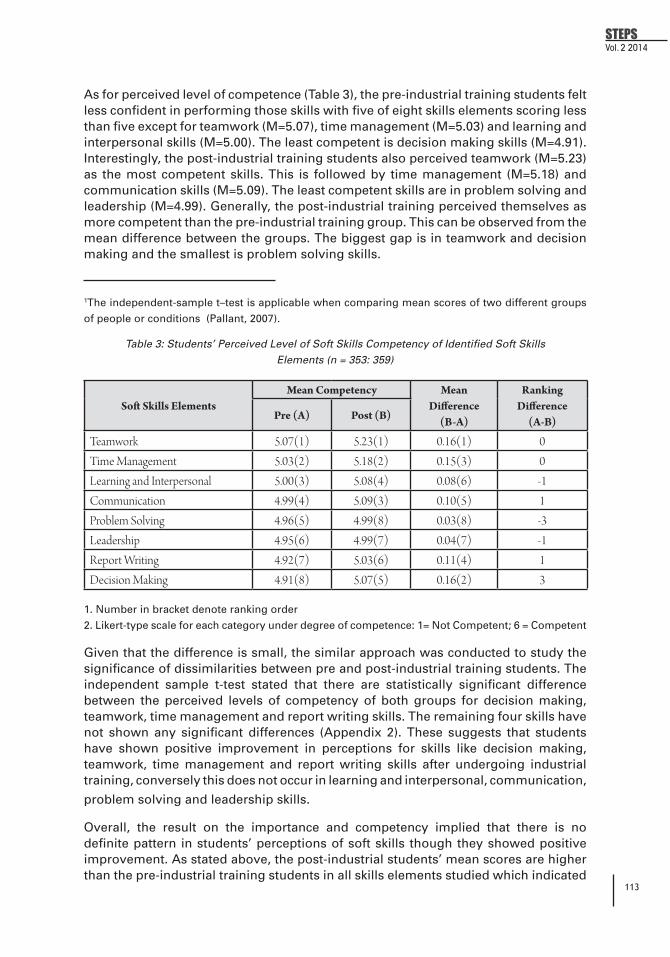
113
STEPSVol. 2 2014
As for perceived level of competence (Table 3), the pre-industrial training students felt less confident in performing those skills with five of eight skills elements scoring less than five except for teamwork (M=5.07), time management (M=5.03) and learning and interpersonal skills (M=5.00). The least competent is decision making skills (M=4.91). Interestingly, the post-industrial training students also perceived teamwork (M=5.23) as the most competent skills. This is followed by time management (M=5.18) and communication skills (M=5.09). The least competent skills are in problem solving and leadership (M=4.99). Generally, the post-industrial training perceived themselves as more competent than the pre-industrial training group. This can be observed from the mean difference between the groups. The biggest gap is in teamwork and decision making and the smallest is problem solving skills.
1The independent-sample t–test is applicable when comparing mean scores of two different groups
of people or conditions (Pallant, 2007).
Table 3: Students’ Perceived Level of Soft Skills Competency of Identified Soft Skills
Elements (n = 353: 359)
Soft Skills ElementsMean Competency Mean
Difference(B-A)
Ranking Difference
(A-B)Pre (A) Post (B)
Teamwork 5.07(1) 5.23(1) 0.16(1) 0Time Management 5.03(2) 5.18(2) 0.15(3) 0Learning and Interpersonal 5.00(3) 5.08(4) 0.08(6) -1Communication 4.99(4) 5.09(3) 0.10(5) 1Problem Solving 4.96(5) 4.99(8) 0.03(8) -3Leadership 4.95(6) 4.99(7) 0.04(7) -1Report Writing 4.92(7) 5.03(6) 0.11(4) 1Decision Making 4.91(8) 5.07(5) 0.16(2) 3
1. Number in bracket denote ranking order
2. Likert-type scale for each category under degree of competence: 1= Not Competent; 6 = Competent
Given that the difference is small, the similar approach was conducted to study the significance of dissimilarities between pre and post-industrial training students. The independent sample t-test stated that there are statistically significant difference between the perceived levels of competency of both groups for decision making, teamwork, time management and report writing skills. The remaining four skills have not shown any significant differences (Appendix 2). These suggests that students have shown positive improvement in perceptions for skills like decision making, teamwork, time management and report writing skills after undergoing industrial training, conversely this does not occur in learning and interpersonal, communication,
problem solving and leadership skills.
Overall, the result on the importance and competency implied that there is no definite pattern in students’ perceptions of soft skills though they showed positive improvement. As stated above, the post-industrial students’ mean scores are higher than the pre-industrial training students in all skills elements studied which indicated
114
Soft Skills in Polytechnic: Students’ Perspectives
the improvement on their perceptions. Thus, it can be concluded that, students have mixed perceptions about industrial training in instilling the awareness of soft skills to polytechnic students. However, the improvement in soft skills and gaps identified between the pre and post-industrial training are very valuable input for future progress of the module.
The Relationship between Perceptions on the Importance of Soft Skills and Perceived Competency of Soft Skills
One of the definitions used in describing competency is “the ability and willingness to perform a task” by Brown (1993) and the purpose of competencies is to show the relationship between perceived performance, anticipated future performance and expected performance (Antonacopoulou & FitzGerald, 1996). Thus, in order to investigate the perceived performance of soft skills in this study, students’ perceived level of competency is explored.
As we can observed above, it is noted that some of the most significantly rated soft skills elements were also the most competent skills, similar to several studies (Ferreira & Santoso, 2008; Ong, et al., 2003). To assess whether or not there is relationship between the perceptions on the importance and the self- perceived level of soft skills competency by both groups, Pearson product-moment correlation coefficient was utilized. The analyzed result shows that there is a strong relationship between respondents’ perception on the importance and self-perceived level of soft skills competency (r = .707 to .800, n = 837, p < .01), this indicates that the higher students think that soft skill is important, the more they anticipate competence (Appendix 3). Therefore, it is concluded here that the positive perception on the importance of soft skills reflects on positive perceived level of soft skills competency.
In summary, respondents generally are having positive perceptions on soft skills, both on the importance and competency. Although the gaps identified from the perceptions of importance and competency for both groups is small, some skills are significant and notable for future improvement. It is also noted that students tended to rate the importance of soft skills more highly than their own ability in those skills, similar to many studies (Azam & Brauchle, 2003; Feast, 2001; Knemeyer & Murphy, 2002; Mey, 2003; Nabi & Bagley, 1999; Saunders & Zuzel, 2010; Singh & Singh, 2008).
Conclusions and Recommendations
Overall it can be seen that there are no outstanding outcome from student-respondents. The ITSS module was not effectively segregated or filtered to provide distinct trends by the pre-and post-industrial students. Most students perceive the majority of the skills to be of paramount important and appear to perceive that they have mastered most of the components of the soft skills tested. Teamwork and time management skills are always at the top rank both in terms of importance and competence regardless of respondents’ background. The least priority skills are report writing and leadership skills. Another notable result is the communication skills. The communication skills scored relatively lower although these skills are well recognized as the most highly required skills by employers. This should be a serious concern to all parties such that appropriate strategies should be taken immediately to inculcate this skill.
115
STEPSVol. 2 2014
For instance, the overall results imply that these are skills which the academe should take into consideration in the teaching and learning in relation to the improvement in the module from the students’ perspective. Students are aware of soft skills and they basically realize the importance of soft skills in achieving their desired level of competence. The small differences between perceptions on importance of soft skills and self-perceived soft skills competency seem and might not be noteworthy but the values suggest that some of these skills are to be prioritized. Moreover, students’ responses should not be the only deciding factor in any future changes if any, but it can be a valuable input to ITSS module evaluation as well as the teaching and learning. The importance and competence identified in each criterion can be consideration points in deciding whether any alterations is needed, emphasized, added or subtracted to curriculum elements.
2A perfect correlation of 1 or -1 indicates that the value of one variable can be determined exactly
by knowing the value on the other variable. A correlation of 0 indicates no relationship between the
two variables. Negative sign in front of the correlation means there is negative correlation between
the two variables (high scores on one are associated with low scores on the other). Strength of
relationship:
Small: r = .10 to .29
Medium r = .30 to .49
Large r = .50 to 1.0
References
1. Allen, M. J. (2004). Assessing academic programs in higher education. Bolton, Massachusetts: Anker Publishing Company.
2. Antonacopoulou, E. P., & FitzGerald, L. (1996). Reframing competency in management development. Human Resource Management Journal, 6(1), 27-48.
3. Azam, M. S., & Brauchle, P. E. (2003). A study of supervisor and employee perceptions of work attitudes in information age manufacturing industries. Journal of Vocational Education Research, 28(3), 185-216.
4. Bakar, A. R., & Hanafi, I. (2007). Employability skills: Malaysian employers perspectives. The International Journal of Interdisciplinary Social Sciences, 2(1), 263-274.
5. Boyatzis, R. E. (1982). The competent manager : a model for effective performance. New York : Wiley.
6. Brown, R. B. (1993). Meta-competence: A recipe for reframing the competence debate. Personnel Review, 22(6), 25.
7. Coll, R. K., Zegwaard, K. E., & Hodges, D. (2002). Science and technology stakeholders’ ranking of graduate competencies part 1. Asia Pacific Journal of Cooperative Education, 3(2), 19-28.
8. Crossley, J. C., Jamieson, L. M., & Brayley, R. E. (2007). Introduction to commercial recreation and tourism : An entrepreneurial approach (4th ed. ed.). [Champaign, Ill.]:: Sagamore Pub.
116
Soft Skills in Polytechnic: Students’ Perspectives
9. Dunne, E., & Rawlins, M. (2000). Bridging the gap between industry and higher education: Training academics to promote student teamwork. Innovations in Education and Teaching International, 37(4), 361 - 371.
10. Evers, F. T., & Rush, J. C. (1996). The bases of competence: Skill development during the transition from university to work. Management Learning, 27(3), 275-299.
11. Feast, V. (2001). Student perceptions of the importance and value of a graduate quality framework in a tertiary environment. International Education Journal, 2(4), 144 -158.
12. Ferreira, A., & Santoso, A. (2008). Do students’ perceptions matter? A study of the effect of students’ perceptions on academic performance. Accounting & Finance, 48(2), 209-231.
13. Hesketh, A. J. (2000). Recruiting an elite? Employers’ perceptions of graduate education and training. Journal of Education and Work, 13, 245-271.
14. Hodges, D., & Burchell, N. (2003). Business graduate competencies: Employers’ views on importance and performance. Asia Pacific Journal of Cooperative Education, 4(2), 16-22.
15. Illeris, K. (2008). Competence development — the key to modern education, or just another buzzword? Asia Pacific Education Review, 9(1), 1-4.
16. Jusoh, M., Razak, M. R. A., & Chong, S. C. (2007). Employers preferences and assessment of qualities of fresh business graduates: Empirical evidence from Malaysia. International Journal Management and Enterprise Development, 4(3), 316-336.
17. Kamsah, M. Z. (2006). Developing generic skills in classroom environment:Engineering students’ perpective. Unpublished Research. Technology University of Malaysia.
18. Keep, E., & Mayhew, K. (1999). The assessment: Knowledge, skills, and competitiveness. Oxford Review of Economic Policy, 15, 1-15.
19. Knemeyer, A. M., & Murphy, P. R. (2002). Logistics internships: Employer and student perspectives. International Journal of Physical Distribution & Logistics Management, 32, 135-152.
20. Krejcie, R. V., & Morgan, D. W. (1970). Determining sample size for research activities. Educational and Psychological Measurement, 30, 607-610.
21. Lee, F. T. (2003). Identifying essential learning skills in students’ engineering education. Paper presented at the Proceedings of. HERDSA Canterbury, New Zealand.
22. Mey, S. C. (2003) Psychological attributes of graduates. Vol. 1. Bulletin of Higher Education Research (pp. 3-5). Kuala Lumpur: National Higher Education Research Institute.
117
STEPSVol. 2 2014
23. Ministry of Higher Education Malaysia. (2006). Soft skills development module for institutions of higher learning Malaysia. Univeristi Putra Malaysia Press, pp. 1-5.
24. Nabi, G. R., & Bagley, D. (1999). Graduates’ perceptions of transferable personal skills and future career preparation in the UK. Education + Training, 41, 184-193.
25. Ong, E., Sharma, R., & Heskin, K. (2003). Generic skills asssessment in a Malaysian tertiary institution: A survey of stakeholders’ perceptions. Journal of Institutional Research South East Asia, 1(2), 33-42.
26. Pallant, J. (2007). SPSS survival manual: A step by step guide to data analysis using SPSS for windows version 15. Sydney, NSW, Australia: Open University Press.
27. Peacock, N., & Ladkin, A. (2002). Exploring relationships between higher education and industry: A case study of a university and the local tourism industry. Industry and Higher Education, 16, 393-401.
28. Saunders, V., & Zuzel, K. (2010). Evaluating employability skills: Employer and student perceptions. Journal of Bioscience Education, 15(June).
29. Shah, N. Z. (2008). Are graduates to be blamed? Unemployment of computer science graduates in Malaysia. Retrieved on 12 Sept 2009 from, http://aabss.org/journal2008/AABS2008Article6NORSHIMAZSHAH.pdf.
30. Sidhu, J. S. (2011, Feb 12). The scramble for skills. The Star Online. Retrieved on 12 July 2011 from http://biz.thestar.com.my/news/story.asp?file=/2011/2/12/business/8051679
31. Singh, G. K. G., & Singh, S. K. G. (2008). Malaysian graduates employability skills. UNITAR E-Journal, 4(1), 15-45.
32. Verney, T. P., Holoviak, S. J., & Winter, A. S. (2009). Enhancing the reliability of internship evaluations. Journal of Applied Business and Economics, 9(1), 22-33.
33. Woo, K. Y. (2006). Malaysian private higher education: A need to study the different interpretations of quality. Retrieved on 21 June 2010 from http://www.ucsi.edu.my/research/jasa/1/papers/10A-pg17.pdf
34. Woodfuffe, C. (1993). What is mean by a competency. Leadership and Organization Development Journal, 14(1), 1993.
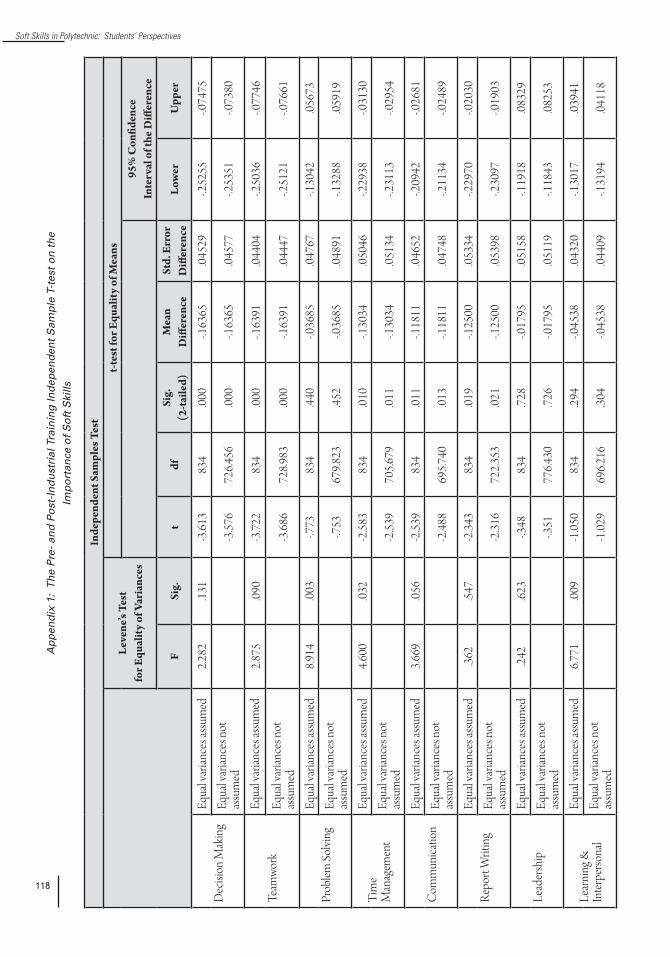
118
Soft Skills in Polytechnic: Students’ Perspectives
Inde
pend
ent S
ampl
es T
est
Leve
ne’s
Test
for E
qual
ity
of V
aria
nces
t-te
st fo
r Equ
alit
y of
Mea
ns
95%
Con
fiden
ceIn
terv
al o
f the
Diff
eren
ce
FSi
g.t
dfSi
g.
(2-t
aile
d)M
ean
Diff
eren
ceSt
d. E
rror
D
iffer
ence
Low
erU
pper
Dec
ision
Mak
ing
Equa
l var
iance
s assu
med
2.282
.131
-3.61
383
4.00
0-.1
6365
.0452
9-.2
5255
-.074
75Eq
ual v
arian
ces n
ot
assu
med
-3.57
672
6.456
.000
-.163
65.04
577
-.253
51-.0
7380
Team
work
Eq
ual v
arian
ces a
ssum
ed2.8
75.09
0-3
.722
834
.000
-.163
91.04
404
-.250
36-.0
7746
Equa
l var
iance
s not
as
sum
ed-3
.686
728.9
83.00
0-.1
6391
.0444
7-.2
5121
-.076
61
Prob
lem So
lving
Equa
l var
iance
s assu
med
8.914
.003
-.773
834
.440
-.036
85.04
767
-.130
42.05
673
Equa
l var
iance
s not
as
sum
ed-.7
5367
9.823
.452
-.036
85.04
891
-.132
88.05
919
Tim
e M
anag
emen
t
Equa
l var
iance
s assu
med
4.600
.032
-2.58
383
4.01
0-.1
3034
.0504
6-.2
2938
-.031
30Eq
ual v
arian
ces n
ot
assu
med
-2
.539
705.6
79.01
1-.1
3034
.0513
4-.2
3113
-.029
54
Com
mun
icatio
n Eq
ual v
arian
ces a
ssum
ed3.6
69.05
6-2
.539
834
.011
-.118
11.04
652
-.209
42-.0
2681
Equa
l var
iance
s not
as
sum
ed-2
.488
695.7
40.01
3-.1
1811
.0474
8-.2
1134
-.024
89
Repo
rt W
ritin
g Eq
ual v
arian
ces a
ssum
ed.36
2.54
7-2
.343
834
.019
-.125
00.05
334
-.229
70-.0
2030
Equa
l var
iance
s not
as
sum
ed-2
.316
722.3
53.02
1-.1
2500
.0539
8-.2
3097
-.019
03
Lead
ersh
ip
Equa
l var
iance
s assu
med
.242
.623
-.348
834
.728
-.017
95.05
158
-.119
18.08
329
Equa
l var
iance
s not
as
sum
ed-.3
5177
6.430
.726
-.017
95.05
119
-.118
43.08
253
Lear
ning
&
Inter
perso
nal
Equa
l var
iance
s assu
med
6.771
.009
-1.05
083
4.29
4-.0
4538
.0432
0-.1
3017
.0394
1Eq
ual v
arian
ces n
ot
assu
med
-1.02
969
6.216
.304
-.045
38.04
409
-.131
94.04
118
Ap
pen
dix
1:
Th
e P
re-
and
Po
st-I
nd
ust
rial
Tra
inin
g In
dep
end
ent
Sam
ple
T-t
est
on
th
e
Imp
ort
ance
of
So
ft S
kills

119
STEPSVol. 2 2014
Inde
pend
ent S
ampl
es T
est
Leve
ne’s
Test
for E
qual
ity
of V
aria
nces
t-te
st fo
r Equ
alit
y of
Mea
ns
95%
Con
fiden
ceIn
terv
al o
f the
Diff
eren
ce
FSi
g.t
dfSi
g.
(2-t
aile
d)M
ean
Diff
eren
ceSt
d. E
rror
D
iffer
ence
Low
erU
pper
Dec
ision
Mak
ing
Equa
l var
iance
s assu
med
2.663
.103
-4.50
683
5.00
0-.2
0067
.0445
4-.2
8809
-.113
25Eq
ual v
arian
ces n
ot
assu
med
-4.44
371
7.790
.000
-.200
67.04
516
-.289
34-.1
1200
Team
work
Eq
ual v
arian
ces a
ssum
ed.64
5.42
2-3
.275
835
.001
-.148
09.04
522
-.236
85-.0
5932
Equa
l var
iance
s not
as
sum
ed-3
.262
747.8
37.00
1-.1
4809
.0454
0-.2
3721
-.058
97
Prob
lem So
lving
Equa
l var
iance
s assu
med
3.146
.076
-.707
835
.480
-.033
43.04
731
-.126
28.05
943
Equa
l var
iance
s not
as
sum
ed-.6
9671
4.465
.487
-.033
43.04
802
-.127
71.06
086
Tim
e M
anag
emen
t
Equa
l var
iance
s assu
med
2.081
.150
-2.98
183
5.00
3-.1
4283
.0479
1-.2
3687
-.048
78Eq
ual v
arian
ces n
ot
assu
med
-2
.905
680.8
30.00
4-.1
4283
.0491
6-.2
3936
-.046
29
Com
mun
icatio
n Eq
ual v
arian
ces a
ssum
ed.11
8.73
2-1
.724
835
.085
-.079
44.04
608
-.169
89.01
102
Equa
l var
iance
s not
as
sum
ed-1
.715
744.3
57.08
7-.0
7944
.0463
2-.1
7036
.0114
9
Repo
rt W
ritin
g Eq
ual v
arian
ces a
ssum
ed.40
3.52
6-2
.487
835
.013
-.132
12.05
312
-.236
38-.0
2786
Equa
l var
iance
s not
as
sum
ed-2
.468
736.7
05.01
4-.1
3212
.0535
3-.2
3720
-.027
04
Lead
ersh
ip
Equa
l var
iance
s assu
med
.876
.350
-1.48
483
5.13
8-.0
7812
.0526
2-.1
8141
.0251
7Eq
ual v
arian
ces n
ot
assu
med
-1.47
073
0.028
.142
-.078
12.05
315
-.182
46.02
622
Lear
ning
&
Inte
rper
sona
l
Equa
l var
iance
s assu
med
.142
.706
-1.60
671
0.10
9-.0
7525
.0468
6-.1
6725
.0167
5Eq
ual v
arian
ces n
ot
assu
med
-1.60
570
4.481
.109
-.075
25.04
689
-.167
30.01
680
Ap
pen
dix
2:
Th
e P
re-
and
Po
st-I
nd
ust
rial
Tra
inin
g In
dep
end
ent
Sam
ple
T-t
est
on
So
ft
Ski
lls C
om
pet
ency
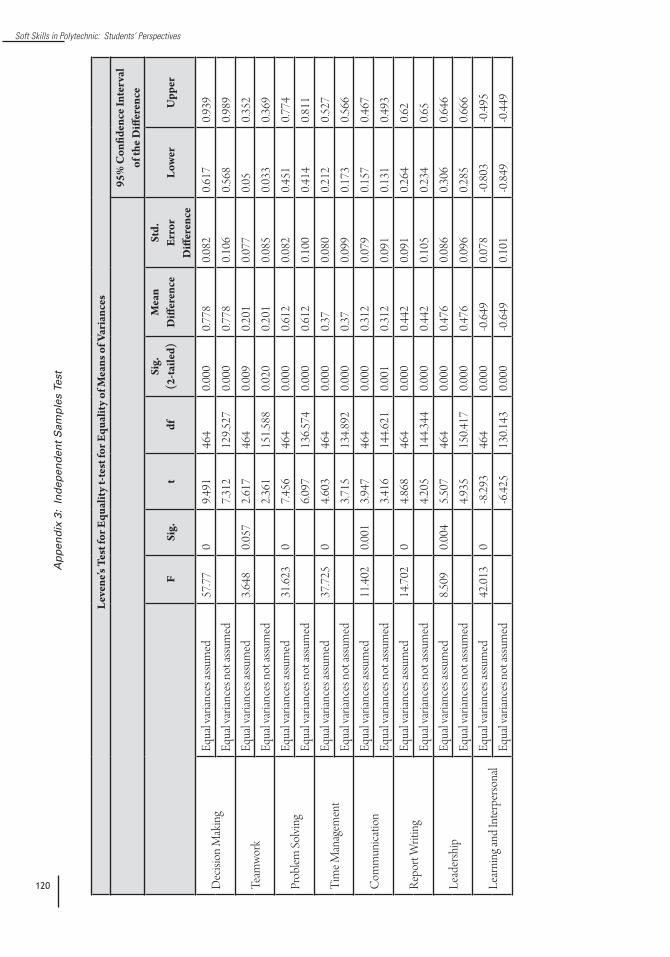
120
Soft Skills in Polytechnic: Students’ Perspectives
Le
vene
’s Te
st fo
r Equ
alit
y t-
test
for E
qual
ity
of M
eans
of V
aria
nces
95%
Con
fiden
ce In
terv
al
of th
e D
iffer
ence
FSi
g.t
dfSi
g.
(2-t
aile
d)M
ean
Diff
eren
ceSt
d.
Erro
r D
iffer
ence
Low
erU
pper
Dec
ision
Mak
ing
Equa
l var
iance
s assu
med
57.77
09.4
9146
40.0
000.7
780.0
820.6
170.9
39Eq
ual v
arian
ces n
ot as
sum
ed7.3
1212
9.527
0.000
0.778
0.106
0.568
0.989
Team
work
Equa
l var
iance
s assu
med
3.648
0.057
2.617
464
0.009
0.201
0.077
0.05
0.352
Equa
l var
iance
s not
assu
med
2.361
151.5
880.0
200.2
010.0
850.0
330.3
69
Prob
lem So
lving
Equa
l var
iance
s assu
med
31.62
30
7.456
464
0.000
0.612
0.082
0.451
0.774
Equa
l var
iance
s not
assu
med
6.097
136.5
740.0
000.6
120.1
000.4
140.8
11
Tim
e Man
agem
ent
Equa
l var
iance
s assu
med
37.72
50
4.603
464
0.000
0.37
0.080
0.212
0.527
Equa
l var
iance
s not
assu
med
3.715
134.8
920.0
000.3
70.0
990.1
730.5
66
Com
mun
icatio
nEq
ual v
arian
ces a
ssum
ed11
.402
0.001
3.947
464
0.000
0.312
0.079
0.157
0.467
Equa
l var
iance
s not
assu
med
3.416
144.6
210.0
010.3
120.0
910.1
310.4
93
Repo
rt W
ritin
gEq
ual v
arian
ces a
ssum
ed14
.702
04.8
6846
40.0
000.4
420.0
910.2
640.6
2Eq
ual v
arian
ces n
ot as
sum
ed4.2
0514
4.344
0.000
0.442
0.105
0.234
0.65
Lead
ersh
ipEq
ual v
arian
ces a
ssum
ed8.5
090.0
045.5
0746
40.0
000.4
760.0
860.3
060.6
46Eq
ual v
arian
ces n
ot as
sum
ed4.9
3515
0.417
0.000
0.476
0.096
0.285
0.666
Lear
ning
and
Inte
rper
sona
lEq
ual v
arian
ces a
ssum
ed42
.013
0-8
.293
464
0.000
-0.64
90.0
78-0
.803
-0.49
5Eq
ual v
arian
ces n
ot as
sum
ed-6
.425
130.1
430.0
00-0
.649
0.101
-0.84
9-0
.449
Ap
pen
dix
3:
Ind
epen
den
t S
amp
les
Test
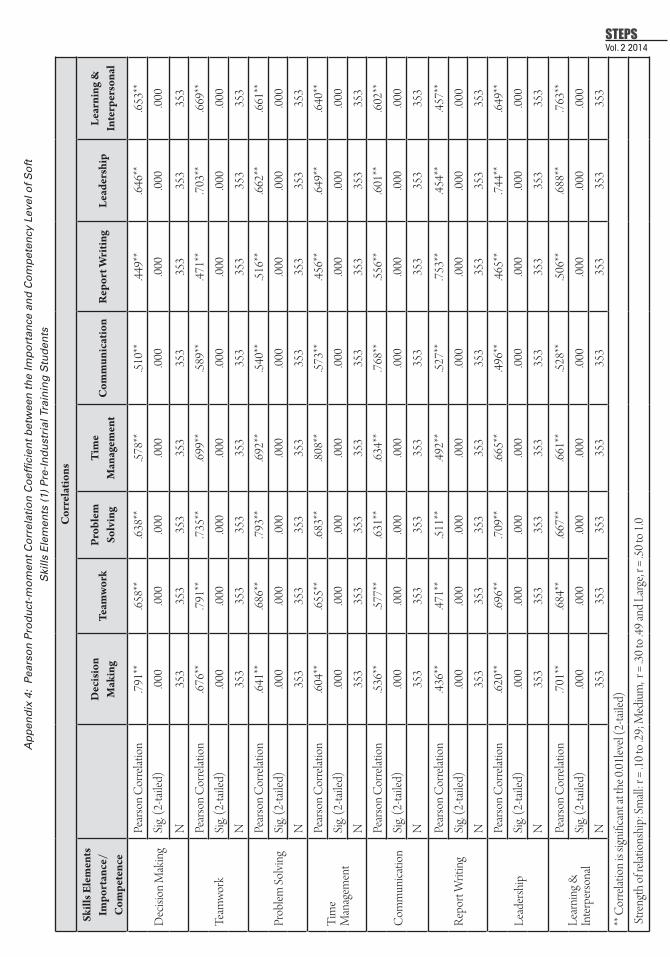
121
STEPSVol. 2 2014
Cor
rela
tions
Skill
s Ele
men
ts
Impo
rtan
ce/
Com
pete
nce
Dec
isio
n M
akin
gTe
amw
ork
Prob
lem
So
lvin
gT
ime
Man
agem
ent
Com
mun
icat
ion
Rep
ort W
ritin
gLe
ader
ship
Lear
ning
&
Inte
rper
sona
l
Dec
ision
Mak
ing
Pear
son
Cor
relat
ion
.791*
*.65
8**
.638*
*.57
8**
.510*
*.44
9**
.646*
*.65
3**
Sig.
(2-ta
iled)
.000
.000
.000
.000
.000
.000
.000
.000
N35
335
335
335
335
335
335
335
3
Team
work
Pear
son
Cor
relat
ion
.676*
*.79
1**
.735*
*.69
9**
.589*
*.47
1**
.703*
*.66
9**
Sig.
(2-ta
iled)
.000
.000
.000
.000
.000
.000
.000
.000
N35
335
335
335
335
335
335
335
3
Prob
lem So
lving
Pear
son
Cor
relat
ion
.641*
*.68
6**
.793*
*.69
2**
.540*
*.51
6**
.662*
*.66
1**
Sig.
(2-ta
iled)
.000
.000
.000
.000
.000
.000
.000
.000
N35
335
335
335
335
335
335
335
3
Tim
e M
anag
emen
t
Pear
son
Cor
relat
ion
.604*
*.65
5**
.683*
*.80
8**
.573*
*.45
6**
.649*
*.64
0**
Sig.
(2-ta
iled)
.000
.000
.000
.000
.000
.000
.000
.000
N35
335
335
335
335
335
335
335
3
Com
mun
icatio
n
Pear
son
Cor
relat
ion
.536*
*.57
7**
.631*
*.63
4**
.768*
*.55
6**
.601*
*.60
2**
Sig.
(2-ta
iled)
.000
.000
.000
.000
.000
.000
.000
.000
N35
335
335
335
335
335
335
335
3
Repo
rt W
ritin
gPe
arso
n C
orre
latio
n.43
6**
.471*
*.51
1**
.492*
*.52
7**
.753*
*.45
4**
.457*
*Si
g. (2
-taile
d).00
0.00
0.00
0.00
0.00
0.00
0.00
0.00
0N
353
353
353
353
353
353
353
353
Lead
ersh
ip
Pear
son
Cor
relat
ion
.620*
*.69
6**
.709*
*.66
5**
.496*
*.46
5**
.744*
*.64
9**
Sig.
(2-ta
iled)
.000
.000
.000
.000
.000
.000
.000
.000
N35
335
335
335
335
335
335
335
3
Lear
ning
&
Inter
perso
nal
Pear
son
Cor
relat
ion
.701*
*.68
4**
.667*
*.66
1**
.528*
*.50
6**
.688*
*.76
3**
Sig.
(2-ta
iled)
.000
.000
.000
.000
.000
.000
.000
.000
N35
335
335
335
335
335
335
335
3**
Cor
relat
ion
is sig
nific
ant a
t the
0.01
level
(2-ta
iled)
St
reng
th o
f rela
tions
hip:
Small
: r =
.10 t
o .29
; Med
ium
, r =
.30 t
o .49
and
Larg
e, r =
.50 t
o 1.0
Ap
pen
dix
4:
Pea
rso
n P
rod
uct
-mo
men
t C
orr
elat
ion
Co
effi
cien
t b
etw
een
th
e Im
po
rtan
ce a
nd
Co
mp
eten
cy L
evel
of
So
ft
Ski
lls E
lem
ents
(1)
Pre
-In
du
stri
al T
rain
ing
Stu
den
ts
Le
vene
’s Te
st fo
r Equ
alit
y t-
test
for E
qual
ity
of M
eans
of V
aria
nces
95%
Con
fiden
ce In
terv
al
of th
e D
iffer
ence
FSi
g.t
dfSi
g.
(2-t
aile
d)M
ean
Diff
eren
ceSt
d.
Erro
r D
iffer
ence
Low
erU
pper
Dec
ision
Mak
ing
Equa
l var
iance
s assu
med
57.77
09.4
9146
40.0
000.7
780.0
820.6
170.9
39Eq
ual v
arian
ces n
ot as
sum
ed7.3
1212
9.527
0.000
0.778
0.106
0.568
0.989
Team
work
Equa
l var
iance
s assu
med
3.648
0.057
2.617
464
0.009
0.201
0.077
0.05
0.352
Equa
l var
iance
s not
assu
med
2.361
151.5
880.0
200.2
010.0
850.0
330.3
69
Prob
lem So
lving
Equa
l var
iance
s assu
med
31.62
30
7.456
464
0.000
0.612
0.082
0.451
0.774
Equa
l var
iance
s not
assu
med
6.097
136.5
740.0
000.6
120.1
000.4
140.8
11
Tim
e Man
agem
ent
Equa
l var
iance
s assu
med
37.72
50
4.603
464
0.000
0.37
0.080
0.212
0.527
Equa
l var
iance
s not
assu
med
3.715
134.8
920.0
000.3
70.0
990.1
730.5
66
Com
mun
icatio
nEq
ual v
arian
ces a
ssum
ed11
.402
0.001
3.947
464
0.000
0.312
0.079
0.157
0.467
Equa
l var
iance
s not
assu
med
3.416
144.6
210.0
010.3
120.0
910.1
310.4
93
Repo
rt W
ritin
gEq
ual v
arian
ces a
ssum
ed14
.702
04.8
6846
40.0
000.4
420.0
910.2
640.6
2Eq
ual v
arian
ces n
ot as
sum
ed4.2
0514
4.344
0.000
0.442
0.105
0.234
0.65
Lead
ersh
ipEq
ual v
arian
ces a
ssum
ed8.5
090.0
045.5
0746
40.0
000.4
760.0
860.3
060.6
46Eq
ual v
arian
ces n
ot as
sum
ed4.9
3515
0.417
0.000
0.476
0.096
0.285
0.666
Lear
ning
and
Inte
rper
sona
lEq
ual v
arian
ces a
ssum
ed42
.013
0-8
.293
464
0.000
-0.64
90.0
78-0
.803
-0.49
5Eq
ual v
arian
ces n
ot as
sum
ed-6
.425
130.1
430.0
00-0
.649
0.101
-0.84
9-0
.449

122
Soft Skills in Polytechnic: Students’ Perspectives
Cor
rela
tions
Skill
s Ele
men
ts
Impo
rtan
ce/
Com
pete
nce
Dec
isio
n M
akin
gTe
amw
ork
Prob
lem
So
lvin
gT
ime
Man
agem
ent
Com
mun
icat
ion
Rep
ort
Wri
ting
Lear
ning
In
terp
erso
nal
Lead
ersh
ip
Dec
ision
Mak
ing
Pear
son
Cor
relat
ion
.705*
*.51
7**
.544*
*.49
0**
.481*
*.40
9**
.540*
*.44
9**
Sig.
(2-ta
iled)
00
00
00
00
N48
448
448
448
448
448
448
448
4
Team
work
Pear
son
Cor
relat
ion
.522*
*.77
0**
.489*
*.48
5**
.509*
*.39
1**
.495*
*.40
3**
Sig.
(2-ta
iled)
00
00
00
00
N48
448
448
448
448
448
448
448
4
Prob
lem So
lving
Pear
son
Cor
relat
ion
.579*
*.55
0**
.737*
*.48
4**
.539*
*.42
2**
.549*
*.43
3**
Sig.
(2-ta
iled)
00
00
00
00
N48
448
448
448
448
448
448
448
4
Tim
e M
anag
emen
t
Pear
son
Cor
relat
ion
.422*
*.49
0**
.474*
*.74
9**
.505*
*.45
1**
.477*
*.36
3**
Sig.
(2-ta
iled)
00
00
00
00
N48
448
448
448
448
448
448
448
4
Com
mun
icatio
n
Pear
son
Cor
relat
ion
.459*
*.52
7**
.490*
*.49
0**
.735*
*.47
0**
.559*
*.44
8**
Sig.
(2-ta
iled)
00
00
00
00
N48
448
448
448
448
448
448
448
4
Repo
rt W
ritin
gPe
arso
n C
orre
latio
n.40
5**
.440*
*.42
6**
.430*
*.47
5**
.689*
*.45
5**
.440*
*Si
g. (2
-taile
d)0
00
00
00
0N
484
484
484
484
484
484
484
484
Lead
ersh
ip
Pear
son
Cor
relat
ion
.498*
*.51
8**
.514*
*.47
2**
.568*
*.46
2**
.727*
*.47
7**
Sig.
(2-ta
iled)
00
00
00
00
N48
448
448
448
448
448
448
448
4
Lear
ning
&
Inter
perso
nal
Pear
son
Cor
relat
ion
.447*
*.45
6**
.494*
*.43
2**
.489*
*.46
4**
.493*
*.75
1**
Sig.
(2-ta
iled)
00
00
00
00
N48
448
448
448
448
448
448
448
4**
. Cor
relat
ion
is sig
nific
ant a
t the
0.01
leve
l (2-
taile
d).
Stre
ngth
of r
elatio
nshi
p: Sm
all: r
= .1
0 to
.29; M
ediu
m, r
= .3
0 to
.49 an
d La
rge,
r = .5
0 to
1.0
(2)
Th
e P
ost
-In
du
stri
al T
rain
ing

123
STEPSVol. 2 2014 Interest Development and
Influence on Study Success in Engineering: Case Studies of Malaysia and Australia
Maizam [email protected]
Aini Nazura [email protected],Technical and Vocational Education
Universiti Tun Hussein Onn Malaysia, Batu Pahat, Malaysia
Abstract
Ensuring tertiary technical and vocational education students graduate on time is highly desirable as study extension can be very costly to the stakeholders. Interest has been found in some studies to be a key contributing factor towards students’ success in higher education while culture can play a major role in interest development. This paper aims to highlight the differences in intrinsic interest of students in Malaysia and Australia that are attributable to cultural variations. This study was conducted on 132 Malaysian and 135 Australian final year engineering students who completed the Study Process Questionnaire (R-SPQ-2F) scale. Correlation coefficient analysis based on the quantitative data indicated positive correlation between intrinsic interest and academic performance for Australian but not for Malaysian students. Interview data provided some explanations for the outcomes that relates to cultural differences. Findings of the current study indicated more similarities rather than differences between interest characteristics of the students in Malaysia and Australia.
Keywords: interest, performance, cultural diversity
Introduction
Technical and vocational education and training (TVET) provision incurs high financial cost to a developed as well as a developing nation that strives to meet the technical and vocational workforce needs of its nation. It is therefore, crucial to get as many students in any given TVET programs to graduate on time. Thus, high students’ attrition rates in tertiary TVET related programs has been of great concern worldwide for the past 15 years (Davis, Clara, & Sullivan, 2007; Godfrey, Aubrey, & King, 2010; Seymour, 1995). Especially for the engineering discipline, Godfrey (2010) has raised several concerns in Australia such as the higher attrition rate in engineering compared to other science disciplines (e.g., medicine and veterinary science); lower number of migration into engineering from other disciplines than out of engineering to other disciplines; higher attrition rate among locals compared to international students; higher attrition and failure rates for male compared to female students (male are dominant in the course which is about 15% higher than female). With the retention rate at about 85% per year, this situation has led to 52% active enrolment or eligible to graduate after four years.
Cor
rela
tions
Skill
s Ele
men
ts
Impo
rtan
ce/
Com
pete
nce
Dec
isio
n M
akin
gTe
amw
ork
Prob
lem
So
lvin
gT
ime
Man
agem
ent
Com
mun
icat
ion
Rep
ort
Wri
ting
Lear
ning
In
terp
erso
nal
Lead
ersh
ip
Dec
ision
Mak
ing
Pear
son
Cor
relat
ion
.705*
*.51
7**
.544*
*.49
0**
.481*
*.40
9**
.540*
*.44
9**
Sig.
(2-ta
iled)
00
00
00
00
N48
448
448
448
448
448
448
448
4
Team
work
Pear
son
Cor
relat
ion
.522*
*.77
0**
.489*
*.48
5**
.509*
*.39
1**
.495*
*.40
3**
Sig.
(2-ta
iled)
00
00
00
00
N48
448
448
448
448
448
448
448
4
Prob
lem So
lving
Pear
son
Cor
relat
ion
.579*
*.55
0**
.737*
*.48
4**
.539*
*.42
2**
.549*
*.43
3**
Sig.
(2-ta
iled)
00
00
00
00
N48
448
448
448
448
448
448
448
4
Tim
e M
anag
emen
t
Pear
son
Cor
relat
ion
.422*
*.49
0**
.474*
*.74
9**
.505*
*.45
1**
.477*
*.36
3**
Sig.
(2-ta
iled)
00
00
00
00
N48
448
448
448
448
448
448
448
4
Com
mun
icatio
n
Pear
son
Cor
relat
ion
.459*
*.52
7**
.490*
*.49
0**
.735*
*.47
0**
.559*
*.44
8**
Sig.
(2-ta
iled)
00
00
00
00
N48
448
448
448
448
448
448
448
4
Repo
rt W
ritin
gPe
arso
n C
orre
latio
n.40
5**
.440*
*.42
6**
.430*
*.47
5**
.689*
*.45
5**
.440*
*Si
g. (2
-taile
d)0
00
00
00
0N
484
484
484
484
484
484
484
484
Lead
ersh
ip
Pear
son
Cor
relat
ion
.498*
*.51
8**
.514*
*.47
2**
.568*
*.46
2**
.727*
*.47
7**
Sig.
(2-ta
iled)
00
00
00
00
N48
448
448
448
448
448
448
448
4
Lear
ning
&
Inter
perso
nal
Pear
son
Cor
relat
ion
.447*
*.45
6**
.494*
*.43
2**
.489*
*.46
4**
.493*
*.75
1**
Sig.
(2-ta
iled)
00
00
00
00
N48
448
448
448
448
448
448
448
4**
. Cor
relat
ion
is sig
nific
ant a
t the
0.01
leve
l (2-
taile
d).
Stre
ngth
of r
elatio
nshi
p: Sm
all: r
= .1
0 to
.29; M
ediu
m, r
= .3
0 to
.49 an
d La
rge,
r = .5
0 to
1.0

124
Interest Development and Influence on Study Success...
Similarly in Malaysia, the situation is also in need of much effort to ensure engineering students graduate on time at the polytechnic and university level. A number of studies have shown that higher-education students are at a risk of dropping out if they lack self-confidence, interest and motivation to achieve success (Lotkowski, Robbins, & Noeth, 2004; Seymour, 1995). In the theory of involvement, Astin (1984) suggested interest as one important indicator for students to be deeply involved in their course of study. Since lack of interest and poor academic results have been consistently cited as one of the primary reasons why students leave a program (Caroline & Fitzgerald, 2000; Godfrey et al., 2010; Veenstra, Dey, & Herrin, 2009) with similar scenario being observed in engineering, focusing on how to promote learning involvement among engineering students is of critical importance. Engineering courses, however, pose unique challenges to students as it requires the integration of theoretical and practical knowledge of the sciences and mathematics as well as the assimilations of the non-technical skills. The comment made by one student who was enrolled in both engineering and a commerce course illustrates the point.
“I think the one thing engineering had taught me was definitely teamwork because if I compare it to commerce again there is no teamwork skill, it was not taught in commerce at all. It was like delegating tasks, doing that and bringing them all together. We interact in a quite different way like, listening to other people, not just your own point of view or how you think it would be.”
The comments also highlight the importance of social interaction in the engineering learning. The current study investigates interest development in learning at a Malaysian and Australian university. The way interest is developed and its role towards success is expected to be different between Australian and Malaysian students are due to cultural differences in learning (Hofstede,1986). The most noticeable attribute is that Malaysians possesses the largest power distance while Australian possesses the highest individualism based on the survey among over forty countries. Such a large gap is likely to influence the way interest is developed among the students at both countries. Consistent with this assumption, interest has been found to be a contributing factor towards success among Australian students in the past (Niles, 1995). While in Malaysia, the situation is expected to be different because students’ motivation to study has been shown to be highly driven by external factors (Alias & Abu Bakar, 2010).
Thus, to begin the exploration, the current study will focus on seeking a better understanding of students’ interest, as a contributing factor towards success in engineering studies in the two countries. The findings from this study will provide a greater understanding on interest development and its influence on study success within diverse cultural contexts which will promote the effectiveness of engineering education in particular and TVET in general.
Literature Review
Interest is one of the affective attributes that has become the focus in this research since it has been acknowledged as one of the critical indicators of success in higher education. Interest in general is defined as positive feelings or emotions such as pleasure or happiness (Dewey, 1913) resulting from active interaction with environmental factors. Hidi and Renninger (2006) defined interest as a psychological state of engaging or the predisposition to reengage with particular classes of objects,
125
STEPSVol. 2 2014
event, or ideas over time (p.2). The same concept can also be linked to an individual’s disposition, preferences or enthusiasm (Renninger, Hidi, & Krapp, 1992).
Interest in learning could emerge before, during or after a learning process as a result of interactions between the student and the learning environment (e.g., learning activity and learning material). According to Renninger et al. (1992), interest is created when an individual experiences one of the following three situations: (i) increased knowledge, (ii) positive emotions, and (iii) increased reference value. A lecturer who has the ability to deliver a good lecture and interact well with students could engage students’ attention, which could be due to the positive feeling from the experiences. The presence of interest can be observed through the way students behave such as paying attention or through an emotional expression such as excitement (Hidi & Renninger, 2006).
Interest is a dynamic feeling that can be inculcated or reduced naturally. The level of interest is normally different from one person to another depending on the level of motivation generated during the learning processes. The motivation can be either intrinsically or extrinsically motivated (Deci & Ryan, 1985). Interest that are intrinsically motivated is sometimes called intrinsic interest and is often intention or goal driven (Bandura & Skunk,1981). When people achieve a goal that they aimed for such as mastering a desired skill or achieving a desired level of performance, they feel satisfied. The feeling of satisfaction could enhance greater level of intrinsic interest which can eventually develop into personal interest. Personal interest indicates the highest level of intrinsic interest or a well-developed interest and is linked to an individual’s dispositions, preferences, and enthusiasm. It is not automatically activated (Bandura & Skunk, 1981), is developed over time and is usually sustained for a long period of time (Dewey, 1913; Pintrich, 1999; Renninger et al., 1992). If a student has a personal interest in a typical subject, he/she will create their own learning activity or find extra learning material that is not related to their subject syllabus. Learning in this situation is more self-directed, and students are often willing to spend extra time exploring more about the topic of interest. Also, if students approach learning with personal interest, any new information is easier to be absorbed. According to Bandura and Skunk (1981), research on intrinsic interest focused primarily on interest that is already present and finding ways to maintain the interest.
Interest that is extrinsically motivated often generates situational interest. Situational interest, can be observed through emotional expression, such as “I like” or “I enjoy”. Any object or learning material that is attractive (e.g., colourful) can foster situational interest (Pintrich, 2003). This type of interest is usually temporary in nature but such interest is likely to be maintained if the situational interest becomes a personal interest. Research on situational interest focuses primarily on investigating motivational sources of interest. Situational interest has been shown to influence learning and performance through better engagement in class (Deci, 1992) and conceptual change (Kang, Scharmann, Kang, & Noh, 2010).
As discussed, there are two different categories of interest, personal interest and situational interest. Based on these two categories, Hidi and Renninger (2006) propose four categories of interest development: (i) a triggered situational interest (ii) a maintained situational interest (iii) an emerging individual interest and (iv) a well-developed individual interest, which resulted from a short-term and long-term effect of motivation received in class. The development process can also be linked to the Krathwohl’s taxonomy of affective domain (Krathwohl, Bloom, & Masia, 1964) as

126
Interest Development and Influence on Study Success...
shown in Figure 1. Hidi and Renninger, (2006) further discussed interest development in details via four cascades of steps which can be linked to interest development in a learning process. The first stage is a triggered situational interest or situational interest which refers to a short term interest that may be triggered when a student experiencing a surprising information, an exciting learning process or increasing of knowledge. The second stage is a maintained situational interest which could involve better engagement and establishment of a self-directed learning activity to sustain the situational interest. The third stage, on the other hand, is an emerging individual interest. This could be established after the students have started to value the experiences and knowledge gathered from the learning process. Students might be volunteered to participate again if they have the opportunity to participate again in the learning activity. The final stage is a well-developed individual interest (also called personal interest or individual interest). Students who possess this level of interest are expected to be self-independent in learning, highly engaged and focus efforts on learning. Students of this category may also establish multiple learning strategies and develop resourcefulness to accomplish their goal even facing obstacles in the learning process.
The illustrations in Figure 1 below illustrate the stages in the affective development of Krathwohl’s taxonomy (Krathwohl, Bloom, & Masia, 1964) and the possible linkage with the aforementioned stages of interest development (Hidi & Renninger, 2006). Progression from Stage 1 to Stage 5 of Krathwohl’s taxonomy represents an increment in the internalization of interest, attitudes, and value. Based on this taxonomy, interest can presumably be generated in line with the development of affective attributes beginning from receiving information when acquiring new knowledge (e.g., while listening to discussion or seeing a demonstration) to a well-developed interest which is expected to form a personal characterization accompanying engagement in learning. Having inquiries in mind that need answers can encourage students to respond in class, or to find more information on the topics outside of class. Satisfaction in response could generate enjoyment and leads to greater level of interest (Bandura & Schunk, 1981; Krathwohl et al., 1964). If students find that the information is useful, they might begin valuing, or appreciate the new knowledge, show greater curiosity and commitment to or having deep interest in developing understanding about the knowledge. Students may start to create their own learning schedule out of formal learning (organizing), presumably, this is also a sign of interest development towards personal interest (well-developed interest). Interest that is well-developed becomes personal interest. At this level, students are expected to possess greater self-efficacy (Bandura & Schunk, 1981), feel autonomous and self-determined in learning (Pintrich, 2003), all of which are believed important behaviors to succeed in engineering.
Figure 1: Illustration of connections between stages in interest development (Hidi &
Renninger, 2006) and affective development in learning (Krathwohl et al., 1964).

127
STEPSVol. 2 2014
Observations made on the educational objectives revealed that the current engineering syllabus only covers the first three levels of the internalization process, namely receiving, responding, and valuing. By linking the development process with the four phase model of interest development (Hidi & Renninger, 2006), these three stages are expected to be devoted to the formation of individual interest (stage three) as demonstrated in Figure 1. At this stage, students begin to generate curiosity, positive feelings, and stored value, all of which can generate deeper interest in studying (Hidi & Renninger, 2006), perhaps better engagement in the course.
Methodology
Participants and Study Location: This study was conducted among Civil, Electrical and Mechanical Engineering undergraduates studying in an institution in Malaysia and Australia. Questionnaire surveys were distributed to final year students, with 267 respondents to the questionnaires (NMY=135, NAU = 132). Final year engineering undergraduates were selected as these students have completed approximately 80% of the engineering program. They are assumed to have developed a particular interest attributes towards learning in engineering. Semi-structured interview sessions were conducted simultaneously with the similar participants. There were sixteen volunteers participated, and were interviewed to share their learning experiences throughout the study.
Only one institution was selected in each country due to practical and resource considerations that limit breadth of selection. This study involved the use of two sets of questionnaire that contain measures of the other learning factors. One of the questionnaires is charged according to the number of respondents thus only a limited numbers of engineering courses could be selected in the absence of research grant or subsidy. Furthermore, the courses from which students were selected must also be offered at both institutions which put another constraint on the selection of institutions. Nevertheless, the numbers of participants are still within the acceptable range (more than 85) to perform the Pearson correlation analysis as recommended by Chuan (2006).
Measures and Process: The revised version of the Study Process Questionnaire (R-SPQ-2F) (Biggs, Kember, & Leung, 2001) was distributed to the participants. With the purpose of understanding the intrinsic interest of the students, only five items relevant to intrinsic interest over twenty items were used. The other items were excluded as they are measuring learning strategy and are linked to an external driving factor. These five items were matched with the three early phases of interest development (Hidi & Renninger, 2006) and were labelled as TI (triggered interest), MI (maintained interest), and EI (emerging individual interest).
A good internal consistency was derived for the interest construct with a Cronbach alpha coefficient of 0.70. The participants were asked to state their level of agreements towards given statements (Table 1) on a scale of 1-5, with 1 being strongly agreed and 5 strongly disagreed.

128
Interest Development and Influence on Study Success...
The performance of the students was measured by the average results to represent success. Thus, the Cumulative Grade Point Average (CGPA) (for Malaysian students) and marks (for Australian students) throughout the program were obtained from university records. Descriptive statistics and correlation coefficient analysis were conducted on the quantitative data with the aid of SPSS Version 19 software. The strength of relationships between intrinsic interest measures and performance were examined using the Pearson Product Moment correlation method – a suitable method as suggested by Pallant (2007)- upon determining that the data met the assumptions of linearity in associations and normality in distributions.
Qualitative data were gathered through semi-structured interviews to support and further explain the quantitative data. Eight Malaysian and eight Australian students volunteered to be interviewed. The semi-structured interview was carried out to provide a free-flowing discussion and allow participants to share their learning experiences throughout the course. This type of interview offers great flexibility in obtaining information about interest attributes of the participants. The first stage of the interview analysis involved the extraction of intrinsic interest related behaviors. The interest attributes identified for the two country groups were then combined and compared to capture any similarities and differences. The semi structured interview data were analyzed with the aid of the NVIVO 9.0 software.
Results and Discussions
Results of means and correlation coefficient analysis are shown in Table 2. Findings of means in the Table 2 showed that Malaysian students tended to rate interest items as more applicable to them than the Australians did (MMY ==3.75; MAU = 3.06). The findings also revealed that intrinsic interest was not significantly correlated with performance for the Malaysian participants (rMY=.137, p>0.05). Only one of the items had a statistically significant and positive correlation with performance which is “studying gives me a feeling of deep personal satisfaction”, (rMY = 0.185*, p>0.05). It is apparent that correlation does not exist (almost zero) for items related to a triggered interest (TI). The results seem to suggest that the learning process may not help foster the development of situational interest and only a higher level of interest can contribute to higher achievement of the Malaysian students. The sensitivity of
Intrinsic Interest Items Label
I find that studying gives me a feeling of deep personal satisfaction.
Deep personal satisfaction
I feel that virtually any topic can be highly interesting once I get into it.
Understanding leads to interest
I find that studying academic topics can at times be as exciting as a good novel or movie.
Exciting Feelings
I work hard at my studies because I find the material interesting.
Interest leads to hard work
I come to most classes with questions in mind that I want answers.
Deep query in mind/curiosity
Table 1: Intrinsic Interest items of R-SPQ-2F scale
Note: TI – triggered interest; MI - maintained interest; EI- emerging individual interest.

129
STEPSVol. 2 2014
the language used is another concern. Since Malaysian students tend to be bounded by a high power distance (Hofstede, 1986), not relating interest feeling with external factors (e.g.. family, friends or lecturer) may have caused the insignificant relationship between the interest measures and study performance.
Even though the Australian students indicated a low of intrinsic interest based on the means, this construct is strongly correlated with their performance (rAU=.212**, p<0.01). Only two of the items correlated significantly with performance. The items were “I find that studying academic topics can at times be as exciting as a good novel or movie” (rAU=.204*, p<0.05) and “I work hard at my studies because I find the material interesting” (rAU=.246**, p<0.01). The results also suggest that students who possess lower level of interest (TI and MI) might have a potential to succeed but, higher level of interest does not guarantee success. This finding also lends support to Niles (1995) whose research revealed that Australian students exhibited strong interest in the way they approach learning. This study found that getting an understanding can help foster their interest and possessing stronger interest can potentially influence their study performance.
Finding of this study might support previous notion that engineering curriculum only emphasize on the first three level of affective development (Krathwohl et al., 1964). Undoubtedly, assisting students to develop these early phases of interest is still crucial to foster the emergence of intrinsic interest. Participants from both countries rated “deep enquiry in mind” of emerging intrinsic interest (EI) category as the least applicable to them (MMY ==3.43; MAU = 2.57). This finding reflects that engineering students could be more inclined to study topics as suggested in class with less intention to gain further knowledge about the topics. Based on this finding, we could assume that the current engineering curriculum only foster the development of situational interest but not personal interest. Since there is only one item representing the EI category, this notion is not fully supported.
As shown in Table 2, most of the interest measures did not significantly correlate with student performance of the two groups. Possessing interest in studying engineering topics might only encourage greater involvement and engagement in studying (Astin, 1984) but less influence on performance. This result may be explained by the fact that
Min (M)Correlation Coef. with performance
(r)
MMY MAU rMY rAU
Code Intrinsic Interest 3.75 3.06 .137 .212**
TI Understanding leads to interest 4.07 3.27 -.071 .115
TI Exciting Feelings 3.55 2.95 .002 .204**MI Deep personal satisfaction 3.99 3.37 .185* .123MI Interest leads to hard work 3.69 3.16 .164 .246**EI Deep query in mind 3.43 2.57 .165 .001
Table 2: Means and correlation coefficients
Note: MI- maintained interest; TI – triggered interest; EI- emerging individual interest
MMY- Means of Malaysian data MAU - Means of Australian data, r = correlation coefficient
130
Interest Development and Influence on Study Success...
a mere interest without other successful characteristic behaviors (i.e., commitment, effort or meaningful understanding) have no influence on engineering student performance (Rotgans, 2009). The outcomes of the interviews and the discussions provide a detailed explanation of each interest attribute to further understand the participants’ behaviors.
Deep Personal Satisfaction
The first interest item, “studying gives me a feeling of deep personal satisfaction”, was the only item that predicts academic performance of the Malaysian participants. Although this item does not predict performance of the Australian participants, analysis of the interview data indicate that slightly more Australians discussed getting a satisfied feeling during or after going through the learning process. The Malaysian participants discussed the feeling of satisfaction when they achieve success in their studies. One of the participants mentioned that he feels satisfied when he has succeeded after putting worthwhile effort in studying:
“For certain subjects like Geomatics, we need to work outside of campus like…do a measurement of building. It was a long and very tiring process. But when I got A for that subject, it was like a deep satisfying feeling. I never regretted taking this course. It was worthwhile to be in this course.” [Malaysian, Civil engineering]
Comments made by the Australian participants revealed that students feel satisfied after going through a learning process. Getting an understanding after putting high effort in studying, acquiring new knowledge and skills and, having sufficient learning materials to facilitate readings, were regarded as some of the situations that have triggered the feelings. According to one participant:
“They taught us a topic in a lecture and I will go through the lecture notes. If I do not understand, I will go to other resources to try and find answers to what I don’t understand from the lecture notes. So I would go to online resources or I will go to the uni library to get the books out and look for answers there. And if not, I would go to my classmates and ask for their opinion on the topic and then if I am happy with all the information that I have gathered, I’ll be satisfied.” [Australian, Electrical engineering]
Another substantial difference seen between the two country groups was that the Malaysian students expressed their feeling of satisfaction about personal achievements or achieving success after studying while Australian students reflected on the feeling of satisfaction that are involved during studying. This variation may reflect the difference in their personal goal achievements in which the Malaysians only “feel enough” when they have succeeded while the Australian feels overly satisfied when valuing the benefits gained while studying.
Understanding Leads to Interest
The second interest item asked if the students feel that “virtually any topics can be highly interesting once I get into it”, which conveys the first level of interest development. The interest feelings are triggered after they managed to get the understanding about the topic. Although the item did not statistically predict the study
131
STEPSVol. 2 2014
performance of the Malaysians and Australians, ten participants discussed situations that could explain this behavior. A sample response from the two participants indicated that:
“When I enrolled in Satellite course last semester, I found that the way it was being taught quite different as compared to the other classes. During the lecture, the lecturer actually taught us to use imagination as if we were in the satellite. To begin the course with that kind of exposure has made the learning process became interesting.”[Malaysian, Mechanical engineering]
“I did one subject, it was a great feeling when they teach you and you can get it the first time. Information is flowing into you. That is really a great feeling, as opposed to normally, when you attend a lecture, and you do not know what they are talking about. Then there’s a huge amount of study required to try and understand it.” [Australian, Electrical engineering]
Their experiences are consistent with Renninger et al.’s (1992) assumption which says that interest can be possibly inculcated naturally when an individual is experiencing increment in his/her knowledge. Students who have developed interest are willing to put higher commitment to learning more about the topics as demonstrated by the Australian participant.
Exciting Feelings
The interview analysis also revealed that there were four participants who shared their exciting feeling which can explain the item “I find that studying academic topics can at times be as exciting as a good novel or movie”. This item was significantly correlated with performance of the Australian participants only. Being excited or enthusiastic is considered a positive emotion of energetic interest in a particular subject or activity and it is functioning as a driving or motivational factor to perform behaviors (Barkle, 2010). Examples of comments made by the participants:
“I constantly feel enthusiastic when it comes to learning engineering topics. When I am being scolded or criticized, I would accept and continue learning until I achieve my target.” [Malaysian, Civil engineering]
“It seems to me that all the physics related topics are really exciting. It is not easy, it is definitely not easy, but when I go to the class, everyone’s enthusiastic, the lecturer is enthusiastic, and they do demonstrations. I have seen it a million times, they still bring it out so every time you see it, they seem enthusiastic, to be enthusiastic to teach. It is just enthusiastic.” [Australian, Electrical engineering]
There is no predictive correlation found between this item and academic performance for the Malaysian participants. One possible reason is because the question asked was culturally biased. Hobbies like reading novels and watching movie can be considered as exciting activities for people in a certain culture but such hobbies may be slightly mismatched with Malaysians hobbies. In Malaysia, students are more likely to visit a shopping mall and do social activities with friends (Ahmed, Ghingold, & Dahari, 2007).

132
Interest Development and Influence on Study Success...
Interest Leads to Hard Work
The other reflection on intrinsic interest was related to the item “I work hard at my work because I find the material interesting”. Students exhibited an intermediate level of interest and are willingly to do extra activities which consequently helped them maintaining the interest. This item significantly predicted academic performance of Australians but not Malaysians. As commented by an Australian participant:
“I am always interested in seeing how things work, doing things as much as practical application and science stuff. That was why I chose engineering. I used to always get out all the appliances, whenever we upgraded appliances I always take the old appliances into my study room and rip them apart and try to find how it is actually working”. [Australian, Mechanical engineering]
He further shared the most valuable experience he had while accomplishing his final year group project. His deep interest on the practical side of engineering has motivated him to put in more effort and to be more actively engaged with the project.
“The formula SAE team, was by far the best thing I have ever done. It was fully hands on. Like, at first half of the year you design a car and then second half you ended up building it. So it was actually the manufacturing stage that I really enjoyed and constructing this car and taking it out to the competition yeah, just the hands on aspect of it…You get something tangible and at the end you know how to play around with it and you have to deal with the actual work problem. This is real engineering. This is what I feel deeply interested in and I want to get into.”
In a similar vein, a Malaysian participant did comment that he was willing to spend his free time to explore more about a learning activity that is of interest.
“I always spend my free time going to the site because I am attracted to see the real working environment. One of my friends work at the site, so I went there so that I can see how he does some work, for example, build column and handle workers.” [Malaysian, Civil engineering]
Both of the reflections lend support to Pintrich’s (2003) study which explained that interest in a particular learning activity or topic can lead students’ intention to learn more about it. In both cases, the students put extra effort on the learning activity in order to maintain their interest. Therefore, having an interest in a particular topic or task is seen as important to increase students’ intention and effort to learn effectively.
Deep Query in Mind
Although there was no correlation found between this item and students’ performance at both locations, a reflection made by a Malaysian participant could explain the situation.
“Before the next topic is taught, I will read it beforehand. If I do not understand, I will ask the lecturer. Not in class, but after class. I will ask even if it is a simple question, just to make sure that I have the correct understanding. If the lecturer can’t give satisfactory answer, I will ask other lecturers. I would love to hear from the experts in
133
STEPSVol. 2 2014
the field, which I often do in class. I will ask questions even though it is not interesting enough.” [Malaysian, Mechanical engineering]
The reflection made by the participant conveyed that this item might not purely relate to interest. This situation describes that even though the topics learned are not interesting, she used several strategies to get deeper understanding of the topics such as read topics before lecture or ask lecturer and experts in the field. Curiosity in this context might be closely related to the intention to get the understanding.
In general, the identification of intrinsic interest behaviors related to satisfaction and excitement, as well as sustaining interest through understanding and extra work verified the quantitative findings. Although the findings of the quantitative study revealed contrasting results between Malaysia and Australia, there was no major difference found for the interview outcomes. Interestingly, participants in the two countries did also reflect on interest behaviors that were not significantly correlated with performance. This result may be explained by the fact that a mere interest without other successful characteristic behaviors (e.g., commitment, initiative or meaningful understanding) may have no influence on students’ performance in technical related field (Rotgans, 2009).
It is also important to highlight that, participants in both countries were not merely experiencing interest through enjoyment and satisfaction in the learning process, but they also developed interest after managing to understand the content. The participants also maintained their interest through effort (hard work) and active involvement in learning. Findings of the qualitative study revealed that interest might complement cognitive ability of the students to influence their success. Additionally, having interest could also motivate students towards the establishment of other positive attitude such as putting extra time, acquiring more knowledge, in depth exploration and knowledge sharing on topics.
Conclusions
This study sets out to investigate similarities and differences between Malaysian and Australian engineering students with respect to their intrinsic interest in the hope to better understand how success in engineering program can be enhanced. Findings of the current study indicate more similarities rather than differences between the two engineering students’ population, Malaysia and Australia. Overall, the data provide support on the importance of interest as an indicator of success for engineering undergraduates. Since study success is also closely linked to study persistence, there is an urgent need for educators to better understand how they can help and nurture interest development - which support persistence - in their classes in order to retain more students in their programs. Although, the population under study were specifically on engineering students, the findings are expected to be applicable to students enrolled in TVET programs of similar nature.
Keeping in mind that the interest attributes explored in this study were not comprehensive enough to provide a detailed overview on students’ intrinsic interest, it is suggested that future research on interest consider additional information of other interest related behaviors to enable a meaningful conclusion being made on the role of interest towards success in engineering programs.
134
Interest Development and Influence on Study Success...
References
1. Ahmed, Z. U., Ghingold, M., & Dahari, Z. (2007). Malaysian shopping mall behavior : An exploratory study. Asia Pacific Journal of Marketing and Logistics, 19(4), 331–348.
2. Alias, M., & Abu Bakar, M. N. F. (2010). Factors contributing to program choice and subsequent career selection among engineering students. In The 3rd Regional Conference on Engineering Education (RCEE 2010) and Research in Higher Education 2010 (RHEd 2010). Kuching, Sarawak.
3. Astin, A. W. (1984). Student involvement : A developmental theory for higher education. Journal of College Student Development, (July), 518–529.
4. Bandura, A., & Schunk, D. H. (1981). Cultivating competence, self-efficacy, and intrinsic interest through proximal self-motivation. Journal of Personality and Social Psychology, 41(3), 586–598.
5. Barkle, E. F. (2010). Student Engagement Techniques: A Handbook for College Faculty. United States: John Wiley & Son, Inc.
6. Biggs, J., Kember, D., & Y.P.Leung, D. (2001). The revised two-factor Study Process Questionnaire: R-SPQ-2F. British Journal of Educational, 71, 133–49.
7. Caroline, B., & Fitzgerald, G. (2000). Motivation and attrition in engineering students. European Journal of Engineering Education, 25(2), 145–155.
8. Chuan, C. L. (2006). Sample size estimation using Krejcie and Morgan and Cohen stastical power analysis: A comparison. Jurnal Penyelidikan IPBL, 7, 78–86.
9. Davis, R. E., Clara, S., & Sullivan, K. (2007). Why do / don’t they stay? Some preliminary results of an engineering retention study. Journal of Engineering Education, 1–6.
10. Deci, E. L. (1992). The relation of interest to the motivation of behavior: A Self-Determination Theory perspective. In K. A. Renninger, S. Hidi, & A. Krapp (Eds.), The Role of Interest in Learning and Development (pp. 43–70). New Jersey: Lawrence Erlbaum Associates.
11. Dewey, J. (1913). Interest and Effort in Education (pp. 1–96). Boston: Riverside Press.
12. Godfrey, E., Aubrey, T., & King, R. (2010). Who leaves and who stays? Retention and attrition in engineering education. Journal of Engineering Education, 5(2), 26–40.
13. Hartman, H., & Hartman, M. (2006). Leaving engineering : Lessons from Rowan University ’ s College of Engineering. Journal of Engineering Education, 95(1), 49.
135
STEPSVol. 2 2014
14. Hidi, S., & Anderson, V. (1992). Situational interest and its impact on reading and expository writing. In The Role of Interest in Learning and Development (pp. 215–238). New Jersey: Lawrence Erlbaum Associates.
15. Hidi, S., & Renninger, K. A. (2006). The four-phase model of interest development. Educational Psychologist, 41(2), 111–127.
16. Hofstede, G. (1986). Cultural differences in teaching and learning. International Journal of Intercultural Relations, 10, 301–320.
17. Kang, H., Scharmann, L. C., Kang, S., & Noh, T. (2010). Cognitive Conflict and Situational Interest as Factors Influencing Conceptual Change. International Journal of Environmental & Science Education, 5(4), 383–405.
18. Krathwohl, D. R., Bloom, B. S., & Masia, B. B. (1964). Taxonomy of educational objectives: The classification of educational goals. Handbook II: Affective Domain. New York: David McKay Company.
19. Lotkowski, V. A., Robbins, S. B., & Noeth, R. J. (2004). The Role of Academic and Non-Academic Factors in Improving College Retention. Iowa.
20. Niles, F. S. (1995). Cultural differences in learning motivation and learning strategies: A comparison of overseas and Australian students at an Australian university. International Journal of Intercultural Relationship, 19(3), 369–385.
21. Pallant, J. (2011). Survival Manual: A step by step guide to data analysis using SPSS for Windows (4th ed.). New York: Mc Graw-Hill.
22. Pintrich, P. R. (1999). The role of motivation in promoting and sustaining self-regulated learning. International Journal of Educational Research, 31(6), 459–470.
23. Pintrich, P. R. (2003). A motivational science perspective on the role of student motivation in learning and teaching contexts. Journal of Educational Psychology, 95(4), 667–686.
24. Renninger, K. A. (2007). Interest and motivation in informal science learning. Learning Science in Informal Environments, 1–45.
25. Renninger, K. A., Hidi, S., & Krapp, A. (1992). The role of interest in learning and development. New Jersey: Lawrence Erlbaum Associates.
26. Rotgans, I. J. (2009). Motivation, achievement-related behaviors, and educational outcomes. Erasmus University Rotterdam.
27. Seymour, E. (1995). The loss of women from science , mathematics , and engineering undergraduate majors : An explanatory account. Science Education, 79(4), 437–473.
136
Interest Development and Influence on Study Success...
28. Veenstra, C. P., Dey, E. L., & Herrin, G. D. (2009). A model for freshman engineering retention. Advances in Engineering Education, 1–33.
29. Walden, S. E., & Foor, C. (2008). What’s to keep you from dropping out? Student immigration into and within engineering. Journal of Engineering Education, 97(2), 191–205.

137
STEPSVol. 2 2014

138
Scholarly Technical Education Publication Series