stereotypical occupational segregation & gender inequality
TRANSCRIPT

DEPARTMENT OF ECONOMICS
Stereotypical Occupational Segregation & Gender Inequality: An Experimental Study
Savita Kulkarni Neeraj Hatekar
WORKING PAPER UDE40/12/2012
DECEMBER 2012
ISSN 2230-8334
DEPARTMENT OF ECONOMICS UNIVERSITY OF MUMBAI
Vidyanagari, Mumbai 400 098.
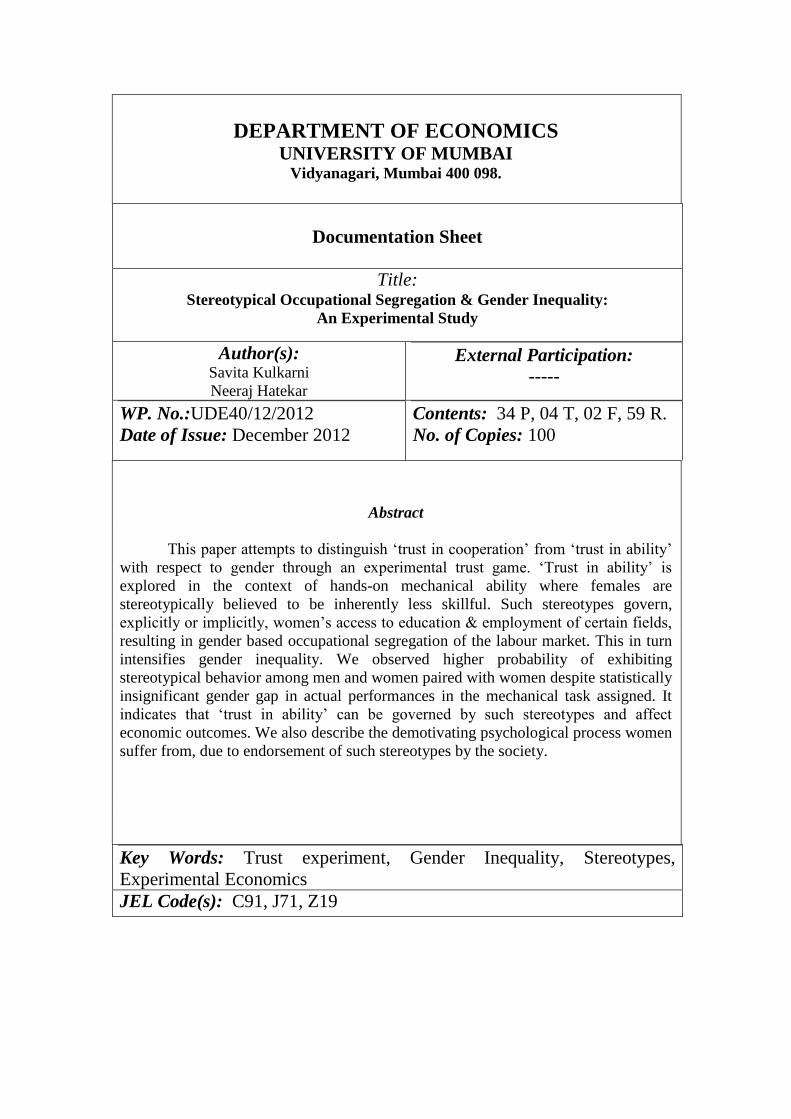
Documentation Sheet
Title: Stereotypical Occupational Segregation & Gender Inequality:
An Experimental Study
Author(s): Savita Kulkarni
Neeraj Hatekar
External Participation:
-----
WP. No.:UDE40/12/2012
Date of Issue: December 2012
Contents: 34 P, 04 T, 02 F, 59 R.
No. of Copies: 100
Abstract
This paper attempts to distinguish „trust in cooperation‟ from „trust in ability‟
with respect to gender through an experimental trust game. „Trust in ability‟ is
explored in the context of hands-on mechanical ability where females are
stereotypically believed to be inherently less skillful. Such stereotypes govern,
explicitly or implicitly, women‟s access to education & employment of certain fields,
resulting in gender based occupational segregation of the labour market. This in turn
intensifies gender inequality. We observed higher probability of exhibiting
stereotypical behavior among men and women paired with women despite statistically
insignificant gender gap in actual performances in the mechanical task assigned. It
indicates that „trust in ability‟ can be governed by such stereotypes and affect
economic outcomes. We also describe the demotivating psychological process women
suffer from, due to endorsement of such stereotypes by the society.
Key Words: Trust experiment, Gender Inequality, Stereotypes,
Experimental Economics
JEL Code(s): C91, J71, Z19

Stereotypical Occupational Segregation & Gender Inequality:
An Experimental Study1
1:Introduction
Gender division of the labor market is a central feature of gender inequality,
both in its economic aspects and in the social construction of gender identities (Huber
1991; Lorber 1994). Gender-based segregation of modern industrial labour market
can be seen as the result of discriminatory practices against women. These practices
originate from endorsement of prejudices, social beliefs and stereotypes prevailing
about women‟s inability to perform certain tasks. Such „trust in (in)ability‟ governs,
directly or indirectly, women‟s access to education and jobs. Informal reservation of
some professions for a specific gender can be viewed in this context. For instance,
fund management, mechanical engineering, driving etc are mainly perceived as men‟s
fields whereas women are seen as inherently more suited to become nurses, pre-
school instructors and elementary school teachers. Professional qualifications or
acquired skills often receive lesser weightage in the recruitment process. However,
widely divergent economic payoffs and social values attached to these professions
empower one of the genders unequally and give rise to occupational inequality and
subsequently intensify gender inequality in economic and social contexts. Thus,
unscientific „trust in (in)ability‟ in the specific gender for certain tasks can be viewed
as source of discrimination. Eventually it gives rise to rigid social structures and
becomes a long term source of discrimination. Besides, it sets in place a self-fulfilling
mechanism. Initially, women face entry barriers in the supposedly “masculine” fields
due to such misperceptions. The resultant incompetence is later cited as evidence to
substantiate the stereotype and to further block entry. It extends family-based
patriarchic culture into industrial-based patriarchal system. Unscientific trust in
(in)ability undermines women‟s potentiality and lowers technological changes, stock
of human capital and economic efficiency.
1 This research work is funded by CCSS.
Our greatest debt is to the anonymous referee for suggesting variation in the standard trust
game and other experimental procedures that increased the internal validity of our results. We
are grateful to Dr. Vivek Belhekar, Dept. of Psychology, University of Mumbai for his expert
opinions. We thank Abodh Kumar, Renita D‟souza, Sneha Thayyil, Vaibhavi Deshpande, Jijo
Jose, Pinky Rajoria and Parinaaz Mehta for their support in conducting the experiments. We
also acknowledge the cooperative participation of students from various colleges in Mumbai
and Pune in the experiment.

2
The conservative attitude about women‟s ability regarding Science and
Engineering Fields (henceforth SEF) & their career opportunities can be explored
experimentally in the Indian context. The main focus of this paper is confined to „trust
in mechanical ability‟ where women are stereotypically believed to be relatively less
skilled in hands-on mechanical tasks. Although, gender gap in the performances of
mechanical task was found to be statistically insignificant, we observed that in trust
game male and female trusters transferred lower amount to their female partners when
payoffs were the function of partners‟ performance in mechanical task assigned.
The paper is organized as follows: Section 2 contains literature review, which
is divided as Section 2.1 summarizes studies dealing with scientific and social views
about women‟s mechanical ability. Section 2.2 discuses the experimental
methodology employed for this study. 2.3 reviews contemporary research on
experimental games for „trust‟. Section 3 discusses the design of our experiment.
Section 4 provides data & analysis while section 5 concludes the paper.
2: Literature Review
2.1: Women’s Mechanical Ability and Stereotypes
Women in modern society may not experience traditional gender
discriminating practices like proscription of women from education & labour market,
but they are not free from discrimination. One of the forms such practices take is the
prevalence of stereotypes that women are relatively unskilled in fields related to
Science & Engineering and particularly in carrying out hands-on mechanical tasks.
The effect of this stereotype is reflected in students‟ sex composition in SEF.
In India, the female enrolment in SEF was less than one percent of the total enrolment
till 1960s; it rose to 8.3% by the mid-1990s. It grew further but still was relatively low
at 16.2% in 1999-00 (UGC (1999)). Parikh and Sukhatme (2002)i reported that
mechanical engineering was the least favored discipline among females. Only 9.3% of
female engineering studentsii chose this branch during 1994-98. According to the
UGC (2008), women‟s enrollment ratio in all graduate-level engineering branches
(5.81%) was almost half of that of men (10.33%) during 2004-05. Other developing
and advanced countries are no exception to this trend. Correll (2001) and Arnot et al.
(1998) separately provided sociological evidences for the existence of a norm
prescribing math & science as men‟s domains in US and Britain. Strength of this

3
stereotype can be best judged by the fact that the US Government had to pass the
Science and Engineering Equal Opportunity Act (1980), to ensure gender-wise equal
opportunities in education, training, and employment in SEF.
Lower female to male ratio in SEF can be mainly attributed to the
misinterpretation of sex differences in cognitive abilities and the wrong belief that
aptitude for SEF is a masculine trait and that women are inferior at the same.
Gendered institutional policies and practices, different priorities of males and females
pertaining to personal and family life and a combination of these factors may have
evolved around this misinterpretation.
As argued by Mosedale (1978) and Shields (1975), the origin of research on
gender differences lies in traditional concerns either to support or to refute
assumptions and expectations about the appropriate social roles for men and women.
Justifications for the subordinate social position assigned to women were earlier
sought in religious doctrines, which started losing their credibility over a period of
time. Thereafter, a “scientific” approach was adopted by invoking the structure of the
brain in order to confine women to the role of mothers and wives. Any difference in
anatomy of the two sexes is generally comprehended to be immutable and unalterable.
Therefore, providing a firm „biological basis‟ for assignment of particular social roles
to each sex could have been an attempt to yield long-lasting credibility for these social
roles.
Although, sophisticated techniques of investigating brains have shown marked
„sex differences‟ between male and female brains; it is still unclear what those
differences may mean in practical terms (Rogoff (2010)). Intelligence tests show
negligible differences between men and women (Ripley (2005)). Although, most
studies agree that men‟s brains are about 10% bigger than women's (after adjusting
for their height), it has been proved that size does not predict intellectual performance
(Giedd 2006). Hanlon et al. (1999) found differences in parts of boys‟ or girls‟ brains
that mature first: for boys, mechanical and spatial reasoning develops four to eight
years earlier, while girls‟ verbal and facial recognition skills mature much faster.
However, negligible differences in intelligence test in fully mature brains suggest that
the developmental path may not matter. Given this fundamental difference in the
development process of the brain in both the sexes, rudimentary comparison in

4
performance of both genders in science subjects in same class in schools may be
misleading.
Caplan P. and Caplan J. (1997) argued that much research on gender
differences in cognition has been poorly conceived and executed, and its findings
have been quite irresponsibly interpreted in order to confine women to their socially
prescribed roles. They critically reviewed the research on gender difference by
shedding light on conceptual and methodological issues in defining mathematical,
spatial and verbal abilities, emphasis on construction of „unbiased‟ tests for their
measurement, magnitude of observed sex-related differences, critical generalization of
the results. Rogoff (2010) argued that the very prevalence of so many inconclusive
studies on sex differences in brains, implies that what truly appears to be holding
women back is not some innate disadvantage, but the belief that they are intrinsically
less gifted in SEF. Such a stereotypeiii
acts like a deterrent in the progress of the
stereotypic group.
Schmader (2006) showed how contextual factors, such as existence of
stereotypes, can discourage stigmatized groups, from pursuing education leading to
careers in the SEF. Prevalence and awareness of gender stereotype add to concerns of
the stereotyped groups that their performance will be judged against the stereotype
which affects their performance negatively (Steele and Aronson (1995)). Stigmatized
groups interpret regular learning difficulties as proof of the claimed inability; rather
than natural aspects of the learning process. Further, women tend to incorporate
negative feedback more than men (Tomi-Ann and Nolen-Hoeksema (1989)). Women
may therefore fall into „confidence traps‟ from which they do not recover easily
(Dweck (2000)).
Negative feedbacks and confidence traps are often accompanied by society‟s
low expectation from stereotyped groups. As a result, women may lack
encouragement to overcome these difficulties. Teachers‟ expectancy effects are one
route that improves stereotype consciousness among children (Wolfe and Spencer,
1996). Differential teacher treatment and suspicion of negative evolution of
performances would affect girls‟ performance in school, and would strengthen the
stereotype among peers. McKown and Weinstein (2003) argued that perceived
personal efficacy influences women‟s choices, effort levels, persistence in the face of
difficulties, the amount of anxiety and stress experienced while coping with

5
threatening environments, their vulnerability to depression, and their resilience to
adversity.
A growing research body shows negligible gender gap in SEF performances,
controlling for various demographic variables. Chen et al. (1996) examined the
relative performance of female mechanical engineering students of various classes
and observed that the female students performed better, by all measures, than the
males in all but one class where they performed equally well. The explanations which
they provide include the following: better pre-college preparation for engineering and
the nurturing environment provided by higher female enrollment ratio, allowing
women to excel by boosting their self-confidence in skills & ability. The Bennett
Mechanical Comprehension Test (BMCT), designed to measure a candidate‟s ability
to perceive and understand the relationship of physical forces and mechanical
elements in practical situations, also failed to reflect any substantial gender difference.
Controlling for education, work experience and leisure factors, gender explained only
2% of additional variance (Fortson (1991)).
Hyde (2006) synthesized results of numerous studies on gender differences in
mathematics performance in her meta-analysis and proposed the „gender similarities‟
hypothesis. She concluded that psychologically, women and men are more similar
than they are different. The study spanned a wide range of psychological
characteristics, including abilities, communication, aggression, leadership, personality
and self-esteem.
Bandura (1986), Beall and Sternberg (1993), Epstein (1997) argued that
although some sex differences are biologically founded, most of the stereotypic
attributes and roles linked to gender arise more from cultural design than from
biological endowment. Innate „sex differences‟ are translated into „gender differences‟
and they are acquired through social interactions. Gender has been defined as
institutionalized system of social practices or of constituting people as two
significantly different categories, men and women, and organizing social relations of
inequality on the basis of that difference (Ferree et al. (1999), Lorber (1994), Glenn
(1999), Ridgeway (1997), Ridgeway and Smith-Lovin (1999) and Risman (1998)).
It may be also observed historically that socio-cultural organizations and
institutional framework has been shaped by rigid and self reinforcing stereotypic
considerations of (in)ability of women. The following example is representative. Prof.

6
D K Karve, the founder of the first women‟s university in India, was inspired by the
ideology guiding Japanese Universities for Women, that assumed women‟s proper
role was only as „wives‟ and „mothers‟. In his autobiography, Karve quotes
approvingly the following from the information brochure of a Japanese University, :
“We cannot support another movement which aims at the so-called emancipation of
women. In opposition to this tendency, we lay emphasis on home life as the chief
sphere of women‟s activities. Here her proper place is found as wife and mother, not
indeed as a tool or ornament, but as an active partaker in the humanitarian and
national spirit which should animate home... Our aim is to educate women so that
they shall come to realize their own special mission in life as free personal agents and
as members of the Empire of Japan and that, as such they shall be able to perform
their services as wives and mothers in a larger sense and more efficient manner than
hitherto” (Karve 1929: 479).
Influenced by the ideology that teaching of supposedly masculine subjects to
women would reduce their maternal functionality, Prof. Karve included home science,
health science and sociology as compulsory subjects in the women‟s university‟s
curriculum, while mathematics and science were kept optional (Karve 1929:587).
Botany, zoology, biology, psychology and child-psychology, singing and painting
were other subjects available (Karve 1929: 576).
Cutting across countries and time, there seems to be no significant change in
these perceptions about women‟s ability in SEF. In 2006, the former President of
Harvard University, Larry Summers claimed that men have superior innate ability in
maths-related fields. Preoccupation of leaders of prime educational institutions with
such stereotypes endows successive generations with a gender bias, distorting human
capital & economic efficiency.
2.2: Methodology of Experimental Economics
Endorsement of such stereotype by a set of people can be investigated by
conducting economic experiments making relevant context salient. As Nobel Laureate
Vernon Smith (2002) describes it, laboratory experiments are methods of inquiry to
study the motivated human interactive behaviour in social contexts governed by
explicit and implicit rules. Explicit rules include move sequences, pay-off structures
and other rules pertaining to games and are controlled by the experimenter. Implicit

7
rules are the norms, social beliefs, perceptions, (here stereotypes, if any) that subjects
bring to the laboratory and which are not controllable & observable. An experimental
setup is created with the help of explicit rules to capture otherwise unobservable
implicit rules. This research methodology is now fairly accepted in economics, mainly
because these implicit social rules are exhibited by the cash-motivated participants. It
is posited that people refrain from exhibiting idealistic views when sizable monetary
gains are at stake. The protocol of strict anonymity between experimenter &
participants and within-participants eliminates participants‟ fear of being scrutinized
and moral pressure (on them) to hide real preferences.
For this study, a variant of the well known trust experiment is used to
behaviorally differentiate the trust extended towards women in base-line treatment
(where the stereotype in not evident) and in treatment when the stereotype was made
salient. The following section briefly reviews the literature on the trust experiments.
2.3: Literature Review of Trust Experiments
Formal government structures or market economies cannot entirely substitute
for ubiquitous informal bargaining institutions. Social beliefs, prejudices as well as
stereotypes influence trust and trustworthiness, which are fundamental to these
informal institutions.
Trust is willingness to permit others‟ decisions to influence one‟s welfare even
when such decisions can potentially harm oneself. In the act of trusting, the individual
(truster) puts herself in a vulnerable position in the hope of gaining benefits from the
trustee in return, although the trustee has a greater incentive to exploit her
vulnerability. A trust-based transaction can materialize only if trusters expect that
trustees will not exploit their vulnerability and will cooperate with them by
reciprocating the trusting behavior. Cooperation results from trust, but trust itself
involves the expectation that the vulnerability of the truster will not be exploited. An
act of pure cooperation need not involve this expectation explicitly. Cooperation is
possible even without trust. We define an act which leads to cooperation between the
truster and the trustee based on the expectation that the truster‟s vulnerability will not
be exploited by the trustee as “trust in cooperation”.
Berg et al. (1995) designed the trust game to capture this trait. In the standard
trust game, players are randomly paired and are endowed with sufficiently high
0 ix e

8
endowment (e>0). Player 1 (truster) is given the option of transferring xi part of e
to the anonymous player 2 (trustee), where Experimenter multiplies xi by
an integer k >1 and then transfers to the trustee. Then, the trustee decides to return any
amount (yi) to the truster where (0 ( ))i iy e k x
Thus monetary payoffs of truster (Ui) and trustee (Vi) are as follows:
i i iU e x y i i iV e k x y
In this sequential game, with complete information and common knowledge of
rationality under anonymity, the truster predicts that the trustee in order to maximize
Vi, would choose yi close to zero. Thus, she would choose xi closer to zero in the first
stage. Therefore, by backward induction the sub-game perfect Nash equilibrium
strategy is to send nothing and receive nothing. However, the pair foregoes a joint
gain of k×e, which could be generated if trusters send out of expectations of
reciprocity. Here, xi is measure of trust exhibited by trusters while yi is degree of
trustee‟s trustworthiness.
Experimental evidence however deviates from this dominant strategy
equilibrium. Berg et.al (1995) found that about 93% of trusters sent around 50% of
endowment and an average amount returned by trustees stood at 46% of total. More
than 35% of subjects returned more than the amount received by trusters i.e. shared
the surplus. Systematic presence of trust and trustworthiness have been found in
various studies (Cox (2002, 2004), Glaeser et al. (2000), Barr (2003)).
The „trust in cooperation‟ is sensitive to various social contexts, interactive
environment featured by communication, opportunity to reciprocate and punish,
pattern of interactions (one- shot vs. repeated), individuals‟ orientations, past
experience, societal relations, institutional incentive structure etc. Various
demographic parameters like culture, in-group identity (Tyler and Dawes (1993), De
Cremer et al. (1999)), ethnicity (Zak and Knack (1998)) and experimental procedures
such as group size (Kaori (1988)), pre-experiment communication (Buchan et.al
(2002)) can explain variation in trust exhibited in experimental studies. We focus on
research dealing with trustingiv
behavior with respect to gender of players.
9
Most studies observed that men exhibit more trust than women. Buchan et al.
(2004) found that men transferred 74% of endowment to trustees compared to 61% by
women. In the study conducted by Cox (2002), this ratio stood at 64% for men and
53% for women. Buchan et al. (2004) showed that women were more sensitive to
trustee‟s gender information change. Women also sent less to a female trustee (58%)
than to a male trustee (67%).
Experimental literature on trust also argues that trust is likely to be
confounded by unconditional other-regarding motives mainly by altruism and
inequality aversion (Cox (2004)). The latter will be activated in case of an
experimental design distributing property entitlements/endowment randomly leading
to unequal payoffs for participants. (In our study, this concern has been addressed by
equal distribution of endowment to all participants.)
Similarly, altruism may motivate trusters to transfer positively without
expecting reciprocal behavior by the partner, i.e. even in the absence of trust. Cox
(2004) decomposed transfer made in trust game in altruism and expectation of
reciprocity (trust) by using triadic designs of dictatorv and trust game. He found
statistically significant differences in average transfers made in dictator game and
those in trust game, implying altruism & trust are two different preferences and
altruism can play a role in trusting behavior.
As in the case of trust, altruist behavior may also be sensitive to information
about partner‟s gender. Women, on average, donate twice as much as men to their
anonymous partners (Eckel and Grossman (1998)). Andreoni and Vesterlund (2001)
experimentally showed that when altruism is expensive, women are kinder, but when
it is cheap, men are more altruistic. They also commented that men are more likely to
be either perfectly selfish or perfectly selfless, whereas women tend to be
„equalitarian‟. Parallel to Buchan et al. (2004)‟s results in trust game, Ben-Ner et al.
(2004) found that women incorporated gender information more in their decision
roles and gave systematically less to other women than to men and persons of
unknown gender. On the other hand, Dufwenberg and Muren (2004) found no
significant differences between male and female giving when partner‟s gender
information was made available.
For the current study, the experiment has been designed to first differentiate
trust in cooperation from altruism and then to compare trusting behavior towards

10
women in the trust game and in the game where performance of females in a
mechanical task determines the truster‟s payoff (after controlling for altruism).
Truster‟s trust in the stereotype about women‟s mechanical ability was expected to
influence their decision of transferring money. To the best of our knowledge, this is
one of the few attempts to explain underrepresentation of female in SEF through
experiments.
3: Design of the Experiment
The experiment consisted of two rounds of the dictator game and two rounds of the
trust game.
1) Standard Dictator Game (D1): Player 1 transfers x amount to the unknown
Player 2; where (0 ≤ x ≤ e).
2) Standard Dictator Game with Gender Information (D2): Player 1 decides x
after knowing the gender of an unknown partner; where (0 ≤ x ≤ e).
3) Trust Game (T1): The transfer x is multiplied a number k randomly chosen
by a computer from the set of (5,3,1,0) and half of the multiplied amount is
added to the trustee‟s account. Then trustee transfers y to player 1 where (0 ≤ y
≤ e+x*k/2). So closing balance for player 1 was (e – x + y) and for trustee was
(e+x*k/2 - y).
4) Trust Game with Mechanical Task (T2): Here k was a n explicit function of
the rank obtained by trustee in a mechanical task. All trustees, for whom
positive x was transferred, received an identical dissembled toy car along with
a screw-driver. They were given five minutes to assemble the car completely
and their performances (in terms of time taken to complete the task) were
ranked. Trustee‟s rank was considered as the pair‟s rank and all pairs were
grouped in three categories (top, middle, bottom) based on their ranks.
Trustees, whose performance was in the top 30% were placed in the Top
category and corresponding x was multiplied by 5. For the middle category
(30 - 70%), k was 3 and for bottom category (0 – 30%), k equaled one. The
resulting amount was equally divided between both the players. Trustees who
failed to complete the task within the stipulated time received zero rank. The

11
transferred amount (x) was forfeited in case of zero rank (thus the closing
balance for trustor was (e-x) and (e) for trustee).
5) Risk Attitude (RA) Task: Trusters‟ trust is likely to be confused by the
attitude towards risk. In other words, it becomes necessary to decompose
transfer into, first, that part of the transfer motivated by the trust in the
trustee‟s reciprocation or mechanical ability and second, that flowing from
his/her attitude towards risk. The truster‟s risk attitude was approximated from
their choices between one of the three schemes. The first scheme offered them
Rs.150 with certainty. The second scheme offered them Rs.300 with 50%
probabilityvi
and nil with 50% probability. The third scheme was a
combination of the first and second schemes. They were categorized as risk
averse on selection of first scheme, risk lover on selection of second scheme
and risk neutral for the last.
This experiment was conducted using Z-tree softwarevii
. Randomization of
role assignment and pair formation, in addition to double-blind anonymity was
emphasized in the instructions. Role and partners were fixed for the experiment.
Private ownership of the endowment was made abundantly clear. Acceptance of zero
transfer was affirmed by providing the options of quitting the round, before they got
checkbox to enter the amount. All rounds were independent and results of all rounds
were informed at the end of experiment so strategic element or risk of reciprocation
faced while deciding transfer in each round was eliminated. The portfolio or income
effect was controlled by making payment only for one of the randomly chosen rounds,
in addition to the payment earned in Risk Attitude task in case of trusters. „Order
effect‟ was controlled by reversing the order of only T1 & T2 for selected sessions,
binding to the aim to study the difference between trust in cooperation and trust in
ability. Five sessions were conducted in D1-D2-T1-T2&RA manner and rest in D1-
D2-T2&RA -T1 manner.
Instructions (Appendix II) for the rounds were read aloud by the experimenter
before each round, and thus were common knowledge. Simple multiple choice
questions were asked to check the subjects‟ comprehension of the instructionsviii
.
Instructions were neutral and did not have any suggestive terms like dictate, truster,
trustee, return etc.
12
Information on the demographic profile of participants (Appendix III) was
collected. It was followed by a questionnaire on gender-mingling of participants
(Appendix IV). Gender-mixing since childhood was expected to have influence on
awareness and endorsement of gender stereotype. McKown and Weinstein (2003)
have shown that children can correlate broadly held stereotypes and people‟s behavior
towards stigmatized group after reaching the age of 10 years. So data on participants‟
type of secondary school (5th
- 10th
std.; whether co-ed, single-sex or both partially)
was obtained. Similarly, data on female siblings and number of female friends in their
five closest friends circle was collected. Educational and occupational information
about siblings & friends was asked to disguise the purpose. The whole exercise,
including payment took approximately one hour and thirty minutes.
In our experimental design, we replaced constant k in standard trust game by
varying k to maintain symmetry in the surplus generation method between T1 and T2.
In T1, x was also a function of truster‟s expectation about partner‟s reciprocation,
while in the following treatment, risk of poor reciprocation was eliminated by placing
rule of equal division of the multiplied amount. This surplus sharing method ensured
that truster would react to the fact that k is a function of trustee‟s mechanical
performance in T2.
4: Analysis & Results
Experimental Data
A total of 156 post-graduate students from Pune and Mumbai, cities in the
state of Maharashtra in India, were covered in nine experimental sessions during
September to October 2012. Average age of the participants was 23 years. 38% of the
populations had annual family income ranging between Rs.1-5 lakh and 36% had
income above Rs.5 lakh. Around 17% of the participants belong to the income group
between Rs.50,000 - Rs.1 lakh while 8% had income below Rs.50,000. Out of 78
pairs, 48 pairs were formed by management students and rest by students of science
faculty. The sample comprised of 68 femalesix
and 87 males. 42 males and 35 females
played the role of dictator and truster in respective games. 45 males and 32 females
played the role of recipient or trustee. Participants in each session belonged to same
class and thus were not strangers in any strict sense. Based on the choices made in

13
risk attitude task, 52% of trusters were categorized as risk neutral, 30% as risk averse
and remaining 18% as risk lover.
Descriptive Statistics
Figure 1 (Appendix I) shows positively skewed distribution of transfers in all
four treatments. Averages of D1 and D2 as presented in Table 1 are lower than
corresponding figures documented in the literature. It should be noted that mean
transfer in T1, is not comparable with other studies given the key distinction of
varying k in our experimental setup.
Table 1: Treatment-wise Comparison of Distributive Statistics
D1 D2 T1 T2
Mean (% of Rs.300) 25.81 (9%) 21.56 (7%) 38.75(13%) 64.21(21%)
Median () 10 2 10 50
Mode 0 0 0 50
Standard deviation 46.10 48.46 68.36 79.80
Sample Selection Bias & Heckman 2-stage Estimation
The chosen experimental design allowed players to send nothing so
occasionally dependent variables (transfers in T1 and T2) took the value of zero. The
data are censored from below, leading to a potential sample selection problem. We
corrected this selection bias by using the Heckman two-stage procedure (Heckman,
1980). This procedure estimates participation function in the first stage with the help
of probit (assuming normally distributed disturbances), to derive an inverse Mills
ratio. The ratio is then used in the second stage OLS estimation as a regressor to
correct for selection bias. However, it should be noted that while the estimates yielded
by the Heckman‟s two stage method are consistent, they are not asymptotically
efficient. We also ran a censored Tobit model, which uses maximum likelihood
method for estimation to further substantiate our results.
Table 2: Heckman Estimation and Tobit Model for Transfers in T1 & T2
Dependent variable Estimators for Transfers
in T1
Estimators for Transfers
in T2
Methods 2-step
Heckman#
Tobit
Model $
2-step
Heckman ##
Tobit
Model $$
Truster‟s Gender -38.33 -44.28 -66.37 -76.67

14
(0.1132) (0.0598 .) (0.0118 *) (0.0023 **)
Trustee‟s gender
-6.02
0.7114
1.17
(0.9431)
-32.11
(0.0653 .)
-37.53
(0.0368 *)
Transfers in D2 0.82
(4.23e-06 ***)
0.98
(3.36e-08 ***)
0.52
(0.0024 **)
0.53
(0.0029 **)
Coed schooling -18.66
(0.1578)
-14.44
(0.2582)
-39.22
(0.0055 **)
-40.00
(0.0049 **)
Class -43.51
(0.3238)
-39.96
(0.3873)
-16.61
(0.7337)
-17.29
(0.7425)
Age 1.42
(0.8036)
-0.04
(0.9939)
1.10
(0.8562)
-0.09
(0.9886)
Scores in 12th
class 2.26
(0.0374 *)
1.41
(0.1419)
1.33
(0.1700)
1.33
(0.1801)
Mother‟s education -0.96
(0.9379)
-3.52
(0.7809)
20.62
(0.1442)
16.73
(0.2390)
Father‟s education 15.97
(0.1913)
15.25
(0.1649)
3.10
(0.7948)
2.79
(0.8149)
Family income -9.55
(0.4294)
-5.69
(0.639)
-18.28
(0.1724)
-15.69
(0.2510)
No. of female siblings -15.77
(0.2026)
-15.76
(0.1584)
-8.70
(0.4532)
-7.78
(0.5159)
No. of female friends 6.34
(0.3521)
9.1
(0.17)
6.71
(0.3381)
9.22
(0.1921)
Order effect
-17.10
(0.6352)
12.80
(0.7147)
-0.11
(0.9972)
3.82
(0.9123)
Risk averse -51.96
(0.7766)
-2.27
(0.9899)
76.02
(0.6836)
107.76
(0.5901)
Risk lover -70.51
(0.7060)
-30.78
(0.8636)
86.73
(0.6374)
115.03
(0.5608)
Risk neutral -53.07
(0.7712)
1.08
(0.9952)
50.79
(0.7854)
89.91
(0.6530)
Risk payoff before
Transfer in T1
-0.02
(0.8429)
-0.05
(0.649)
- -
n = 77 (as only truster‟s data is considered)
Gender =1 for female; 0 otherwise,
Coed schooling =1 for single sex; =2 for attendance of single & coed school partially;
3= co-ed schooling,
Class = 1 for undergraduate; 2=post-graduation; 3= Ph.d Scholars ,
Order effect =1 for t2t1; 0 for t1t2,
Risk averse/lover/neutral = 1 when scheme choice is 1/2/3; 0 otherwise #
censored observations = 19; observed observations = 58
37 free parameters (df = 41)
Adjusted R-Squared:0.5106
Inverse Mills Ratio= 50.8549 (0.0716 .)
sigma = 57.5542 rho = 0.8836 $
logSigma = 4.11896 (< 2e-16 ***)
Newton-Raphson maximisation, 7 iterations
Log-likelihood: -320.2466 on 18 Df

15
Left-censored (19) Uncensored (55) Right-censored (3) ##
Censored observations =10 ; observed observations =67
35 free parameters (df = 43)
Adjusted R-Squared: 0.606 ;
Inverse Mills Ratio = 69.795 (p=0.103 )
sigma = 64.406 rho = 1.084 $$
logSigma: 4.25379 (p = < 2e-16 ***)
Newton-Raphson maximisation, 10 iterations
Log-likelihood: -366.011 on 17 Df
Left-censored observations: 10 Uncensored observations: 62
Right-censored observations: 5
(P values in in parenthesis are significant at : „***‟ 0.001 „**‟ 0.01 „*‟ 0.05 „.‟ 0.1)
The vector of explanatory variables for both the treatments was same except
that the model for T1 has an additional variable, „risk payoff before transfer in T1‟.
To recall, the risk attitude task was administered simultaneously with T2 in order to
avoid boredom on part of trusters when their partners were busy in completing the
mechanical task. Hence, a subsample (n=48) which played the game in D1-D2-
T2&RA-T1 manner, had at least a partial idea about their final payment gained due to
guaranteed payoff in this task. However, this might have distorted their future
decision viz. transferred amount in T1 and thus was required to control for. This was
done by including the „risk payoff before transfer in T1‟. This variable turned out to
be statistically insignificant.
Based on the inverse Mills ratio (50.86) presented in Table 2, we failed to
reject the null of no sample bias at 5% (p=0.0716) in treatment T1. The Heckman
Two Stage estimator shows that the coefficient of „risk payoff before transfer in T1‟ (-
0.02,p=0.8429) was statistically insignificant, thereby indicating that the
administrative manipulation did not influence transfers in T1. This was also
confirmed by results of the Tobit regression. Karl Pearson‟s correlation coefficient
between risk payoff and transfer in T1 was also low at 0.16. The estimated coefficient
for altruism was statistically significant, however its magnitude was rather low.
Truster‟s gender was negatively associated with transfers in T1, indicating that female
trusters sent lower than their male counterparts. Adjusted R-Squared of the model was
51%, indicating that slightly over 50% of the transfers are explained by the model.
Inverse Mills ratio for model for T2 stood at 69.795, insignificant at 10%
(p=0.103) . In this case too, we failed to reject the null of no sample bias in the data.

16
As far as treatment 2 is concerned, both the Heckman Two stage and Tobit estimates
show, though with different magnitudes, that female trustees received statistically
significantly lower transfers compared to males, an indication of endorsement of
stereotype by trusters. In treatment T1, the coefficient of the trustee‟s gender was
statistically insignificant according to both the estimates, while in T2, it became
significant in both. On an average, as both the set of estimates indicate, female
trustees received a substantially lower amount (lower by approximately Rs.32
(Heckman‟s estimates) to Rs. 37 (Tobit estimates)) in T2 in comparison to T1. This is
the central finding of the paper, which empirically brings out the existence of the
stereotype about women‟s poor mechanical ability.
Female trusters also sent less than male trusters. Results also indicate that
more altruistic people are likely to transfer more. There also existed statistically
significant causal relationship between school type during the secondary school
education and transfers. The estimated coefficients for order effect, risk attitudes and
other gender-mingling variables were statistically insignificant. Adjusted R-square of
the outcome model was relatively high at 60%.
Non-parametric Tests and Hypotheses testing:
Non-parametric tests were undertaken to compare median values () of
various treatments (D2, T1 and T2). The results would shed light on the existence of
social preferences like altruism, trust in cooperation and trust in ability. Table 3 shows
the results of the non-parametric tests.
Table 3: Results of non-parametric tests
Wilcoxon Paired Rank Sum$
(WPRS) test
(P value)
D1
H0: D1 = 0
H1: D1 > 0
D1 & D2
H0: D1 =D2
H1: D1≠D1
D2 & T1
H0: D2=T1
H1: D2<T1
T1 & T2
H0: T1 =T2
H1: T1<T2
W$^
= 1596,
(3.165e-11)
V= 989
(0.0307)
V=1003
(0.0055)
V=1144
(5.058e-07)
$ with continuity correction, ^ Wilcoxon Signed Rank Sum (WSRS) test, denotes one-tailed test
1) In D1, dictators were expected to confirm to the sub-game perfect Nash
equilibrium strategy so expected null was the zero average transfer: As shown
in Table 4, the mean transfer was 9% (Rs.25.81) of the endowment (Rs.300).
Around 27% of dictators chose to retain the whole endowment while only one

17
participant gave away the whole endowment. WPRS test indicated that the
median transfer was significantly greater than zero (W= 1596, p = (3.165e-11)).
It established the presence of altruist motivation in the sample studied.
2) Information about the partner’s gender was expected to lead to a difference in
participants’ altruist behavior in D2, compared to D1: The central tendency
measures (except mode) showed decline in transfers from D1 to D2. WPRS test
(two-tailed) confirmed the existence of statistically significant difference (V
=989, p =0.0307).
3) Expectation of reciprocity was expected to encourage trusters to transfer more
in T1 compared to D2, with unchanged information about trustee’s gender:
Around 25% of trusters retained the whole endowment; on the other hand 4%
retained nil. Mean transfer increased marginally from 7% in D2 to 13% and the
difference was statistically significant (V=1003, p=0.0055). Thus we also
observed significant trusting behavior in T1, consistent with Cox (2004)‟s
results.
4) With the presumption that trust in ability is different from trust in cooperation,
we expected a statistically significant difference between transfers in T1 & T2:
The fraction of sample retaining the endowment slipped to 13% from 25% in
T1. Nearly 6% in T2 compared to 4% in T1 passed on the whole endowment.
Mean transfer increased sharply from 13% in T1 to 21% in T2 and difference
was confirmed by WPRS test (V=1144, p =5.058e-07). It suggests that „trust in
cooperation‟ and „trust in ability‟ are two distinct aspects of trust.
It was imperative to study the gender-wise differences in these social
preferences. Table 5 presents mean transfers pattern in cross-gender (female-
male(fm), & mf) and same-gender pairing (ff,mm).
Table 4: Comparison of Mean transfers
Average (in
Rs.) Ff Fm Mf Mm Pattern
D2 30.27 9.55 17.59 28.64 ff > mm > mf > fm
T1 33.93 21.65 34.59 58.16 mm > mf > ff > fm
T2 31.20 41.85 49.35 112.00 mm > mf >fm > ff
No. of pairs 15 20 17 25
18
1) Altruist behavior in same-gender pairing was higher than that in cross-gender
pairing, however we failed to reject the null of pair-wise equality in averages
based on WPRS test results. (The results are not presented here for the sake of
brevity).
2) Same-gender pairings again reported relatively higher trust than the cross-
gender pairing in T1. Males trusted both types of partners more than did
females (mm & mf > ff & fm). Trust extended by male trusters to their male
trustees was higher than the trust among female pairings in statistically
significant way (W =240.5 & p=0.0696).
3) In T2, when payoffs were the function of partners‟ mechanical ability, male
trusters sent remarkably higher amounts to their male partners (Rs.112)
compared to their female partners (Rs.49.35). WPRS (one-tailed) test results
also allow us to reject the null of equality of median (p=0.0187) in favor of
alternative hypothesis of mm > mf. These results undoubtedly suggest the
prevalence of gender stereotype against female‟s mechanical ability among
male trusters. Female trusters also appeared to be endorsing the stereotype as
mean transfer sent to their female partners was low (Rs.31.2) than that was
sent to male partners (Rs.41.85), however the difference was not statistically
significant (p=0.8269).
These results imply that both genders had poor opinion about female‟s
mechanical ability. Average transfer for female trusters was statistically significantly
lower than comparable figure for male trustors (for W=407, p=0.0004 with H0: f
T2=m T2). This is consistent with pattern of averages for T2 (ff <fm<mf<mm). Few
alternative explanations can be proposed whose consistency needs to be examined.
Firstly, women could have shied away from the competitive environment.
Additionally, women‟s prediction about others‟ competence in the mechanical task
could be highly influenced by their own stereotyped inferiority complex about the
same. So information that trustees were males might not have brought out drastic
changes in transfers.
Post-experiment questionnaire also revealed sample‟s inclination towards
endorsing the stereotype. It shows 47% of trusters thought that mechanical
engineering is more a man's field. Around 33% of trusters expressed the view that
women are generally less efficient than men at hands-on mechanical tasks. The

19
fraction of trusters adhering to the statement that „Some people believe that women
are less skilled at 'hands on' mechanical tasks compared to men‟ was 38%.
Gender-wise comparison of actual performance
Actual performance of trustees suggested modest gender gap, however it was
not statistically significant for any of the categories (using test for equality of
proportions). As shown in the figure 2, the percentage of female trustees placed in the
Top category was lower than their male counterparts. Bottom category saw more male
trustees than female while only one female trustee obtained zero rank. Four males and
six female trustees could not complete the mechanical task as their partners quit the
round.
Limitations of the study
The decision to endorse the stereotype could be also influenced by the
experimental environment. Firstly, these computerized experiments were
administered by a female experimenter, accompanied by female volunteers who
handled all computer-related accessories and computer-networking efficiently. This
might have influenced participants‟ view about the engineering and mechanical ability
of women.
It might also be that the assigned mechanical task might have perceived to be
very simple by trusters. Around 81% of trustees also reported that the task was „very
easy‟ or „easy‟, while rest admitted that it was „manageable‟. Additionally, since

20
participants in each session were from the same class, the partial non-anonymity and
their past interactions could have contaminated the salient experimental context.
On top of it, the sample we have studied belonged to the metropolitan city
having relatively higher gender mingling social contacts and wide exposure to various
dynamic processes enriching their experience-based knowledge. All being post-
graduate students having decided their career options, the contexts striking the gender
stereotype could be absent or rare in their personal lives. These factors might have
weakened the stereotype strength. Similar exercise with samples from rural area,
patriarchal societies, junior colleges, human resource managers might reflect the
stronger presence of the stereotype and a clear distinction between gender-wise trust
in cooperation and trust in ability.
Our design suffered from asymmetry between T1 and T2 regarding surplus
sharing method. While in T2, the surplus was equally divided, the division was based
entirely on the trustee‟s discretion in T1. The procedural difference was viewed
essential to qualify T1 as trust game. As a result, two risks confronted by truster (in
T1) namely realization of lower value of k and poor reciprocation would have
suppressed transfers in T1 unequally. Selection of k i.e. the surplus generation method
also differs in another plausibly important aspect. In T1, it was non-human (by
computer) whereas depended on human actions (mechanical task) in the subsequent
treatment. Impact of this process-discrimination can be tested referring to the studies
which observed that human participants behave differently when opponents are non-
human (Blount 1995). Nonetheless, regression results of transfer in T2 confirming
gender bias cannot be undermined because of these shortcomings.
5. Concluding remarks
The paper finds substantial evidence that a stereotype about women‟s relative
incompetence in tasks involving mechanical dexterity is widely held in society. We
observed that endorsement of the stereotype by both males and females lowers
women‟s economic payoffs. Our results importantly emphasize that making the social
identity salient leads to changes in individuals‟ behaviour mainly through changes in
expectations. Hoff and Pandey (2004) had shown that activating caste identities
debilitated the low caste and hurt even the performance of the high castes.

21
These findings call for cogitation by the society about the unscientific social
belief about mechanical ability of women. Females‟ self-efficacy belief, higher
tendency to fall in confidence trap in addition to society‟s poor expectations underline
necessity of gender-neutral socialization. Statistically significant negative regression
coefficient of co-ed education emphatically underlines conscious initiation of gender-
blind socialization from the age of 10 years. It would help to correct the
underrepresentation of women in SEF and subsequent stereotypical occupational
segregation of the labour market.
i The study was conducted between 1994-98 in 13 engineering institutes in Andhra Pradesh, Delhi,
Gujarat, Karnataka, Kerala, Maharashtra and Tamil Nadu. The sample is argued to be a representative
of 80% of India‟s women engineers. ii 37% of female engineering students preferred electronics, 20% opted civil engineering and another
16-17% chose electrical and computer engineering respectively. iii
According to Fung and Ma (2000) stereotype is a subjective perception, which may be an intuition, a
prejudice, an imagination, or past impression of what a person has been. iv Restricting the focus on trust behavior, studies on gender-wise differences in reciprocation is not
provided. Similarly, our experimental data on reciprocity is not discussed here. v Dictator game is widely used to infer altruist motivation. In dictator game, player 1 (dictator) splits
the endowment with his unknown partner, who have no right of rejection. While the game theory
predicts is zero transfer, experimental literature reports positive transfers (Forsythe et al. (1994),
Hoffman et al. (1994) Camerer (2003)). vi Probabilities were calculated as follows: Player 1 selecting scheme 2 received a keypad on their
screen with two blank & jumbled keys meant for head & tails. Player 1 hits on any key. If „head‟
appears, he receives Rs.300 and zero otherwise. For third scheme, first keypad provided two keys for
both the schemes & payment was generated according to selected scheme. vii
It is Zurich Toolbox for Readymade Economic Experiments having client-server application
developed by Fischbacher (2007). http://www.iew.uzh.ch/ztree/index.php viii
Players who gave wrong answers, received the instructions again. ix
Observation of a female player 1 was eliminated as she provided insufficient data.

22
Bibliography
1. Andreoni, James and Lise Vesterlund (2001): “Which is the Fair Sex? Gender
Differences in Altruism”, the Quarterly Journal of Economics, 116(1), pp. 293-
312.
2. Arnot, M, J Gray, M James and J Ruddock (1998): Recent Research on Gender
and Educational Performance (London: The Stationery Office).
3. Bandura, Albert (1986): Social Foundations of Thought and Action: A Social
Cognitive Theory (Englewood Cliffs, NJ: Prentice-Hall).
4. Barr, Abigail (2003):“Trust and Expected Trustworthiness: Experimental
Evidence from Zimbabwean Villages”, the Economic Journal, 113 (489), pp.
614-30.
5. Beall, A E and R J Sternberg, ed. (1993): The Psychology of Gender (New York:
Guilford Press).
6. Ben-Ner, Avner Fanmin Kong and Louis Putterman (2004): “Share and Share
Alike? Intelligence, Socialization, Personality and Gender-Pairing as
Determinants of Giving”, Journal of Economic Psychology, 25, pp.581-89.
7. Berg, Joyce, John Dickhaut and Kevin McCabe (1995): “Trust, Reciprocity, and
Social History”, Games and Economic Behavior, 10(1), pp.122-42.
8. Blount S (1995): “When Social Outcomes aren‟t Fair: the Effect of Cause
Attribution on Preferences”, Organizational Behavior & Human Decision
Process, (62), pp.131-44.

23
9. Buchan, Nancy R, Rachel Croson, Eric J. Johnson (2002): “Trust and
Reciprocity: An International Experiment”, Working paper, Wharton School,
University of Pennsylvania.
10. Buchan, Nancy R, Rachel Croson, and Sara S. Solnick (2004): “Trust and
Gender: An Examination of Behavior, Biases, and Beliefs in the Investment
Game”, Working Paper, University of Pennsylvania.
11. Camerer, Colin, F (2003): Behavioral Game Theory: Experiments in Strategic
Interaction (Princeton N.J.: Princeton University Press), pp. 57.
12. Caplan, Paula and Jeremy Caplan (1997): “Do Sex-Related Cognitive
Differences Exist, and Why Do People Seek Them Out” in Caplan P., Crawford
M., Hyde Janet S. and Richardson John T.E. (ed) Gender Difference in Human
Cognition (New York: Oxford University Press).
13. Chen, J C, S Owusu-Ofori, D Pai, E Toca-McDowell, S L Wang and C K Waters
(1996): “A Study of Female Academic Performance in Mechanical Engineering.”
Paper presented at the 26th
Annual Frontiers in Education Conference, Salt Lake
City, UT, USA 1996 November.
14. Correll S J (2001): “Gender and Career Choice Process: The Role of Biased Self-
Assessments”, American Journal of Sociology, 106(6), pp. 1691-730.
15. Cox, James (2002): “Trust, Reciprocity, and Other-Regarding Preferences: Group
vs.
Individuals and Males vs. Females.” in R. Zwick and A. Rapoport (ed)
Experimental Business Research (Boston: Kluwer Academic Press), pp. 331-49.
16. ______ (2004): “How to Identify Trust and Reciprocity”, Games and Economic
Behavior, 46, pp. 260–81.
17. De Cremer, David and Mark Van Vugt (1999): “Social Identification Effects in
Social Dilemmas: a Transformation of Motives”, European Journal of Social
Psychology, 29, pp. 871-93.
18. Dufwenberg, Martin and Astri Muren (2004): “Discrimination by Gender and
Social Distance”, Working Paper, University of Arizona.
19. Dweck, Carol S (2000): Self-Theories: Their Role in Motivation, Personality, and
Development (Philadelphia, PA: Psychology Press).
20. Eckel, Catherine and Grossman Philip (1998): “Are Women Less Selfish Than
Men?: Evidence from Dictator Experiments”, The Economic Journal, 108 (448),
pp. 726-35.

24
21. Epstein, C F (1997): “The Multiple Realities of Sameness and Difference:
Ideology and Practice”, Journal of Social Issues, (53), pp. 259-78.
22. Ferree, Myra M, J Lorber and B Hess (1999): “Introduction”, Revisioning Gender
(Thousand Oaks, CA: Sage) pp. xv-xxxvi.
23. Fischbacher, U (2007): “z-Tree: Zurich Toolbox for Ready-made Economic
Experiments”, Experimental Economics, 10(2), pp.171-78
24. Forsythe, R, J L Horowitz, N E Savin and M Sefton (1994): “Fairness in Simple
Bargaining Experiments”, Games and Economic Behavior (6), pp. 347–69.
25. Fortson, H D (1991): “An Investigation of Gender Differences in Mechanical
Aptitude”, Unpublished doctoral dissertation, California School of Professional
Psychology.
26. Fung, A and E Ma (2000): “Formal vs. Informal Use of Television and Gender-
role Stereotyping in Hong Kong”, Sex Roles, (42), pp. 57-81.
27. Giedd, Jay (2006): “Sexual Dimorphism in the Developing Brain”, in „Biological,
Social, and Organizational Components of Success for Women in Academic
Science and Engineering: Workshop Report‟ (Washington, D.C.: National
Academies Press).
28. Glenn, Evelyn, N (1999): “The Social Construction and Institutionalization of
Gender and Race: An Integrative Framework” in M. Ferree, J. Lorber, and B.
Hess (ed) Revisioning Gender (Thousand Oaks, CA: Sage).
29. Glaeser, Edward L, David Laibson, Jose Scheinkman and Christine L Soutter
(2000): “Measuring Trust”, Quarterly Journal of Economics, 115 (3), pp. 811-46.
30. Hanlon, Harriet, Robert Thatcher and Marvin Cline (1999): “Gender Differences
in the Development of EEG Coherence in Normal Children”, Developmental
Neuropsychology, 16(3), pp. 502.
31. Heckman, James (1980): “Sample Selection Bias as a Specification Error with
Application to the Estimation of Labor Supply Functions.” in Smith J. P. (ed)
Female Labor Supply: Theory and Estimation of Labor Supply Functions
(Princeton, N.J.: Princeton University Press), pp. 206–48.
32. Hoff, K R and P Pandey (2004): “Belief Systems and Durable Inequalities: An
Experimental Investigation of Indian Caste”, World Bank Policy Research
Working Paper, 3351.

25
33. Hoffman, E, K McCabe, K Shachat and V Smith (1994): “Preferences, Property
Rights and Anonymity in Bargaining Games”, Games and Economic Behavior,
7(3), pp. 346-80.
34. Huber, Joan (1991): “A Theory of Family, Economy, and Gender” in Blumberg
Rae L. (ed.) Gender, Family, and Economy: The Triple Overlap (Newbury Park,
CA: Sage).
35. Hyde, Janet (2006): “Women in Science and Mathematics: Gender Similarities in
Abilities and Socio-cultural Forces”, in „Biological, Social, and Organizational
Components of Success for Women in Academic Science and Engineering:
Workshop Report‟ (The National Academies Press, Washington, D.C).
36. Kaori, Sato (1988): “Trust and Group Size in a Social Dilemma”, Japanese
Psychological Research, 30(2), pp. 88-93.
37. Karve, D K (1929): Atmavroota (Hingne Budruk, Balikashram).
38. Lorber, Judith (1994): Paradoxes of Gender (New Haven, CT: Yale University
Press).
39. Martin, C L and C F Halverson (1981): “A Schematic Processing Model of Sex-
typing and Stereotyping in Children”, Child Development, 52, pp. 1119-34.
40. McKown, C and R S Weinstein (2003): “The Development and Consequences of
Stereotype Consciousness in Middle Childhood”, Child Development, 74 (2), pp.
498-515.
41. Mosedale, S S (1978): “Science Corrupted: Victorian Biologists Consider “The
Woman Question””, Journal of the History of Biology, 11, pp.1-55.
42. Parikh, P P and S P Sukhatme (2002): Women in the Engineering Profession in
India - the Millennium Scenario, final report, Sponsored Project No.
DST/NSTMIS/05/05/97, (New Delhi: Department of Science and Technology,
Government of India).
43. R Development Core Team (2008): R: A Language and Environment for
Statistical Computing. R Foundation for Statistical Computing, Vienna, Austria,
ISBN 3-900051-07-0, (http://www.R-project.org).
44. Ridgeway, Cecilia L (1997): “Interaction and the Conservation of Gender
Inequality: Considering Employment”, American Sociological Review, 62, pp.
218-35
45. Ridgeway, Cecilia L and Lynn Smith-Lovin (1999): “The Gender System and
Interaction”, Annual Review of Sociology, 25, pp.191-216
26
46. Ripley, Amanda (February 27, 2005): “Who Says a Woman can't be Einstein?”,
Time Magazine, viewed on 10 January 2012
(http://www.time.com/time/magazine/article/0,9171,1032332,00.html#ixzz1Lvgj
DNFy)
47. Risman, Barbara J (1998): Gender Vertigo: American Families in Transition
(New Haven, CT: Yale University Press).
48. Rogoff, J (2010): “Neuroscience, Gender, and a Scientific Career”, MIT
OpenCourseWare, (http://ocw.mit.edu), Neuroscience and Society, STS.010
Paper 2, OR http://ocw-mit.kemdiknas.go.id/courses/science-technology-and-
society/sts-010-neuroscience-and-society-spring-
2010/assignments/MITSTS_010S10_paper2_jr.pdf
49. Schmader, T (2006): “Contextual Influences on Performance” in Biological,
Social, and Organizational Components of Success for Women in Academic
Science and Engineering: Workshop Report‟ (Washington, D.C.: National
Academies Press)
50. Schwieren, C and Matthias Sutter (2007): “Trust in Cooperation or Ability? An
Experimental Study on Gender Differences”, Working Papers, 20, Faculty of
Economics and Statistics, University of Innsbruck.
51. Shields, S A (1975): “Functionalism, Darwinism, and the Psychology of Women:
A Study in Social Myth”, American Psychologist, 30, pp. 739-54.
52. Smith, V (2002): “What is Experimental Economics?”, viewed on 12 October
2011 (http://www.ices-gmu.org/article.php/368.html).
53. Steele, C M and J Aronson (1995): “Stereotype Threat and the Intellectual Test
Performance of African Americans”, Journal of Personality and Social
Psychology, 69, pp.797-811.
54. Tomi-Ann, R and S Nolen-Hoeksama (1989): “Sex Differences in Reactions to
Evaluative Feedback”, Sex Roles, pp. 725–47.
55. Tyler, T and R Dawes (1993): “Fairness in Groups: Comparing the Self-Interest
and Social Identity Perspectives”, in Barbara Mellers, and Jonathan Baron (ed)
Psychological Perspectives on Justice (Cambridge, UK: Cambridge University
Press).
56. UGC (1999): Research and Development Statistics (New Delhi: Department of
Science and Technology, Ministry of Science and Technology, Government of
India).
57. _____ (2008): Higher Education in India: Issues Related to Expansion,
Inclusiveness, Quality and Finance (New Delhi: University Grant Commission).

27
58. Wolfe, C T and S J Spencer (1996): “Stereotypes and Prejudice: Their Overt and
Subtle Influence in the Classroom”, American Behavioral Scientist, 40, pp.176-
85.
59. Zak, P J and S Knack (1998): “Trust and Growth”, IRIS Working Paper, 219,
University of Maryland, College Park.

28
Appendix I
Figure 2: Distributions of transfers in various treatments
05
1015
20
D1 transfers
Amount (in Rs.)
Freq
uenc
y
0 40 100 200 300
05
1525
D2 transfers
Amount (in Rs.)
Freq
uenc
y
0 50 199 300
05
1015
T1 transfers
Amount (in Rs.)
Freq
uenc
y
0 40 90 150 300
04
812
T2 transfers
Amount (in Rs.)
Freq
uenc
y
0 40 90 150 300

29
Appendix II
Instructions
Welcome to the experiment conducted by the Centre for Computational Social Sciences
at University of Mumbai.
The experiment consists of four rounds and it will take approximately one & half hour.
The computer will randomly form various pairs of two participants sitting in this room.
During and even after the experiment, everyone's identity will be kept secret. No such
private information will be asked that will reveal or help to trace anyone's identity. So no
one will able to identify his/her partner in the experiment. However, individual's total
earning will depend on his own and his/her unknown partner's decision, taken during the
experiment.
For each round, a new account will be created for each of you and your earnings during
that round will be deposited in that account.
Each round is independent of the other. So you can NOT use money earned in one round
in other rounds.
Results of all rounds will be informed to you at the end of the experiment.
HOWEVER, only one of the rounds will be selected RANDOMLY to make final
payment.
At the end of the experiment, you will receive a key pad with four blank keys. Each key
will be meant for one round. You will hit on any key on it. The chosen round will be
selected for your payment. Amount in your account for that round will be paid to you.
Since the round will be chosen randomly, every round has equal chance of getting
selected. Hence, it is in your best interest to take decisions carefully in each round.
Please do not discuss the experiment among yourselves or share any information with
your friends. Any such attempt will disqualify your participation in the experiment.
Volunteers will assist you in case of any query.
Round 1
The COMPUTER will RANDOMLY form various pairs of two participants available
here.
They will be named as Player 1 & Player 2. Everyone will be informed about his/her
own name for the experiment.

30
A sum of Rs.300/- will be deposited in both the Players' accounts. This amount will be
personal endowment of each player and every one is free to take any decision regarding
it.
Player 1 will have two options : 'To continue the round' or 'To quit the round'.
a) If he/she decides to quit the round, the round 1 will finish for that pair only and they
will enter into next round. In such case, the closing balance for both of them will be
Rs.300 .
b) If Player 1 decides to continue, he/she will send any amount from received Rs.300 to
Player 2;
so the closing balance will be as follows :
for Player 1 : Rs.300 - amount sent to Player 2
for Player 2 : Rs.300 + amount sent by Player 1
If you have any query, please raise your hand; else you can start the experiment.
Round 2
This round will be similar to the first round.
This time, some information about your unknown partner will be shared with you.
However, you will not able to identify your partner based on that information.
After this, same as in Round 1
Round 3
A sum of Rs.300/- will be deposited in both the Players' accounts. This amount will be
personal endowment of each player and every one is free to take any decision regarding
it.
Player 1 will have two options: 'To continue the round' or 'To quit the round'.
a) If he/she chooses to quit the experiment, the round 3 will finish for that pair only and
the closing balance for both the players will be Rs.300
b) If Player 1 chooses to continue, he/she will send any amount from received Rs.300 to
Player 2; the balance amount will remain in his/her account.
*** Before depositing this amount in Player 2's account, the computer will randomly
select one number from the bracket (5,3,1,0) and will multiply
the amount by the chosen number and half of this multiplied amount will be deposited in
Player 2's account.

31
*** So this half of the multiplied amount will be added to Player 2's personal
endowment. Now he/she can take any decision regarding the whole amount.
*** Now Player 2 can also send any amount from the his/her personal endowment to
Player 1. The balance money will remain in his/her account.
Round 3 ends here. Results of the round will be informed to you after Round 4.
If you have any question, please raise your hand; a volunteer will come to you to solve
your query.
Round 4
For Round 4, the role & partner will be same as in Round 3.
Both the players will receive Rs.300 per head. Player 1 will have option to either 'Quit
the round' or to 'Continue & so option of sending some money to Player 2'.
If Player 1chooses to quit, the round will end for that pair. If Player 1 chooses to send
some money to unknown Player 2, the round will continue.
*** This time, the computer will not choose the multiplication factor randomly but value
of the multiplication factor will depend on ranks obtained by Player 2 in a
MECHANICAL TASK.
All the Players 2 will be given the engine of a small car, its wheels, model of the car, one
screw & a screw-driver separately. They are required to assemble the car in given 5
minutes.
As soon as Player 2 finishes the task, he or she is supposed to submit it to the volunteers.
We will check the assembled car. If all parts are assembled properly & if it runs well, the
mechanical task will be finished only for that Player 2. Similarly, all cars will be
checked.
** Whoever finishes the task first, will get the rank 1. Next Player 2 will get the rank 2 &
so on. All players 2, who submit after 5 minutes, will get the rank 'zero'.
Players 2 will be given chits with ranks written on it. They are requested to keep it
confidential.
*** The rank obtained by Players 2 will be considered as pair's rank and all pairs will be
placed in 3 categories (Top, Middle and Bottom) depending on the ranks.
** Pairs which obtain higher ranks compared to others, will be categorized in Top
category and the sent money will be multiplied by 5

32
** For pairs categorized in Middle category, the sent money will be multiplied by 3
** For pairs categorized in Bottom category, the sent money will be multiplied by 1.
** This multiplied amount will be divided equally between both the players in the pair
and will be deposited in each player's account.
** Pairs with 'zero' rank, will move out of the competition. In such case, amount sent by
Player 1 to Player 2 will be taken away. Thus, Player 1 will retain the residual amount
whereas Player 2 will not receive any amount from Player 1. So the closing balance for
player 2 will be his personal endowment (Rs.300)
Do you have any question? Please raise your hand; volunteers will come to you to solve
your query.
Round 5
Till Players 2 finish their mechanical task, please participate in round 5.
You have to choose one of the following three schemes.
Scheme 1 : pays you Rs.150
Scheme 2 : pays you Rs.300 with 50 % chance and Rs.0 with 50% chance.
Once you select this scheme, a keypad will appear on your screen.
It will have two keys, meant for 'head' and 'tail'. However, it will not be visible to you
and keys will be jumbled.
You have to hit on any key randomly.
If 'head' gets selected from the chosen blank key, you will earn Rs.300 and if 'tail' gets
selected, you will earn nothing.
Scheme 3 : is the combination of above two schemes.
If you opt for Scheme 3, you will face two keypads with blank keys.
First keypad will have names of the schemes underwritten the blank and jumbled keys.
Once you hit on any key randomly, if it happens to be 'scheme 1', you will earn Rs.150
however if 'scheme 2' gets selected, you will face another blank keypad for 'head' & 'tail'
Your payment will be calculated according to Scheme 2, as explained earlier.
You will be paid for this task in certain way. It means this payment will be in addition to
the payment made for the randomly selected round.
If you have any query please raise your hand; else you may start the round.

33
Appendix III
1) Your Age :
2) The discipline you study in :
1)Science 2)Commerce 3)Arts 4)Vocational 5)Others
3) Educational Background of your father :
1)No Education 2) Matriculation 3)Graduation 4)Post-graduation 5)Doctorate
6)Other
4) Educational Background of your mother :
1)No Education 2) Matriculation 3)Graduation 4)Post-graduation 5)Doctorate
6)Other
5) Occupation of your father :
1)Govt/Private/Public Service 2) Self-employed 3)Medicine/Law/Accounts
4)Education 5)Household work 6)Other
6) Occupation of your Mother :
1)Govt/Private/Public Service 2) Self-employed 3)Medicine/Law/Accounts
4)Education 5)Household work 6)Other
7) Your parents' annual income is :
1)<Rs.50,000 2)Rs.50,000 - Rs. 1 lakh 3)Rs.1 lakh - Rs. 5 lakh 4)>5 lakh
8) Have you attended any experiment conducted by this Centre : Yes No

34
Appendix IV
Login ID for the experiment:
Please provide following information
1. Please provide your marks in 12th
(if 12th
not available provide 10th
marks)
_______________%
2. Please write names of your three closest friends & their details
Sr. No. Name Gender Age Education & Occupation
1
2
3
4
5
3. Do you have siblings (brothers & sisters) : ______________
4. Information about your siblings :
Sr. No. Name Gender Age Education & Occupation
1
2
3
4
5
5. Please write names of your five closest friends & their details
Sr. No. Name Gender Age Education & Occupation
1
2
3
4
5