steve brice regional head of research middle east and south asia
DESCRIPTION
Qatar: The best is yet to come. Steve Brice Regional Head of Research Middle East and South Asia. Overview. Outstanding medium term prospects Securing the future Realising the country’s potential. Outstanding medium-term prospects. Nobody better positioned than Qatar. - PowerPoint PPT PresentationTRANSCRIPT

Steve BriceRegional Head of ResearchMiddle East and South Asia
Qatar: The best is yet to come

Overview
Outstanding medium term prospects
Securing the future
Realising the country’s potential
Outstanding medium-term prospects
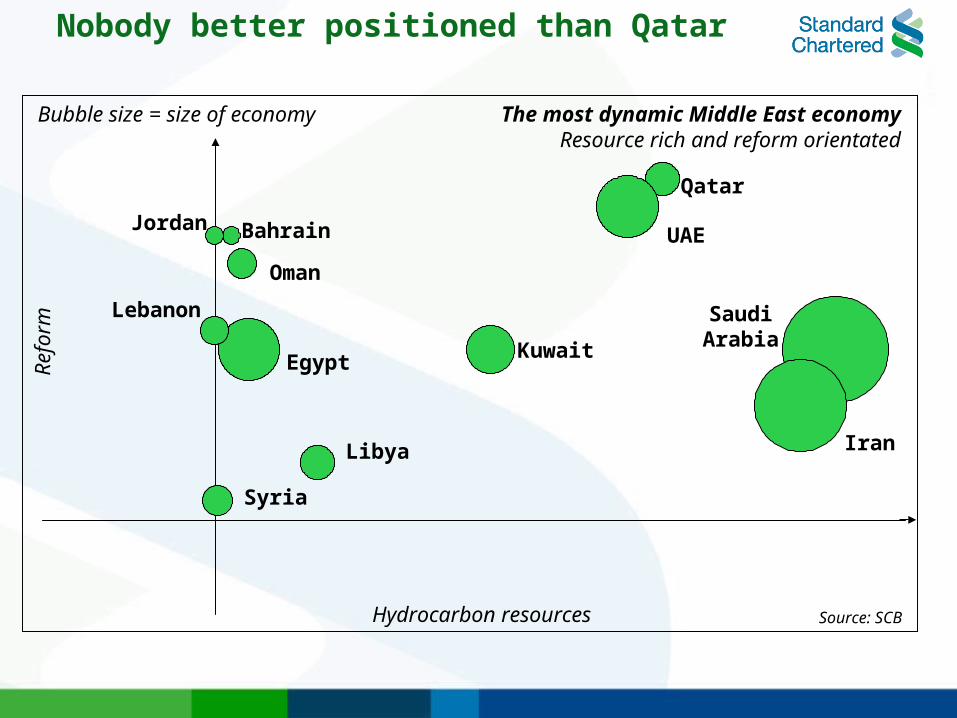
Nobody better positioned than Qatar
SaudiArabia
Iran
Qatar
UAE
Kuwait
Libya
Egypt
Oman
BahrainJordan
Lebanon
Syria
Hydrocarbon resources
Ref
orm
The most dynamic Middle East economyResource rich and reform orientated
Source: SCB
Bubble size = size of economy

Development of gas reserves key near-term
0
500
1,000
1,500
2,000
2,500
3,000
3,500
1997 1998 1999 2000 2001 2002 2003 2004 2005 2006 2007 2008 2009 2010
Oil Gas
Source: QP, QNB, SCB
Total oil and gas production, ‘000s of barrels of oil equivalent

Securing the future

Non-hydrocarbon balance key
-50%
-40%
-30%
-20%
-10%
0%
10%
20%
1994 1995 1996 1997 1998 1999 2000 2001 2002 2003 2004 2005f
0
10
20
30
40
50
60
Non-hydrocarbon balance, % GDP
Fiscal balance, % of GDP
Oil price, $ per barrel OPEC (RHS)
Source: QCB, IIF, SCB

Fiscal targets consistent with inter-generational equity
Source: SCB
Policy goal Long-term oil price Target non-hydrocarbonassumption fiscal deficit
USD per barrel % of 2004 GDP(QAR bn)
Maintain constant oil 22 -30% [-31]
and gas wealth 50 -54% [-56]
80 -88% [-91]
Maintain constant oil 22 -4% [-4]
and gas wealth per capita 50 -9% [-9]
80 -15% [-16]
=
*For description of all assumptions see text
==
===

Why bother?
Electricity16%
Combustible renewables and
waste14%
Gas16%
Oil43%
Coal7%
Other*4%
2002 fuel shares of total final consumption (World)
Source: IEA* geothermal, solar, wind, heat, etc
Scope for alternative fuel growth
Realising the country’s potential

Hydrocarbon revenues as a catalyst
Exploitingenergy
resources
Exploring energy
resources
Exploring economic
potential
Exploitative economy Exploratative economy
Crude oil/gas production
Petrochemicals
Extractive industries
Energy research and development
New energy technologies
Innovative energy industries
Dynamic research and development centre
Clusters of innovative companies in the energy and non-energy sectors
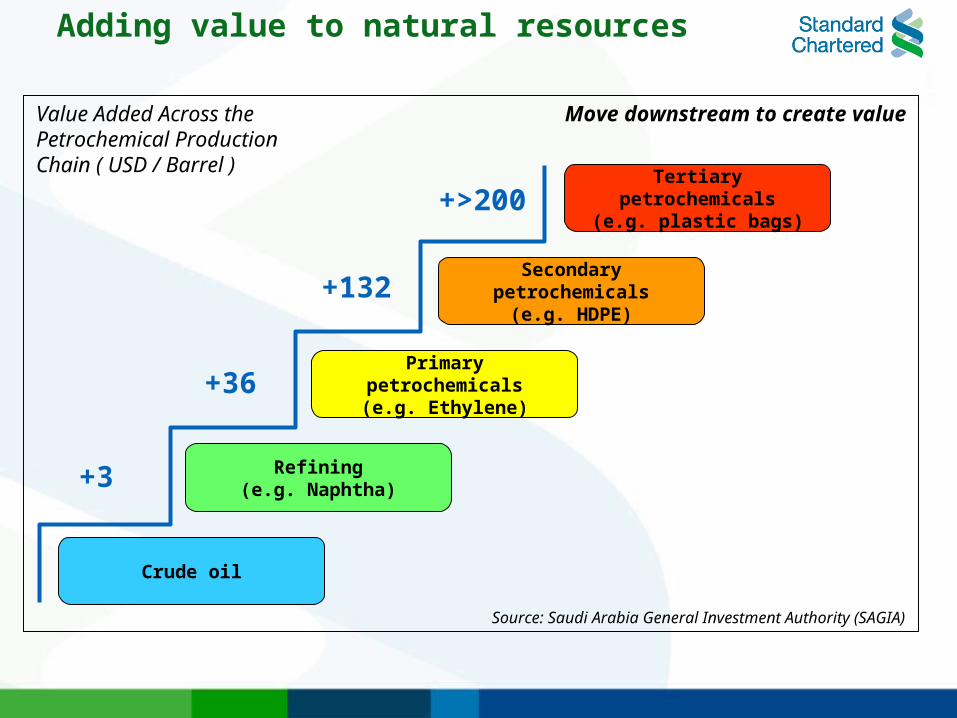
Adding value to natural resources
Value Added Across the Petrochemical Production Chain ( USD / Barrel )
Tertiary petrochemicals(e.g. plastic bags)
Secondary petrochemicals(e.g. HDPE)
Primary petrochemicals(e.g. Ethylene)
Refining(e.g. Naphtha)
Crude oil
+3
+36
+132
+>200
Source: Saudi Arabia General Investment Authority (SAGIA)
Move downstream to create value

Energy research hub vs gas producer?
Recognised research but commercial potential not tapped
0.0
0.5
1.0
1.5
2.0
2.5
3.0
3.5
4.0
4.5
5.0
Qatar
Jord
an
Tunis
ia
Egypt
UAE
Leban
on
Bahra
in
Oman
Saudi
Source: WEF
Quality of scientific research institutions 1=nonexistent 7=the best in their fields
0.0
0.5
1.0
1.5
2.0
2.5
3.0
3.5
4.0
Tunis
ia
Jord
an
Moro
cco
Egypt
Qatar
UAE
Bahra
in
Oman
Leban
on
Saudi
Source: WEF
University/Industry Collaboration 1=minimal 7=intensive and ongoing
0.0
0.5
1.0
1.5
2.0
2.5
3.0
3.5
4.0
Moro
cco
Tunis
ia
Egypt
Jord
anUAE
Leban
onQat
ar
Bahra
in
Saudi
Oman
Source: WEF
Capacity for innovation of national companies
1= solely license from international partners 7=R&D all in house
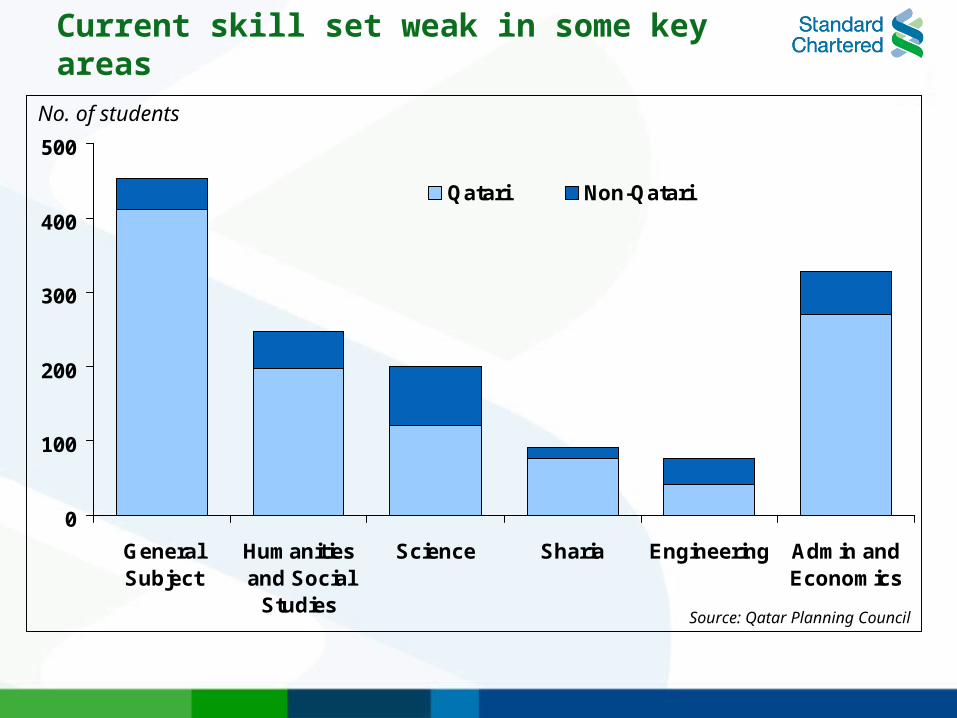
Current skill set weak in some key areas
0
100
200
300
400
500
GeneralSubject
Humanitiesand Social
Studies
Science Sharia Engineering Admin andEconomics
Qatari Non-Qatari
No. of students
Source: Qatar Planning Council

Region lags behind smaller economies in converted R&D
0
6,000
12,000
18,000
24,000
30,000
36,000
South K
orea
Isra
el
Hong Kon
g
Norway
Singa
pore
Irela
nd
Luxem
bourg
Mid
dle E
ast,
ex. I
l
Liech
tens
tein
GCC
Source: SCB, US Patent Office
GCC R&D ComparisonNumber of Patents filed in the US, by
inventor country (1977-2003)

Focus on non-oil sector to bear fruit
-10%
0%
10%
20%
30%
40%
1975 1978 1981 1984 1987 1990 1993 1996 1999 2002 2005
GDP Trend Oil Sector Trend Non-oil Trend
Source: SCB
Nominal GDP trends, y/y Non-hydrocarbon growth has been trending down

Qatar can be competitive outside of energy
0
2
4
6
8
10
Oil an
d Gas
Petro
chem
ical
s
Finan
ce
Med
ia a
nd Mar
ketin
g
Art an
d Musi
c
Sport
Educatio
n an
d Hea
lthca
re
Touris
m
Agricultu
re
Competitive advantage Job creation Domestic consumption
DiversificationIndex, 10 is very appropriate and 1 is not appropriate
Source: SCB

Scenario analysis of GDP per capita
0
20
40
60
80
100
120
2005 2008 2011 2014 2017 2020
Low oil trend (I)Medium oil trend (II)High oil trend (III)Low oil reform (IV)Medium oil trend (V)High oil reform (VI)
Source: SCB
USD 000’s
II
III
V
VI
I
IV

Summary
Outstanding medium term prospects
Securing the future
Realising the country’s potential