steve jobs gets confused by a bad chart in 2006
TRANSCRIPT

Steve Jobs and 16 seconds of confusion
How a bad „Hall-of-Shame“ chart shocked the master of design thinking in 2006
Roman Griesfelder, aspektumOctober 2014

This is Steve Jobs world in 2006.
Presenting well designed and usable products.
MacWorld 2006 (January 10, 2006)
Source: Youtube „First Intel Mac“
https://www.youtube.com/watch?feature=player_detailpage&v=cp49Tmmtmf8

But what happened seconds later made Steve Jobs loose his focus …

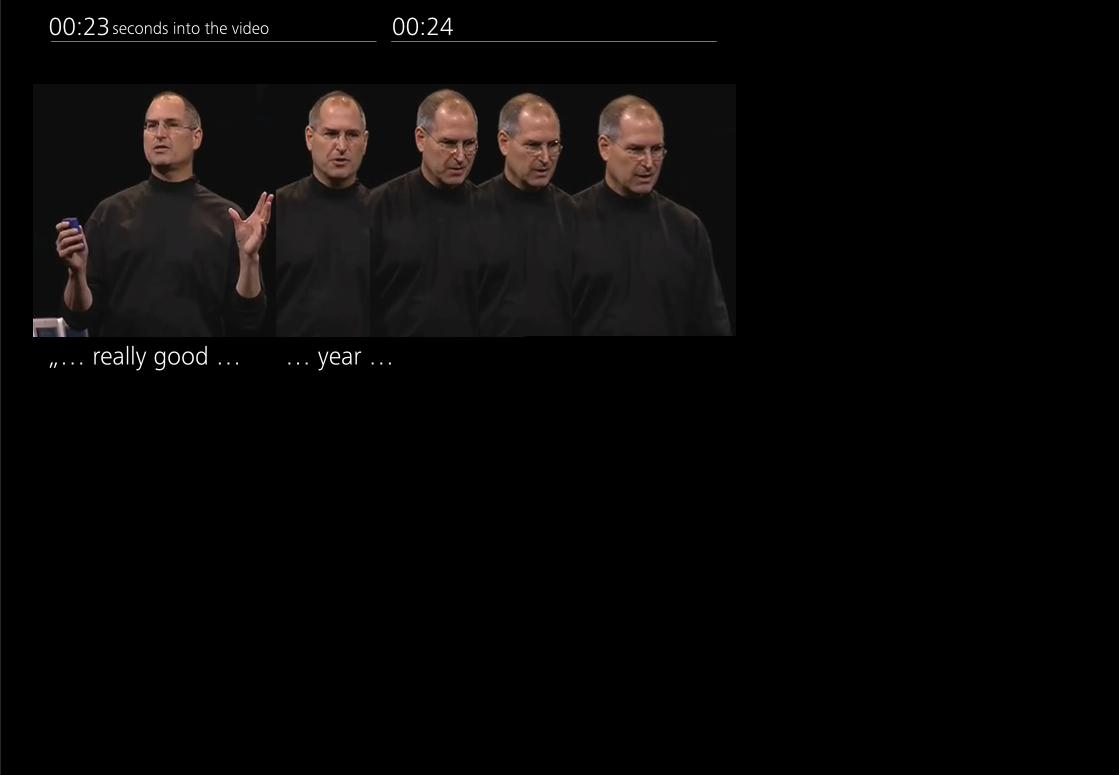
00:23 seconds into the video

00:23
„… really good …
seconds into the video

00:23
„… really good … … year …
seconds into the video
00:23 00:24
„… really good … … year …
seconds into the video

00:23 00:24
„… really good … … year …
seconds into the video
Jobs is looking at the
stage monitor.

00:23 00:24
„… really good … … year … … Ahhh …
seconds into the video
Jobs is looking at the
stage monitor.

00:23 00:24
„… really good … … year
…
… Ahhh …
00:25
… with
seconds into the video
Jobs is looking at the
stage monitor.

00:23 00:24
„… really good … … year
…
… Ahhh …
00:25
… with
seconds into the video
Jobs is looking at the
stage monitor.
… Macs.“

00:23 00:24
„… really good … … year
…
… Ahhh …
00:25
… with
seconds into the video
Jobs is looking at the
stage monitor.
… Macs.“
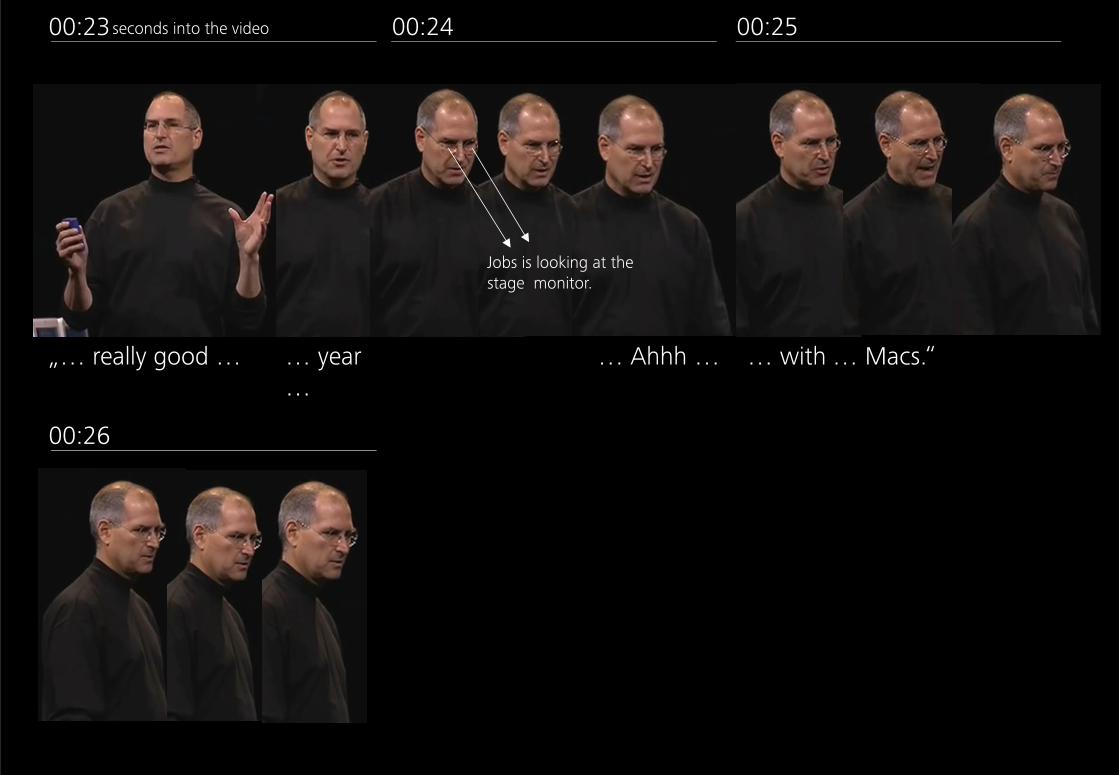
00:23 00:24
„… really good … … year
…
… Ahhh …
00:25
00:26
… with
seconds into the video
Jobs is looking at the
stage monitor.
… Macs.“

00:23 00:24
„… really good … … year
…
… Ahhh …
00:25
00:26 00:27
… with
seconds into the video
Jobs is looking at the
stage monitor.
… Macs.“

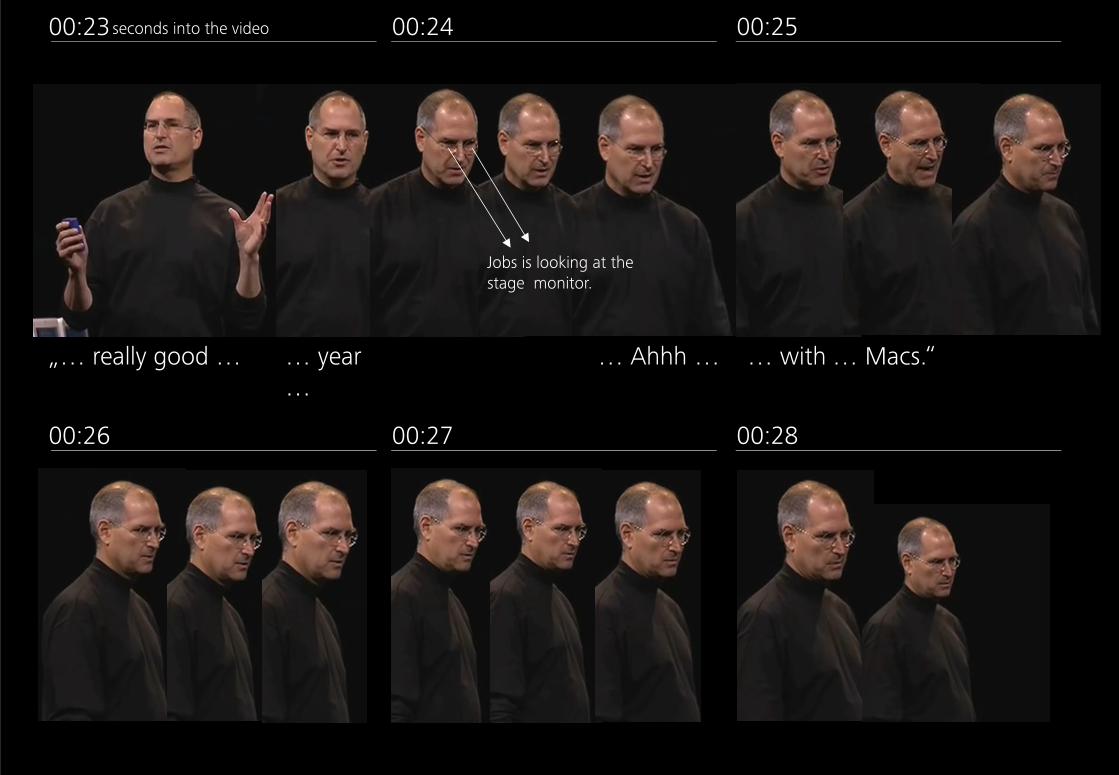
00:23 00:24
„… really good … … year
…
… Ahhh …
00:25
00:26 00:27 00:28
… with
seconds into the video
Jobs is looking at the
stage monitor.
… Macs.“
00:23 00:24
„… really good … … year
…
… Ahhh …
00:25
00:26 00:27 00:28
… with
seconds into the video
Jobs is looking at the
stage monitor.
… Macs.“
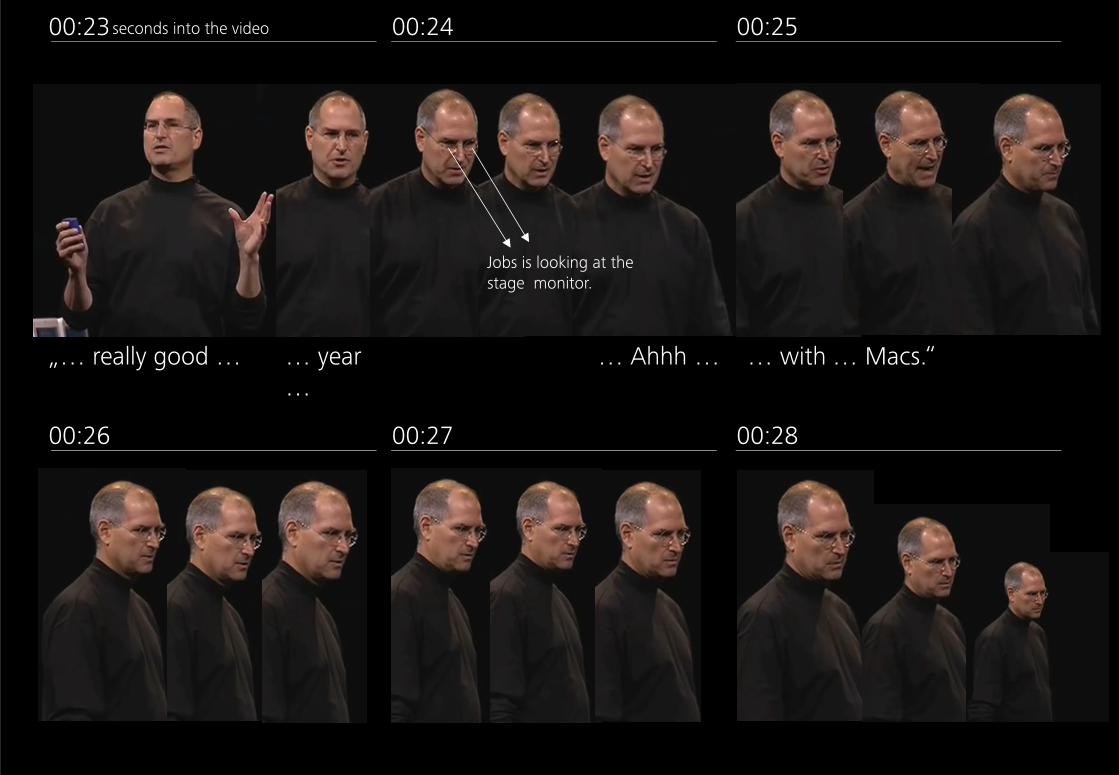
00:23 00:24
„… really good … … year
…
… Ahhh …
00:25
00:26 00:27 00:28
… with
seconds into the video
Jobs is looking at the
stage monitor.
… Macs.“


[loosing focus on audience]

„… so we …“

„… started off the quarter …“
?It is not the quarter.

„… started off the year …“
Right!

„… selling over a million Macs a quarter …
… and did better every quarter after that.“

[regaining focus on audience]

„But the biggest news this year …“[turning to the previously announced change from PowerPC to Intel processors]
00:39 (16 seconds after)

Now what exactly shocked Steve Jobs
in front of a global audience?

Since when are we selling stones?
Or to be precise: Green marble from India?

Since when do we have to cut axes?
What exactly are we trying to hide?

Since when is fake 3D
in our design philosophy?(did you realize it rhymes?)

How can anyone use the arrangement of this scale
to comprehend the columns?

Why do we have to show fake 3D objects
in a fake 3D orientation?(Still did not find out what it is exactly we are trying to hide …)

Why do we have to show numbers twice?

?
And by the way: What exactly am I showing anway?

Here are 5 simple suggetions for Steve Jobs
and everyone who is trying to use professional charts.

Get rid of all decorative elements.
Like in your products …

Q1 Q2 Q3 Q4
Draw a straight line and make it clearly visible.

Q1 Q2 Q3 Q4
Use simple elements to represent your numbers.(Not if you have something to hide …)

1,07
1,18
1,241,25
Q1 Q2 Q3 Q4
Use direct labels and get rid of axe labels.

1,071,18
1,24 1,25
Q1 Q2 Q3 Q4
Do not lie. Not with words and not with charts.
Use accurate scaling to get true representations.
0
1,071,18
1,24 1,25
Q1 Q2 Q3 Q4
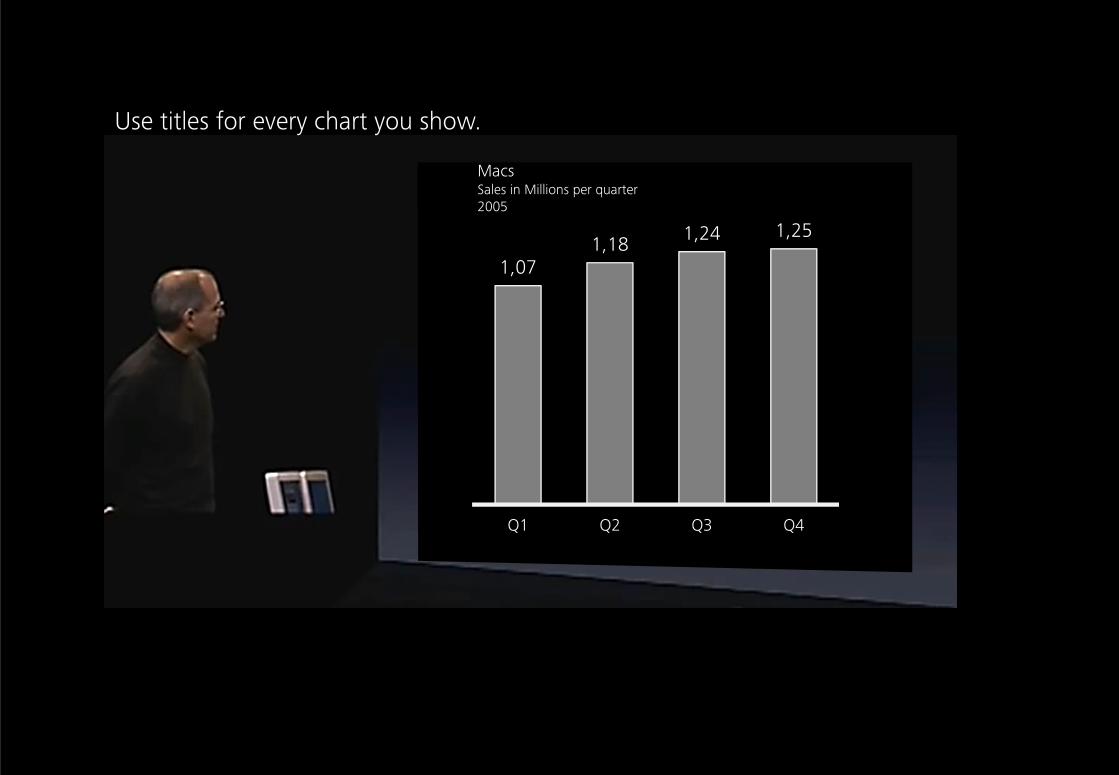
MacsSales in Millions per quarter2005
Use titles for every chart you show.

1,071,18
1,24 1,25
Q1 Q2 Q3 Q4
MacsSales in Millions per quarter2005
Now, what do you think, Steve?
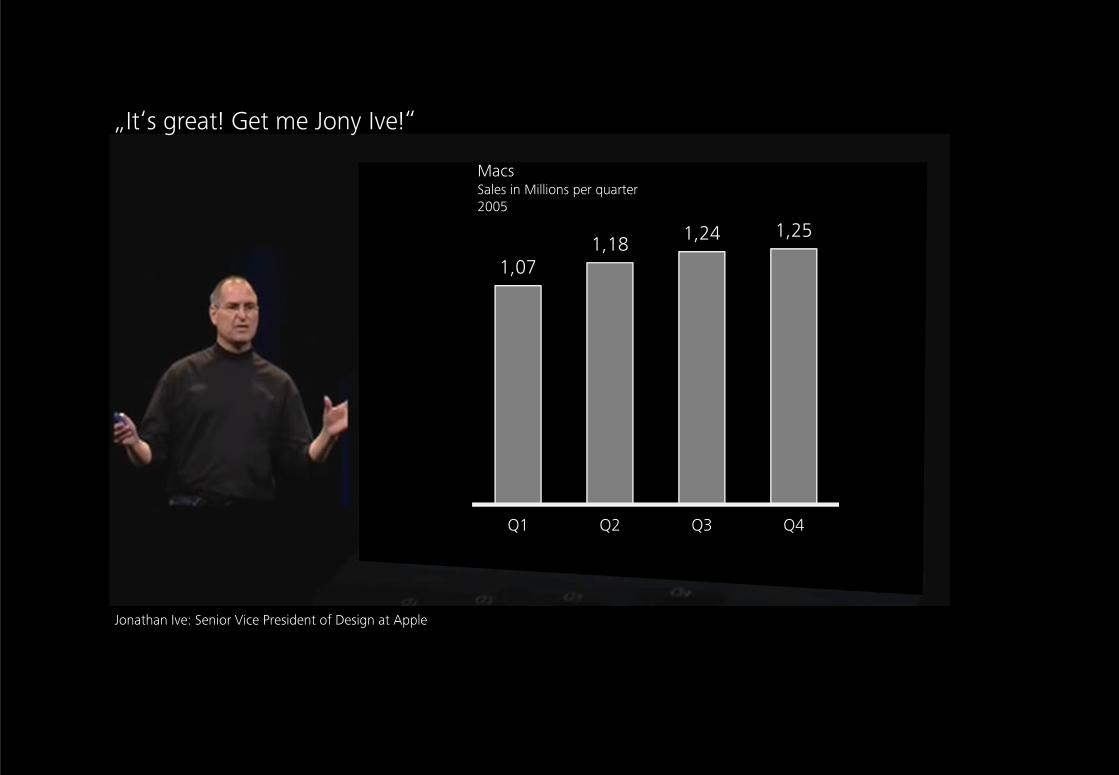
1,071,18
1,24 1,25
Q1 Q2 Q3 Q4
MacsSales in Millions per quarter2005
„It‘s great! Get me Jony Ive!“
Jonathan Ive: Senior Vice President of Design at Apple
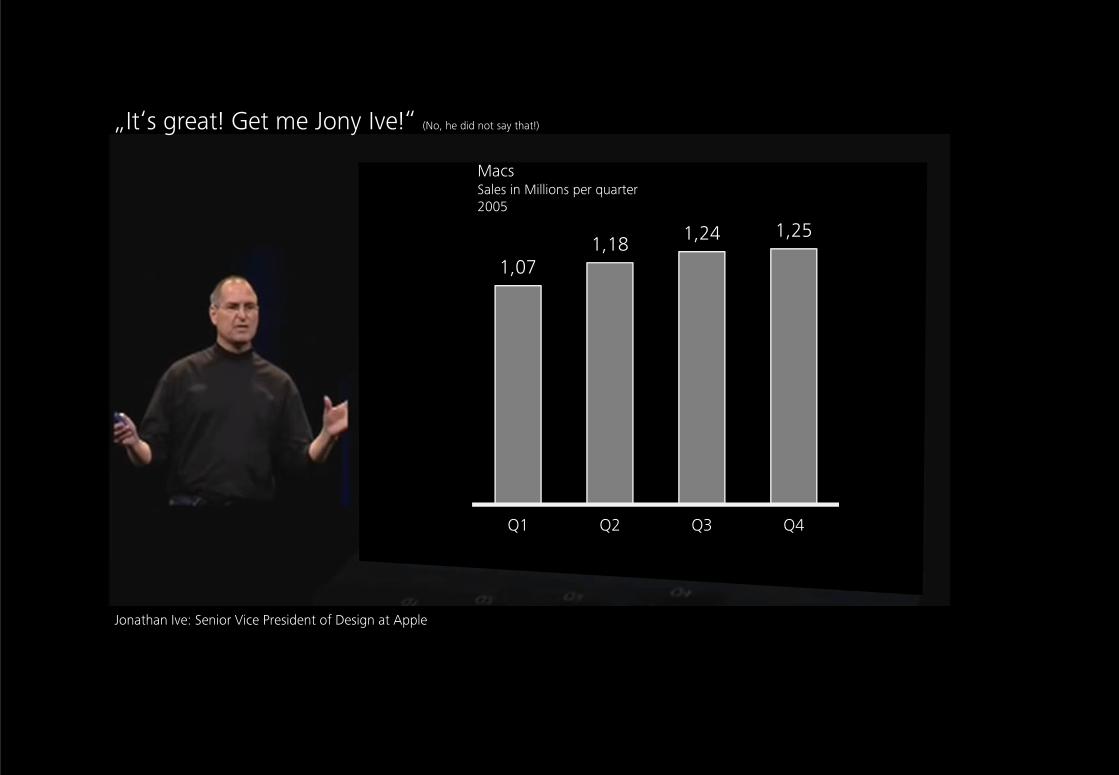
1,071,18
1,24 1,25
Q1 Q2 Q3 Q4
MacsSales in Millions per quarter2005
„It‘s great! Get me Jony Ive!“ (No, he did not say that!)
Jonathan Ive: Senior Vice President of Design at Apple

rethinking business communication
Geschäftskommunikation neu denken
aspektum
www.aspektum.com
switzerland