stifel financial net revenues: $931mm ... sales and trading professionals 37 337 811% ... stifel has...
TRANSCRIPT

Investor Presentation
November 2009
STIFEL
FINANCIAL

Page 1
This presentation may contain “forward-looking statements” within the meaning of the Private Securities Litigation Reform
Act of 1995 that involve significant risks, assumptions and uncertainties, including statements relating to the market
opportunity and future business prospects of Stifel Financial Corp., as well as Stifel, Nicolaus and Company, Inc. and its
other subsidiaries (collectively, “SF” or the “Company”). These statements can be identified by the use of the words
“may,” “will,” “should,” “could,” “would,” “plan,” “potential,” “estimate,” “project,” “believe,” “intend,” “anticipate,”
“expect” and similar expressions. In particular, these statements may refer to our goals, intentions and expectations, our
business plans and growth strategies, our ability to integrate and manage our acquired businesses, estimates of our risks and
future costs and benefits, and forecasted demographic and economic trends relating to our industry.
You should not place undue reliance on any forward-looking statements, which speak only as of the date they were made.
We will not update these forward-looking statements, even though our situation may change in the future, unless we are
obligated to do so under federal securities laws.
Actual results may differ materially and reported results should not be considered as an indication of future performance.
Factors that could cause actual results to differ are included in the Company’s annual and quarterly reports and from time to
time in other reports filed by the Company with the Securities and Exchange Commission and include, among other things
changes in general economic and business conditions, actions of competitors, regulatory actions, changes in legislation and
technology changes.
To supplement our financial statements presented in accordance with Generally Accepted Accounting Principles
(“GAAP”), management uses certain non-GAAP measures of financial performance and liquidity. These non-GAAP
measures are in addition to results prepared by the Company in accordance with GAAP, and should only be considered
together with the Company’s GAAP results.
Forward-Looking Statements
Page 2
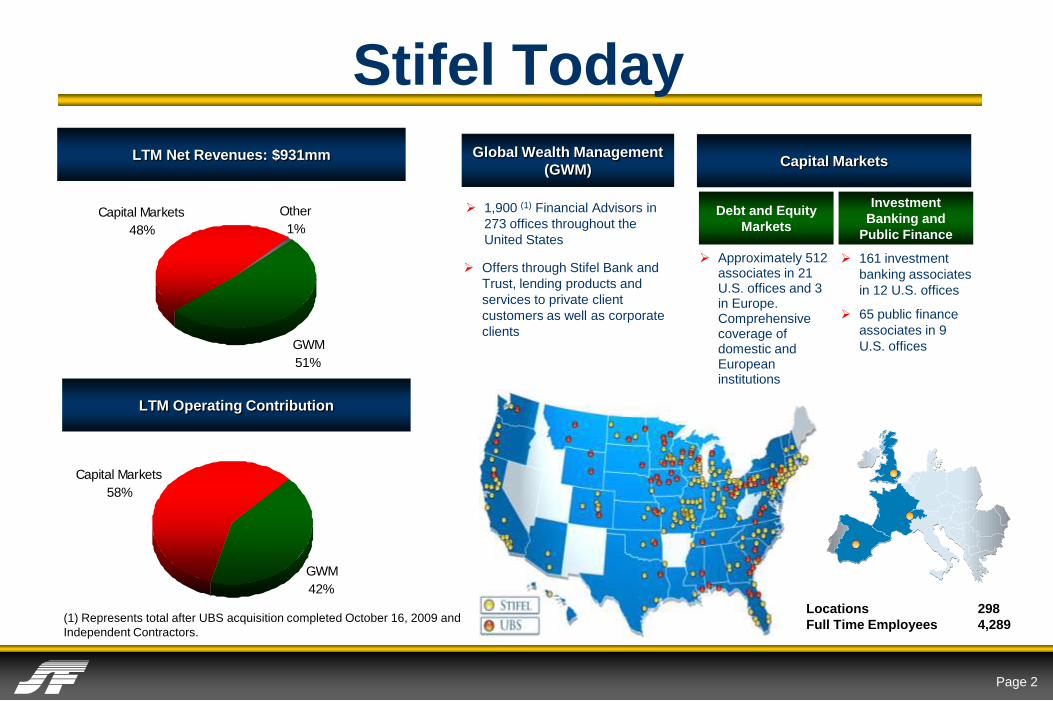
Stifel Today
1,900 (1) Financial Advisors in
273 offices throughout the
United States
Global Wealth Management
(GWM)
Debt and Equity
Markets
Approximately 512 associates in 21 U.S. offices and 3 in Europe. Comprehensive coverage of domestic and European institutions
161 investment
banking associates
in 12 U.S. offices
65 public finance
associates in 9
U.S. offices
Offers through Stifel Bank and
Trust, lending products and
services to private client
customers as well as corporate
clients
LTM Net Revenues: $931mm
LTM Operating Contribution
GWM
42%
Capital Markets
58%
(1) Represents total after UBS acquisition completed October 16, 2009 and
Independent Contractors.
Capital Markets
Investment
Banking and
Public Finance
GWM
51%
Capital Markets
48%
Other
1%
Locations 298
Full Time Employees 4,289

Page 3
Stifel is well-positioned in the current market:
Dislocation creating opportunity for market
share gains
Ability to add talented professionals
Evolving regulatory framework (Stifel is already
regulated by the Fed)
Strong balance sheet
We See Opportunity
Page 4
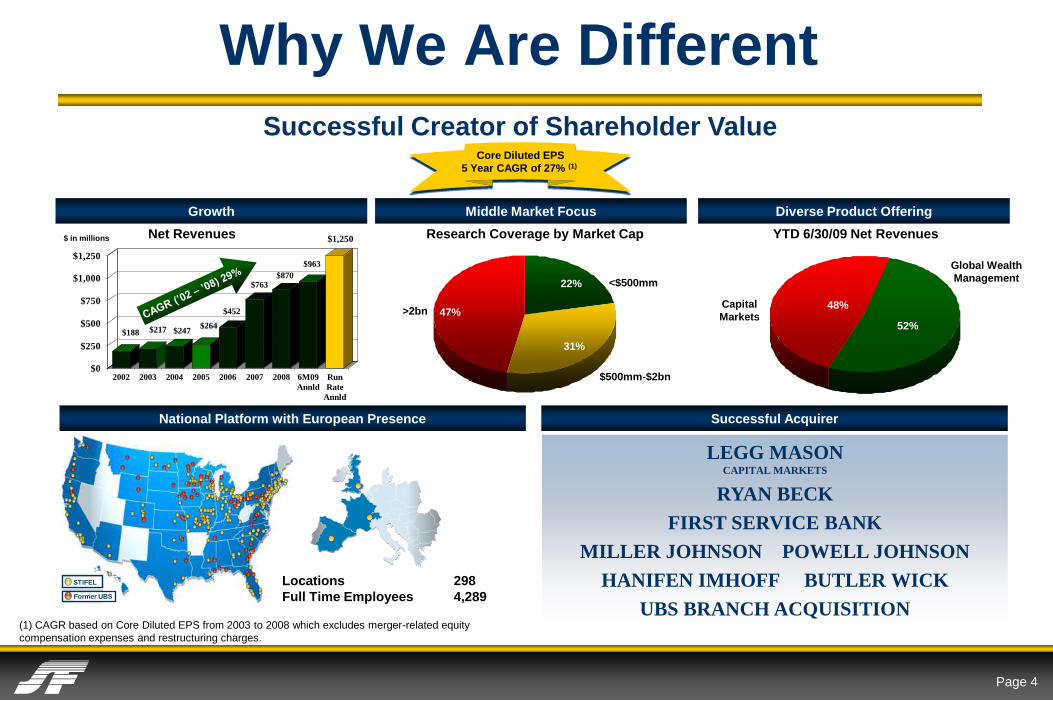
Locations 298
Full Time Employees 4,289
STIFEL
Former UBS
$188 $217 $247$264
$452
$763$870
$963
$1,250
$0
$250
$500
$750
$1,000
$1,250
2002 2003 2004 2005 2006 2007 2008 6M09
Annld
Run
Rate
Annld
`
Why We Are Different
Growth
Successful AcquirerNational Platform with European Presence
Successful Creator of Shareholder Value
$ in millions Net Revenues YTD 6/30/09 Net Revenues
22%
31%
47%
<$500mm
$500mm-$2bn
>2bn
Middle Market Focus
Research Coverage by Market Cap
Capital
Markets
Global Wealth
Management
48%
52%
Diverse Product Offering
LEGG MASONCAPITAL MARKETS
RYAN BECK
FIRST SERVICE BANK
MILLER JOHNSON POWELL JOHNSON
HANIFEN IMHOFF BUTLER WICK
UBS BRANCH ACQUISITION
Core Diluted EPS
5 Year CAGR of 27% (1)
(1) CAGR based on Core Diluted EPS from 2003 to 2008 which excludes merger-related equity
compensation expenses and restructuring charges.

Page 5
$18.36
$24.86
$22.75
$5.91$7.23
$9.02$10.21
$12.35
$0.00
$6.00
$12.00
$18.00
$24.00
$30.00
2002 2003 2004 2005 2006 2007 2008 Q2'09
1,900
1,3151,163
735644621647
543
0
500
1,000
1,500
2,000
2002 2003 2004 2005 2006 2007 2008 Current
$90
$35
$27$20$20
$16
$59 $52
$0
$10
$20
$30
$40
$50
$60
$70
$80
$90
$100
2002 2003 2004 2005 2006 2007 2008 Current
$593
$425
$80 $100$131 $155
$220
$0
$250
$500
$750
$1,000
2002 2003 2004 2005 2006 2007 2008 Q2'09
$67
$27 $29
$73
$40
$21$23
$15
$3
$0
$16
$32
$48
$64
$80
2002 2003 2004 2005 2006 2007 2008 1H
'08
1H
'09
$763$870
$963
$1,250
$452
$264$247$217$188
$0
$300
$600
$900
$1,200
$1,500
2002 2003 2004 2005 2006 2007 2008 6M 09
Annld
Run
Rate
Annld
Stifel is a Growth Story
(1) 2006 - 2008 excludes merger-related equity compensation expenses and restructuring charges. All other years reflect GAAP net income.
(2) Represents total after UBS acquisition completed October 16, 2009 and Independent Contractors.
(3) Pro forma for equity offering competed September 2009
Net Revenues ($MM)
Total Client Assets ($BN) (2)
Core Net Income ($MM) (1)
Financial Advisors (2)
Total Equity ($MM) (3)
Book Value Per Share ($)
$795

Page 6
118
738
0
200
400
600
800
2004 Current
Stifel’s Investment in Expanding Client Capabilities
Stifel’s Quarterly Revenue and Stock Price Growth
$-
$50
$100
$150
$200
$250
$300
$-
$10
$20
$30
$40
$50
$60
Revenue
Price
2004
Q1 Q1
2005 2006 2007 2008 2009
Revenue ($M) Stock Price
Q2Q2 Q4Q3Q1 Q2 Q4Q3Q1 Q2 Q4Q3Q1 Q2 Q4Q3 Q1 Q2 Q4Q3
Capital Markets Global Wealth Management Research Coverage
Victor Nesi hired as Director of
Investment Banking and Co-Director
of Capital Markets
Hired 13 new Managing Directors
over past 18 months
Professionals & Support
705
3,178
0
1,000
2,000
3,000
2004 Current
Financial Advisors, Bank Associates & Support(1)
229
898
0
250
500
750
1,000
2004 Current
(1) Represents total after UBS acquisition completed October 16, 2009 and Independent Contractors.
Companies Covered
January 21, 2009 – Stifel research sweeps both #1
rankings in 2008 StarMine Survey
May 19, 2009 – Stifel research analysts win fourteen
awards in FT / StarMine Analyst Survey
June 4, 2009 – Stifel analysts win six awards in the
Wall Street Journal’s Best on the Street Survey

Page 7
Growth – “The Numbers”
(1) Represents total after UBS acquisition completed October 16, 2009 and Independent Contractors.
% Change
Business Units 2004
Since
2004 YTD
Global Wealth Management
Financial Advisors 621 1,900 206% 44% 583
Branch Support 284 1,011 256% 62% 388
Offices 86 273 217% 32% 66
Stifel Bank & Trust Support Associates 0 74 n/a 21% 13
Capital Markets
Sales and Trading Professionals 37 337 811% 11% 34
Investment Banking / Analyst / Public Finance / Support 81 401 395% 17% 57
Infrastructure
Support Associates 195 510 162% 34% 128
Total Associates 1,384 4,289 210% 39% 1,203
Total
As of
9/30/09
YTD Net
Additions
(1)

0
500
1,000
1,500
2,000
2,500
3,000
3,500
4,000
4,500
1997 1998 1999 2000 2001 2002 2003 2004 2005 2006 2007 2008 2Q 09
Annld
Run
Rate
Annld
$0
$200
$400
$600
$800
$1,000
$1,200
$1,400
Total Associates Net Revenues (millions)
Correlation between Associates and Revenue Growth

Page 9
Significant Employee Ownership
(1) Approximate percentages include all fully diluted shares, units, options and shares owned by Stifel’s former Chairman as of September 4, 2009.
27%
40%Institutional
Other
Insider (1)
33%
Page 10
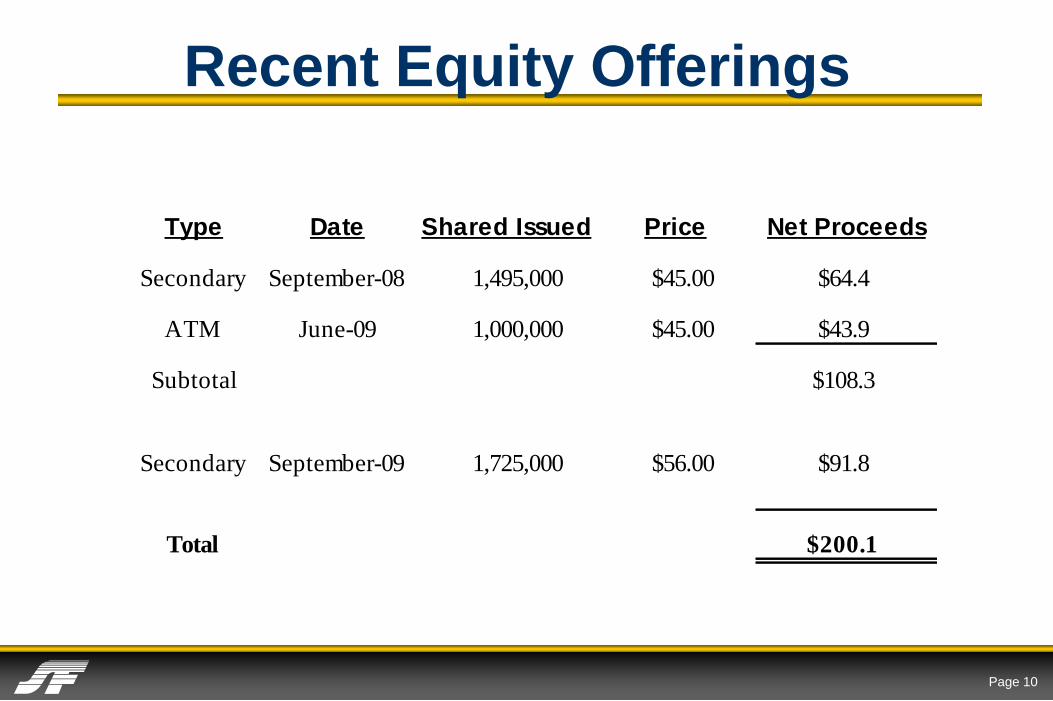
Recent Equity Offerings
Type Date Shared Issued Price Net Proceeds
Secondary September-08 1,495,000 $45.00 $64.4
ATM June-09 1,000,000 $45.00 $43.9
Subtotal $108.3
Secondary September-09 1,725,000 $56.00 $91.8
Total $200.1

Page 11
Execution of Growth Strategy
The September 2008 and June 2009 common offerings netted proceeds of $108 million
Since September 1, 2008, Stifel has invested approximately $172 million of capital through
both organic growth and acquisitions
$ 9
$ 7 6
$ 8 7
$ 1 7 2
$ 0
$ 20
$ 40
$ 60
$ 80
$ 100
$ 120
$ 140
$ 160
$ 180
$ 200
But l er Wi ck UBS Or gani c Gr owth T otal Ut i l i zed
Capi tal
( $ M )
Organic Growth

Page 12
Expand private client footprint in the U.S.
Expand institutional equity business both domestically
and internationally
Grow investment banking
Focus on asset generation within banking operations
Enhance and accelerate Stifel Bank and Trust strategy
Approach acquisition opportunities with discipline
Consolidation and Industry Retrenchments Drive our Growth
Overall Growth Strategy

Page 13
$11.8$17.2
$25.1
$48.9 $45.7
$71.3
24,98824,17721,803
13,0107,616 9,635
$0
$20
$40
$60
$80
2004 2005 2006 2007 2008 6/30/09
0
10,000
20,000
30,000
40,000
Total AUM # of Accounts
Net
Revenues ($MM)
Operating
Contribution ($MM)
Overview
Provides securities brokerage services and Stifel Bank products
1,900 Financial Advisors in 273 branch offices in 41 states and
the District of Columbia at October 16, 2009*
Proven organic growth and acquirer of private client business
Organically grown to hire 320 advisors in 25 offices in 2009
Acquired Butler Wick & Company, Inc., adding 75 advisors
in 23 offices across three states in December 2008
Acquired 56 branches from UBS Financial Services, Inc.
with 322 advisors
Strategy focused on recruiting experienced advisors with
established client relationships and further expanding our U.S.
footprint
Fee-Based Account Assets and #
of Accounts ($000’s)
$499
$750
$471$441
$231$197$187
$0
$200
$400
$600
$800
2004 2005 2006 2007 2008 6M09
Annld
Run Rate
Annld
* Represents total after UBS acquisition completed October 16, 2009 and Independent Contractors.
(1) Source: SIFMA 2008 Year Book Retail RRs.
(2) Source: Company Data, Goldman Sachs Research. $ in billions.
$79
$98$96
$50$48$48
$0
$30
$60
$90
$120
$150
2004 2005 2006 2007 2008 6M09
Annld
Global Wealth ManagementRank Company Headquarters RRs
(1)Client Assets
(2)
1 Citigroup/Smith Barney New York, NY 19,296 $1,034
2 Wells Fargo Securities St. Louis, MO 16,678 1,000+
3 Merrill Lynch & Co. New York, NY 15,880 1,475
4 Edward D. Jones St. Louis, MO 10,532 400
5 UBS Financial Services, Inc. Weehawken, NJ 8,182 537
6 RBC Dain Rauscher Minneapolis, MN 2,157 177
7 Stifel Proforma St. Louis, MO 1,891 74
8 Oppenheimer New York, NY 1,395 NA
9 Raymond James Financial New York, NY 1,218 170
10 Morgan Keegan & Co. Memphis, TN 1,075 NA
11 Janney Montgomery Philadelphia, PA 857 NA
12 Robert Baird Milwaukee, WI 591 NA
13 Hilliard Lyons Louisville, KY 410 NA
Strengths of our Brokerage Position
($B)

Page 14
Global Wealth Management Growth
GWM Account Growth
* Represents total after UBS acquisition completed October 16, 2009 and Independent Contractors.
GWM Broker Growth
172,751
180,639
213,973
340,235
375,165
651,354
0 100,000 200,000 300,000 400,000 500,000 600,000 700,000
October 2009
December 2008
December 2007
December 2006
December 2005
December 2004
Retail Accounts
621
644
735
1,163
1,315
1,900
0 500 1,000 1,500 2,000
October 2009
December 2008
December 2007
December 2006
December 2005
December 2004
Investment Executives
GWM Branch Growth
86
92
111
148
196
273
0 50 100 150 200 250 300
October 2009
December 2008
December 2007
December 2006
December 2005
December 2004
Retail Branches
Since the acquisition of Butler Wick, 717
Financial Advisors have joined Stifel, 397
through both the Butler Wick and UBS
acquisitions*
Stifel expects to see opportunities resulting
from continued dislocation from
competitors mergers
* *
*
Page 15
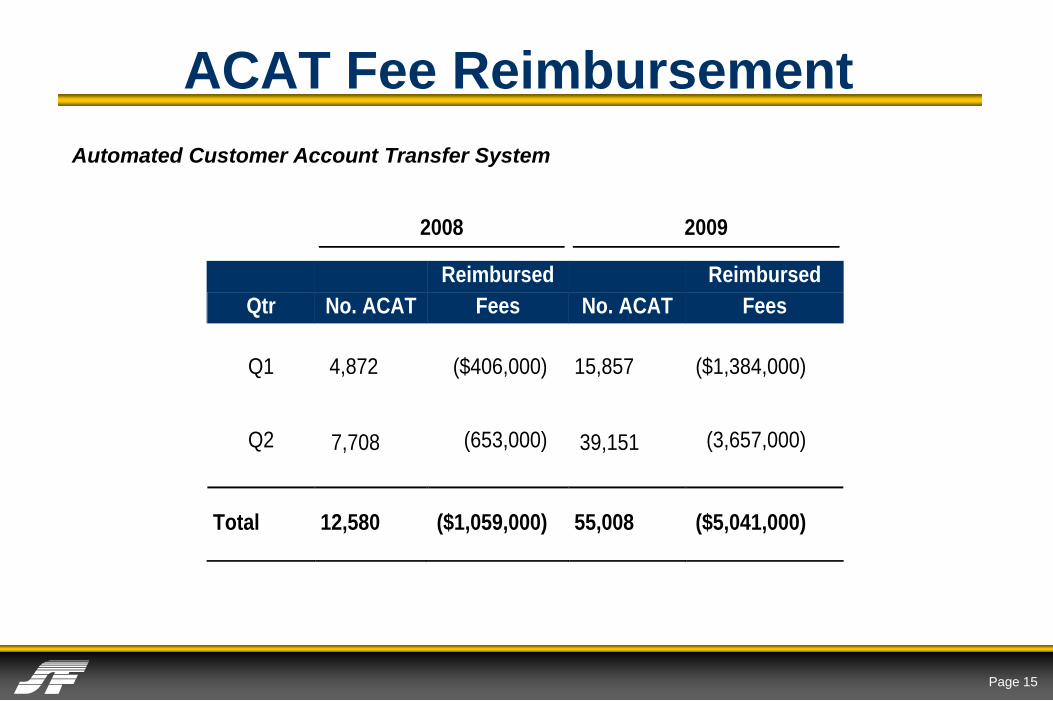
ACAT Fee Reimbursement
2008 2009
Qtr No. ACAT
Reimbursed
Fees No. ACAT
Reimbursed
Fees
Q1 4,872 ($406,000) 15,857 ($1,384,000)
Q2 7,708 (653,000) 39,151 (3,657,000)
Total 12,580 ($1,059,000) 55,008 ($5,041,000)
Automated Customer Account Transfer System

Page 16
Same Store Sales Commission ($ Millions)FAs Hired Prior to January 2008
830 Financial Advisors
$328
$0
$100
$200
$300
$400
$500
$600
$700
2008

Page 17
Same Store Sales Commission ($ Millions)FAs Hired Prior to January 2008
10%
YOY
830 Financial Advisors
$328 $296
$0
$100
$200
$300
$400
$500
$600
$700
2008 Annualized 2009

Page 18
Same Store Sales Commission ($ Millions)FAs Hired Prior to January 2008
1% YOY
830 Financial Advisors
$328 $296$332
$0
$100
$200
$300
$400
$500
$600
$700
2008 Annualized 2009 Last 2 Mo Annlzd

Page 19
Potential GWM Commission ($ Millions)
$332$290
$622
$0
$100
$200
$300
$400
$500
$600
$700
2008 Group New Hires Potential GWM Commissions
830 Financial
Advisors
Potential
775 New
Financial
Advisors

Page 20
14%
46%
40%
Cash $145MM
Investment Securities& Cash $495MM
Loans Receivable $418MM
59%
14%
10% 9%
8%Residential Real
EstateCommercial Real
EstateConsumer
Home Equity
Lines of CreditCommercial
Construction and
LandStock Secured
Loans
Stifel Bank
3% 8%8%
75%
6%
ABS $15MM
Corporates $41MM
Agencies $1MM
CMBS $38MM
Agency MBS $367MM
MBS $32MM
Muni's $1MM
Annualized Interest Earning AssetsCurrent Loan Portfolio
Residential Real Estate
$51.5MM
Commercial Real Estate
$36.3MM
Consumer $0.4MM
Home Equity Lines of Credit
$33.2
Commercial $29MM
Construction and Land
$1.1MM
Stock Secured Loans
$225.8MMTotal: $418MM
Current Investment Portfolio
Total: $495MMTotal: $1 Billion
Overview
April 2007- Acquired First Service Financial Company and
its wholly-owned subsidiary FirstService Bank, a
St. Louis-based Missouri commercial bank
Growth since acquisition
Assets of $1 billion, up over 600% from $130 million at
acquisition announcement
Deposits of $1 billion, up over 900% from $99 million
at acquisition announcement
Strategy and Opportunity
Maintains high asset quality:
$1.9 million Non-performing loans to gross loans
$1.7 million LTM losses to average loans
Offer banking products within the GWM client base
Establish trust services during 2010

Page 21
738
184
517 510
608
716
0
200
400
600
800
1,000
2004 2005 2006 2007 2008 9/30/09
$56 $61
$204
$305
$390
$461$500
$0
$200
$400
$600
2004 2005 2006 2007 2008 6M 09
Annld
Run
Rate
Annld
Overview
Provides securities brokerage, trading, research services,
as well as underwriting and corporate advisory
738 associates located in 21 offices in the U.S.
Opportunistically expanding talent pool
Victor Nesi, Director of Investment Banking and
Co-Director of Capital Markets (June 2009)
William Heinzerling, Head of Fixed Income Capital
Markets (May 2009)
Hired 11-person sales & trading team from Bear
Stearns, a four-person convertible securities team
from Banc of America, and strategic hires from
Wachovia, JPMorgan, Barclays and others
$116
$92
$61
$43
$16$15
0
20
40
60
80
100
120
2004 2005 2006 2007 2008 6M09
Annld
Net Revenues ($MM) Operating Contribution ($MM) # of Employees
Highlights
Recognized Industry Expertise and Execution Capabilities
June 4, 2009 – Stifel analysts win six awards in the
Wall Street Journal’s Best on the Street Survey
May 19, 2009 – Stifel research analysts win fourteen
awards in FT / StarMine Analyst Survey
April 22, 2009- Stifel M&A Advisory and Corporate
Finance Transactions win “Deal of the Year” honors
March 19, 2009 – Stifel Nicolaus wins Consumer
M&A Deal of the Year Award
January 21, 2009 – Stifel research sweeps both #1
rankings in 2008 StarMine Survey
Research Coverage Stats (62 senior analysts covering
898 companies across 12 industry sectors)
Capital Markets

Page 22
Capital Markets Market Opportunity
$150 billion annually with dislocation and deleveraging resulting in significant share opportunity
T reasuries &
A gencies
$ 30 billio n
C o rpo rates
$ 9 billio n
Equit ies
$ 13 billio n
M o rtgages
$ 54 billio n
A dviso ry
$ 21 billio n
D ebt C apital
M arkets
$ 14 billio n
Equity C apital
M arkets
$ 13 billio n
Sources: Investment Banking fees per Dealogic.
(1) Revenue data as of the first six months of 2009.
(2) Excludes fees for restructuring services driven by accelerating default rates and maturities.
Large Available Market Competitive Opportunity
~$50 billion annually in Investment Banking Fees (2)
$100+ billion annually in Secondary Commissions
Strong opportunity to grow our investment
banking share
Investment Banking Revenues (1)
0%
5%
10%
15%
20%
25%
30%
35%
40%
45%
JMP KBW PJC RJF TWPG SF
Investment Banking (% of Capital Markets Rev.)
Peer Avg. 38%

Page 23
Run Rate AnnualizedEstimated Revenue
Global Wealth Management $700 - $800
Capital Markets $450 - $550
Total $1,150 - $1,350
$0
$250
$500
$750
$1,000
$1,250
2002 2003 2004 2005 2006 2007 2008 Q2 09
Annld
Run
Rat e
AnnldGWM CM
$183 $211 $243 $259
$435
$743$862
$1,250
$963

$963$868$763$452
10%
14%14%15%
$0
$200
$400
$600
$800
$1,000
$1,200
2006 2007 2008 6M09 Annld
0%
5%
10%
15%
20%
Net Revenues (millions) Core Pre-Tax Margins
Pre-Tax Margins
*2006 through 2008 reflects CORE earnings. 2009 reflects GAAP.

Page 25
($ in thousands)
Net
Revenues
Pre-Tax
Operating
Contributions
% of
Net Rev
As Reported 481,486$ 48,264$ 10%
Pro Forma Adjustments
Private Client Group (PCG)
PCG established business 22,207 9,929
PCG new business (29,445) 6,110
Bank excess liquidity 3,000 3,000
Firm overhead - 3,360
Pro Forma 477,248$ 70,663$ 15%
Normalized Pro FormaSix Months ended June 30, 2009
Note: Excludes merger-related equity compensation expenses and restructuring charges.

Page 26
$80$35
$100$35
$131
$35$155
$70$220
$70$425
$95
$595
$82
$795
$82
$0
$250
$500
$750
$1,000
2002 2003 2004 2005 2006 2007 2008 Q2 2009
$5.91$7.23
$9.02 $10.21
$12.35
$18.36
$22.75
$24.86
$0.00
$5.00
$10.00
$15.00
$20.00
$25.00
2002 2003 2004 2005 2006 2007 2008 Q2 2009
Leverage Ratio(2)
Total Assets ($ millions) Total Capitalization ($ millions) (1)
Book Value Per Share
(1) Defined as stockholder’s equity plus the trust preferred securities. Total assets at 6/30/09 with September 2009 offering proceeds.(2) Defined as assets divided by total capitalization (equity + trust preferred). 6/30/09 includes September 2009 offering proceeds.
Stifel Balance Sheet
$115 $135$166
$225$290
$520
$678
$877
$423 $412 $382
$842
$1,085
$1,499$1,562
$2,288
$0
$600
$1,200
$1,800
$2,400
2002 2003 2004 2005 2006 2007 2008 Q2 2009
`
3.7x
3.1x
2.3x
3.7x 3.7x
2.9x
2.3x
2.7x
.0x
1.0x
2.0x
3.0x
4.0x
2002 2003 2004 2005 2006 2007 2008 Q2 2009

Page 27
($ in thousands)
Total Assets (1)
2,379,792$
Stockholders' Equity (2)
794,502$
Debentures to:
Stifel Financial Capital Trust II - LIBOR plus 1.70% (fixed at 6.38% until 9/30/10), due 9/30/35 35,000$
Stifel Financial Capital Trust III - LIBOR plus 1.85% (fixed at 6.79% until 6/6/12), due 6/6/37 35,000
Stifel Financial Capital Trust IV - LIBOR plus 1.85% (fixed at 6.78% until 9/6/12), due 9/6/37 12,500
Total Debentures (average 6.64% per annum) 82,500$
Total Capitalization 877,002$
Ratios:
Equity to Assets 33%
Capitalization to Assets 37%
Debentures to Equity 10%
Leverage Ratio(3)
2.7x
Equity Capitalization(4)
3.0x
(1) Total assets at 6/30/09 with September 2009 offering proceeds
(2) Stockholders’ Equity at 6/30/09 with September 2009 offering proceeds
(3) Defined as assets divided by total capitalization.
(4) Defined as assets divided by equity.
Capital Structure

Page 28
Level 3 Assets
Carrying Value Change
($ in thousands) 9/30/09 12/31/08
Auction Rate Securities 55,786$ 18,509$ 37,277$
Stifel Bank & Trust Investments 11,700 10,423 1,277
Trading Securities 767 4,161 (3,394)
Other Investments 5,093 5,169 (76)
73,346$ 38,262$ 35,084$
Percentage of Equity 9% 7%

Page 29
Diversified well balanced business
Growth story
Industry dislocation provides significant
growth opportunities
Scalable platform
Disciplined acquirer and skilled integrator
Proven steward of investor capital
Why Buy Stifel Financial (SF)

Page 30
Q&A