stiffness and ultimate capacity of typical abutment ... · stiffness and ultimate capacity of...
TRANSCRIPT
Stiffness and Ultimate Capacity of Typical Abutment- Embankment Systems O.N. Taskari & A.G. Sextos Aristotle University of Thessaloniki, Greece SUMMARY: One of the key modeling issues that affects the seismic response of a bridge is the realistic consideration of the abutment-embankment system compliance. Previous research studies have shown that depending on the earthquake ground motion intensity, the abutment-embankment system flexibility may play a dominant role on the overall bridge response. The scope of this paper is to propose simplified force-displacement (P-y) relationships for five typical abutment-embankment systems of California overpasses considering, in a refined numerical manner, the resistance of the abutment-foundation system. After appropriate calibration of the finite element models developed to UCDavis and UCLA test results, P-y relationships were assembled considering the distinct resisting mechanisms that are activated prior and after the backwall failure. Finally, an effort is made to quantify the uncertainty induced by the backfill and foundation soil properties. Keywords: abutment-embankment system, material uncertainty, soil-structure interaction, pushover analysis 1. INTRODUCTION Advanced nonlinear finite element analysis is nowadays commonly used in the framework of the seismic assessment of bridges. Depending on the intended sophistication level, these models vary in terms of the phenomena considered as well as the respective modeling refinement. One of the key modeling issues that affects the seismic response of a bridge is the realistic consideration of the abutment-embankment system compliance. Previous research studies have shown that, depending on the earthquake ground motion intensity, the abutment-embankment flexibility may play a dominant role to the overall response of a bridge. Particularly for the case of short bridges, the stiffness and mass of the embankments may substantially reduce the contribution of the column resistance on the overall response of the bridge at high shaking intensities (Inel, 2002; Kotsoglou and Pantazopoulou, 2007). Moreover, earthquake-induced damage has highlighted the impact of the deck-abutment gap closure, on the backfill excessive deformation and the subsequent deck unseating. This phenomenon of the embankment-backfill-abutment-deck interaction is multi-parametric and complicated, especially from a dynamic viewpoint, since it is a continuous interplay between the dynamic characteristics (in terms of stiffness and damping) of the supporting sub-systems and those of the incoming seismic motion. The simplest way to represent the lateral stiffness of the abutment-embankment system is to substitute it with appropriate static springs attached to the ends of the bridge deck (Goel and Chopra, 1997). In this case, it is quite common to determine the transverse and vertical embankment static stiffness according to Wilson and Tan (1990a) based on linear elastic plain strain analysis and the measured response of the Meloland Road Overpass (MRO). Werner et al. (1987) proposed a model that accounts for both the mass and stiffness of the embankment. This method, however, was calibrated empirically to the MRO and thus, it cannot easily be extrapolated to other cases. Based on the shear wedge model, Zhang and Makris (2002) developed analytical expressions for evaluating the dynamic transverse embankment stiffness. These values can be used for the longitudinal embankment stiffness as well. Analytical models of the abutment stiffness as a function of the displacement also have been
developed by Siddharthan et al. (1997) and Shamsabadi et al. (2005). Based on recorded data (Wissawapaisal and Aschheim, 2000; Inel and Aschheim, 2004) or on analytical models (Zhang and Makris, 2002; Kotsoglou and Pantazopoulou, 2009), values for the embankment critical length and the embankment mobilized mass have also been suggested. Normalized embankment capacity curves for common embankment fills and dimensions of short bridges responding in the transverse were also proposed by Inel and Aschheim (2004), while simplified lateral force-displacement backbone curves for abutment walls of varying height for a granular and a cohesive backfill soil material were more recently introduced by Shamsabadi et al. (2010). The latter curves were derived assuming a log-spiral failure surface coupled with hyperbolic soil stress-strain relationships implemented in refined finite element models and they are quite practical for design purposes. Apart from the analytical models, full scale testing has been conducted at the University of California, Davis (UCD) (Romstad et al., 1995) on a 1.67m high abutment wall with a clayey silt backfill. Similar tests have also been performed at the University of California, San Diego (Bozorgzadeh, 2007) to investigate the effect of backfill properties, backfill height and vertical wall movement on the stiffness and capacity of the abutments. A full-scale cyclic lateral load test of an abutment backwall with granular backfill was also conducted at the University of California, Los Angeles (UCLA, Lemnitzer et al., 2009). In all cases, the height of the backwall and the properties of the filling materials were appropriately selected to comply with the bridge design practice in California. Despite the aforementioned works and the documented importance of considering the abutment-embankment stiffness in a reliable manner, most modern seismic codes and design guidelines only provide approximate or simplified expressions. One reason for this simplification is the computational implications related to the three-dimensional geometry and the heavily non-linear response of the backfill soil primarily, both inducing a significant amount of additional epistemic (modeling) uncertainty. A second reason is the material uncertainty itself, associated with the properties of the embankment and backfill soil formations. In fact, the only quantitative guidance currently available worldwide is provided by Caltrans (Caltrans, 2010), based on the aforementioned passive earth pressure tests and the corresponding force-deflection relationships derived. In particular, for fill materials that comply with the Caltrans Standard Specifications requirements, the initial longitudinal stiffness of the embankment can be taken equal to 28.7 kN/mm per meter of the width of the wall. In case of other fill materials, the value of 14.35kN/mm/m may be used. The ultimate abutment load is then limited by a maximum passive resistance of 239kPa. Notwithstanding the value of the above well-controlled experiments which have significantly contributed to the understanding of the physical problem, one limitation that could be expressed from a designer’s point of view is that, the overall approach is essentially independent of the abutment type and to some extent of the soil properties. It is recalled that the latter assumed compliant to the experimental ones. They guidelines are also almost direction independent since only minor adaptations are prescribed with respect to the transverse abutment-embankment stiffness. The potential contribution of the abutment foundations in the resistance of the entire foundation-abutment system prior to the failure of the backwall is also not explicitly accounted for in the Caltrans guidelines. Given the above, the Caltrans approach is a precious, well justified, experimentally-based approach; however, it is deemed that there is space for further tuning to address more explicitly the issues described above. Along these lines, the scope of this paper is to improve the existing P-y relationships by considering five characteristic abutment-embankment systems of typical California overpasses with the use of targeted, refined, three dimensional finite element models and detailed calibration with the results of the aforementioned UCD and UCLA experimental tests. Moreover, an effort is made to quantify the contribution of the abutment foundation on the entire system stiffness prior to backwall failure in both the longitudinal and transverse direction. An effort is also made to quantify the variability of the stiffness predicted due to the uncertainty in the backfill and foundation soil properties. The justification of the results is presented in the following.
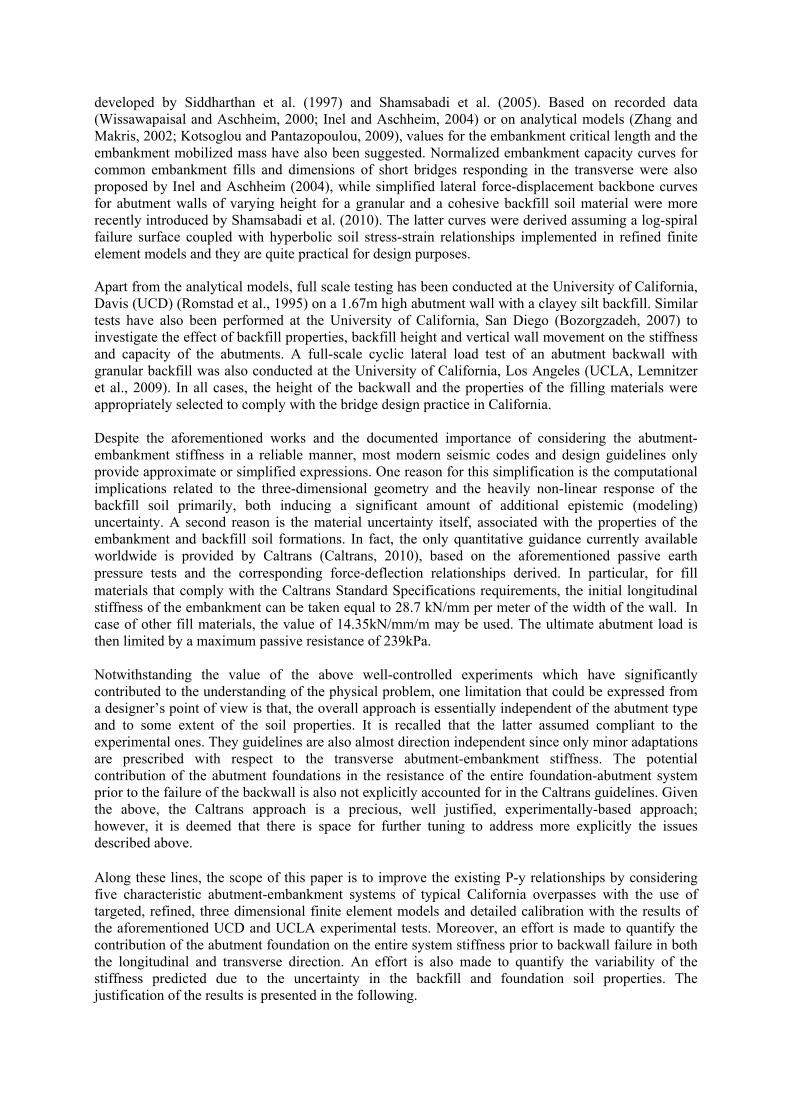
2. OVERVIEW OF THE CASES STUDIED For the purpose of this study, the abutment-embankment systems of five typical Californian reinforced concrete overpasses (namely MGR, Adobe, W180, La Veta and Route 14) were selected (Aviram et al., 2008). Their superstructure consists of a box-girder section resting on typical column bents and seat type abutments. The geometry of the cases studied is illustrated in Fig. 2.1 and is summarized in Table 2.1. In general, the total abutment height H varies from 4.15m to 5.30m, while the backwall height which is used for the adjustment of the initial abutment stiffness as proposed by Caltrans (Caltrans, 2010) varies from 1.25m to 2.35m. In terms of the overall length L, the abutments extend from 13.00 to 23.50m, with the wing walls also ranging from 5.25m to 6.0m. The stem wall width b is of the order of 1.0m. The width of the parapet for all the six abutment types is equal to 30cm while the wing wall height is taken equal to 90cm. It is noted that in contrast to all the other bridges studied which are supported on pile groups, the abutments of the Route 14 bridge are resting on shallow foundations. The compressive strength of the unconfined concrete is 25MPa for both piles and abutments in all cases, thus, corresponding to an elastic modulus equal to E=30.5MPa. The actual soil profiles of the embankment-abutment systems under study are summarized in Table 2.1. Finally, the slope of all the examined embankment cross sections was taken equal to 2:1 (Fig. 2.1).
Figure 2.1 Configuration of a typical seat type abutment and embankment under study Table 2.1. Geometrical data of the five abutment-embankment systems
H (m)
h1 (m)
h2 (m)
b (m)
L (m)
Lww (m)
Lpile (m)
Dpile (m)
Pile Group
Soil Profile (blow count in parenthesis)
MGR 5.00 1.90 2.35 1.10 14.00 5.30 15.00 0.75 5x1/6x1 5m rock, 5m sandy gravel
Adobe 4.40 1.25 2.25 1.20 13.00 6.00 15.00 0.40 2x10 2m sandy silt (13), 12m clayey silt
(15-20), 3m medium sand(45)
W180 5.30 2.35 2.25 1.20 13.00 5.70 13.00 0.40 3x10 3m silty sand (15), 6m med.fine sand(27), 6m
med/fine sand(40) La Veta 4.15 1.90 1.60 1.15 23.50 5.25 17.00 0.60 2x11 5m fine/medium
sand, 4m dense sand Route 14 4.70 1.75 2.25 1.00 16.50 5.35 - - - -

3. NUMERICAL ANALYSES OF THE ABUTMENT-EMBANKMENT SYSTEMS All abutment-embankment systems were modeled in three dimensional space using the finite element program ABAQUS (ABAQUS, PRE 2004). Tetrahedral solid elements (C3D4 ABAQUS type) were used for the backfill and embankment soil discretization while the abutment, pile groups and foundation soil mesh was formed with brick elements (C3D8). A dense finite element grid was adopted for the areas where stress concentration was anticipated, i.e., at the vicinity of the abutment, backfill and pile groups. The approach embankment was modeled along a distance of 50m, that is, at a length greater than the critical embankment length lc predicted analytically according to Zhang and Makris (2002). The foundation soil volume considered corresponds to a cube with dimensions 5Lx2Lxlc, which are deemed adequate to ensure smooth attenuation of the earthquake-induces stresses with distance. The boundary conditions of the model were assumed fixed at its base and rolled along the lateral surface. For illustration purposes, the finite element model of the MGR embankment-abutment system is presented in Fig. 3.1. Details on other four finite element models can be found elsewhere (Sextos et al., 2008). The non-linear behavior of the backfill, embankment and foundation soil was explicitly modeled using the Mohr-Coulomb yield surface, whereas an equivalent linear elastic behavior was assumed for the reinforced concrete parts (abutment and piles), the latter using a cracked section stiffness reduced to 2/3 of the corresponding gross one. The backfill soil was considered cohesive and characterized by the same properties as those of the backfill soil used in the large scale abutment tests at the UCDavis (i.e., a compacted low plasticity clayey silt with liquid limit LL=34% and plasticity index PI=10.5%). The values adopted for the unit weight, Young’s modulus, undrained shear strength, friction angle and Poisson’s ratio are extracted by the study of Shamsabadi et al. (2010) and are summarized in Table 3.1. The same properties were assumed for the embankment soil as those of the backfill soil. The foundation soil properties of the five abutment-embankment systems are summarized in Table 3.1. In order to account for the inherent variability in the mechanical properties of the soil, a log-normal distribution was adopted for the elastic modulus and the undrained shear strength. For each of these soil material parameters, the mean values were taken as the nominal values while the coefficients of variation (COV) were extracted from the literature (Zhang, 2006; Jones et al., 2002). The probability distribution functions as well as the coefficients of variation of the soil material parameters are summarized in Table 3.2. Random samples (statistically different but nominally identical) of the aforementioned soil material parameters were then generated for each abutment-embankment system under study by implementing the variance reduction Latin Hypercube Sampling (LHS) technique. Due to restrictions associated with computational effort, the sample size of each abutment-embankment system involved 10 finite element models with backfill and the foundation soil properties varying according to the distribution function assumed leading to an overall of 200 nonlinear analyses. A post-gravity incremental pressure was gradually applied along the longitudinal and transverse direction of the bridge, that is, normal and in parallel to the backwall face, respectively. With the aid of non-linear static (i..e, pushover) analysis and by assuming a normal distribution for the abutment-embankment stiffness, the mean values and standard deviation of the corresponded force-displacement (P-y) relationships were derived for each abutment-embankment systems studied, foundation soil type and direction of excitation. It is noted herein that the particular capacity curves can be directly used as lateral boundary conditions (i.e., through bi-directional non-linear springs representing the entire abutment-embankment system stiffness) in the framework of static or response spectrum analysis of the bridge in case that the three dimensional representation of the abutment-embankment system is not feasible. It is also noted that the particular curves do not depend on the potential presence of bearings, gaps, stoppers and joints between the abutment and the deck as the latter have to be modeled independently as part of the main bridge superstructure.

Figure 3.1 Finite element model of the MGR abutment-embankment system
Table 3.1. Backfill and foundation soil properties
Backfill Foundation Soil
(MGR, Adobe, R14) Foundation Soil (La Veta, W180)
γ (kN/m3) 18.8 20.0 20.0 E (MPa) 14.4 10.0 10.0 c (kPa) 95.8 75 100 φ (deg) 0 0 0 ψ (deg) 0 0 0
v 0.45 0.30 0.30 Table 3.2. Probability distribution functions and coefficients of variation of soil material parameters
Soil Material Parameter
Distribution Mean Coefficient of variation
Backfill Young’s modulus of
elasticity Log-normal 14.4 MPa 0.30
Undrained shear strength Log-normal 95.8 kPa 0.22 Foundation Soil
(MGR, Adobe, R14)
Young’s modulus of elasticity
Log-normal 10.0 MPa 0.30
Undrained shear strength Log-normal 75 kPa 0.22 Foundation Soil
(La Veta, W180) Young’s modulus of
elasticity Log-normal 10.0 MPa 0.30
Undrained shear strength Log-normal 100 kPa 0.22 4. VALIDATION AGAINST THE UCD AND UCLA TESTS Before proceeding in the numerical investigation of the bridges of interest, it was deemed necessary to establish a level of confidence in the ability of the finite element models developed to realistically capture the non-linear relationship between the force that is transferred through the deck and the compliance of the abutment. For this reason, the abutments tested at the both the UCD and UCLA were first numerically modeled using the actual and geometrical properties and the modeling principles described in Section 3. The necessity to study both the experiments arose from the different properties of the backfill material. In particular, the (3.05m wide and 1.67m high) abutment tested at UCD was backed with a cohesive material (E=14.4MPa, c=95.8kPa), whereas the backfill of the (4.6m wide and 1.67m high) wall tested at UCLA was granular (E=70MPa, phi=39, c=24kPa). It is recalled that the two walls were cyclically loaded into failure along the longitudinal direction leading to the force-displacement backbone curves presented in Shamsabadi et al. (2010). For documentation purposes, a detailed description of the experimental setup as well as the backfill material properties can be found elsewhere (Maroney, 1995; Lemnitzer et al., 2009). Figures 4.1-4.2 illustrate the comparison between the force-displacement backbone curves derived numerically and experimentally in the longitudinal direction. Given the material and epistemic uncertainties involved, the agreement between the measured and the predicted response is deemed very good.

Figure 4.1. Verification of the ABAQUS model against the UCD test results (Romstad et al., 1995)
Figure 4.2. Verification of the ABAQUS model against the UCLA test results (Lemnitzer et al., 2009)
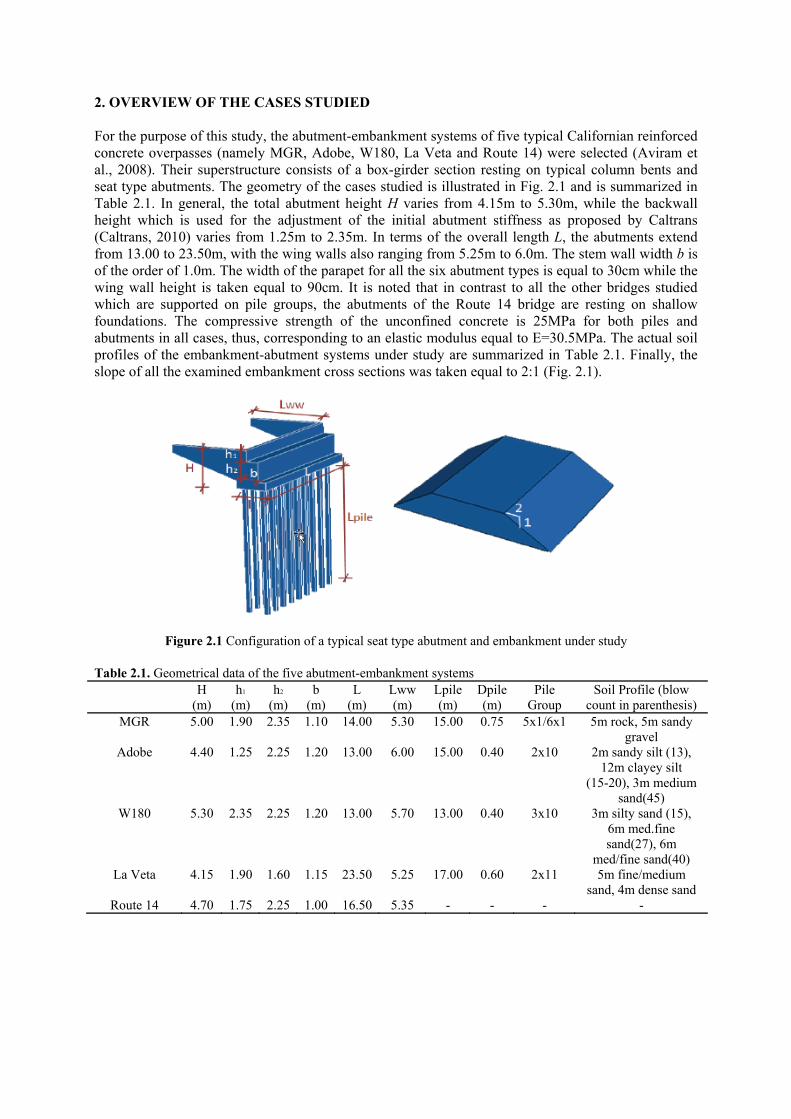
5. ABUTMENT-EMBANKMENT SYSTEM STIFFNESS (LONGITUNINAL DIRECTION) 5.1 Stiffness of the abutment-foundation-backfill system prior to the backwall failure Having established a level of confidence on the modelling approach, the mean capacity curves (plus and minus 1.64 times standard deviation) were derived for the five abutment-embankment systems studied considering the uncertainty in the backfill soil properties (Fig. 5.1-5.3). It can be observed that, at least for small displacements (i.e., lower than an approximate limit of 5cm of backwall failure), the coefficient of variation (COV) does not exceed 0.10. This variation was found insensitive to the uncertainty in the foundation soil properties, because the foundation itself is rather stiff, hence the role of the surrounding to the foundation soil (and subsequently its uncertainty) is rather minor. 5.2 Stiffness of the backfill (only) after the backwall failure According to the current design procedure, the abutment backwall is considered sacrificial during strong seismic events. In fact, the backwall is intended to break off and mobilize the longitudinal resistance of the approach fill (Caltrans, 2010; ATC, 1996) in order to protect the foundation from excessive deformations and distress. Therefore, the backwall-backfill interaction, as well as the passive earth resistance behind the abutments, are, by design, the main mechanisms activated. Based on this design concept, the analyses presented earlier were repeated, assuming this time the backwall failure as the starting point and the backfill as the only resistant mechanism. The mean capacity curves derived considering the uncertainty in the backfill soil properties (plus and minus 1.64 times standard deviation) are depicted in Fig. 5.1 to 5.3 (orange curve). In the same figures, the initial stiffness and the ultimate capacity of each backwall derived according to Caltrans (Caltrans, 2010) is also comparatively plotted. At first, it is observed that the contribution of the foundation (that is activated prior to the failure of the backwall) is not negligible as it leads to higher system stiffness for all five bridges studied (blue curve compared to the orange curve). It is also seen that the force-displacement relationship predicted according to Caltrans is, naturally, closer to the backfill-only system curve but, in general, still overestimates the initial stiffness of the system. These deviations may be attributed to the fact that the Caltrans prediction is essentially independent of the 3D geometry of the abutment studied while at the same time it neglects the contribution of the abutment foundation stiffness.
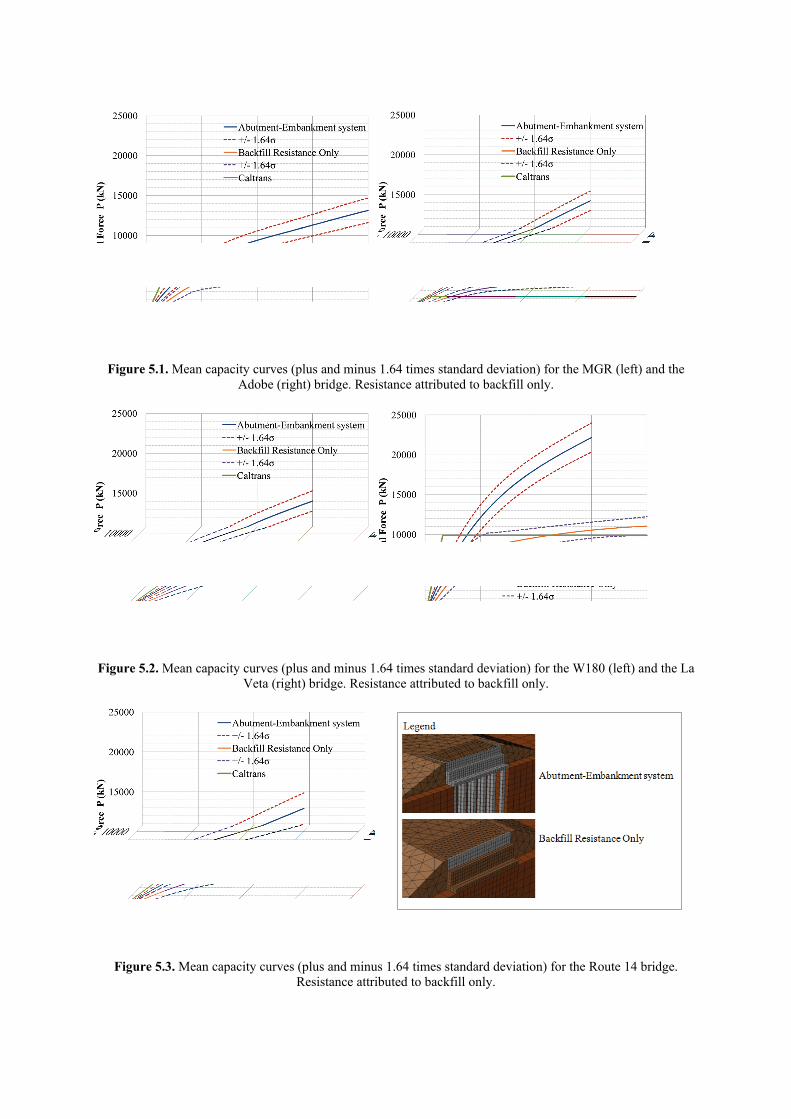
Figure 5.1. Μean capacity curves (plus and minus 1.64 times standard deviation) for the MGR (left) and the Adobe (right) bridge. Resistance attributed to backfill only.
Figure 5.2. Μean capacity curves (plus and minus 1.64 times standard deviation) for the W180 (left) and the La
Veta (right) bridge. Resistance attributed to backfill only.
Figure 5.3. Μean capacity curves (plus and minus 1.64 times standard deviation) for the Route 14 bridge. Resistance attributed to backfill only.

Figure 5.4. Assembled capacity curves (mean plus and minus 1.64 times standard deviation) for the MGR bridge
(left) and the Adobe bridge (right) along the longitudinal direction
Figure 5.5. Assembled capacity curves (mean plus and minus 1.64 times standard deviation) for the W180 bridge (left) and the La Veta bridge (right) along the longitudinal direction
Figure 5.6. Assembled capacity curves (mean plus and minus 1.64 times standard deviation) for the Route 14 bridge along the longitudinal direction
Backwall failure
Backwall failure
Backwall failure
Backwall failure Backwall failure
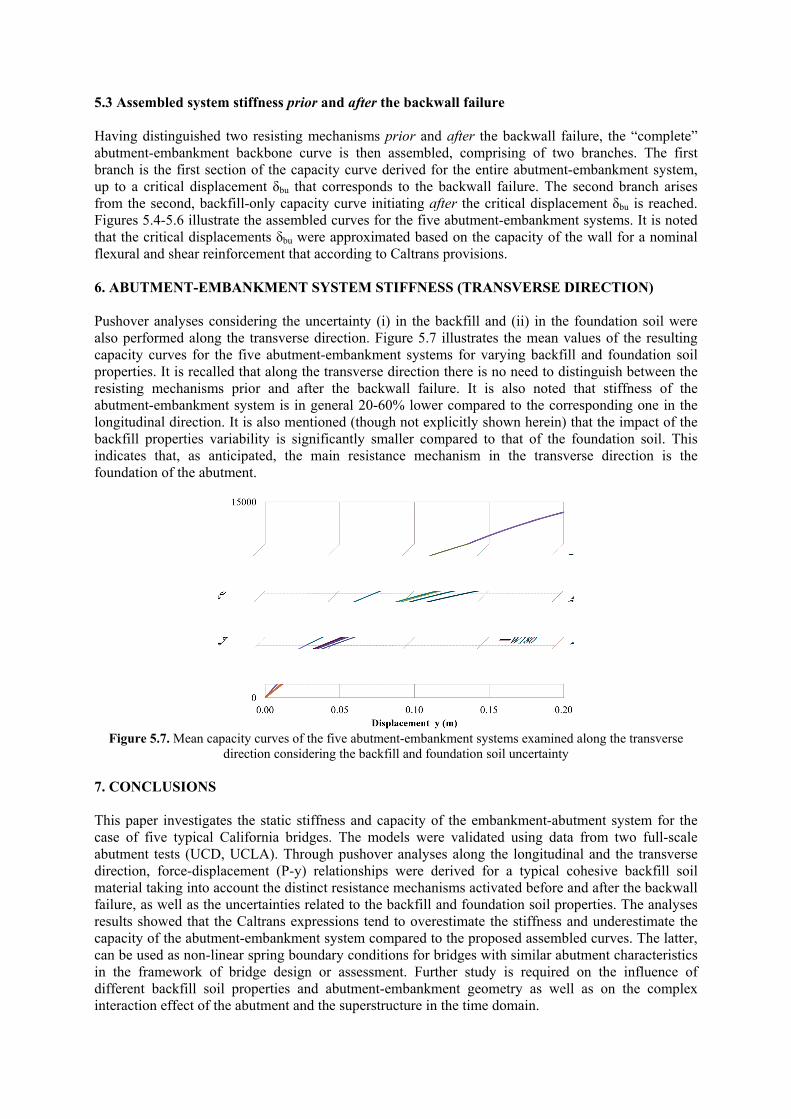
5.3 Assembled system stiffness prior and after the backwall failure Having distinguished two resisting mechanisms prior and after the backwall failure, the “complete” abutment-embankment backbone curve is then assembled, comprising of two branches. The first branch is the first section of the capacity curve derived for the entire abutment-embankment system, up to a critical displacement δbu that corresponds to the backwall failure. The second branch arises from the second, backfill-only capacity curve initiating after the critical displacement δbu is reached. Figures 5.4-5.6 illustrate the assembled curves for the five abutment-embankment systems. It is noted that the critical displacements δbu were approximated based on the capacity of the wall for a nominal flexural and shear reinforcement that according to Caltrans provisions. 6. ABUTMENT-EMBANKMENT SYSTEM STIFFNESS (TRANSVERSE DIRECTION) Pushover analyses considering the uncertainty (i) in the backfill and (ii) in the foundation soil were also performed along the transverse direction. Figure 5.7 illustrates the mean values of the resulting capacity curves for the five abutment-embankment systems for varying backfill and foundation soil properties. It is recalled that along the transverse direction there is no need to distinguish between the resisting mechanisms prior and after the backwall failure. It is also noted that stiffness of the abutment-embankment system is in general 20-60% lower compared to the corresponding one in the longitudinal direction. It is also mentioned (though not explicitly shown herein) that the impact of the backfill properties variability is significantly smaller compared to that of the foundation soil. This indicates that, as anticipated, the main resistance mechanism in the transverse direction is the foundation of the abutment.
Figure 5.7. Mean capacity curves of the five abutment-embankment systems examined along the transverse
direction considering the backfill and foundation soil uncertainty 7. CONCLUSIONS This paper investigates the static stiffness and capacity of the embankment-abutment system for the case of five typical California bridges. The models were validated using data from two full-scale abutment tests (UCD, UCLA). Through pushover analyses along the longitudinal and the transverse direction, force-displacement (P-y) relationships were derived for a typical cohesive backfill soil material taking into account the distinct resistance mechanisms activated before and after the backwall failure, as well as the uncertainties related to the backfill and foundation soil properties. The analyses results showed that the Caltrans expressions tend to overestimate the stiffness and underestimate the capacity of the abutment-embankment system compared to the proposed assembled curves. The latter, can be used as non-linear spring boundary conditions for bridges with similar abutment characteristics in the framework of bridge design or assessment. Further study is required on the influence of different backfill soil properties and abutment-embankment geometry as well as on the complex interaction effect of the abutment and the superstructure in the time domain.
ACKNOWLEDGEMENTS This research was supported by the 7th Framework Programme of the European Commission, under the PIRSES-GA-2009-247567-EXCHANGE-SSI (Experimental & Computational Hybrid Assessment Network for Ground-Motion Excited Soil-Structure Interaction Systems) Grant. This support is gratefully appreciated. The authors would also like to thank Dr. K. Mackie Assistant Professor at the University of Central Florida and Prof. Amr Elnashai at the University of Illinois at Urbana-Champaign for providing useful feedback regarding the overpasses studied, as well as the undergraduate student M. Ekonomakis for his contribution in some preliminary analyses of this study. REFERENCES ABAQUS / PRE. (2004). Users. manual. Hibbit, Karlsson and Sorensen Inc. ATC. (1996). Improved seismic design criteria for California bridges. Redwood City, California, Report No.
ATC-32, 1996. Aviram, A., Mackie, K., and Stojadinovic, B. (2008). Guidelines of Nonlinear Analysis of Bridge Structures in
California. PEER REPORT 2008:3 Bozorgzadeh, A. (2007). Effect of Backfill on Stiffness and Capacity of Bridge Abutments. PhD thesis,
University of California, San Diego Caltrans. (2010). Seismic Design Criteria Version 1.6. California Department of Transportation: Sacramento,
CA, U.S. Goel, R.K. and Chopra, A.K. (1997). Evaluation of bridge abutment capacity and stiffness during earthquakes.
Earthquake Spectra 13:1, 1-23. Inel, M. (2002). Displacement-based strategies for the performance-based seismic design of short bridges
considering embankment flexibility. PhD thesis, Univ. of Illinois at Urbana-Champaign, Urbana, Ill. Inel, M. and Aschheim, M. (2004). Seismic Design of Columns of Short Bridges Accounting for Embankment
Flexibility. Journal of Structural Engineering 130:10, 1515-1528. Jones, A., Kramer, S., and Arduino, P. (2002). Estimation of Uncertainty in Geotechnical Properties for
Performance-Based Earthquake Engineering. PEER REPORT 2002:16 , Kotsoglou, A. and Pantazopoulou, S. (2007). Bridge–embankment interaction under transverse ground
excitation. Earthquake Engineering and Structural Dynamics 36, 1719-1740. Kotsoglou, A. and Pantazopoulou, S. (2009). Assessment and modeling of embankment participation in the
seismic response of integral abutment bridges. Bulletin of Earthquake Engineering 7:2, 343-361. Lemnitzer, A., Ahlberg, E., Nigbor, R., Shamsabadi, A., Wallace, J., and Stewart, J. (2009). Lateral Performance
of Full-Scale Bridge Abutment Wall with Granular Backfill. Journal of Geotechnical and Geoenvironmental Engineering 135:4, 506-514.
Maroney, B. (1995). Large Scale Abutment Tests to Determine Stiffness and Ultimate Strength Under Seismic Loading. Ph.D. Dissertation, University of California, Davis.
Romstad, K., Kutter, B., Maroney, B., Vanderbilt, E., Griggs, M., and Chai, Y.H. (1995). Experimental measurements of bridge abutment behavior. Rep. No. UCD-STR-95-1, Dept. of Civil and Environmental Engineering, Univ. of Calif., Davis, Calif.
Sextos, A.G., Mackie, K.R., Stojadinović, B., and Taskari, O.N. (2008). Simplified P-y relationships fro modeling embankment-abutment systems of typical California bridges. 14th World Conference on Earthquake Engineering.
Shamsabadi, A., Ashour, M., and Norris, G. (2005). Bridge Abutment Nonlinear Force-Displacement-Capacity Prediction for Seismic Design. Journal of Geotechnical and Geoenvironmental Eng. 131:2, 151-161.
Shamsabadi, A., Khalili-Tehrani, P., Stewart, J., and Taciroglu, E. (2010). Validated Simulation Models for Lateral Response of Bridge Abutments with Typical Backfills. Journal of Bridge Eng. 15:3, 302-311.
Siddharthan, R., El-gamal, M., and Maragakis, E. (1997). Stiffnesses of abutments on spread footings with cohesionless backfill. Canadian Geotechnical Journal 34:5, 686-697.
Werner, S., Beck, J., and Levine, M. (1987). Seismic Response Evaluation of Meloland Road Overpass Using 1979 Imperial Valley Earthquake Records. Earthquake Engineering & Structural Dynamics 15:2, 249-274.
Wilson, J. and Tan, B. (1990). Bridge Abutments: Formulation of simple model for earthquake response analysis. Journal of Engineering Mechanics 116:8, 1828-1837.
Wissawapaisal, C. and Aschheim, M. (2000). Modeling the transverse response of short bridges subjected to earthquakes. Mid-America Earthq. Center CD release 00-05, University of Illinois, Urbana-Champaign
Zhang, J. and Makris, N. (2002). Kinematic response functions and dynamic stiffnesses of bridge embankments. Earthquake Engineering and Structural Dynamics 31:11, 1933-1966.
Zhang, Y., 2006. Probabilistic structural seismic performance assessment methodology and application to an actual bridge-foundation-ground system. PhD thesis, University of California, San Diego