still bullish on smid energy, within e&p’s pulling off our
TRANSCRIPT
Lori Calvasina, Small/Mid Cap US Equity Strategist
212-538-6396/[email protected]
Sara Mahaffy, Associate Analyst
212-325-6824/[email protected]
Still Bullish On SMID Energy, Within E&P’s Pulling Off Our
Preference For Hybrids, Time For Oily & Gassy Names To
Take A Turn?
February 13th, 2013
Lauren Thompson, Research Analyst
212-325-1417/[email protected]
DISCLOSURE APPENDIX CONTAINS IMPORTANT DISCLOSURES, ANALYST CERTIFICATIONS, INFORMATION ON TRADE ALERTS, ANALYST MODEL PORTFOLIOS AND THE STATUS OF NON-U.S ANALYSTS. FOR OTHER IMPORTANT DISCLOSURES, visit www.credit-suisse.com/researchdisclosures or call +1 (877) 291-2683 US Disclosure: Credit Suisse does and seeks to do business with companies covered in its research reports. As a result, investors should be aware that the Firm may have a conflict of interest that could affect the objectivity of this report. Investors should consider this report as only a single factor in making their investment decision.
CREDIT SUISSE SECURITIES RESEARCH & ANALYTICS BEYOND INFORMATION™
Client-Driven Solutions, Insights, and Access
Still Bullish On SMID Energy, Within E&P’s Pulling Off Our Preference For Hybrids, Time For Oily & Gassy Names To Take A Turn?
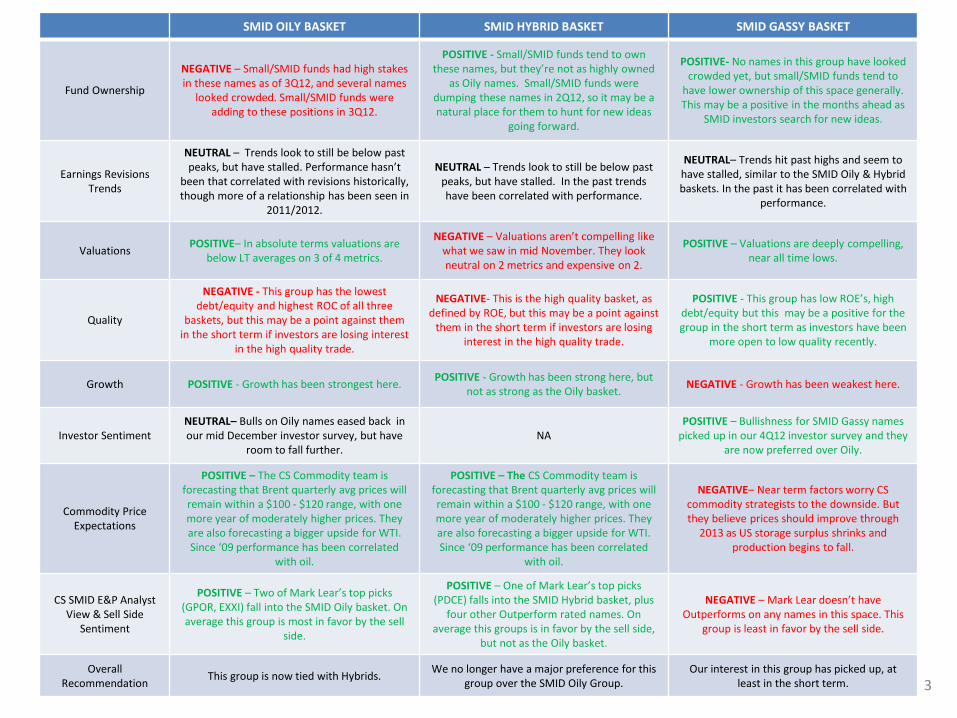
Updating Our Outlook For SMID E&P Groups: In this report we updated our analysis on the three SMID E&P baskets – “SMID Oily”, “SMID Hybrid” and “SMID Gassy” – that we began tracking in mid November. Names were classified with the help of CS Small/Mid Cap E&P analyst, Mark Lear, based on 2011 reserves data.
Our Bottom Line: We remain overweight Energy, and there are aspects we like about all three E&P groups, one the biggest weights within the sector. We no longer have a strong preference for SMID Hybrids as the group has run and valuations are no longer attractive. Our interest in the SMID Gassy group has picked up, at least in the short term, as investors have been more open to low quality/new ideas.
Hybrids Led in 2H12 & January, But Oily Names Leading In February: The SMID Hybrid group outperformed both the SMID Oily and SMID Gassy groups in the second half of last year. Outperformance continued into the first month of 2013, but the Hybrids have lagged both Oily & Gassy names in early Februrary.
No Longer Prefer SMID Hybrids, Valuations Have Run: We still can find several aspects that we like about this group. Beta is high and SMID investors dumped these names during 2Q12, but didn’t pile back into them in 3Q12 (though they may have started to during 4Q12/early 2013 when performance improved). The CS commodity team’s forecast for Oil is also constructive, and the performance of SMID Hybrid names has been closely correlated with WTI prices in the past. But we no longer have a preference for this group over the SMID Oily and Gassy baskets as valuations have run. This has been the best performing basket since mid-November, and valuations now look neutral on 2 of 4 metrics we track and expensive on the other 2. Earnings revisions trends also stalled last month, but we saw this happen across all three baskets. One of Mark Lear’s top picks (PDCE) is in this basket, plus four other Outperforms (ROSE, SFY, MHR and BCEI).
Intrigued By SMID Oily Valuations, But This Group Has Been Crowded: Valuations for SMID Oily names are now more attractive than what we’re seeing for SMID Hybrid names, with 3 out of 4 metrics below LT averages. This group has also had the strongest growth and trades closely with WTI prices. Crowding has been our main concern (several names are among the most popular in small cap funds across sectors, and crowded names have struggled to lead lately) and we would be selective within this group. Two of Mark Lear’s top ideas, GPOR and EXXI, are in the SMID Oily Basket.
SMID Gassy Names May Eventually Bounce From Interest In Lower Quality: We are getting more constructive on the SMID Gassy basket and think this group may benefit from its low quality bias in the short term as investors have become more open to the idea of moving into lower quality and are looking for new ideas. Valuations also remain deeply compelling, near historical lows. CS commodity analysts are worried about near term downside risks to US natural gas prices, which keeps us concerned. Mark Lear has Neutrals on three names in this group (REXX, CRK, PVA) and an Underperform rating on one name (FST). Note that most names on the Gassy list have been more lowly owned than Oily or Hybrid stocks in recent quarters.
2
SMID OILY BASKET SMID HYBRID BASKET SMID GASSY BASKET
Fund Ownership
NEGATIVE – Small/SMID funds had high stakes in these names as of 3Q12, and several names
looked crowded. Small/SMID funds were adding to these positions in 3Q12.
POSITIVE - Small/SMID funds tend to own these names, but they’re not as highly owned
as Oily names. Small/SMID funds were dumping these names in 2Q12, so it may be a natural place for them to hunt for new ideas
going forward.
POSITIVE- No names in this group have looked crowded yet, but small/SMID funds tend to
have lower ownership of this space generally. This may be a positive in the months ahead as
SMID investors search for new ideas.
Earnings Revisions Trends
NEUTRAL – Trends look to still be below past peaks, but have stalled. Performance hasn’t
been that correlated with revisions historically, though more of a relationship has been seen in
2011/2012.
NEUTRAL – Trends look to still be below past peaks, but have stalled. In the past trends have been correlated with performance.
NEUTRAL– Trends hit past highs and seem to have stalled, similar to the SMID Oily & Hybrid baskets. In the past it has been correlated with
performance.
Valuations POSITIVE– In absolute terms valuations are
below LT averages on 3 of 4 metrics.
NEGATIVE – Valuations aren’t compelling like what we saw in mid November. They look neutral on 2 metrics and expensive on 2.
POSITIVE – Valuations are deeply compelling, near all time lows.
Quality
NEGATIVE - This group has the lowest debt/equity and highest ROC of all three
baskets, but this may be a point against them in the short term if investors are losing interest
in the high quality trade.
NEGATIVE- This is the high quality basket, as defined by ROE, but this may be a point against
them in the short term if investors are losing interest in the high quality trade.
POSITIVE - This group has low ROE’s, high debt/equity but this may be a positive for the group in the short term as investors have been
more open to low quality recently.
Growth POSITIVE - Growth has been strongest here. POSITIVE - Growth has been strong here, but
not as strong as the Oily basket. NEGATIVE - Growth has been weakest here.
Investor Sentiment NEUTRAL– Bulls on Oily names eased back in our mid December investor survey, but have
room to fall further. NA
POSITIVE – Bullishness for SMID Gassy names picked up in our 4Q12 investor survey and they
are now preferred over Oily.
Commodity Price Expectations
POSITIVE – The CS Commodity team is forecasting that Brent quarterly avg prices will remain within a $100 - $120 range, with one more year of moderately higher prices. They are also forecasting a bigger upside for WTI. Since ‘09 performance has been correlated
with oil.
POSITIVE – The CS Commodity team is forecasting that Brent quarterly avg prices will remain within a $100 - $120 range, with one more year of moderately higher prices. They are also forecasting a bigger upside for WTI. Since ‘09 performance has been correlated
with oil.
NEGATIVE– Near term factors worry CS commodity strategists to the downside. But they believe prices should improve through
2013 as US storage surplus shrinks and production begins to fall.
CS SMID E&P Analyst View & Sell Side
Sentiment
POSITIVE – Two of Mark Lear’s top picks (GPOR, EXXI) fall into the SMID Oily basket. On average this group is most in favor by the sell
side.
POSITIVE – One of Mark Lear’s top picks (PDCE) falls into the SMID Hybrid basket, plus
four other Outperform rated names. On average this groups is in favor by the sell side,
but not as the Oily basket.
NEGATIVE – Mark Lear doesn’t have Outperforms on any names in this space. This
group is least in favor by the sell side.
Overall Recommendation
This group is now tied with Hybrids. We no longer have a major preference for this
group over the SMID Oily Group. Our interest in this group has picked up, at
least in the short term. 3
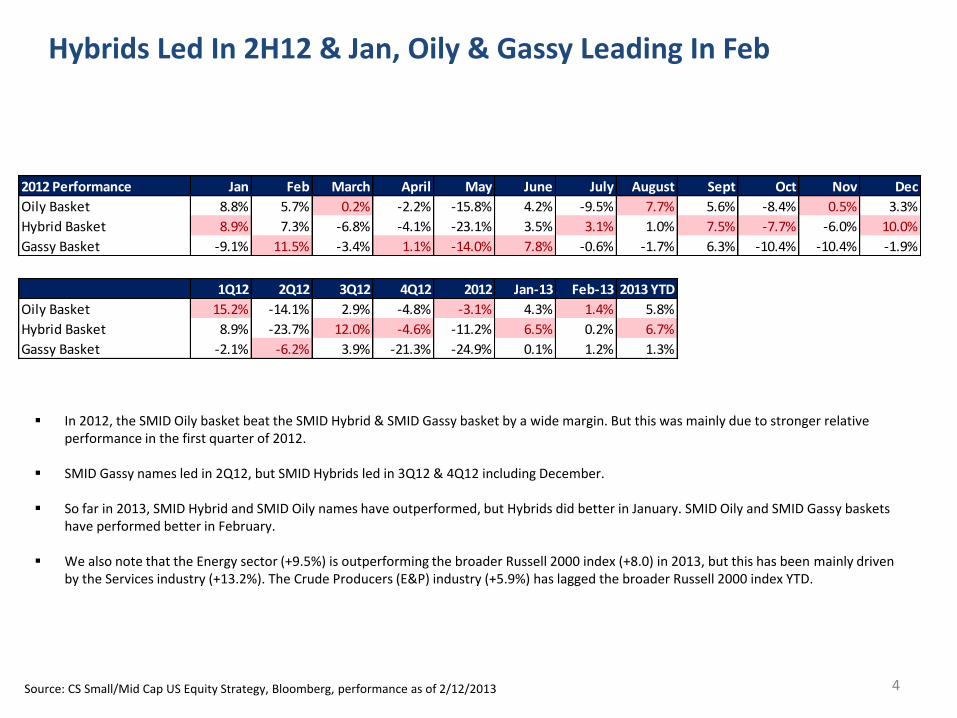
Hybrids Led In 2H12 & Jan, Oily & Gassy Leading In Feb
In 2012, the SMID Oily basket beat the SMID Hybrid & SMID Gassy basket by a wide margin. But this was mainly due to stronger relative performance in the first quarter of 2012.
SMID Gassy names led in 2Q12, but SMID Hybrids led in 3Q12 & 4Q12 including December.
So far in 2013, SMID Hybrid and SMID Oily names have outperformed, but Hybrids did better in January. SMID Oily and SMID Gassy baskets have performed better in February.
We also note that the Energy sector (+9.5%) is outperforming the broader Russell 2000 index (+8.0) in 2013, but this has been mainly driven by the Services industry (+13.2%). The Crude Producers (E&P) industry (+5.9%) has lagged the broader Russell 2000 index YTD.
2012 Performance Jan Feb March April May June July August Sept Oct Nov Dec
Oily Basket 8.8% 5.7% 0.2% -2.2% -15.8% 4.2% -9.5% 7.7% 5.6% -8.4% 0.5% 3.3%
Hybrid Basket 8.9% 7.3% -6.8% -4.1% -23.1% 3.5% 3.1% 1.0% 7.5% -7.7% -6.0% 10.0%
Gassy Basket -9.1% 11.5% -3.4% 1.1% -14.0% 7.8% -0.6% -1.7% 6.3% -10.4% -10.4% -1.9%
Source: CS Small/Mid Cap US Equity Strategy, Bloomberg, performance as of 2/12/2013
1Q12 2Q12 3Q12 4Q12 2012 Jan-13 Feb-13 2013 YTD
Oily Basket 15.2% -14.1% 2.9% -4.8% -3.1% 4.3% 1.4% 5.8%
Hybrid Basket 8.9% -23.7% 12.0% -4.6% -11.2% 6.5% 0.2% 6.7%
Gassy Basket -2.1% -6.2% 3.9% -21.3% -24.9% 0.1% 1.2% 1.3%
4
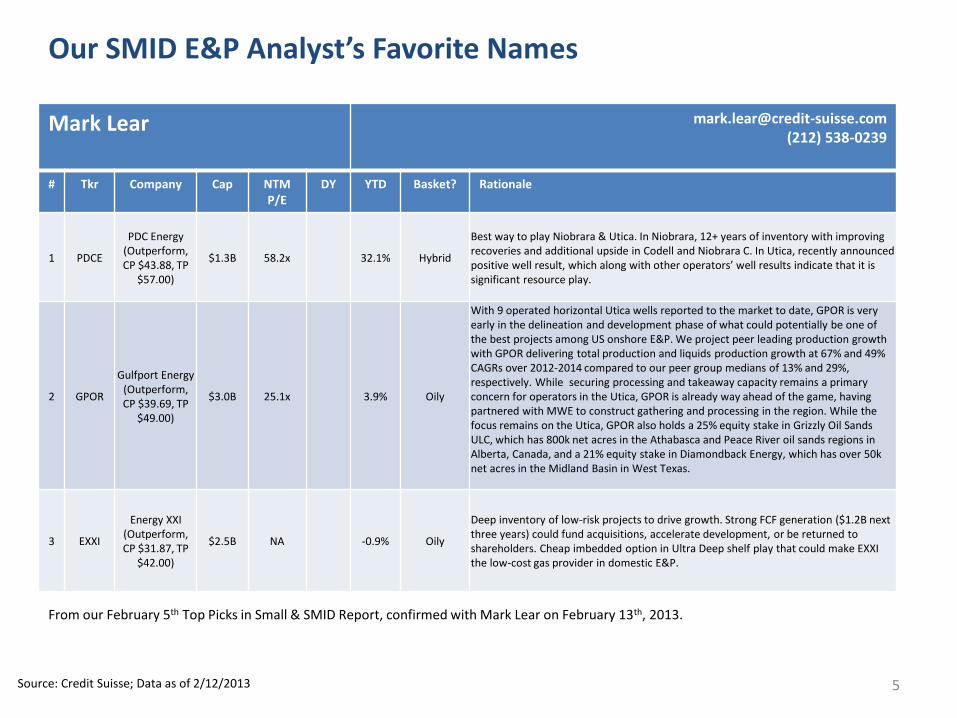
Our SMID E&P Analyst’s Favorite Names
Mark Lear [email protected] (212) 538-0239
# Tkr Company Cap NTM P/E
DY YTD Basket? Rationale
1 PDCE
PDC Energy (Outperform, CP $43.88, TP
$57.00)
$1.3B 58.2x 32.1% Hybrid
Best way to play Niobrara & Utica. In Niobrara, 12+ years of inventory with improving recoveries and additional upside in Codell and Niobrara C. In Utica, recently announced positive well result, which along with other operators’ well results indicate that it is significant resource play.
2 GPOR
Gulfport Energy (Outperform, CP $39.69, TP
$49.00)
$3.0B 25.1x 3.9% Oily
With 9 operated horizontal Utica wells reported to the market to date, GPOR is very early in the delineation and development phase of what could potentially be one of the best projects among US onshore E&P. We project peer leading production growth with GPOR delivering total production and liquids production growth at 67% and 49% CAGRs over 2012-2014 compared to our peer group medians of 13% and 29%, respectively. While securing processing and takeaway capacity remains a primary concern for operators in the Utica, GPOR is already way ahead of the game, having partnered with MWE to construct gathering and processing in the region. While the focus remains on the Utica, GPOR also holds a 25% equity stake in Grizzly Oil Sands ULC, which has 800k net acres in the Athabasca and Peace River oil sands regions in Alberta, Canada, and a 21% equity stake in Diamondback Energy, which has over 50k net acres in the Midland Basin in West Texas.
3 EXXI
Energy XXI (Outperform, CP $31.87, TP
$42.00)
$2.5B NA -0.9% Oily
Deep inventory of low-risk projects to drive growth. Strong FCF generation ($1.2B next three years) could fund acquisitions, accelerate development, or be returned to shareholders. Cheap imbedded option in Ultra Deep shelf play that could make EXXI the low-cost gas provider in domestic E&P.
Source: Credit Suisse; Data as of 2/12/2013
From our February 5th Top Picks in Small & SMID Report, confirmed with Mark Lear on February 13th, 2013.
5
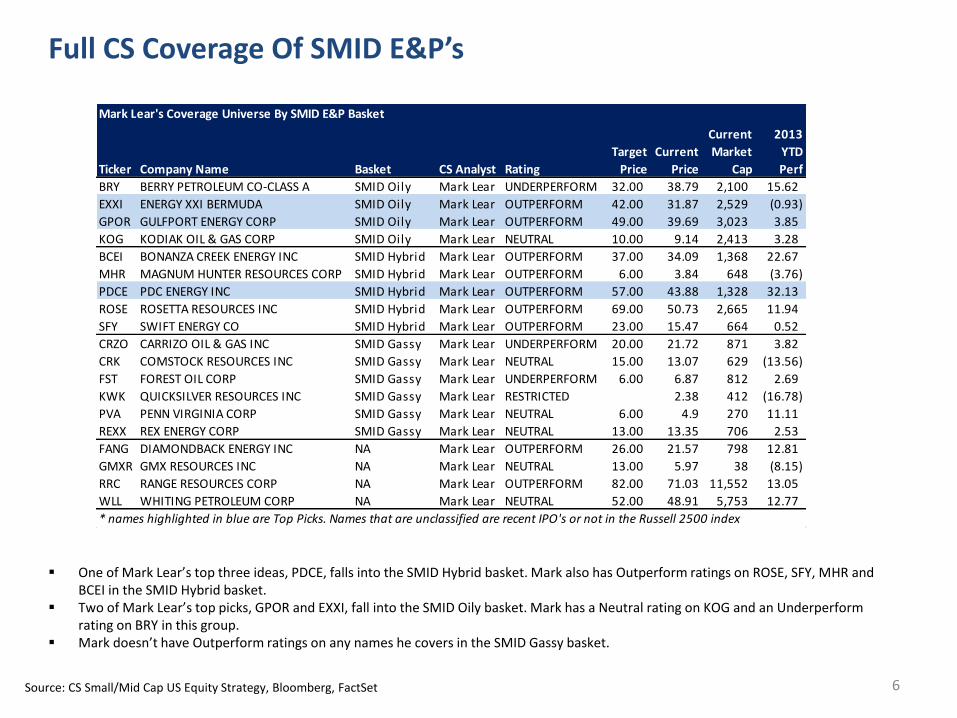
One of Mark Lear’s top three ideas, PDCE, falls into the SMID Hybrid basket. Mark also has Outperform ratings on ROSE, SFY, MHR and BCEI in the SMID Hybrid basket.
Two of Mark Lear’s top picks, GPOR and EXXI, fall into the SMID Oily basket. Mark has a Neutral rating on KOG and an Underperform rating on BRY in this group.
Mark doesn’t have Outperform ratings on any names he covers in the SMID Gassy basket.
Full CS Coverage Of SMID E&P’s
Source: CS Small/Mid Cap US Equity Strategy, Bloomberg, FactSet
Mark Lear's Coverage Universe By SMID E&P Basket
Ticker Company Name Basket CS Analyst Rating
Target
Price
Current
Price
Current
Market
Cap
2013
YTD
Perf
BRY BERRY PETROLEUM CO-CLASS A SMID Oily Mark Lear UNDERPERFORM 32.00 38.79 2,100 15.62
EXXI ENERGY XXI BERMUDA SMID Oily Mark Lear OUTPERFORM 42.00 31.87 2,529 (0.93)
GPOR GULFPORT ENERGY CORP SMID Oily Mark Lear OUTPERFORM 49.00 39.69 3,023 3.85
KOG KODIAK OIL & GAS CORP SMID Oily Mark Lear NEUTRAL 10.00 9.14 2,413 3.28
BCEI BONANZA CREEK ENERGY INC SMID Hybrid Mark Lear OUTPERFORM 37.00 34.09 1,368 22.67
MHR MAGNUM HUNTER RESOURCES CORP SMID Hybrid Mark Lear OUTPERFORM 6.00 3.84 648 (3.76)
PDCE PDC ENERGY INC SMID Hybrid Mark Lear OUTPERFORM 57.00 43.88 1,328 32.13
ROSE ROSETTA RESOURCES INC SMID Hybrid Mark Lear OUTPERFORM 69.00 50.73 2,665 11.94
SFY SWIFT ENERGY CO SMID Hybrid Mark Lear OUTPERFORM 23.00 15.47 664 0.52
CRZO CARRIZO OIL & GAS INC SMID Gassy Mark Lear UNDERPERFORM 20.00 21.72 871 3.82
CRK COMSTOCK RESOURCES INC SMID Gassy Mark Lear NEUTRAL 15.00 13.07 629 (13.56)
FST FOREST OIL CORP SMID Gassy Mark Lear UNDERPERFORM 6.00 6.87 812 2.69
KWK QUICKSILVER RESOURCES INC SMID Gassy Mark Lear RESTRICTED 2.38 412 (16.78)
PVA PENN VIRGINIA CORP SMID Gassy Mark Lear NEUTRAL 6.00 4.9 270 11.11
REXX REX ENERGY CORP SMID Gassy Mark Lear NEUTRAL 13.00 13.35 706 2.53
FANG DIAMONDBACK ENERGY INC NA Mark Lear OUTPERFORM 26.00 21.57 798 12.81
GMXR GMX RESOURCES INC NA Mark Lear NEUTRAL 13.00 5.97 38 (8.15)
RRC RANGE RESOURCES CORP NA Mark Lear OUTPERFORM 82.00 71.03 11,552 13.05
WLL WHITING PETROLEUM CORP NA Mark Lear NEUTRAL 52.00 48.91 5,753 12.77
* names highlighted in blue are Top Picks. Names that are unclassified are recent IPO's or not in the Russell 2500 index
6
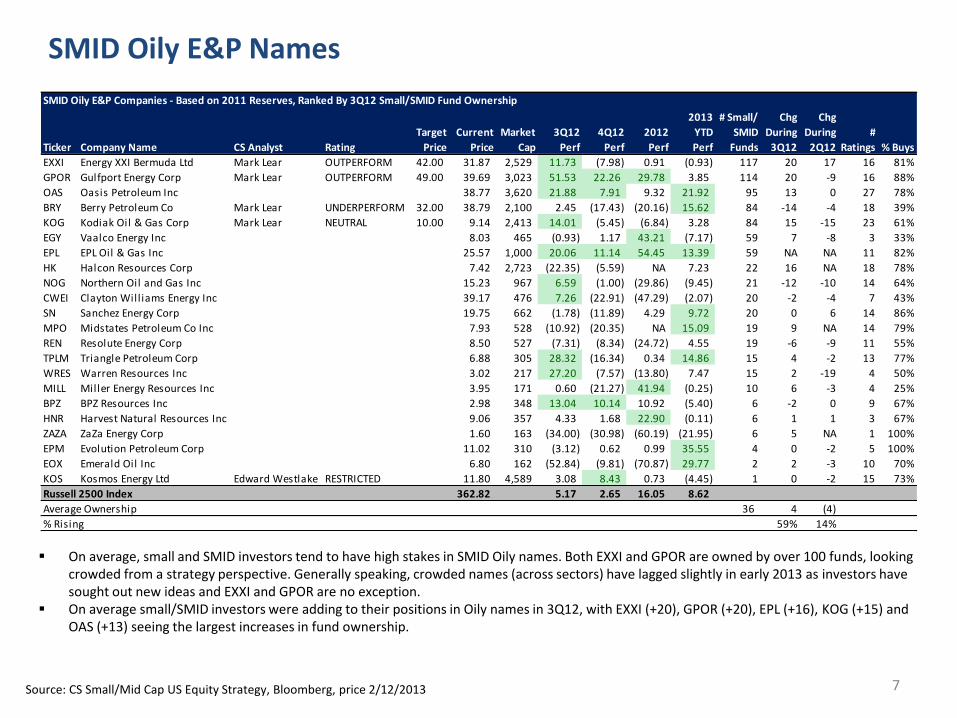
SMID Oily E&P Names
On average, small and SMID investors tend to have high stakes in SMID Oily names. Both EXXI and GPOR are owned by over 100 funds, looking crowded from a strategy perspective. Generally speaking, crowded names (across sectors) have lagged slightly in early 2013 as investors have sought out new ideas and EXXI and GPOR are no exception.
On average small/SMID investors were adding to their positions in Oily names in 3Q12, with EXXI (+20), GPOR (+20), EPL (+16), KOG (+15) and OAS (+13) seeing the largest increases in fund ownership.
Source: CS Small/Mid Cap US Equity Strategy, Bloomberg, price 2/12/2013
SMID Oily E&P Companies - Based on 2011 Reserves, Ranked By 3Q12 Small/SMID Fund Ownership
Ticker Company Name CS Analyst Rating
Target
Price
Current
Price
Market
Cap
3Q12
Perf
4Q12
Perf
2012
Perf
2013
YTD
Perf
# Small/
SMID
Funds
Chg
During
3Q12
Chg
During
2Q12
#
Ratings % Buys
EXXI Energy XXI Bermuda Ltd Mark Lear OUTPERFORM 42.00 31.87 2,529 11.73 (7.98) 0.91 (0.93) 117 20 17 16 81%
GPOR Gulfport Energy Corp Mark Lear OUTPERFORM 49.00 39.69 3,023 51.53 22.26 29.78 3.85 114 20 -9 16 88%
OAS Oasis Petroleum Inc #N/A #N/A #N/A 38.77 3,620 21.88 7.91 9.32 21.92 95 13 0 27 78%
BRY Berry Petroleum Co Mark Lear UNDERPERFORM 32.00 38.79 2,100 2.45 (17.43) (20.16) 15.62 84 -14 -4 18 39%
KOG Kodiak Oil & Gas Corp Mark Lear NEUTRAL 10.00 9.14 2,413 14.01 (5.45) (6.84) 3.28 84 15 -15 23 61%
EGY Vaalco Energy Inc #N/A #N/A #N/A 8.03 465 (0.93) 1.17 43.21 (7.17) 59 7 -8 3 33%
EPL EPL Oil & Gas Inc #N/A #N/A #N/A 25.57 1,000 20.06 11.14 54.45 13.39 59 NA NA 11 82%
HK Halcon Resources Corp #N/A #N/A #N/A 7.42 2,723 (22.35) (5.59) NA 7.23 22 16 NA 18 78%
NOG Northern Oil and Gas Inc #N/A #N/A #N/A 15.23 967 6.59 (1.00) (29.86) (9.45) 21 -12 -10 14 64%
CWEI Clayton Williams Energy Inc #N/A #N/A #N/A 39.17 476 7.26 (22.91) (47.29) (2.07) 20 -2 -4 7 43%
SN Sanchez Energy Corp #N/A #N/A #N/A 19.75 662 (1.78) (11.89) 4.29 9.72 20 0 6 14 86%
MPO Midstates Petroleum Co Inc #N/A #N/A #N/A 7.93 528 (10.92) (20.35) NA 15.09 19 9 NA 14 79%
REN Resolute Energy Corp #N/A #N/A #N/A 8.50 527 (7.31) (8.34) (24.72) 4.55 19 -6 -9 11 55%
TPLM Triangle Petroleum Corp #N/A #N/A #N/A 6.88 305 28.32 (16.34) 0.34 14.86 15 4 -2 13 77%
WRES Warren Resources Inc #N/A #N/A #N/A 3.02 217 27.20 (7.57) (13.80) 7.47 15 2 -19 4 50%
MILL Miller Energy Resources Inc #N/A #N/A #N/A 3.95 171 0.60 (21.27) 41.94 (0.25) 10 6 -3 4 25%
BPZ BPZ Resources Inc #N/A #N/A #N/A 2.98 348 13.04 10.14 10.92 (5.40) 6 -2 0 9 67%
HNR Harvest Natural Resources Inc #N/A #N/A #N/A 9.06 357 4.33 1.68 22.90 (0.11) 6 1 1 3 67%
ZAZA ZaZa Energy Corp #N/A #N/A #N/A 1.60 163 (34.00) (30.98) (60.19) (21.95) 6 5 NA 1 100%
EPM Evolution Petroleum Corp #N/A #N/A #N/A 11.02 310 (3.12) 0.62 0.99 35.55 4 0 -2 5 100%
EOX Emerald Oil Inc #N/A #N/A #N/A 6.80 162 (52.84) (9.81) (70.87) 29.77 2 2 -3 10 70%
KOS Kosmos Energy Ltd Edward Westlake RESTRICTED 11.80 4,589 3.08 8.43 0.73 (4.45) 1 0 -2 15 73%
Russell 2500 Index 362.82 5.17 2.65 16.05 8.62
Average Ownership 36 4 (4)
% Rising 59% 14%
7
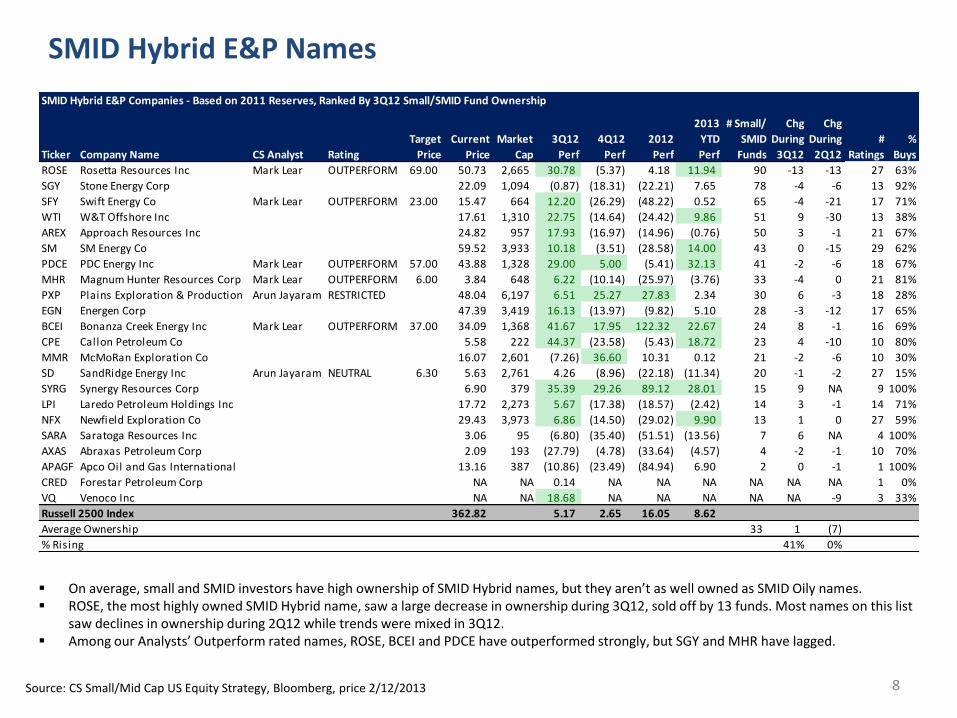
SMID Hybrid E&P Names
On average, small and SMID investors have high ownership of SMID Hybrid names, but they aren’t as well owned as SMID Oily names. ROSE, the most highly owned SMID Hybrid name, saw a large decrease in ownership during 3Q12, sold off by 13 funds. Most names on this list
saw declines in ownership during 2Q12 while trends were mixed in 3Q12. Among our Analysts’ Outperform rated names, ROSE, BCEI and PDCE have outperformed strongly, but SGY and MHR have lagged.
Source: CS Small/Mid Cap US Equity Strategy, Bloomberg, price 2/12/2013
SMID Hybrid E&P Companies - Based on 2011 Reserves, Ranked By 3Q12 Small/SMID Fund Ownership
Ticker Company Name CS Analyst Rating
Target
Price
Current
Price
Market
Cap
3Q12
Perf
4Q12
Perf
2012
Perf
2013
YTD
Perf
# Small/
SMID
Funds
Chg
During
3Q12
Chg
During
2Q12
#
Ratings
%
Buys
ROSE Rosetta Resources Inc Mark Lear OUTPERFORM 69.00 50.73 2,665 30.78 (5.37) 4.18 11.94 90 -13 -13 27 63%
SGY Stone Energy Corp #N/A #N/A #N/A 22.09 1,094 (0.87) (18.31) (22.21) 7.65 78 -4 -6 13 92%
SFY Swift Energy Co Mark Lear OUTPERFORM 23.00 15.47 664 12.20 (26.29) (48.22) 0.52 65 -4 -21 17 71%
WTI W&T Offshore Inc #N/A #N/A #N/A 17.61 1,310 22.75 (14.64) (24.42) 9.86 51 9 -30 13 38%
AREX Approach Resources Inc #N/A #N/A #N/A 24.82 957 17.93 (16.97) (14.96) (0.76) 50 3 -1 21 67%
SM SM Energy Co #N/A #N/A #N/A 59.52 3,933 10.18 (3.51) (28.58) 14.00 43 0 -15 29 62%
PDCE PDC Energy Inc Mark Lear OUTPERFORM 57.00 43.88 1,328 29.00 5.00 (5.41) 32.13 41 -2 -6 18 67%
MHR Magnum Hunter Resources Corp Mark Lear OUTPERFORM 6.00 3.84 648 6.22 (10.14) (25.97) (3.76) 33 -4 0 21 81%
PXP Plains Exploration & Production Arun Jayaram RESTRICTED 48.04 6,197 6.51 25.27 27.83 2.34 30 6 -3 18 28%
EGN Energen Corp #N/A #N/A #N/A 47.39 3,419 16.13 (13.97) (9.82) 5.10 28 -3 -12 17 65%
BCEI Bonanza Creek Energy Inc Mark Lear OUTPERFORM 37.00 34.09 1,368 41.67 17.95 122.32 22.67 24 8 -1 16 69%
CPE Callon Petroleum Co #N/A #N/A #N/A 5.58 222 44.37 (23.58) (5.43) 18.72 23 4 -10 10 80%
MMR McMoRan Exploration Co #N/A #N/A #N/A 16.07 2,601 (7.26) 36.60 10.31 0.12 21 -2 -6 10 30%
SD SandRidge Energy Inc Arun Jayaram NEUTRAL 6.30 5.63 2,761 4.26 (8.96) (22.18) (11.34) 20 -1 -2 27 15%
SYRG Synergy Resources Corp #N/A #N/A #N/A 6.90 379 35.39 29.26 89.12 28.01 15 9 NA 9 100%
LPI Laredo Petroleum Holdings Inc #N/A #N/A #N/A 17.72 2,273 5.67 (17.38) (18.57) (2.42) 14 3 -1 14 71%
NFX Newfield Exploration Co #N/A #N/A #N/A 29.43 3,973 6.86 (14.50) (29.02) 9.90 13 1 0 27 59%
SARA Saratoga Resources Inc #N/A #N/A #N/A 3.06 95 (6.80) (35.40) (51.51) (13.56) 7 6 NA 4 100%
AXAS Abraxas Petroleum Corp #N/A #N/A #N/A 2.09 193 (27.79) (4.78) (33.64) (4.57) 4 -2 -1 10 70%
APAGF Apco Oil and Gas International #N/A #N/A #N/A 13.16 387 (10.86) (23.49) (84.94) 6.90 2 0 -1 1 100%
CRED Forestar Petroleum Corp #N/A #N/A #N/A NA NA 0.14 NA NA NA NA NA NA 1 0%
VQ Venoco Inc #N/A #N/A #N/A NA NA 18.68 NA NA NA NA NA -9 3 33%
Russell 2500 Index 362.82 5.17 2.65 16.05 8.62
Average Ownership 33 1 (7)
% Rising 41% 0%
8
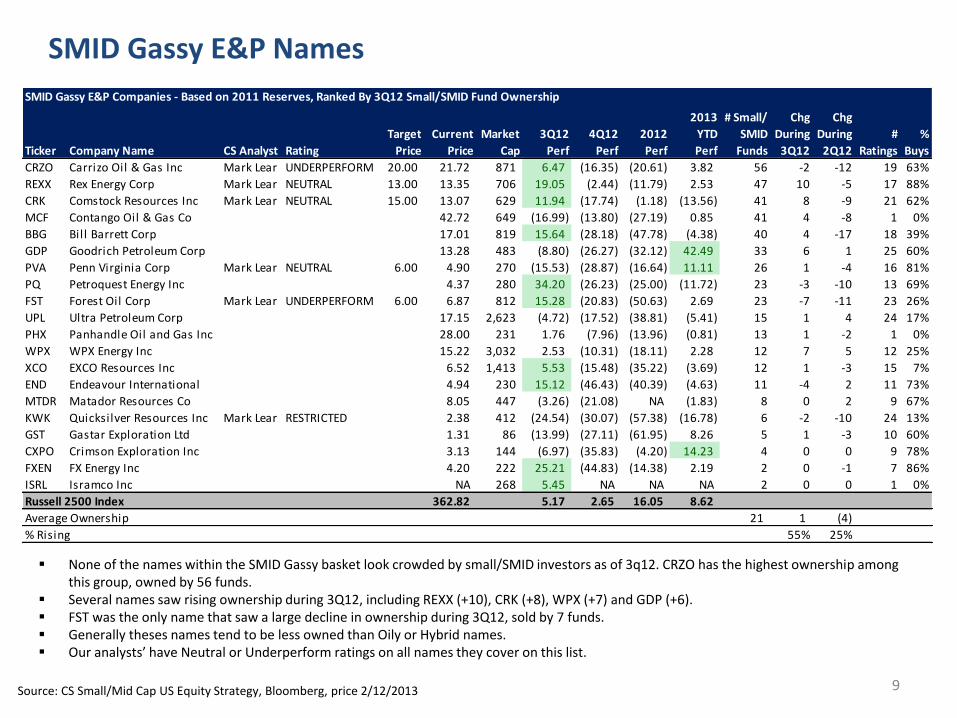
None of the names within the SMID Gassy basket look crowded by small/SMID investors as of 3q12. CRZO has the highest ownership among this group, owned by 56 funds.
Several names saw rising ownership during 3Q12, including REXX (+10), CRK (+8), WPX (+7) and GDP (+6). FST was the only name that saw a large decline in ownership during 3Q12, sold by 7 funds. Generally theses names tend to be less owned than Oily or Hybrid names. Our analysts’ have Neutral or Underperform ratings on all names they cover on this list.
SMID Gassy E&P Names
Source: CS Small/Mid Cap US Equity Strategy, Bloomberg, price 2/12/2013
SMID Gassy E&P Companies - Based on 2011 Reserves, Ranked By 3Q12 Small/SMID Fund Ownership
Ticker Company Name CS Analyst Rating
Target
Price
Current
Price
Market
Cap
3Q12
Perf
4Q12
Perf
2012
Perf
2013
YTD
Perf
# Small/
SMID
Funds
Chg
During
3Q12
Chg
During
2Q12
#
Ratings
%
Buys
CRZO Carrizo Oil & Gas Inc Mark Lear UNDERPERFORM 20.00 21.72 871 6.47 (16.35) (20.61) 3.82 56 -2 -12 19 63%
REXX Rex Energy Corp Mark Lear NEUTRAL 13.00 13.35 706 19.05 (2.44) (11.79) 2.53 47 10 -5 17 88%
CRK Comstock Resources Inc Mark Lear NEUTRAL 15.00 13.07 629 11.94 (17.74) (1.18) (13.56) 41 8 -9 21 62%
MCF Contango Oil & Gas Co #N/A #N/A #N/A 42.72 649 (16.99) (13.80) (27.19) 0.85 41 4 -8 1 0%
BBG Bill Barrett Corp #N/A #N/A #N/A 17.01 819 15.64 (28.18) (47.78) (4.38) 40 4 -17 18 39%
GDP Goodrich Petroleum Corp #N/A #N/A #N/A 13.28 483 (8.80) (26.27) (32.12) 42.49 33 6 1 25 60%
PVA Penn Virginia Corp Mark Lear NEUTRAL 6.00 4.90 270 (15.53) (28.87) (16.64) 11.11 26 1 -4 16 81%
PQ Petroquest Energy Inc #N/A #N/A #N/A 4.37 280 34.20 (26.23) (25.00) (11.72) 23 -3 -10 13 69%
FST Forest Oil Corp Mark Lear UNDERPERFORM 6.00 6.87 812 15.28 (20.83) (50.63) 2.69 23 -7 -11 23 26%
UPL Ultra Petroleum Corp #N/A #N/A #N/A 17.15 2,623 (4.72) (17.52) (38.81) (5.41) 15 1 4 24 17%
PHX Panhandle Oil and Gas Inc #N/A #N/A #N/A 28.00 231 1.76 (7.96) (13.96) (0.81) 13 1 -2 1 0%
WPX WPX Energy Inc #N/A #N/A #N/A 15.22 3,032 2.53 (10.31) (18.11) 2.28 12 7 5 12 25%
XCO EXCO Resources Inc #N/A #N/A #N/A 6.52 1,413 5.53 (15.48) (35.22) (3.69) 12 1 -3 15 7%
END Endeavour International #N/A #N/A #N/A 4.94 230 15.12 (46.43) (40.39) (4.63) 11 -4 2 11 73%
MTDR Matador Resources Co #N/A #N/A #N/A 8.05 447 (3.26) (21.08) NA (1.83) 8 0 2 9 67%
KWK Quicksilver Resources Inc Mark Lear RESTRICTED 2.38 412 (24.54) (30.07) (57.38) (16.78) 6 -2 -10 24 13%
GST Gastar Exploration Ltd #N/A #N/A #N/A 1.31 86 (13.99) (27.11) (61.95) 8.26 5 1 -3 10 60%
CXPO Crimson Exploration Inc #N/A #N/A #N/A 3.13 144 (6.97) (35.83) (4.20) 14.23 4 0 0 9 78%
FXEN FX Energy Inc #N/A #N/A #N/A 4.20 222 25.21 (44.83) (14.38) 2.19 2 0 -1 7 86%
ISRL Isramco Inc #N/A #N/A #N/A NA 268 5.45 NA NA NA 2 0 0 1 0%
Russell 2500 Index 362.82 5.17 2.65 16.05 8.62
Average Ownership 21 1 (4)
% Rising 55% 25%
9
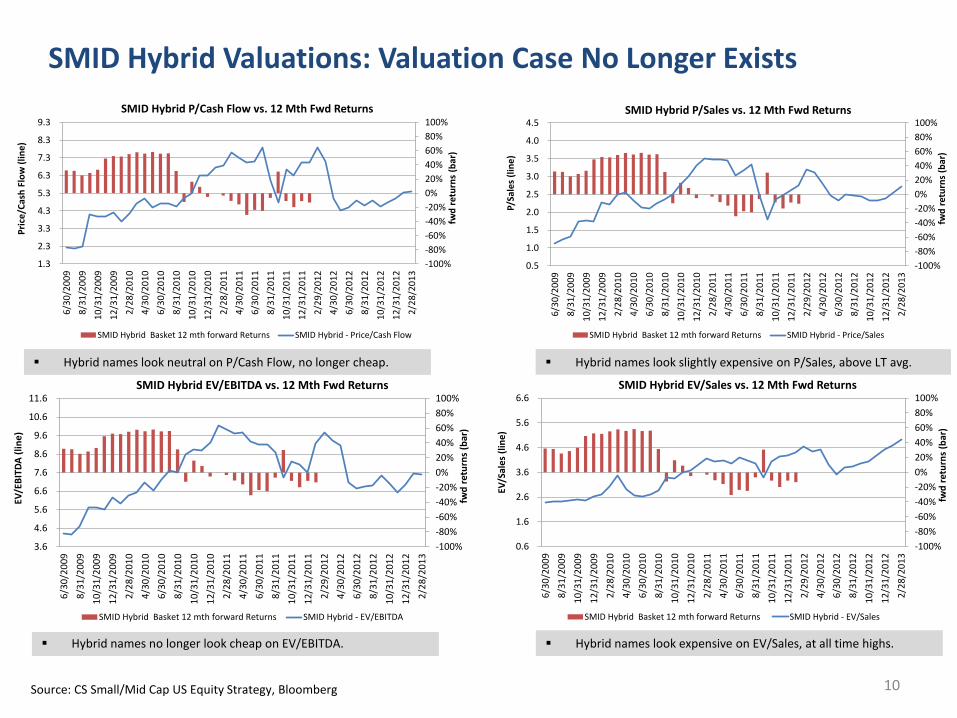
Hybrid names look neutral on P/Cash Flow, no longer cheap. Hybrid names look slightly expensive on P/Sales, above LT avg.
Hybrid names no longer look cheap on EV/EBITDA. Hybrid names look expensive on EV/Sales, at all time highs.
SMID Hybrid Valuations: Valuation Case No Longer Exists
-100%
-80%
-60%
-40%
-20%
0%
20%
40%
60%
80%
100%
1.3
2.3
3.3
4.3
5.3
6.3
7.3
8.3
9.3
6/3
0/2
00
9
8/3
1/2
00
9
10
/31
/20
09
12
/31
/20
09
2/2
8/2
01
0
4/3
0/2
01
0
6/3
0/2
01
0
8/3
1/2
01
0
10
/31
/20
10
12
/31
/20
10
2/2
8/2
01
1
4/3
0/2
01
1
6/3
0/2
01
1
8/3
1/2
01
1
10
/31
/20
11
12
/31
/20
11
2/2
9/2
01
2
4/3
0/2
01
2
6/3
0/2
01
2
8/3
1/2
01
2
10
/31
/20
12
12
/31
/20
12
2/2
8/2
01
3
fwd
ret
urn
s (b
ar)
Pri
ce/C
ash
Flo
w (
lin
e)
SMID Hybrid P/Cash Flow vs. 12 Mth Fwd Returns
SMID Hybrid Basket 12 mth forward Returns SMID Hybrid - Price/Cash Flow
-100%
-80%
-60%
-40%
-20%
0%
20%
40%
60%
80%
100%
0.5
1.0
1.5
2.0
2.5
3.0
3.5
4.0
4.5
6/3
0/2
00
9
8/3
1/2
00
9
10
/31
/20
09
12
/31
/20
09
2/2
8/2
01
0
4/3
0/2
01
0
6/3
0/2
01
0
8/3
1/2
01
0
10
/31
/20
10
12
/31
/20
10
2/2
8/2
01
1
4/3
0/2
01
1
6/3
0/2
01
1
8/3
1/2
01
1
10
/31
/20
11
12
/31
/20
11
2/2
9/2
01
2
4/3
0/2
01
2
6/3
0/2
01
2
8/3
1/2
01
2
10
/31
/20
12
12
/31
/20
12
2/2
8/2
01
3
fwd
ret
urn
s (b
ar)
P/Sa
les
(lin
e)
SMID Hybrid P/Sales vs. 12 Mth Fwd Returns
SMID Hybrid Basket 12 mth forward Returns SMID Hybrid - Price/Sales
-100%
-80%
-60%
-40%
-20%
0%
20%
40%
60%
80%
100%
3.6
4.6
5.6
6.6
7.6
8.6
9.6
10.6
11.6
6/3
0/2
00
9
8/3
1/2
00
9
10
/31
/20
09
12
/31
/20
09
2/2
8/2
01
0
4/3
0/2
01
0
6/3
0/2
01
0
8/3
1/2
01
0
10
/31
/20
10
12
/31
/20
10
2/2
8/2
01
1
4/3
0/2
01
1
6/3
0/2
01
1
8/3
1/2
01
1
10
/31
/20
11
12
/31
/20
11
2/2
9/2
01
2
4/3
0/2
01
2
6/3
0/2
01
2
8/3
1/2
01
2
10
/31
/20
12
12
/31
/20
12
2/2
8/2
01
3
fwd
ret
urn
s (b
ar)
EV/E
BIT
DA
(li
ne
)
SMID Hybrid EV/EBITDA vs. 12 Mth Fwd Returns
SMID Hybrid Basket 12 mth forward Returns SMID Hybrid - EV/EBITDA
-100%
-80%
-60%
-40%
-20%
0%
20%
40%
60%
80%
100%
0.6
1.6
2.6
3.6
4.6
5.6
6.6
6/3
0/2
00
9
8/3
1/2
00
9
10
/31
/20
09
12
/31
/20
09
2/2
8/2
01
0
4/3
0/2
01
0
6/3
0/2
01
0
8/3
1/2
01
0
10
/31
/20
10
12
/31
/20
10
2/2
8/2
01
1
4/3
0/2
01
1
6/3
0/2
01
1
8/3
1/2
01
1
10
/31
/20
11
12
/31
/20
11
2/2
9/2
01
2
4/3
0/2
01
2
6/3
0/2
01
2
8/3
1/2
01
2
10
/31
/20
12
12
/31
/20
12
2/2
8/2
01
3
fwd
ret
urn
s (b
ar)
EV/S
ales
(li
ne
)
SMID Hybrid EV/Sales vs. 12 Mth Fwd Returns
SMID Hybrid Basket 12 mth forward Returns SMID Hybrid - EV/Sales
Source: CS Small/Mid Cap US Equity Strategy, Bloomberg 10
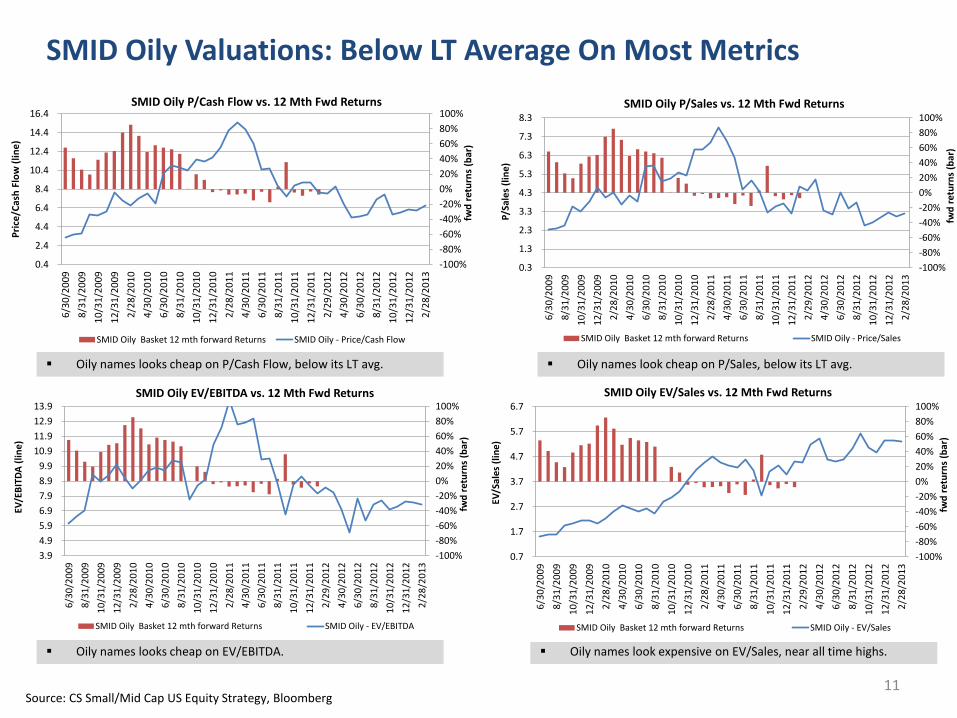
Oily names looks cheap on P/Cash Flow, below its LT avg. Oily names look cheap on P/Sales, below its LT avg.
Oily names looks cheap on EV/EBITDA. Oily names look expensive on EV/Sales, near all time highs.
SMID Oily Valuations: Below LT Average On Most Metrics
-100%
-80%
-60%
-40%
-20%
0%
20%
40%
60%
80%
100%
0.4
2.4
4.4
6.4
8.4
10.4
12.4
14.4
16.4
6/3
0/2
00
9
8/3
1/2
00
9
10
/31
/20
09
12
/31
/20
09
2/2
8/2
01
0
4/3
0/2
01
0
6/3
0/2
01
0
8/3
1/2
01
0
10
/31
/20
10
12
/31
/20
10
2/2
8/2
01
1
4/3
0/2
01
1
6/3
0/2
01
1
8/3
1/2
01
1
10
/31
/20
11
12
/31
/20
11
2/2
9/2
01
2
4/3
0/2
01
2
6/3
0/2
01
2
8/3
1/2
01
2
10
/31
/20
12
12
/31
/20
12
2/2
8/2
01
3
fwd
ret
urn
s (b
ar)
Pri
ce/C
ash
Flo
w (
lin
e)
SMID Oily P/Cash Flow vs. 12 Mth Fwd Returns
SMID Oily Basket 12 mth forward Returns SMID Oily - Price/Cash Flow
-100%
-80%
-60%
-40%
-20%
0%
20%
40%
60%
80%
100%
0.3
1.3
2.3
3.3
4.3
5.3
6.3
7.3
8.3
6/3
0/2
00
9
8/3
1/2
00
9
10
/31
/20
09
12
/31
/20
09
2/2
8/2
01
0
4/3
0/2
01
0
6/3
0/2
01
0
8/3
1/2
01
0
10
/31
/20
10
12
/31
/20
10
2/2
8/2
01
1
4/3
0/2
01
1
6/3
0/2
01
1
8/3
1/2
01
1
10
/31
/20
11
12
/31
/20
11
2/2
9/2
01
2
4/3
0/2
01
2
6/3
0/2
01
2
8/3
1/2
01
2
10
/31
/20
12
12
/31
/20
12
2/2
8/2
01
3
fwd
ret
urn
s (b
ar)
P/Sa
les
(lin
e)
SMID Oily P/Sales vs. 12 Mth Fwd Returns
SMID Oily Basket 12 mth forward Returns SMID Oily - Price/Sales
-100%
-80%
-60%
-40%
-20%
0%
20%
40%
60%
80%
100%
3.9
4.9
5.9
6.9
7.9
8.9
9.9
10.9
11.9
12.9
13.9
6/3
0/2
00
9
8/3
1/2
00
9
10
/31
/20
09
12
/31
/20
09
2/2
8/2
01
0
4/3
0/2
01
0
6/3
0/2
01
0
8/3
1/2
01
0
10
/31
/20
10
12
/31
/20
10
2/2
8/2
01
1
4/3
0/2
01
1
6/3
0/2
01
1
8/3
1/2
01
1
10
/31
/20
11
12
/31
/20
11
2/2
9/2
01
2
4/3
0/2
01
2
6/3
0/2
01
2
8/3
1/2
01
2
10
/31
/20
12
12
/31
/20
12
2/2
8/2
01
3
fwd
ret
urn
s (b
ar)
EV/E
BIT
DA
(li
ne
)
SMID Oily EV/EBITDA vs. 12 Mth Fwd Returns
SMID Oily Basket 12 mth forward Returns SMID Oily - EV/EBITDA
-100%
-80%
-60%
-40%
-20%
0%
20%
40%
60%
80%
100%
0.7
1.7
2.7
3.7
4.7
5.7
6.7
6/3
0/2
00
9
8/3
1/2
00
9
10
/31
/20
09
12
/31
/20
09
2/2
8/2
01
0
4/3
0/2
01
0
6/3
0/2
01
0
8/3
1/2
01
0
10
/31
/20
10
12
/31
/20
10
2/2
8/2
01
1
4/3
0/2
01
1
6/3
0/2
01
1
8/3
1/2
01
1
10
/31
/20
11
12
/31
/20
11
2/2
9/2
01
2
4/3
0/2
01
2
6/3
0/2
01
2
8/3
1/2
01
2
10
/31
/20
12
12
/31
/20
12
2/2
8/2
01
3
fwd
ret
urn
s (b
ar)
EV/S
ale
s (l
ine
)
SMID Oily EV/Sales vs. 12 Mth Fwd Returns
SMID Oily Basket 12 mth forward Returns SMID Oily - EV/Sales
Source: CS Small/Mid Cap US Equity Strategy, Bloomberg 11
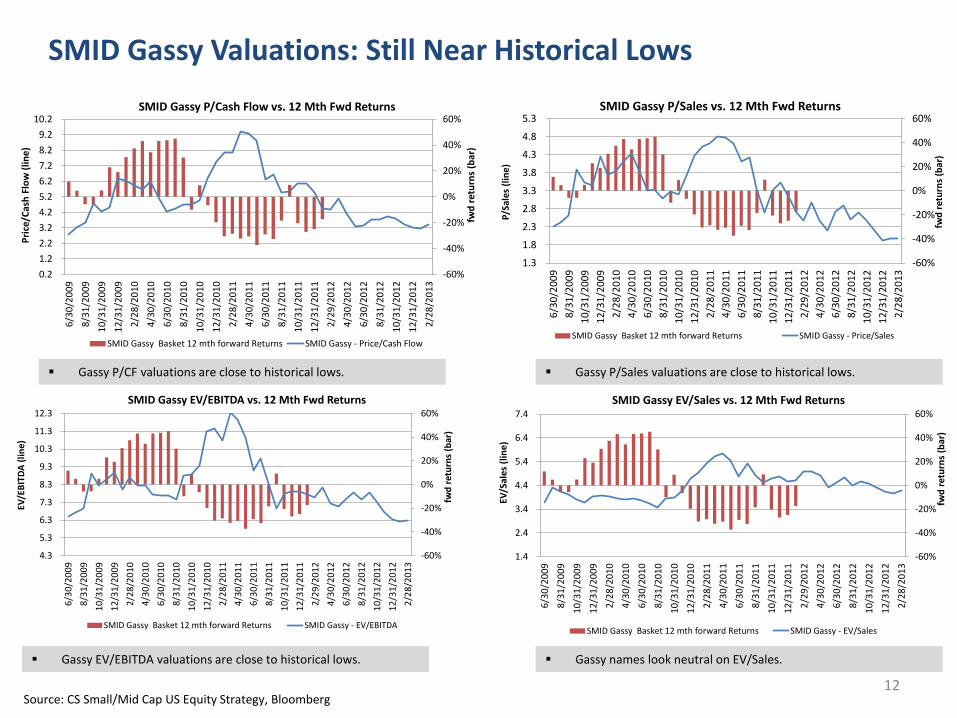
Gassy P/CF valuations are close to historical lows. Gassy P/Sales valuations are close to historical lows.
Gassy EV/EBITDA valuations are close to historical lows. Gassy names look neutral on EV/Sales.
SMID Gassy Valuations: Still Near Historical Lows
-60%
-40%
-20%
0%
20%
40%
60%
0.2
1.2
2.2
3.2
4.2
5.2
6.2
7.2
8.2
9.2
10.2
6/3
0/2
00
9
8/3
1/2
00
9
10
/31
/20
09
12
/31
/20
09
2/2
8/2
01
0
4/3
0/2
01
0
6/3
0/2
01
0
8/3
1/2
01
0
10
/31
/20
10
12
/31
/20
10
2/2
8/2
01
1
4/3
0/2
01
1
6/3
0/2
01
1
8/3
1/2
01
1
10
/31
/20
11
12
/31
/20
11
2/2
9/2
01
2
4/3
0/2
01
2
6/3
0/2
01
2
8/3
1/2
01
2
10
/31
/20
12
12
/31
/20
12
2/2
8/2
01
3
fwd
ret
urn
s (b
ar)
Pri
ce/C
ash
Flo
w (
lin
e)
SMID Gassy P/Cash Flow vs. 12 Mth Fwd Returns
SMID Gassy Basket 12 mth forward Returns SMID Gassy - Price/Cash Flow
-60%
-40%
-20%
0%
20%
40%
60%
1.3
1.8
2.3
2.8
3.3
3.8
4.3
4.8
5.3
6/3
0/2
00
9
8/3
1/2
00
9
10
/31
/20
09
12
/31
/20
09
2/2
8/2
01
0
4/3
0/2
01
0
6/3
0/2
01
0
8/3
1/2
01
0
10
/31
/20
10
12
/31
/20
10
2/2
8/2
01
1
4/3
0/2
01
1
6/3
0/2
01
1
8/3
1/2
01
1
10
/31
/20
11
12
/31
/20
11
2/2
9/2
01
2
4/3
0/2
01
2
6/3
0/2
01
2
8/3
1/2
01
2
10
/31
/20
12
12
/31
/20
12
2/2
8/2
01
3
fwd
ret
urn
s (b
ar)
P/Sa
les
(lin
e)
SMID Gassy P/Sales vs. 12 Mth Fwd Returns
SMID Gassy Basket 12 mth forward Returns SMID Gassy - Price/Sales
-60%
-40%
-20%
0%
20%
40%
60%
4.3
5.3
6.3
7.3
8.3
9.3
10.3
11.3
12.3
6/3
0/2
00
9
8/3
1/2
00
9
10
/31
/20
09
12
/31
/20
09
2/2
8/2
01
0
4/3
0/2
01
0
6/3
0/2
01
0
8/3
1/2
01
0
10
/31
/20
10
12
/31
/20
10
2/2
8/2
01
1
4/3
0/2
01
1
6/3
0/2
01
1
8/3
1/2
01
1
10
/31
/20
11
12
/31
/20
11
2/2
9/2
01
2
4/3
0/2
01
2
6/3
0/2
01
2
8/3
1/2
01
2
10
/31
/20
12
12
/31
/20
12
2/2
8/2
01
3
fwd
ret
urn
s (b
ar)
EV/E
BIT
DA
(lin
e)
SMID Gassy EV/EBITDA vs. 12 Mth Fwd Returns
SMID Gassy Basket 12 mth forward Returns SMID Gassy - EV/EBITDA
-60%
-40%
-20%
0%
20%
40%
60%
1.4
2.4
3.4
4.4
5.4
6.4
7.4
6/3
0/2
00
9
8/3
1/2
00
9
10
/31
/20
09
12
/31
/20
09
2/2
8/2
01
0
4/3
0/2
01
0
6/3
0/2
01
0
8/3
1/2
01
0
10
/31
/20
10
12
/31
/20
10
2/2
8/2
01
1
4/3
0/2
01
1
6/3
0/2
01
1
8/3
1/2
01
1
10
/31
/20
11
12
/31
/20
11
2/2
9/2
01
2
4/3
0/2
01
2
6/3
0/2
01
2
8/3
1/2
01
2
10
/31
/20
12
12
/31
/20
12
2/2
8/2
01
3
fwd
ret
urn
s (b
ar)
EV/S
ales
(li
ne
)
SMID Gassy EV/Sales vs. 12 Mth Fwd Returns
SMID Gassy Basket 12 mth forward Returns SMID Gassy - EV/Sales
Source: CS Small/Mid Cap US Equity Strategy, Bloomberg 12
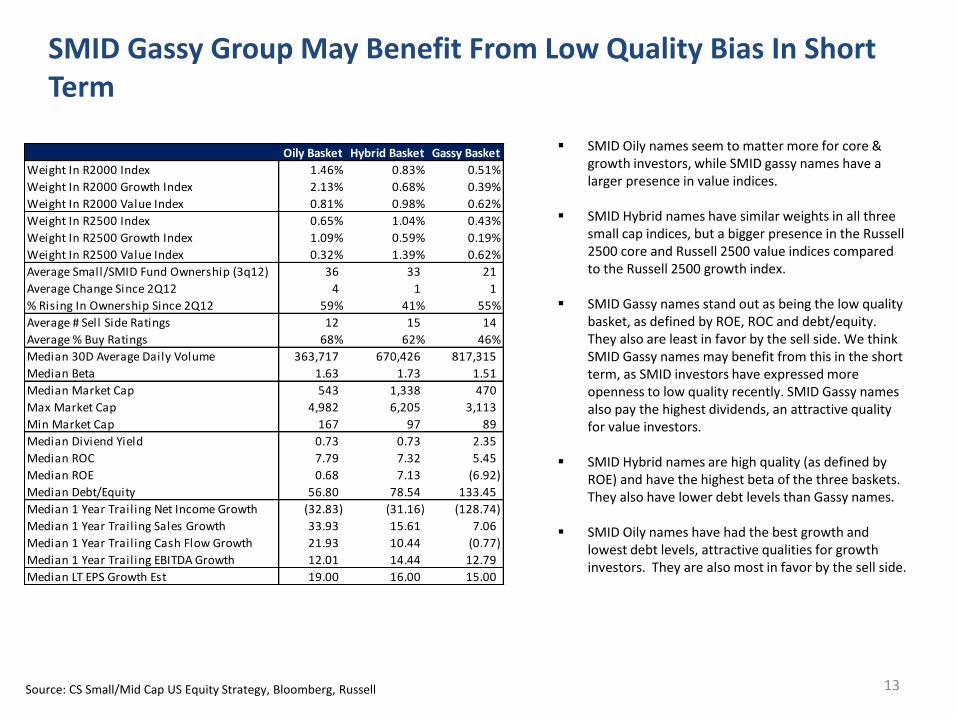
SMID Gassy Group May Benefit From Low Quality Bias In Short Term
SMID Oily names seem to matter more for core &
growth investors, while SMID gassy names have a larger presence in value indices.
SMID Hybrid names have similar weights in all three small cap indices, but a bigger presence in the Russell 2500 core and Russell 2500 value indices compared to the Russell 2500 growth index.
SMID Gassy names stand out as being the low quality basket, as defined by ROE, ROC and debt/equity. They also are least in favor by the sell side. We think SMID Gassy names may benefit from this in the short term, as SMID investors have expressed more openness to low quality recently. SMID Gassy names also pay the highest dividends, an attractive quality for value investors.
SMID Hybrid names are high quality (as defined by
ROE) and have the highest beta of the three baskets. They also have lower debt levels than Gassy names.
SMID Oily names have had the best growth and lowest debt levels, attractive qualities for growth investors. They are also most in favor by the sell side.
Source: CS Small/Mid Cap US Equity Strategy, Bloomberg, Russell
Oily Basket Hybrid Basket Gassy Basket
Weight In R2000 Index 1.46% 0.83% 0.51%
Weight In R2000 Growth Index 2.13% 0.68% 0.39%
Weight In R2000 Value Index 0.81% 0.98% 0.62%
Weight In R2500 Index 0.65% 1.04% 0.43%
Weight In R2500 Growth Index 1.09% 0.59% 0.19%
Weight In R2500 Value Index 0.32% 1.39% 0.62%
Average Small/SMID Fund Ownership (3q12) 36 33 21
Average Change Since 2Q12 4 1 1
% Rising In Ownership Since 2Q12 59% 41% 55%
Average # Sell Side Ratings 12 15 14
Average % Buy Ratings 68% 62% 46%
Median 30D Average Daily Volume 363,717 670,426 817,315
Median Beta 1.63 1.73 1.51
Median Market Cap 543 1,338 470
Max Market Cap 4,982 6,205 3,113
Min Market Cap 167 97 89
Median Diviend Yield 0.73 0.73 2.35
Median ROC 7.79 7.32 5.45
Median ROE 0.68 7.13 (6.92)
Median Debt/Equity 56.80 78.54 133.45
Median 1 Year Trailing Net Income Growth (32.83) (31.16) (128.74)
Median 1 Year Trailing Sales Growth 33.93 15.61 7.06
Median 1 Year Trailing Cash Flow Growth 21.93 10.44 (0.77)
Median 1 Year Trailing EBITDA Growth 12.01 14.44 12.79
Median LT EPS Growth Est 19.00 16.00 15.00
13
18%
41% 39%36%
41%
23%
41%
34%
26%
43%
35%
22%
0%
10%
20%
30%
40%
50%
Outperform Market Perform Underperform
What is your expectation for Gassy names (within small/mid
cap) over the next 6-12 months?
1Q12 2Q12 3Q12 4Q12
46%
34%
16%
26%
44%
30%
45%
35%
20%
36%
43%
21%
0%
10%
20%
30%
40%
50%
Outperform Market Perform Underperform
What is your expectation for Oily names (within small/mid
cap) over the next 6-12 months?
1Q12 2Q12 3Q12 4Q12
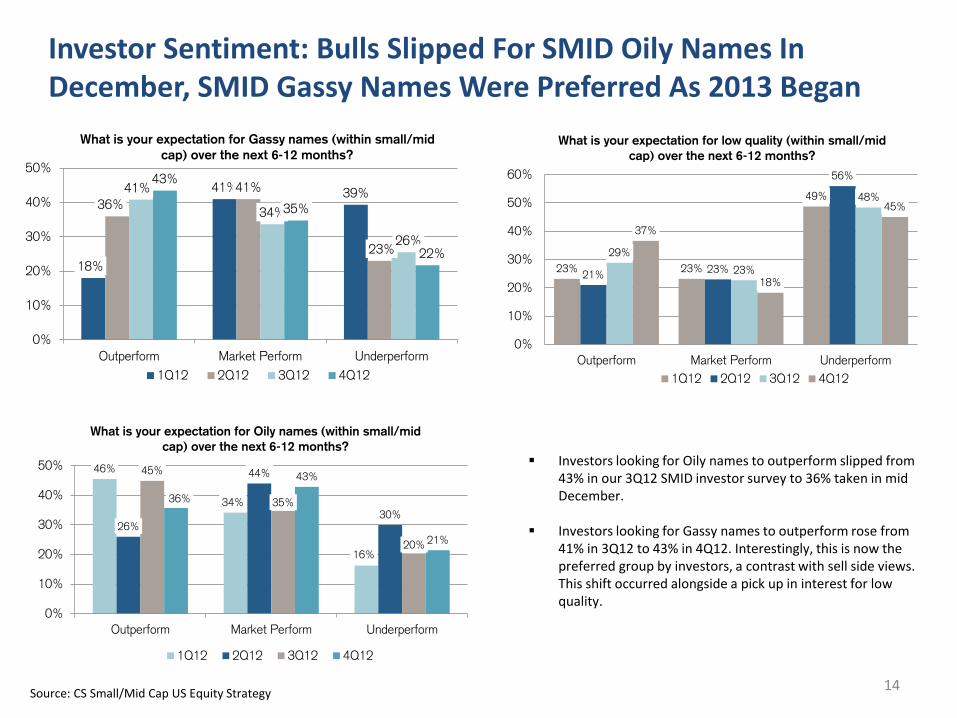
Investor Sentiment: Bulls Slipped For SMID Oily Names In December, SMID Gassy Names Were Preferred As 2013 Began
Investors looking for Oily names to outperform slipped from 43% in our 3Q12 SMID investor survey to 36% taken in mid December.
Investors looking for Gassy names to outperform rose from 41% in 3Q12 to 43% in 4Q12. Interestingly, this is now the preferred group by investors, a contrast with sell side views. This shift occurred alongside a pick up in interest for low quality.
Source: CS Small/Mid Cap US Equity Strategy
23% 23%
49%
21%23%
56%
29%
23%
48%
37%
18%
45%
0%
10%
20%
30%
40%
50%
60%
Outperform Market Perform Underperform
What is your expectation for low quality (within small/mid
cap) over the next 6-12 months?
1Q12 2Q12 3Q12 4Q12
14
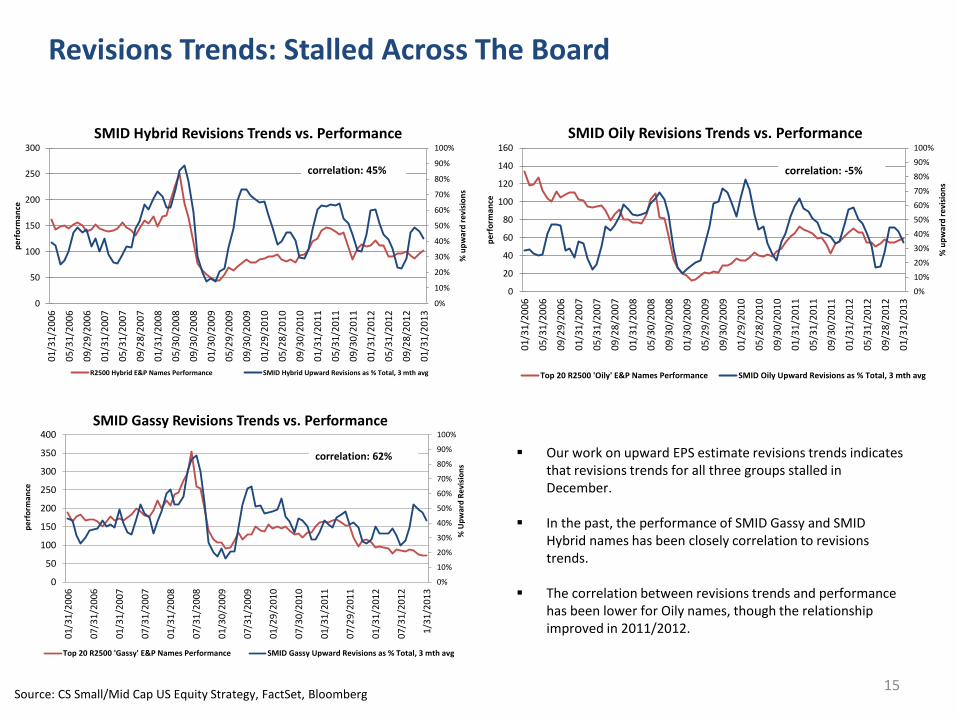
Revisions Trends: Stalled Across The Board
Our work on upward EPS estimate revisions trends indicates that revisions trends for all three groups stalled in December.
In the past, the performance of SMID Gassy and SMID Hybrid names has been closely correlation to revisions trends.
The correlation between revisions trends and performance has been lower for Oily names, though the relationship improved in 2011/2012.
0%
10%
20%
30%
40%
50%
60%
70%
80%
90%
100%
0
50
100
150
200
250
300
350
400
01
/31
/20
06
07
/31
/20
06
01
/31
/20
07
07
/31
/20
07
01
/31
/20
08
07
/31
/20
08
01
/30
/20
09
07
/31
/20
09
01
/29
/20
10
07
/30
/20
10
01
/31
/20
11
07
/29
/20
11
01
/31
/20
12
07
/31
/20
12
1/3
1/2
01
3
% U
pw
ard
Re
visi
on
s
pe
rfo
rman
ce
SMID Gassy Revisions Trends vs. Performance
Top 20 R2500 'Gassy' E&P Names Performance SMID Gassy Upward Revisions as % Total, 3 mth avg
correlation: 62%
0%
10%
20%
30%
40%
50%
60%
70%
80%
90%
100%
0
20
40
60
80
100
120
140
160
01
/31
/20
06
05
/31
/20
06
09
/29
/20
06
01
/31
/20
07
05
/31
/20
07
09
/28
/20
07
01
/31
/20
08
05
/30
/20
08
09
/30
/20
08
01
/30
/20
09
05
/29
/20
09
09
/30
/20
09
01
/29
/20
10
05
/28
/20
10
09
/30
/20
10
01
/31
/20
11
05
/31
/20
11
09
/30
/20
11
01
/31
/20
12
05
/31
/20
12
09
/28
/20
12
01
/31
/20
13
% u
pw
ard
re
visi
on
s
pe
rfo
rman
ce
SMID Oily Revisions Trends vs. Performance
Top 20 R2500 'Oily' E&P Names Performance SMID Oily Upward Revisions as % Total, 3 mth avg
correlation: -5%
0%
10%
20%
30%
40%
50%
60%
70%
80%
90%
100%
0
50
100
150
200
250
300
01
/31
/20
06
05
/31
/20
06
09
/29
/20
06
01
/31
/20
07
05
/31
/20
07
09
/28
/20
07
01
/31
/20
08
05
/30
/20
08
09
/30
/20
08
01
/30
/20
09
05
/29
/20
09
09
/30
/20
09
01
/29
/20
10
05
/28
/20
10
09
/30
/20
10
01
/31
/20
11
05
/31
/20
11
09
/30
/20
11
01
/31
/20
12
05
/31
/20
12
09
/28
/20
12
01
/31
/20
13
% u
pw
ard
re
visi
on
s
pe
rfo
rman
ce
SMID Hybrid Revisions Trends vs. Performance
R2500 Hybrid E&P Names Performance SMID Hybrid Upward Revisions as % Total, 3 mth avg
correlation: 45%
Source: CS Small/Mid Cap US Equity Strategy, FactSet, Bloomberg 15
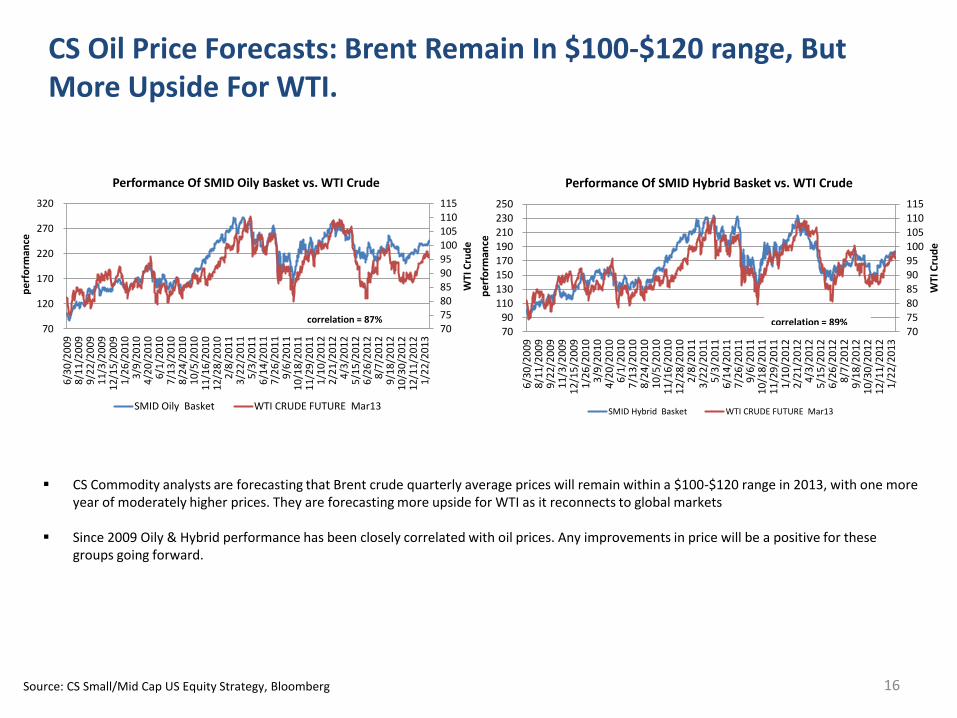
CS Oil Price Forecasts: Brent Remain In $100-$120 range, But More Upside For WTI.
CS Commodity analysts are forecasting that Brent crude quarterly average prices will remain within a $100-$120 range in 2013, with one more year of moderately higher prices. They are forecasting more upside for WTI as it reconnects to global markets
Since 2009 Oily & Hybrid performance has been closely correlated with oil prices. Any improvements in price will be a positive for these
groups going forward.
707580859095100105110115
70 90
110 130 150 170 190 210 230 250
6/3
0/2
009
8/1
1/2
009
9/2
2/2
009
11
/3/2
009
12
/15
/20
09
1/2
6/2
010
3/9
/20
10
4/2
0/2
010
6/1
/20
10
7/1
3/2
010
8/2
4/2
010
10
/5/2
010
11
/16
/20
10
12
/28
/20
10
2/8
/20
11
3/2
2/2
011
5/3
/20
11
6/1
4/2
011
7/2
6/2
011
9/6
/20
11
10
/18
/20
11
11
/29
/20
11
1/1
0/2
012
2/2
1/2
012
4/3
/20
12
5/1
5/2
012
6/2
6/2
012
8/7
/20
12
9/1
8/2
012
10
/30
/20
12
12
/11
/20
12
1/2
2/2
013
WTI
Cru
de
per
form
ance
Performance Of SMID Hybrid Basket vs. WTI Crude
SMID Hybrid Basket WTI CRUDE FUTURE Mar13
correlation = 89%707580859095100105110115
70
120
170
220
270
320
6/3
0/2
00
98
/11
/20
09
9/2
2/2
00
91
1/3
/20
09
12
/15
/20
09
1/2
6/2
01
03
/9/2
01
04
/20
/20
10
6/1
/20
10
7/1
3/2
01
08
/24
/20
10
10
/5/2
01
01
1/1
6/2
01
01
2/2
8/2
01
02
/8/2
01
13
/22
/20
11
5/3
/20
11
6/1
4/2
01
17
/26
/20
11
9/6
/20
11
10
/18
/20
11
11
/29
/20
11
1/1
0/2
01
22
/21
/20
12
4/3
/20
12
5/1
5/2
01
26
/26
/20
12
8/7
/20
12
9/1
8/2
01
21
0/3
0/2
01
21
2/1
1/2
01
21
/22
/20
13
WTI
Cru
de
pe
rfo
rman
ce
Performance Of SMID Oily Basket vs. WTI Crude
SMID Oily Basket WTI CRUDE FUTURE Mar13
correlation = 87%
Source: CS Small/Mid Cap US Equity Strategy, Bloomberg 16
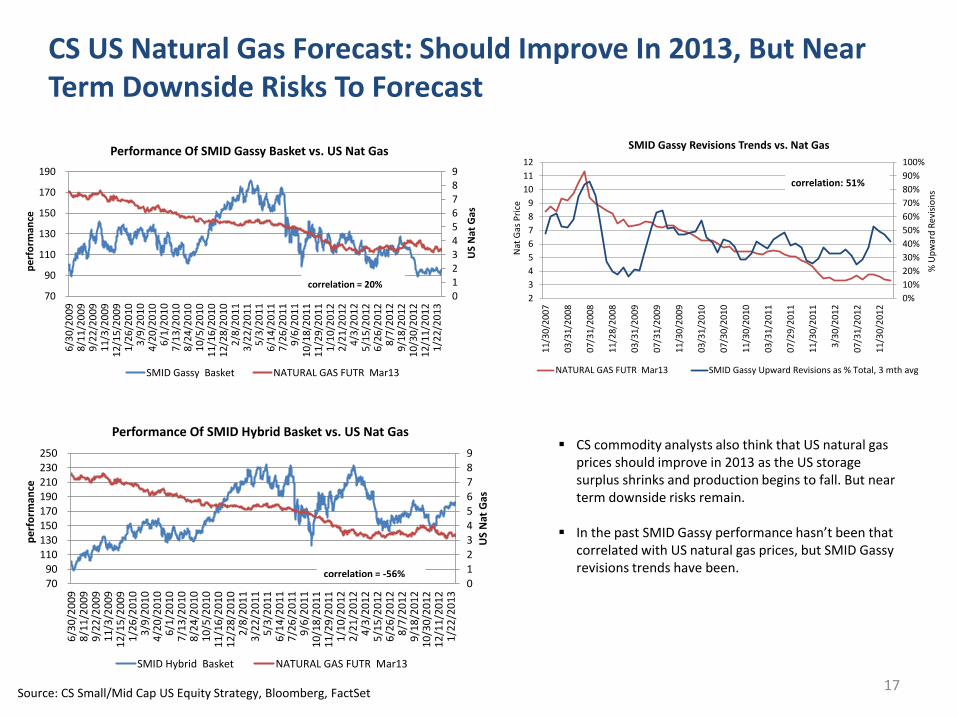
CS commodity analysts also think that US natural gas prices should improve in 2013 as the US storage surplus shrinks and production begins to fall. But near term downside risks remain.
In the past SMID Gassy performance hasn’t been that correlated with US natural gas prices, but SMID Gassy revisions trends have been.
CS US Natural Gas Forecast: Should Improve In 2013, But Near Term Downside Risks To Forecast
0123456789
70 90
110 130 150 170 190 210 230 250
6/3
0/2
00
98
/11
/20
09
9/2
2/2
00
91
1/3
/20
09
12
/15
/20
09
1/2
6/2
01
03
/9/2
01
04
/20
/20
10
6/1
/20
10
7/1
3/2
01
08
/24
/20
10
10
/5/2
01
01
1/1
6/2
01
01
2/2
8/2
01
02
/8/2
01
13
/22
/20
11
5/3
/20
11
6/1
4/2
01
17
/26
/20
11
9/6
/20
11
10
/18
/20
11
11
/29
/20
11
1/1
0/2
01
22
/21
/20
12
4/3
/20
12
5/1
5/2
01
26
/26
/20
12
8/7
/20
12
9/1
8/2
01
21
0/3
0/2
01
21
2/1
1/2
01
21
/22
/20
13
US
Nat
Gas
pe
rfo
rman
ce
Performance Of SMID Hybrid Basket vs. US Nat Gas
SMID Hybrid Basket NATURAL GAS FUTR Mar13
correlation = -56%
0123456789
70
90
110
130
150
170
190
6/3
0/2
00
98
/11
/20
09
9/2
2/2
00
91
1/3
/20
09
12
/15
/20
09
1/2
6/2
01
03
/9/2
01
04
/20
/20
10
6/1
/20
10
7/1
3/2
01
08
/24
/20
10
10
/5/2
01
01
1/1
6/2
01
01
2/2
8/2
01
02
/8/2
01
13
/22
/20
11
5/3
/20
11
6/1
4/2
011
7/2
6/2
01
19
/6/2
01
11
0/1
8/2
01
11
1/2
9/2
01
11
/10
/20
12
2/2
1/2
01
24
/3/2
01
25
/15
/20
12
6/2
6/2
012
8/7
/20
12
9/1
8/2
01
21
0/3
0/2
01
21
2/1
1/2
01
21
/22
/20
13
US
Nat
Gas
pe
rfo
rman
ce
Performance Of SMID Gassy Basket vs. US Nat Gas
SMID Gassy Basket NATURAL GAS FUTR Mar13
correlation = 20%
0%
10%
20%
30%
40%
50%
60%
70%
80%
90%
100%
2
3
4
5
6
7
8
9
10
11
12
11
/30
/20
07
03
/31
/20
08
07
/31
/20
08
11
/28
/20
08
03
/31
/20
09
07
/31
/20
09
11
/30
/20
09
03
/31
/20
10
07
/30
/20
10
11
/30
/20
10
03
/31
/20
11
07
/29
/20
11
11
/30
/20
11
3/3
0/2
01
2
07
/31
/20
12
11
/30
/20
12
% U
pw
ard
Re
visi
on
s
Nat
Gas
Pri
ce
SMID Gassy Revisions Trends vs. Nat Gas
NATURAL GAS FUTR Mar13 SMID Gassy Upward Revisions as % Total, 3 mth avg
correlation: 51%
Source: CS Small/Mid Cap US Equity Strategy, Bloomberg, FactSet 17
-100%
-75%
-50%
-25%
0%
25%
50%
75%
100%
(4)
(3)
(2)
(1)
-
1
2
3
4
Dec
-86
Dec
-88
Dec
-90
Dec
-92
Dec
-94
Dec
-96
Dec
-98
Dec
-00
Dec
-02
Dec
-04
Dec
-06
Dec
-08
Dec
-10
Dec
-12
Ret
urn
Val
uat
ion
Small Cap Energy Relative Valuation
Energy 12 Mth Relative Forward Return
Energy Relative Valuation Model - P/B, P/S
Still Overweight Energy & E&P’s Are The Biggest Weight
0%
10%
20%
30%
40%
50%
60%
70%
80%
90%
01
/30
/19
87
01
/31
/19
89
01
/31
/19
91
01
/29
/19
93
01
/31
/19
95
01
/31
/19
97
01
/29
/19
99
01
/31
/20
01
01
/31
/20
03
01
/31
/20
05
01
/31
/20
07
01
/30
/20
09
1/3
1/2
011
1/3
1/2
013
Energy Upward Revisions Trends
Russell 2500 Energy Sector Up Revisions as % of Total
Russell 2500 Energy Sector 3 mo avg
0%
2%
4%
6%
8%
10%
Dec
-03
Mar
-04
Jun
-04
Sep
-04
Dec
-04
Mar
-05
Jun
-05
Sep
-05
Dec
-05
Mar
-06
Jun
-06
Sep
-06
Dec
-06
Mar
-07
Jun
-07
Sep
-07
Dec
-07
Mar
-08
Jun
-08
Sep
-08
Dec
-08
Mar
-09
Jun
-09
Sep
-09
Dec
-09
Mar
-10
Jun
-10
Sep
-10
Dec
-10
Mar
-11
Jun
-11
Sep
-11
Dec
-11
Mar
-12
Jun
-12
Sep
-12
Dec
-12
Energy Allocation in R2000 Value Funds vs Sector Weight In R2000 Value Index
R2000 Value Benchmarked Funds Energy Allocation
Energy Weight In R2000 Value Index
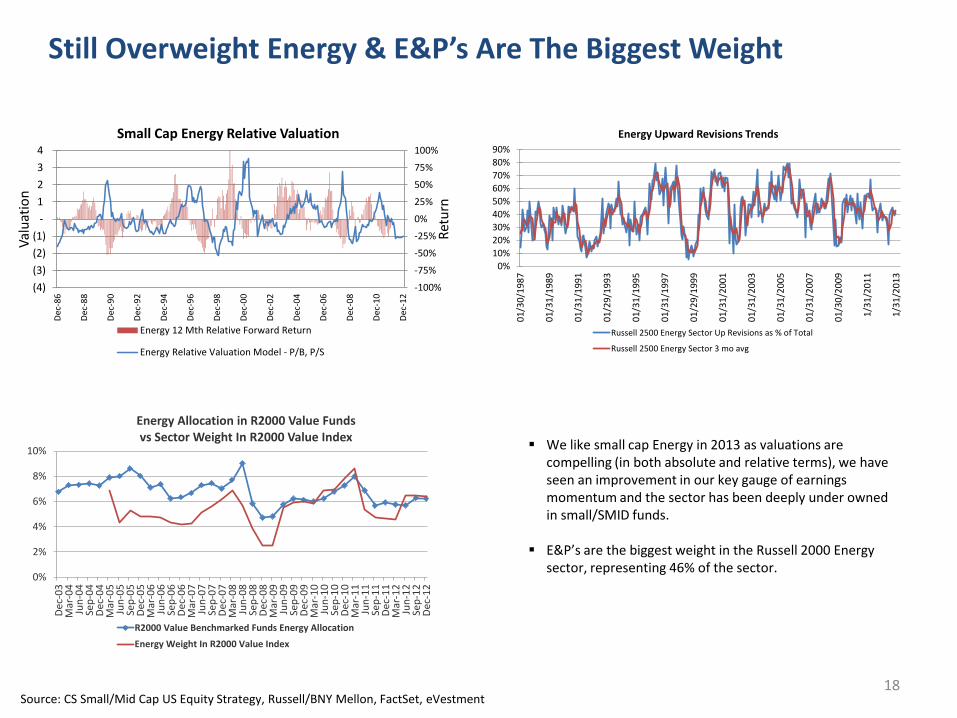
We like small cap Energy in 2013 as valuations are compelling (in both absolute and relative terms), we have seen an improvement in our key gauge of earnings momentum and the sector has been deeply under owned in small/SMID funds.
E&P’s are the biggest weight in the Russell 2000 Energy sector, representing 46% of the sector.
Source: CS Small/Mid Cap US Equity Strategy, Russell/BNY Mellon, FactSet, eVestment 18
Please see slides 5-9 for a full list of companies mentioned
DISCLOSURE APPENDIX CONTAINS IMPORTANT DISCLOSURES, ANALYST CERTIFICATIONS, INFORMATION ON TRADE ALERTS, ANALYST MODEL
PORTFOLIOS AND THE STATUS OF NON-U.S ANALYSTS. US Disclosure: Credit Suisse does and seeks to do business with companies covered in its research reports. As a result, investors should be aware that the Firm may have a conflict of interest that could affect the objectivity of this report. Investors should consider this report as only a single factor in making their investment decision.
Disclosure Appendix
Important Global Disclosures
I, Lori Calvasina, certify that (1) the views expressed in this report accurately reflect my personal views about all of the subject companies and securities and (2) no part of my compensation was, is or will be directly or indirectly related to the specific recommendations or views expressed in this report.
The analyst(s) responsible for preparing this research report received Compensation that is based upon various factors including Credit Suisse's total revenues, a portion of which are generated by Credit Suisse's investment banking activities
As of December 10, 2012 Analysts’ stock rating are defined as follows:
Outperform (O) : The stock’s total return is expected to outperform the relevant benchmark*over the next 12 months.
Neutral (N) : The stock’s total return is expected to be in line with the relevant benchmark* over the next 12 months.
Underperform (U) : The stock’s total return is expected to underperform the relevant benchmark* over the next 12 months.
*Relevant benchmark by region: As of 10th December 2012, Japanese ratings are based on a stock’s total return relative to the analyst's coverage universe which consists of all companies covered by the analyst within the relevant sector, with Outperforms representing the most attractive, Neutrals the less attractive, and Underperforms the least attractive investment opportunities. As of 2nd October 2012, U.S. and Canadian as well as European ratings are based on a stock’s total return relative to the analyst's coverage universe which consists of all companies covered by the analyst within the relevant sector, with Outperforms represe nting the most attractive, Neutrals the less attractive, and Underperforms the least attractive investment opportunities. For Latin American and non -Japan Asia stocks, ratings are based on a stock’s total return relative to the average total return of the relevant country or regional benchmark; Australia, New Zealand are, and prior to 2nd October 2012 U.S. and Canadian ratings were based on (1) a stock’s absolute total return potential to its current share price and (2) the relative attractiveness of a stock’s total return potential within an analyst’s coverage universe. For Australian and New Zealand stocks, 12-month rolling yield is incorporated in the absolute total return calculation and a 15% and a 7.5% threshold replace the 10-15% level in the Outperform and Underperform stock rating definitions, respectively. The 15% and 7.5% thresholds replace the +10-15% and -10-15% levels in the Neutral stock rating definition, respectively. Prior to 10th December 2012, Japanese ratings were based on a stock’s total return rel ative to the average total return of the relevant country or regional benchmark.
Restricted (R) : In certain circumstances, Credit Suisse policy and/or applicable law and regulations preclude certain types of communications, including an investment recommendation, during the course of Credit Suisse's engagement in an investment banking transaction and in certain other circumstances.
Volatility Indicator [V] : A stock is defined as volatile if the stock price has moved up or down by 20% or more in a month in at least 8 of the past 24 months or the analyst expects significant volatility going forward.
Analysts’ sector weightings are distinct from analysts’ stock ratings and are based on the analyst’s expectations for the fundamentals and/or valuation of the sector* relative to the group’s historic fundamentals and/or valuation:
Overweight : The analyst’s expectation for the sector’s fundamentals and/or valuation is favorable over the next 12 months.
Market Weight : The analyst’s expectation for the sector’s fundamentals and/or valuation is neutral over the next 12 months.
Underweight : The analyst’s expectation for the sector’s fundamentals and/or valuation is cautious over the next 12 months.
*An analyst’s coverage sector consists of all companies covered by the analyst within the relevant sector. An analyst may cover multiple sectors.
Credit Suisse's distribution of stock ratings (and banking clients) is:
Global Ratings Distribution
Rating Versus universe (%) Of which banking clients (%)
Outperform/Buy* 42% (53% banking clients)
Neutral/Hold* 38% (47% banking clients)
Underperform/Sell* 16% (40% banking clients)
Restricted 3%
*For purposes of the NYSE and NASD ratings distribution disclosure requirements, our stock ratings of Outperform, Neutral, an d Underperform most closely correspond to Buy, Hold, and Sell, respectively; however, the meanings are not the same, as our stock ratings are determined on a relative basis. (Please refer to definitions above.) An investor's decision to buy or sell a security should be based on investment objectives, current holdings, and other individua l factors.
Credit Suisse’s policy is to update research reports as it deems appropriate, based on developments with the subject company, the sector or the market that may have a material impact on the research views or opinions stated herein.
Credit Suisse's policy is only to publish investment research that is impartial, independent, clear, fair and not misleading. For more detail please refer to Credit Suisse's Policies for Managing Conflicts of Interest in connection with Investment Research: http://www.csfb.com/research and analytics/disclaimer/managing_conflicts_disclaimer.html
Credit Suisse does not provide any tax advice. Any statement herein regarding any US federal tax is not intended or
written to be used, and cannot be used, by any taxpayer for the purposes of avoiding any penalties.
Please refer to the firm's disclosure website at www.credit-suisse.com/researchdisclosures for the definitions of abbreviations typically used in the target price method and risk sections.
Important Regional Disclosures
Singapore recipients should contact Credit Suisse AG, Singapore Branch for any matters arising from this research report.
Restrictions on certain Canadian securities are indicated by the following abbreviations: NVS--Non-Voting shares; RVS--Restricted Voting Shares; SVS--Subordinate Voting Shares.
Individuals receiving this report from a Canadian investment dealer that is not affiliated with Credit Suisse should be advised that this report may not contain regulatory disclosures the non-affiliated Canadian investment dealer would be required to make if this were its own report.
For Credit Suisse Securities (Canada), Inc.'s policies and procedures regarding the dissemination of equity research, please visit http://www.csfb.com/legal_terms/canada_research_policy.shtml.
As of the date of this report, Credit Suisse acts as a market maker or liquidity provider in the equities securities that are the subject of this report.
Principal is not guaranteed in the case of equities because equity prices are variable.
Commission is the commission rate or the amount agreed with a customer when setting up an account or at any time after that.
For Credit Suisse disclosure information on other companies mentioned in this report, please visit the website at www.credit-suisse.com/researchdisclosures or call +1 (877) 291-2683.
19
References in this report to Credit Suisse include all of the subsidiaries and affiliates of Credit Suisse operating under its investment banking division. For more information on our structure, please use the following link: https://www.credit-suisse.com/who_we_are/en/.This report may contain material that is not directed to, or intended for distribution to or use by, any person or entity who is a citizen or resident of or located in any locality, state, country or other jurisdiction where such distribution, publication, availability or use would be contrary to law or regulation or which would subject Credit Suisse AG or its affiliates ("CS") to any registration or licensing requirement within such jurisdiction. All material presented in this report, unless specifically indicated otherwise, is under copyright to CS. None of the material, nor its content, nor any copy of it, may be altered in any way, transmitted to, copied or distributed to any other party, without the prior express written permission of CS. All trademarks, service marks and logos used in this report are trademarks or service marks or registered trademarks or service marks of CS or its affiliates. The information, tools and material presented in this report are provided to you for information purposes only and are not to be used or considered as an offer or the solicitation of an offer to sell or to buy or subscribe for securities or other financial instruments. CS may not have taken any steps to ensure that the securities referred to in this report are suitable for any particular investor. CS will not treat recipients of this report as its customers by virtue of their receiving this report. The investments and services contained or referred to in this report may not be suitable for you and it is recommended that you consult an independent investment advisor if you are in doubt about such investments or investment services. Nothing in this report constitutes investment, legal, accounting or tax advice, or a representation that any investment or strategy is suitable or appropriate to your individual circumstances, or otherwise constitutes a personal recommendation to you. CS does not advise on the tax consequences of investments and you are advised to contact an independent tax adviser. Please note in particular that the bases and levels of taxation may change. Information and opinions presented in this report have been obtained or derived from sources believed by CS to be reliable, but CS makes no representation as to their accuracy or completeness. CS accepts no liability for loss arising from the use of the material presented in this report, except that this exclusion of liability does not apply to the extent that such liability arises under specific statutes or regulations applicable to CS. This report is not to be relied upon in substitution for the exercise of independent judgment. CS may have issued, and may in the future issue, other communications that are inconsistent with, and reach different conclusions from, the information presented in this report. Those communications reflect the different assumptions, views and analytical methods of the analysts who prepared them and CS is under no obligation to ensure that such other communications are brought to the attention of any recipient of this report. CS may, to the extent permitted by law, participate or invest in financing transactions with the issuer(s) of the securities referred to in this report, perform services for or solicit business from such issuers, and/or have a position or holding, or other material interest, or effect transactions, in such securities or options thereon, or other investments related thereto. In addition, it may make markets in the securities mentioned in the material presented in this report. CS may have, within the last three years, served as manager or co-manager of a public offering of securities for, or currently may make a primary market in issues of, any or all of the entities mentioned in this report or may be providing, or have provided within the previous 12 months, significant advice or investment services in relation to the investment concerned or a related investment. Additional information is, subject to duties of confidentiality, available on request. Some investments referred to in this report will be offered solely by a single entity and in the case of some investments solely by CS, or an associate of CS or CS may be the only market maker in such investments. Past performance should not be taken as an indication or guarantee of future performance, and no representation or warranty, express or implied, is made regarding future performance. Information, opinions and estimates contained in this report reflect a judgment at its original date of publication by CS and are subject to change without notice. The price, value of and income from any of the securities or financial instruments mentioned in this report can fall as well as rise. The value of securities and financial instruments is subject to exchange rate fluctuation that may have a positive or adverse effect on the price or income of such securities or financial instruments. Investors in securities such as ADR's, the values of which are influenced by currency volatility, effectively assume this risk. Structured securities are complex instruments, typically involve a high degree of risk and are intended for sale only to sophisticated investors who are capable of understanding and assuming the risks involved. The market value of any structured security may be affected by changes in economic, financial and political factors (including, but not limited to, spot and forward interest and exchange rates), time to maturity, market conditions and volatility, and the credit quality of any issuer or reference issuer. Any investor interested in purchasing a structured product should conduct their own investigation and analysis of the product and consult with their own professional advisers as to the risks involved in making such a purchase. Some investments discussed in this report may have a high level of volatility. High volatility investments may experience sudden and large falls in their value causing losses when that investment is realised. Those losses may equal your original investment. Indeed, in the case of some investments the potential losses may exceed the amount of initial investment and, in such circumstances, you may be required to pay more money to support those losses. Income yields from investments may fluctuate and, in consequence, initial capital paid to make the investment may be used as part of that income yield. Some investments may not be readily realisable and it may be difficult to sell or realise those investments, similarly it may prove difficult for you to obtain reliable information about the value, or risks, to which such an investment is exposed. This report may provide the addresses of, or contain hyperlinks to, websites. Except to the extent to which the report refers to website material of CS, CS has not reviewed any such site and takes no responsibility for the content contained therein. Such address or hyperlink (including addresses or hyperlinks to CS's own website material) is provided solely for your convenience and information and the content of any such website does not in any way form part of this document. Accessing such website or following such link through this report or CS's website shall be at your own risk. This report is issued and distributed in Europe (except Switzerland) by Credit Suisse Securities (Europe) Limited, One Cabot Square, London E14 4QJ, England, which is regulated in the United Kingdom by The Financial Services Authority ("FSA"). This report is being distributed in Germany by Credit Suisse Securities (Europe) This report is being distributed in the United States and Canada by Credit Suisse Securities (USA) LLC; in Switzerland by Credit Suisse AG; in Brazil by Banco de Investimentos Credit Suisse (Brasil) S.A or its affiliates; in Mexico by Banco Credit Suisse (México), S.A. (transactions related to the securities mentioned in this report will only be effected in compliance with applicable regulation); in Japan by Credit Suisse Securities (Japan) Limited, Financial Instruments Firm, Director-General of Kanto Local Finance Bureau (Kinsho) No. 66, a member of Japan Securities Dealers Association, The Financial Futures Association of Japan, Japan Investment Advisers Association, Type II Financial Instruments Firms Association; elsewhere in Asia/ Pacific by whichever of the following is the appropriately authorised entity in the relevant jurisdiction: Credit Suisse (Hong Kong) Limited, Credit Suisse Equities (Australia) Limited, Credit Suisse Securities (Thailand) Limited, Credit Suisse Securities (Malaysia) Sdn Bhd, Credit Suisse AG, Singapore Branch, Credit Suisse Securities (India) Private Limited regulated by the Securities and Exchange Board of India (registration Nos. INB230970637; INF230970637; INB010970631; INF010970631), having registered address at 9th Floor, Ceejay House, Dr.A.B. Road, Worli, Mumbai - 18, India, T- +91-22 6777 3777, Credit Suisse Securities (Europe) Limited, Seoul Branch, Credit Suisse AG, Taipei Securities Branch, PT Credit Suisse Securities Indonesia, Credit Suisse Securities (Philippines ) Inc., and elsewhere in the world by the relevant authorised affiliate of the above. Research on Taiwanese securities produced by Credit Suisse AG, Taipei Securities Branch has been prepared by a registered Senior Business Person. Research provided to residents of Malaysia is authorised by the Head of Research for Credit Suisse Securities (Malaysia) Sdn Bhd, to whom they should direct any queries on +603 2723 2020. This research may not conform to Canadian disclosure requirements. In jurisdictions where CS is not already registered or licensed to trade in securities, transactions will only be effected in accordance with applicable securities legislation, which will vary from jurisdiction to jurisdiction and may require that the trade be made in accordance with applicable exemptions from registration or licensing requirements. Non-U.S. customers wishing to effect a transaction should contact a CS entity in their local jurisdiction unless governing law permits otherwise. U.S. customers wishing to effect a transaction should do so only by contacting a representative at Credit Suisse Securities (USA) LLC in the U.S. Please note that this research was originally prepared and issued by CS for distribution to their market professional and institutional investor customers. Recipients who are not market professional or institutional investor customers of CS should seek the advice of their independent financial advisor prior to taking any investment decision based on this report or for any necessary explanation of its contents. This research may relate to investments or services of a person outside of the UK or to other matters which are not regulated by the FSA or in respect of which the protections of the FSA for private customers and/or the UK compensation scheme may not be available, and further details as to where this may be the case are available upon request in respect of this report. CS may provide various services to US municipal entities or obligated persons ("municipalities"), including suggesting individual transactions or trades and entering into such transactions. Any services CS provides to municipalities are not viewed as "advice" within the meaning of Section 975 of the Dodd-Frank Wall Street Reform and Consumer Protection Act. CS is providing any such services and related information solely on an arm's length basis and not as an advisor or fiduciary to the municipality. In connection with the provision of the any such services, there is no agreement, direct or indirect, between any municipality (including the officials, management, employees or agents thereof) and CS for CS to provide advice to the municipality. Municipalities should consult with their financial, accounting and legal advisors regarding any such services provided by CS. In addition, CS is not acting for direct or indirect compensation to solicit the municipality on behalf of an unaffiliated broker, dealer, municipal securities dealer, municipal advisor, or investment adviser for the purpose of obtaining or retaining an engagement by the municipality for or in connection with Municipal Financial Products, the issuance of municipal securities, or of an investment adviser to provide investment advisory services to or on behalf of the municipality. If this report is being distributed by a financial institution other than Credit Suisse AG, or its affiliates, that financial institution is solely responsible for distribution. Clients of that institution should contact that institution to effect a transaction in the securities mentioned in this report or require further information. This report does not constitute investment advice by Credit Suisse to the clients of the distributing financial institution, and neither Credit Suisse AG, its affiliates, and their respective officers, directors and employees accept any liability whatsoever for any direct or consequential loss arising from their use of this report or its content. Principal is not guaranteed. Commission is the commission rate or the amount agreed with a customer when setting up an account or at any time after that.
Copyright © 2013 CREDIT SUISSE AG and/or its affiliates. All rights reserved.
Investment principal on bonds can be eroded depending on sale price or market price. In addition, there are bonds on which investment principal can be eroded due to changes in redemption amounts. Care is required when investing in such instruments.
When you purchase non-listed Japanese fixed income securities (Japanese government bonds, Japanese municipal bonds, Japanese government guaranteed bonds, Japanese corporate bonds) from CS as a seller, you will be requested to pay the purchase price only. 20