stimulating investment in the western balkans - ebrd.com · ellen goldstein world bank country...
TRANSCRIPT

Stimulating Investment in the Western Balkans
February 24, 2014
Ellen Goldstein World Bank Country Director for Southeast Europe

Key Messages
Location, human capital and labor costs make investing in the Western Balkans today a great opportunity!
Maximum investment, growth and jobs will require courageous Governments to do faster and deeper reforms;
Macro-fiscal adjustment, enhancing competitiveness and connectedness, and building “new economy” skills are key;
History shows that integration into the European economic bloc will drive a powerful convergence towards prosperity.
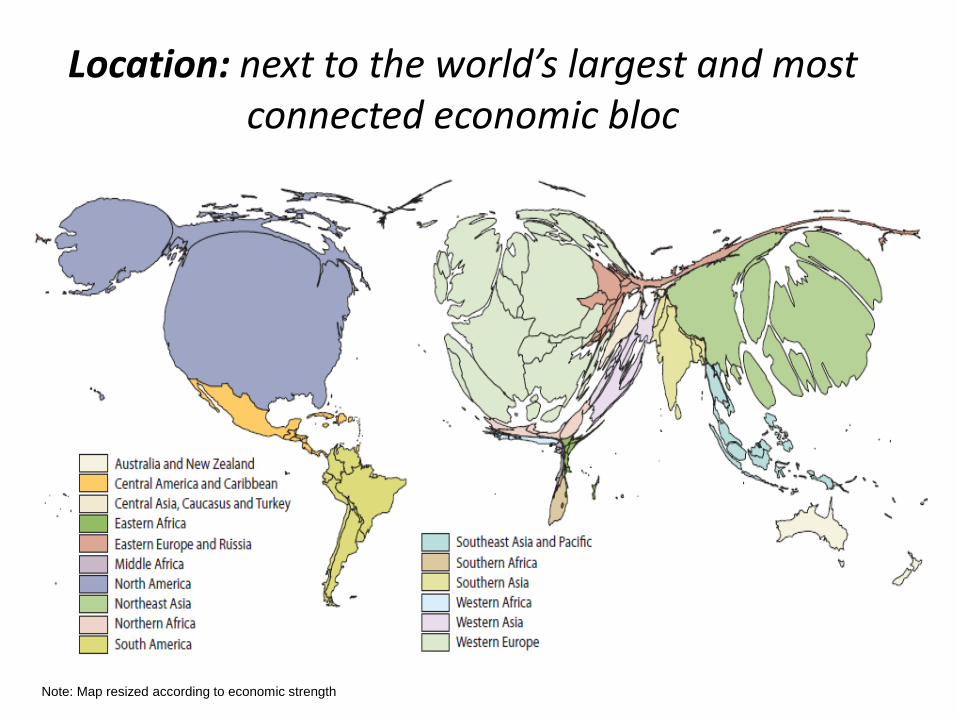
Location: next to the world’s largest and most connected economic bloc
Note: Map resized according to economic strength

Human capital: education outcomes exceed other fast-growing, middle-income regions
360
380
400
420
440
460
480
LAC Developing Asia Western Balkans ECA
PISA scores in math test, 2012
Source: PISA; Note: Developing Asia includes Indonesia, Malaysia, and Thailand Western Balkans includes: Albania, Montenegro, Serbia
Trend: Stagnating
Trend: Stagnating
Trend: Stagnating
Trend: Improving

Labor costs: significantly lower than the rest of Europe…but well beyond low-cost Asia
Source: ILO
Nominal average monthly wage in USD, 2010
0
200
400
600
800
1000
1200
India Indonesia Philippines Thailand Albania China Serbia Macedonia,FYR
Bosnia EU11average

0
5
10
15
20
25
30
SEE ECA LAC EAP OECD(Europe)
OECD(Non
Europe)
2007 2012
40
45
50
55
60
65
70
SEE ECA LAC EAP OECD(Europe)
OECD (NonEurope)
2007 2012
…Yet labor force participation lowest and unemployment highest of mid/high income regions
Labor Force Participation Rate (% pop)
Unemployment Rate (% of labor force)
Notes: ECA = Europe and Central Asia; LAC = Latin America and the Caribbean; EAP = East Asia and Pacific.
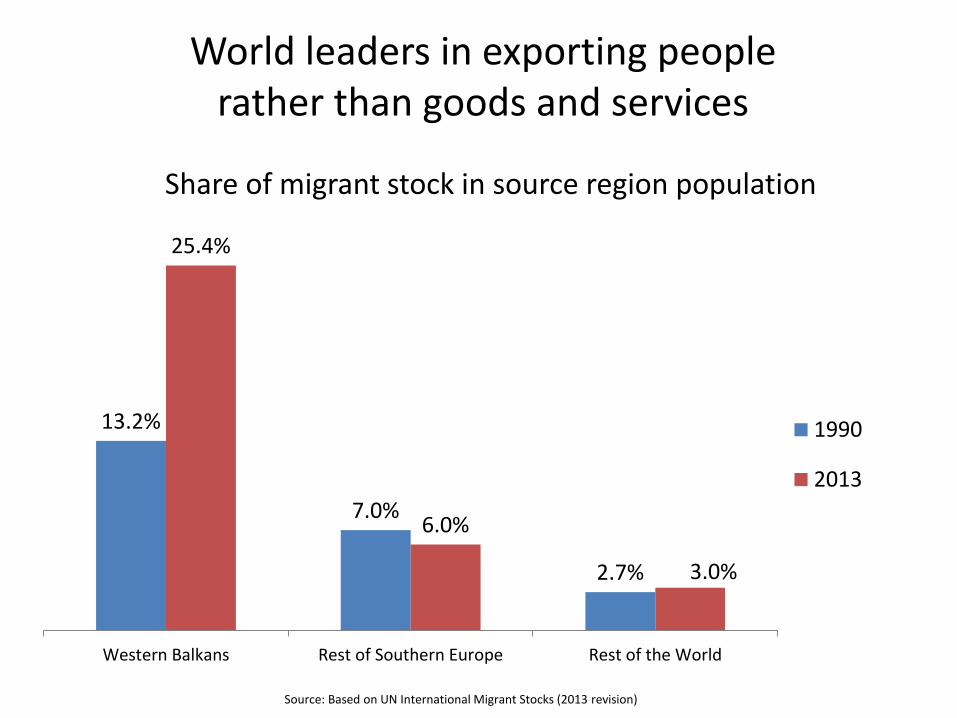
13.2%
7.0%
2.7%
25.4%
6.0%
3.0%
Western Balkans Rest of Southern Europe Rest of the World
1990
2013
Share of migrant stock in source region population
Source: Based on UN International Migrant Stocks (2013 revision)
World leaders in exporting people rather than goods and services

Doing More to Stimulate Investment and Jobs

Post-crisis recovery (2009-2013) much slower than East Asia after its crisis (1998-2002)
-8
-6
-4
-2
0
2
4
6
8
10
t-7 t-6 t-5 t-4 t-3 t-2 t-1 t=0 t+1 t+2 t+3 t+4 t+5 t+6 t+7
Western Balkans (t=2008) EU11 (t=2008) East Asia excl. China (t=1997)
distance from pre-crisis peak

East Asia aggressively pursued export-led growth; Western Balkans’ current accounts deteriorated
-20
-15
-10
-5
0
5
10
t-8 t-7 t-6 t-5 t-4 t-3 t-2 t-1 t=0 t=1 t=2 t=3 t=4 t=5 t=6 t=7
EU 11, t=2008 Western Balkans, t=2008 East Asia**, t=1997
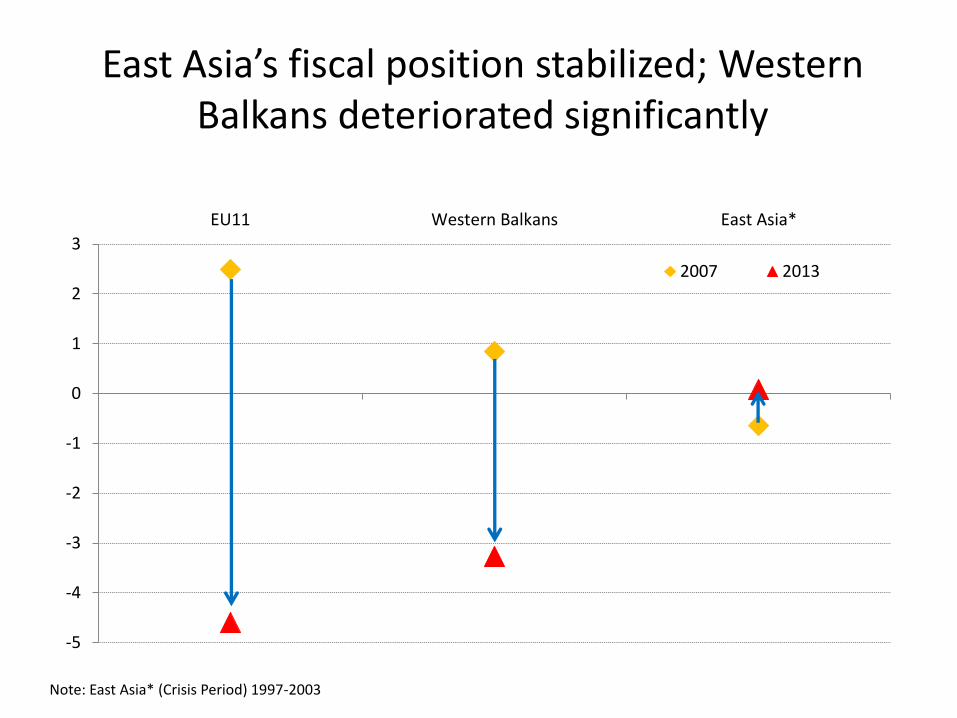
East Asia’s fiscal position stabilized; Western Balkans deteriorated significantly
Note: East Asia* (Crisis Period) 1997-2003
-5
-4
-3
-2
-1
0
1
2
3
EU11 Western Balkans East Asia*
2007 2013
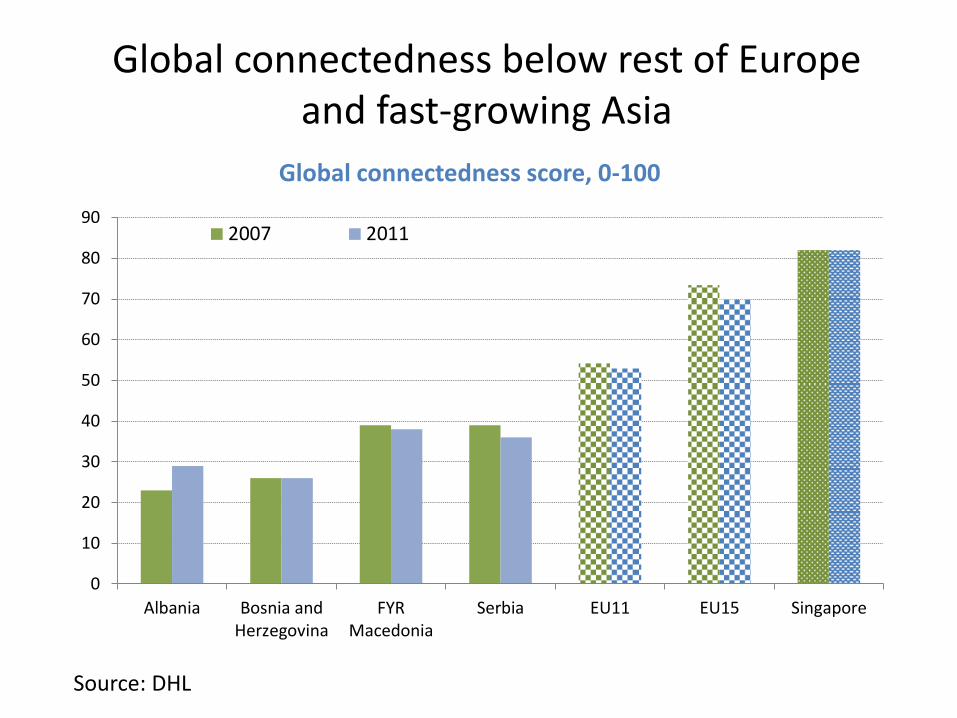
Global connectedness below rest of Europe and fast-growing Asia
0
10
20
30
40
50
60
70
80
90
Albania Bosnia andHerzegovina
FYRMacedonia
Serbia EU11 EU15 Singapore
2007 2011
Global connectedness score, 0-100
Source: DHL

Trade facilitation and logistics fall short of European and global standards …
0.0
0.5
1.0
1.5
2.0
2.5
3.0
3.5
4.0
4.5
Logistics PerformanceIndex Score
Customs and Clearance
Infrastructure for trade
International shipmentsLogistics competence
Tracking & tracing
Timeliness
EU 15 Average
Western Balkan Average
Singapore
Source: World Bank, Logistics Performance Index

Export performance reflects weak integration in global economy
Exports of goods and services (% of GDP)
0
50
100
150
200
250
Ko
sovo BiH
Alb
ania
Serb
ia
Mo
nte
neg
ro
Mac
edo
nia
, FYR
Pan
ama
Mal
aysi
a
Irel
and
Sin
gap
ore

Labor market demands youth with “new economy” skills; older cohort risks obsolescence
40
45
50
55
60
65
2007 2008 2009 2010 2011
Mea
n S
kill
Per
cen
tile
of
20
07
S
kills
Dis
trib
uti
on
FYR Macedonia, Cohort born after 1955
40
45
50
55
60
65
2007 2008 2009 2010 2011
FYR Macedonia, Cohort born after 1974
Source: World Bank staff, based on LFS.
New Economy skills
Manual skills
Routine Skills
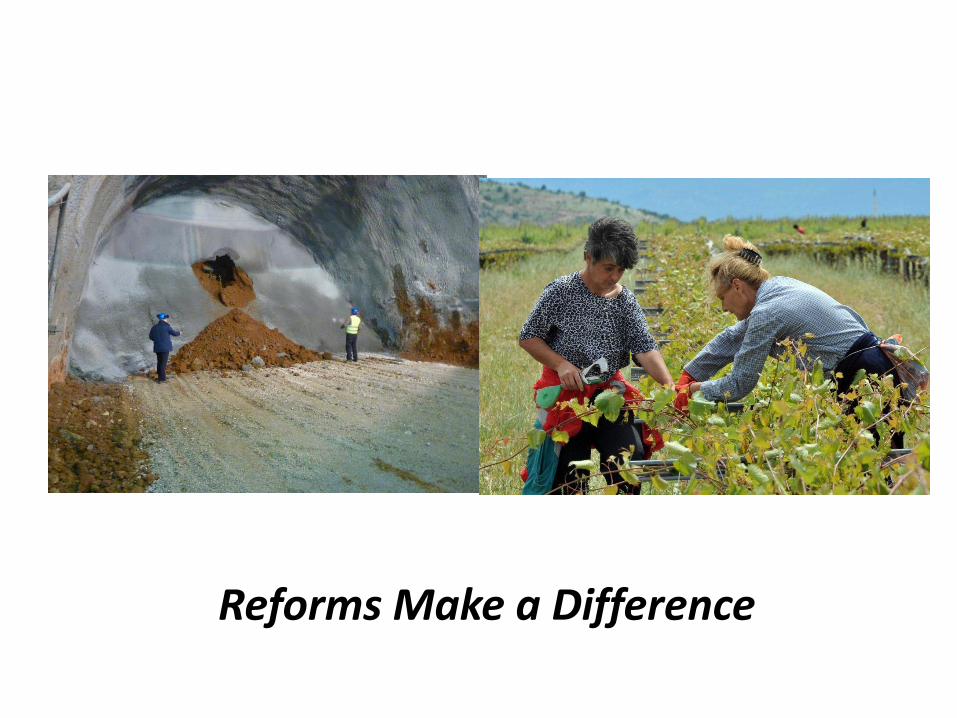
Reforms Make a Difference

% of years in each decade when both labor productivity and employment increased
0%
10%
20%
30%
40%
50%
60%
70%
80%
1990s 2000s 1990s 2000s 1990s 2000s
Poland FYR Macedonia Belarus
Advanced Reformers Intermediate Reformers Late Reformers
Advanced Reformers Poland 1990s Advanced Reformers Poland 2000s
Intermediate Reformers FYR Macedonia 1990s Intermediate Reformers FYR Macedonia 2000s
Late Reformers Belarus 1990s Late Reformers Belarus 2000s
Stronger reformers benefit from increased employment and labor productivity … but with a lag
Source: Back To Work: Growing with Jobs in Europe and Central Asia (2013).

Comparing two countries: business climate reforms and employment growth
Employment growth, 2008=100 (2008-2012)
Left chart: This measure shows the distance of each economy to the “frontier.” An economy’s distance to frontier is reflected on a scale from 0 to 100, where 0 represents the lowest performance and 100 represents the frontier. Right chart, Source: Authors’ calculations based on ILO and WDI.
90
92
94
96
98
100
102
104
106
108
110
2008 2009 2010 2011 2012
Bosnia and Herzegovina FYR Macedonia
40
45
50
55
60
65
70
75
80
2006 2007 2008 2009 2010 2011 2012 2013 2014
Bosnia and Herzegovina Macedonia, FYR
Doing Business: Distance to frontier (=100)

History on your side: Western Balkans will benefit from Europe’s “convergence machine”
Annual growth of consumption per capita between 1970 and 2009, by level of consumption in 1970
Note: n = number of countries. *** statistical significance at the 1 percent. Source: World Bank staff calculations, based on Penn World Table 7.0 (Heston, Summers, and Aten 2011).
Corr. = -0.80***n = 26
0
2
4
6
0 3 6 9 12 15
Europe
Corr. = -0.21n = 15
0 3 6 9 12 15
East Asia
Corr. = -0.25n = 22
0 3 6 9 12 15
Latin America
An
nu
al p
er
ca
pita
co
nsu
mp
tio
n g
row
th
pe
rce
nt,
19
70
-20
09
Initial level of consumption per capita, 1970PPP, thousands of 2005 international dollars

Key Messages
Location, human capital and labor costs make investing in the Western Balkans today a great opportunity!
Maximum investment, growth and jobs will require courageous Governments to do faster and deeper reforms;
Macro-fiscal adjustment, enhancing competitiveness and connectedness, and building “new economy” skills are key;
History shows that integration into the European economic bloc will drive a powerful convergence towards prosperity.


Capital markets reward countries with strong fiscal adjustment
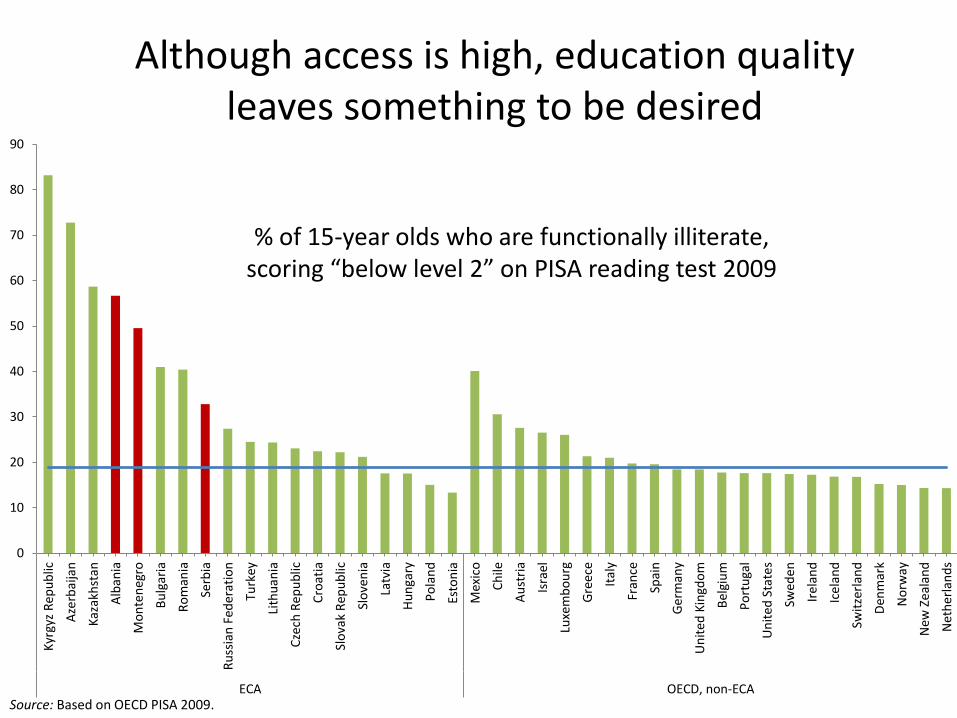
Although access is high, education quality leaves something to be desired
0
10
20
30
40
50
60
70
80
90
Kyr
gyz
Rep
ub
lic
Aze
rbai
jan
Kaz
akh
stan
Alb
ania
Mo
nte
neg
ro
Bu
lgar
ia
Ro
man
ia
Serb
ia
Ru
ssia
n F
eder
atio
n
Turk
ey
Lith
uan
ia
Cze
ch R
epu
blic
Cro
atia
Slo
vak
Rep
ub
lic
Slo
ven
ia
Latv
ia
Hu
nga
ry
Po
lan
d
Esto
nia
Mex
ico
Ch
ile
Au
stri
a
Isra
el
Luxe
mb
ou
rg
Gre
ece
Ital
y
Fran
ce
Spai
n
Ger
man
y
Un
ited
Kin
gdo
m
Bel
giu
m
Po
rtu
gal
Un
ited
Sta
tes
Swed
en
Irel
and
Icel
and
Swit
zerl
and
Den
mar
k
No
rway
New
Zea
lan
d
Net
her
lan
ds
ECA OECD, non-ECASource: Based on OECD PISA 2009.
% of 15-year olds who are functionally illiterate, scoring “below level 2” on PISA reading test 2009
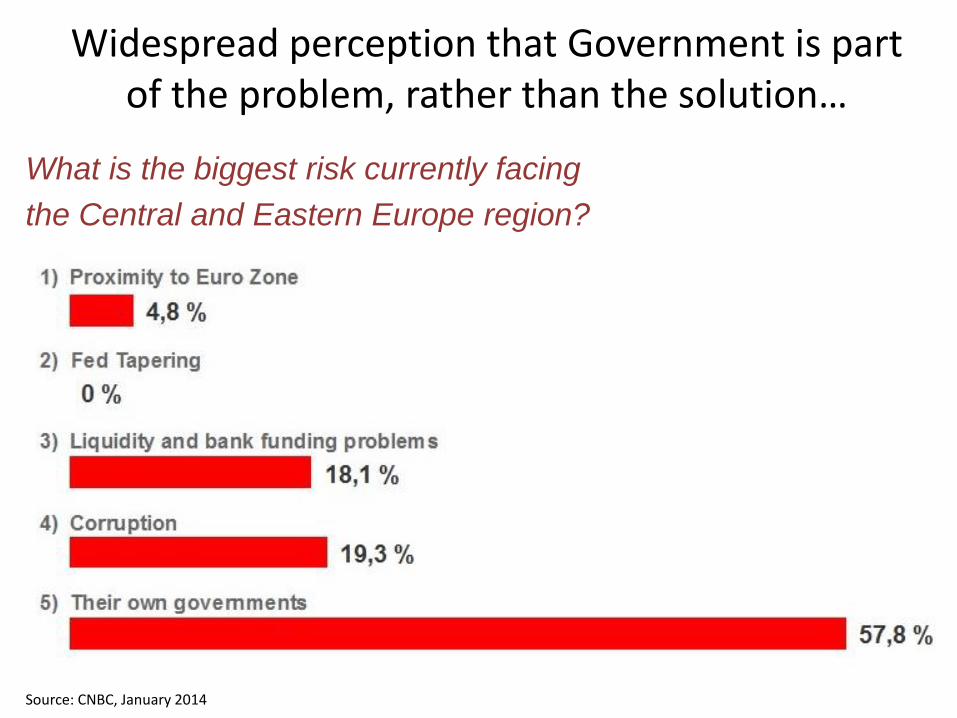
Widespread perception that Government is part of the problem, rather than the solution…
What is the biggest risk currently facing
the Central and Eastern Europe region?
Source: CNBC, January 2014