stirling abstract 2016-17 audited version · responsibilities of the chief finance officer for the...
TRANSCRIPT

Loch Dhu
STIRLING COUNCIL
ABSTRACT OF ACCOUNTS
2016-17

Page 2 of 75
Annual Accounts - Contents
Page Page
Independent Auditor’s Report 3 Note 14 Asset Revaluation Programme 45
Note 15 Capital Expenditure and Capital Financing 46
Management Commentary 5 Note 16 Heritage Assets 46
Note 17 Long Term Debtors 47
Explanatory & Assurance Statements Note 18 Short Term Debtors 47
Statement of Responsibilities 15 Note 19 Cash & Cash Equivalents 47
Annual Governance Statement 16 Note 20 Short Term Creditors 48
Remuneration Report 22 Note 21 PFI and PPP Contracts 48
Note 22 Pension Costs 49
Principal Financial Statements of the Single Entity Note 23 Unusable Reserves 52
Expenditure and Funding Analysis 28 Note 24 Leases 54
Comprehensive Income and Expenditure Statement 29 Note 25 Financial Instruments (FI) 55
Movement in Reserves Statement 30 Note 26 Nature and Extent of Risks Arising From
Financial Instruments 57
Balance Sheet 31 Note 27 Related Parties 58
Cash Flow Statement 32
Supplementary Financial Statements
Notes to the Single Entity Financial Statements Housing Revenue Account 59
General Accounting Policies & Assumptions Council Tax Income Account 61
Note 1 General Accounting Policies (where no
accompanying note) 33 Non Domestic Rates Income Account 62
Note 2 Accounting Standards Not Yet Adopted 34 Common Good Funds 63
Note 3 Critical Judgements Applied 34 Trust Funds 64
Note 4 Future Assumptions 35
Note 5 Events After The Reporting Period 36 Principal Financial Statements of the Group
Note 6 Prior Year Adjustments 36 Group Comprehensive Income & Expenditure
Statement 65
Group Movement in Reserves Statement 66
Expenditure and Funding Analysis Group Balance Sheet 67
Note 7 Note to the Expenditure and Funding Analysis 37 Group Cash Flow Statement 68
Comprehensive Income and Expenditure Statement
Note 8 Grants and Taxation Income 38 Notes to the Group Financial Statements
Note 9 External Audit Costs 38 1. Group Accounting Policies 69
2. Non-Consolidation Interests in Other Entities 71
Statement of Movements in Reserves 3. Financial Results of Associates, Joint Ventures and
Joint Operations 71
Note 10 Adjustments Between Accounting Basis and
Funding Basis Under Regulations 39 4. Financial Impact of Group Consolidation 72
Note 11 General Fund Reserves 41
Glossary of Terms
Balance Sheet Glossary of Terms 73
Note 12 Property, Plant & Equipment 41
Note 13 Impairments/Downward Revaluations 44

Page 3 of 75
Independent Auditor’s Report
Independent auditor’s report to the members of Stirling Council and the Accounts Commission
This report is made solely to the parties to whom it is addressed in accordance with Part VII of the Local Government (Scotland)
Act 1973 and for no other purpose. In accordance with paragraph 120 of the Code of Audit Practice approved by the Accounts
Commission, I do not undertake to have responsibilities to members or officers, in their individual capacities, or to third parties.
Report on the audit of the financial statements
Opinion on financial statements
I certify that I have audited the financial statements in the annual accounts of Stirling Council and its group for the year ended
31 March 2017 under Part VII of the Local Government (Scotland) Act 1973. The financial statements comprise the Expenditure
and Funding Analysis, the group and council-only Comprehensive Income and Expenditure Statements, Movement in Reserves
Statements, Balance Sheets, and Cash-Flow Statements, the council-only Housing Revenue Account, the Council Tax Income
Account, and the Non-Domestic Rates Income Account and notes to the financial statements, including a summary of significant
accounting policies. The financial reporting framework that has been applied in their preparation is applicable law and
International Financial Reporting Standards (IFRSs) as adopted by the European Union, and as interpreted and adapted by the
Code of Practice on Local Authority Accounting in the United Kingdom 2016/17 (the 2016/17 Code).
In my opinion the accompanying financial statements:
• give a true and fair view in accordance with applicable law and the 2016/17 Code of the state of affairs of the council and
its group as at 31 March 2017 and of the deficit on the provision of services of the council and its group for the year then
ended;
• have been properly prepared in accordance with IFRSs as adopted by the European Union, as interpreted and adapted by
the 2016/17 Code; and
• have been prepared in accordance with the requirements of the Local Government (Scotland) Act 1973, The Local
Authority Accounts (Scotland) Regulations 2014, and the Local Government in Scotland Act 2003.
Basis of opinion
I conducted my audit in accordance with applicable law and International Standards on Auditing in the UK and Ireland (ISAs
(UK&I)). My responsibilities under those standards are further described in the Auditor’s Responsibilities for the Audit of the
Financial Statements section of my report. I am independent of the council and its group in accordance with the ethical
requirements that are relevant to my audit of the financial statements in the UK including the Financial Reporting Council’s
Ethical Standards for Auditors, and I have fulfilled my other ethical responsibilities in accordance with these requirements. I
believe that the audit evidence I have obtained is sufficient and appropriate to provide a basis for my opinion.
Responsibilities of the Chief Finance Officer for the financial statements
As explained more fully in the Statement of Responsibilities, the Chief Finance Officer is responsible for the preparation of
financial statements that give a true and fair view in accordance with the financial reporting framework, and for such internal
control as the Chief Finance Officer determines is necessary to enable the preparation of financial statements that are free from
material misstatement, whether due to fraud or error.
Auditor’s responsibilities for the audit of the financial statements
My responsibility is to audit and express an opinion on the financial statements in accordance with applicable legal
requirements and ISAs (UK&I) as required by the Code of Audit Practice approved by the Accounts Commission. Those standards
require me to comply with the Financial Reporting Council’s Ethical Standards for Auditors. An audit involves obtaining evidence
about the amounts and disclosures in the financial statements sufficient to give reasonable assurance that the financial
statements are free from material misstatement, whether caused by fraud or error. This includes an assessment of: whether the
accounting policies are appropriate to the circumstances of the council and its group and have been consistently applied and
adequately disclosed; the reasonableness of significant accounting estimates made by the Chief Finance Officer and the overall
presentation of the financial statements.
My objectives are to achieve reasonable assurance about whether the financial statements as a whole are free from material
misstatement, whether due to fraud or error, and to issue an auditor’s report that includes my opinion. Reasonable assurance is
a high level of assurance, but is not a guarantee that an audit conducted in accordance with ISAs (UK&I) will always detect a
material misstatement when it exists. Misstatements can arise from fraud or error and are considered material if, individually or
in the aggregate, they could reasonably be expected to influence the economic decisions of users taken on the basis of these
financial statements.
Other information in the annual accounts
The Chief Finance Officer is responsible for the other information in the annual accounts. The other information comprises the
information other than the financial statements and my auditor’s report thereon. My opinion on the financial statements does
not cover the other information and I do not express any form of assurance conclusion thereon except on matters prescribed by
the Accounts Commission to the extent explicitly stated later in this report.

Page 4 of 75
In connection with my audit of the financial statements in accordance with ISAs (UK&I), my responsibility is to read all the
financial and non-financial information in the annual accounts to identify material inconsistencies with the audited financial
statements and to identify any information that is apparently materially incorrect based on, or materially inconsistent with, the
knowledge acquired by me in the course of performing the audit. If I become aware of any apparent material misstatements or
inconsistencies I consider the implications for my report.
Report on other requirements
Opinions on other prescribed matters
I am required by the Accounts Commission to express an opinion on the following matters.
In my opinion, the auditable part of the Remuneration Report has been properly prepared in accordance with The Local
Authority Accounts (Scotland) Regulations 2014.
In my opinion, based on the work undertaken in the course of the audit
• the information given in the Management Commentary for the financial year for which the financial statements are
prepared is consistent with the financial statements and that report has been prepared in accordance with statutory
guidance issued under the Local Government in Scotland Act 2003; and
• the information given in the Annual Governance Statement for the financial year for which the financial statements are
prepared is consistent with the financial statements and that report has been prepared in accordance with the Delivering
Good Governance in Local Government: Framework (2016).
Matters on which I am required to report by exception
I am required by the Accounts Commission to report to you if, in my opinion:
• adequate accounting records have not been kept; or
• the financial statements and the auditable part of the Remuneration Report are not in agreement with the accounting
records; or
• I have not received all the information and explanations I require for my audit; or
• there has been a failure to achieve a prescribed financial objective.
I have nothing to report in respect of these matters.
David McConnell MA CPFA
Assistant Director
Audit Scotland
4th Floor, South Suite
8 Nelson Mandela Place
Glasgow
G2 1BT

Page 5 of 75
Management Commentary
1. Introduction
The purpose of the Management Commentary is to inform users of the Annual Accounts and help them assess how Stirling
Council has performed during 2016-17 and understand the year-end financial position as at 31 March 2017. It also provides a
narrative on the financial outlook and the complexities Stirling Council will have to deal with in the financial years 2017-18 and
beyond.
Stirling Council’s financial results are presented in five primary statements (pages 27 to 31): Expenditure and Funding Analysis;
Comprehensive Income and Expenditure Statement; Movement in Reserves Statement; Balance Sheet; Cash Flow Statement.
The accompanying notes to the financial statements set out the accounting policies adopted by Stirling Council to ensure that
the financial statements give a true and fair view of the Council’s financial position and transactions. The format and content of
local authorities’ Annual Accounts are governed by the The Code of Practice on Local Authority Accounting in the United
Kingdom (“the Code”).
2. About Stirling Council
Stirling Council is one of 32 Councils in Scotland established in 1996 as part of Local Government reorganisation. The Council
covers an area of around 850 square miles, and immediately prior to the recent Local Government Elections (May 2017), had 22
elected Members serving a population of approximately 92,000. The Stirling Council Administration prior to May 2017 was a
coalition of Labour and Conservative members as follows:
From May 2017, Stirling Council now has 23 elected members, with the Stirling Council Administration being a coalition of
Scottish National Party and Labour members.
A number of factors are impacting on Stirling Council and how it operates as an organisation. An increasing expectation amongst
citizens to have a say in how services are being delivered, a decrease in resources, localities becoming stronger and continued
financial challenges are all a catalyst for change.
As we have built up our relationships with communities, our understanding of their requirements has become better. The
integrated work we currently do in a range of areas, the new locality based approach, our organisational transformation and our
work on a City Region Deal, will mean significant changes in the way we deliver our services over the next five years.
These challenges which face Stirling Council over the next five years will be the focus of work in our two Service directorates -
‘Localities and Infrastructure’ and ‘Children, Communities and Enterprise’.
The remit for Localities and Infrastructure includes Waste, Integrated Facilities Management, Roads and Land, Business
Improvement and Compliance, Infrastructure, Planning and Building Standards Regulation, Sustainability, Finance, Governance
Page 6 of 75
and Technology, with corporate responsibility for Health and Safety, Fleet, Performance Management and Risk and Resilience.
The nature of these services means there will be a close relationship between their delivery and the locality approach and a
crossover with many aspects of Children, Communities and Enterprise.
The remit for Children, Communities and Enterprise covers the spectrum from birth to older people, with an integrated
approach to the services that we provide to citizens, working in partnership with our communities, stakeholders, national
bodies, Community Planning Partners and the third sector. It includes Economic Development and Regeneration, Communities
and People (adult social care, housing, public transport, safer communities, enforcement and community planning), Schools,
Learning and Education, Children and Families, Human Resources, Organisational Development, Programme Management,
Customer Services and Complaints, Communications and Priority Based Budgeting (PBB).
Integration of Adult Health & Social Care Services
On 1 April 2016, Stirling Council, Clackmannanshire Council and NHS Forth Valley commenced a Health and Social Care
Partnership across the Stirling and Clackmannanshire Council areas to integrate the planning for and delivery of adult health and
social care services. The partnership has also been extended to third and independent sector colleagues.
The Integration Joint Board has representatives from Stirling and Clackmannanshire Councils, NHS Forth Valley Health Board, the
Third Sector, representatives of those who use health and social care services and unpaid carers. The Board, through the Chief
Officer, has responsibility for the planning, resourcing and operational oversight of integrated services within the Strategic Plan.
Further information on the Clackmannanshire and Stirling Health and Social Care Partnership can be found at the following
webpage: http://nhsforthvalley.com//about-us/health-and-social-care-integration/clackmannanshire-and-stirling/.
3. Council Performance 2016-17
Key Council Achievements 2016-17
• Completed new build construction of St Ninians and St Margaret’s Primary Schools;
• Continued with a replacement programme of energy efficient street lighting with funding secured for this from the UK
Green Investment Bank PLC;
• Built or purchased 66 new units of social housing;
• Supported development of Health & Social Care Integration; and
• Continued to progress proposals for the Stirling City Development Framework.
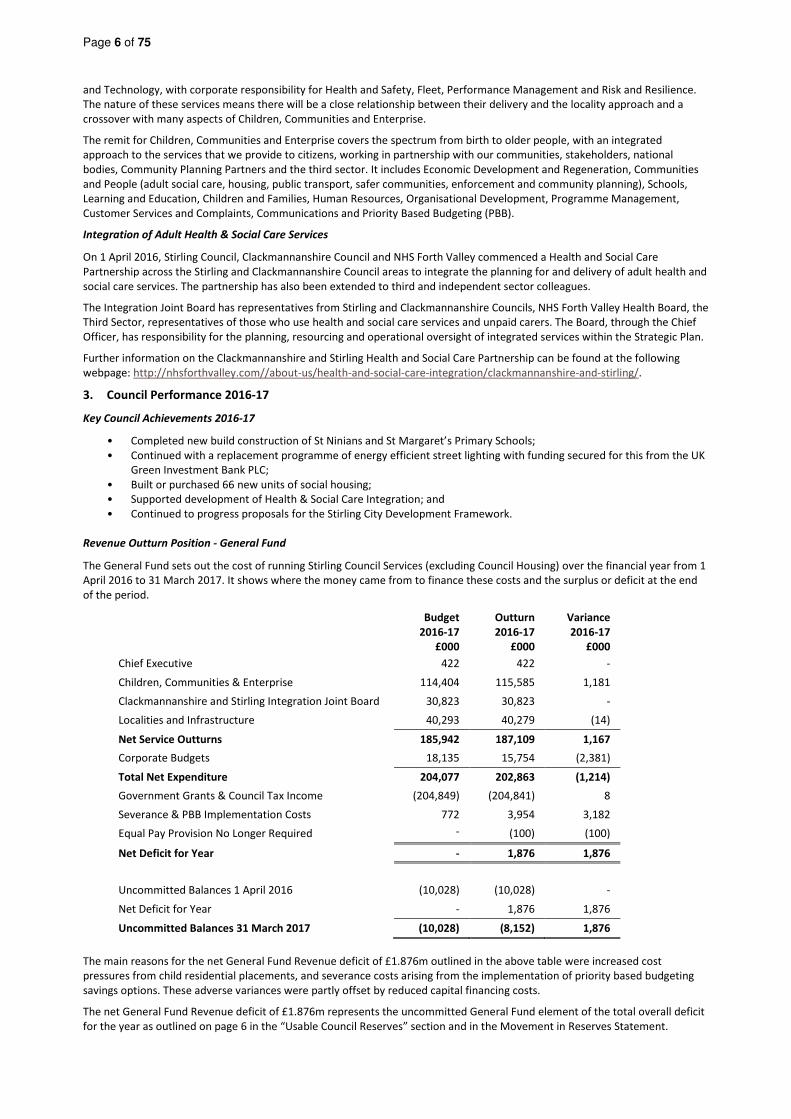
Revenue Outturn Position - General Fund
The General Fund sets out the cost of running Stirling Council Services (excluding Council Housing) over the financial year from 1
April 2016 to 31 March 2017. It shows where the money came from to finance these costs and the surplus or deficit at the end
of the period.
Budget
2016-17
£000
Outturn
2016-17
£000
Variance
2016-17
£000
Chief Executive 422 422 -
Children, Communities & Enterprise 114,404 115,585 1,181
Clackmannanshire and Stirling Integration Joint Board 30,823 30,823 -
Localities and Infrastructure 40,293 40,279 (14)
Net Service Outturns 185,942 187,109 1,167
Corporate Budgets 18,135 15,754 (2,381)
Total Net Expenditure 204,077 202,863 (1,214)
Government Grants & Council Tax Income (204,849) (204,841) 8
Severance & PBB Implementation Costs 772 3,954 3,182
Equal Pay Provision No Longer Required -
(100) (100)
Net Deficit for Year - 1,876 1,876
Uncommitted Balances 1 April 2016 (10,028) (10,028) -
Net Deficit for Year - 1,876 1,876
Uncommitted Balances 31 March 2017 (10,028) (8,152) 1,876
The main reasons for the net General Fund Revenue deficit of £1.876m outlined in the above table were increased cost
pressures from child residential placements, and severance costs arising from the implementation of priority based budgeting
savings options. These adverse variances were partly offset by reduced capital financing costs.
The net General Fund Revenue deficit of £1.876m represents the uncommitted General Fund element of the total overall deficit
for the year as outlined on page 6 in the “Usable Council Reserves” section and in the Movement in Reserves Statement.
Page 7 of 75
There was a surplus of £1.124m in the earmarked element of the General Fund income and expenditure. Overall, this resulted in
a deficit of £0.752m in the General Fund for 2016/17 which contributed to the decrease in usable reserves of £3.426m in
2016/17.
Council Housing (Housing Revenue Account)
Stirling Council owns 5,587 houses for which it charges rent. All expenditure associated with these houses must be funded from
the rental income generated. Any surplus or deficit at the end of the year is transferred into or out of the Housing Revenue
Account (HRA) balances. For 2016-17, the transfer of a net surplus of £0.250m resulted in HRA balances of £0.736m.
Capital Outturn Position
Capital expenditure represents money spent by the Council for buying, upgrading or improving assets such as buildings and
roads. The difference between capital and revenue expenditure is that the Council receives the benefit from capital expenditure
over a period exceeding one year. Stirling Council spent £40.688m during the year to finance various capital expenditure
programmes.
The General Fund Capital Programme reported expenditure of £28.127m against a full year budget of £32.106m representing
slippage of £3.979m. The most significant capital projects undertaken during the year included Sports Village – National Curling
Academy, Roads Improvements, Energy Efficient Street Lighting and St Margaret’s and St Ninians Primary School new builds.
The Housing Capital Programme reported expenditure of £12.561m, an overspend of £2.890m against a budget of £9.671m.
This overspend was due to the completion of previously slipped ‘New Build’ Programmes and additional spending on property
acquisitions which was offset by additional grant income and house sales of £2.057m. This resulted in borrowing of £0.955m in
the year against a budget of £0.122m.
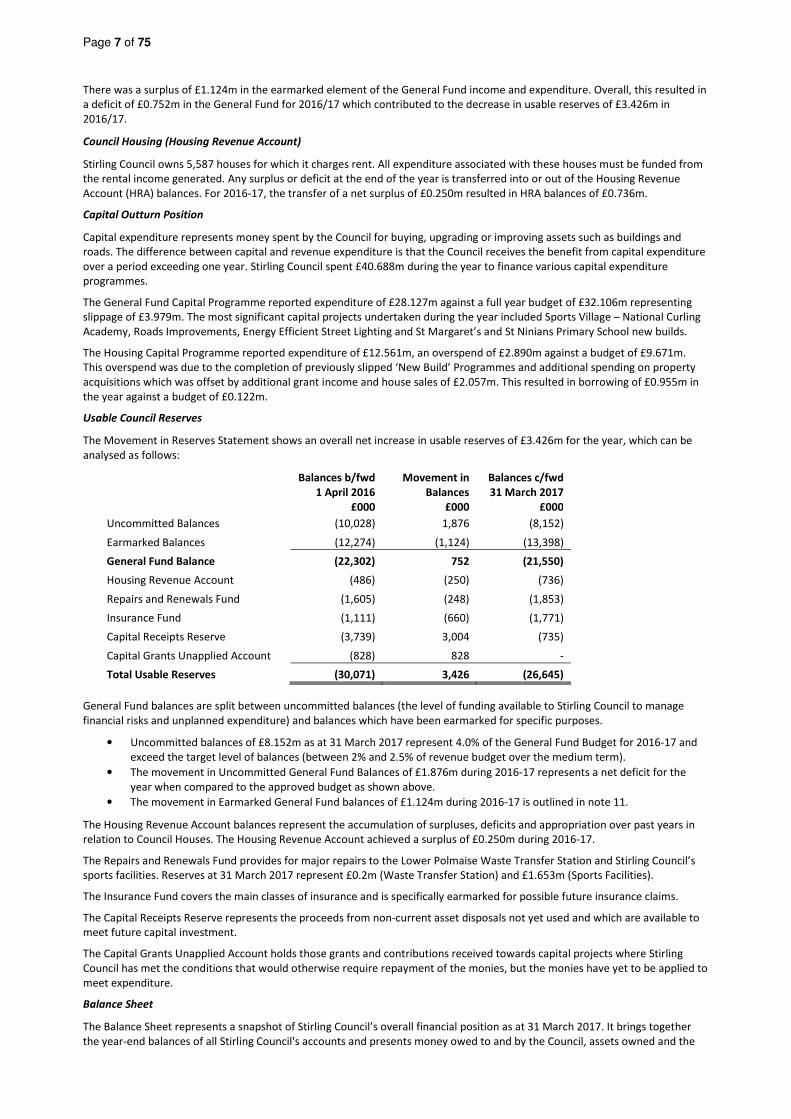
Usable Council Reserves
The Movement in Reserves Statement shows an overall net increase in usable reserves of £3.426m for the year, which can be
analysed as follows:
Balances b/fwd
1 April 2016
£000
Movement in
Balances
£000
Balances c/fwd
31 March 2017
£000
Uncommitted Balances (10,028) 1,876 (8,152)
Earmarked Balances (12,274) (1,124) (13,398)
General Fund Balance (22,302) 752 (21,550)
Housing Revenue Account (486) (250) (736)
Repairs and Renewals Fund (1,605) (248) (1,853)
Insurance Fund (1,111) (660) (1,771)
Capital Receipts Reserve (3,739) 3,004 (735)
Capital Grants Unapplied Account (828) 828 -
Total Usable Reserves (30,071) 3,426 (26,645)
General Fund balances are split between uncommitted balances (the level of funding available to Stirling Council to manage
financial risks and unplanned expenditure) and balances which have been earmarked for specific purposes.
• Uncommitted balances of £8.152m as at 31 March 2017 represent 4.0% of the General Fund Budget for 2016-17 and
exceed the target level of balances (between 2% and 2.5% of revenue budget over the medium term).
• The movement in Uncommitted General Fund Balances of £1.876m during 2016-17 represents a net deficit for the
year when compared to the approved budget as shown above.
• The movement in Earmarked General Fund balances of £1.124m during 2016-17 is outlined in note 11.
The Housing Revenue Account balances represent the accumulation of surpluses, deficits and appropriation over past years in
relation to Council Houses. The Housing Revenue Account achieved a surplus of £0.250m during 2016-17.
The Repairs and Renewals Fund provides for major repairs to the Lower Polmaise Waste Transfer Station and Stirling Council’s
sports facilities. Reserves at 31 March 2017 represent £0.2m (Waste Transfer Station) and £1.653m (Sports Facilities).
The Insurance Fund covers the main classes of insurance and is specifically earmarked for possible future insurance claims.
The Capital Receipts Reserve represents the proceeds from non-current asset disposals not yet used and which are available to
meet future capital investment.
The Capital Grants Unapplied Account holds those grants and contributions received towards capital projects where Stirling
Council has met the conditions that would otherwise require repayment of the monies, but the monies have yet to be applied to
meet expenditure.
Balance Sheet
The Balance Sheet represents a snapshot of Stirling Council’s overall financial position as at 31 March 2017. It brings together
the year-end balances of all Stirling Council's accounts and presents money owed to and by the Council, assets owned and the

Page 8 of 75
balances and reserves at the Council's disposal. The overall net assets of Stirling Council reduced by £88.1m from £263.6m to
£175.5m in 2016-17.
The significant changes in the Balance Sheet were a £13.9m increase in the value of Property, Plant & Equipment (PPE) assets, a
£5.1m decrease in cash and cash equivalents and an increase in the local government pension scheme liability of £99.6m.
Pension Liability
Under International Accounting Standard 19 (IAS19), Stirling Council is required to disclose information regarding the pension
fund assets and liabilities of the Local Government Pension Scheme. Hymans Robertson, an independent firm of actuaries, has
calculated a net liability position on the Scheme as at 31 March 2017, with Stirling Council’s share being £315.821m. This
represents an increase of £99.592m when compared with the net liability position of £216.229m as at 31 March 2016.
The increase in the net liability position is principally due to an decrease in the net discount rate for the year to 31 March 2017,
which is used to place a value on the pension fund liabilities. The negative impact of the decreased discount rate on pension
fund liabilities however, has been partially offset by an increase in pension fund assets.
Employer’s contributions to the pension fund during 2016-17 were charged at 21% of total pensionable employee pay in line
with actuarial advice. The actuary has recommended an annual increase of 0.5% for 2017/18 following the most recent formal
fund valuation at 31 March 2014.
Borrowing
During 2016-17, the level of short-term temporary borrowing undertaken by Stirling Council reduced by £4.9m from the
previous year. New long-term borrowing of £12.0m (average rate 1.97%) was undertaken from the Public Works Loan Board
(PWLB) to replenish maturing loans and support the Council’s capital financing requirement. New loans of £3.119m were also
drawn from the UK Green Investment Bank Ltd arrangement to support energy efficient street lighting projects.
Overall, Stirling Council maintained its under-borrowed position and, consistent with the approved strategy for the year,
achieved this by giving priority to internal borrowing and short-term temporary borrowing. The strategy of effectively delaying
new long-term borrowing by prioritising internal and temporary borrowing has served well at a time when comparatively
cheaper temporary borrowing is readily available, counterparties meeting the investment criteria are limited and historically low
investment returns generate potentially significant carrying costs for any new long-term borrowing undertaken.
The Local Authority (Capital Finance & Accounting) (Scotland) Regulations 2016 came into force on 1 April 2016 to replace the
statutory provisions for local authority borrowing, lending and loans fund as set out in Schedule 3 of the Local Authority
(Scotland) Act 1965 and Finance Circular 29/1975. The change in legislative basis from the prescriptive approach of the 1975 Act
to a general power to borrow and a requirement maintain a statutory loans fund in accordance with proper accounting practices
and prudent financial management represents a change in accounting policy. The Council’s Treasury Management Financial
Strategy 2017/18 set out the Council’s intention to continue to use the Statutory Method during the transition period.
Property, Plant & Equipment Assets
During 2016-17, the overall valuation of Property, Plant & Equipment assets owned by Stirling Council increased by £13.9m.
Expenditure of £39.7m on new assets was partially offset by an annual depreciation charge of £27.8m.
The Council had anticipated the introduction of the Highways Network Asset Code on 1 April 2016, the provisions of which
required the Highways Network Asset to be measured at current value i.e. depreciated replacement cost instead of historic cost.
However, at it’s meeting on 8th March 2017, the CIPFA/LASAAC Board decided not to proceed with the introduction of this code
into the financial reporting requirements for local authorities. The Board decided that in the absence of central support for key
elements of the valuation, the costs of implementation outweighted the benefits and determined that further consideration to
this issue would be subject to clear evidence that benefits outweighted costs for local authorities.
Group Accounts
Stirling Council has a controlling interest in a number of companies and joint ventures, which were set up to promote
partnerships between the public and private sectors. After consolidation, the Group Balance Sheet shows a reduction in reserves
and net assets (excluding minority interests) of £5.949m or 3.39% from those reported in Stirling Council’s Balance Sheet (2015-
16, £5.179m, 1.96%). Details of the consolidated Group Accounts of Stirling Council can be found on pages 64 to 71.
Financial Indicators
The Chartered Institute of Public Finance and Accountancy (CIPFA) Directors of Finance Section recommends the inclusion of
certain “financial ratios” in the Management Commentary to assist the reader to assess the performance of Stirling Council over
the financial year and the affordability of its ongoing commitments. The following table provides the indicators with an
explanation of each, grouped into CIPFA categories for the various areas of financial activity.
Financial Indicator Commentary Restated 2015-16 2016-17
Uncommitted general fund
reserve as a % of annual net
budget
Reflects the amount of funding available to
manage unplanned events.
4.9% 4.0%
In year council tax collection Reflects Stirling Council’s effectiveness in
collecting council tax debt.
97.69% 97.75%

Page 9 of 75
Financial Indicator Commentary Restated 2015-16 2016-17
Council Tax funding to overall
level of funding
Reflects to overall percentage of Stirling Council
funding from local taxation.
19.8% 20.0%
Actual outturn compared to
budgeted expenditure
How closely expenditure compares to the
budget is a reflection of the effectiveness of
financial management.
98.96% 100.9%
Capital financing requirement Reflects Stirling Council’s underlying need to
borrow.
£256.948m £256.955m
External debt levels The actual external debt and long term liabilities
of Stirling Council. This should never exceed
Stirling Council’s authorised limit.
£215.976m £217.385m
Ratio of finance costs to net
revenue stream
This is a measure of how affordable Stirling
Council’s capital plans are. It takes actual finance
costs as a % of net revenue spend.
GF
10%
GF
10%
HRA
18%
HRA
17%
Impact of capital investment
on council tax and housing
rents
This measures the impact of capital investment
decisions on Stirling Council’s bottom line. The
figures shown are council tax per band D
household and housing rents per week/per
house.
Council Tax
£11.59
Council Tax
£9.97
Housing Rent
£11.86
Housing Rent
£11.67
4. Looking Forward - Five Year Business Plan
Executive Summary
Stirling Council’s vision is to be bold, ambitious and community led, delivering quality services with customer focus, tailored to
the different needs of our communities.
Overall, the Council will invest in the region of £200m per annum across services throughout urban and rural Stirling.
The rolling Five Year Business Plan identifies the different factors that impact on the development and delivery of services. It
outlines the activities and initiatives the Council plans to undertake to achieve our strategic vision for the Stirling area.
The Council has put in place a number of strategies and plans designed to support sustainable growth and diversification of
Stirling’s economy and deliver high-impact projects. Key to this will be building on the City Region Deal which will position
Stirling as a vibrant economic centre benefiting the whole of the region.
The Council continues to be committed to improving the way it engages with employees, residents and other key stakeholders
from the public, private and voluntary sectors and to developing and modernising the way we deliver services to better meet
the needs of our communities. To achieve this, we will develop with communities a different approach to delivering services
which are closer to the needs of localities, with 2017 seeing us embark on the next phase of our work to support communities to
test out new ways of moulding the delivery of their services per the priorities of those living and working within the area.
The Five-Year Business Plan will be reviewed every year and updated in line with changes in the Council’s priorities and any
relevant external factors. It is supported by our priority-based approach to budgeting and a five year strategic workforce plan.
Strategic Priorities
Stirling Council is committed to ensuring the best possible outcomes for everyone who lives, works and visits the Stirling area. By
October 2017, Stirling Council and our community planning partners need to have a Local Outcome Improvement Plan (LOIP) in
place which will set out a clear and ambitious vision for the Stirling area, identifying how we will work to support communities
who are experiencing the poorest outcomes through locality plans.
The LOIP will build on our Single Outcome Agreement (SOA) 2013-23, which developed seven outcomes based on evidence and
priorities gathered from consultation with communities and partners:
• Improved outcomes in children’s early years;
• Improved support for disadvantaged and vulnerable families and individuals;
• Communities are well served, better connected and safe;
• Reduced risk factors that lead to health and other inequalities;
• Improved opportunities for learning, training and work;
• A diverse economy that delivers quality local jobs; and
• Improved supply of social and affordable housing.

Page 10 of 75
Key Priorities
To deliver the seven strategic outcomes, the Council has set out the following key priorities:
• Partnership - building a Community Planning Partnership that is democratically led with an engaged community and
works towards positive outcomes for Stirling;
• Welfare Reform - developing advice services that are fit to support people through the current round of welfare
changes by establishing an integrated service with voluntary sector leadership;
• Families - increasing the focus on early intervention to help families in need;
• Service Delivery - Examining and delivering more opportunities for improved models of service delivery;
• Regeneration - regenerating our most in-need communities to deliver a full range of positive social, environmental
and economic outcomes;
• Environment - adopting a pragmatic approach to sustainability that protects and enhances the local environment;
• Education - improving the outcomes for the lowest performing 20 per cent of children in nurseries and schools and
providing additional nursery and out of school care places throughout the Stirling area to support working families;
• Roads - making resurfacing roads, paths and pavements the service priority across the whole Stirling area;
• Housing - building more socially rented housing;
• Corporate Parenting - being a good corporate parent;
• Digital Connectivity - delivering and improving upon access to and speed of, internet access across the Stirling area;
• Older People - improving care for our vulnerable people at home;
• Economy - streamlining business support under the leadership of the business community;
• Sport - promoting opportunities and supporting access to physical activity and sport for all;
• Business - pursuing a diverse high wage economy that delivers local jobs for people across Stirling and a procurement
policy that supports this;
• Enforcement - ensuring enforcement action is taken across all areas of Council activity and making full use of Council
policy to combat anti-social behaviour;
• Finance - our financial strategy will reflect the current economic challenges by making savings while ensuring the
delivery of quality services.
The Next Five Years
Stirling has a bold ambition and a once-in-a-generation opportunity to reposition itself as an economic and cultural powerhouse.
We are ready to do this, with the backing of our local communities, elected representatives, City Commissioners and Community
Planning Partners. Our unique, collaborative and evidence-based approach has identified the programmes to support us to do
this, including our approach to organisational transformation, our City Region Deal and our localities programmes.
Stirling Council will face significant changes and challenges over the next five years that will impact on the way we operate.
These changes are being driven by policy and financial, legislative and demographic factors.
The Council will continue to respond to an increasingly challenging economic environment by seeking innovative and effective
ways of delivering high-value services in partnership with our residents and communities.
There are also opportunities, particularly around sustainability, reducing carbon and the use of smart technology - in the next
five years we can expect to see better use of renewables for heat and energy and greater use of technology to make our services
more efficient and help inform our future decision making.
Genuine partnership lies at the heart of our people and place plans in the City Region Deal programme. This sets out a robust
and compelling case for transformative and sustainable economic growth that benefits everyone across the area and closes the
gap between the most advantaged and disadvantaged in our communities. Spanning skills and employability, social innovation,
marketing, inward investment and infrastructure projects, the programme aims to create local jobs and a stronger economy
across urban and rural areas, while promoting health and attainment and driving growth in key areas of the economy.
Capital investment by the Council is important in facilitating further investment in the area, thereby contributing to economic
growth. The Council intends to broaden its outlook on alternative means of financing and funding investment and leverage
additional investment where appropriate.
Stirling Council will be refining our ten-year Capital Programming to align it with the City Region Deal negotiations and to ensure
that asset management, infrastructure planning and the Council’s key priorities tie together within a sustainable and affordable
capital programme.
It is important that the Council is clear about how services will be structured and managed. Alternative models of service
delivery may emerge which complement and enhance what we currently do. Any developments will be considered in the
context of current service provision and delivery, the requirements of the people who use the services and the changing
expectations of the wider public.
The Council also recognises the different roles that our urban and rural communities play, acknowledging that there isn’t a “one
size fits all” approach. In line with the Community Empowerment (Scotland) Act 2015, the development of a localities based
approach to service delivery will allow the Council and partners to deliver alternative ways of working which complement the
needs and priorities of different communities.
Page 11 of 75
The Council needs a more tailored approach to deliver this opportunity, acknowledging that the scope for refining services may
be more limited for some than others. The Council will be structured and managed accordingly and will operate with a new set
of values and ways of working and our employees will play a key part in this.
The rolling five-year plan allows us the flexibility to adapt to these changes and taking this strategic approach enables us to
continue to deliver high quality services and ensure that only the most appropriate savings are made.
How we deliver this plan reflects the Council’s priorities, political imperatives and local circumstances. Councilors will determine
the principles and direction of this plan and the Chief Executive and Corporate Management Team are accountable for its detail
and delivery.
To meet the agreed priorities of Stirling Council, we have created a set of key messages and goals to focus our work as follows:
• Be Community Led - design and deliver services that respond to the needs and priorities of our diverse communities
and empower them to play a greater role in service delivery.
• Be One Council: One Team - address service provision in a collaborative manner, with no artificial or perceived
boundaries.
• Be a Learning Council - work with and learn from each other and our partners, sharing knowledge and best practice to
meet current and future challenges.
• Be Risk Aware: Not Risk Averse - take innovative and new approaches to service delivery, being aware of risks rather
than being risk averse.
• Be Open and Responsive - engage and communicate effectively and meaningfully with communities, employees and
partners.
Influences Over The Next Five Years
Stirling Council will continue to face significant changes and challenges over the next five years that will impact the way the
Council operates. These changes will be driven by economic, financial, technological, political direction and public policy factors.
Economic Influences
• Stirling has lower levels of unemployment than Scotland as a whole, however 2,200 people in the area are looking for,
but cannot find a job at any one time.
• Stirling has lower rates of economic activity, higher rates of economic inactivity and lower rates of employment than
Scotland as a whole.
• The numbers of people of working age in Stirling whose long term conditions affect their lives are almost as great, as
those over the age of 65 with similar conditions.
• Resident earnings are higher than workplace earnings.
• Business birth rates are still relatively high compared to Scotland, but other cities are catching up and overtaking
Stirling.
• The ratio of jobs to working population is falling.
• Retail spend is falling - 40% of resident spend is outside of Stirling.
• Gross value added (GVA) per head is behind Scotland, Glasgow and Edinburgh.
• A successful City Region Deal will see us gain the financial investment necessary to deliver a programme of change for
Stirling that will unlock our full potential and result in a healthier, wealthier, greener and better connected future for
Stirling, Scotland and the UK. The programme will benefit everyone who lives, visits, works and invests in Stirling and
beyond by permanently boosting GVA, creating 3,000 additional jobs, ensuring sustainable growth across all areas,
closing gaps in attainment and health inequalities, increasing Foreign Direct Investment, increasing overseas exports,
benefitting all citizens through work and skills programmes and increasing tourism by 25 per cent.
Financial Influences
• It is anticipated that there will be continued financial pressure on our government grant.
• Councils will have the ability to increase council tax, following a nine-year period of council tax freeze.
• There will be increasing service delivery costs.
• Pension and salary costs will increase.
• Localities financing has still to be addressed.
The Council will also be considering how we can involve local communities in our budgeting processes and notes the success of
participatory budgeting elsewhere in the world.
Technological Influences
• Stirling has one of the highest levels of internet connectivity in Scotland, but investment in broadband infrastructure is
required to enable communities and business across the area.
• Approximately 20% of households do not have access to superfast broadband and are relying on slower services. The
Government’s broadband scheme is targeted to reduce this to 6% of households by 2018 and further investment is
required beyond this programme.
• Many rural properties and those not included in the first phase of the Government programme do not have any access
to broadband connections. The next phase is targeted to be completed by 2021.

Page 12 of 75
• In early 2017, Stirling became Scotland’s fourth Gigabit City in order to deliver high speed connectivity which will
encourage economic growth and inward investment within the City. Construction will commence in June 2017.
• Improving digital engagement with our citizens, businesses and visitors through a new website offering an enhanced
range of online services transforming the way we do business.
• By pursuing a cloud-based strategy for our business systems we will ensure that our staff are able to work in a more
mobile and flexible manner, as well as improve information sharing to better equip and support our staff in their work.
• Developing more joined up technologies to validate and quality check we have the correct and most up-to-date
information on all our communities.
• Stirling is developing its smart capability through the Smart Cities programme with other Scottish cities. Over the next
two years, Stirling will develop solutions around smart energy systems, smart waste, mobility, intelligent street lighting
and greatly enhance not only our data capability but how we use that data.
Political Direction and Public Policy
• A new administration following the Scottish local government elections in May 2017. A snap General Election in June
2017.
• Public service reform will place expectations on the public sector to share budget and resources.
• The Community Empowerment (Scotland) Act 2015 was issued by the Scottish Government on 25th October 2016.
This replaces the current Single Outcome Agreement with the expectation that a Local Outcome Improvement Plan
(LOIP) will be in place for October 2017.
• Community Justice (Scotland) Act 2016 was passed by the Scottish Parliament on 11th February 2016 and sees the
establishment of a national body - Community Justice Scotland - on 31st March 2017. The arrangements for local
strategic planning and delivery of community justice will be undertaken with local community planning partners.
• The Integration Joint Board (IJB) responsible for the delivery of adult health and social care services was implemented
from 1st April 2016. The Chief Officer is in post and has financial responsibility for the joint budgets across the three
partners - Clackmannanshire Council, Stirling Council and NHS Forth Valley. The Partnership approach also includes
third and independent sectors.
• Effective community planning arrangements are at the heart of public service reform and Single Outcome Agreements
will be replaced by Local Outcome Improvement Plans (LOIP) and Locality Plans. This will commit our community
planning partners to an evidence-based approach to determining priorities and tackling inequalities, which will focus
on putting communities at the heart of everything we do and provide clearer focus on early intervention and
prevention to achieve both financial stability and improve outcomes.
Community Engagement
The Scottish Government introduced new revised national standards for community engagement which were launched in
September 2016. These are good practice principles designed to support and inform the process of community engagement and
improve what happens as a result.
The Community Empowerment (Scotland) Act 2015 has a specific focus on promoting effective engagement and participation to
help communities achieve greater control and influence in the decisions and circumstances that affect their lives. The national
standards for community engagement are important in supporting organisations in putting the Act into practice , they can be
used to shape the participation process used by public bodies as well as shape how community organisations can involve wider
communities of interest.
The key aspects of the national standards are inclusion, support, planning, working together, methods and communication.
These will allow us to assess the impact of engagement and use what has been learned to improve our future community
engagement.
Priority Based Budgeting
Over the last few years Stirling Council has been developing and strengthening its approach to Priority Based Budgeting (PBB).
The five year budget that supports this business plan takes account of extensive communication and community engagement,
including:
• The publication of a draft report with an improved format based on Engagement Sounding Board input which allowed
greater time for comment and feedback.
• Whole Council and service-led workforce briefings, informal drop-in sessions and colleague conversations.
• Five community conversations in November and December 2016 to share options and gather comments, questions
and suggestions.
• A public survey held in January/February 2017 asking people what they think the Council could do differently.
• A contact point at [email protected] where people could provide comment, questions and
suggestions on the process.
• The publication of a priority based budgeting report outlining proposals for PBB4 (2017/18).
Our aim throughout the community engagement exercises has been to connect with communities and ensure they have
sufficient opportunity to influence the budget process. The Council will continue to have open and meaningful dialogue with
employees, residents and key stakeholders throughout this process.
Page 13 of 75
We will also work hard to improve awareness and understanding of all the Council’s activities and services and encourage
increased participation and engagement across the board. We will then build on this engagement with urban and rural
communities, our partner organisations and staff.
Stirling Council is also currently developing an approach which will help it move towards much more participatory budgeting.
Management of Risks
Risk Management processes have been embedded across Stirling Council to manage risks that might impact on the delivery of
the Five Year Business Plan.
The Service Risk Registers contain operational risks and are managed by each Service Management Team. The Resilience and
Risk Team and Corporate Risk Group provide further scrutiny of Service Risks. Service risks with a score above 15 (red) are
reported to Audit Committee. Significant Service risks can be escalated to the Strategic Risk Register.
The Strategic Risk Register is managed by the Corporate Management Team which provides assurance through scrutiny and
challenge at a senior level and ensures that the significant risks facing the Council have been identified and effective treatment
actions implemented that reduce these risks to acceptable levels. It is maintained by the Resilience and Risk Team Leader and
submitted to the Corporate Management Team, prior to Audit Committee, for discussion and monitoring. The Strategic Risk
Register is reported to each Audit Committee which provides effective scrutiny and challenge as part of the Council’s corporate
governance arrangements.
Strategic Workforce Plan
The Strategic Workforce Plan is strategically aligned to the Council’s Five Year Business Plan and the Priority Based Budgeting
(PBB) process. The Plan captures the implications of the Council’s ongoing process of transformation, while providing
information on the current workforce and setting out a strategy to ensure the Council’s outcomes and priorities are delivered.
Taking into consideration the common themes emerging from individual service and corporate business plans and with regard
to the financial landscape, the following strategic workforce priorities are proposed for the period 2017 to 2022:
• Strengthen the linkage between business, financial and strategic workforce planning.
• Continue to embed a culture of customer-focused, high performance across the Council.
• Maximise employee engagement, creating a working environment where everyone can have a rewarding and
enjoyable working life.
• Work together with our trades unions, striving for positive industrial and employee relations.
• Develop the working environment and the promotion of a health, safety and wellbeing culture.
• Manage required changes to the workforce in a structured, planned and fully consultative basis.
• Ensure that the Council’s status as an ‘employer of choice’ is enhanced and that the principle of equal opportunities is
evident in all aspects of the Council’s employment processes.
• Focus on increasing the diversity of the workforce over the next five years.
• Increase the number of training, apprentice, graduate and talent management opportunities and help everyone to
develop skills to excel in their performance and move towards their life and career goals. This includes supporting the
Corporate Parenting and employability pipeline.
• Ensure attendance management levels equate to upper quartile performance standards.
• Ensure high level management performance across the Council through robust selection processes and tailored
development programmes.
• Measures will be developed as part of the Organisational Change programme to align major strategies, including
digital, customer and technology and locality programmes.
Delivering on these priorities will contribute significantly to fulfilling the Five Year Business Plan aspiration to have a “flexible,
skilled and motivated workforce”. Staff will operate effectively if they feel valued, have a clear role to play and can see the
results of their efforts. Workforce planning is an on-going process and the Plan will continue to evolve to match the objectives
and aspirations of Stirling Council.
Council Performance Management Framework
Stirling Council's Performance Management Framework is the method by which the Council plans and prioritises, monitors and
manages performance and undertakes reviews and improvement activities as part of the Five Year Business Plan. The
Framework is shown in the diagram that follows and includes the following sections:
• Planning and Prioritising - details of Stirling Council's main strategic plans and priorities.
• Reporting and Managing - the latest performance information and analysis showing Stirling Council's performance
over time and in comparison with other local authorities.
• Reviewing and Improving - details of how Stirling Council reviews progress and identifies its strengths and areas for
improvement.

Page 14 of 75
Jim Boyle CPFA
Chief Finance Officer
31 August 2017
Stewart Carruth
Chief Executive
31 August 2017
Scott Farmer
Leader of the Council
31 August 2017
Page 15 of 75
Statement of Responsibilities
The Authority’s Responsibilities
The authority is required to:
- Make arrangements for the proper administration of its financial affairs and to secure that the proper officer of the
authority has responsibility for the administration of those affairs (section 95 of the Local Government (Scotland)
Act 1973). In this authority, that officer is the Chief Finance Officer, Corporate Operations.
- Manage its affairs to secure economic, efficient and effective use of resources and safeguard its assets.
- Ensure the Annual Accounts are prepared in accordance with legislation (The Local Authority Accounts (Scotland)
Regulations 2014) and so far as is compatible with that legislation, in accordance with proper accounting practices
(section 12 of the Local Government in Scotland Act 2003).
- Approve the Annual Accounts for signature.
I confirm that these Annual Accounts were approved for signature by the Audit Committee at its meeting on 31 August 2017.
Signed on behalf of Stirling Council.
Scott Farmer
Leader of the Council
31 August 2017
The Chief Financial Officer’s Responsibilities
The Chief Finance Officer is responsible for the preparation of the authority’s Annual Accounts in accordance with proper
practices as required by legislation and as set out in the CIPFA/LASAAC Code of Practice on Local Authority Accounting in the
United Kingdom (the Accounting Code).
In preparing the Annual Accounts, the Chief Finance Officer has:
- Selected suitable accounting policies and then applied them consistently.
- Made judgements and estimates that were reasonable and prudent.
- Complied with legislation.
- Complied with the local authority Accounting Code (in so far as it is compatible with legislation).
The Chief Finance Officer has also:
- Kept adequate accounting records which were up to date.
- Taken reasonable steps for the prevention and detection of fraud and other irregularities.
I certify that the financial statements give a true and fair view of the financial position of the local authority and its group at the
reporting date and the transactions of the local authority and its group for the year ended 31 March 2017.
Jim Boyle CPFA
Chief Finance Officer
31 August 2017
Page 16 of 75
Annual Governance Statement
Scope of Responsibility
Stirling Council is responsible for ensuring that its business is conducted in accordance with the law and proper standards, and
that public money is safeguarded, properly accounted for, and used economically, efficiently and effectively. The Council also
has a statutory duty, under the Local Government in Scotland Act 2003, to make arrangements to secure best value through
continuous improvement in performance of its functions. Elected Members and the Corporate Management Team are
responsible, in discharging those responsibilities, for putting proper arrangements in place for the governance of the Council’s
affairs, and for facilitating the effective exercise of its functions, including risk management arrangements.
This assurance statement relates to the governance framework in place within the Council for the year ended 31 March 2017,
and up to the date of signature of the Council’s Annual Accounts for 2016-17.
The Council approved and adopted its Local Code of Corporate Governance (‘the Code’) in December 2013. The Code is
consistent with the six principles of the CIPFA and SOLACE Delivering Good Governance in Local Government Framework. It also
incorporates the requirements of CIPFA’s Statement on The Role of the Chief Financial Officer in Local Government. A copy of
the Code is on our website at www.stirling.gov.uk, or can be obtained by writing to: The Chief Governance Officer, Stirling
Council, Old Viewforth, Stirling FK8 2ET.
This Annual Governance Statement explains how the Council has complied with the Code and complies with the CIPFA Code of
Practice on Local Authority Accounting in the United Kingdom: Guidance Notes for Practitioners 2016-17, which details the
requirements for an Annual Governance Statement. It also complies with the Delivering Good Governance in Local Government
Framework and Guidance Notes, and the Local Authority Accounts (Scotland) Regulations 2014, both of which require the
Council to conduct an annual review of the effectiveness of its system of internal control, to consider and report the findings of
that review, and to approve an Annual Governance Statement, signed by the Chief Executive and Council Leader.
The Governance Framework
The governance framework comprises the systems, processes, culture and values by which the Council is directed and
controlled, and the activities through which it accounts to, engages with, and leads its communities. It enables the Council to
monitor achievement of its eighteen key priorities, published in the Council’s Five-year Business Plan. It also enables the Council
to consider whether those objectives have led to the delivery of appropriate value for money.
The Council’s system of internal control is a significant part of the governance framework and is designed to manage risk to a
reasonable level. Internal control cannot eliminate all risk of failure to achieve policies, aims and objectives, and can therefore
only provide reasonable and not absolute assurance of effectiveness. The system of internal control is based on an ongoing
process designed to identify and prioritise the risks to the achievement of policies, aims and objectives; to evaluate the
likelihood of those risks being realised and the impact should they be realised; and, to manage those risks efficiently, effectively
and economically.
The Council’s governance framework is set out in the Local Code of Corporate Governance, which aims to:
• give an overview of the governance arrangements in operation within the Council;
• provide assurance that the Council’s business is run lawfully, accountably and openly; and,
• provide the Council with a focus for self-assessment of its governance arrangements.
The Council maintains organisational and management structures to ensure it has the right capacity, competencies, behaviours
and governance arrangements to address future opportunities and challenges, including a greater emphasis on: community
planning and engagement; health and social care integration; a strategic infrastructure plan; changing customer demands; and,
ongoing financial challenges.
The Council structure underpins a flexible partnership delivery approach based on community priorities and outcomes. The
Council keeps its decision-making and delegation arrangements, and its organisational structure, under regular review to
support the delivery of its key priorities and objectives. The Council endorsed a revised organisational and management
structure on 19 May 2016, in line with earlier Council decisions, and delegated authority to the Chief Executive to implement the
approved structure.
The Council’s current decision-making structures include:
• a Community Planning & Regeneration Committee • an Education Committee
• an Environment & Housing Committee • a Finance & Economy Committee
• a Public Safety Committee • a Social Care & Health Committee

Page 17 of 75
The Council also has an Audit Committee that is chaired by the Leader of the Opposition.
The Council considers that the senior management, decision-making and scrutiny arrangements are aligned appropriately to its
eighteen key priorities, and provide an effective framework through which it can direct and control its activities, and scrutinise
its performance in delivering these. The other key elements of the corporate governance framework are:
• a Five-year Business Plan that sets out The Council’s vision and key corporate priorities and supports the actions required to
deliver the agreed priorities under the Single Outcome Agreement. The Single Outcome Agreement and Five-year Business
Plan are published on the Council’s website;
• Outcomes for Stirling, the Single Outcome Agreement for 2013-2023, was agreed by the Council, Community Planning
Partners and the Scottish Government. It sets out the shared objectives of the Council and its Community Planning Partners,
and details their vision, strategic priorities and intended outcomes for the Stirling area, its citizens and service users;
• governance arrangements for the Single Outcome Agreement during 2016/17 included a Leadership Group to perform the
functions of the Community Planning Partnership (CPP) Board, to lead the Partnership and be responsible for its
effectiveness, and sub-groups responsible to the Leadership Group for delivery of specified priorities;
• the Priority Based Budgeting (PBB) process, which underpins the Five-year Business Plan and Strategic Workforce Plan,
enabling the Council to manage expected future costs and service demands, aligning service delivery and transformation to
address those demands and deliver best value from available resources;
• governance arrangements for Strategic Transformation and Priority Based Budgeting (PBB) savings options, including
Thematic and Subsidiary Boards to oversee the co-ordination, prioritisation and delivery of PBB projects;
• formal arrangements to support and engage with Local and Area Community Planning Groups through the three Area
Community Planning Forums, and to support and engage with Community Councils, ensuring that the service needs and
priorities of local communities are identified and can influence Council policy and services;
• a performance management framework, incorporating internal and public performance reporting, that enables the Council
to regularly report performance in achieving its key objectives. Performance reports include the Annual Report and
Accounts, and Performance and Strategic Priorities Progress Reports: these are published on the Council’s website and in
Council or Committee agenda papers;
• presentation of reports, including findings and recommendations, to the Corporate Management Team, Audit Committee
and Council, where appropriate, by Internal Audit, external audit, and other inspectorates;
• Standing Orders, Contract Standing Orders, Schemes of Delegation and Financial Regulations, which define the roles and
responsibilities of Elected Members and officers, and are subject to regular review
• the overall responsibilities of:
• the Chief Executive, as the Head of Paid Service, for all aspects of operational management;
• the Chief Finance Officer for keeping proper financial records, maintaining an effective system of internal financial
control, and ensuring appropriate advice is given to the Council on all financial matters;
• the Chief Governance Officer, as statutory Monitoring Officer, for ensuring appropriate advice is given to the Council
on corporate governance arrangements, and for ensuring compliance with relevant legislation and procedure;
• the Audit Manager, as set out in the Internal Audit Charter, to review, appraise and report to management, the Audit
Committee and the Council on the adequacy of internal control and corporate governance arrangements and on risks
relating to approved policies, programmes and projects;
• an Audit Committee that provides the Council with independent assurance of the adequacy of the governance and risk
management frameworks and the internal control environment, including through an annual report;
• an approved Risk Management Policy and Procedures that sets out the responsibilities of Elected Members, the Audit
Committee, management and staff for the identification and management of risks to the key corporate priorities;
• a Council-wide Strategic Risk Register and Service Risk Registers, which identify risks and treatment actions, are regularly
reviewed, updated and reported to the Audit Committee and the Corporate Management Team
• Business Impact Assessment & Recovery Plans are in place to set out arrangements for service continuity in the event of an
emergency or other disruption to critical services;
• formal objectives for staff, including senior management, which are subject to review through the Council-wide Personal
Review & Development (PRD) process;
• a Register of Members’ Interests and a Register of Officers’ Interests (for senior officers) are maintained and made available
for public inspection;
• a ‘Members’ Remuneration and Expenses Scheme’ which is consistent with Scottish Government– guidance. Information on
the amounts and composition of Elected Members’ salaries, allowances and expenses is published on the Council website;

Page 18 of 75
• induction training on roles and responsibilities, and ongoing development opportunities, are provided for Elected Members;
• codes of conduct that set out the standards of behaviour expected from Elected Members and officers, including the
Councillors’ Code of Conduct and the Code of Ethical Standards for officers;
• an Anti-Fraud & Corruption Strategy sets out the responsibilities of officers and Elected Members in relation to fraud and
corruption, and is reinforced by the Public Interest Disclosure (‘Whistleblowing’) Policy, the codes of conduct and the
Financial Regulations;
• an Integrity Group, which manages and co-ordinates the corporate response to the Scottish Government’s Serious
Organised Crime Strategy and national Prevent Duty guidance;
• an Information Management Group contributes to, and has oversight of, strategy, policy and procedures to promote the
effective management of information throughout its lifecycle; and,
• a Local Code of Practice on Following the Public Pound & Funding External Bodies, and arrangements for appointments of
Members and Officers to Boards or management groups of group entities, to ensure proper accountability for Council funds
used in the external delivery of services to meet strategic priorities and objectives.
Review of Effectiveness
The Council is responsible for conducting, at least once in each financial year, a review of the effectiveness of its governance
framework, including the system of internal financial control. The review of the effectiveness of the Council governance
framework is informed by:
• the work of the Corporate Management Team, which develops and maintains the governance environment;
• the work of Council managers and finance staff;
• the annual assurance statements on governance arrangements that are provided by Directors;
• an annual review, by Internal Audit, of compliance with the Council’s Local Code of Corporate Governance;
• the Audit Manager’s annual report and internal audit reports across the range of Council services;
• reports from the Council’s external auditor; and,
• reports from other external review bodies, agencies and inspectorates.
The annual review of effectiveness is supported by a process of self-assessment and assurance certification by Directors and
Senior Managers, including completion of an Assurance Checklist covering the key elements of the governance framework. As
part of this process, they were asked to identify progress on implementing improvement actions identified as part of the 2016-
17 assessments, and to identify actions they proposed to take during 2017-18.
The Audit Manager considered the completed assurance checklists, certifications and improvement action plans from each
Service, and concluded that:
• these did not highlight any issues that would impact on the level of assurance over the effectiveness of the Council’s
governance framework;
• Services had identified areas for improvements to the current governance framework, focussing on:
� strengthening Service planning, data management, risk management, and performance management;
� improving procurement capacity and capability, and cyber threat arrangements;
� undertaking training on key financial responsibilities and corporate fraud awareness;
� improving monitoring and management of the Council’s arms’ length organisations and partnerships; and,
� strengthening operational procedures to ensure these meet requirements of new legislation, in relation to privacy
impact assessments in particular.
• the proposed improvements did not indicate any significant gaps or weaknesses in the existing governance framework that
should have been addressed by Services.
Internal Audit has performed an annual review on the existence, appropriateness and application of the key elements of the
Local Code of Corporate Governance during the year to 31 March 2017, concluding that:
• the Code is consistent with CIPFA and SOLACE guidance on the Delivering Good Governance in Local Government
Framework and with the International Framework Good Governance in the Public Sector;
• the key governance arrangements and controls are clearly set out in the Code, and there is sufficient, clear, reliable and
objective evidence to provide assurance that these exist and are being applied in practice; and,
• there is scope to continue to develop and refine corporate governance arrangements. Internal Audit has made a small
number of recommendations for improvement, agreed with the Chief Governance Officer.

Page 19 of 75
In order to comply with the group accounting requirements of the Code of Practice on Local Authority Accounting in the United
Kingdom: Guidance Notes for Practitioners 2016-17, this Statement incorporates assurance on the governance arrangements
and systems of internal financial controls within the consolidated group entities of Stirling Council. The review of the
effectiveness of those arrangements for the year to 31 March 2017 is informed by:
• the work of those bodies’ respective external auditors (and, where relevant, internal auditors); and,
• the Annual Governance Statement included within the Statement of Accounts of Central Scotland Valuation Joint Board.
Roles and Responsibilities of the Audit Committee and the Head of Internal Audit
The Audit Committee is chaired by the Leader of the Opposition and operates in accordance with CIPFA’s Audit Committee
Principles in Local Authorities in Scotland and Audit Committees: Practical Guidance for Local Authorities. Its role includes:
• to review internal and external audit reports and the main issues arising, and seek assurance that action has been taken
where necessary;
• to receive and consider the Audit Manager’s annual report, summarising internal audit activity and the level of assurance
this provides over the arrangements for risk management, governance and internal financial control within the Council and
its group entities;
• to satisfy itself that the Council’s assurance statements, including the Annual Governance Statement, properly reflect the
risk environment and any actions required to improve it;
• to keep the Local Code of Corporate Governance under review and ensure arrangements for the publication of a statement
in the Council’s Annual Accounts confirming compliance with the Code; and,
• to review the Annual Accounts and to consider the external auditor’s report to those charged with governance on issues
arising from the audit of the accounts.
As required by the Public Sector Internal Audit Standards, the Audit Manager (as Head of Internal Audit) prepares an annual
Internal Audit Risk Assessment & Plan, and undertakes a programme of internal audit reviews that takes account of the risks
identified in the Council’s risk registers and Internal Audit’s own assessment of risk.
The Audit Committee approves Internal Audit’s planned programme of work and regularly monitors the performance of the
service. The Audit Manager provides an annual Statement of Assurance to the Audit Committee, containing his independent
opinion on the adequacy and effectiveness of the Council’s risk management, internal control and corporate governance
arrangements.
Internal Audit reports are provided to Elected Members, to management and to the external auditor. The reports include
improvement recommendations and agreed action plans to address these. Management is responsible for responding to those
reports and ensuring that appropriate action is taken. Significant matters, including any non-compliance with recommendations
arising from Internal Audit work, are reported to the Audit Committee.
Compliance with Best Practice
The Council complies with the requirements in CIPFA’s The Role of the Chief Financial Officer in Local Government. The Chief
Finance Officer has overall responsibility for the Council’s financial arrangements, and is professionally qualified and suitably
experienced to lead the Council’s finance function and to direct finance staff.
The Council complies with the requirements in CIPFA’s The Role of the Head of Internal Audit in Public Service Organisations
The Audit Manager has responsibility for the Council’s Internal Audit service, and is professionally qualified and suitably
experienced to lead and direct the Internal Audit team. The Internal Audit service operates in accordance with the Public Sector
Internal Audit Standards. The Council’s external auditor conducts an annual review of the effectiveness of the Council’s Internal
Audit Service and arrangements, and reports its findings to the Council within its Annual Audit Report.
Health & Social Care Integration: Clackmannanshire and Stirling Health & Social Care Partnership
The Public Bodies (Joint Working) (Scotland) Act 2014 (the Act) requires Local Authorities and Health Boards to integrate
planning and delivery of certain adult health and social care services. Stirling and Clackmannanshire Councils elected to form a
single body corporate with NHS Forth Valley. The Clackmannanshire and Stirling Health & Social Care Partnership was
established and became operational on 1 April 2016.
The Act required that each Health & Social Care Integration Joint Board (IJB) establish adequate internal audit arrangements to
support independent review of the adequacy of risk management, governance and control arrangements for the delegated
resources, including the appointment of a Chief Internal Auditor.

Page 20 of 75
The Clackmannanshire and Stirling IJB has agreed a rotational appointment across constituent bodies, and appointed Stirling
Council’s Audit Manager as the Chief Internal Auditor for the period up to 31 March 2019. The IJB has also approved the
establishment, membership and remit of its Audit Committee.
The Audit Manager, in his capacity as Chief Internal Auditor, provided information and reports to the IJB Audit Committee at
meetings in September 2016 and February 2017, to meet the obligation to provide independent assurance on the risk
management, governance and control arrangements within the Partnership. In particular, the Audit Manager reported to the IJB
Audit Committee on:
• the Internal Audit Annual Report for 2015/16, incorporating a positive assurance statement in support of the IJB’s Annual
Governance Statement, as published in the Annual Accounts;
• a draft, risk-based Internal Audit Annual Plan for 2016/17, approved by the Committee in September 2016, setting out an
agreed programme of work to enable Internal Audit to provide independent assurance on risk management, governance
and internal control arrangements;
• the financial assurance arrangements within the Council to agree the Council’s base budget allocation of resources to the IJB
for 2016/17, noting the robustness of those arrangements;
• a progress report on the approved Internal Audit Annual Plan for 2016/17, incorporating the report on the IJB’s governance
arrangements.
Significant Governance Issues and Planned Actions
The Audit Manager’s overall Audit Opinion for the Annual Governance Statement is included within the Internal Audit Annual
Report for 2016-17 and concludes that he was able to provide reasonable assurance on the Council’s overall framework of
control for the year to 31 March 2017, including the group entities. The programme of Internal Audit work undertaken in
respect of 2016-17 was sufficient in breadth and depth to allow him to form a robust and balanced opinion. A significant
majority of reports issued provided ‘substantial assurance’ opinions on the Council’s control arrangements.
The Council and group entities continue to work to address control weaknesses identified during audits and other inspections
and, subject to any issues noted in this Statement, progress has been made with the implementation of agreed improvement
actions including those identified in the previous year’s Annual Governance Statement. The internal audit process incorporates
follow-up work to monitor implementation of agreed actions. The outcomes of internal audit follow-up work during 2016-17
were reported regularly to the Corporate Management Team and to the Audit Committee, and will continue to be so.
The following table sets out key improvements and developments to the Council’s overall governance framework, identified
from the review and monitoring of the effectiveness of its governance arrangements. These are corporate initiatives that will be
undertaken or progressed further during 2017/18.
Improvement /
Development
Source of Action Action in 2017-18
1 The Council’s overall
corporate governance
framework, as set out in
the approved Local Code of
Corporate Governance, and
related policies and
procedures.
CIPFA “Delivering Good
Governance in Local
Government Framework
and Guidance Notes.
1. Revise the Council’s Local Code of Corporate
Governance to reflect the revised Delivering Good
Governance in Local Government Framework.
Council - Review of
Governance Documents
Internal Audit Review:
Local Code of Corporate
Governance 2016-17
2. Revise the Standing Orders, Scheme of Delegation,
Scheme of Sub-Delegation and Financial Regulations to
reflect the governance and decision-making
arrangements of the new Council, following elections in
May 2017.
2 Community and Locality
Planning arrangements,
and the development and
publication of statutory
plans required under the
Community Empowerment
(Scotland) Act (2015).
Community Empowerment
(Scotland) Act (2015)
Community Empowerment
(Scotland) Act (2015)
Stirling Council and the
Community Planning
Partnership Leadership
Group
3. Progress and develop the ‘next steps’ in the Council’s
Localities Programme, including locality planning and
locality budgeting; building on the ‘test sites’
experiences with further community engagement, and
report on progress to Committee in the autumn of
2017.
4. Develop and publish a Local Outcomes Improvement
Plan (LOIP) by October 2017 to replace the Single
Outcome Agreement, and Locality Plans for areas
experiencing the poorest outcomes.
Page 21 of 75
Improvement /
Development
Source of Action Action in 2017-18
3 The Equality Strategy 2013-
17, setting out Council’s
approach to meeting its
obligations under the
Equality Act 2010 and the
Public Sector Equality Duty.
Equality Strategy 2013-17 5. Continue to deliver the outcomes set out in the
Council’s Equality Strategy 2013-17, and further
develop performance monitoring arrangements.
Publish the Mainstreaming Report, Outcomes Progress
Report and Equality Outcomes 2017-2021 by the end of
April 2017, required under the Public Sector Equality
Duty (publication is now complete).
4 The Council’s deployment
of its Strategic Workforce
Plan, which is aligned with
the Priority Based Budget
Financial Plan and the 5-
year Business Plan.
5-year Business Plan 2017-
2022
Strategic Workforce Plan
2017-2022
6. Facilitation of engagement events to seek employees’
views and ideas for the future, and implementation and
roll-out of the Council’s new, integrated HR & Payroll
system during 2017. The new system will help support
the achievement of the strategic priorities, and realise
the workforce vision, set out in the Strategic Workforce
Plan.
Conclusion
This Annual Governance Statement summarises, openly and transparently, the governance arrangements established by Stirling
Council for 2016/17 and the period to date.
As Leader of the Council and Chief Executive, we have been advised on the implications of the review of the effectiveness of the
governance framework and that the Council’s arrangements continue to be regarded as fit for purpose in accordance with the
governance framework. It is our opinion that reasonable assurance can be placed upon the adequacy and effectiveness of the
systems of governance operated by the Council and its Group.
The annual review of effectiveness identifies sufficient evidence that the Council’s Local Code of Corporate Governance operates
effectively, and that the Council and its Group propose to continue to take steps, in the coming year, to address the above
matters to further enhance their governance arrangements. We are satisfied that these steps will address the need for
improvements that have been identified in the review of effectiveness, and will monitor their implementation and operation as
part of the next annual review.
Stewart Carruth
Chief Executive
31 August 2017
Scott Farmer
Leader of the Council
31 August 2017
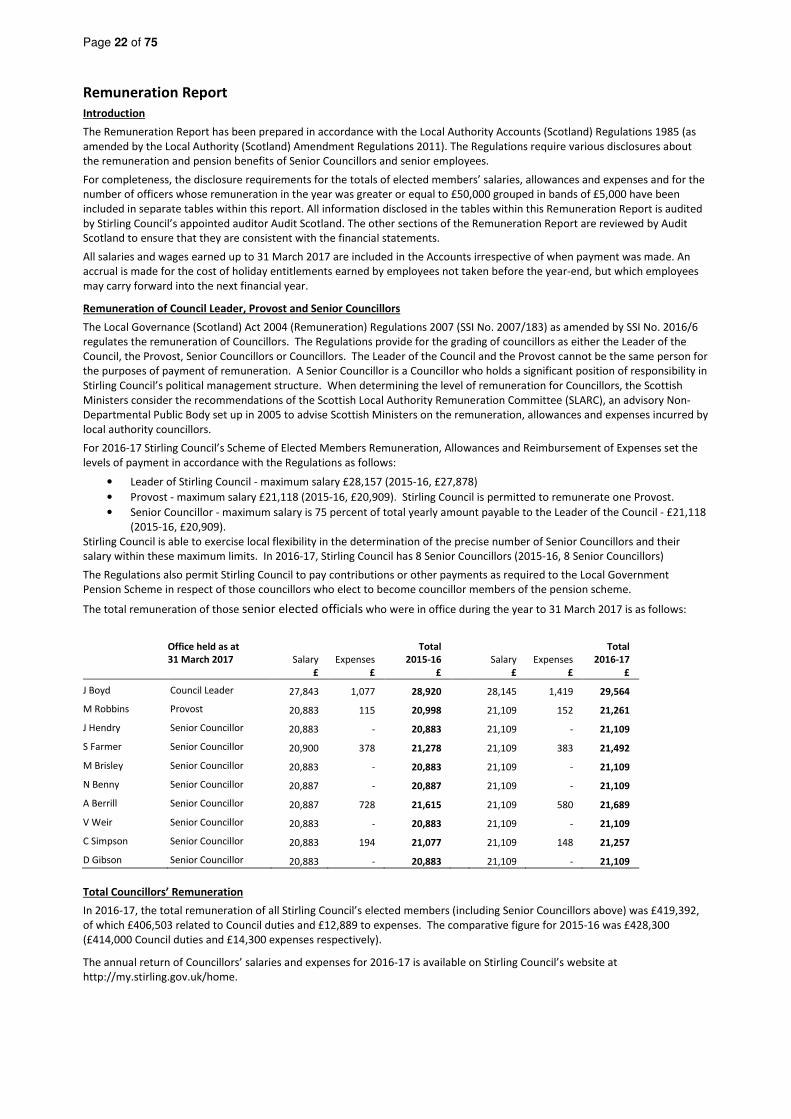
Page 22 of 75
Remuneration Report
Introduction
The Remuneration Report has been prepared in accordance with the Local Authority Accounts (Scotland) Regulations 1985 (as
amended by the Local Authority (Scotland) Amendment Regulations 2011). The Regulations require various disclosures about
the remuneration and pension benefits of Senior Councillors and senior employees.
For completeness, the disclosure requirements for the totals of elected members’ salaries, allowances and expenses and for the
number of officers whose remuneration in the year was greater or equal to £50,000 grouped in bands of £5,000 have been
included in separate tables within this report. All information disclosed in the tables within this Remuneration Report is audited
by Stirling Council’s appointed auditor Audit Scotland. The other sections of the Remuneration Report are reviewed by Audit
Scotland to ensure that they are consistent with the financial statements.
All salaries and wages earned up to 31 March 2017 are included in the Accounts irrespective of when payment was made. An
accrual is made for the cost of holiday entitlements earned by employees not taken before the year-end, but which employees
may carry forward into the next financial year.
Remuneration of Council Leader, Provost and Senior Councillors
The Local Governance (Scotland) Act 2004 (Remuneration) Regulations 2007 (SSI No. 2007/183) as amended by SSI No. 2016/6
regulates the remuneration of Councillors. The Regulations provide for the grading of councillors as either the Leader of the
Council, the Provost, Senior Councillors or Councillors. The Leader of the Council and the Provost cannot be the same person for
the purposes of payment of remuneration. A Senior Councillor is a Councillor who holds a significant position of responsibility in
Stirling Council’s political management structure. When determining the level of remuneration for Councillors, the Scottish
Ministers consider the recommendations of the Scottish Local Authority Remuneration Committee (SLARC), an advisory Non-
Departmental Public Body set up in 2005 to advise Scottish Ministers on the remuneration, allowances and expenses incurred by
local authority councillors.
For 2016-17 Stirling Council’s Scheme of Elected Members Remuneration, Allowances and Reimbursement of Expenses set the
levels of payment in accordance with the Regulations as follows:
• Leader of Stirling Council - maximum salary £28,157 (2015-16, £27,878)
• Provost - maximum salary £21,118 (2015-16, £20,909). Stirling Council is permitted to remunerate one Provost.
• Senior Councillor - maximum salary is 75 percent of total yearly amount payable to the Leader of the Council - £21,118
(2015-16, £20,909).
Stirling Council is able to exercise local flexibility in the determination of the precise number of Senior Councillors and their
salary within these maximum limits. In 2016-17, Stirling Council has 8 Senior Councillors (2015-16, 8 Senior Councillors)
The Regulations also permit Stirling Council to pay contributions or other payments as required to the Local Government
Pension Scheme in respect of those councillors who elect to become councillor members of the pension scheme.
The total remuneration of those senior elected officials who were in office during the year to 31 March 2017 is as follows:
Office held as at
31 March 2017 Salary Expenses
Total
2015-16 Salary Expenses
Total
2016-17
£ £ £ £ £ £
J Boyd Council Leader 27,843 1,077 28,920 28,145 1,419 29,564
M Robbins Provost 20,883 115 20,998 21,109 152 21,261
J Hendry Senior Councillor 20,883 - 20,883 21,109 - 21,109
S Farmer Senior Councillor 20,900 378 21,278 21,109 383 21,492
M Brisley Senior Councillor 20,883 - 20,883 21,109 - 21,109
N Benny Senior Councillor 20,887 - 20,887 21,109 - 21,109
A Berrill Senior Councillor 20,887 728 21,615 21,109 580 21,689
V Weir Senior Councillor 20,883 - 20,883 21,109 - 21,109
C Simpson Senior Councillor 20,883 194 21,077 21,109 148 21,257
D Gibson Senior Councillor 20,883 - 20,883 21,109 - 21,109
Total Councillors’ Remuneration
In 2016-17, the total remuneration of all Stirling Council’s elected members (including Senior Councillors above) was £419,392,
of which £406,503 related to Council duties and £12,889 to expenses. The comparative figure for 2015-16 was £428,300
(£414,000 Council duties and £14,300 expenses respectively).
The annual return of Councillors’ salaries and expenses for 2016-17 is available on Stirling Council’s website at
http://my.stirling.gov.uk/home.
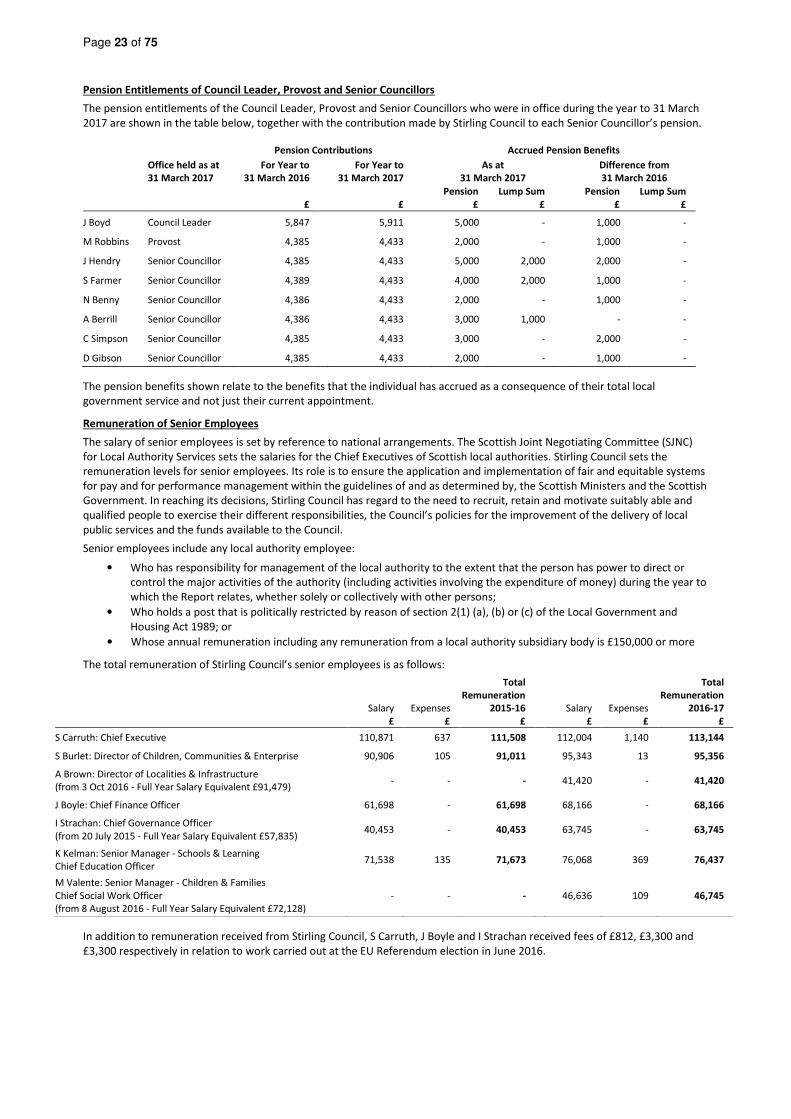
Page 23 of 75
Pension Entitlements of Council Leader, Provost and Senior Councillors
The pension entitlements of the Council Leader, Provost and Senior Councillors who were in office during the year to 31 March
2017 are shown in the table below, together with the contribution made by Stirling Council to each Senior Councillor’s pension.
Pension Contributions Accrued Pension Benefits
Office held as at
31 March 2017
For Year to
31 March 2016
For Year to
31 March 2017
As at
31 March 2017
Difference from
31 March 2016
£ £
Pension
£
Lump Sum
£
Pension
£
Lump Sum
£
J Boyd Council Leader 5,847 5,911 5,000 - 1,000 -
M Robbins Provost 4,385 4,433 2,000 - 1,000 -
J Hendry Senior Councillor 4,385 4,433 5,000 2,000 2,000 -
S Farmer Senior Councillor 4,389 4,433 4,000 2,000 1,000 -
N Benny Senior Councillor 4,386 4,433 2,000 - 1,000 -
A Berrill Senior Councillor 4,386 4,433 3,000 1,000 - -
C Simpson Senior Councillor 4,385 4,433 3,000 - 2,000 -
D Gibson Senior Councillor 4,385 4,433 2,000 - 1,000 -
The pension benefits shown relate to the benefits that the individual has accrued as a consequence of their total local
government service and not just their current appointment.
Remuneration of Senior Employees
The salary of senior employees is set by reference to national arrangements. The Scottish Joint Negotiating Committee (SJNC)
for Local Authority Services sets the salaries for the Chief Executives of Scottish local authorities. Stirling Council sets the
remuneration levels for senior employees. Its role is to ensure the application and implementation of fair and equitable systems
for pay and for performance management within the guidelines of and as determined by, the Scottish Ministers and the Scottish
Government. In reaching its decisions, Stirling Council has regard to the need to recruit, retain and motivate suitably able and
qualified people to exercise their different responsibilities, the Council’s policies for the improvement of the delivery of local
public services and the funds available to the Council.
Senior employees include any local authority employee:
• Who has responsibility for management of the local authority to the extent that the person has power to direct or
control the major activities of the authority (including activities involving the expenditure of money) during the year to
which the Report relates, whether solely or collectively with other persons;
• Who holds a post that is politically restricted by reason of section 2(1) (a), (b) or (c) of the Local Government and
Housing Act 1989; or
• Whose annual remuneration including any remuneration from a local authority subsidiary body is £150,000 or more
The total remuneration of Stirling Council’s senior employees is as follows:
Salary
Expenses
Total
Remuneration
2015-16
Salary
Expenses
Total
Remuneration
2016-17
£ £ £ £ £ £
S Carruth: Chief Executive 110,871 637 111,508 112,004 1,140 113,144
S Burlet: Director of Children, Communities & Enterprise 90,906 105 91,011 95,343 13 95,356
A Brown: Director of Localities & Infrastructure
(from 3 Oct 2016 - Full Year Salary Equivalent £91,479) - - - 41,420 - 41,420
J Boyle: Chief Finance Officer 61,698 - 61,698 68,166 - 68,166
I Strachan: Chief Governance Officer
(from 20 July 2015 - Full Year Salary Equivalent £57,835) 40,453 - 40,453 63,745 - 63,745
K Kelman: Senior Manager - Schools & Learning
Chief Education Officer 71,538 135 71,673 76,068 369 76,437
M Valente: Senior Manager - Children & Families
Chief Social Work Officer
(from 8 August 2016 - Full Year Salary Equivalent £72,128)
- - - 46,636 109 46,745
In addition to remuneration received from Stirling Council, S Carruth, J Boyle and I Strachan received fees of £812, £3,300 and
£3,300 respectively in relation to work carried out at the EU Referendum election in June 2016.

Page 24 of 75
The remuneration details of those senior employees who left the employment of the Council during 2016-17 as part of a
management restructuring exercise are as follows:
Salary
Expenses
Total
Remuneration
2015-16
Salary
Expenses Redundancy
Total
Remuneration
2016-17
£ £ £ £ £ £ £
G O’Sullivan: Director of Corporate Operations
(to 15 July 2016 - Full Year Salary Equivalent £91,479) 89,158 - 89,158 27,064 - 7,509 34,573
R Steenson: Director of Housing & Environment
(to 31 July 2016 - Full Year Salary Equivalent £91,479) 89,158 - 89,158 33,874 - - 33,874
D Leng: Director of Children, Young People & Education
(to 31 July 2016 - Full Year Salary Equivalent £46,826)* 46,334 - 46,334 19,756 - 20,258 40,014
V de Souza: Director of Social Services
(to 31 Aug 2016 - Full Year Salary Equivalent £40,110)* 39,715 36 39,751 18,720 173 - 18,893
*From 1 April 2011 until 30 September 2016, Stirling and Clackmannanshire Councils jointly delivered Education and Social
Services. Stirling Council was the lead authority for Education with Clackmannanshire Council leading on Social Services. The
salary and expenses figures shown for D Leng and V de Souza represent 50% of their total remuneration, being Stirling Council’s
share under the joint management arrangement between Stirling and Clackmannanshire Councils. The redundancy payment for
D Leng represents the total amount due and paid in full by Stirling Council.
Pension Entitlements of Senior Employees
The pension entitlements of Senior Employees are shown in the table below, together with contributions made by Stirling
Council to each Senior Employee’s pension.
In-Year Pension Contributions Accrued Pension Benefits
For Year to 31
March 2016
For Year to 31
March 2017
As at
31 March 2017
Difference from
31 March 2016
£ £
Pension
£
Lump Sum
£
Pension
£
Lump Sum
£
S Carruth: Chief Executive 23,283 23,521 8,000 - 3,000 -
S Burlet: Director of Children, Communities & Enterprise 19,090 20,022 4,000 - 1,000 -
A Brown: Director of Localities and Infrastructure * - 8,698 1,000 - 1,000 -
J Boyle: Chief Finance Officer 13,532 14,315 30,000 61,000 3,000 4,000
I Strachan: Chief Governance Officer * 8,495 13,386 2,000 - 1,000 -
K Kelman: Chief Education Officer 15,023 15,974 8,000 - 2,000 -
M Valente: Chief Social Work Officer * - 9,794 1,000 - 1,000 -
* The accrued pension benefits for A Brown, I Strachan and M Valente only represents their respective Falkirk Pension Fund
amounts.
The pension entitlements of those senior employees who left the employment of the Council during 2016-17 as part of a
management restructuring exercise are as follows:
In-Year Pension Contributions Accrued Pension Benefits
For Year to 31
March 2016
For Year to 31
March 2017
As at
31 March 2017
Difference from
31 March 2016
£ £
Pension
£
Lump Sum
£
Pension
£
Lump Sum
£
G O’Sullivan: Director of Corporate Operations 18,723 6,300 3,000 - 1,000 -
R Steenson: Director of Housing & Environment 18,723 7,114 36,000 73,000 34,000 73,000
D Leng: Director of Children, Young People & Education** 9,730 3,697 11,000 16,000 9,000 16,000
V de Souza: Director of Social Services** 8,340 3,931 11,500 19,000 500 500
** The in-year pension contributions and accrued pension benefits for D Leng and V de Souza represent 50% of the total sums,
being Stirling Council’s share under the joint management arrangement between Stirling and Clackmannanshire Councils.
All senior employees shown in the tables above are members of the Local Government Pension Scheme (LGPS). The pension
figures shown relate to the benefits that the person has accrued as consequence of their total local government service and not
just their current appointment.
Pension Scheme Contribution Rates
From 1 April 2009 a tiered pension contribution system was introduced with contributions from scheme members being based
on how much pay falls into each tier. This is designed to give more equality between the cost and benefits of scheme
membership. The respective tiers and contribution rates paid by pension scheme members towards their pensions are as
follows:
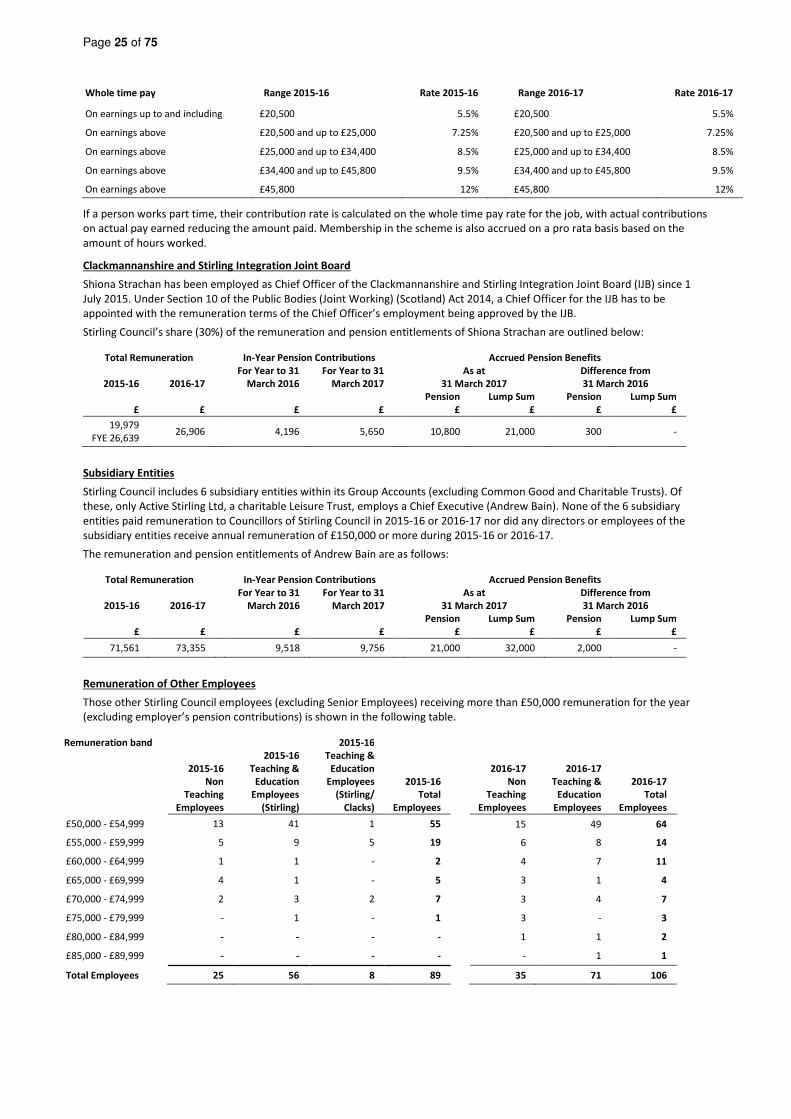
Page 25 of 75
Whole time pay Range 2015-16 Rate 2015-16 Range 2016-17 Rate 2016-17
On earnings up to and including
£19,044
£20,500 5.5% £20,500 5.5%
On earnings above £20,500 and up to £25,000 7.25% £20,500 and up to £25,000 7.25%
On earnings above £25,000 and up to £34,400 8.5% £25,000 and up to £34,400 8.5%
On earnings above £34,400 and up to £45,800 9.5% £34,400 and up to £45,800 9.5%
On earnings above £45,800 12% £45,800 12%
If a person works part time, their contribution rate is calculated on the whole time pay rate for the job, with actual contributions
on actual pay earned reducing the amount paid. Membership in the scheme is also accrued on a pro rata basis based on the
amount of hours worked.
Clackmannanshire and Stirling Integration Joint Board
Shiona Strachan has been employed as Chief Officer of the Clackmannanshire and Stirling Integration Joint Board (IJB) since 1
July 2015. Under Section 10 of the Public Bodies (Joint Working) (Scotland) Act 2014, a Chief Officer for the IJB has to be
appointed with the remuneration terms of the Chief Officer’s employment being approved by the IJB.
Stirling Council’s share (30%) of the remuneration and pension entitlements of Shiona Strachan are outlined below:
Total Remuneration In-Year Pension Contributions Accrued Pension Benefits
2015-16 2016-17
For Year to 31
March 2016
For Year to 31
March 2017
As at
31 March 2017
Difference from
31 March 2016
£ £ £ £
Pension
£
Lump Sum
£
Pension
£
Lump Sum
£
19,979
FYE 26,639 26,906 4,196 5,650 10,800 21,000 300 -
Subsidiary Entities
Stirling Council includes 6 subsidiary entities within its Group Accounts (excluding Common Good and Charitable Trusts). Of
these, only Active Stirling Ltd, a charitable Leisure Trust, employs a Chief Executive (Andrew Bain). None of the 6 subsidiary
entities paid remuneration to Councillors of Stirling Council in 2015-16 or 2016-17 nor did any directors or employees of the
subsidiary entities receive annual remuneration of £150,000 or more during 2015-16 or 2016-17.
The remuneration and pension entitlements of Andrew Bain are as follows:
Total Remuneration In-Year Pension Contributions Accrued Pension Benefits
2015-16 2016-17
For Year to 31
March 2016
For Year to 31
March 2017
As at
31 March 2017
Difference from
31 March 2016
£ £ £ £
Pension
£
Lump Sum
£
Pension
£
Lump Sum
£
71,561 73,355 9,518 9,756 21,000 32,000 2,000 -
Remuneration of Other Employees
Those other Stirling Council employees (excluding Senior Employees) receiving more than £50,000 remuneration for the year
(excluding employer’s pension contributions) is shown in the following table.
Remuneration band
2015-16
Non
Teaching
Employees
2015-16
Teaching &
Education
Employees
(Stirling)
2015-16
Teaching &
Education
Employees
(Stirling/
Clacks)
2015-16
Total
Employees
2016-17
Non
Teaching
Employees
2016-17
Teaching &
Education
Employees
2016-17
Total
Employees
£50,000 - £54,999 13 41 1 55 15 49 64
£55,000 - £59,999 5 9 5 19 6 8 14
£60,000 - £64,999 1 1 - 2 4 7 11
£65,000 - £69,999 4 1 - 5 3 1 4
£70,000 - £74,999 2 3 2 7 3 4 7
£75,000 - £79,999 - 1 - 1 3 - 3
£80,000 - £84,999 - - - - 1 1 2
£85,000 - £89,999 - - - - - 1 1
Total Employees 25 56 8 89 35 71 106
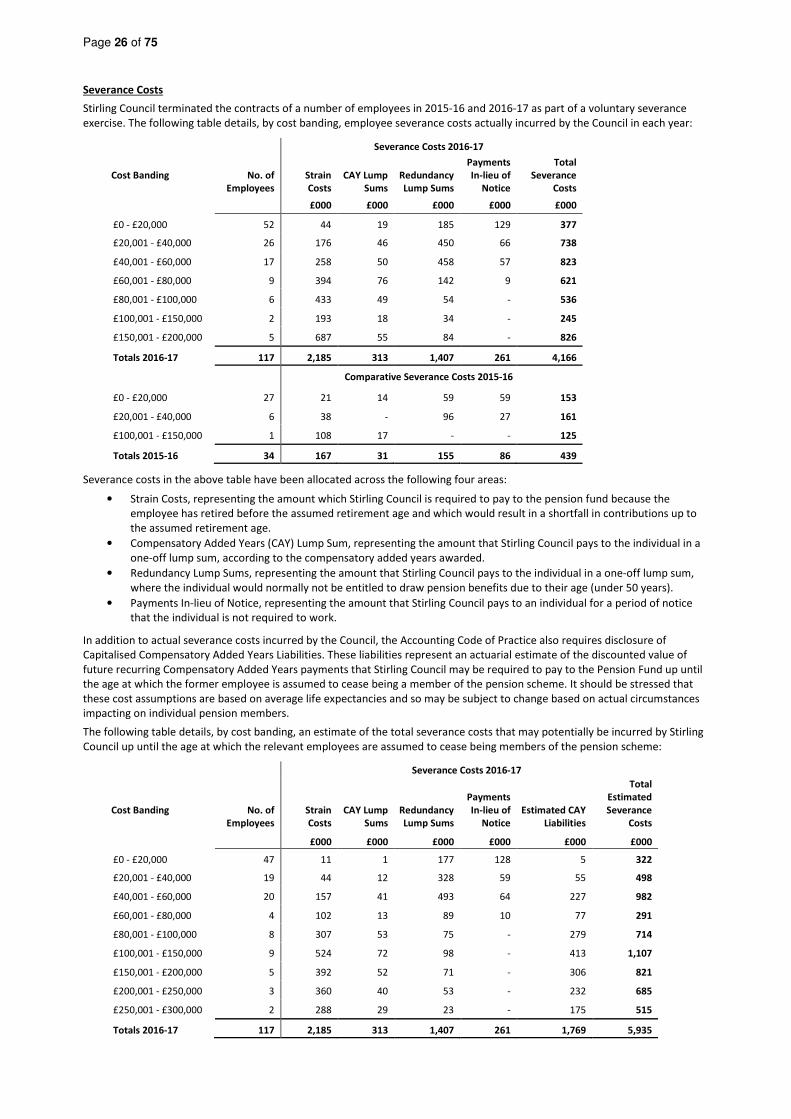
Page 26 of 75
Severance Costs
Stirling Council terminated the contracts of a number of employees in 2015-16 and 2016-17 as part of a voluntary severance
exercise. The following table details, by cost banding, employee severance costs actually incurred by the Council in each year:
Severance Costs 2016-17
Cost Banding
No. of
Employees
Strain
Costs
CAY Lump
Sums
Redundancy
Lump Sums
Payments
In-lieu of
Notice
Total
Severance
Costs
£000 £000 £000 £000 £000
£0 - £20,000 52 44 19 185 129 377
£20,001 - £40,000 26 176 46 450 66 738
£40,001 - £60,000 17 258 50 458 57 823
£60,001 - £80,000 9 394 76 142 9 621
£80,001 - £100,000 6 433 49 54 - 536
£100,001 - £150,000 2 193 18 34 - 245
£150,001 - £200,000 5 687 55 84 - 826
Totals 2016-17 117 2,185 313 1,407 261 4,166
Comparative Severance Costs 2015-16
£0 - £20,000 27 21 14 59 59 153
£20,001 - £40,000 6 38 - 96 27 161
£100,001 - £150,000 1 108 17 - - 125
Totals 2015-16 34 167 31 155 86 439
Severance costs in the above table have been allocated across the following four areas:
• Strain Costs, representing the amount which Stirling Council is required to pay to the pension fund because the
employee has retired before the assumed retirement age and which would result in a shortfall in contributions up to
the assumed retirement age.
• Compensatory Added Years (CAY) Lump Sum, representing the amount that Stirling Council pays to the individual in a
one-off lump sum, according to the compensatory added years awarded.
• Redundancy Lump Sums, representing the amount that Stirling Council pays to the individual in a one-off lump sum,
where the individual would normally not be entitled to draw pension benefits due to their age (under 50 years).
• Payments In-lieu of Notice, representing the amount that Stirling Council pays to an individual for a period of notice
that the individual is not required to work.
In addition to actual severance costs incurred by the Council, the Accounting Code of Practice also requires disclosure of
Capitalised Compensatory Added Years Liabilities. These liabilities represent an actuarial estimate of the discounted value of
future recurring Compensatory Added Years payments that Stirling Council may be required to pay to the Pension Fund up until
the age at which the former employee is assumed to cease being a member of the pension scheme. It should be stressed that
these cost assumptions are based on average life expectancies and so may be subject to change based on actual circumstances
impacting on individual pension members.
The following table details, by cost banding, an estimate of the total severance costs that may potentially be incurred by Stirling
Council up until the age at which the relevant employees are assumed to cease being members of the pension scheme:
Severance Costs 2016-17
Cost Banding
No. of
Employees
Strain
Costs
CAY Lump
Sums
Redundancy
Lump Sums
Payments
In-lieu of
Notice
Estimated CAY
Liabilities
Total
Estimated
Severance
Costs
£000 £000 £000 £000 £000 £000
£0 - £20,000 47 11 1 177 128 5 322
£20,001 - £40,000 19 44 12 328 59 55 498
£40,001 - £60,000 20 157 41 493 64 227 982
£60,001 - £80,000 4 102 13 89 10 77 291
£80,001 - £100,000 8 307 53 75 - 279 714
£100,001 - £150,000 9 524 72 98 - 413 1,107
£150,001 - £200,000 5 392 52 71 - 306 821
£200,001 - £250,000 3 360 40 53 - 232 685
£250,001 - £300,000 2 288 29 23 - 175 515
Totals 2016-17 117 2,185 313 1,407 261 1,769 5,935

Page 27 of 75
Comparative Severance Costs 2015-16
Cost Banding
No. of
Employees
Strain
Costs
CAY Lump
Sums
Redundancy
Lump Sums
Payments
In-lieu of
Notice
Estimated CAY
Liabilities
Total
Estimated
Severance
Costs
£000 £000 £000 £000 £000 £000
£0 - £20,000 25 12 2 59 59 - 132
£20,001 - £40,000 6 - 6 96 27 30 159
£40,001 - £60,000 1 9 6 - - 33 48
£60,001 - £80,000 1 38 - - - 27 65
£200,001 - £250,000 1 108 17 - - 99 224
Totals 2015-16 34 167 31 155 86 189 628
Stewart Carruth
Chief Executive
31 August 2017
Scott Farmer
Leader of the Council
31 August 2017
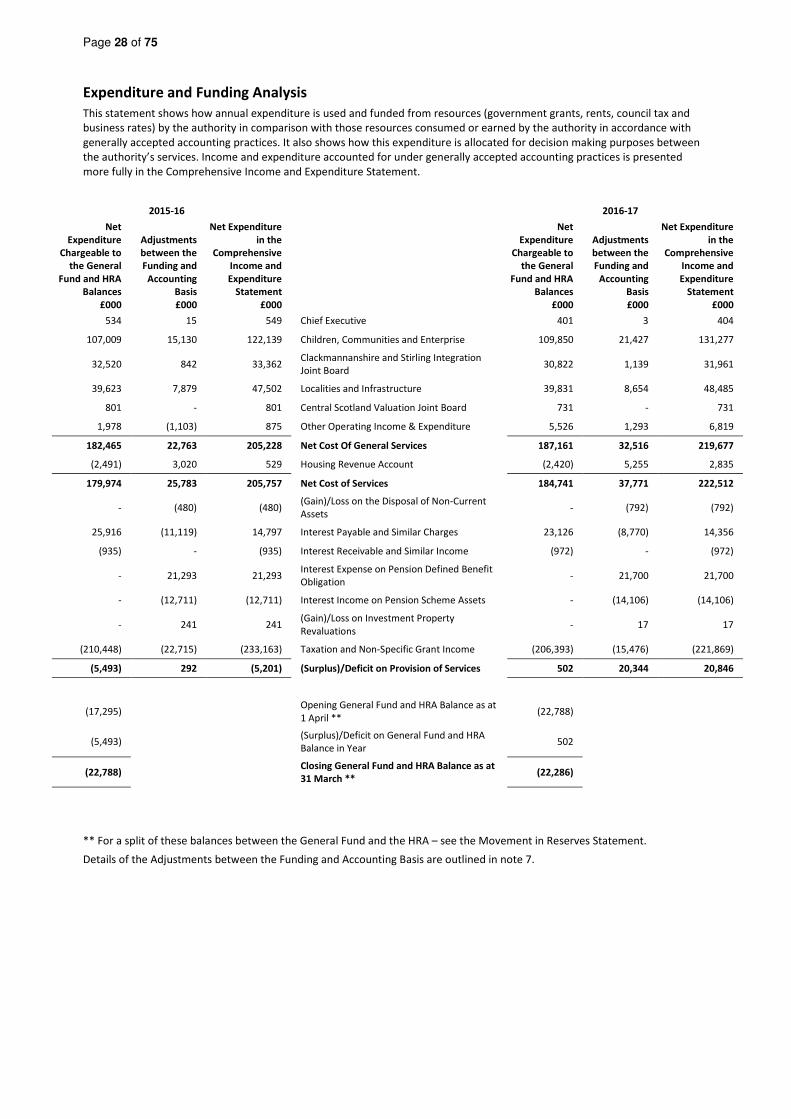
Page 28 of 75
Expenditure and Funding Analysis
This statement shows how annual expenditure is used and funded from resources (government grants, rents, council tax and
business rates) by the authority in comparison with those resources consumed or earned by the authority in accordance with
generally accepted accounting practices. It also shows how this expenditure is allocated for decision making purposes between
the authority’s services. Income and expenditure accounted for under generally accepted accounting practices is presented
more fully in the Comprehensive Income and Expenditure Statement.
2015-16 2016-17
Net
Expenditure
Chargeable to
the General
Fund and HRA
Balances
£000
Adjustments
between the
Funding and
Accounting
Basis
£000
Net Expenditure
in the
Comprehensive
Income and
Expenditure
Statement
£000
Net
Expenditure
Chargeable to
the General
Fund and HRA
Balances
£000
Adjustments
between the
Funding and
Accounting
Basis
£000
Net Expenditure
in the
Comprehensive
Income and
Expenditure
Statement
£000
534 15 549 Chief Executive 401 3 404
107,009 15,130 122,139 Children, Communities and Enterprise 109,850 21,427 131,277
32,520 842 33,362 Clackmannanshire and Stirling Integration
Joint Board 30,822 1,139 31,961
39,623 7,879 47,502 Localities and Infrastructure 39,831 8,654 48,485
801 - 801 Central Scotland Valuation Joint Board 731 - 731
1,978 (1,103) 875 Other Operating Income & Expenditure 5,526 1,293 6,819
182,465 22,763 205,228 Net Cost Of General Services 187,161 32,516 219,677
(2,491) 3,020 529 Housing Revenue Account (2,420) 5,255 2,835
179,974 25,783 205,757 Net Cost of Services 184,741 37,771 222,512
- (480) (480) (Gain)/Loss on the Disposal of Non-Current
Assets - (792) (792)
25,916 (11,119) 14,797 Interest Payable and Similar Charges 23,126 (8,770) 14,356
(935) - (935) Interest Receivable and Similar Income (972) - (972)
- 21,293 21,293 Interest Expense on Pension Defined Benefit
Obligation - 21,700 21,700
- (12,711) (12,711) Interest Income on Pension Scheme Assets - (14,106) (14,106)
- 241 241 (Gain)/Loss on Investment Property
Revaluations - 17 17
(210,448) (22,715) (233,163) Taxation and Non-Specific Grant Income (206,393) (15,476) (221,869)
(5,493) 292 (5,201) (Surplus)/Deficit on Provision of Services 502 20,344 20,846
(17,295) Opening General Fund and HRA Balance as at
1 April ** (22,788)
(5,493) (Surplus)/Deficit on General Fund and HRA
Balance in Year 502
(22,788) Closing General Fund and HRA Balance as at
31 March ** (22,286)
** For a split of these balances between the General Fund and the HRA – see the Movement in Reserves Statement.
Details of the Adjustments between the Funding and Accounting Basis are outlined in note 7.
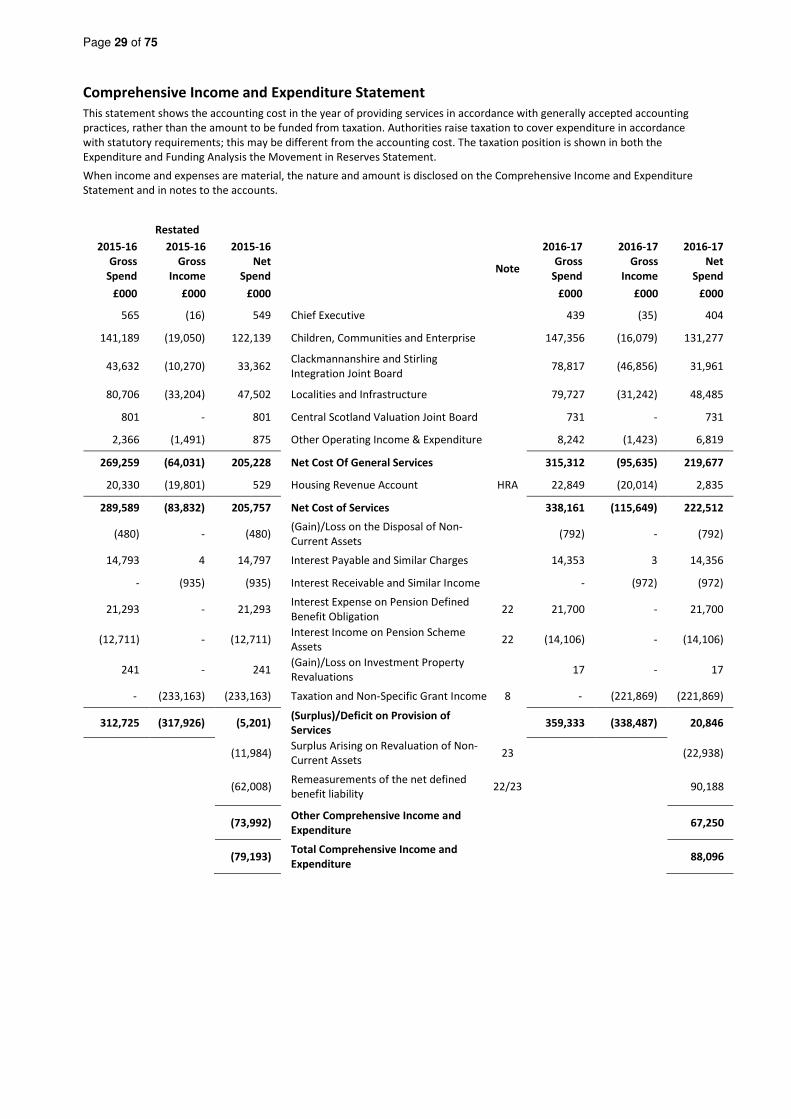
Page 29 of 75
Comprehensive Income and Expenditure Statement
This statement shows the accounting cost in the year of providing services in accordance with generally accepted accounting
practices, rather than the amount to be funded from taxation. Authorities raise taxation to cover expenditure in accordance
with statutory requirements; this may be different from the accounting cost. The taxation position is shown in both the
Expenditure and Funding Analysis the Movement in Reserves Statement.
When income and expenses are material, the nature and amount is disclosed on the Comprehensive Income and Expenditure
Statement and in notes to the accounts.
Restated
2015-16 2015-16 2015-16 2016-17 2016-17 2016-17
Gross
Spend
Gross
Income
Net
Spend Note
Gross
Spend
Gross
Income
Net
Spend
£000 £000 £000 £000 £000 £000
565 (16) 549 Chief Executive 439 (35) 404
141,189 (19,050) 122,139 Children, Communities and Enterprise 147,356 (16,079) 131,277
43,632 (10,270) 33,362 Clackmannanshire and Stirling
Integration Joint Board 78,817 (46,856) 31,961
80,706 (33,204) 47,502 Localities and Infrastructure 79,727 (31,242) 48,485
801 - 801 Central Scotland Valuation Joint Board 731 - 731
2,366 (1,491) 875 Other Operating Income & Expenditure 8,242 (1,423) 6,819
269,259 (64,031) 205,228 Net Cost Of General Services 315,312 (95,635) 219,677
20,330 (19,801) 529 Housing Revenue Account HRA 22,849 (20,014) 2,835
289,589 (83,832) 205,757 Net Cost of Services 338,161 (115,649) 222,512
(480) - (480) (Gain)/Loss on the Disposal of Non-
Current Assets (792) - (792)
14,793 4 14,797 Interest Payable and Similar Charges 14,353 3 14,356
- (935) (935) Interest Receivable and Similar Income - (972) (972)
21,293 - 21,293 Interest Expense on Pension Defined
Benefit Obligation 22 21,700 - 21,700
(12,711) - (12,711) Interest Income on Pension Scheme
Assets 22 (14,106) - (14,106)
241 - 241 (Gain)/Loss on Investment Property
Revaluations 17 - 17
- (233,163) (233,163) Taxation and Non-Specific Grant Income 8 - (221,869) (221,869)
312,725 (317,926) (5,201) (Surplus)/Deficit on Provision of
Services 359,333 (338,487) 20,846
(11,984) Surplus Arising on Revaluation of Non-
Current Assets 23 (22,938)
(62,008) Remeasurements of the net defined
benefit liability 22/23 90,188
(73,992) Other Comprehensive Income and
Expenditure 67,250
(79,193) Total Comprehensive Income and
Expenditure 88,096

Page 30 of 75
Movement in Reserves Statement
This statement shows the movement from the start of the year to the end on the different reserves held by the authority,
analysed into ‘usable reserves’ (i.e. those that can be applied to fund expenditure or reduce local taxation) and other ‘unusable
reserves’. The statement shows how the movements in year of the authority’s reserves are broken down between gains and
losses incurred in accordance with generally accepted accounting practices and the statutory adjustments required to return to
the amounts chargeable to council tax (or rents) for the year. The Net Increase/Decrease line shows the statutory General Fund
Balance and Housing Revenue Account Balance movements in the year following those adjustments.
Note
General
Fund
Balance
£000
Housing
Revenue
Account
£000
Capital
Receipts
Reserve
£000
Repairs
and
Renewals
Fund
£000
Insurance
Fund
£000
Capital
Grants
Unapplied
Account
£000
Total
Usable
Reserves
£000
Unusable
Reserves
£000
Total
Council
Reserves
£000
Balance b/fwd at 1/4/2015 (17,059) (236) (4,335) (1,414) (1,136) (50) (24,230) (160,214) (184,444)
Movement in Reserves 2015-16
(Surplus)/deficit on provision of
Services CIES (5,096) (105) - - - - (5,201) - (5,201)
Other Comprehensive
Expenditure/(Income) CIES - - - - - - 0 (73,992) (73,992)
Total Comprehensive
Expenditure/(Income) (5,096) (105) - - - - (5,201) (73,992) (79,193)
Adjustments between accounting
basis & funding basis under
regulations
10 (313) (145) 596 - - (778) (640) 640 0
Transfers to/from Other Statutory
Reserves 166 - - (191) 25 - 0 - 0
(Increase)/Decrease in 2015-16 (5,243) (250) 596 (191) 25 (778) (5,841) (73,352) (79,193)
Balance c/fwd at 31/3/2016 (22,302) (486) (3,739) (1,605) (1,111) (828) (30,071) (233,566) (263,637)
Balance b/fwd at 1/4/2016 (22,302) (486) (3,739) (1,605) (1,111) (828) (30,071) (233,566) (263,637)
Movement in Reserves 2016-17
(Surplus)/deficit on provision of
Services CIES 18,627 2,219 - - - - 20,846 - 20,846
Other Comprehensive
Expenditure/(Income) CIES - - - - - - 0 67,250 67,250
Total Comprehensive
Expenditure/(Income) 18,627 2,219 - - - - 20,846 67,250 88,096
Adjustments between accounting
basis & funding basis under
regulations
10 (18,783) (2,469) 3,004 - - 828 (17,420) 17,420 0
Transfers to/from Other Statutory
Reserves 908 - - (248) (660) - 0 - 0
(Increase)/Decrease in 2016-17 752 (250) 3,004 (248) (660) 828 3,426 84,670 88,096
Balance c/fwd at 31/3/2017 (21,550) (736) (735) (1,853) (1,771) - (26,645) (148,896) (175,541)
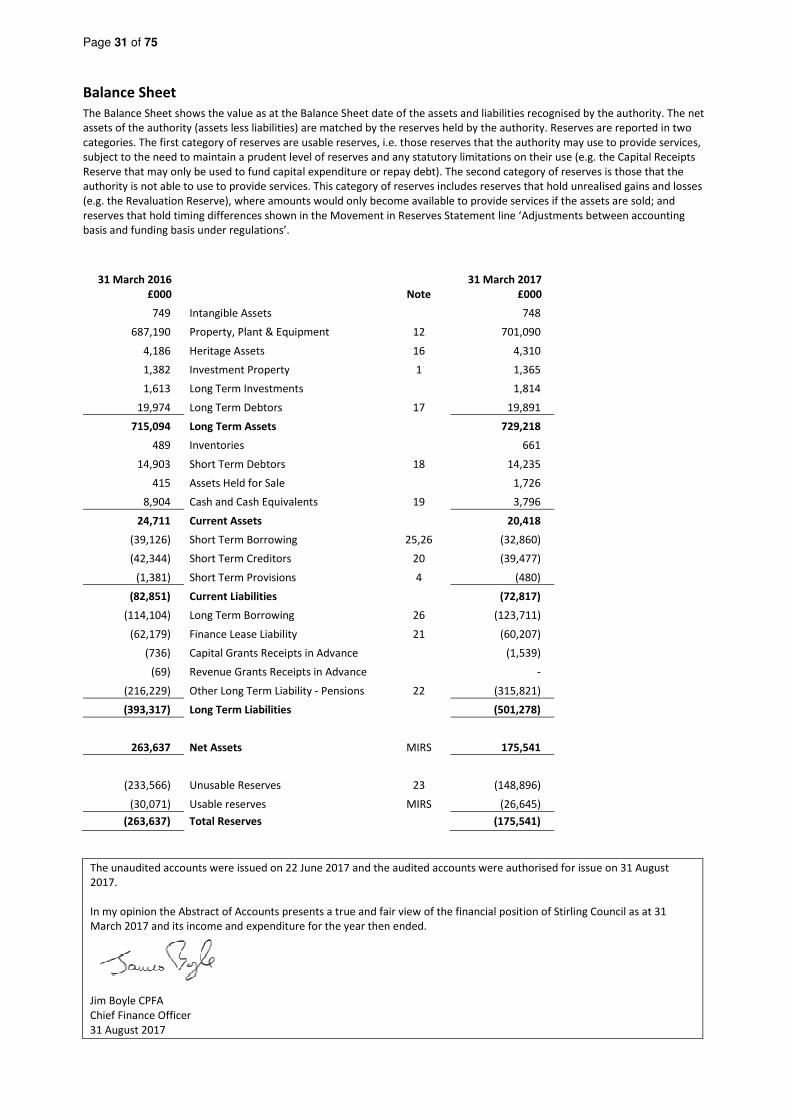
Page 31 of 75
Balance Sheet
The Balance Sheet shows the value as at the Balance Sheet date of the assets and liabilities recognised by the authority. The net
assets of the authority (assets less liabilities) are matched by the reserves held by the authority. Reserves are reported in two
categories. The first category of reserves are usable reserves, i.e. those reserves that the authority may use to provide services,
subject to the need to maintain a prudent level of reserves and any statutory limitations on their use (e.g. the Capital Receipts
Reserve that may only be used to fund capital expenditure or repay debt). The second category of reserves is those that the
authority is not able to use to provide services. This category of reserves includes reserves that hold unrealised gains and losses
(e.g. the Revaluation Reserve), where amounts would only become available to provide services if the assets are sold; and
reserves that hold timing differences shown in the Movement in Reserves Statement line ‘Adjustments between accounting
basis and funding basis under regulations’.
31 March 2016
£000 Note
31 March 2017
£000
749 Intangible Assets 748
687,190 Property, Plant & Equipment 12 701,090
4,186 Heritage Assets 16 4,310
1,382 Investment Property 1 1,365
1,613 Long Term Investments 1,814
19,974 Long Term Debtors 17 19,891
715,094 Long Term Assets 729,218
489 Inventories 661
14,903 Short Term Debtors 18 14,235
415 Assets Held for Sale 1,726
8,904 Cash and Cash Equivalents 19 3,796
24,711 Current Assets 20,418
(39,126) Short Term Borrowing 25,26 (32,860)
(42,344) Short Term Creditors 20 (39,477)
(1,381) Short Term Provisions 4 (480)
(82,851) Current Liabilities (72,817)
(114,104) Long Term Borrowing 26 (123,711)
(62,179) Finance Lease Liability 21 (60,207)
(736) Capital Grants Receipts in Advance (1,539)
(69) Revenue Grants Receipts in Advance -
(216,229) Other Long Term Liability - Pensions 22 (315,821)
(393,317) Long Term Liabilities (501,278)
263,637 Net Assets MIRS 175,541
(233,566) Unusable Reserves 23 (148,896)
(30,071) Usable reserves MIRS (26,645)
(263,637) Total Reserves (175,541)
The unaudited accounts were issued on 22 June 2017 and the audited accounts were authorised for issue on 31 August
2017.
In my opinion the Abstract of Accounts presents a true and fair view of the financial position of Stirling Council as at 31
March 2017 and its income and expenditure for the year then ended.
Jim Boyle CPFA
Chief Finance Officer
31 August 2017

Page 32 of 75
Cash Flow Statement
The Cash Flow Statement shows the changes in cash and cash equivalents of the authority during the reporting period. The
statement shows how the authority generates and uses cash and cash equivalents by classifying cash flows as operating,
investing and financing activities. The amount of net cash flows arising from operating activities is a key indicator of the extent
to which the operations of the authority are funded by way of taxation and grant income or from the recipients of services
provided by the authority. Investing activities represent the extent to which cash outflows have been made for resources which
are intended to contribute to the authority’s future service delivery. Cash flows arising from financing activities are useful in
predicting claims on future cash flows by providers of capital (i.e. borrowing) to the authority.
2015-16
£000 Note
2016-17
£000
(5,201) Net (Surplus)/Deficit on the Provision of Services MIRS 20,846
Adjustment for Non-Cash Movements
(33,573) Depreciation and impairments (45,762)
(6,440) Non current asset adjustments (1,960)
(11,502) Retirement benefits (9,404)
(27) Net movement in stock (171)
6,838 Net movement in debtors (780)
(1,608) Net movement in creditors and provisions 3,711
622 Other Internal accounts adjustments 839
(45,690) (53,527)
Adjustments for Items Shown Within Investing and Financing Activities
6,679 Proceeds from the sale of property, plant and equipment, investment property and
intangible assets 2,734
22,715 Capital grants and contributions applied to capital financing 8 15,476
2,593 Other payments for financing activities (net contribution to/from NDR Pool) NDR 1,280
31,987 19,490
(18,904) Net Cash Inflows from Operating Activities * (13,190)
46,186 Purchase of property, plant and equipment, investment property and intangible assets 40,406
(6,679) Proceeds from the sale of property, plant and equipment, investment property and
intangible assets (2,734)
(22,715) Capital grants and contributions applied to capital financing (16,552)
16,792 Net Cash Outflows from Investing Activities 21,120
(87,657) Cash receipts of short and long-term borrowing (93,752)
86,098 Cash repayments of short and long-term borrowing 90,237
2,114 Cash payments for the reduction of the outstanding liabilities relating to finance leases
and on-balance sheet PFI contracts 21 1,974
(2,593) Other payments/receipts for financing activities (net contribution to/from NDR Pool) NDR (1,280)
(2,038) Net Cash (In)/Outflows from Financing Activities (2,821
(4,150) Net (Increase) / Decrease in Cash and Cash Equivalents 5,108
4,754 Cash and Cash Equivalents at the Beginning of the Reporting Period 8,904
8,904 Cash and Cash Equivalents at the End of the Reporting Period 19 3,796
* The cash flows from operating activities in 2016-17 include interest received of £0.640m (2015-16, £0.644m) and interest paid
of £14.314m (2015-16, £14.794m).

Page 33 of 75
Notes to the Single Entity Financial Statements
1. General Accounting Policies (where there is no accompanying note)
General Principles
The Statement of Accounts summarises Stirling Council’s transactions for the 2016-17 financial year and its position as at
31 March 2017. Stirling Council is required to prepare an annual Statement of Accounts in accordance with the Local
Authority Accounts (Scotland) Regulations 2014. Section 12 of the Local Government in Scotland Act 2003 also requires
the Statement of Accounts to be prepared in accordance with proper accounting practices. These practices comprise the
Code of Practice on Local Authority Accounting in the United Kingdom 2016-17 (The Code), supported by International
Financial Reporting Standards (IFRS) and statutory guidance issued under section 12 of the Local Government in Scotland
Act 2003.
The accounting convention adopted in the Statement of Accounts is principally historical cost, modified by the
revaluation of certain categories of non-current assets and financial instruments.
Accounting Concepts and Principles
The accounting concepts followed in the application of accounting policies are:
• Accruals - sums due to or from Stirling Council during the year are included, whether or not the cash has
actually been received or paid in the year.
• Going concern - this assumes that Stirling Council will continue in existence for the foreseeable future.
The accounting concepts are supported by qualitative characteristics prescribed by the International Accounting
Standards Board’s Conceptual Framework for Financial Reporting:
• Two fundamental characteristics (relevance and faithful representation, of which faithful representation has
three characteristics - completeness, neutrality and freedom from error); and
• Four enhancement characteristics, which complement the fundamental characteristics (comparable, verifiable,
timely and understandable).
Revenue Recognition
Revenue from the sale of goods is recognised when Stirling Council transfers the significant risks and rewards of
ownership to the purchaser and it is probable that economic benefits or service potential associated with the
transaction will flow to the Council.
Revenue from the provision of services is recognised when Stirling Council can measure reliably the percentage of
completion of the transaction and it is probable that economic benefits or service potential associated with the
transaction will flow to the Council.
Revenue from Council Tax and Non Domestic Rates is recognised when it is probable that the economic benefits or
service potential associated with the transaction will flow to Stirling Council and the amount of revenue can be
measured reliably. Revenue is measured at the full amount receivable (net of any impairment losses) as they are non-
contractual, non-exchange transactions and there can be no difference between the delivery and payment dates.
Government Grants, Third Party Contributions and Donations
Whether paid on account, by instalments or in arrears, government grants and third party contributions and donations
are recognised as due to the Council when there is reasonable assurance that the Council will comply with the conditions
attached to the payments and the grants or contributions will be received.
Monies advanced as grants and contributions for which conditions have not been satisfied are carried in the Balance
Sheet as creditors. When conditions are satisfied, the grant or contribution is credited to the relevant service line (for
revenue grants) or Taxation and Non-Specific Grant Income (for non-ring-fenced revenue grants and all capital grants).
Where capital grants are credited to the CIES, they are reversed out of the General Fund Balance in the Movement in
Reserves Statement.
When the grant has yet to be used to finance capital expenditure, it is posted to the Capital Grants Unapplied Account.
When it has been applied, it is posted to the Capital Adjustment Account. Amounts in the Capital Grants Unapplied
Account are transferred to the Capital Adjustment Account once they have been applied.
Intangible Assets
Expenditure on intangible assets that do not have physical substance but are controlled by Stirling Council as a result of
past events (e.g. software licences) is capitalised when it is expected that future economic benefits or service potential
will flow from the intangible asset to the Council. The depreciable amount of an intangible asset is amortised over its
useful life to the relevant service line(s) in the Comprehensive Income and Expenditure Statement.
Surplus Assets
Assets that are not being used to deliver services, but which do not meet the criteria to be classified as Investment
Properties or Assets Held for Sale, i.e. Surplus assets, are measured at fair value (at highest and best use) based on the
price that would be received to sell an asset in an orderly transaction between market participants at the measurement
date.
Investment Properties
Investment properties are those that are used solely to earn rentals and/or for capital appreciation. The definition is not
met if the property is used in any way to facilitate the delivery of services or production of goods or is held for sale.

Page 34 of 75
Investment properties are measured initially at cost and subsequently at fair value (highest and best use), based on the
price that would be received to sell an asset in an orderly transaction between market participants at the measurement
date. Properties are not depreciated but are revalued annually according to market conditions at the year-end. Gains
and losses on revaluation and/or disposals are posted to the Comprehensive Income and Expenditure Statement.
Rentals received in relation to investment properties are credited to the Comprehensive Income and Expenditure
Statement and result in a gain for the General Fund Balance. However, revaluation and disposal gains and losses are not
permitted by statutory arrangements to have an impact on the General Fund Balance. The gains and losses are therefore
reversed out of the General Fund Balance in the Movement in Reserves Statement and posted to the Capital Adjustment
Account with sale proceeds being posted to Capital Receipts Reserve.
Stirling Council currently has 2 investment properties being the Stirling Highland Hotel and the Bio-Reliance Building at
Stirling University with a combined carrying value of £1.365m as at 31 March 2017 (£1.382m, 31 March 2016). The
investment properties were revalued in 2016-17 with a net loss on revaluation of £0.017m.
Rental income received during 2016-17 from Investment Properties was £0.180m (2015-16, £0.182m). Stirling Council
incurred no direct expenses relating to these properties.
Inventories
Inventories are generally included in the Balance Sheet at the lower of cost and net realisable value. Certain inventories
have been valued at latest invoice price. The difference between the policy adopted for inventories and that required by
the Accounting Code of Practice is not considered material.
Assets Held for Sale
At the balance sheet date, when it is probable that the carrying amount of an asset will be recovered through a sale
transaction, it is reclassified as an Asset Held for Sale. The asset is revalued immediately before reclassification and then
carried at the lower of this amount and fair value less costs to sell. Depreciation is not charged on Assets Held for Sale.
If assets no longer meet the criteria to be classified as Assets Held for Sale, they are reclassified back to Non-current
Assets and valued at the lower of their carrying amount before they were classified as held for sale; adjusted for
depreciation, amortisation or revaluations that would have been recognised had they not been classified as Held for Sale
and their recoverable amount at the date of the decision not to sell. Assets that are to be abandoned or scrapped are
not reclassified as Assets Held for Sale.
Provisions
Provisions are made where an event has taken place that gives Stirling Council a legal or constructive obligation that
probably requires settlement by a transfer of economic benefits or service potential and a reliable estimate can be made
of the amount of the obligation. Provisions are charged as an expense to the appropriate service line in the
Comprehensive Income and Expenditure Statement in the year that Stirling Council becomes aware of the obligation,
based on the best estimate of the likely settlement. When payments are eventually made, they are charged to the
provision carried in the Balance Sheet. Estimated settlements are reviewed at the end of each financial year and
appropriate adjustments made to the level of provision.
2. Accounting Standards That Have Been Issued but Have Not Yet Been Adopted
The Code requires the disclosure of information relating to the impact of an accounting change that will be required by a
new standard that has been issued but not yet adopted. This applies to the adoption of the following new or amended
standards within the 2017/18 Code:
• Amendment to the reporting of pension fund scheme transaction costs.
• Amendment to the reporting of investments within defined benefit pension scheme disclosures.
The Code requires implementation from 1 April 2017 and there is therefore no impact on the 2016-17 financial
statements.
3. Critical Judgements in Applying Accounting Policies
In applying accounting policies, Stirling Council has had to make certain judgements about complex transactions or those
involving uncertainty about future events. The critical judgements made in the Statement of Accounts are:
• Public Sector Funding - There is a high degree of uncertainty about future levels of funding for local
government. However, Stirling Council has determined that this uncertainty is not yet sufficient to provide an
indication that the assets of the Council might be impaired as a result of a need to close facilities and reduce
levels of service provision.
• Employee Benefits Provision - Stirling Council has used a sampling approach to calculating the provision for
non-teaching employees annual leave.
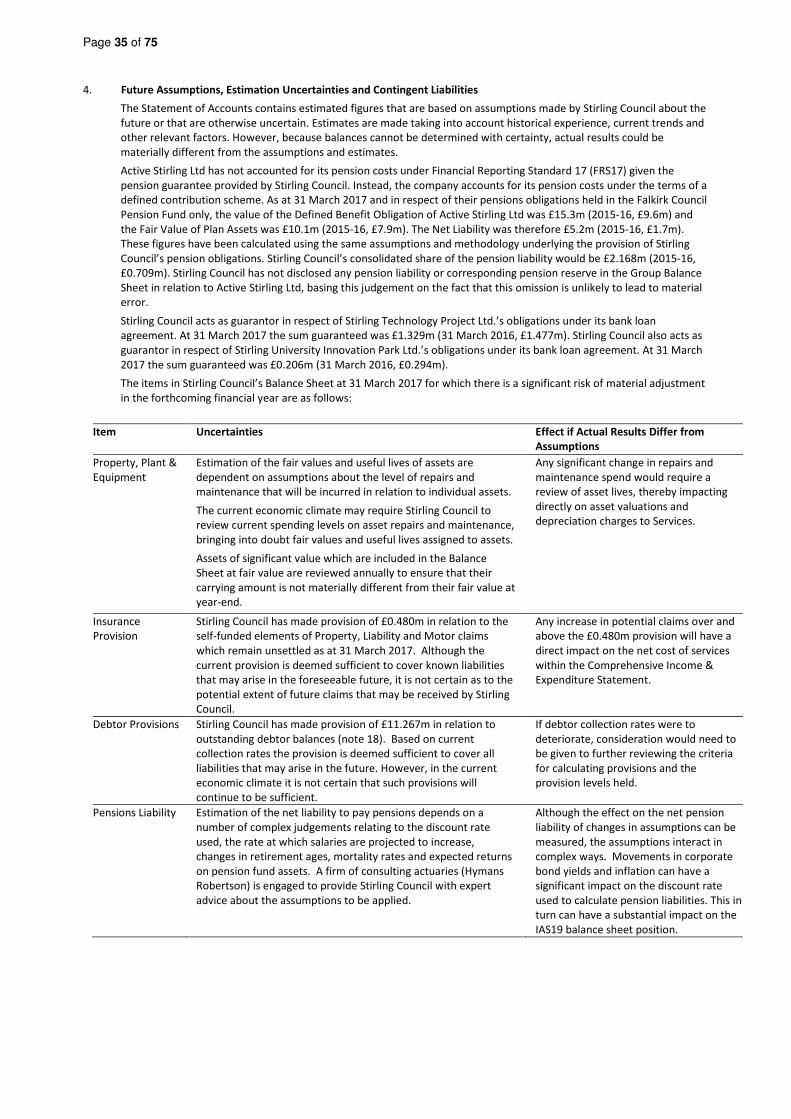
Page 35 of 75
4. Future Assumptions, Estimation Uncertainties and Contingent Liabilities
The Statement of Accounts contains estimated figures that are based on assumptions made by Stirling Council about the
future or that are otherwise uncertain. Estimates are made taking into account historical experience, current trends and
other relevant factors. However, because balances cannot be determined with certainty, actual results could be
materially different from the assumptions and estimates.
Active Stirling Ltd has not accounted for its pension costs under Financial Reporting Standard 17 (FRS17) given the
pension guarantee provided by Stirling Council. Instead, the company accounts for its pension costs under the terms of a
defined contribution scheme. As at 31 March 2017 and in respect of their pensions obligations held in the Falkirk Council
Pension Fund only, the value of the Defined Benefit Obligation of Active Stirling Ltd was £15.3m (2015-16, £9.6m) and
the Fair Value of Plan Assets was £10.1m (2015-16, £7.9m). The Net Liability was therefore £5.2m (2015-16, £1.7m).
These figures have been calculated using the same assumptions and methodology underlying the provision of Stirling
Council’s pension obligations. Stirling Council’s consolidated share of the pension liability would be £2.168m (2015-16,
£0.709m). Stirling Council has not disclosed any pension liability or corresponding pension reserve in the Group Balance
Sheet in relation to Active Stirling Ltd, basing this judgement on the fact that this omission is unlikely to lead to material
error.
Stirling Council acts as guarantor in respect of Stirling Technology Project Ltd.’s obligations under its bank loan
agreement. At 31 March 2017 the sum guaranteed was £1.329m (31 March 2016, £1.477m). Stirling Council also acts as
guarantor in respect of Stirling University Innovation Park Ltd.’s obligations under its bank loan agreement. At 31 March
2017 the sum guaranteed was £0.206m (31 March 2016, £0.294m).
The items in Stirling Council’s Balance Sheet at 31 March 2017 for which there is a significant risk of material adjustment
in the forthcoming financial year are as follows:
Item Uncertainties Effect if Actual Results Differ from
Assumptions
Property, Plant &
Equipment
Estimation of the fair values and useful lives of assets are
dependent on assumptions about the level of repairs and
maintenance that will be incurred in relation to individual assets.
The current economic climate may require Stirling Council to
review current spending levels on asset repairs and maintenance,
bringing into doubt fair values and useful lives assigned to assets.
Assets of significant value which are included in the Balance
Sheet at fair value are reviewed annually to ensure that their
carrying amount is not materially different from their fair value at
year-end.
Any significant change in repairs and
maintenance spend would require a
review of asset lives, thereby impacting
directly on asset valuations and
depreciation charges to Services.
Insurance
Provision
Stirling Council has made provision of £0.480m in relation to the
self-funded elements of Property, Liability and Motor claims
which remain unsettled as at 31 March 2017. Although the
current provision is deemed sufficient to cover known liabilities
that may arise in the foreseeable future, it is not certain as to the
potential extent of future claims that may be received by Stirling
Council.
Any increase in potential claims over and
above the £0.480m provision will have a
direct impact on the net cost of services
within the Comprehensive Income &
Expenditure Statement.
Debtor Provisions
Stirling Council has made provision of £11.267m in relation to
outstanding debtor balances (note 18). Based on current
collection rates the provision is deemed sufficient to cover all
liabilities that may arise in the future. However, in the current
economic climate it is not certain that such provisions will
continue to be sufficient.
If debtor collection rates were to
deteriorate, consideration would need to
be given to further reviewing the criteria
for calculating provisions and the
provision levels held.
Pensions Liability Estimation of the net liability to pay pensions depends on a
number of complex judgements relating to the discount rate
used, the rate at which salaries are projected to increase,
changes in retirement ages, mortality rates and expected returns
on pension fund assets. A firm of consulting actuaries (Hymans
Robertson) is engaged to provide Stirling Council with expert
advice about the assumptions to be applied.
Although the effect on the net pension
liability of changes in assumptions can be
measured, the assumptions interact in
complex ways. Movements in corporate
bond yields and inflation can have a
significant impact on the discount rate
used to calculate pension liabilities. This in
turn can have a substantial impact on the
IAS19 balance sheet position.
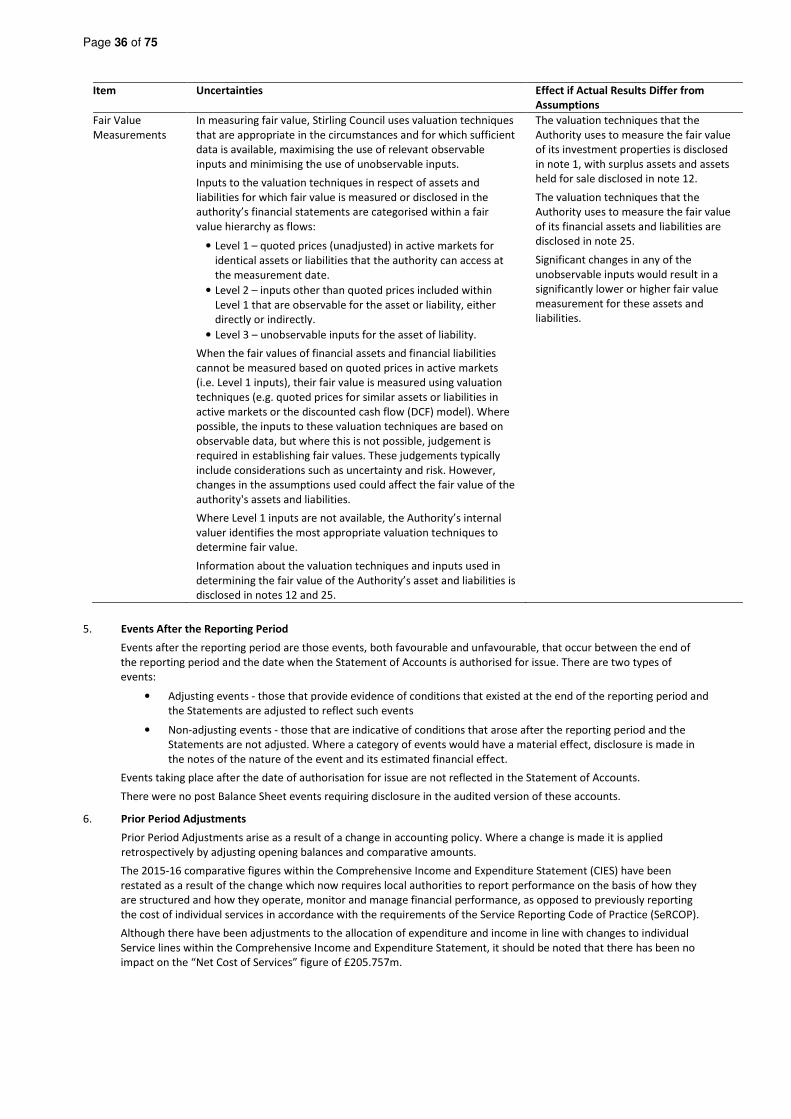
Page 36 of 75
Item Uncertainties Effect if Actual Results Differ from
Assumptions
Fair Value
Measurements
In measuring fair value, Stirling Council uses valuation techniques
that are appropriate in the circumstances and for which sufficient
data is available, maximising the use of relevant observable
inputs and minimising the use of unobservable inputs.
Inputs to the valuation techniques in respect of assets and
liabilities for which fair value is measured or disclosed in the
authority’s financial statements are categorised within a fair
value hierarchy as flows:
• Level 1 – quoted prices (unadjusted) in active markets for
identical assets or liabilities that the authority can access at
the measurement date.
• Level 2 – inputs other than quoted prices included within
Level 1 that are observable for the asset or liability, either
directly or indirectly.
• Level 3 – unobservable inputs for the asset of liability.
When the fair values of financial assets and financial liabilities
cannot be measured based on quoted prices in active markets
(i.e. Level 1 inputs), their fair value is measured using valuation
techniques (e.g. quoted prices for similar assets or liabilities in
active markets or the discounted cash flow (DCF) model). Where
possible, the inputs to these valuation techniques are based on
observable data, but where this is not possible, judgement is
required in establishing fair values. These judgements typically
include considerations such as uncertainty and risk. However,
changes in the assumptions used could affect the fair value of the
authority's assets and liabilities.
Where Level 1 inputs are not available, the Authority’s internal
valuer identifies the most appropriate valuation techniques to
determine fair value.
Information about the valuation techniques and inputs used in
determining the fair value of the Authority’s asset and liabilities is
disclosed in notes 12 and 25.
The valuation techniques that the
Authority uses to measure the fair value
of its investment properties is disclosed
in note 1, with surplus assets and assets
held for sale disclosed in note 12.
The valuation techniques that the
Authority uses to measure the fair value
of its financial assets and liabilities are
disclosed in note 25.
Significant changes in any of the
unobservable inputs would result in a
significantly lower or higher fair value
measurement for these assets and
liabilities.
5. Events After the Reporting Period
Events after the reporting period are those events, both favourable and unfavourable, that occur between the end of
the reporting period and the date when the Statement of Accounts is authorised for issue. There are two types of
events:
• Adjusting events - those that provide evidence of conditions that existed at the end of the reporting period and
the Statements are adjusted to reflect such events
• Non-adjusting events - those that are indicative of conditions that arose after the reporting period and the
Statements are not adjusted. Where a category of events would have a material effect, disclosure is made in
the notes of the nature of the event and its estimated financial effect.
Events taking place after the date of authorisation for issue are not reflected in the Statement of Accounts.
There were no post Balance Sheet events requiring disclosure in the audited version of these accounts.
6. Prior Period Adjustments
Prior Period Adjustments arise as a result of a change in accounting policy. Where a change is made it is applied
retrospectively by adjusting opening balances and comparative amounts.
The 2015-16 comparative figures within the Comprehensive Income and Expenditure Statement (CIES) have been
restated as a result of the change which now requires local authorities to report performance on the basis of how they
are structured and how they operate, monitor and manage financial performance, as opposed to previously reporting
the cost of individual services in accordance with the requirements of the Service Reporting Code of Practice (SeRCOP).
Although there have been adjustments to the allocation of expenditure and income in line with changes to individual
Service lines within the Comprehensive Income and Expenditure Statement, it should be noted that there has been no
impact on the “Net Cost of Services” figure of £205.757m.
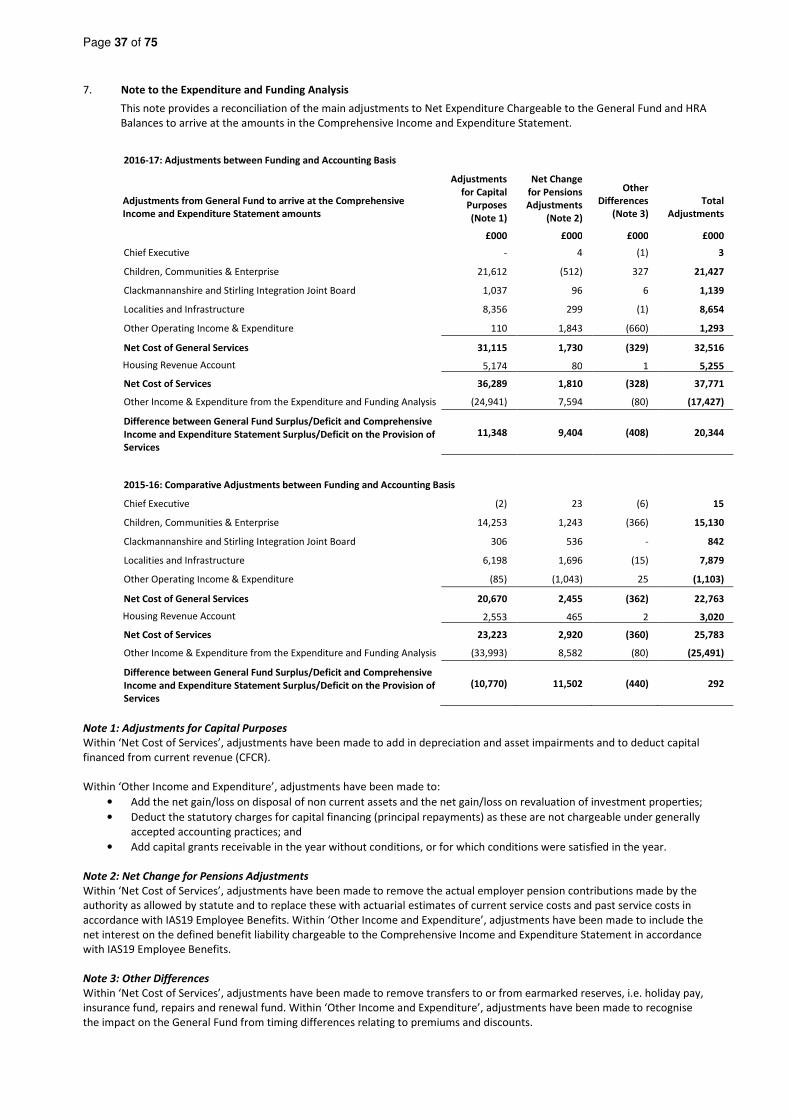
Page 37 of 75
7. Note to the Expenditure and Funding Analysis
This note provides a reconciliation of the main adjustments to Net Expenditure Chargeable to the General Fund and HRA
Balances to arrive at the amounts in the Comprehensive Income and Expenditure Statement.
2016-17: Adjustments between Funding and Accounting Basis
Adjustments from General Fund to arrive at the Comprehensive
Income and Expenditure Statement amounts
Adjustments
for Capital
Purposes
(Note 1)
Net Change
for Pensions
Adjustments
(Note 2)
Other
Differences
(Note 3)
Total
Adjustments
£000 £000 £000 £000
Chief Executive - 4 (1) 3
Children, Communities & Enterprise 21,612 (512) 327 21,427
Clackmannanshire and Stirling Integration Joint Board 1,037 96 6 1,139
Localities and Infrastructure 8,356 299 (1) 8,654
Other Operating Income & Expenditure 110 1,843 (660) 1,293
Net Cost of General Services 31,115 1,730 (329) 32,516
Housing Revenue Account 5,174 80 1 5,255
Net Cost of Services 36,289 1,810 (328) 37,771
Other Income & Expenditure from the Expenditure and Funding Analysis (24,941) 7,594 (80) (17,427)
Difference between General Fund Surplus/Deficit and Comprehensive
Income and Expenditure Statement Surplus/Deficit on the Provision of
Services
11,348 9,404 (408) 20,344
2015-16: Comparative Adjustments between Funding and Accounting Basis
Chief Executive (2) 23 (6) 15
Children, Communities & Enterprise 14,253 1,243 (366) 15,130
Clackmannanshire and Stirling Integration Joint Board 306 536 - 842
Localities and Infrastructure 6,198 1,696 (15) 7,879
Other Operating Income & Expenditure (85) (1,043) 25 (1,103)
Net Cost of General Services 20,670 2,455 (362) 22,763
Housing Revenue Account 2,553 465 2 3,020
Net Cost of Services 23,223 2,920 (360) 25,783
Other Income & Expenditure from the Expenditure and Funding Analysis (33,993) 8,582 (80) (25,491)
Difference between General Fund Surplus/Deficit and Comprehensive
Income and Expenditure Statement Surplus/Deficit on the Provision of
Services
(10,770) 11,502 (440) 292
Note 1: Adjustments for Capital Purposes
Within ‘Net Cost of Services’, adjustments have been made to add in depreciation and asset impairments and to deduct capital
financed from current revenue (CFCR).
Within ‘Other Income and Expenditure’, adjustments have been made to:
• Add the net gain/loss on disposal of non current assets and the net gain/loss on revaluation of investment properties;
• Deduct the statutory charges for capital financing (principal repayments) as these are not chargeable under generally
accepted accounting practices; and
• Add capital grants receivable in the year without conditions, or for which conditions were satisfied in the year.
Note 2: Net Change for Pensions Adjustments
Within ‘Net Cost of Services’, adjustments have been made to remove the actual employer pension contributions made by the
authority as allowed by statute and to replace these with actuarial estimates of current service costs and past service costs in
accordance with IAS19 Employee Benefits. Within ‘Other Income and Expenditure’, adjustments have been made to include the
net interest on the defined benefit liability chargeable to the Comprehensive Income and Expenditure Statement in accordance
with IAS19 Employee Benefits.
Note 3: Other Differences
Within ‘Net Cost of Services’, adjustments have been made to remove transfers to or from earmarked reserves, i.e. holiday pay,
insurance fund, repairs and renewal fund. Within ‘Other Income and Expenditure’, adjustments have been made to recognise
the impact on the General Fund from timing differences relating to premiums and discounts.

Page 38 of 75
8. Grants and Taxation Income
Whether paid on account, by instalments or in arrears, government grants, third party contributions and donations are
recognised as due to Stirling Council when there is reasonable assurance that the Council will comply with the conditions
attached to the payments and the grants or contributions will be received.
Amounts recognised as due to Stirling Council are not credited to the Comprehensive Income and Expenditure
Statement until conditions attaching to the grant or contribution have been satisfied. Conditions are stipulations that
specify that the future economic benefits or service potential embodied in the asset acquired using the grant or
contribution are required to be consumed by the recipient as specified or future economic benefits or service potential
must be returned to the transferor.
Monies advanced as grants and contributions for which conditions have not been satisfied are carried in the Balance
Sheet as grants received in advance. When conditions are satisfied, the grant or contribution is credited to the relevant
service line (attributable revenue grants/contributions) or Taxation and Non-Specific Grant Income (non-ring-fenced
revenue grants and all capital grants) in the Comprehensive Income and Expenditure Statement.
Where capital grants are credited to the Comprehensive Income and Expenditure Statement, they are reversed out of
the General Fund Balance in the Movement in Reserves Statement. Where the grant has yet to be used to finance capital
expenditure, it is posted to the Capital Grants Unapplied Account. Amounts in the Capital Grants Unapplied Account are
transferred to the Capital Adjustment Account once they have been applied.
Stirling Council credited the following grants, contributions and taxation income to the Comprehensive Income and
Expenditure Statement:
2015-16
£000
2016-17
£000
Credited to Services
Housing Benefit (Rent Allowance & Rent Rebate) Subsidy (18,518) (17,918)
Other Grants, Reimbursements & Contributions (Government) (2,983) (2,768)
Other Grants, Reimbursements & Contributions (Non-Government) (6,615) (6,548)
Housing Benefit/Council Tax Benefit Admin Grant (316) (296)
Total (28,432) (27,530)
Council Tax/Community Charge (41,564) (42,043)
General Government Grant (123,484) (118,134)
Non Domestic Rate Redistribution (45,400) (46,216)
Capital Grants and Contributions (22,715) (15,476)
Total (233,163) (221,869)
9. External Audit Costs
Stirling Council has incurred £0.241m during 2016-17 (£0.261m, 2015-16) in respect of external audit services carried out
by the appointed auditor.

Page 39 of 75
10. Adjustments Between Accounting Basis and Funding Basis Under Regulations
This note details the adjustments that are made to the total Comprehensive Income and Expenditure recognised by
Stirling Council in the year in accordance with proper accounting practice to the resources that are specified by statutory
provisions as being available to the Council to meet future capital and revenue expenditure.
Adjustments made in 2016-17
Note
General
Fund
Balance
£000
Housing
Revenue
Account
£000
Capital
Receipts
Reserve
£000
Capital
Grants
Unapplied
£000
Unusable
Reserves
Movement
£000
PPE non-current assets written off on disposal or sale 12 (5,406) (1,821) - - 7,227
PPE depreciation written off on disposal or sale 12 4,986 521 - - (5,507)
Intangible Assets written off on disposal or sale (14) - - - 14
Intangible Assets depreciation written off on disposal or sale 8 - - - (8)
Current Assets Held For Sale written off on disposal or sale (45) - - - 45
Sale proceeds from disposal of non-current assets 657 2,077 (2,734) - -
Capital expenditure met from Capital Receipts Reserve 15 - - 5,567 - (5,567)
Contribution from Capital Receipts Reserve towards
administrative costs of non-current asset disposals (72) (99) 171 - -
Net (gain) / loss on disposal of non-current assets 114 678 3,004 - (3,796)
Capital grants & contributions applied to capital financing 8 12,271 3,205 - - (15,476)
Amortisation of intangible assets (216) (21) - - 237
Non-current asset revaluation decreases to CIES 13 (8,497) (9,463) - - 17,960
Reversal of non-current asset revaluation decreases to CIES 13 229 - - - (229)
Non-current asset depreciation charged to CIES 12 (24,482) (3,312) - - 27,794
Depreciation and impairment of non-current assets (32,750) (12,775) - - 45,525
Movement in the market value of investment properties CIES (17) - - - 17
Reversal of items relating to retirement benefits debited or
credited to the ‘Surplus or Deficit on the Provision of
Services’ in the CIES
22,23 (23,459) (2,418) - - 25,877
Employer’s pensions contributions and direct payments to
pensioners payable in the year 22 15,232 1,241 - - (16,473)
Application of grants to capital financing 15 - - - 828 (828)
New capital grants unapplied - - - - 0
Application of grants to capital financing from the Capital
Grants Unapplied Account 23 - - - 828 (828)
Statutory provision for the financing of capital investment 15,23 8,690 1,220 - - (9,910)
Capital expenditure charged to the General Fund & HRA 15,23 1,851 6,402 - - (8,253)
Amount by which finance costs charged to the CIES are
different from finance costs chargeable in the year in
accordance with statutory requirements
23 80 - - - (80)
Net transfer to / (from) earmarked reserves required by
legislation (i.e. holiday pay accrual) 23 (579) (1) - - 580
Total Adjustments 2016-17 (18,783) (2,469) 3,004 828 17,420

Page 40 of 75
Comparative Adjustments made in 2015-16
Note
General
Fund
Balance
£000
Housing
Revenue
Account
£000
Capital
Receipts
Reserve
£000
Capital
Grants
Unapplied
£000
Unusable
Reserves
Movement
£000
PPE non-current assets written off on disposal or sale 12 (3,096) (5,957) - - 9,053
PPE depreciation written off on disposal or sale 12 2,901 57 - - (2,958)
Intangible Assets written off on disposal or sale (87) - - - 87
Intangible Assets depreciation written off on disposal or sale 83 - - - (83)
Sale proceeds from disposal of non-current assets 263 6,416 (6,679) - -
Capital expenditure met from Capital Receipts Reserve 15 - - 7,175 - (7,175)
Contribution from Capital Receipts Reserve towards
administrative costs of non-current asset disposals (21) (79) 100 - -
Net (gain) / loss on disposal of non-current assets 43 437 596 - (1,076)
Capital grants & contributions applied to capital financing 8 19,369 3,346 - - (22,715)
Amortisation of intangible assets (174) (16) - - 190
Non-current asset revaluation decreases to CIES 13 (3,435) (10,011) - - 13,446
Reversal of non-current asset revaluation decreases to CIES 13 3,311 3,365 - - (6,676)
Non-current asset depreciation charged to CIES 12 (23,426) (3,187) - - 26,613
Depreciation and impairment of non-current assets (23,550) (9,833) - - 33,383
Movement in the market value of investment properties CIES (241) - - - 241
Reversal of items relating to retirement benefits debited or
credited to the ‘Surplus or Deficit on the Provision of
Services’ in the CIES
22,23 (23,672) (2,497) - - 26,169
Employer’s pensions contributions and direct payments to
pensioners payable in the year 22 13,543 1,124 - - (14,667)
Application of grants to capital financing 15 - - - 50 (50)
New capital grants unapplied 15 - - - (828) 828
Application of grants to capital financing from the Capital
Grants Unapplied Account 23 - - - (778) 778
Statutory provision for the financing of capital investment 15,23 11,038 1,189 - - (12,227)
Capital expenditure charged to the General Fund & HRA 15,23 3,054 6,107 - - (9,161)
Amount by which finance costs charged to the CIES are
different from finance costs chargeable in the year in
accordance with statutory requirements
23 80 - - - (80)
Net transfer to / (from) earmarked reserves required by
legislation (i.e. holiday pay accrual) 23 197 (2) - - (195)
Total Adjustments 2015-16 (313) (145) 596 (778) 640

Page 41 of 75
11. General Fund Reserves
This note shows General Fund Reserves split between earmarked and uncommitted balances.
Balance at
1 April
2016
£000
Use of
Balances
2016-17
£000
New
Balances
2016-17
£000
Balance at
31 March
2017
£000
Central Energy Efficiency Fund (252) - - (252)
Communities and People Initiatives (977) 372 (359) (964)
Corporate Initiatives (Earlsburn Windfarm, Risk Fund) (4,884) - (1,667) (6,551)
Council Tax Discount on 2nd Homes (for reinvestment in affordable housing) (818) - - (818)
DWP monies, Council Tax Reduction scheme and Social Fund (678) 211 (608) (1,075)
Economic Development and Regeneration Initiatives (281) 243 (331) (369)
Environment and Place Initiatives (106) 45 (216) (277)
Governance Initiatives (99) 99 (111) (111)
Infrastructure Initiatives (271) 127 (24) (168)
Management Initiatives (70) 70 (210) (210)
Scheme of Devolved Budget Management within Education (245) 106 (44) (183)
Schools and Learning Initiatives (1,423) 1,025 (423) (821)
Stirling Development Agency Ltd Loan Investment Income (581) - (87) (668)
Strategic Housing Account (for reinvestment in affordable housing) (931) - - (931)
Clackmannanshire & Stirling Integration Joint Board Initiatives (658) 658 - 0
Earmarked Reserves (12,274) 2,956 (4,080) (13,398)
Uncommitted Reserves (10,028) 3,182 (1,306) (8,152)
Total Reserves (22,302) 6,138 (5,386) (21,550)
12. Property, Plant & Equipment
Property, Plant and Equipment assets are those that have physical substance and are held for use in the production or
supply of goods or services, for rental to others, or for administrative purposes and which are expected to be used
during more than one financial year.
Recognition
Expenditure on the acquisition, creation or enhancement of Property, Plant and Equipment is capitalised on an accruals
basis, provided that it is probable that the future economic benefits or service potential associated with the item will
flow to Stirling Council and the cost of the item can be measured reliably. Expenditure that maintains but does not add
to an asset’s potential to deliver future economic benefits or service potential is charged as an expense when it is
incurred.
Measurement
Assets are initially measured at cost, comprising the purchase price and any costs attributable to bringing the asset to
the location and condition necessary for it to be capable of operating in the manner intended by management.
The cost of an asset acquired other than by purchase is deemed to be its fair value, unless the acquisition does not have
commercial substance (i.e. it will not lead to a variation in the cashflows of the authority).
Property, plant and equipment assets are carried in the Balance Sheet using the following measurement bases:
• Infrastructure, Community Assets and Assets Under Construction - Depreciated historical cost
• Council Dwellings - Existing use value for social housing (EUV-SH)
• Surplus assets - Fair value at highest and best use
• All other assets - if no active market exists for the asset or the asset is specialised, measure at depreciated
replacement cost. If an active market exists for the asset, measure at existing use value.
Where non-property assets have short useful lives or low values (or both), depreciated historical cost basis is used as a
proxy for fair value.
Stirling Council carries out a rolling programme which ensures that all Property, Plant and Equipment to be measured at
fair value, Council Dwellings, Other Land & Buildings and Surplus Assets undergo revaluation at least every five years.
Increases in valuations are matched by credits to the Revaluation Reserve to recognise unrealised gains. Exceptionally,
gains might be credited to the Comprehensive Income and Expenditure Statement where they arise from the reversal of
a loss previously charged to a Service.
The Revaluation Reserve contains revaluation gains recognised since 1 April 2007 only, the date of its formal
implementation. Gains arising before that date have been consolidated into the Capital Adjustment Account.

Page 42 of 75
Depreciation
Depreciation is provided for on all Property, Plant and Equipment assets by the systematic allocation of their depreciable
amounts over their useful lives. An exception is made for assets without a determinable finite useful life (i.e. freehold
land and certain Community Assets), Investment Properties and assets not yet available for use (Assets under
Construction).
Depreciation is calculated on the following bases:
• Dwellings and other buildings - straight-line allocation over the useful life of the property as estimated by the
Stirling Council Valuer.
• Vehicles, plant and equipment - a percentage of the value of each class of assets in the Balance Sheet, as
advised by a suitably qualified officer.
• Infrastructure - straight-line allocation over 30-50 years depending on the type of infrastructure asset (e.g.
road, bridge etc.).
Services are charged with depreciation, where appropriate, for the use of assets no matter how they are financed.
Depreciation on Stirling Council’s non-operational assets is not charged to Service revenue accounts. It is however
reflected in the Comprehensive Income and Expenditure Statement through Other Operating Income and Expenditure.
Revaluation gains are also depreciated, with an amount equal to the difference between current value depreciation
charged on assets and the depreciation that would have been chargeable based on their historical cost being transferred
each year from the Revaluation Reserve to the Capital Adjustment Account.
Component Accounting
Where a significant component part of an item of Property, Plant & Equipment (PPE) is expected to wear out more
quickly than the overall asset, it is depreciated over a shorter period of time and any subsequent expenditure on
restoring or replacing the component is capitalised (with any carrying amount of the replaced component being written
off to the Comprehensive Income and Expenditure Statement). It should be noted that council dwellings, other land and
buildings and surplus assets are considered for componentisation with no de-minimis thresholds set by Stirling Council.
Disposals
When an asset is disposed of or decommissioned, the carrying amount of the asset in the Balance Sheet (whether
Property, Plant and Equipment or Assets Held for Sale) is written off to the Comprehensive Income and Expenditure
Statement as part of the gain or loss on disposal. Receipts from disposals (if any) are credited to the Comprehensive
Income and Expenditure Statement as part of the gain or loss on disposal (i.e. netted off against the carrying value of the
asset at the time of disposal). Any revaluation gains accumulated for the asset in the Revaluation Reserve are transferred
to the Capital Adjustment Account.
All amounts received for a disposal are categorised as capital receipts and require to be credited to the Capital Receipts
Reserve and can then only be used for new capital investment or set aside to reduce Stirling Council’s underlying need to
borrow (the capital financing requirement). Receipts are appropriated to the Reserve from the General Fund Balance in
the Movement in Reserves Statement.
The written-off value of disposals is not a charge against Council Tax, as the cost of non-current assets is fully provided
for under separate arrangements for capital financing. Amounts are appropriated to the Capital Adjustment Account
from the General Fund Balance in the Movement in Reserves Statement.
Movements in Property, Plant and Equipment
The movements in Property, Plant and Equipment during 2016-17 are as follows:
Movements 2016-17 Council
Dwellings
Other
Land &
Buildings
Vehicles,
Plant &
Equip
Infra-
Structure
Assets
Community
Assets
Surplus
Assets
Assets Under
Construction
Total
Property,
Plant &
Equip
£000 £000 £000 £000 £000 £000 £000 £000
Cost or Valuation
At 1 April 2016 157,949 435,385 25,416 135,338 6,865 2,560 12,987 776,500
Additions 9,260 5,028 5,611 10,161 916 - 8,710 39,687
Disposals (1,352) (19) (5,690) - (122) (43) - (7,227)
Revaluation increases/
(decreases) recognised
through Revaluation Reserve
- 10,568 (139) - - 735 (120) 11,043
Revaluation increases/
(decreases) recognised in the
Surplus/Deficit on the
Provision of Services
(8,255) (9,402) - - - 4 - (17,653)
Asset Reclassifications (incl. to
Investment Properties and
Assets Held for Sale)
2,703 13,433 - - - (149) (17,362) (1,376)
At 31 March 2017 160,305 454,991 25,199 145,499 7,659 3,107 4,215 800,976

Page 43 of 75
Movements 2016-17 Council
Dwellings
Other
Land &
Buildings
Vehicles,
Plant &
Equip
Infra-
Structure
Assets
Community
Assets
Surplus
Assets
Assets Under
Construction
Total
Property,
Plant &
Equip
£000 £000 £000 £000 £000 £000 £000 £000
Accumulated Depreciation
and Impairment
At 1 April 2016 (6,617) (31,435) (10,831) (38,688) (1,732) (7) - (89,310)
Depreciation charge (2,475) (18,177) (2,529) (4,110) (502) - - (27,794)
Disposals 57 - 5,328 - 122 - - 5,507
Depreciation written out to
the Revaluation Reserve
- 11,615 91 - - 6 - 11,712
At 31 March 2017 (9,035) (37,997) (7,942) (42,798) (2,112) (1) - (99,885)
Net Book Value
At 31 March 2017 151,270 416,994 17,257 102,701 5,547 3,107 4,215 701,090
At 31 March 2016 151,332 403,950 14,585 96,650 5,133 2,553 12,987 687,190
Comparative Movements
2015-16 Council
Dwellings
Other
Land &
Buildings
Vehicles,
Plant &
Equip
Infra-
Structure
Assets
Community
Assets
Surplus
Assets
Assets Under
Construction
Total
Property,
Plant &
Equip
£000 £000 £000 £000 £000 £000 £000 £000
Cost or Valuation
At 1 April 2015 154,472 458,856 23,393 126,746 6,630 1,828 6,495 778,420
Additions 11,652 3,569 4,776 8,728 219 - 14,960 43,904
Disposals (943) (5,212) (2,392) (136) (329) (41) - (9,053)
Revaluation increases/
(decreases) recognised
through Revaluation Reserve
- (30,506) 11 - - (99) - (30,594)
Revaluation increases/
(decreases) recognised in the
Surplus/Deficit on the
Provision of Services
(9,839) 2,871 (2) - (80) 392 - (6,658)
Asset Reclassifications (incl. to
Investment Properties and
Assets Held for Sale)
2,607 5,807 (370) - 425 480 (8,468) 481
At 31 March 2016 157,949 435,385 25,416 135,338 6,865 2,560 12,987 776,500
Accumulated Depreciation
and Impairment
At 1 April 2015 (4,298) (56,892) (10,602) (34,991) (1,659) (68) - (108,510)
Depreciation charge (2,376) (17,388) (2,608) (3,833) (402) (6) - (26,613)
Disposals 57 58 2,370 136 329 8 - 2,958
Asset Reclassifications (incl. to
Investment Properties and
Assets Held for Sale)
- 3 13 - - (16) - -
Depreciation written out to
the Revaluation Reserve
- 42,784 (4) - - 75 - 42,855
At 31 March 2016 (6,617) (31,435) (10,831) (38,688) (1,732) (7) - (89,310)
Net Book Value
At 31 March 2016 151,332 403,950 14,585 96,650 5,133 2,553 12,987 687,190
PFI/PPP Assets
The net book value of PFI/PPP assets included in Other Land & Buildings as at 31 March 2017 is £139.4m (31 March
2016, £147.3m).

Page 44 of 75
Capital Commitments
As at 31 March 2017, Stirling Council has entered into a number of contracts for the construction or enhancement of
Property, Plant and Equipment within its approved Capital Programme. The most significant projects and remaining
profiled costs for project completion are: Construction of Balvalachan Cemetery Callander (£0.464m); Stirling Sports
Village National Curling Academy (£0.516m); St Ninian’s Primary School Phase 2 (£0.655m).
13. Impairments/Downward Revaluations
Assets subject to a reduction in value as a result of impairment and/or downward revaluation have been accounted for
as follows:
• Where there is a balance of revaluation gains for the asset in the Revaluation Reserve, the carrying amount of
the asset is written down against that balance (up to the amount of the accumulated gains)
• Where there is no balance in the Revaluation Reserve or insufficient balance, the carrying amount of the asset
is written down against the relevant Service line(s) in the Comprehensive Income and Expenditure Statement
Where a revaluation loss is reversed subsequently, the reversal is credited to the relevant Service line(s) in the
Comprehensive Income and Expenditure Statement, up to the amount of the original loss, adjusted for depreciation that
would have been charged if the loss had not been recognised.
The following table outlines revaluation losses charged and revaluation reversals credited to the Surplus or Deficit on the
Provision of Services.
It should be noted that the 2015-16 comparative figures have been restated as a result of the change which requires
local authorities to report performance on the basis of how they are structured and how they operate, monitor and
manage financial performance. Therefore, local authorities are no longer required to report the cost of individual
services in accordance with the format as specified in the Service Reporting Code of Practice (SeRCOP).
Restated
Assets 2015-16
Losses
£000
2015-16
Reversals
£000
2015-16
Totals
£000
2016-17
Losses
£000
2016-17
Reversals
£000
2016-17
Totals
£000
Car Parks - (5) (5) 925 (107) 818
Community Facilities / Shops / Retail 665 (50) 615 4,362 (100) 4,262
Infrastructure 2 - 2 3 - 3
Office Sites & Depots 537 (932) (395) 96 (5) 91
Open Spaces - (25) (25) - - -
Regeneration / Development Sites - (3,338) (3,338) 372 - 372
Residential Accommodation 9,968 (396) 9,572 9,057 - 9,057
Schools / Educational Establishments 2,274 (1,930) 344 3,145 (17) 3,128
13,446 (6,676) 6,770 17,960 (229) 17,731

Page 45 of 75
14. Asset Revaluation Programme
Stirling Council carries out a rolling programme which ensures that the Property, Plant and Equipment required to be
measured at fair value, Council Dwellings, Other Land & Buildings and Surplus Assets, undergoes revaluation at least
every five years. Professionally qualified valuers (RICS: Royal Institute of Chartered Surveyors) employed within Stirling
Council’s Estates Team carry out valuations of all property-based assets held by the Council. The net value of assets are:
Assets
31
March
2016
Assets
31
March
2017
Carried
at
Historic
Cost
Valued at Fair Value as at:
Total Cost
or
Valuation
31 March
2017
31 March
2016
31 March
2015
31 March
2014
31 March
2013
£000 £000 £000 £000 £000 £000 £000
Council Dwellings 5,566 5,587 - - - - 151,270 - 151,270
Other Land & Buildings
Secondary Schools 7 7 945 - 138,905 - - - 139,850
Primary Schools 38 38 1,884 13,599 77,047 - - - 92,530
Sports Clubs/Facilities 30 31 970 36,085 58 - 6,174 - 43,287
Land 184 187 3,385 1,068 5,356 3,288 188 5,475 18,760
Car Parks 49 48 15 16,562 - - - - 16,577
Community Campus 1 1 25 - - - 13,867 - 13,892
Council Offices 34 37 1,949 2,206 11,209 - - - 15,364
Community Centres / Halls 23 23 167 15,451 - - - - 15,618
Industrial Premises 74 73 173 498 8,573 - 37 - 9,281
Art / Entertainment Venues 2 2 - 11,732 - - - - 11,732
Hostels 6 6 3 - - 5,743 - - 5,746
Nursery Schools 13 13 287 - 5,650 - - - 5,937
Libraries 16 16 40 - - 4,628 - - 4,668
Other Buildings 28 28 1,194 367 928 1,207 - 762 4,458
Residential Care Homes 4 3 - 2,954 - - - - 2,954
Shops 37 38 46 830 2,507 - - - 3,383
Depots 6 6 19 - 2,618 - - - 2,637
Garages/Pitches 1,199 1,199 18 - - - 2,446 - 2,464
Day Care 3 1 - 1,781 - - - - 1,781
T’port Facilities/Park & Ride 3 3 55 - - 1,525 - - 1,580
Fishing Rights 3 3 - 1,549 - - - - 1,549
Special Education Properties 2 2 - - 1,325 - - - 1,325
Public Conveniences 18 18 40 1,581 - - - - 1,621
Total OLB 1,780 1,783 11,215 106,263 254,176 16,391 22,712 6,237 416,994
Surplus Assets 11 7 - 3,077 30 - - - 3,107
Value of Assets Held at Depreciated Historic Cost
Carried at
Historic Cost
Carried at
Historic Cost
£000 £000
Vehicles, Plant & Equipment Infrastructure Assets
Vehicles 482 Bridges 8,310
Plant & Equipment 16,775 Cycle Routes/Footways 1,866
Roads 85,666
Community Assets Lighting 6,859
Cemeteries/ Churchyards 2,210
Parks, Open Spaces, Play Areas 3,337 Assets Under Construction 4,215
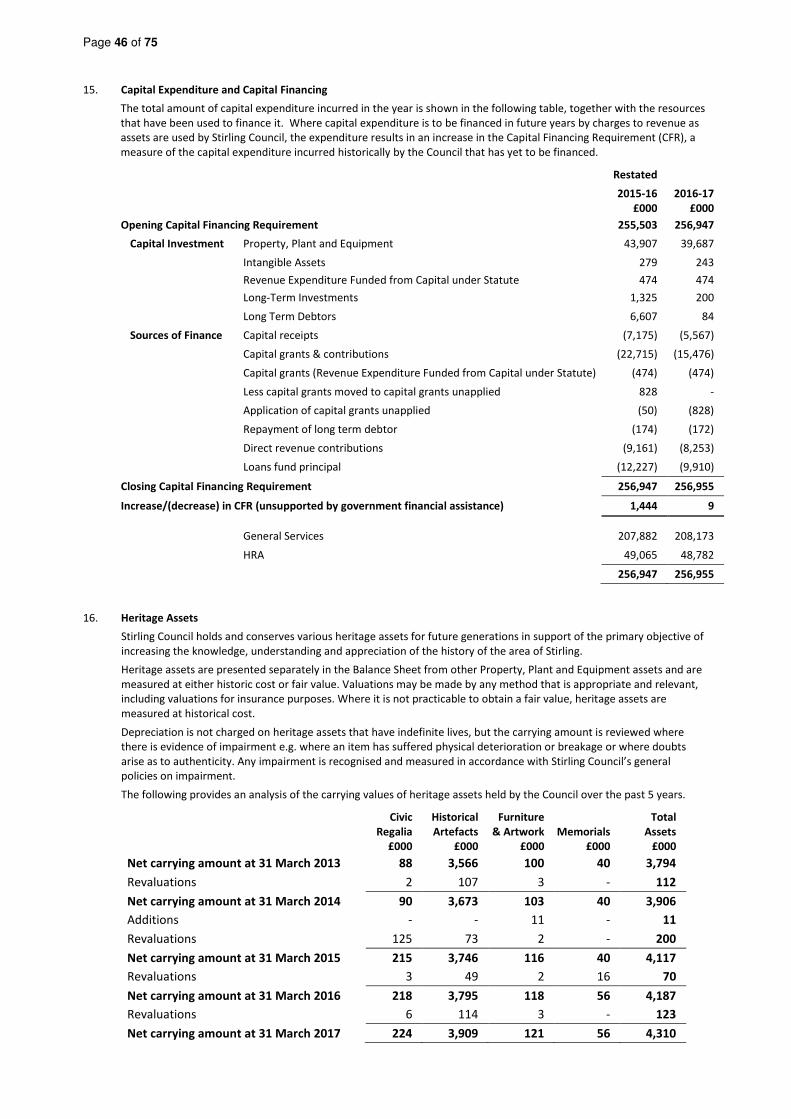
Page 46 of 75
15. Capital Expenditure and Capital Financing
The total amount of capital expenditure incurred in the year is shown in the following table, together with the resources
that have been used to finance it. Where capital expenditure is to be financed in future years by charges to revenue as
assets are used by Stirling Council, the expenditure results in an increase in the Capital Financing Requirement (CFR), a
measure of the capital expenditure incurred historically by the Council that has yet to be financed.
Restated
2015-16
£000
2016-17
£000
Opening Capital Financing Requirement 255,503 256,947
Capital Investment Property, Plant and Equipment 43,907 39,687
Intangible Assets 279 243
Revenue Expenditure Funded from Capital under Statute 474 474
Long-Term Investments 1,325 200
Long Term Debtors 6,607 84
Sources of Finance Capital receipts (7,175) (5,567)
Capital grants & contributions (22,715) (15,476)
Capital grants (Revenue Expenditure Funded from Capital under Statute) (474) (474)
Less capital grants moved to capital grants unapplied 828 -
Application of capital grants unapplied (50) (828)
Repayment of long term debtor (174) (172)
Direct revenue contributions (9,161) (8,253)
Loans fund principal (12,227) (9,910)
Closing Capital Financing Requirement 256,947 256,955
Increase/(decrease) in CFR (unsupported by government financial assistance) 1,444 9
General Services 207,882 208,173
HRA 49,065 48,782
256,947 256,955
16. Heritage Assets
Stirling Council holds and conserves various heritage assets for future generations in support of the primary objective of
increasing the knowledge, understanding and appreciation of the history of the area of Stirling.
Heritage assets are presented separately in the Balance Sheet from other Property, Plant and Equipment assets and are
measured at either historic cost or fair value. Valuations may be made by any method that is appropriate and relevant,
including valuations for insurance purposes. Where it is not practicable to obtain a fair value, heritage assets are
measured at historical cost.
Depreciation is not charged on heritage assets that have indefinite lives, but the carrying amount is reviewed where
there is evidence of impairment e.g. where an item has suffered physical deterioration or breakage or where doubts
arise as to authenticity. Any impairment is recognised and measured in accordance with Stirling Council’s general
policies on impairment.
The following provides an analysis of the carrying values of heritage assets held by the Council over the past 5 years.
Civic
Regalia
£000
Historical
Artefacts
£000
Furniture
& Artwork
£000
Memorials
£000
Total
Assets
£000
Net carrying amount at 31 March 2013 88 3,566 100 40 3,794
Revaluations 2 107 3 - 112
Net carrying amount at 31 March 2014 90 3,673 103 40 3,906
Additions - - 11 - 11
Revaluations 125 73 2 - 200
Net carrying amount at 31 March 2015 215 3,746 116 40 4,117
Revaluations 3 49 2 16 70
Net carrying amount at 31 March 2016 218 3,795 118 56 4,187
Revaluations 6 114 3 - 123
Net carrying amount at 31 March 2017 224 3,909 121 56 4,310

Page 47 of 75
Civic Regalia items comprise the Council Mace, Provost Chain, Provost Medal and four Bailie Chains. Historical Artefacts
comprise the Wallace Sword and the Old Stirling High School Telescope. Furniture & Artwork comprise those items on
display within Council offices. All have been included in the Balance Sheet at insurance valuations (as a proxy for fair
values) and are subject to annual review.
In terms of Memorials, the Council considers that it is not practical to obtain a valuation at a cost commensurate with
the benefits to users of the financial statements, and that reliable cost or valuation information cannot be obtained.
These include the Wallace Monument, which is leased to Stirling District Tourism Ltd who manage it on behalf of the
Council, statues, monuments, war memorials, fountains and clock towers. These assets are recognised on the Balance
Sheet at a nominal sum of £1 each plus any relevant expenditure incurred.
17. Long Term Debtors
The following table provides an analysis of long-term debtors balances payable to Stirling Council:
31 March 2016 31 March 2017
Police
Debt
£000
Housing
Loans
£000
National
Housing
Trusts
£000
Total
Debtors
£000
Police
Debt
£000
Housing
Loans
£000
National
Housing
Trusts
£000
Total
Debtors
£000
8,293 536 4,718 13,547 Balance b/fwd as at 1st April 8,160 614 11,200 19,974
(133) - - (133) Police Debt Due to Loans Fund (127) - - (127)
- 125 - 125 House Loan Advances - 84
- 84
- (47) - (47) House Loan Repayments - (40) - (40)
- - 6,482 6,482 Loans to National Housing Trusts - - - -
8,160 614 11,200 19,974 Balance c/fwd as at 31st March 8,033 658 11,200 19,891
18. Short Term Debtors
The following table provides an analysis of short-term debtors balances payable to Stirling Council:
31 March 2016
£000
31 March 2017
£000
Central Government Bodies 5,136 3,679
Other Local Authorities 12 253
NHS Bodies 476 611
Other Entities and Individuals 9,279 9,692
Total 14,903 14,235
The above debtors figures represent the position after deducting the following bad debt provisions:
31 March 2016
31 March 2017
£000
Council Tax (5,189) (5,321)
Council Tax Penalty Charges (1,035) (1,052)
Housing Rents (1,204) (1,219)
Sundry Debtors (1,968) (2,147)
Non Domestic Rates (934) (1,388)
Non Domestic Rates Penalty Charges (113) (140)
Total (10,443) (11,267)
19. Cash and Cash Equivalents
Cash is represented by cash in hand and deposits with financial institutions repayable without penalty on notice of not
more than 24 hours. Cash equivalents are investments that mature in three months or less from the date of acquisition
and that are readily convertible to known amounts of cash with insignificant risk of change in values. Cash and cash
equivalents are shown net of bank overdrafts that are repayable on demand.
Cash and cash equivalents held as at 31 March are as follows:
31 March 2016
£000 31 March 2017
£000 Cash Held by Officers 28 31
Bank Current Accounts (817) 665
Short Term Deposits 9,693 3,100
Total Cash and Cash Equivalents 8,904 3,796

Page 48 of 75
20. Short Term Creditors
The following table provides an analysis of short-term creditor balances payable by Stirling Council:
31 March 2016
£000
31 March 2017
£000
Central Government Bodies (433) (684)
Other Local Authorities (1,742) (1,113)
NHS Bodies (49) (196)
Other Entities and Individuals (40,120) (37,484)
Total (42,344) (39,477)
21. Private Finance Initiatives (PFI) and Public Private Partnerships (PPP) Contracts
PFI/PPP contracts are agreements to receive services, where the responsibility for making available the property, plant
and equipment needed to provide the services passes to the PFI/PPP contractor. The appropriate treatment of PFI/PPP
contracts is based on control of an asset, such as specifying services and the price paid for these services.
Stirling Council is deemed to control the services that are provided under its PFI/PPP schemes and as ownership of the
Property, Plant and Equipment will pass to the Council at the end of the contracts for no additional charge, the Council
carries the assets used under the contracts on its Balance Sheet as part of Property, Plant and Equipment. Assets
recognised on the Balance Sheet are revalued and depreciated in the same way as Property, Plant & Equipment owned
by Stirling Council.
A liability is also carried on the Balance Sheet representing payments due for the financing of these assets. The unitary
charge paid to the PPP contractor is allocated between operating costs, finance lease principal and interest and any
capitalised lifecycle costs.
Balfron High School PFI Contract
In March 2000, Stirling Council entered into a PFI contract for the replacement of Balfron High School. The new school
became operational in August 2001. Stirling Council makes annual payments under the Balfron High School PFI
agreement to Balfron School Services Ltd, a wholly owned subsidiary of Bell Rock Topco Ltd, who operate the school on
behalf of the Council. Education Services made net Unitary Charge payments of £2.8m in 2016-17 (2015-16, £3.04m).
Stirling Council also receives £1.59m of annual support grant from the Scottish Government as part funding for the
project.
Stirling Schools PPP Contract
On 21st April 2006, Stirling Council concluded the Stirling Schools PPP Project Agreement with Stirling Gateway, a
consortium established for the purpose of carrying out a major rebuilding programme covering five secondary schools
within the area and a new community campus at Raploch. Construction commenced in May 2006 and was completed by
August 2008. Stirling Council makes annual payments under the Stirling Schools PPP agreement to Stirling Gateway Ltd
who operate the PPP schools on behalf of the Council. Education Services made net Unitary Charge payments of
£11.20m in 2016-17 (2015-16, £11.03m). Stirling Council also receives £4.4m of annual support grant from the Scottish
Government as part funding for the project.
Ownership of all schools will pass to Stirling Council when the Balfron and Stirling Schools’ contracts terminate in 2026
and 2039 respectively.
Payments
Stirling Council makes agreed payments each year, which are increased by inflation and reduced if the contractor fails to
meet availability and performance standards. Payments still to be made under the PFI/PPP contracts at 31 March 2017
(excluding any estimation of inflation and availability/performance deductions) are as follows:
Balfron High School PFI Stirling Schools PPP
Service
Charge
£000
Interest
Charge
£000
Principal
Charge
£000
Contingent
Rentals
£000
Total
£000
Service
Charge
£000
Interest
Charge
£000
Principal
Charge
£000
Contingent
Rentals
£000
Total
£000
Payable in 2017-18 1,587 608 246 321 2,762 4,366 3,570 1,727 1,499 11,162
Payable within 2 - 5 years 5,097 1,934 2,628 2,092 11,751 18,964 13,080 7,854 7,639 47,537
Payable within 6 - 10 years 6,035 973 4,147 3,204 14,359 32,763 13,537 8,570 11,541 66,411
Payable within 11 - 15 years - - - - - 41,625 10,930 8,493 14,132 75,180
Payable within 16 - 20 years - - - - - 38,905 7,337 16,167 22,605 85,014
Payable within 21 -25 years - - - - - 14,442 1,195 12,353 15,428 43,418
Total 12,719 3,515 7,021 5,617 28,872 151,065 49,649 55,164 72,844 328,722
Although the payments made to the contractor are described as unitary payments, they have been calculated to
compensate the contractor for the fair value of the services they provide, the capital expenditure incurred and interest
payable whilst the capital expenditure remains to be reimbursed. The liability outstanding to the contractor for capital
expenditure incurred is as follows:

Page 49 of 75
The balance outstanding at year end of £62.179m is split within the Balance Sheet between Finance Lease Liability of
£60.207m and Short Term Creditors of £1.972m (total principal charge payable in 2017-18 of £0.245m + £1.727m).
22. Pension Costs
Stirling Council participates in two formal pension schemes: the Local Government Pension Scheme (LGPS) administered
by Falkirk Council and the Teachers' Scheme administered by the Scottish Government. Both schemes provide defined
benefits to members. However, the liabilities for the teachers’ scheme cannot be identified specifically to Stirling
Council, therefore the scheme is accounted for as if it were a defined contributions scheme - Stirling Council does not
recognise assets or liabilities related to the Teachers' Scheme as the liability for payment of pensions rests ultimately
with the Scottish Government.
Teachers
In 2016-17, Stirling Council paid £6.14m to the Teachers’ Pension Scheme in respect of teachers’ retirement benefits,
representing 17.2% of pensionable pay (2015-16, £5.80m and 16.2%). The Teachers’ superannuation rate increased
from 14.9% to 17.2% from 1 September 2015. Stirling Council is responsible for the costs of any additional benefits
awarded upon early retirement outside of the terms of the Teachers’ Scheme. In 2016-17 these amounted to £0.878m
(2015-16, £0.911m). Accrued pension costs at 31 March 2017 amounted to £0.515m (31 March 2016, £0.510m).
Local Government Pension Scheme (LGPS)
In accordance with International Accounting Standard 19 (IAS19) Stirling Council is required to account for retirement
benefits when it is committed to giving them, even if the giving will be many years into the future. This involves the
recognition in the Balance Sheet of Stirling Council's share of the net pension asset or liability in the LGPS together with a
pension reserve. The CIES also recognises changes during the year in the pension asset or liability. Scottish Government
regulations require the General Fund to be charged with the amount payable to the pension fund or directly to
pensioners in the year, not the amount calculated according to the relevant accounting standards, In the MIRS this
means that there are appropriations to and from the Pensions Reserve to remove the notional charges and credits for
retirement benefits and replace them with charges for the cash paid to the pension fund and pensioners and any such
amounts payable but unpaid at the year end.
Stirling Council also has restricted powers to make discretionary awards of retirement benefits in the event of early
retirements. Any liabilities estimated to arise as a result of an award to any member of staff (including Teachers) are
accrued in the year of the decision to make the award and accounted for using the same policies as are applied to the
LGPS.
The following elements of pension costs are charged to the CIES:
• Current Service Cost - the increase in the present value of liabilities expected to arise from employee service in
the current period.
• Past Service Costs - the increase in liabilities arising from decisions to improve retirement benefits in the
current period but which are related to employee service in prior periods.
• Settlements - events that change the pension liabilities but are not covered by the actuarial assumptions.
• Interest Expense - the expected increase during the year in the present value of liabilities because the benefits
are one year closer to settlement.
• Expected Return on Assets (including interest income) - a measure of the expected average rate of return on
the investment assets held by the scheme in the year.
The following transactions have been made in the financial statements in accordance with IAS19:
2015-16
£000
2016-17
£000
Comprehensive Income and Expenditure Statement (CIES)
Cost of Services:
• Current Service Cost 16,654 14,144
• Past Service Costs (including Curtailments) 933 4,139
Financing and Investment Income and Expenditure:
• Interest Expense - Defined Benefit Obligation 21,293 21,700
• Interest Income - Scheme Assets (12,711) (14,106)
Total Post-Employment Benefits Charged to the Surplus or Deficit on the Provision of Services 26,169 25,877
2015-16 2016-17
Balfron PFI
£000
Schools PPP
£000
Total
£000
Balfron PFI
£000
Schools PPP
£000
Total
£000
(7,802) (58,465) (66,267) Balance Outstanding Start of Year (7,236) (56,917) (64,153)
566 1,548 2,114 Payments During the Year 221 1,753 1,974
(7,236) (56,917) (64,153) Balance Outstanding at Year-end (7,015) (55,164) (62,179)
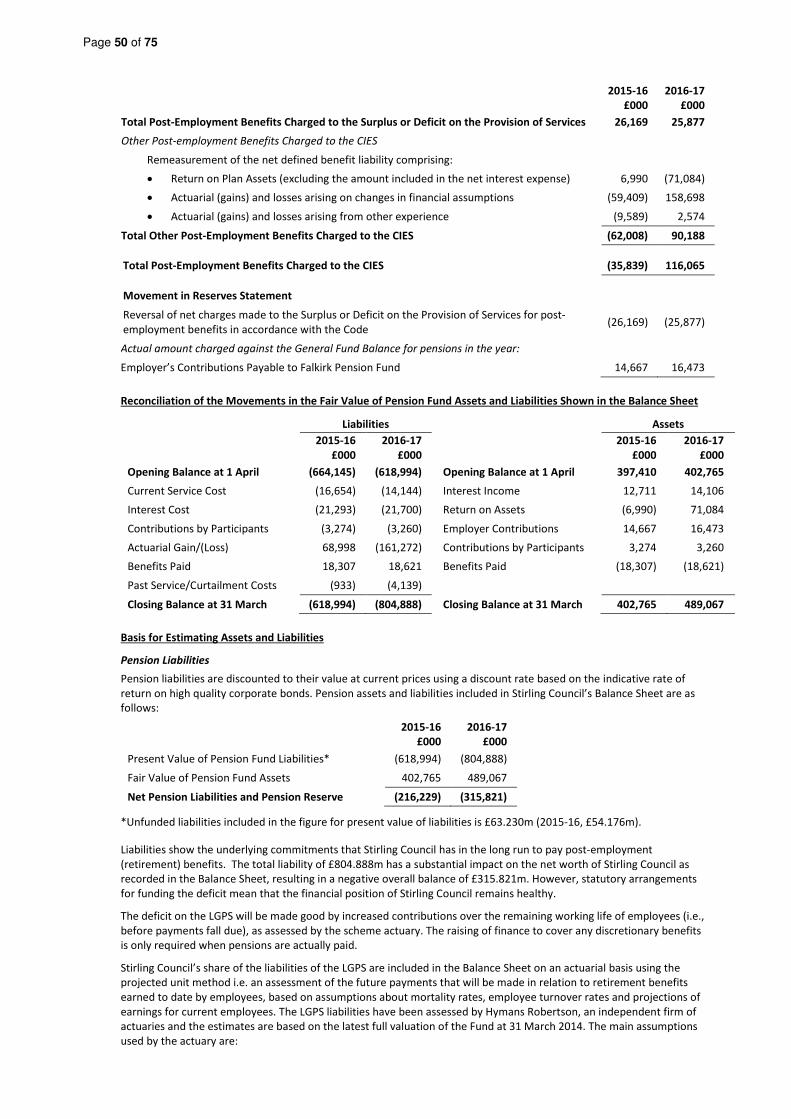
Page 50 of 75
2015-16
£000
2016-17
£000
Total Post-Employment Benefits Charged to the Surplus or Deficit on the Provision of Services 26,169 25,877
Other Post-employment Benefits Charged to the CIES
Remeasurement of the net defined benefit liability comprising:
• Return on Plan Assets (excluding the amount included in the net interest expense) 6,990 (71,084)
• Actuarial (gains) and losses arising on changes in financial assumptions (59,409) 158,698
• Actuarial (gains) and losses arising from other experience (9,589) 2,574
Total Other Post-Employment Benefits Charged to the CIES (62,008) 90,188
Total Post-Employment Benefits Charged to the CIES (35,839) 116,065
Movement in Reserves Statement
Reversal of net charges made to the Surplus or Deficit on the Provision of Services for post-
employment benefits in accordance with the Code (26,169) (25,877)
Actual amount charged against the General Fund Balance for pensions in the year:
Employer’s Contributions Payable to Falkirk Pension Fund 14,667 16,473
Reconciliation of the Movements in the Fair Value of Pension Fund Assets and Liabilities Shown in the Balance Sheet
Liabilities Assets
2015-16
£000
2016-17
£000
2015-16
£000
2016-17
£000
Opening Balance at 1 April (664,145) (618,994) Opening Balance at 1 April 397,410 402,765
Current Service Cost (16,654) (14,144) Interest Income 12,711 14,106
Interest Cost (21,293) (21,700) Return on Assets (6,990) 71,084
Contributions by Participants (3,274) (3,260) Employer Contributions 14,667 16,473
Actuarial Gain/(Loss) 68,998 (161,272) Contributions by Participants 3,274 3,260
Benefits Paid 18,307 18,621 Benefits Paid (18,307) (18,621)
Past Service/Curtailment Costs (933) (4,139)
Closing Balance at 31 March (618,994) (804,888) Closing Balance at 31 March 402,765 489,067
Basis for Estimating Assets and Liabilities
Pension Liabilities
Pension liabilities are discounted to their value at current prices using a discount rate based on the indicative rate of
return on high quality corporate bonds. Pension assets and liabilities included in Stirling Council’s Balance Sheet are as
follows:
2015-16
£000
2016-17
£000
Present Value of Pension Fund Liabilities* (618,994) (804,888)
Fair Value of Pension Fund Assets 402,765 489,067
Net Pension Liabilities and Pension Reserve (216,229) (315,821)
*Unfunded liabilities included in the figure for present value of liabilities is £63.230m (2015-16, £54.176m).
Liabilities show the underlying commitments that Stirling Council has in the long run to pay post-employment
(retirement) benefits. The total liability of £804.888m has a substantial impact on the net worth of Stirling Council as
recorded in the Balance Sheet, resulting in a negative overall balance of £315.821m. However, statutory arrangements
for funding the deficit mean that the financial position of Stirling Council remains healthy.
The deficit on the LGPS will be made good by increased contributions over the remaining working life of employees (i.e.,
before payments fall due), as assessed by the scheme actuary. The raising of finance to cover any discretionary benefits
is only required when pensions are actually paid.
Stirling Council’s share of the liabilities of the LGPS are included in the Balance Sheet on an actuarial basis using the
projected unit method i.e. an assessment of the future payments that will be made in relation to retirement benefits
earned to date by employees, based on assumptions about mortality rates, employee turnover rates and projections of
earnings for current employees. The LGPS liabilities have been assessed by Hymans Robertson, an independent firm of
actuaries and the estimates are based on the latest full valuation of the Fund at 31 March 2014. The main assumptions
used by the actuary are:

Page 51 of 75
2015-16
£000
2016-17
£000
Long-Term Expected Rate of Return on Fund Assets:
Equity Investments, Property, Bonds & Cash 3.5% 2.6%
Mortality Assumptions:
Longevity at 65 for Current Pensioners - Male 22.1 years 22.1 years
Longevity at 65 for Current Pensioners - Female 23.8 years 23.8 years
Longevity at 65 for Future Pensioners - Male 24.3 years 24.3 years
Longevity at 65 for Future Pensioners - Female 26.3 years 26.3 years
Other Assumptions:
Rate of Inflation / Rate of Increase in Pensions 2.2% 2.4%
Rate of Increase in Salaries 3.7% 3.9%
Rate for Discounting Fund Liabilities 3.5% 2.6%
LGPS liabilities are sensitive to the actuarial assumptions set out in the table above. The sensitivity analyses below have
been determined based on reasonably possible changes of the assumptions occurring at the end of the reporting period
and assumes for each change that the assumption analysed changes while all the other assumptions remain constant.
The methods and types of assumption used in preparing the sensitivity analysis below did not change from this used in
the previous period.
Change in Assumptions at 31 March 2017
Approx %
Increase to
Employer
Liability
Approx
Monetary
Amount
(£000)
0.5% Decrease in Real Discount Rate 11% 86,877
1 year Increase in Member Life Expectancy 3% 24,147
0.5% Increase in the Salary Increase Rate 4% 29,055
0.5% Increase in the Pension Increase Rate 7% 55,406
Pension Assets
Pension assets attributable to Stirling Council are included in the Balance Sheet at their fair value, principally the bid
price for quoted securities and estimated fair value for unquoted securities.
The following table shows the split of pension fund asset investments:
31 March 2016 (£’000) 31 March 2017 (£’000)
Prices Quoted
in Active
Markets
Prices Not
Quoted in
Active Markets
Total
Assets
Prices Quoted
in Active
Markets
Prices Not
Quoted in
Active Markets
Total
Assets
Consumer 42,306 - 42,306 50,851 - 50,851
Manufacturing 22,762 - 22,762 23,858 - 23,858
Energy and Utilities 14,367 - 14,367 19,734 - 19,734
Financial Institutions 26,031 - 26,031 32,993 - 32,993
Health & Care 20,603 - 20,603 22,048 - 22,048
Information Technology 24,392 - 24,392 33,652 - 33,652
Other 9 - 9 9,649 - 9,649
Corporate Bonds - 6,509 6,509 - 18,720 18,720
Private Equity - 29,300 29,300 - 37,503 37,503
UK Property - 31,315 31,315 - 30,549 30,549
Overseas Property - 953 953 - 832 832
Equities 85,676 - 85,676 108,634 - 108,634
Bonds - 27,759 27,759 - 23,529 23,529
Infrastructure - 5,267 5,267 - 5,868 5,868
Other 46,486 - 46,486 50,687 - 50,687
Cash & Cash Equivalents 19,030 - 19,030 19,960 - 19,960
Total Assets 301,662 101,103 402,765 372,066 117,001 489,067
As can be seen from the table above, the Falkirk Pension Fund invests in a wide range of active markets. A large
proportion of the assets are invested in equities (70%) and bonds (20%), together with property (6%) and cash (4%). The
comparative year’s figures are 65%, 22%, 8% and 5% respectively.

Page 52 of 75
Impact on the Authority’s Cash Flow
The objectives of the Falkirk Pension Fund are to keep employers’ contributions at as constant a rate as possible.
Employer’s contributions have been agreed at 21.5% for 2017-18. The next triennial valuation is due on 31 March 2017.
Total contributions expected to be made by Stirling Council to Falkirk Pension Fund in the year to 31 March 2018 is
£11.651m.
Principal Risks to the Pension Scheme
The principal risks to the Scheme are the longevity assumptions, statutory changes to the Scheme, changes to inflation,
bond yields and the performance of the investments held by the Scheme. The long-term funding strategy and the
employer’s contribution rates are reviewed triennially and take into account these factors to mitigate the risks.
23. Unusable Reserves
31 March 2016
£000
31 March 2017
£000
(123,796) Revaluation Reserve (144,867)
2,516 Financial Instruments Adjustment Account 2,436
(334,901) Capital Adjustment Account (329,252)
6,386 Employee Statutory Adjustment Account 6,966
216,229 Pensions Reserve 315,821
(233,566) Total Unusable Reserves (148,896)
Revaluation Reserve
The Revaluation Reserve contains the unrealised gains made by Stirling Council arising from increases in the value of its
Property, Plant and Equipment. The Reserve contains only revaluation gains accumulated since 1 April 2007, the date
that the Reserve was created. The following table shows the movement on the Revaluation Reserve during the year:
2015-16
£000
2016-17
£000
2016-17
£000
(112,334) Balance at 1 April (123,796)
30,594 Net revaluation (increases)/decreases - PPE Assets (11,043)
(53) Net revaluation (increases)/decreases - Heritage Assets. (124)
330 Net revaluation (increases)/decreases - Assets Held for Sale. (59)
(42,855) Depreciation written out to the Revaluation Reserve - PPE Assets (11,712)
(11,984) (Surplus)/Deficit on revaluation of non-current assets posted to the
Comprehensive Income and Expenditure Statement
(22,938)
522 Difference between fair value depreciation and historical cost depreciation 1,741
- Amounts (to)/from Capital Adjustment Account 126
(123,796) Balance at 31 March (144,867)
Financial Instruments Adjustment Account
The Financial Instruments Adjustment Account (FIAA) absorbs the timing differences arising from the different
arrangements for accounting for income and expenses relating to certain financial instruments. Stirling Council uses the
FIAA primarily to manage premiums paid on the early redemption of loans in line with the Treasury Management
strategy. Over time the expense is posted to the General Fund balance in accordance with statutory arrangements to
spread the burden on Council Tax. The following table shows the movement on the FIAA during the year:
2015-16
£000
2016-17
£000
2016-17
£000
2,596 Balance at 1 April 2,516
(80) Proportion of premiums incurred in previous financial years to be charged
against the General Fund Balance in accordance with statutory requirements (80)
(80)
Amount by which finance costs charged to the Comprehensive Income and
Expenditure Statement are different from finance costs chargeable in the year in
accordance with statutory requirements
(80)
2,516 Balance at 31 March 2,436

Page 53 of 75
Capital Adjustment Account
The Capital Adjustment Account absorbs the timing differences arising from the different arrangements for accounting
for the consumption of non-current assets and for financing the acquisition, construction or enhancement of those
assets under statutory provisions. The following table shows the movement on the Capital Adjustment Account during
the year:
2015-16
£000
2016-17
£000
2016-17
£000
(323,792) Balance at 1 April (334,901)
Reversal of items relating to capital expenditure debited or credited to the
Comprehensive Income and Expenditure Statement:
26,613 • Charges for depreciation of non-current assets - PPE 27,794
13,328 • Charges for revaluation decreases of non-current assets - PPE 17,881
(6,670) • Reversal of charges for revaluation decreases of non-current assets - PPE (229)
118 • Charges for revaluation decreases of assets held for sale 79
(6) • Reversal of charges for revaluation decreases of assets held for sale -
190 • Amortisation of intangible assets 237
9,053 • PPE non-current assets written off on disposal or sale 7,227
(2,958) • PPE depreciation written off on disposal or sale (5,507)
- • AHFS non-current assets written off on disposal or sale 45
87 • Intangible Assets written off on disposal or sale 14
(83) • Intangible Assets depreciation written off on disposal or sale (8)
39,672 47,533
(522) Difference between fair value depreciation and historical cost depreciation (1,741)
- Adjusting amounts to/(from) the Revaluation Reserve (126)
39,150 Net written out amount of the cost of non-current assets consumed in the year 45,666
Capital financing applied in the year:
(7,175) • Use of the Capital Receipts Reserve to finance new capital expenditure (5,567)
(50) • Application of grants to capital financing from Capital Grants Unapplied (828)
(22,715) • Capital grants and contributions credited to the Comprehensive Income and
Expenditure Statement (15,476)
828 • Capital grants and contributions moved to Capital Grants Unapplied Account -
(12,227) • Statutory provision for the financing of capital investment charged against
the General Fund and HRA balances (9,910)
(9,161) • Capital expenditure charged against the General Fund and HRA balances (8,253)
(50,500) (40,034)
241 Movements in the market value of Investment Properties debited or credited to
the Comprehensive Income and Expenditure Statement
17
(334,901) Balance at 31 March (329,252)
Employee Statutory Adjustment Account
The Employee Statutory Adjustment Account absorbs the differences that would otherwise arise on the General Fund
Balance from accruing for compensated absences earned but not taken in the year. Statutory arrangements require that
the impact on the General Fund Balance is neutralised by transfers to or from the Account.
2015-16
£000
2016-17
£000
2016-17
£000
6,581 Balance at 1 April 6,386
(6,581) Settlement or cancellation of accrual made at the end of the preceding year (6,386)
6,386 Amounts accrued at the end of the current year 6,966
(195)
Amount by which officer remuneration charged to the Comprehensive Income
and Expenditure Statement on an accruals basis is different from remuneration
chargeable in the year in accordance with statutory requirements
580
6,386 Balance at 31 March 6,966

Page 54 of 75
Pensions Reserve
The Pensions Reserve absorbs the timing differences arising from the different arrangements for accounting for post-
employment benefits and for funding benefits in accordance with statutory provisions. The debit balance on the
Pensions Reserve shows a substantial shortfall in the benefits earned by past and current employees and the resources
Stirling Council has set aside to meet them. The statutory provisions will ensure that funding will have been set aside by
the time the benefits come to be paid.
2015-16
£000
2016-17
£000
266,735 Balance at 1 April 216,229
6,990 Return on Pension Assets (71,084)
(59,409) Actuarial (gains) / losses arising on changes in financial assumptions 158,698
(9,589) Actuarial (gains) / losses arising from other experience 2,574
26,169 Reversal of items relating to retirement benefits debited or credited to the Surplus or Deficit
on the Provision of Services in the Comprehensive Income and Expenditure Statement 25,877
(14,667) Employer’s pensions contributions and direct payments to pensioners payable in the year (16,473)
216,229 Balance at 31 March 315,821
24. Leases
Leases are classified as finance leases where the terms of the lease transfer substantially all the risks and rewards of the
ownership of the property, plant or equipment from the lessor to the lessee. All other leases are classified as operating
leases. Where a lease covers both land and buildings, these elements are considered separately for classification.
Assets acquired by Stirling Council under finance leases are shown in the Balance Sheet together with a liability to pay
outstanding rentals. Rental payments are apportioned between the finance charge and the reduction of the outstanding
obligation, with the finance charge being allocated and charged to revenue over the term of the lease.
Rental payments made by Stirling Council under operating leases are charged to the Comprehensive Income and
Expenditure Statement as an expense of the services benefiting from use of the leased property, plant or equipment.
Charges are made on a straight-line basis over the life of the lease.
Where Stirling Council grants an operating lease to a lessee over a property or an item of plant or equipment, the asset
is retained in the Balance Sheet. Rental income is credited to the Comprehensive Income and Expenditure Statement
with credits being made on a straight-line basis over the life of the lease.
Council as Lessee
Operating Leases - Stirling Council has a number of operational lease arrangements in respect of property and vehicles.
Minimum lease payments payable under non-cancellable leases in future years are detailed below.
31 March 2016
£000
31 March 2017
£000
Not later than one year 320 740
Later than one year and not later than five years 1,065 2,434
Later than five years 5,408 5,046
6,793 8,220
The expenditure charged to relevant Services in the Comprehensive Income and Expenditure Statement during 2016-17
in relation to these lease payments was £0.549m (2015-16, £0.321m).
Finance Leases - During 2016-17, finance lease payments of £1.974m were made in respect of the Balfron PFI and
Schools PPP contracts (2015-16, £2.114m) as outlined in note 21. There were no other finance lease payments.
Council as Lessor
Operating Leases - Stirling Council leases out property under operating leases for the following purposes:
• For the provision of community services, such as sports facilities, tourism services and community centres
• For economic development purposes to provide suitable affordable accommodation for local businesses
Minimum lease payments receivable under non-cancellable leases in future years are as follows:
31 March 2016
£000
31 March 2017
£000
Not later than one year (2,265) (2,615)
Later than one year and not later than five years (5,945) (6,194)
Later than five years (22,495) (24,348)
(30,705) (33,157)
The expected minimum lease payments receivable as at 31 March 2016 have been revised down due to the cessation of
the Wellgreen Car Park lease from 31 March 2018 and its replacement with a Service Contract arrangement.
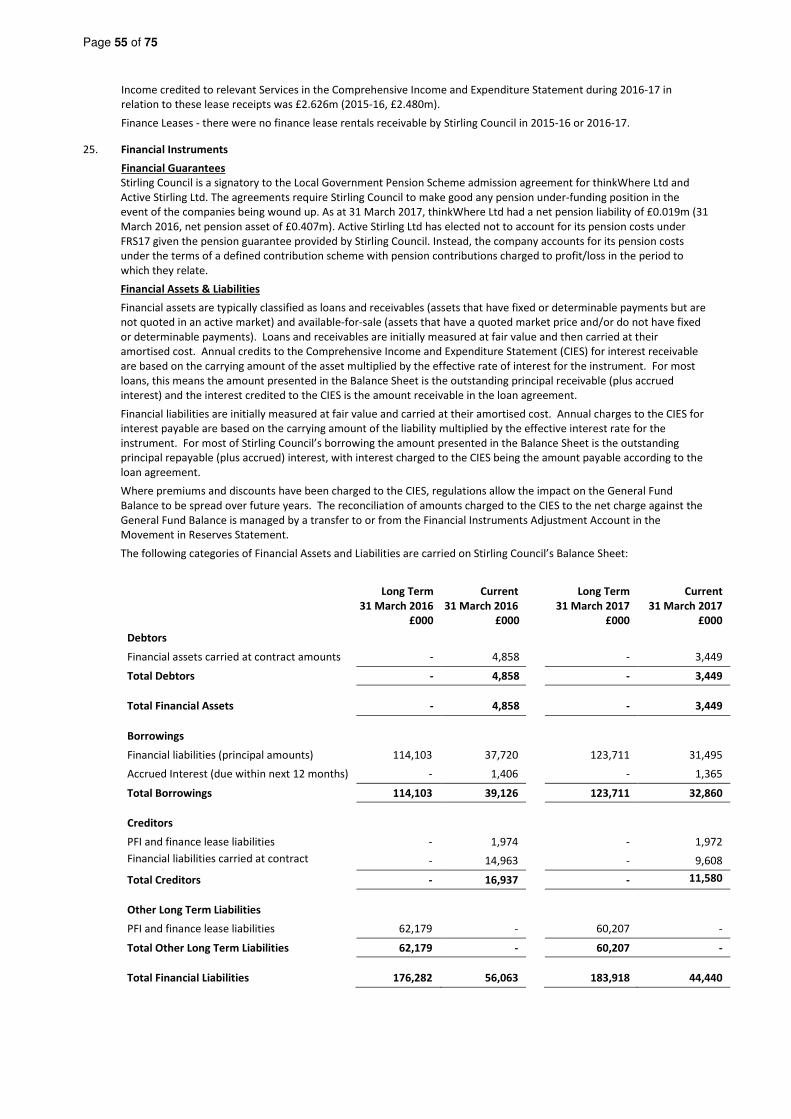
Page 55 of 75
Income credited to relevant Services in the Comprehensive Income and Expenditure Statement during 2016-17 in
relation to these lease receipts was £2.626m (2015-16, £2.480m).
Finance Leases - there were no finance lease rentals receivable by Stirling Council in 2015-16 or 2016-17.
25. Financial Instruments
Financial Guarantees
Stirling Council is a signatory to the Local Government Pension Scheme admission agreement for thinkWhere Ltd and
Active Stirling Ltd. The agreements require Stirling Council to make good any pension under-funding position in the
event of the companies being wound up. As at 31 March 2017, thinkWhere Ltd had a net pension liability of £0.019m (31
March 2016, net pension asset of £0.407m). Active Stirling Ltd has elected not to account for its pension costs under
FRS17 given the pension guarantee provided by Stirling Council. Instead, the company accounts for its pension costs
under the terms of a defined contribution scheme with pension contributions charged to profit/loss in the period to
which they relate.
Financial Assets & Liabilities
Financial assets are typically classified as loans and receivables (assets that have fixed or determinable payments but are
not quoted in an active market) and available-for-sale (assets that have a quoted market price and/or do not have fixed
or determinable payments). Loans and receivables are initially measured at fair value and then carried at their
amortised cost. Annual credits to the Comprehensive Income and Expenditure Statement (CIES) for interest receivable
are based on the carrying amount of the asset multiplied by the effective rate of interest for the instrument. For most
loans, this means the amount presented in the Balance Sheet is the outstanding principal receivable (plus accrued
interest) and the interest credited to the CIES is the amount receivable in the loan agreement.
Financial liabilities are initially measured at fair value and carried at their amortised cost. Annual charges to the CIES for
interest payable are based on the carrying amount of the liability multiplied by the effective interest rate for the
instrument. For most of Stirling Council’s borrowing the amount presented in the Balance Sheet is the outstanding
principal repayable (plus accrued) interest, with interest charged to the CIES being the amount payable according to the
loan agreement.
Where premiums and discounts have been charged to the CIES, regulations allow the impact on the General Fund
Balance to be spread over future years. The reconciliation of amounts charged to the CIES to the net charge against the
General Fund Balance is managed by a transfer to or from the Financial Instruments Adjustment Account in the
Movement in Reserves Statement.
The following categories of Financial Assets and Liabilities are carried on Stirling Council’s Balance Sheet:
Long Term
31 March 2016
£000
Current
31 March 2016
£000
Long Term
31 March 2017
£000
Current
31 March 2017
£000
Debtors
Financial assets carried at contract amounts - 4,858 - 3,449
Total Debtors - 4,858 - 3,449
Total Financial Assets - 4,858 - 3,449
Borrowings
Financial liabilities (principal amounts) 114,103 37,720 123,711 31,495
Accrued Interest (due within next 12 months) - 1,406 - 1,365
Total Borrowings 114,103 39,126 123,711 32,860
Creditors
PFI and finance lease liabilities - 1,974 - 1,972
Financial liabilities carried at contract
amount - 14,963 - 9,608
Total Creditors - 16,937 - 11,580
Other Long Term Liabilities
PFI and finance lease liabilities 62,179 - 60,207 -
Total Other Long Term Liabilities 62,179 - 60,207 -
Total Financial Liabilities 176,282 56,063 183,918 44,440

Page 56 of 75
Income, Expenses, Gains & Losses
There were no gains or losses arising from financial instruments during the year. Income and expenses associated with
financial instruments are detailed below:
2015-16 2016-17
Financial
Liabilities
Amortised
Cost £000
Total
£000
Financial
Liabilities
Amortised
Cost £000
Total
£000
8,308 8,308 Interest Expense 8,159 8,159
6,486 6,486 Schools PFI/PPP Interest Charges 6,195 6,195
14,794 14,794 Net (Gain)/Loss for the year 14,354 14,354
Fair Value of Assets and Liabilities
Financial assets and liabilities are carried in the Balance Sheet at amortised cost. The fair value of financial assets and
liabilities is required to be disclosed to enable a comparison to the carrying amounts in the Balance Sheet. Fair value is
defined as the price that would be received to sell an asset or paid to transfer a liability in an orderly transaction
between market participants at the measurement date, emphasising that fair value is a market-based measurement, not
an authority specific measurement. Fair value does not need to be disclosed when the carrying amount is a reasonable
approximation of fair value.
Fair Value of Financial Assets and Financial Liabilities that are not measured at Fair Value (but for which Fair Value
disclosures are required)
Financial liabilities and financial assets represented by loans and receivables are carried on the Balance Sheet at
amortised cost. Their fair value can be assessed by calculating the present value of the cash flows that will take place
over the remaining term of the instruments (Level 2: inputs other than quoted prices that are observable for the
financial asset/liability), using the following assumptions:
• For loans receivable prevailing benchmark market rates have been used to provide the fair value.
• Fair value disclosures are not required for short-term trade payables and receivables as the carrying amount is a
reasonable approximation fair value.
• For PWLB loans, fair value has been estimated at the cost of taking out a new loan at PWLB new loan (certainty)
rates applicable to existing loans at the Balance Sheet date.
• For non-PWLB loans, fair values have been calculated using PWLB new market loan discount rates.
• For PFI/PPP Liabilities, PWLB Annuity Rates have been used as a proxy rate and fair values estimated using new
borrowing (certainty rate) discount rates.
• No early repayment or impairment is recognised.
The fair value of assets and liabilities are as follows:
31 March 2016 31 March 2017
Carrying
Amount
£000
Fair Value
New
Borrowing
Rate
£000
Carrying
Amount
£000
Fair Value
New
Borrowing
Rate
£000
(118,013) (177,964) PWLB Loans (123,263) (193,404)
(33,810) (34,050) Non-PWLB Loans (31,943) (33,052)
(151,823) (212,014) Total Debt (155,206) (226,456)
(64,153) (94,810) PFI/PPP Finance Lease Liability (62,179) (94,537)
(215,976) (306,824) Total Financial Liabilities (217,385) (320,993)
The fair value is greater than the carrying amount because Stirling Council’s borrowing portfolio includes a number of
fixed rate loans where the interest rate payable is higher than the comparable loan interest rates at the Balance Sheet
date. The difference between the fair value and the carrying value thereby reflects the premiums that would be payable
on the early redemption of these fixed rate loans, under a purely hypothetical situation, thereby showing a notional
future loss (based on economic conditions at 31 March 2017) arising from a commitment to pay interest to lenders
above current market rates.
Stirling Council has a continuing ability to borrow at concessionary rates from the PWLB rather than from the markets,
termed the PWLB Certainty interest rates. The fair value figure presented above for PWLB loans is based on new
borrowing rates however, the Council cannot settle these loans at this amount as PWLB charge penalties for early
repayment, based on a schedule of premature repayment rates. The fair value calculated on this basis results in the
carrying amount of £123.263m being valued at £227.294m which represents the amount that would need to be paid to
PWLB to settle these loans at 31 March 2017 i.e. a penalty charge for early redemption of £104.031m.

Page 57 of 75
26. Nature and Extent of Risks Arising from Financial Instruments
Stirling Council’s activities expose it to a variety of financial risks. The key risks are:
• Credit risk - the possibility that other parties might fail to pay amounts due to Stirling Council
• Re-financing risk - the possibility that Stirling Council might be required to renew a financial instrument on
maturity on disadvantageous interest rates or terms.
• Liquidity risk - the possibility that Stirling Council might not have funds available to meet its commitments to
make payments
• Market risk - the possibility that financial loss might arise for Stirling Council as a result of changes in such
measures as interest rates and stock market movements.
Stirling Council’s overall risk management programme focuses on the unpredictability of financial markets and seeks to
minimise potential adverse effects on the resources available to fund services. Risk management is carried out by a
central treasury team, under polices approved by Stirling Council in the annual Treasury Management Financial Strategy.
Stirling Council provides written principles for overall risk management, as well as written policies covering specific
areas, such are interest rate risk, credit risk and the investment of surplus cash. The Treasury Management Financial
Strategy 2016-17 was approved on 31 March 2016 and is available on Stirling Council’s website.
Credit Risk
Credit risk arises from deposits with banks and financial institutions, as well as credit exposures to Stirling Council’s
customers. This risk is minimised through the Treasury Management Financial Strategy (Annual Investment Strategy and
Counterparty Policy) which requires that deposits are not made with financial institutions unless they meet identified
minimum credit criteria and sets maximum monetary and time limits for deposits with financial institutions. For 2016-
17, Stirling Council determined that until there was greater stability in the world economy, deposits would only be
undertaken with UK financial institutions, with priority given to those with a significant level of government support.
Stirling Council’s maximum exposure to credit risk in relation to its investments in financial institutions cannot be
assessed generally as the risk of an institution failing to make interest payments or repay principal sums will be specific
to each individual institution. A risk of irrecoverability applies to all of Stirling Council’s deposits but there was no
evidence at 31 March 2017 that this was likely to crystallise: Stirling Council’s levels of deposits were relatively low and
were held only with UK government backed institutions. At 31 March 2017, a deposit of £3.100m held with the Royal
Bank of Scotland was classed as cash and cash equivalents, being invested only for operational cash flow purposes. No
credit limits were exceeded during the period.
Stirling Council does not generally allow credit for its customers, such that £1.998m of the £3.284m balance is past its
due date for payment. This amount can be analysed by age as follows:
31 March 2016
£000
31 March 2017
£000
Less than 30 days 911 454
31 – 60 days 254 267
61 – 90 days 113 67
More than 90 days 1,134 1,210
2,412 1,998
Re-financing Risk
The longer term risk to Stirling Council relates to managing the exposure to replacing financial instruments as they
mature: there is a refinancing risk that Stirling Council will be bound to replenish a significant proportion of its debt at a
time when market rates may be volatile, uncertain or unfavourable. This risk is addressed in the treasury management
strategy and formulation of prudential indicators: the calculation of upper and lower limits regarding the maturity
structure of borrowings is designed to avoid large concentrations of debt with the same maturity structure. The
maturity profile of financial liabilities is regularly reviewed to identify opportunities to improve the profile through the
restructure of existing debt or new borrowing. Stirling Council’s debt portfolio is predominantly PWLB debt and the
current practice of a separate schedule of early repayment rates presents a further element of refinancing risk as this
will have an impact of the cost effectiveness of debt rescheduling.
The maturity analysis of financial liabilities (principal amounts) is as follows:
31 March 2016
£000
31 March 2017
£000
Less than one year (37,720) (31,495)
Between 1 and 2 years (4,512) (2,470)
Between 2 and 5 years (11,742) (11,332)
Between 5 and 10 years (23,518) (24,825)
Between 10 and 20 years (19,647) (16,875)
Between 20 and 30 years (833) (2,357)
Between 30 and 40 years (5,000) (17,625)
Between 40 and 50 years (48,852) (48,227)
(151,824) (155,206)

Page 58 of 75
All trade and other payables are due to be paid in less than one year and are not included in the above table. Temporary
Borrowing of £26.0m is included in amounts maturing in less than one year (£30.9m as at 31 March 2016).
Liquidity Risk
Stirling Council has a comprehensive cash flow management system that seeks to ensure that cash is available as
needed. If unexpected movements happen, Stirling Council has ready access to borrowings from the money markets
and the Public Works Loan Board. Stirling Council is also required to provide a balanced budget under the Local
Government Finance Act 1992, which ensures sufficient monies are raised to cover annual expenditure. There is
therefore no significant risk that it will be unable to raise finance to meet its commitments under financial instruments.
Market Risk
Stirling Council is exposed to interest rate movements on its borrowings and investments. As Stirling Council’s debt
portfolio predominantly comprises fixed rate debt, there is considerable certainty regarding the costs of financing such
debt and the subsequent charge to the Comprehensive Income and Expenditure Statement (CIES). Movements in
interest rates have a complex impact on Stirling Council, depending on how variable and fixed interest rates move across
differing financial instrument periods. For instance, a rise in interest rates would have the following effects:
• Borrowings at variable rates – the interest expense charged to the CIES will rise
• Borrowings at fixed rates – the fair value of the liabilities borrowings will fall (no impact on revenue balances)
• Investments at variable rates – the interest income credited to the CIES will rise
• Investments at fixed rates – the fair value of the assets will fall (no impact on revenue balances)
Borrowings are not carried at fair value on the Balance Sheet, so nominal gains and losses on fixed rate borrowings
would not impact on the Surplus or Deficit on the Provision of Services or Other Comprehensive Income and
Expenditure. However, changes in interest payable and receivable on variable rate borrowings and investments will be
posted to the Surplus or Deficit on the Provision of Services and affect the General Fund Balance.
Stirling Council has a number of strategies for managing interest rate risk. The annual treasury management strategy
draws together Stirling Council’s prudential and treasury indicators and its expected treasury operations, including
expectations of interest rate movements. This strategy sets out maximum limits for fixed and variable interest rate
exposures. Treasury Management staff monitor market and forecast interest rates during the year to adjust exposures
appropriately.
At 31 March 2017, if interest rates had been 1% higher with all other variables held constant, the financial effect on the
Surplus or Deficit on Provision of Services would have been a credit of £0.043m, of which £0.012m relates to HRA. The
decrease in the fair value of fixed rate borrowing liabilities using new borrowing rates would be £28.654m. The impact of
a 1% fall in interest rates would be the same values but with the movements being reversed.
27. Related Parties
Stirling Council is required to disclose material transactions with related parties, being bodies or individuals that have
the potential to control or influence the Council or to be controlled or influenced by the Council. Disclosure allows
readers to assess the extent to which Stirling Council might have been constrained in its ability to operate
independently, or might have secured the means to limit another party’s ability to bargain freely with the Council.
The Scottish Government
The Scottish Government has significant influence over the general operations of Stirling Council, being responsible for
providing the statutory framework within which the Council operates. The Scottish Government also provides the
majority of Stirling Council’s funding in the form of grants and prescribes the terms of many of the transactions that the
Council has with other parties (such as Council Tax bills and Housing Benefits). Grants received from the Scottish
Government are set out in note 8.
Officers and Elected Members
There are no significant related party transactions with Officers of Stirling Council. Elected members of Stirling Council
have direct control over the Council’s financial and operating policies. The total of members’ allowances paid in 2016-17
is shown in the Remuneration Report. Each member’s registered interests can be found at the following link by clicking
on their photograph http://my.stirling.gov.uk/councillors/view/3.
Entities Controlled or Significantly Influenced by the Council
Stirling Council has relationships with a number of Companies, Associations, Trusts, Joint Committees and Voluntary
Organisations. All of these associations facilitate the discharge of Stirling Council’s functions in terms of Section 69 of the
Local Government (Scotland) Act 1973. Where Stirling Council has a controlling and/or significant influence over an
entity, the entity is consolidated within the Council’s Group Accounts. Further information relating to these entities is
included in the notes to the Group Accounts on pages 69-70.
The following table shows significant transactions between Stirling Council and relevant associated entities.
2015-16
£000
2016-17
£000
Contributions made to Clackmannanshire and Stirling Integration Joint Board - 32,594
Commissioning income received from Clackmannanshire and Stirling Integration Joint Board - (32,594)
Requisition payment made to Central Scotland Valuation Joint Board 801 731
Management fee paid to Active Stirling Ltd 1,397 1,397

Page 59 of 75
Housing Revenue Account
The HRA Income and Expenditure Statement shows the economic cost in the year of providing housing services in
accordance with generally accepted accounting practices, rather than the amount to be funded from rents and
government grants. Authorities charge rents to cover expenditure in accordance with regulations; this may be different
from the accounting cost. The increase or decrease in the year, on the basis on which rents are raised, is shown in the
Movement on the Housing Revenue Account Statement.
Restated
2015-16 2016-17
£’000 £’000
Income
(17,763) Dwelling Rents (17,937)
(436) Non-dwelling Rents (440)
(56) HRA Share of Corporate and Democratic Core (56)
(1,546) Other Income (1,581)
(19,801) Total Income (20,014)
Expenditure
5,443 Repairs and Maintenance 5,291
4,363 Supervision and Management 4,079
9,849 Depreciation and Impairment of Non-Current Assets 12,796
226 HRA Share of Corporate and Democratic Core 219
198 Increase in the Allowance for Bad Debts/Debt Write-offs 198
251 Other Expenditure 266
20,330 Total Expenditure 22,849
529 Net Expenditure of HRA Services Included in the Comprehensive Income and
Expenditure Statement 2,835
HRA Share of the Operating Income and Expenditure Included in the Comprehensive
Income and Expenditure Statement:
(437) (Gain)/Loss on Sale of HRA Non-Current Assets (678)
2,270 Interest Payable and Similar Charges 2,202
(3,346) Capital Grants & Contributions Applied to Capital Financing (3,205)
(28) Interest and Investment Income (32)
89 Pension Past Service Costs (including Curtailments) 387
818 Net Interest Cost/Income on Pension Liabilities/Assets 710
(105) (Surplus) / Deficit for the Year on HRA Services 2,219
The 2015-16 comparative figures have been restated as a result of the change which now requires local authorities to report
performance on the basis of how they are structured and how they operate, monitor and manage financial performance, as
opposed to previously reporting the cost of individual services in accordance with the requirements of the Service Reporting
Code of Practice (SeRCOP). This change has resulted in the HRA Share of Corporate and Democratic Core expenditure and
income now being reported directly within the HRA Income and Expenditure Statement, as opposed to previously being
reported within a separate and distinct Corporate and Democratic Core line within the Comprehensive Income and Expenditure
Statement.
Movement on the Housing Revenue Account Statement
2015-16 Notes 2016-17
£’000 £’000
(236) Balance on the HRA at the End of the Previous Year (486)
(105) (Surplus) / Deficit for the Year on HRA Income and Expenditure Statement 2,219
(145) Adjustments Between Accounting Basis and Funding Basis Under Statute 1 (HRA) (2,469)
(250) (Increase)/Decrease in Year on the HRA (250)
(486) Balance on the HRA at the End of the Current Year (736)

Page 60 of 75
Housing Revenue Account Disclosures
1. Adjustments between Accounting Basis and Funding Basis under Statute
2015-16 2016-17
£’000 £’000
437 Gain/(Loss) on Sale of HRA Non-current Assets 678
3,346 Capital Grants & Contributions Applied to Capital Financing 3,205
(16) Amortisation of intangible assets (21)
(10,011) Non-current asset reval increases/(decreases) to CIES (9,463)
3,365 Reversal of non-current asset reval increases/(decreases) to CIES -
(3,187) Non-current asset depreciation charged to CIES (3,312)
(2,497) Reversal of items relating to retirement benefits (2,418)
1,124 Employer’s pensions contributions 1,241
1,189 Repayment of Debt 1,220
6,107 Capital Expenditure Funded by the HRA 6,402
(2) Transfer to/from Employee Statutory Adjustment Account (1)
(145) Total (2,469)
2. Housing Stock
Stirling Council’s housing stock at 31 March 2017 was 5,587 (5,566 at 31 March 2016) in the following categories:
Property Type 1 Apt 2 Apt 3 Apt 4 Apt 5 Apt 6 Apt+ Total
Bedsit 21 1 0 0 0 0 22
Flat in Close 2 564 618 125 2 0 1,311
Own Door Flat 0 354 411 189 66 0 1,020
Maisonette 0 0 66 11 0 0 77
Bungalow 0 306 44 25 2 1 378
Mid Terrace 0 16 452 452 20 1 941
End Terrace/Semi 0 25 727 914 158 4 1,828
Detached 0 0 0 4 3 3 10
23 1,266 2,318 1,720 251 9 5,587
3. Rent Arrears
Rent arrears relating to current tenants in Council dwellings and lockups totalled £751,012 as at 31 March 2017 (£754,020
as at 31 March 2016). Rent arrears relating to former tenants in Council dwellings and lockups totalled £1,036,116 as at 31
March 2017. Arrears of £176,630 were written off during the year, which related to former housing tenants.
4. Movement in the Allowance for Bad Debts
An accumulated total provision of £1,218,779 has been made for Bad and Doubtful Debts, of which £1,167,000 is for
dwellings and lockups, with the balance of £51,779 relating to other debtors. This is compared to a total of £1,203,936 in
2015-16, of which £1,144,000 was for dwellings and lockups with the balance of £59,936 relating to other debtors.
5. Rent Lost Due To Empty Properties
Rent lost as a result of empty properties during the year was £0.216m (2015-16, £0.177m).

Page 61 of 75
Council Tax Income Account
Stirling Council raises taxes from its residents through the Council Tax, which is a property taxed linked to property values. Each
dwelling in the Stirling Council area is placed into one of eight valuation bands (A to H). Stirling Council determines the annual
tax for a band D property and all other properties are charged a proportion of this, with lower valued properties (Bands A to C)
paying less and higher valued properties (D to F) paying more.
2015-16
£000
2016-17
£000
(53,364) Gross Council Tax Levied and Contributions in Lieu (53,844)
Adjusted for:
4,186 Council Tax Reduction Scheme 3,994
7,254 Other Discounts and Reductions 7,415
362 Provision for Non-collection 392
(41,562) (42,043)
(2) Community Charge Recovered -
(41,564) Net Council Tax Income per the Comprehensive Income and Expenditure Statement (42,043)
Calculation of the Council Tax Base 2016-17
No of
Dwellings
Long Term
Empty
Premium
Exempt
Dwellings
Disabled
Relief
Discounts
25%
Discounts
50%
Total
Dwellings
Ratio to
Band D
Band D
Equivalents
Band A* - - - 17 - - 17 5/9 9
Band A 5,679 25 (309) 29 (736) (9) 4,679 6/9 3,119
Band B 8,686 44 (511) (10) (912) (16) 7,281 7/9 5,663
Band C 4,561 31 (487) 1 (442) (8) 3,656 8/9 3,250
Band D 4,756 35 (340) 17 (414) (14) 4,040 1 4,040
Band E 6,285 33 (281) (17) (439) (14) 5,567 11/9 6,804
Band F 5,160 23 (142) 4 (263) (13) 4,769 13/9 6,889
Band G 5,108 16 (86) (38) (170) (8) 4,822 15/9 8,037
Band H 707 11 (22) (3) (15) (2) 676 18/9 1,352
Total 39,163
Class 17 dwellings (MoD) 16
Provision for non-collection (783)
Council Tax Reduction Scheme (3,632)
Council Tax Base 34,764
Band A* refers to properties subject to disabled relief
Dwellings fall within a valuation band between A to H, which is determined by the Assessor. The Council Tax charge is calculated
using the Council Tax Base i.e. Band D equivalents. This value is then increased or decreased depending on the band. Based on
the Council Tax base available to Stirling Council, the band D charge for 2016-17 was £1,197 (2015-16, £1,197).
Stirling Council charges per band for 2016-17
Band A £798 Band E £1,463
Band B £931 Band F £1,729
Band C £1,064 Band G £1,995
Band D £1,197 Band H £2,394
Council Tax Discount on Second Homes and Long-Term Empty Properties
From 1 April 2005, local authorities were granted discretion to reduce or retain the Council Tax discount on second homes and
long-term empty properties to between 10% and 50%. Stirling Council agreed to reduce the Council Tax discount on second
homes and long-term empty properties to 10%. From 1 April 2013, local authorities were granted discretion to remove the 10%
discount and levy an additional charge up to 100% of the Council Tax on properties that were empty in excess of 12 months,
except in certain circumstances. Stirling Council introduced the full 100% levy from 1 July 2014. The additional income
generated from the additional charge has to be retained locally for the provision of new-build affordable social housing to meet
locally determined priorities.

Page 62 of 75
Non-Domestic Rates Income Account
Local authorities collect Non Domestic Rates (NDR) income which is remitted to the Scottish Government, pooled nationally and
re-distributed back to local authorities along with the General Revenue Grant. As local authorities act as an agent of the Scottish
Government when collecting NDR, the Code requires that local authorities only recognise a net NDR creditor or debtor due to or
from the Scottish Government in the Balance Sheet.
The table below outlines the actual levels of NNDR collected by Stirling Council and the overall increase/decrease between the
rates collected and the amount that Stirling Council is entitled to receive under the National Pooling arrangement.
2015-16
£000
2015-16
£000
2016-17
£000
2016-17
£000
(54,381) Gross rates levied and contributions in lieu (56,405)
11,060 Reliefs and other deductions 11,021
651 Provision for bad and doubtful debts 584
(18) Other adjustments (20)
11,693 11,585
(42,688) Net Non-Domestic Rate Income (44,820)
(119) Discretionary Relief charged to General Fund (116)
(42,807) Income for Contribution to National Non Domestic Rate Pool (44,936)
42,807 Contribution to National Non Domestic Rate pool 44,936
(45,400) Distribution from National Non Domestic Rate Pool (46,216)
(2,593) Net Contribution to/(from) National Non Domestic Rate Pool (1,280)
(45,400) Net Non-Domestic Rate Income to Comprehensive Income and
Expenditure Statement (46,216)
Net Rateable Value Calculation
The amount paid for NNDR is determined by the rateable value placed on the property by the Assessor multiplied by the rate
per £, which is determined each year by the Scottish Government. The NNDR poundage rate set by the Scottish Government for
2016-17 was 48.4p (2015-16, 48.0p). Properties with a rateable value greater than £35,000 are charged a supplement of 2.6p
per £ (2015-16, 1.3p). Properties with a rateable value of £18,000 or less may be eligible for Small Business Bonus relief.
The rateable values and numbers of rateable subjects as at 1 April 2016 were:
Subject Classification No. of
Subjects
% Rateable
Value (£000)
%
Commercial 3,062 61.13% 70,947 62.05%
Industrial 853 17.03% 13,904 12.16%
Miscellaneous 1,048 20.92% 24,472 21.40%
Formula Valued Subjects 46 0.92% 5,016 4.39%
5,009 100.00% 114,339 100.00%
The comparative rateable values and numbers of rateable subjects as at 1 April 2015 were:
Subject Classification No. of
Subjects
% Rateable
Value (£000)
%
Commercial 3,033 60.77% 70,894 62.08%
Industrial 871 17.45% 14,034 12.29%
Miscellaneous 1,056 21.16% 24,416 21.38%
Formula Valued Subjects 31 0.62% 4,858 4.25%
4,991 100.00% 114,202 100.00%
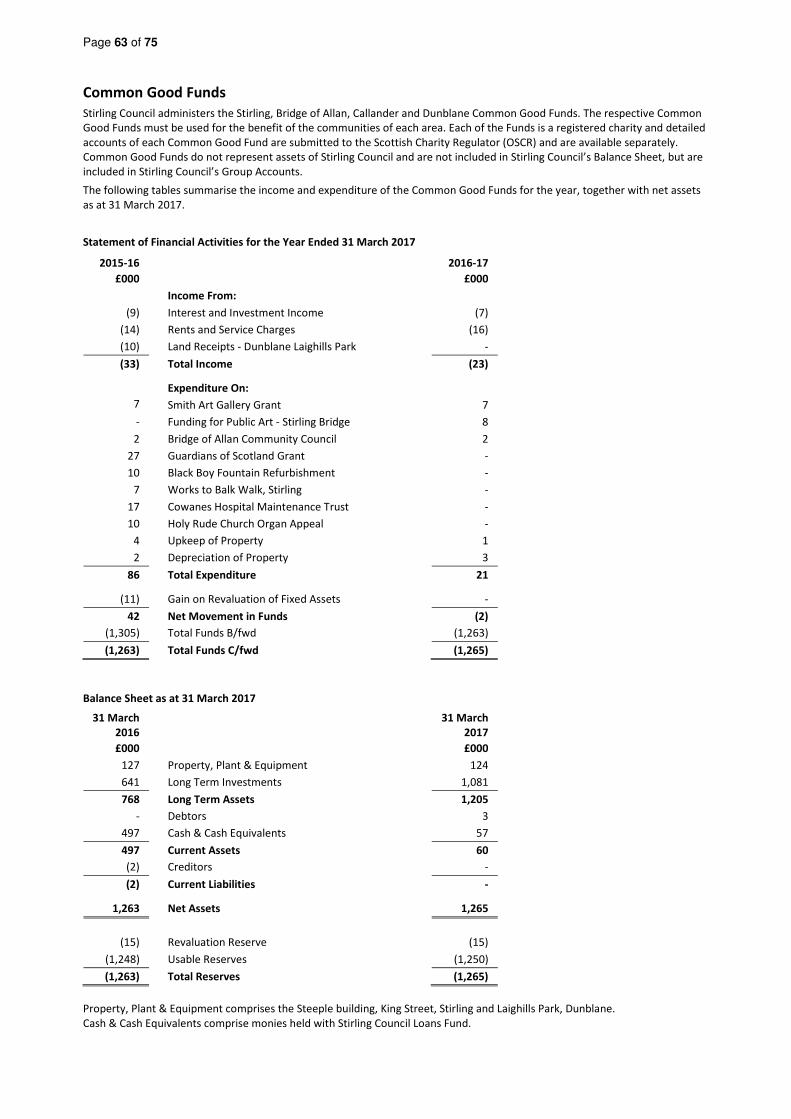
Page 63 of 75
Common Good Funds
Stirling Council administers the Stirling, Bridge of Allan, Callander and Dunblane Common Good Funds. The respective Common
Good Funds must be used for the benefit of the communities of each area. Each of the Funds is a registered charity and detailed
accounts of each Common Good Fund are submitted to the Scottish Charity Regulator (OSCR) and are available separately.
Common Good Funds do not represent assets of Stirling Council and are not included in Stirling Council’s Balance Sheet, but are
included in Stirling Council’s Group Accounts.
The following tables summarise the income and expenditure of the Common Good Funds for the year, together with net assets
as at 31 March 2017.
Statement of Financial Activities for the Year Ended 31 March 2017
2015-16 2016-17
£000 £000
Income From:
(9) Interest and Investment Income (7)
(14) Rents and Service Charges (16)
(10) Land Receipts - Dunblane Laighills Park -
(33) Total Income (23)
Expenditure On:
7
Smith Art Gallery Grant 7
- Funding for Public Art - Stirling Bridge 8
2 Bridge of Allan Community Council 2
27 Guardians of Scotland Grant -
10 Black Boy Fountain Refurbishment -
7 Works to Balk Walk, Stirling -
17 Cowanes Hospital Maintenance Trust -
10 Holy Rude Church Organ Appeal -
4 Upkeep of Property 1
2 Depreciation of Property 3
86 Total Expenditure 21
(11) Gain on Revaluation of Fixed Assets -
42 Net Movement in Funds (2)
(1,305) Total Funds B/fwd (1,263)
(1,263) Total Funds C/fwd (1,265)
Balance Sheet as at 31 March 2017
31 March
2016
31 March
2017
£000 £000
127 Property, Plant & Equipment 124
641 Long Term Investments 1,081
768 Long Term Assets 1,205
- Debtors 3
497 Cash & Cash Equivalents 57
497 Current Assets 60
(2) Creditors -
(2) Current Liabilities -
1,263 Net Assets 1,265
(15) Revaluation Reserve (15)
(1,248) Usable Reserves (1,250)
(1,263) Total Reserves (1,265)
Property, Plant & Equipment comprises the Steeple building, King Street, Stirling and Laighills Park, Dunblane.
Cash & Cash Equivalents comprise monies held with Stirling Council Loans Fund.

Page 64 of 75
Trust Funds
Stirling Council administers 20 Charitable Trusts which have arisen mainly as a result of gifts, bequests or donations to be used
for the benefit of citizens within the Stirling Council area.
Stirling Council is currently conducting a review of the smaller charitable trusts which it administers with the objective of either
reorganising these into fewer charities, or transferring the balances held to external charitable organisations who may be better
placed to meet the purposes for which the trusts were originally established.
Balances held in the Charitable Trusts have been consolidated within Stirling Council’s Group Accounts in accordance with
required accounting practice. Detailed accounts of each Charitable Trust are submitted to the Scottish Charity Regulator (OSCR)
on an annual basis and are available from the Chief Finance Officer, Stirling Council.
The figures below summarise the Income and Expenditure arising during the year and the aggregate Assets and Liabilities of the
Charitable Trusts at the year end.
Statement of Financial Activities for the year ended 31 March 2017
2015-16 2016-17
Revenue
Reserves
Capital
Reserves
Total
Funds
Revenue
Reserves
Total
Funds
£000 £000 £000 £000 £000
Incoming Resources from Generated Funds
- - - Donations (3) (3)
(3) - (3) Investment Income (1) (1)
(3) - (3) Total Incoming Resources (4) (4)
Resources Expended - Charitable Activities
2 - 2 Repairs/Energy/Upkeep of Grounds 5 5
521 - 521 Payments To Third Parties 1 1
523 - 523 Total Resources Expended 6 6
Other Recognised (Gains)/Losses
(2) 2 - (Gain)/Loss on Investments - -
(2) 2 - Total Recognised (Gains)/Losses - -
518 2 520 Net Movement In Funds 2 2
(774) (2) (776) Total Funds B/fwd (256) (256)
(256) - (256) Total Funds C/fwd (254) (254)
Balance Sheet as at 31 March 2017
2015-16
£000
2016-17
£000
363 Property, Plant & Equipment 432
363 Long Term Assets 432
256 Cash & Cash Equivalents 254
256 Current Assets 254
619 Net Assets 686
(363) Revaluation Reserve (432)
(256) Usable Reserves (254)
(619) Total Reserves (686)
Property, Plant & Equipment comprises the Village Club building, Strathblane. Cash & Cash Equivalents comprise monies held
with Stirling Council Loans Fund.
Stirling Council also administers 21 Other Trusts. Funds held in these Trusts do not represent assets of Stirling Council and are
not included in Stirling Council’s Balance Sheet, nor are they included in Stirling Council’s Group Accounts. Other Trust Fund
revenue balances held as at 31 March 2017 are as follows:
2016
£000
2017
£000
Welfare Bequests (2 Trusts)
Provision of poor relief and amenity improvements 12 13
Education Bequests (7 Trusts)
Provision of school prizes 45 44
Social Services Funds (12 Trusts)
Residential homes donations and care related activities 33 39
Total Other Trusts 90 96

Page 65 of 75
Group Comprehensive Income and Expenditure Statement
The Group Comprehensive Income and Expenditure Statement combines the Income and Expenditure figures of Stirling Council
with Stirling Council’s share of the operating results of those entities in which it has a financial interest.
Restated
2015-16 2015-16 2015-16 Note 2016-17 2016-17 2016-17
Gross
Spend
Gross
Income
Net
Spend
Gross
Spend
Gross
Income
Net
Spend
£000 £000 £000 £000 £000 £000
565 (16) 549 Chief Executive 439 (35) 404
145,610 (23,696) 121,914 Children, Communities and Enterprise 152,046 (21,116) 130,930
43,632 (10,270) 33,362 Clackmannanshire and Stirling Integration Joint
Board 78,817 (46,856) 31,961
81,867 (34,587) 47,280 Localities and Infrastructure 80,877 (32,575) 48,302
801 - 801 Central Scotland Valuation Joint Board 731 - 731
2,356 (1,481) 875 Other Operating Income & Expenditure 8,242 (1,423) 6,819
609 (24) 585 Share of Operating Results of Common Good &
Charitable Trusts 27 (16) 11
4,367 (4,238) 129 Associates, Joint Ventures and Joint Operations
accounted for on an equity basis 38,316 (39,210) (894)
279,807 (74,312) 205,495 Net Cost Of General Services 359,495 (141,231) 218,264
20,330 (19,801) 529 Housing Revenue Account 22,849 (20,014) 2,835
300,137 (94,113) 206,024 Net Cost of Services 382,344 (161,245) 221,099
(480) - (480) Other Operating Expenditure (792) - (792)
23,921 (955) 22,966 Financing & Investment Income/Expenditure 23,044 (987) 22,057
- (233,163) (233,163) Taxation and Non-Specific Grant Income - (221,869) (221,869)
55 - 55 Tax Expenses 59 - 59
- - - Minority Interests - (19) (19)
323,634 (328,231) (4,598) (Surplus)/Deficit on Provision of Services 4 404,655 (384,120) 20,535
(11,984) (Surplus) / Deficit on revaluation of non-current
assets (22,938)
6,990 Return on Pension Assets (71,084)
(68,998) Actuarial Gains / (Losses) on Pension
Assets/Liabilities 161,272
(642)
Share of Other Comprehensive
Income/Expenditure of Associates, Joint
Ventures and Joint Operations
874
(74,634) Other Comprehensive Income/Expenditure MIRS 68,124
(79,232) Total Comprehensive Income/Expenditure MIRS 88,659

Page 66 of 75
Group Movement in Reserves Statement
The Group Movement in Reserves Statement shows the movement in the year on the different reserves held by Stirling Council,
together with the movement in Stirling Council’s share of those entities in which it has a financial interest.
Note
Stirling
Council
Usable
Reserves
£000
Group
Entities
Usable
Reserves
£000
Total
Group
Usable
Reserves
£000
Stirling
Council
Unusable
Reserves
£000
Group
Entities
Unusable
Reserves
£000
Total
Group
Unusable
Reserves
£000
Total
Group
Reserves
£000
Balance b/fwd at 1 April 2015 (24,230) 4,329 (19,901) (160,214) 878 (159,336) (179,237)
Restatement to Opening Balances
b/fwd (Group Shareholdings) - 11 11 - - - 11
Restated Balance b/fwd at 1 April
2015 (24,230) 4,340 (19,890) (160,214) 878 (159,336) (179,226)
Movement in Reserves 2015-16
(Surplus)/deficit on provision of
services CIES (5,201) 603 (4,598) - - - (4,598)
Other Comprehensive
Expenditure/(Income) CIES - - - (73,992) (642) (74,634) (74,634)
Total Comprehensive
Expenditure/(Income) CIES (5,201) 603 (4,598) (73,992) (642) (74,634) (79,232)
Adjustments between accounting
basis & funding basis under
regulations
(640) (1,092) (1,732) 640 1,092 1,732 -
(Increase)/Decrease in 2015-16 (5,841) (489) (6,330) (73,352) 450 (72,902) (79,232)
Balance at 31 March 2016 4 (30,071) 3,851 (26,220) (233,566) 1,328 (232,238) (258,458)
Balance b/fwd at 1 April 2016 (30,071) 3,851 (26,220) (233,566) 1,328 (232,238) (258,458)
Restatement to Opening Balances
b/fwd (Group Shareholdings) - - - - 207 207 207
Restated Balance b/fwd at 1 April
2015 (30,071) 3,851 (26,220) (233,566) 1,535 (232,031) (258,251)
Movement in Reserves 2016-17
(Surplus)/deficit on provision of
services CIES 20,846 (311) 20,535 - - - 20,535
Other Comprehensive
Expenditure/(Income) CIES - - - 67,250 874 68,124 68,124
Total Comprehensive
Expenditure/(Income) CIES 20,846 (311) 20,535 67,250 874 68,124 88,659
Adjustments between accounting
basis & funding basis under
regulations
(17,420) (92) (17,512) 17,420 92 17,512 -
(Increase)/Decrease in 2016-17 3,426 (403) 3,023 84,670 966 85,636 88,659
Balance at 31 March 2017 4 (26,645) 3,448 (23,197) (148,896) 2,501 (146,395) (169,592)

Page 67 of 75
Group Balance Sheet
The Group Balance Sheet shows as at 31 March 2017 the assets and liabilities of the Group and combines Stirling Council’s
assets and liabilities with its share of the assets and liabilities of those entities in which it has a financial interest.
Restated
31 March 2016 Note 31 March 2017
£000 £000
749 Intangible Assets 748
689,996 Property, Plant & Equipment 703,371
4,186 Heritage Assets 4,310
1,797 Investment Property 1,365
1,668 Long Term Investments 1,876
119 Investments in Associates and Joint Ventures 3 967
19,974 Long Term Debtors 19,891
718,489 Long Term Assets 732,528
1,077 Inventories 1,252
15,659 Short Term Debtors 14,650
415 Assets Held for Sale 1,726
12,628 Cash and Cash Equivalents 7,650
29,779 Current Assets 25,278
(39,126) Short Term Borrowing (32,860)
(45,349) Short Term Creditors (42,255)
(1,383) Short Term Provisions (482)
(85,858) Current Liabilities (75,597)
(114,104) Long Term Borrowing (123,711)
(62,179) Finance Lease Liability (60,207)
(736) Capital Grants Receipts in Advance (1,539)
(69) Revenue Grants Receipts in Advance -
(1,329) Long Term Creditors (1,174)
(8,971) Liabilities of Associates and Joint Ventures 3 (10,057)
(216,229) Other Long Term Liability - Pensions (315,821)
(403,617) Long Term Liabilities (512,509)
258,793 Net Assets 169,700
(233,566) Stirling Council Unusable Reserves MIRS (148,896)
(30,071) Stirling Council Usable Reserves MIRS (26,645)
5,179 Group Entities’ Reserves MIRS,1,4 5,949
(258,458) Total Group Reserves MIRS,1 (169,592)
(335) Minority Interests (108)
(258,793) Total Reserves (169,700)
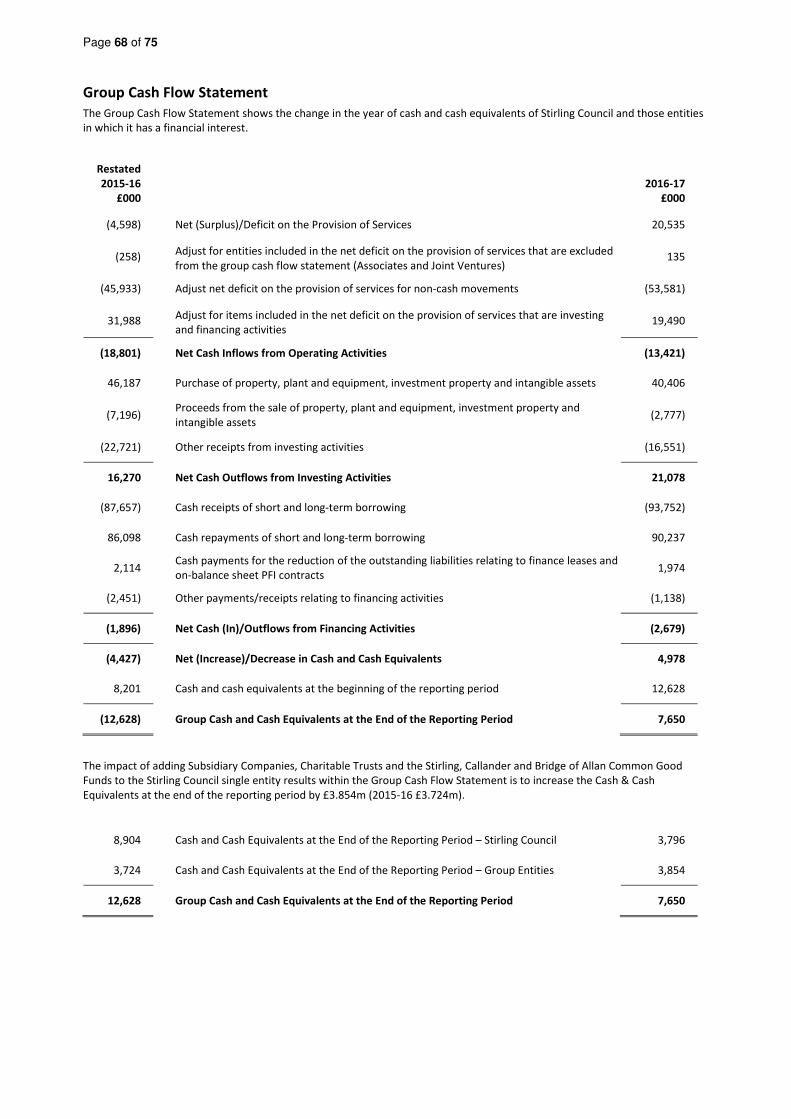
Page 68 of 75
Group Cash Flow Statement
The Group Cash Flow Statement shows the change in the year of cash and cash equivalents of Stirling Council and those entities
in which it has a financial interest.
Restated
2015-16
£000
2016-17
£000
(4,598) Net (Surplus)/Deficit on the Provision of Services 20,535
(258) Adjust for entities included in the net deficit on the provision of services that are excluded
from the group cash flow statement (Associates and Joint Ventures) 135
(45,933) Adjust net deficit on the provision of services for non-cash movements (53,581)
31,988 Adjust for items included in the net deficit on the provision of services that are investing
and financing activities 19,490
(18,801) Net Cash Inflows from Operating Activities (13,421)
46,187 Purchase of property, plant and equipment, investment property and intangible assets 40,406
(7,196) Proceeds from the sale of property, plant and equipment, investment property and
intangible assets (2,777)
(22,721) Other receipts from investing activities (16,551)
16,270 Net Cash Outflows from Investing Activities 21,078
(87,657) Cash receipts of short and long-term borrowing (93,752)
86,098 Cash repayments of short and long-term borrowing 90,237
2,114 Cash payments for the reduction of the outstanding liabilities relating to finance leases and
on-balance sheet PFI contracts 1,974
(2,451) Other payments/receipts relating to financing activities (1,138)
(1,896) Net Cash (In)/Outflows from Financing Activities (2,679)
(4,427) Net (Increase)/Decrease in Cash and Cash Equivalents 4,978
8,201 Cash and cash equivalents at the beginning of the reporting period 12,628
(12,628) Group Cash and Cash Equivalents at the End of the Reporting Period 7,650
The impact of adding Subsidiary Companies, Charitable Trusts and the Stirling, Callander and Bridge of Allan Common Good
Funds to the Stirling Council single entity results within the Group Cash Flow Statement is to increase the Cash & Cash
Equivalents at the end of the reporting period by £3.854m (2015-16 £3.724m).
8,904 Cash and Cash Equivalents at the End of the Reporting Period – Stirling Council 3,796
3,724 Cash and Cash Equivalents at the End of the Reporting Period – Group Entities 3,854
12,628 Group Cash and Cash Equivalents at the End of the Reporting Period 7,650

Page 69 of 75
Notes to the Group Financial Statements
1. Group Accounting Policies
The Financial Statements in the Group Accounts have been prepared in accordance with Stirling Council’s accounting policies.
Stirling Council has adopted the recommendations of the Code, which requires local authorities to consider their interests in all
types of entity to incorporate into Group Accounts.
Stirling Council has accounted for its interest in each Subsidiary using the acquisition method of accounting. Stirling Council’s
interest in each Associate has been accounted for using the equity method of accounting. With regard to the Central Scotland
Valuation Joint Board, Stirling Council's interest reflects the requisition share paid by Stirling Council. Stirling Council has
accounted for its interest in each Joint Venture using the gross equity method of accounting.
Combining Entities
Recognition has been made of Stirling Council's controlling interest in six Subsidiary companies. Active Stirling Ltd is treated as a
subsidiary on account of it being a Charitable Leisure Trust over which Stirling Council has effective control. Raploch URC Ltd and
Raploch URC (Landholdings) Ltd have also been consolidated as subsidiaries as Stirling Council is the sole Member on the Board
of Directors and therefore has effective control. Stirling Council also has effective control over the Stirling, Callander, Bridge of
Allan and Dunblane Common Good Funds and a number of Charitable Trusts, which it administers as sole trustee and, as such,
these are also treated as subsidiaries in the Group Accounts. Stirling Council also consolidates its interests in three Associates
(including Central Scotland Valuation Joint Board) and three Joint Ventures. The Accounting period end for all entities is the 31
March 2017.
Copies of the most recent audited accounts of the combining entities are available from the Chief Finance Officer, Stirling
Council.
The % share of each combining entity’s financial results (after taking account of Minority Interests) is as follows:
Basis for
Consolidation
Treatment
Group
Share
2015-16
%
Net
Exp/(Inc)
2015-16
£000
Net Assets/
(Liabilities)
2015-16
£000
Group
Share
2016-17
%
Net
Exp/(Inc)
2016-17
£000
Net Assets/
(Liabilities)
2016-17
£000
Subsidiaries
Active Stirling Ltd Voting Rights 41.7% (38) 206 41.7% - 205
Raploch URC Ltd Sole Member 50% 1 - 50% - -
Raploch URC Landholdings Ltd Sole Member 50% (8) 367 50% 13 (73)
Steadfast Homes LLP Voting Rights 100% (7) 2 100% (35) 37
Stirling Business Centre Ltd Voting Rights 91.45% 76 354 91.45% 65 283
Stirling Technology Projects Ltd Sole Member 100% (284) 1,197 100% 351 846
Common Good Funds Sole Trustee 100% 42 1,263 100% (1) 1,265
Charitable Trust Funds Sole Trustee 100% 521 619 100% (67) 686
Associates
Central Scotland Valuation Joint Board Requisition 35.4% (465) (1,865) 35.4% 1,025 (2,890)
thinkWhere Ltd Voting Rights 33.3% 83 (143) 33.3% 160 (303)
Joint Ventures
Stirling Development Agency Ltd Voting Rights 50% 33 (6,963) 50% (99) (6,864)
Stirling University Innovation Park Ltd Voting Rights 50% 7 119 50% 4 114
Clackmannanshire and Stirling
Integration Joint Board
Voting Rights 25% - - 25% (853) 853
Total Consolidated Group Entities (39) (4,844) 563 (5,841)
Stirling Council (79,193) 263,637 88,096 175,541
Group Financial Statements (79,232) 258,793 88,659 169,700
Total Consolidated Group Entities (as above) (4,844) (5,841)
Minority Interests (335) (108)
Group Entities’ Reserves (5,179) (5,949)
Page 70 of 75
Subsidiaries
Active Stirling Limited
Since 31 March 2006, Active Stirling Ltd, being a company limited by guarantee and having charitable status, has operated and
managed Stirling Council’s sport and leisure facilities including leisure centres, pavilions and sports pitches in accordance to a
service level agreement with Stirling Council. The main venue is the Stirling Sports Village and Peak Facility at Forthbank. The
land and buildings operated and managed by Active Stirling remain in Stirling Council’s ownership.
Raploch Urban Regeneration Company Ltd
The principal activity of the company is the promotion for the public benefit of urban regeneration in areas of social and
economic deprivation, in particular within the area of Raploch, Stirling. The company is limited by guarantee and has been
granted tax exemption status as a charity by the Inland Revenue. The company has one wholly owned subsidiary, Raploch Urban
Regeneration Company (URC) Landholdings Limited.
Raploch Urban Regeneration Company Landholdings Ltd
Raploch Urban Regeneration Company (URC) Landholdings Ltd, a wholly owned subsidiary of Raploch Urban Regeneration
Company Ltd is the operating company for the Raploch Regeneration project. The Development Agreement between Raploch
Urban Regeneration Company Limited, Raploch URC Landholdings Limited and Stirling Council was signed on 21 June 2007. This
agreed the transfer of over 60 acres of land from Stirling Council to Raploch URC Landholdings Limited.
Steadfast Homes LLP
Steadfast Homes LLP is a limited liability partnership between Stirling Council and the Scottish Futures Trust, supported by the
Scottish Government as guarantor, to deliver up to 175 new-build and refurbished homes in the Stirling area to help meet the
strong demand for affordable mid-market homes for rent.
Stirling Business Centre Limited
The company’s principal activity is to promote and encourage industrial and commercial activity and enterprise in Stirling district
and to make available accommodation for letting. Stirling Council has entered into a lease with the company of the Stirling
Business Centre at Wellgreen Road, Stirling and of Enterprise House at Springkerse Business Park, Stirling.
Stirling Technology Projects Limited
The company was formed for the single purpose of providing an extension to the building occupied by BioReliance Ltd at Stirling
University Innovation Park and thereafter leasing the whole building to BioReliance Ltd. BioReliance Ltd took entry to the
building provided by the company in May 1999 at which point the company began to trade. Stirling Council acts as guarantor in
respect of the company’s obligations under its bank loan agreement. At 31 March 2017 the sum guaranteed was £1.329m
(2015-16, £1.477m).
Associates
Central Scotland Valuation Joint Board
Central Scotland Valuation Joint Board is the statutory body responsible for maintaining the electoral, council tax and non-
domestic rate registers for Stirling, Falkirk and Clackmannanshire Councils.
thinkWhere Ltd
The principal activity of the company is the provision of corporate Geographical Information Services and, in particular, to
Clackmannanshire, Falkirk and Stirling Councils.
Joint Ventures
Stirling Development Agency Ltd
This is a joint venture company whose principal activity is the development and refurbishment of commercial, industrial and
residential properties. The company was formed in March 2008 as a result of the restructuring of City of Stirling Business Parks
(Investments) Limited.
Stirling University Innovation Park Ltd
The principal activity of the company is the development, promotion, marketing, use and management of Stirling University
Innovation Park. Stirling Council acts as guarantor in respect of the company’s obligations under the bank facility it acquired to
assist in the purchase of the head lease interests in the Alpha and Beta Centres. The bank loan amounted to £0.294m at 31
March 2017 (31 March 2016, £0.382m).
Clackmannanshire and Stirling Integration Joint Board
Clackmannanshire and Stirling Integration Joint Board (IJB) is a statutory body established to integrate health and social care
services between Clackmannanshire Council, Stirling Council and NHS Forth Valley. The contribution provided by Stirling Council
to the IJB in 2016/17 was £31.6m, of which £30.8m was funded from General Fund and £0.8m from Housing Revenue Account.
The IJB Board comprises twelve voting members with three (25%) made up of Stirling Council Elected Members.
2. Non-Consolidation Interests in Other Entities
The principal activity of Stirling Enterprise Park Ltd and its wholly owned subsidiary, Stirling Enterprise Ltd, is to promote and
encourage industrial and commercial activity and enterprise and to make available accommodation for letting.
Stirling Council holds the majority of equity capital (83.9% of allotted shares) in Stirling Enterprise Park Ltd, but under normal
practices it does not control the majority of voting rights (3 directors out of 8, or 37.5%), nor does it have the right to appoint
the majority of the governing board. However, in the event of a poll being demanded at a Board meeting (by 2 Directors),
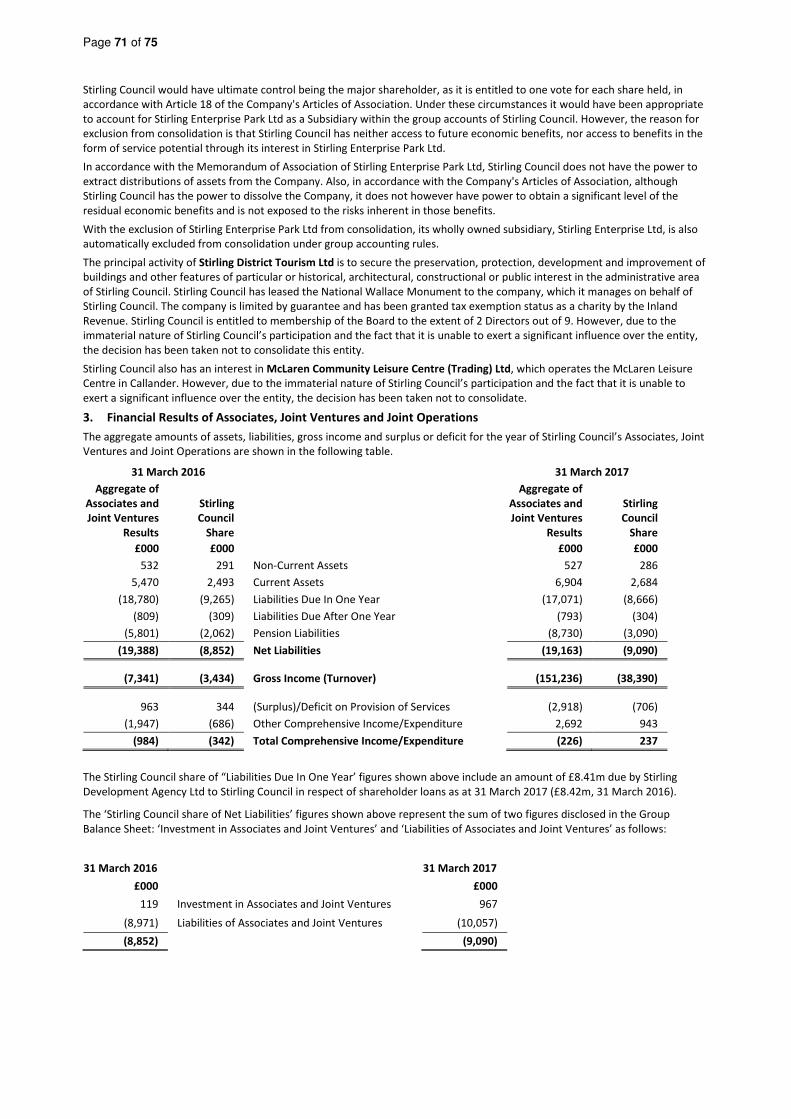
Page 71 of 75
Stirling Council would have ultimate control being the major shareholder, as it is entitled to one vote for each share held, in
accordance with Article 18 of the Company's Articles of Association. Under these circumstances it would have been appropriate
to account for Stirling Enterprise Park Ltd as a Subsidiary within the group accounts of Stirling Council. However, the reason for
exclusion from consolidation is that Stirling Council has neither access to future economic benefits, nor access to benefits in the
form of service potential through its interest in Stirling Enterprise Park Ltd.
In accordance with the Memorandum of Association of Stirling Enterprise Park Ltd, Stirling Council does not have the power to
extract distributions of assets from the Company. Also, in accordance with the Company's Articles of Association, although
Stirling Council has the power to dissolve the Company, it does not however have power to obtain a significant level of the
residual economic benefits and is not exposed to the risks inherent in those benefits.
With the exclusion of Stirling Enterprise Park Ltd from consolidation, its wholly owned subsidiary, Stirling Enterprise Ltd, is also
automatically excluded from consolidation under group accounting rules.
The principal activity of Stirling District Tourism Ltd is to secure the preservation, protection, development and improvement of
buildings and other features of particular or historical, architectural, constructional or public interest in the administrative area
of Stirling Council. Stirling Council has leased the National Wallace Monument to the company, which it manages on behalf of
Stirling Council. The company is limited by guarantee and has been granted tax exemption status as a charity by the Inland
Revenue. Stirling Council is entitled to membership of the Board to the extent of 2 Directors out of 9. However, due to the
immaterial nature of Stirling Council’s participation and the fact that it is unable to exert a significant influence over the entity,
the decision has been taken not to consolidate this entity.
Stirling Council also has an interest in McLaren Community Leisure Centre (Trading) Ltd, which operates the McLaren Leisure
Centre in Callander. However, due to the immaterial nature of Stirling Council’s participation and the fact that it is unable to
exert a significant influence over the entity, the decision has been taken not to consolidate.
3. Financial Results of Associates, Joint Ventures and Joint Operations
The aggregate amounts of assets, liabilities, gross income and surplus or deficit for the year of Stirling Council’s Associates, Joint
Ventures and Joint Operations are shown in the following table.
31 March 2016 31 March 2017
Aggregate of
Associates and
Joint Ventures
Results
Stirling
Council
Share
Aggregate of
Associates and
Joint Ventures
Results
Stirling
Council
Share
£000 £000 £000 £000
532 291 Non-Current Assets 527 286
5,470 2,493 Current Assets 6,904 2,684
(18,780) (9,265) Liabilities Due In One Year (17,071) (8,666)
(809) (309) Liabilities Due After One Year (793) (304)
(5,801) (2,062) Pension Liabilities (8,730) (3,090)
(19,388) (8,852) Net Liabilities (19,163) (9,090)
(7,341) (3,434) Gross Income (Turnover) (151,236) (38,390)
963 344 (Surplus)/Deficit on Provision of Services (2,918) (706)
(1,947) (686) Other Comprehensive Income/Expenditure 2,692 943
(984) (342) Total Comprehensive Income/Expenditure (226) 237
The Stirling Council share of “Liabilities Due In One Year’ figures shown above include an amount of £8.41m due by Stirling
Development Agency Ltd to Stirling Council in respect of shareholder loans as at 31 March 2017 (£8.42m, 31 March 2016).
The ‘Stirling Council share of Net Liabilities’ figures shown above represent the sum of two figures disclosed in the Group
Balance Sheet: ‘Investment in Associates and Joint Ventures’ and ‘Liabilities of Associates and Joint Ventures’ as follows:
31 March 2016 31 March 2017
£000 £000
119 Investment in Associates and Joint Ventures 967
(8,971) Liabilities of Associates and Joint Ventures (10,057)
(8,852) (9,090)
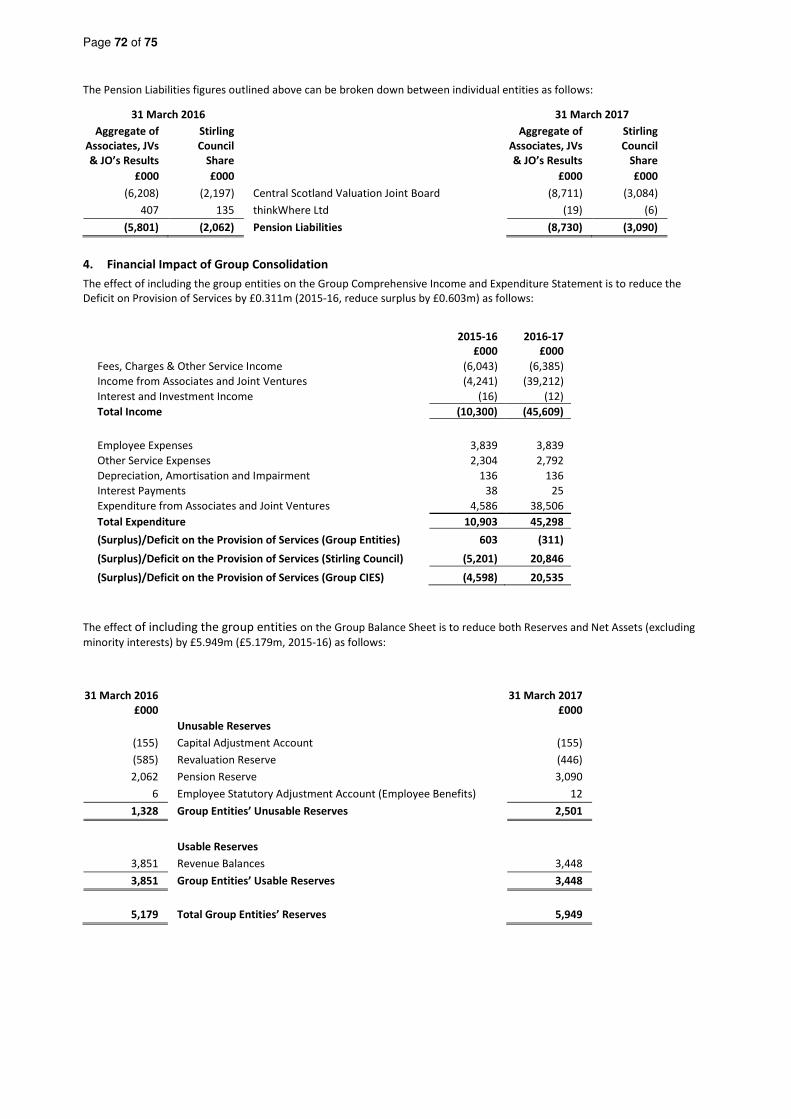
Page 72 of 75
The Pension Liabilities figures outlined above can be broken down between individual entities as follows:
31 March 2016 31 March 2017
Aggregate of
Associates, JVs
& JO’s Results
Stirling
Council
Share
Aggregate of
Associates, JVs
& JO’s Results
Stirling
Council
Share
£000 £000 £000 £000
(6,208) (2,197) Central Scotland Valuation Joint Board (8,711) (3,084)
407 135 thinkWhere Ltd (19) (6)
(5,801) (2,062) Pension Liabilities (8,730) (3,090)
4. Financial Impact of Group Consolidation
The effect of including the group entities on the Group Comprehensive Income and Expenditure Statement is to reduce the
Deficit on Provision of Services by £0.311m (2015-16, reduce surplus by £0.603m) as follows:
2015-16
£000
2016-17
£000
Fees, Charges & Other Service Income (6,043) (6,385)
Income from Associates and Joint Ventures (4,241) (39,212)
Interest and Investment Income (16) (12)
Total Income (10,300) (45,609)
Employee Expenses 3,839 3,839
Other Service Expenses 2,304 2,792
Depreciation, Amortisation and Impairment 136 136
Interest Payments 38 25
Expenditure from Associates and Joint Ventures 4,586 38,506
Total Expenditure 10,903 45,298
(Surplus)/Deficit on the Provision of Services (Group Entities) 603 (311)
(Surplus)/Deficit on the Provision of Services (Stirling Council) (5,201) 20,846
(Surplus)/Deficit on the Provision of Services (Group CIES) (4,598) 20,535
The effect of including the group entities on the Group Balance Sheet is to reduce both Reserves and Net Assets (excluding
minority interests) by £5.949m (£5.179m, 2015-16) as follows:
31 March 2016
£000
31 March 2017
£000
Unusable Reserves
(155) Capital Adjustment Account (155)
(585) Revaluation Reserve (446)
2,062 Pension Reserve 3,090
6 Employee Statutory Adjustment Account (Employee Benefits) 12
1,328 Group Entities’ Unusable Reserves 2,501
Usable Reserves
3,851 Revenue Balances 3,448
3,851 Group Entities’ Usable Reserves 3,448
5,179 Total Group Entities’ Reserves 5,949
Page 73 of 75
Glossary of Terms
While much of the terminology used in this document is intended to be self-explanatory, the following additional definitions and
interpretation of terms may be of assistance.
1. Accounting Period
The period of time covered by the accounts, normally a period of twelve months commencing on 1 April.
2. Actuarial Gains and Losses (Pensions)
Changes in actuarial deficits or surpluses that arise because events have not coincided with previous actuarial assumptions or
actuarial assumptions have changed.
3. Asset
An asset is categorised as either current or non-current. A current asset will be consumed or cease to have material value within
the next financial year (e.g. cash and stock). A non-current asset will provide benefit to Stirling Council and to the Services it
provides for a period of more than one year.
4. Associate
An entity in which Stirling Council has a participating interest or over whose operating and financial policies Stirling Council is
able to exercise significant influence.
5. Capital Adjustment Account
The Capital Adjustment Account relates to amounts set aside from capital resources to meet past expenditure.
6. Capital Expenditure
Expenditure on the acquisition of a non-current asset, which will be used in providing services beyond the current accounting
period, or expenditure which adds to and not merely maintains the value of an existing non-current asset.
7. Capital Financing
The various methods used to finance capital expenditure such as borrowing, leasing, capital receipts, capital grants and use of
revenue funding.
8. Capital Grants Unapplied Account
The Capital Grants Unapplied Account holds the grants and contributions received towards capital projects for which Stirling
Council has met the conditions that would otherwise require repayment of the monies but which have yet to be applied to meet
expenditure.
9. Capital Receipt
Proceeds from the disposal of land or other non-current assets.
10. Capital Receipts Reserve
The Capital Receipts Reserve represents the proceeds from non-current asset disposals not yet used and are available to meet
future capital investment.
11. Community Assets
Assets that Stirling Council intends to hold in perpetuity, that have no determinable useful life and that may have restrictions on
their disposal, such as municipal parks.
12. Corporate and Democratic Core
The Corporate and Democratic Core comprises all activities, which local authorities engage in specifically because they are
elected multi-purpose authorities. The cost of these activities are therefore over and above those which would be incurred by a
series of independent, single purpose, nominated bodies managing the same service.
13. Creditor
Amounts owed by Stirling Council for work done, goods received or services rendered within the accounting period, but for
which payment has not been made by the end of that accounting period.
14. Current Service Cost (Pensions)
The increase in the present value of a defined benefit scheme’s liabilities, expected to arise from employee service in the
current period.
15. Debtor
Amount owed to Stirling Council for works done, goods received or services rendered within the accounting period, but for
which payment has not been received by the end of that accounting period.
16. Defined Benefit Pension Scheme
Pension schemes in which the benefits received by the participants are independent of the contributions paid and are not
directly related to the investments of the scheme.
17. Depreciation
The measure of the cost of wearing out, consumption or other reduction in the useful economic life of Stirling Council’s non-
current assets during the accounting period, whether from use, the passage of time or obsolescence through technical or other
changes.
18. Discretionary Benefits (Pensions)
Retirement awards, which the employer has no legal, contractual or constructive obligation to award and are awarded under
Stirling Council’s discretionary powers.

Page 74 of 75
19. Employee Statutory Adjustment Account
The Employee Statutory Adjustment Account, which absorbs the differences that would otherwise arise on the General Fund
Balance from accruing for compensated absences earned but not taken in the year. Statutory arrangements require that the
impact on the General Fund Balance is neutralised by transfers to or from the Account.
20. Entity
A body corporate, partnership, trust, unincorporated association, or statutory body that is delivering a service or carrying on a
trade or business with or without a view to profit. It should have a separate legal personality and is legally required to prepare
its own single entity accounts.
21. Events after the Balance Sheet Date
Are those events both favourable and unfavourable that occur between the Balance Sheet date and the date when the Annual
Accounts are signed.
22. Fair Value
The fair value of an asset is the price that would be received to sell an asset or paid to transfer a liability in an orderly
transaction between market participants at the measurement date.
23. Financial Instruments Adjustment Account
The Financial Instruments Adjustment Account is a balancing account to allow for differences in statutory requirements and
proper accounting practices for lending and borrowing by Stirling Council.
24. Finance Lease
A lease that transfers substantially all the risks and rewards of ownership of a non-current asset to the lessee.
25. Government Grants
Grants made by the Government towards either revenue or capital expenditure in return for past or future compliance with
certain conditions relating to the activities of Stirling Council. These grants may be specific to a particular scheme or may
support the revenue or capital spend of Stirling Council in general.
26. Gross Expenditure
This includes all expenditure attributable to the service and activity including employee costs, expenditure relating to premises
and transport, supplies and services, third party payments, support services and capital charges.
27. Gross Income
This includes grant income and all charges to individuals and organisations for the direct use of Stirling Council’s services.
28. Heritage Asset
An asset with historical, artistic, scientific, technological, geophysical or environmental qualities that is held and maintained
principally for its contribution to knowledge and culture.
29. Impairment
A reduction in the value of a non-current asset to below its carrying amount on the Balance Sheet.
30. Infrastructure Assets
Assets belonging to Stirling Council represented by highways, footpaths and bridges.
31. Insurance Fund
The Insurance Fund covers the main classes of insurance and is earmarked for insurance purposes.
32. Interest Cost (Pensions)
For a defined benefit scheme, the expected increase during the period of the scheme liabilities because the benefits are one
period closer to settlement.
33. Inventories
Items of raw materials and stock Stirling Council has procured and holds in expectation of future use. Examples are consumable
stores, raw materials and products and services in intermediate stages of completion.
34. Joint Venture
An entity in which Stirling Council has an interest on a long-term basis and is jointly controlled by Stirling Council and one or
more entities under a contractual or other binding agreement.
35. Liability
A liability is where Stirling Council owes payment to an individual or another organisation. A current liability is an amount which
will become payable or could be called in within the next accounting period e.g. creditors or cash overdrawn. A long-term
liability is an amount which by arrangement is payable beyond the next year at some point in the future or to be paid off by an
annual sum over a period of time.
36. National Non-Domestic Rates Pool
All Non Domestic Rates collected by local authorities are remitted to the national pool and thereafter distributed to Councils by
the Scottish Government.
37. Net Book Value
The amount at which non-current assets are included in the Balance Sheet, i.e. their historical cost or current value less the
cumulative amounts provided for depreciation.
38. Non-Current Assets
These are created by capital expenditure incurred by Stirling Council. They include property, vehicles, plant, machinery, roads,
computer equipment, etc.
Page 75 of 75
39. Non-Distributed Costs
Costs that cannot be allocated to specific services and are, therefore, excluded from the total cost relating to Service activity in
accordance with the Service Reporting Code of Practice. Charges for added pension years and early retirement are examples of
these costs.
40. Operating Lease
A lease where the ownership of a non-current asset remains with the lessor.
41. Past Service Cost (Pensions)
For a defined benefit scheme, the increase in the present value of the scheme liabilities relating to employee service in prior
periods arising in the current period as a result of the introduction of, or improvement to retirement benefits.
42. Pension Reserve
The Pension Reserve arises from the AIS19 accounting disclosures for retirement benefits and recognises Stirling Council's share
of actuarial gains and losses in the Falkirk Pension Fund and the change in Stirling Council’s share of the Pension Fund net
liability chargeable to the Comprehensive Income and Expenditure Statement.
43. Pension Scheme Liabilities
The liabilities of a defined benefit pension scheme for outgoings due after the valuation date. The scheme liabilities, measured
using the “projected unit method” reflect the benefits that the employer is committed to provide for service up to the valuation
date.
44. Post Employment Benefits
All forms of consideration given by an employer in exchange for services rendered by employees that are payable after the
completion of employment (e.g. pensions in retirement).
45. Prior Year Adjustment
Material adjustments applicable to previous years arising from changes in accounting policies or from the correction of
fundamental errors. This does not include normal recurring corrections or adjustments of accounting estimates made in prior
years.
46. Provision
An amount put aside in the accounts for future liabilities or losses which are certain or very likely to occur but the amounts or
dates of when they will arise are uncertain.
47. Public Works Loan Board (PWLB)
A Central Government Agency, which provides loans for one year and above to Councils at interest rates only based on those at
which the Government can borrow itself.
48. Rateable Value
The annual assumed rental of a non-housing property, which is for national Non Domestic Rates purposes.
49. Related Parties
Entities or individuals that have the potential to control or influence Stirling Council, or to be controlled or influenced by Stirling
Council.
50. Remuneration
All sums paid to or receivable by an employee and sums due by way of expenses allowances (as far as these sums are chargeable
to UK income tax) and the money value of any other benefits received other than in cash.
51. Repairs and Renewal Fund
The Repairs and Renewal Fund provides for major repairs to the Waste Transfer Station at Lower Polmaise and Stirling Council’s
sports facilities.
52. Reserves
The accumulation of surpluses, deficits and appropriation over past years. Reserves of a revenue nature are available and can be
spent or earmarked at the discretion of Stirling Council. Some capital reserves such as the Revaluation Reserve cannot be used
to meet current expenditure.
53. Residual Value
The net realisable value of an asset at the end of its useful life.
54. Revaluation Reserve
The Revaluation Reserve represents the store of gains on revaluation of non current assets not yet realised through sales.
55. Revenue Expenditure
The day-to-day running costs associated with the provision of services.
56. Significant Interest
The reporting authority is actively involved and is influential in the direction of an entity through its participation in policy
and/or operational decisions.
57. Soft Loan
A loan made by Stirling Council to another entity at an interest rate significantly below market interest rates.
58. Subsidiary
An entity over which Stirling Council has overall control through the power to govern its financial and operating policies so as to
obtain benefits from the entity’s activities.