stmoritz
TRANSCRIPT

Bozidar DedusBozidar Dedus
RAINFALL-RUNOFF RAINFALL-RUNOFF ANALYSIS FOR THE ANALYSIS FOR THE ZAGREB SEWERAGE ZAGREB SEWERAGE
OPTIMISATION PROJECTOPTIMISATION PROJECT
Rainfall WorkshopRainfall Workshop
04.-07. Dec. 1997. Pontresina Switzerland04.-07. Dec. 1997. Pontresina Switzerland

General objectives of the Zagreb General objectives of the Zagreb projectproject
Phase IPhase I - create and verify model of the present state, - create and verify model of the present state, clarify system’s pattern of performance, clarify reasons clarify system’s pattern of performance, clarify reasons for missbehaviour, check system as a systemfor missbehaviour, check system as a system
Phase IIPhase II - create Master Plan, design GIS cadasdre - create Master Plan, design GIS cadasdre define short term remedial measures, define new define short term remedial measures, define new measurement system, …measurement system, …
Phase II aPhase II a - define relevant parameters for the future - define relevant parameters for the future sewerage system performance w.r. to WWTP, and other sewerage system performance w.r. to WWTP, and other infrastructure projectsinfrastructure projects
Subsequent phasesSubsequent phases … WQ, Scada, RTC … WQ, Scada, RTC

Rainfall analysisRainfall analysis Check Check applicabilityapplicability of traditional approaches based on of traditional approaches based on
IDFIDF relations and Rational formula vs. HD models and relations and Rational formula vs. HD models and resulting sewer’s dimensionsresulting sewer’s dimensions
Produce Produce flooding mapsflooding maps based on IDF curves and relate based on IDF curves and relate them to historical rain data simulationsthem to historical rain data simulations
Check system’s performance on Check system’s performance on historical rainhistorical rain records records Perform rainfall-runoff measuremnts and Perform rainfall-runoff measuremnts and caliratecalirate/verify /verify
modelmodel Check applicability of historical rain data for design Check applicability of historical rain data for design
purposes and relate to purposes and relate to flooding frequenciesflooding frequencies Propose Propose guidelinesguidelines for design of the Zagreb sewer for design of the Zagreb sewer
systemsystem

General dataGeneral data
Zagreb sewerage serving Zagreb sewerage serving 11 M inhabitants + M inhabitants + IndustryIndustry
Catchment >Catchment >200200 km km22, , 3030 km from W to E km from W to E >>180180 M m M m33 average yearly volume of waste water average yearly volume of waste water ~~14001400 km of sewers km of sewers 2 2 M mM m33 retention capacity of sewers retention capacity of sewers 22 combined systems separted by the river Sava combined systems separted by the river Sava no CSO allowed by authorities so farno CSO allowed by authorities so far 6 6 small rivers introduced into the sewer systemsmall rivers introduced into the sewer system no WWTPno WWTP


Traditional valuesTraditional values(valid for Zagreb)(valid for Zagreb)
RAINFALL ANALYSISRAINFALL ANALYSIS– IDF relationship valid for Zagreb derived as a IDF relationship valid for Zagreb derived as a
complex empirical formula ...complex empirical formula ...– Design IDF values Design IDF values i=140 l/sec/ha, D=25 min F=3 i=140 l/sec/ha, D=25 min F=3
y.y.
RUNOFF ANALYSISRUNOFF ANALYSIS– all assumptions inherent to Rational formula all assumptions inherent to Rational formula

IDF relations developed for IDF relations developed for ZAGREBZAGREB
HTP curves for Zagreb IDVOGZ 1992.
0,00
20,00
40,00
60,00
80,00
100,00
120,00
140,00
160,00
180,00
200,00
10 15 20 25 30 40 50 60 120 240 300 360 720 1080 1440
Time (min)
Ra
insto
mr
de
pth
(m
m)
P = 1 god
P = 2 god
P = 3 god
P = 4 god
P = 5 god
P = 10 god
P = 15 god
P = 20 god
P = 25 god
P = 30 god
P = 40 god
P = 50 god
P = 100 god
P = 1000 god
P = 10000 god

… … IDF curvesIDF curves
IDF curves for Zagreb (IDVOGZ 1992.)
0 10 20 30 40 50 60 70
Time (min)
Inte
nsity
(l/s
ec/h
a)
1
2
3
4
5
10
15
20
25
30
40
50
100

Hydrological interestHydrological interest
Investigate influence of Investigate influence of FRCFRC and and SRCSRC Investigate influence of Investigate influence of hydrological memoryhydrological memory of of
the catchmentthe catchment investigate investigate spatialspatial and and temporaltemporal rain pattern rain pattern Define Define contributing factorscontributing factors of water balance in of water balance in
yearly waste water production on the catchmentyearly waste water production on the catchment Investigate Investigate overload duration and frequencyoverload duration and frequency vs. vs.
untreated volume for hypothetical WWTPuntreated volume for hypothetical WWTP
USE USE HISTORICAL RAIN SERIESHISTORICAL RAIN SERIES RECORDS and RECORDS and CONTINOUS MODELLING APPROACH !!!CONTINOUS MODELLING APPROACH !!!

Rain + relevant dataRain + relevant data
Historical rain seriesHistorical rain series from from 1111 r-g with r-g with 5 5 min min time inc. measured by National Weather time inc. measured by National Weather Institute (“DHMZ”)Institute (“DHMZ”)
Rain dataRain data from measuring campaign at from measuring campaign at 33 locations with locations with 22 min resolution --> on-line min resolution --> on-line (+simultaneous runoff at strategic places in (+simultaneous runoff at strategic places in sewers)sewers)
potential evaporationpotential evaporation temperaturetemperature
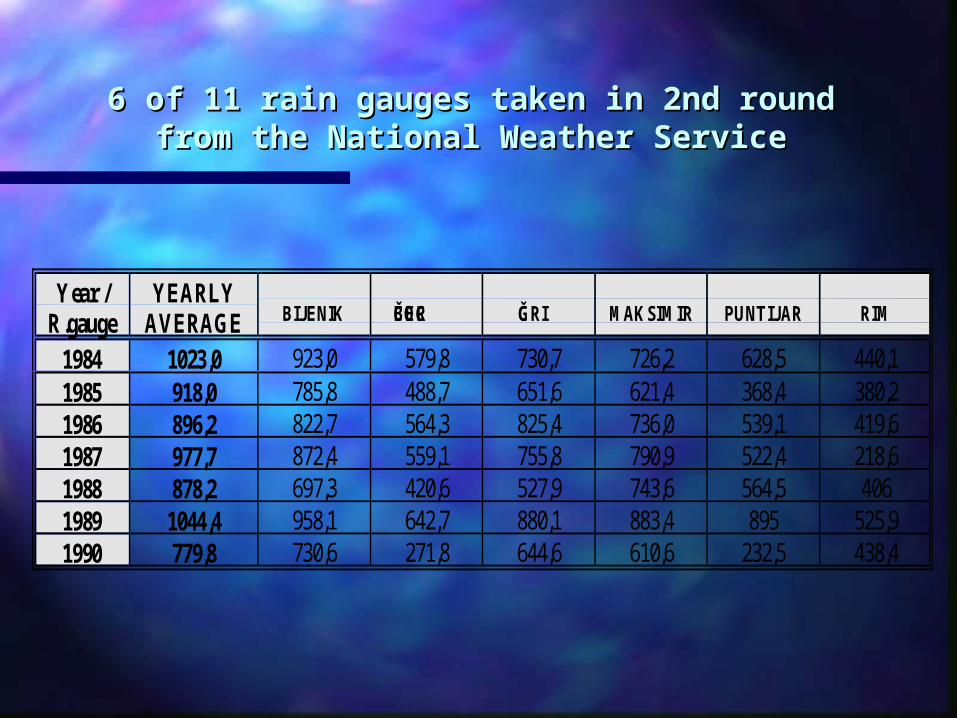
6 of 11 rain gauges taken in 2nd round 6 of 11 rain gauges taken in 2nd round from the National Weather Servicefrom the National Weather Service
Year /R.gauge
YEARLYAVERAGE BIJENIK BORČEC GRIČ MAKSIMIR PUNTIJAR RIM
1984 1023,0 923,0 579,8 730,7 726,2 628,5 440,11985 918,0 785,8 488,7 651,6 621,4 368,4 380,21986 896,2 822,7 564,3 825,4 736,0 539,1 419,61987 977,7 872,4 559,1 755,8 790,9 522,4 218,61988 878,2 697,3 420,6 527,9 743,6 564,5 4061989 1044,4 958,1 642,7 880,1 883,4 895 525,91990 779,8 730,6 271,8 644,6 610,6 232,5 438,4

Permanent rain gauges / temporary Permanent rain gauges / temporary flow monitorsflow monitors
PERMANENT RAIN GAUGES (“DHMZ”)
TEMPORARY RAIN GAUGES (“ADS”)
PERMANENT LEVEL/ VELOCITY MONITOR
TEMPORARY LEVEL / VELOCITY / FLOW MONITORS
ZAGREB SEWERAGE SYSTEM - MONITORING LOCATIONSZAGREB SEWERAGE SYSTEM - MONITORING LOCATIONS

Rain events used for Rain events used for calibrationcalibration
RAIN EVENT 29/07/95 05/08/95 19/08/95 21/08/95 25/08/95BIJENIK 48.8 16.2 21.2 19.7 13.7BORČEC 45.4 6.6 18.8 51.9 1.4GRIČ 58.5 14.9 22.7 20.5 10.9MAKSIMIR 68.0 16.8 37.0 15.5 18.1ADS RG1 94.0 36.3 56.4 22.9 15.2ADS RG2 69.6 17.7 38.7 12.6 26.8ADS RG3 58.2 11.6 35.2 55.9 12.7AVERAGE 63.21 17.16 32.85 28.43 14.11

SCALE : 1:90000EDITED : 20-SEP-1996 16:07DATAFILE: LUMPED.SWF
Rain event 1995.07.25. measured by seven rain gauges
RG3-GAJNICE BORČEC BIJENIK GRIČ RG2-FOLNEG. MAKSIMIR RG1-SESVETE
ALTITUDE (m)
122 200 230 158 114 125 115
START 3:45 3:25 3:25 4:05 4:15 4:10 4:18
END 12:54 12:15 11:45 12:50 12:41 13:05 12:33
DURATION (hour) 9.15 7.83 8.33 8.75 8.43 8.92 8.25
MAXIMUM (hour) 4:30 04:21 04:31 04:46 4:51 04:51 5:37
MAXIMUM (mm) 1.05 0.9 0.86 0.96 0.95 1.22 0.95
TOTAL RAINDEPTH
(mm)55.7 43.5 46.4 55.4 65.8 64.54 86.3

Rain guage no. 1: Sesvete Rainfall event 1995.7.29.
0
0.2
0.4
0.6
0.8
1
1.20:
52
1:37
2:22
3:07
3:52
4:37
5:22
6:07
6:52
7:37
8:22
9:07
9:52
10:3
7
11:2
2
12:0
7
12:5
2
13:3
7
14:2
2
15:0
7
15:5
2
16:3
7
17:2
2
Time
Ra
in d
ep
th (
mm
)
Rain guage no. 2: FolnegovicevaRainfall event 1995.7.29.
0
0.2
0.4
0.6
0.8
1
1.2
0:58
1:49
2:40
3:31
4:22
5:13
6:04
6:55
7:46
8:37
9:28
10:1
9
11:1
0
12:0
1
12:5
2
13:4
3
14:3
4
15:2
5
16:1
6
17:0
7
17:5
8
18:4
9
19:4
0
Time
Ra
in d
ep
th (
mm
)
Rain guage no. 3: Gajnice Rainfall event 1995.7.29.
0
0.2
0.4
0.6
0.8
1
1.2
0:5
5
1:4
3
2:3
1
3:1
9
4:0
7
4:5
5
5:4
3
6:3
1
7:1
9
8:0
7
8:5
5
9:4
3
10
:31
11
:19
12
:07
12
:55
13
:43
14
:31
15
:19
16
:07
16
:55
17
:43
18
:31
19
:19
Time
Ra
in d
ep
th (m
m)
ADS three RAINGUAGESRainfall event 1995.7.29.
0
0.2
0.4
0.6
0.8
1
1.2
0:58
1:49
2:40
3:31
4:22
5:13
6:04
6:55
7:46
8:37
9:28
10:1
9
11:1
0
12:0
1
12:5
2
13:4
3
14:3
4
15:2
5
16:1
6
17:0
7
17:5
8
18:4
9
19:4
0
Time
Ra
in d
ep
th (
mm
)

Rainguage BIJENIKRainfall event 1995.7.29.
0
0.2
0.4
0.6
0.8
1
1.2
1.40:
25
1:19
2:13
3:07
4:01
4:55
5:49
6:43
7:37
8:31
9:25
10:1
9
11:1
3
12:0
7
13:0
1
13:5
5
14:4
9
15:4
3
16:3
7
17:3
1
18:2
5
19:1
9
20:1
3
21:0
7
Time
Ra
in d
ep
th (
mm
)Rainguage BORCEC
Rainfall event 1995.7.29
0
0.2
0.4
0.6
0.8
1
1.2
1.4
0:30
1:22
2:14
3:06
3:58
4:50
5:42
6:34
7:26
8:18
9:10
10:0
2
10:5
4
11:4
6
12:3
8
13:3
0
14:2
2
15:1
4
16:0
6
16:5
8
17:5
0
18:4
2
19:3
4
20:2
6
21:1
8
Time
Rai
n d
epth
(m
m)
Rainguage MAKSIMIRRainfall event 1995.7.29.
00.20.40.60.8
11.21.4
0:45
2:01
3:17
4:33
5:49
7:05
8:21
9:37
10:5
3
12:0
9
13:2
5
14:4
1
15:5
7
17:1
3
18:2
9
19:4
5
21:0
1
Time
Rai
n d
epth
(m
m)
Raingauge GRICRainfall event 1995.7.29.
00.20.40.60.8
11.21.4
0:25
1:44
3:03
4:22
5:41
7:00
8:19
9:38
10:5
7
12:1
6
13:3
5
14:5
4
16:1
3
17:3
2
18:5
1
20:1
0
21:2
9
Time
Rai
n d
epth
(m
m)
DHMZ four rainguagesRainevent 1995.7.29
0
0.2
0.4
0.6
0.8
1
1.2
1.4
0:25
1:30
2:35
3:40
4:45
5:50
6:55
8:00
9:05
10:1
0
11:1
5
12:2
0
13:2
5
14:3
0
15:3
5
16:4
0
17:4
5
18:5
0
19:5
5
21:0
0
Time
Rai
n d
epth
(m
m)
BIJENIK
BORCEC
MAKSIMIR
GRIC

Calibration resultsCalibration results

Extreme event analysis - HD Extreme event analysis - HD simulationsimulation
NO. DATE 1-HOUR PEAKRAIN VOLUME
(MAX. OF 3 R.GAUGES)
MM
AVERAGERAINFALLDURATION
HOURS
AVERAGETOTAL
RAINFALLVOLUME
MM
1. 03.07.1989. 27.3 10.58 96.22. 25.08.1989. 21.6 7.42 38.63. 29.05.1985. 33.7 2.05 19.84. 23.06.1989. 27.6 1.75 27.605- 08.08.1989. 39.5 10.36 65.376. 27.09.1987. 17.2 18.39 77.237. 23.09.1991. 26.5 5.81 37.378. 14.06.1990. 18.4 1.33 17.379. 14.06.1986. 31.1 6.61 40.2710. 06.08.1985. 19.1 9.22 39.07

Flooding mapFlooding map
FLOOD MAP ILLUSTRATING THE FREQUENCY OF FLOODING RECU RRENCEFLOOD MAP ILLUSTRATING THE FREQUENCY OF FLOODING RECU RRENCE
F L O O D E D O N CE I N 10 Y E A R S
F L O O D E D 2 - 3 T IM E S I N 10 Y E A R S
F L O O D E D 4 O R M O R E T I M E S I N 10 Y E A R S
BASED ON THE “PILOT” SIMULATIONS (1984. - 1993.) EXPERIENCED CR ITICAL AREAS AND POSSIBLEFLOODING ZONES

ConclusionsConclusions
Use Use IDF curvesIDF curves … … YESYES when designing when designing secondary sewers, and as a initial step before secondary sewers, and as a initial step before use of historical rain records for final solutionsuse of historical rain records for final solutions
Use Use Rational FormulaRational Formula … … NO NO Use Use Historical rain seriesHistorical rain series … … YESYES when when
designing system’s performance pattern, designing system’s performance pattern, Master Plan, detailed insight in generation of Master Plan, detailed insight in generation of surcharge and flooding, structures, input to surcharge and flooding, structures, input to WWTP, etc.WWTP, etc.

More conclusions ...More conclusions ...
SRCSRC component ( component (rain induced infiltrationrain induced infiltration) ) importantimportant
Catchments Catchments sensitivesensitive to hydrological history … to hydrological history … i.e. to catchment’s i.e. to catchment’s hydrological memoryhydrological memory
Majority of relevant rain events come from N, Majority of relevant rain events come from N, problem arrives when it comes from W --> Eproblem arrives when it comes from W --> E
Time difference is important for rain events Time difference is important for rain events coming from W --> Ecoming from W --> E
Spatial and temporal differences subject to Spatial and temporal differences subject to further investigation (current)further investigation (current)

Contributing factors in water Contributing factors in water balancebalance
KEY NUMBERS - FLOW COMPONENTS IN GOKYearly average contributions
Sanitary + Industrial Flow53%
Surface Runoff6%
Inflow from Creeks36%
Ground Water Infiltration
5%

More conclusions ...More conclusions ...
WWTP loadings for different volume of untreated water, overload frequency and duration
0
2
4
6
8
10
12
14
16
18
20
6 9 12 15 18
WWTP capacity m3/s
mili
ona
m3
/ god
.
0
10
20
30
40
50
60
Ove
rloa
d Fre
quen
cy a
nd D
urat
ion
Netretirani volumen (miliona m3/god)
U~estalost preoptere}enja (doga|aj/godi{nje)
Trajanje preoptere}enja (dana/godi{nje)

KEEP IN MINDKEEP IN MIND
DON’T LOOSE TOUCH OF WHAT DON’T LOOSE TOUCH OF WHAT IS THE PURPOSE AND OBJECTIVE IS THE PURPOSE AND OBJECTIVE OF RAINFALL ANALYSISOF RAINFALL ANALYSIS
DECISION MAKERS (DECISION MAKERS (MONEY MONEY HOLDERSHOLDERS) WILL EASE YOUR ) WILL EASE YOUR PROBLEMS - THEY WILL PROBLEMS - THEY WILL IMPLICITLY DEFINE RELEVANT IMPLICITLY DEFINE RELEVANT RAIN INPUTRAIN INPUT