stochastic modeling workshop —policyholder behavior · douglas l. robbins november 19, 2003. 2...
TRANSCRIPT

Stochastic Modeling Workshop
— Policyholder Behavior
Southeastern Actuaries Conference
Marc N. AltschullDouglas L. Robbins
November 19, 2003

2
IntroductionIntroduction
Agenda
GMDB ResultsGMDB Results
GMIB ResultsGMIB Results
ConclusionsConclusions
IntroductionIntroduction

3
Objective
The results presented in this paper will enable insurers to better understand that policyholder behaviors need to be modeled in order to evaluate the volatility of results, using variable annuity guarantees as an example.
The results presented in this paper will enable insurers to better understand that policyholder behaviors need to be modeled in order to evaluate the volatility of results, using variable annuity guarantees as an example.
4
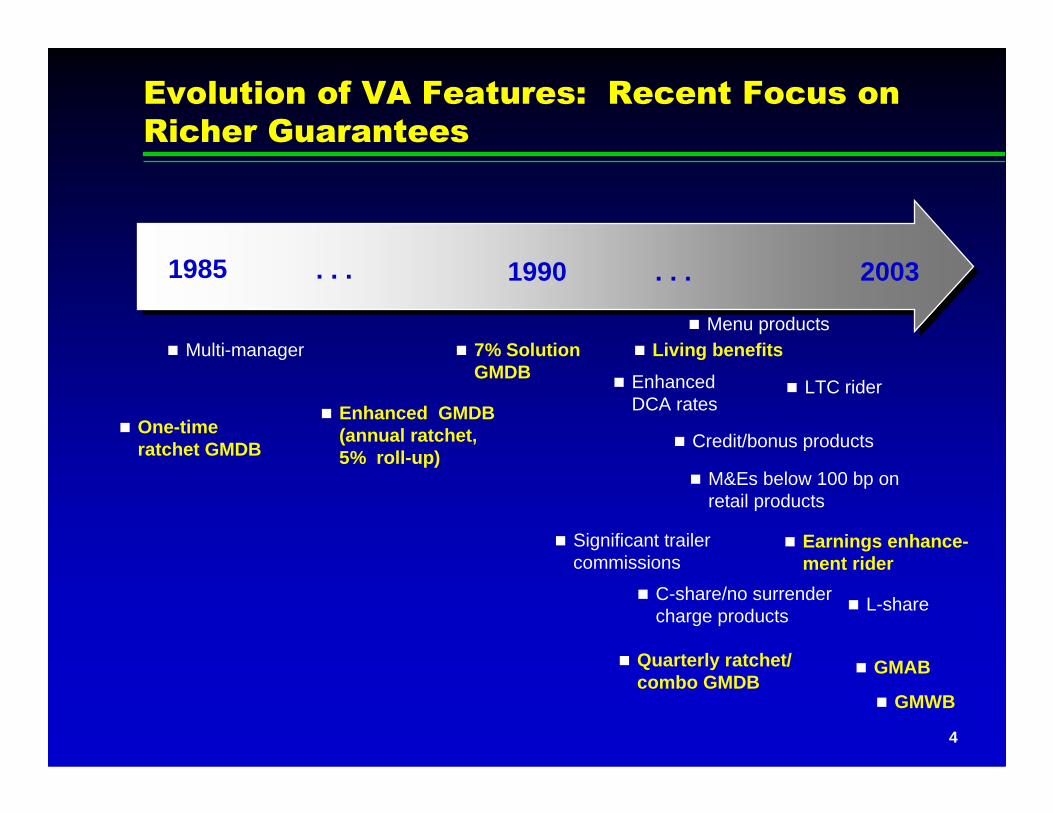
Evolution of VA Features: Recent Focus on
Richer Guarantees
� Multi-manager � 7% Solution GMDB
� Living benefits
� Credit/bonus products
� Significant trailer commissions
� Enhanced DCA rates
� LTC rider
� One-time ratchet GMDB
� M&Es below 100 bp on retail products
� C-share/no surrender charge products
� Enhanced GMDB (annual ratchet,5% roll-up)
1985 1990 2003. . . . . .
� Quarterly ratchet/ combo GMDB
� Menu products
� Earnings enhance-ment rider
� L-share
� GMAB
� GMWB

5
VA Sales Have Coincided with the Ebb and
Flow of the Equity Markets
400
600
800
1000
1200
1400
1600
1st Q
tr 9
5
1st Q
tr 9
6
1st Q
tr 9
7
1st Q
tr 9
8
1st Q
tr 9
9
1st Q
tr 0
0
1st Q
tr 0
1
1st Q
tr 0
2
1st Q
tr 0
3
S&
P 5
00
0
5
10
15
20
25
30
35
40
Qua
rter
ly G
ross
VA
Sal
es1
1 Annual sales for 1995 through 1999 distributed uniformly. Source: Variable sales from Tillinghast VALUE Survey, includes all non-pension variable annuitypremiums (first-year and renewal, separate account and fixed account).

6
Methodology
� Projected inforce deferred VA
� Issue date = one month prior to model start date
� Initial surplus = 0
� Annual surplus projected 20 years
� 500 stochastic scenarios
� Discount at after-tax, general account earned rate
� Total Capital Requirement = CTE 90

7
Guaranteed Benefits Considered
� GMDB� Greater of annual ratchet to age 80 and 5% premium
roll-up to age 80� Cost included in base product asset charges
� GMIB� 5% roll-up to age 80� 10-year waiting period for annuitization � 35 bps additional asset fee

8
Summary of Base Results
Guaranteed Benefits C3 Capital Requirement
GMDB Only 88 bps
GMDB and GMIB 91

9
Scenario Calibration Modifications
� Purpose: to determine sensitivity of results to scenario calibration
� 1% reduction in annual expected returns
� 120% multiplier on annual return volatility

10
Summary of Scenario Calibration Results
(Change from Base)
Guaranteed Benefits (Base)
1% Reduction in Expected Returns
120% Multiplier on Return Volatility
GMDB only (88 bps)
30 bps 27 bps
GMDB and GMIB (91 bps)
97 39

11
IntroductionIntroduction
Agenda
GMDB ResultsGMDB Results
GMIB ResultsGMIB Results
ConclusionsConclusions

12
GMDB Behavioral Assumptions
� Lapses
� Partial withdrawals� Dollar-for-dollar� Proportionate
� Transfers to the fixed account
� Transfers to a “safer” separate account fund

13
Assumption Change in C3 Requirement
Dynamic increasedlapsation in down markets
(13) bps
GMDB Dynamic Lapse Results (Changes from
base C3 requirement of 88 bps)
Dynamic lapse reductionover 20% of GMDB
25
Dynamic lapse reductionover 40% of GMDB
20

14
GMDB Deterministic Lapse Results (Changes
from base C3 requirement of 88 bps)
Assumption Change in C3 Requirement
200% lapse rates in allyears
(32) bps
50% lapse rates in allyears
31
200% lapse rates aftersurrender charge period
(4)
50% lapse rates aftersurrender charge period
9

15
Dollar-for-Dollar with Dynamic Partial
Withdrawals Increase C3 Requirement 217 bps
Base Dollar-for-Dollar
88 bps
305 bps
217
bps
Incr
ease

16
Dynamic lapses with transfers from SA to GA and 0% guarantee on GA
15
Dynamic lapses only 25
Assumption Change in C3 Requirement
Transfers from SA to GA (no dynamic lapses)
3 bps
Dynamic lapses with transfers from SA to GA
33
GMDB Transfers to Fixed Account Results
(Changes from base C3 requirement of 88 bps)

17
IntroductionIntroduction
Agenda
GMDB ResultsGMDB Results
GMIB ResultsGMIB Results
ConclusionsConclusions

18
GMIB Behavioral Assumptions
� GMIB utilization
� Lapses
� Transfers to the fixed account
� Transfers to a safer separate account fund

19
GMIB Utilization Assumption (Changes from
base C3 requirement of 91 bps)
12 bps
22 bps67 bps
vs.
Combination: Electionrate of 100% with max of 50%
Maximum annual GMIB election rate increased from25% to 50%
GMIB election rateincreased from50% to 100% of“in-the-moneyness”

20
Assumption Change in C3 Requirement
Dynamic Lapse Tests
Dynamic lapse reductionover 20% of GMIB
224 bps
Dynamic lapse reductionover 40% of GMIB
164
Deterministic Lapse Tests
200% lapse rates in all years (80)
50% lapse rates in all years 281
GMIB Lapse Assumption Results (Changes
from base C3 requirement of 91 bps)
21
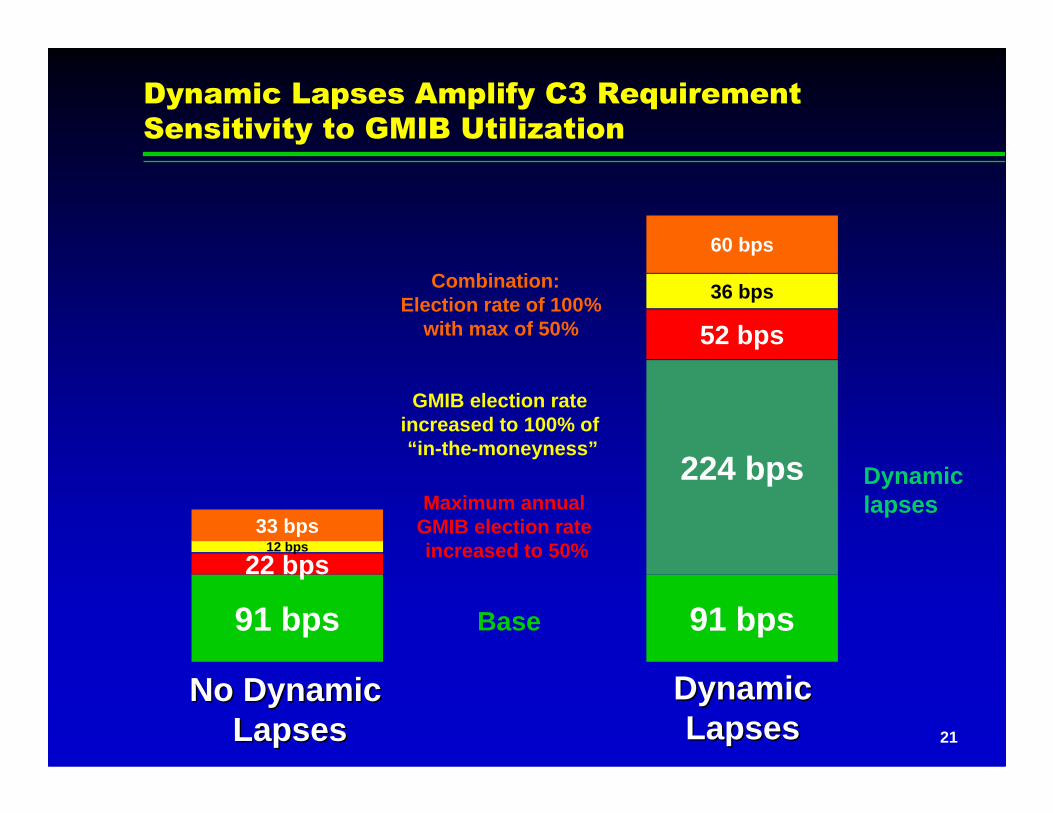
Dynamic Lapses Amplify C3 Requirement
Sensitivity to GMIB Utilization
91 bps Base
22 bps
Maximum annual GMIB election rate increased to 50%12 bps
GMIB election rate increased to 100% of “in-the-moneyness”
No DynamicNo DynamicLapsesLapses
DynamicDynamicLapsesLapses
91 bps
224 bps Dynamic lapses
52 bps
36 bps
33 bps
Combination: Election rate of 100%
with max of 50%
60 bps

22
Negligible Impact of Transfers to the Fixed
Account: GMDB vs. GMIB
88 bps 91 bps
3 bps8 bps
GMDB GMIB
Base
Transfers fromSA to GA
(no dynamic lapses)

23
Transfers to a Safer Separate Account Provide
Counterintuitive Results
88 bps 91 bps
GMDB GMIB
(46) bps
Net C3Requirement
with No Dynamic Lapses42 bps 44 bps
Net C3Requirement
with No Dynamic Lapses135 bps
25 bps
224 bps
(42) bps
207 bps
Net C3Requirement
with Dynamic Lapses71 bps
Net C3Requirement
with Dynamic Lapses522 bps
Base
Transfersfrom
large cap to bonds
(no dynamiclapses)
Dynamiclapses
turned on,but no
transfers
Transferfrom large
cap tobonds

24
IntroductionIntroduction
Agenda
GMDB ResultsGMDB Results
GMIB ResultsGMIB Results
ConclusionsConclusions

25
GMDB Observations
� Certain behaviors can be comparable to moderate changes in economic scenarios for average issue ages
� Partial withdrawals on products with dollar-for-dollar GMDB reductions can be significant
� Behavioral changes in early policy durations dominate later durations for average issue age
� Moderate scenario changes dominate most behavioral changes for older issue ages

26
GMIB Observations
� Many behaviors influence C3 much more than moderate changes in economic scenarios
� Impact of behaviors compounds
� Late duration behaviors more important than with GMDB only