stochastic population projections: an application to the ... filemassimiliano crisci, institute for...
TRANSCRIPT
WP 9.2
16 October 2013
UNITED NATIONS STATISTICAL COMMISSION
and ECONOMIC COMMISSION FOR EUROPE
STATISTICAL OFFICE OF THE
EUROPEAN UNION (EUROSTAT)
Joint Eurostat/UNECE Work Session on Demographic Projections
organised in cooperation with Istat
(29-31 October 2013, Rome, Italy)
Item 9 – Stochastic methods in population projections
Stochastic Population Projections: an Application to the Rome Metropolitan
Area
Salvatore Bertino, Sapienza University of Rome
Oliviero Casacchia, Sapienza University of Rome
Massimiliano Crisci, Institute for Research on Population and Social Policies (CNR IRPPS)
Abstract
As stated by various authors (see, for instance, Alho et al., 2006; Billari, Graziani and Melilli, 2012;
Scherbov, Mamolo and Lutz, 2008), stochastic population forecasts has recently received much attention
from researchers. The opportunity of forecasting future levels of population, fertility, mortality and migration
by using a prediction interval to manage uncertainty is currently an important task. At the same time, the
stochastic method seems to be a useful and efficient tool for implementing multiregional forecasting at a
local level.
The stochastic approach presented in the present paper is based on micro-simulations of birth-death-
emigration-immigration point event processes proposed in recent years by some authors (Bertino and
Sonnino, 2007; Bertino, Sonnino and Lanzieri, 2012) - the so-called Bertino-Sonnino (B-S) method).
In the paper the results are presented of a project financed by the Province of Rome to make a multiple
stochastic population forecast of the Rome Metropolitan Area (RMA) using the B-S method. The RMA
territory is fractionated into five concentric sub-areas, obtained by dividing into two the huge municipality of
Rome (core and urban periphery) and aggregating the districts around Rome into three rings (the
metropolitan peripheries). This forecast is based on a range of assumptions referring to the future
demographic dynamics over the period 2009-24 and forming three variants: high, medium and low. The
output includes numerous data and demographic indicators for each year between 2009 and 2024,
determined by gender, age and sub-area. The outcome of the stochastic method is compared with
deterministic multiregional forecasting to verify the efficiency of both methodologies. This two-step strategy
allows “control” to be maintained over the assumed future demographic variants, at the same time linking in
a probability level.
1. Background and objectives
Stochastic population forecasting has recently received much attention from researchers. Various
authors stress the importance of stochastic forecasts in delineating the future structure and size of
human populations and many contributions are now available on this topic (see, for instance, Alho
et al., 2006; Scherbov, Mamolo and Lutz, 2008; Billari, Graziani and Melilli, 2012). Also Eurostat
in various studies in the past has asserted the utility of using this approach (see, for instance,
Eurostat 2007).
2
The stochastic approach produces forecasts of future levels of population, fertility, mortality and
migration by providing an estimation interval to manage uncertainty1. At the same time, the
stochastic method represents a useful and efficient tool for implementing multiregional forecasts at
a local level. In this paper a micro-simulation of birth-death-emigration-immigration point event
processes is presented (Bertino and Sonnino, 2007; Bertino, Sonnino and Lanzieri, 2012). This
model, the so-called Bertino-Sonnino method (B-S method), represents a new approach that is not
considered in the usual definition of the current probabilistic approaches (Billari, Graziani and
Melilli, 2012).
The stochastic approach presented here is referred to a research project of forecasting the
population of Rome Metropolitan Area (RMA), a territory of around 2000 km2, with 4 million
inhabitants2.
The RMA territory is fractionated into five concentric sub-areas - dividing into two the huge
municipality of Rome (core and urban periphery) and aggregating the districts around Rome into
three rings (the metropolitan peripheries). For this purpose, mixed regionalization criteria were
used: institutional, functional and geographic. The application of forecasting methodology was
preceded by an accurate data preparation including the correction of the population structure
sourced from the population register of Rome (anagrafe)3, and an analysis of demographic trends in
the RMA during the first decade of the 21st century (§ 2).
The stochastic approach adopted here is based on the B-S method (§ 3.1). Underlying the
forecasts are a range of assumptions, referring to the future demographic dynamics in the period
2009-24 and consisting of three variants: high, medium and low, as illustrated in 3.2. Some results
including numerous data and demographic indicators for each year between 2009 and 2024,
determined by gender, age and sub-area, are presented in the following section. The outcome of the
stochastic method is compared with deterministic forecasts based upon the Rogers' multiregional
method, to verify the efficiency of both methodologies (§ 4.2). This two-step strategy allows
“control” to be maintained over the assumed future demographic scenario, at the same time linking
in a probability level.
2. The Rome Metropolitan Area
During the first decade of the 21st century all the major Italian metropolitan provinces
underwent population increases. The process of periurbanization continued to erode the population
in all metropolitan capitals in favour of the hinterland, in parallel with ever-increasing international
migratory flows that continue to involve the Penisula with decreasing intensity from North to South.
The capacity to attract migratory flows from abroad is the main distinguishing factor between
Italian urban areas that are growing and those that are contracting.
The city of Rome, the capital of the province of the same name, today counts the same number
of residents as in 1971, approximately two million 750 thousand, while population structure and
distribution have changed considerably compared with forty years ago. Highly significant
phenomena have occurred such as demographic ageing and the nuclearization of the family which
take profoundly different forms in the central city quarters compared with the periphery.
1 With reference to the convergence scenario adopted by Eurostat in building UN forecasting, the authors of the report
wrote «... in order to estimate in a quantitative way the uncertainty (...) it is needed to move to stochastic techniques»
(2007). 2 The paper presents the principal results of a research project titled “La popolazione dell’area metropolitana di Roma.
Evoluzione demografica e previsioni al 2024” funded in 2012 by the Province of Rome and carried out by IRPPS-CNR
and the Department of Statistics, Sapienza University of Roma (project director Massimiliano Crisci). We thank
Provinciattiva S.p.a. for permission to publish, in particular the of the Territory Area Enzo Proietti, Paolo Iannini and
Franco Leccese. 3 The description of the procedure followed in constructing the socalled "virtual population", that is, the population
obtained on the basis of the registry office and census documentation (2001), proved to be quite complex and is
impossible to describe concisely in this paper: see, for further details, Sonnino et al., 2011 and Carbonetti, Crisci and
Gesano (2013).
3
Natural dynamics are no longer the driving force behind Rome demographic growth. Due to the
decrease in the mean number of children per woman the birth rate has declined considerably while
the lengthening of life expectancy has led to an increase in the number of elderly persons but also
an increase in the number of deaths, which in the past two decades has always exceeded that of
births.
Compared with a few decades ago the migratory situation has changed radically: the population
no longer changes as a result of in-migration from the country and the South, but due to foreign
immigration, which has changed the face of a city that now accommodates 300 thousand foreign
residents belonging to nearly two hundred different ethnic communities (Sonnino 2006; Bonifazi,
Strozza 2007).
In the Rome area, foreign immigration has taken on aspects comparable to other western
metropolises (Castles, Miller 2009) which may be summed up as the heterogeneous nature of the
countries of origin, the growing predominance of females in the flows, insertion in the less
appealing segments of the labour market, in the first instance family assistance and care and the
construction industry (Ambrosini 2005; Bonifazi 2007). Foreign citizens have more than tripled in
just a few years and their impact on the local demographic situation has become increasingly
marked. Immigration from abroad has offset the negative migratory balance of Rome caused over
many years by the out-migration of Rome residents towards towns in the hinterland and also the
natural dynamics has benefited from the higher fertility of foreign women (Crisci, 2006; Casacchia,
Crisci, Strozza, 2006).
Residents are no longer concentrated in the central and semi-central quarters but are scattered
over the former farmland around Rome (‘Agro romano’) and the outlying municipalities and spread
over the entire metropolitan province4. The consolidation of international migrations was actually
superimposed on and interacted with another phenomenon which had been in progress for several
decades – the redistribution of the population between the centre and the metropolitan periphery
(Dematteis, Bonavero 1997; Indovina 2003; Martinotti 1999).
The 1970s saw the development of a process of peri-urbanization in which formally out-
migration of population from central Rome benefited the hinterland municipalities and the other
provinces in Lazio although it should rather be interpreted as the expansion of the city itself beyond
its boundaries rather than as urban decline. The persistent monocentric structure of the area meant
that this new peri-urban population, although moving its residence some distance from the city
centre, continued to be linked to the capital for its various activities, ranging from work to study,
from shopping to personal care (Gesano 1987; Crisci 2002; Cannata, Carloni, Castronovi 2008).
However, an understanding and interpretation of the socio-demographic dynamics demands a
larger-scale territorial observation horizon than that of the municipality. In the absence of any
official delimitation of the Rome Metropolitan Area it is sufficient to extend the observation
horizon from that of municipality to that of the province to realize that the population of the Rome
area has not remained the same as it was forty years ago but has increased by 600 thousand units
and continues to grow (Crisci, 2010).
The first decade of the 21st century witnessed an acceleration of urban sprawl, that is, the
unregulated expansion of the city into the surrounding metropolitan area in a process of selective
diffusion involving above all young families with children. They moved to areas of Rome situated
outside the Grande Raccordo Anulare (GRA), the urban highway surrounding the city, or to the
municipalities of the hinterland also because they could not afford the real estate prices in the
quarters closer to the city centre (Caudo 2006; Berdini 2008).
The actual extent of this expansion phenomenon, which in Italy is often studied by contrasting
the population of the capital with that of the rest of the province (the hinterland), is largely masked
4 In early 2011 the province of Rome had a population in the vicinity of 4 million 200 thousand and over the period
2002-11 displayed the most rapid growth of all the large Italian urban areas with an increase of 336 thousand units.
Some 91.6% of population growth was due to migratory dynamics (+308 thousand residents) and only the remaining
8.4% to the natural balance (+28 thousand residents).
4
by the huge size of the municipal territory of ‘Roma Capitale’5, the second largest in Europe after
London. It comprises not only the densely populated “compact city” but also huge sections of the
Roman countryside (‘Agro romano’), that is, of the sparsely populated “diffuse city”. For this
reason, a substantial proportion of residential changes of a periurban nature, that is, involving out-
migration from the city towards an area of the ‘Agro romano’ inside the territory of the capital is
incorrectly interpreted as an intra-municipal migration (Crisci, 2010). In actual fact, the territory of
the capital is too large to be able to identify the urban core but at the same time too small to be
considered a metropolis owing to the obvious functional links between the capital and the
surrounding municipalities6. An analysis aimed at detecting the evolutionary nature of the
redistribution of the Rome population must therefore endeavour to progress beyond the
conventional dichotomic concept of capital -hinterland and involve several urban strata inside Rome
and its province.
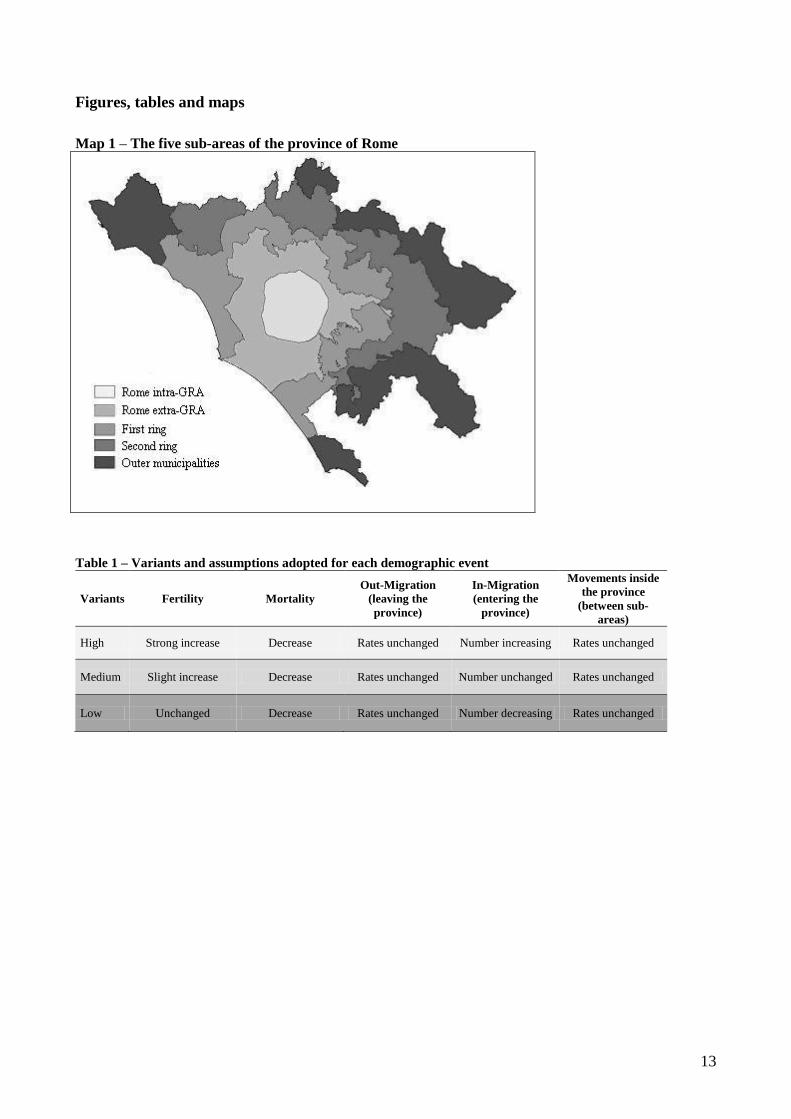
For this reason it was decided to carry out the demographic forecasts by subdividing the territory of
the Rome Metropolitan Area into five areas, namely the part of ‘Roma Capitale’ inside the Ring
Road (GRA) and the four surrounding sub-areas: the Roma Capitale territory outside the GRA, the
first and second ring of municipalities belonging to the Local Labour System (SLL) of Rome and
the more outlying municipalities of the province that belong to other SLLs and are less closely
linked to the capital from the socio-economic point of view (Map 1).
<Map 1 approximately here>
3. Methods and materials
3.1 The stochastic method
The stochastic method of demographic prediction proposed by Bertino-Sonnino (2007) and used in
the present paper consists of the (reiterated) simulation of all the events occurring in each year of
the period investigated. The simulation procedure is based on the hypothesis that each individual in
the population generates events such as death, emigration and birth, in the case of women of fertile
age, according to the rules governing independent Poisson Processes7.
The postulated independence of the processes and the properties of Poisson processes allows us to
state that any time during the study period a process of birth, death and emigration is ongoing and
will itself follow the rules governing Poisson processes and is combined independently with a
Poisson process of immigration.
A Poisson process is known to be characterized by an instantaneous rate of occurrence of events. In
our hypothesis this rate can easily be computed from the functions of mortality, fertility and
emigration (which represent input data for the procedure). For instance, due to the effect of the
independent Poisson processes, the instantaneous rate of mortality for the death process in a given
5 In the absence of any official delimitation of much of the Italian metropolitan areas, although envisaged starting from
the early nineteen-nineties, the interpretation of the changes in settlement dynamics and interchange inside the large
Italian urban areas is conventionally based on the provincial territory and in particular on the dichotomy between the
capital and the rest of the province. 6 Of course, the migratory flows away from Rome that may be included in the process of urban diffusion are not
directed uniformly towards the 120 hinterland municipalities. The attractiveness of the latter tends to diminish with
increasing distance from the urban core in terms of travelling time rather than of actual distance. So much so that certain
urban centres outside the province of Rome that have good communications links with the capital successfully attract
an increasing number of former Rome residents. 7 The stochastic projection method used in the present paper was developed several years ago by Salvatore Bertino and
Eugenio Sonnino, who on several occasions proposed and developed it in a number of scientific contributions: cf. for
instance, Bertino and Sonnino, A new technique for stochastic projection, in Joint EUROSTAT-UNECE Work Session
on Demographic Projections – Budapest, 10-12 October 2007, European Commission Office for Official Publications,
Luxembourg, 2007. In particular, the projections described herein were constructed using the MULTIPRODEST
software developed by Salvatore Bertino.
5
population is obtained by summing the instantaneous mortality rates of all the individuals that go to
make up the population. Likewise, the instantaneous birth rate is obtained by summing the
instantaneous birth rate of all women of fertile age present in the population. The instantaneous rate
of emigration is obtained in a similar fashion. The instantaneous rate of the emigration process is
taken as equal to the average number of immigrants for one year.
A second property of Poisson processes allows us to compute the probability distribution of
individual kinds of event (birth, death, emigration, immigration. Denoting as λ1, λ2, λ3, λ4 the
instantaneous rates of the processes of birth, death, emigration and immigration, respectively, the
probability of an event occurring at a given time t, a birth, for instance, is given by the ratio
4
11 i i. Likewise for the other events. With this distribution, by generating a random number in
(0,1), it is possible to simulate the kind of event that occurred at time t.
The same procedure can be used to simulate age at birth, sex and age at death, sex and age at
emigration, sex and age of the immigrant. The simulation is repeated for all the events occurring in
a given year T.
In conclusion, the procedure involves the simulation of all the events occurring over the whole
study area during each year of the study period, in the following steps:
1) starting from time 0, the first moment of the projection period (period of one year), determination
of the time the first event occurs;
2) assignment of the region in which the event occurs;
3) determination of the kind of event;
4) change in the population’s structure as a result of the type of event.
In general, starting from the time ti in which the i-th event occurs, determination of the time in
which the next event occurs (ti+1). Steps 2, 3 and 4 are repeated for each event.
The procedure is stopped as soon as the time in which the last event should occur exceeds one (that
is, one year).
At the end of the year a series of parameters are defined that characterize the population such as:
breakdown of population structure by sex and five-year age group;
total population broken down by sex;
maximum age of individuals in the population, separately for each sex;
average age of survivors, separately for each sex;
number of births of both sexes in the course of the year;
average age at childbirth;
number of deaths for each sex during the year;
average age at death by sex;
life expectancy at birth observed for each sex;
number of immigrants during the year, separately for each sex;
number of emigrants during the year for each sex;
observed TFR.
The above statistics are computed for each region in the study year and for each year of the study
period. The simulation procedure is then repeated a prescribed number of times (twenty-one in our
study). In this way the mean values of all the parameters characterizing the population can be
computed, together with the relative standard variations and, using these data, the projection
intervals.
3.2. Assumptions and variants
The implementation of the projection procedure was preceded by an exacting phase of input data
preparation. In the first instance it was necessary to acquire population data for the first year of the
projection procedure. In other words a detailed picture was created of the total population resident
in the province and its composition by gender, annual age group, nationality and municipality, as
6
well as urban sub-area of Rome to which it belongs, with reference to the base year from which the
projection ran (1.1.2009). The next step was to aggregate the 155 urban sub-areas of Rome and the
120 municipalities of the province in order to obtain the population structure of the five territorial
sub-areas by sex, age and nationality.
In the next phase the following information was extracted from recent demographic statistics,
disaggregated by gender and age with reference to each territorial zone: total population, deaths,
total immigration broken down by place of origin (other sub-areas, other Italian provinces, abroad),
total emigration broken down by destination (other sub-areas, other Italian provinces, abroad) and
births by mother’s nationality. This information was used to construct specific rates by sex and age
referring to each kind of event.
Once the stage of basic input preparation had been completed, the variants regarding the future
demographic dynamics of the population were obtained by analysing the trends over the past decade
and making assumptions concerning life expectancy, inclination to move outside the province or
move around inside it and residents’ fertility, all broken down by sex, age and residential sub-area.
Moreover, hypotheses were proposed concerning the future annual total number of immigrants from
the other Italian provinces and from abroad and their distribution by sex, age and territorial sub-
area.
In the light of recent demographic trends in the area, it was decided to adopt only one hypothesis
regarding mortality, emigration and changes of residence inside the province and to differentiate the
three variants, identified as high, medium and low, in accordance with alternative hypotheses
regarding fertility and immigration (Table 1). As far as future evolution is concerned, three
assumptions were made: slight increase in specific fertility rates reflecting the slight upward trend
observed over the past few years; a greater increase with respect to recent evolution; rates constant
at average levels observed in recent years8. The high variability affecting immigration from abroad
due to a number of factors, also of a global nature, obviously make the attempt to forecast the size
of the flows more difficult. For this reason three distinct hypotheses were developed: constant in-
migration versus the (already high) levels observed in recent years; increase with respect to the
levels observed in recent years (+20% in 2023); marked decrease with respect to the levels observed
over the past few years (-50% in 2023).
<Table 1 approximately here>
The medium variant assumes the continuation over the period 2009-23 of the trends observed
during the preceding decade: slight increase in fertility, increased life expectancy, relatively high
immigration volume versus emigration which produces a positive migratory balance, spreading into
the metropolitan sub-areas of the population resident in the urban core with decreasing intensity the
further away one moves from the city centre.
The high variant differs from the medium one as a result of the expansion assumptions adopted for
fertility and immigration. A more favourable socio-economic situation than that prevailing in recent
years could lead to an increase in fertility in both Italian and foreign women. The average number
of children per immigrant woman could increase also as a result of a national migration policy more
open towards family reunification, which would also produce a further gradual increase in
immigration from abroad.
8 Analysis of reproductive behaviour in the province of Rome during the first decade of the third millennium has led to
two territorial models being identified, which differ in their fertility intensity: a high value (referring to the intra-GRA
area of Rome), and a low one (referring to the four metropolitan sub-areas). Moreover, in assessing the intensity and
the future reproductive calendar, consideration was given also to the differences between the fertility models of the
Italian and foreign residents, as may be seen in the different contributions made to the TFR in the respective areas. The
different contributions made by Italian and foreign women to provincial fertility have been assigned proportionally to
the relative weight of the Italian and foreign residents respectively in the various reproductive ages (between 15 and 49
years) predicted for 2024 (Casacchia, Crisci, Strozza, 2006).
7
The low variant envisages an increase in the effects of the economic crisis in Italy. Even though
increasing population ageing and the weakness of the welfare state seem to point to an increased
future demand for immigrant workers, this variant postulates a strong decrease in the number of
foreign citizens registering as residents, that is, in more stable presences, which could be the result
of a national migration policy aimed at encouraging the temporary nature of the flows mainly for
work purposes and at discouraging the tendency towards stabilization of settlement and family
reunifications. Such circumstances could halt the slight recovery in fertility witnessed over the past
few years owing to the reaction of the native population to a situation of economic crisis and to the
reduced number of births by foreign mothers.
The three variants are therefore based on several “strong” assumptions:
population growth in the Rome area will continue to be due above all to immigration, in
particular from abroad;
fertility will not decrease, even in the case of a drop in foreign immigration;
the process of peri-urbanization will continue to cause population transfer towards the
metropolitan zones at the same rate as in the last few years;
there will be no increase in the propensity to out-migrate from the province of Rome.
4. Main results
4.1 The results of stochastic prediction
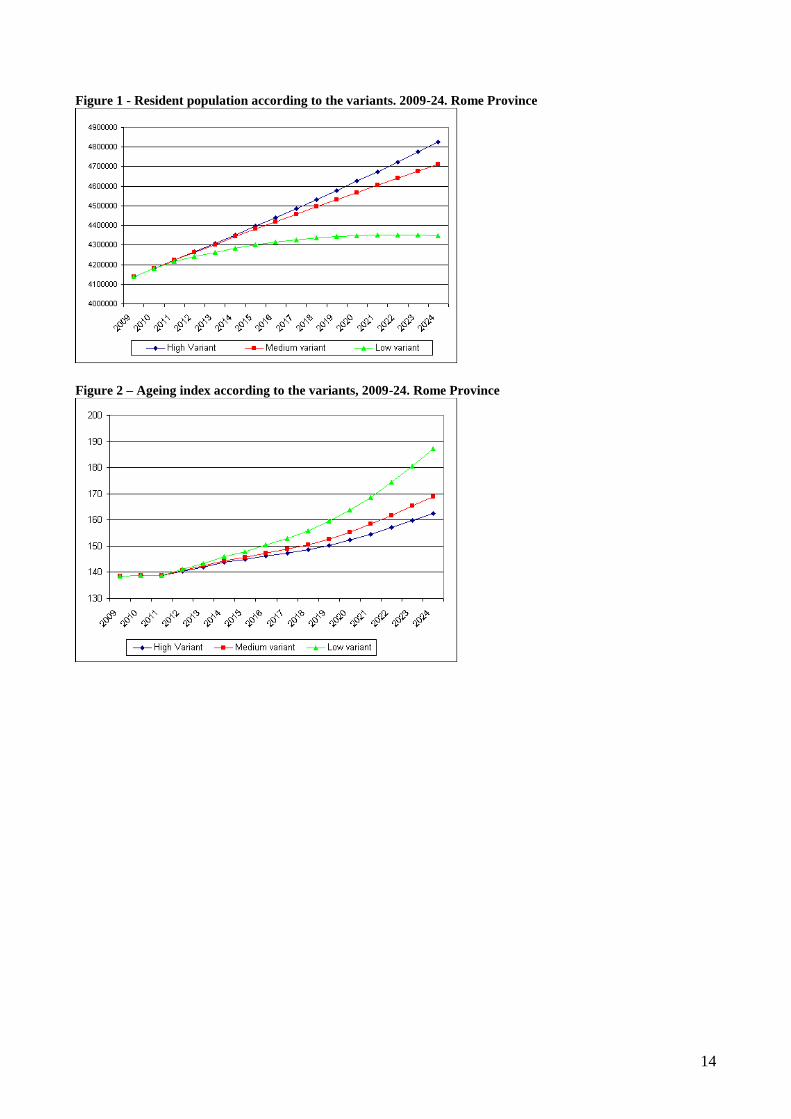
All three variants constructed using the stochastic method, albeit to different degrees, unanimously
indicate that over the next 15 years the population of the province of Rome will increase and its age
structure will continue to grow older, also because the natural balance will change from positive to
negative. In 2024 the number of residents will increase from the 4.1 million of 2009 to between 4.8
million for the high variant and 4.3 million for the low variant. Between 2009 and 2024, an increase
in absolute terms of between 207 thousand and 688 thousand residents will occur, in relative terms
between +5% and +16.6% (Fig. 1). The percentage of residents under the age of 15 will drop from
14% in 2009 to 12.3-13% in 2024, while the incidence of over 65s will rise from 19.4% of 2009 to
21.2-22.9% in 2024. As a result, the old-age index will increase, rising from 139 over 65s per 100
under 15s in 2009, to 163-187 over 65s per 100 under 15s (Fig. 2). In absolute terms, between 2009
and 2024, the elderly population will undergo a strong increase (over 65s: about +200 thousand
units), while the number of under 15s will increase for the high and medium scenarios (+24-51
thousand units) and will decrease by 46 thousand units for the low scenario. The relative ageing of
the population in the province will not necessarily be paralleled by a reduction in younger age
residents.
The natural negative balance will be produced by an increase in the number of deaths (predicted in
all three scenarios, despite the increased life expectancy) due to the increase in the elderly
population which is not offset by a corresponding increase in the number of births, the latter
actually decreasing if the medium, and above all the low, scenario is considered. The decrease in
the number of births could occur despite a slight increase in the mean number of children per
woman as the number of women of fertile age (15-49 years) is destined to decrease over the next
few years as the less numerous generations born in years of low birth rate gradually reach
reproductive age.
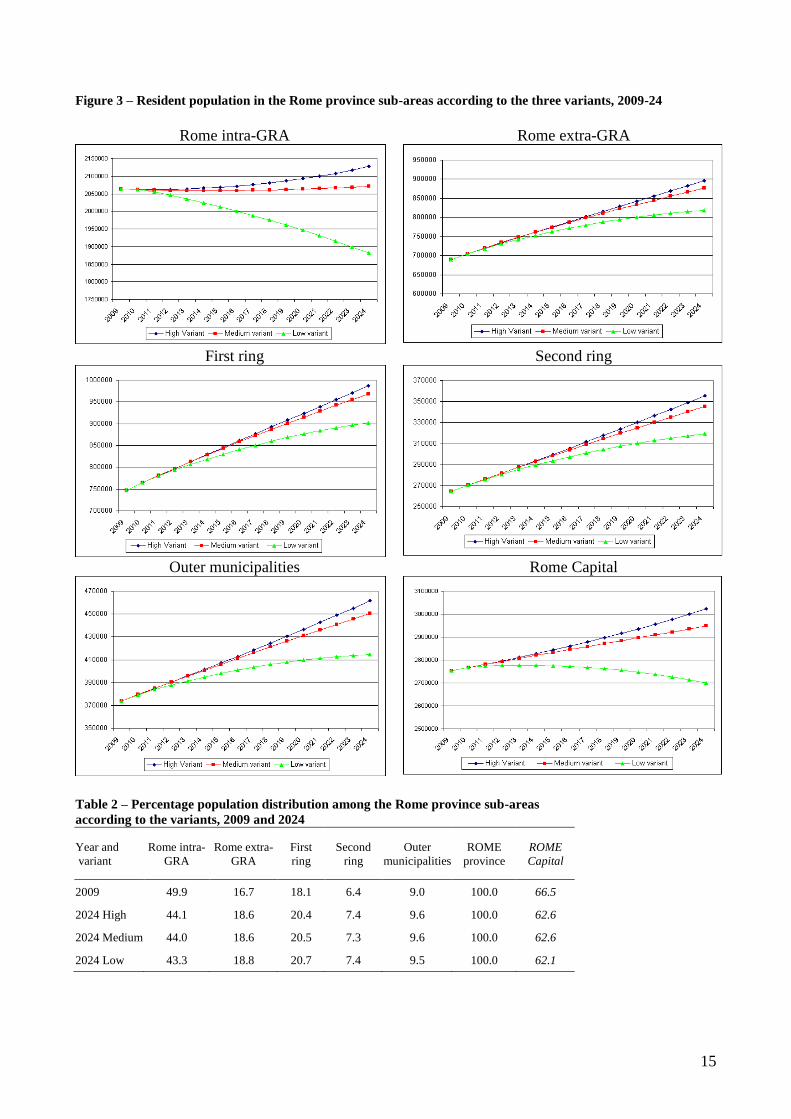
The persistent process of population flow from the central areas of the province to the metropolitan
zones will result in population growth occurring at different rates and with a different sign in the
five provincial sub-areas, in particular along the centre-periphery axis (Fig. 3).
In 2024, inside the Rome GRA, the number of residents could decrease by 181 thousand units (-
8.8%), which would bring the population below the level of 2 million should the assumptions on
which the low scenario is based prove true, in particular the sharp decrease in immigration from the
rest of Italy and from abroad. In the medium scenario there would be a substantial freezing of the
8
2009 figures while in the high scenario, thanks to a further increase in immigration, it is predicted
that the number of residents would increase by 64 thousand units over the next 15 years.
The metropolitan sub-areas around the GRA will be subjected to a strong population increase. In
particular, the extra-GRA zone of Rome will rise from the 690 thousand residents of 2009 to 818-
896 thousand in 2024, with an increase of between 18.6% and 29.8%, while the population of the
municipalities in the first ring will rise from 748 thousand units in 2009 to 902-987 thousand in
2024, that is, a growth of between +20.6% and +32%. In the second ring municipalities compared
with 2009 the growth will be between +20.9% and +34.4% residents in relative terms, and the
population will rise from the 264 thousand units of 2009 to 320-355 thousand in 2024. In the
outlying municipalities the increase is predicted to be lower (between +10.9% and +23.5%), with an
increase in the number of residents from 374 thousand to 414-462 thousand units over the period in
consideration.
There will consequently be a further decrease in the relative demographic weight of Rome inside
the GRA (from 49.9% in 2009, to 43-44.1% in 2024) and an increase in the metropolitan sub-areas
– a particularly large one in the extra-GRA sub-area of Rome and in the first ring municipalities,
and a smaller one in the second ring municipalities and the outlying municipalities of the province
(Tab. 2).
<Figure 1 approximately here>
< Figure 2 approximately here>
< Figure 3 approximately here>
< Table 2 approximately here>
4.2 Some comparisons with results using the deterministic method
During the study some predictive scenarios involving the use of the deterministic model of the
multiregional type (Rogers' model) were developed. It is interesting to check whether the point
event estimates obtained using the multiregional model are consistent or not with those of the
stochastic model, and above all to verify whether the latter, for which also prediction intervals9 are
available, incorporate also the deterministic estimates or whether the latter lie outside the prediction
interval10
.
Already in several previous tests it was deemed useful to compare the results obtained from the two
proposed methods so as to strengthen the conclusions deriving from the implementation of the
prediction model which, it will be recalled, is to be considered a new model even though it has now
been tested on several occasions.
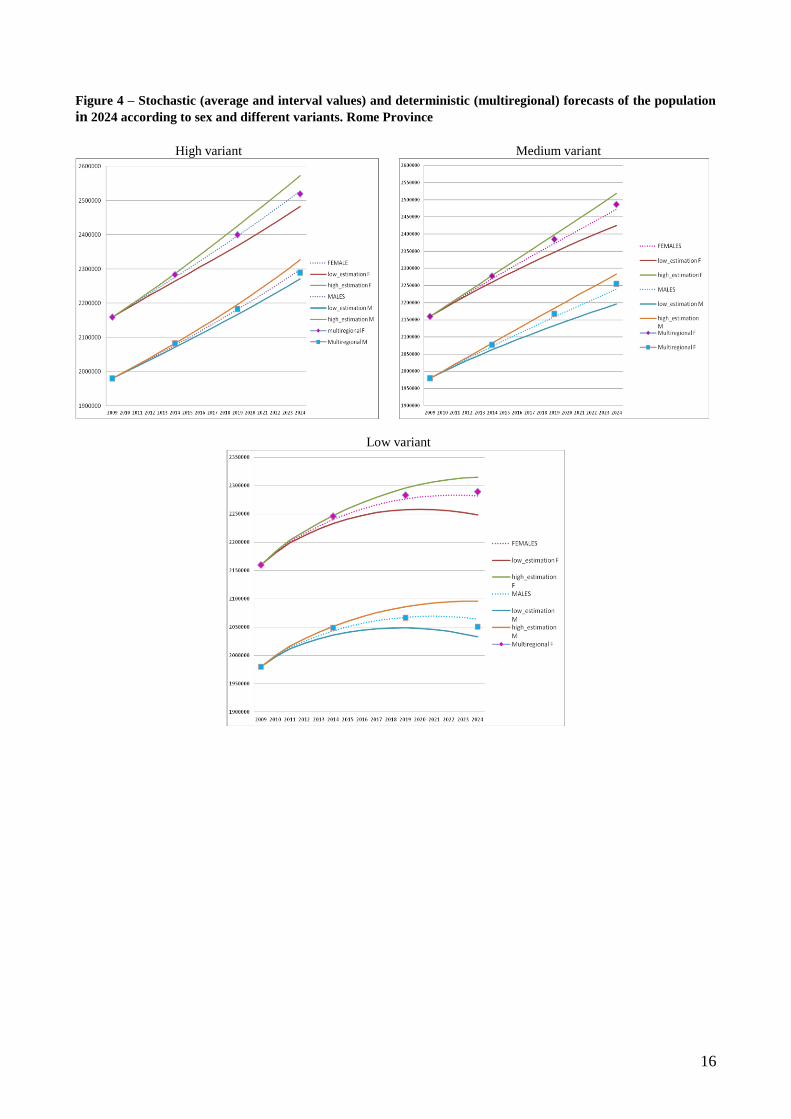
In the following the proposed comparisons refer to the 2009-2024 evolution of the resident
population obtained using the two methods separately for each kind of variant (Figure 4).
9 The prediction interval is obtained by taking a range 2.135 times the value of the standard deviation of the stochastic
estimates (cfr. Sonnino, Bertino, Casacchia, Crisci, D’Orio, Rosati, Popolazione e previsioni demografiche nei Municipi
di Roma Capitale, Gangemi, Roma, 2011, p. 91), which corresponds to the 95% t-student value weighted with a factor
corresponding to the square root of 1+1/m, in which m expresses the number of simulations (in this case 21): cf.
Bertino, Sonnino and Lanzieri, «Projecting the population of the 27 Member States by stochastic methods combined
with the deterministic projections EUROPOP 2008», Genus, LXVIII, 1, 91-106. 10
In the present paper the same logic is applied as that which has already produced interesting results in the case of
predictions performed at the level of the nineteen Rome municipalities (cf. Sonnino et al., cit.). Equally encouraging
results were obtained by comparing deterministic estimates with stochastic predictions for the populations of the 27
European Union countries: cf. Bertino, Sonnino and Lanzieri, cit.
9
Subsequently comparisons will be proposed with reference to the medium variant alone (the results
for the other two variants are exactly the same).
It should be noted that the multiregional model implemented has produced five-year results (the
population is predicted by aggregating the individual ages into five-year groups so that also the
prediction interval will follow the same step). This is because it is usually advisable to aggregate
groups which may sometimes be very small and lead to unstable results. Conversely, the stochastic
method affords more analytical results (individual ages and prediction intervals equal to one year)
as the determination of the uncertainty of the estimates is obtained by constructing prediction
intervals.
It should also be noted that the stochastic kind of projections produces prediction intervals that can
provide the user with precious information. Moreover, in the short term, the forecast uncertainty is
not high: the interval after five years from 2009 lies within a narrow range of values. This in itself is
an important result which may be taken as a valid orientation towards the governance of the
provincial territory. However, in the medium and long run the forecast uncertainty is by no means
negligible (see Figure 4). In some cases, particularly in the less substantial demographic sub-areas it
becomes substantial: in this case, the help provided by stochastic predictions is rather that of
encouraging the user of the projections to adopt a probabilistic stance at decision-making time, as
has been argued in recent contributions on the subject of the effective usefulness of stochastic
predictions (see Christiansen and Keilman, 2013).
Observing the two predictions – stochastic and deterministic – for the resident population of the
province of Rome, a substantial consistency is found between the estimates obtained using the
multiregional method and the stochastic predictions. The estimates obtained using the first method
all lie within the prediction interval provided by the stochastic method, often actually almost
coinciding with the central estimate value (Figure 4). No significant differences are observed in the
comparison of the levels corresponding to the two sexes.
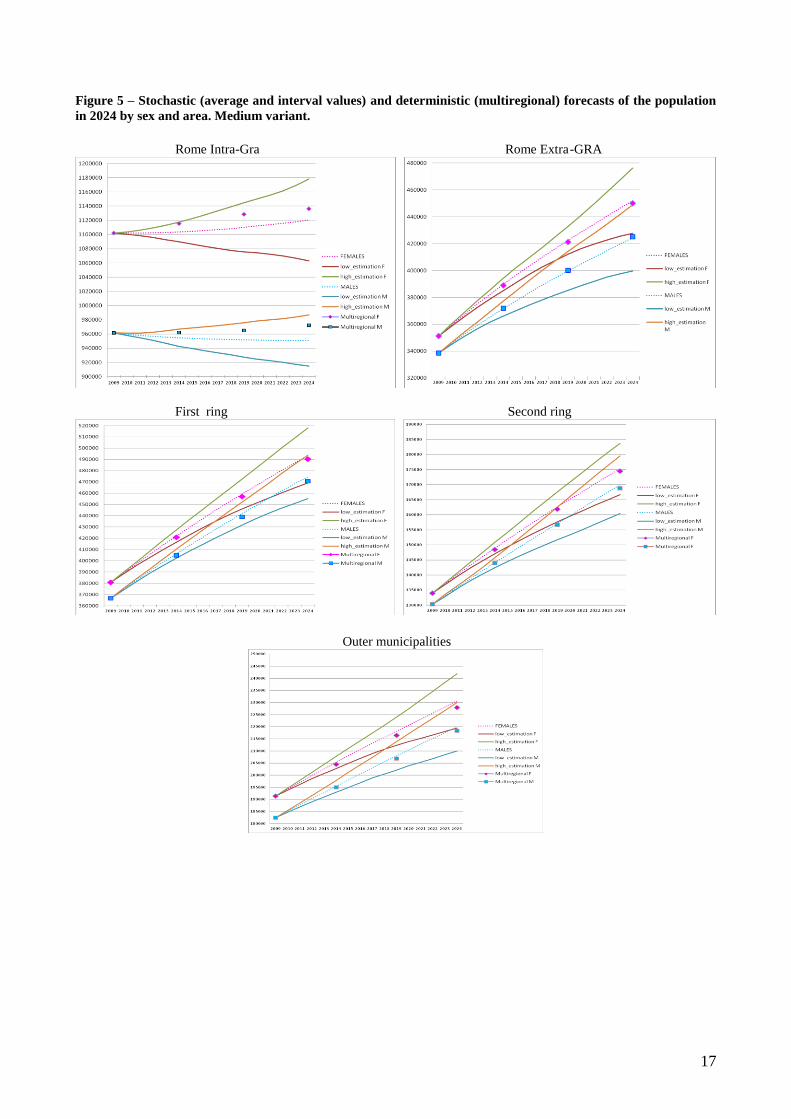
If the comparison is set up at a more greatly disaggregated territorial level (that of the five sub-
areas), a lower degree of consistency is obviously to be expected, as the estimated consistency of
the two prediction scenarios is lower versus the population of the province as a whole (the
population in the metropolitan zones varies from a minimum of 300 thousand to a maximum of
about one million).
Also in this case, however, the results of the comparison seem to be encouraging: the consistency
between the results obtained using the two methods again seems to be very high. The deterministic
estimates all lie within the prediction interval for both the male and the female population (Figure
5).
Moreover, except for the comparison set up for the first sub-area (intra-Gra Rome: Figure 5), the
deterministic estimates seem practically to coincide with the central value of the stochastic
estimates.
The comparison can also be performed by further distinguishing the results of the predictions
obtained using the two methods (for instance, considering specific age groups). In this case it
should be noted that the results obtained using the deterministic method are sometimes found to lie
partly outside the stochastic prediction interval, although the differences are always fairly small.
< Figure 4 approximately here>
< Figure 5 approximately here>
5. Discussion and further development
10
At this stage some reflections need to be made concerning the specific stochastic method used in
this paper, the comparison with a more classical method used to construct population predictions,
the specific results obtained for the 5 Rome sub-areas highlighting the basic, structural and
consistency trends, focusing on the effect that will be exerted on future population levels by the
various demographic components (mortality, fertility, migration).
1. As far as the methodology implemented to develop the population predictions proposed herein is
concerned, a methodology among other things already tested in previous works, cited several times
in the text, it should be emphasized that the B-S method makes available a method for checking the
uncertainty of the predicted values, an uncertainty that is assessed in its two fundamental
components, the one associated with deterministic predictions and that inherent in the stochastic
method. The latter represents a source of variability that is far greater than the variability of
deterministic predictions: both forms of variability are however combined in the B-S method to
yield the stochastic variability of the proposed projection (see Bertino, Sonnino and Lanzieri, 2012:
95).
2. As far as the comparison between the two prediction procedures is concerned, both the
deterministic and the B-S stochastic forecasting display the same trend. Moreover, the average
values of random projections are not very different from the deterministic ones, both as regards the
prediction of the provincial population as a whole and observing the predictions constructed for the
five metropolitan zones.
3. Examining the results obtained in detail it must be emphasized that all three variants, albeit in
different degrees, unanimously predict that in 2024 the population of the province of Rome will
increase and its age structure will continue to grow older. Over the next few years, to a much
greater extent than as a result of natural dynamics (that is, birth rate and mortality), it will be the
changes in the short, medium and long term migration dynamics that will modify the present
demographic situation prevailing in the area. The three prediction variants presuppose national
policies that could have different knock-on effects on the volume and characteristics of foreign
immigration in the Rome area, while migrations to/from other Italian provinces are obviously
deemed to be less flexible and not liable to be influenced by political choices. Compared with the
short-range flows it has instead been postulated that mobility within the province will take place
within the framework of “unchanged territorial policies”. That is, over the next 15 years the local
administrations will maintain the same attitude as has favoured the urban sprawl of the last decade.
This will facilitate the continuation of the process of urban spread from the compact city to the
metropolitan periphery and will lead to a further decrease in the demographic weight of the urban
core.
One interesting development of the present research could be represented by a combination of
deterministic forecasts and stochastic predictions. One extremely elegant, original and innovative
way (see Bertino, Sonnino, Lanzieri, Lisbon 2010) to combine the two predictions is that involving
a Bayesian approach. In such a context the deterministic prediction with its degree of reliability is
viewed as the initial distribution (a priori vis-à-vis the experiment) of the parameter of interest and
the stochastic prediction is viewed (as it is) as the result of an experiment consisting of m
independent tests in a simulation procedure following an assigned model11
. Such a formalization
will make it possible in future to compute prediction intervals based on the final forecast
distribution.
11
Assuming that the initial distribution is 2, ddN
and that the stochastic simulations are the outcome of a normal
distribution 2, sN
, the mean of which is estimated from s and whose variance is estimated by 2ˆs, the final
forecast distribution is:
22
22
22
22
1,ds
ds
ds
dssd
mm
mN
11
References
Alho J., Alders M., Cruijsen H., Keilman N., Nikander T., and Pham D.Q. (2006), "New forecast: Population decline
postponed in Europe", Statistical Journal of the United Nations ECE 23, 1-10, available at
http://folk.uio.no/keilman/UNECE.pdf.
Ambrosini M. (2005), Sociologia delle migrazioni, il Mulino, Bologna.
Berdini P. (2008), La città in vendita. Centri storici e mercato senza regole, Donzelli Editore, Roma.
Bertino S., Sonnino E. (2007), «A new technique for stochastic population projections», in Work session on
demographic projections, Joint EUROSTAT-UNECE Work Session on Demographic Projections, (Bucharest –
Romania, 10-12 October), pp. 161-175, Luxembourg: Europ. Comm. Office for Official Publications (Luxembourg).
Bertino S., Sonnino E., Lanzieri G. (2010), Combining Deterministic and Stochastic Population Projections, Lisbon,
28-30 April 2010. Eurostat Methodologies and Working papers.
Bertino S., Sonnino E., Lanzieri G. (2012), Projecting the population of the 27 EU Member States by stochastic
methods combined with the deterministic projections Europop 2008, «Genus», LXVIII, 1, pp. 91-106.
Billari F.C., Graziani R., Melilli E. (2011), Stochastic population forecasts based on conditional expert opinions,
«Journal of Royal Statistical Society», 175, part 2, pp. 491-511.
Bonifazi C. (2007), L’immigrazione straniera in Italia, il Mulino, Bologna.
Bonifazi C., Strozza S. (2007), “La presenza straniera: le tendenze recenti”, in Morrone A., Pugliese E., Sgritta G.B.,
Gli immigrati nella Provincia di Roma. Rapporto 2006, Franco Angeli, Milano.
Cannata B., Carloni S., Castronovi A. (2008), Le periferie nella città metropolitana, Ediesse, Roma.
Carbonetti R., Crisci M., Gesano G. (2013), "Studi di popolazione per la governance locale", in F. Racioppi and G.
Rivellini (eds.), Applied Demography. La demografia per le aziende e la governance locale, Nuova Cultura, Roma,
pp.175-198.
Casacchia O. (2013), “Stime e previsioni di popolazione in ambito sub-regionale e per piccole aree”, in F. Racioppi and
G. Rivellini (eds.), Applied Demography. La demografia per le aziende e la governance locale, Nuova Cultura,
Roma, pp.83-98.
Casacchia O., Crisci M., Strozza S. (2006), “Nati stranieri a Roma. Possibilità di stima e previsioni”, in I numeri di
Roma. Statistiche per la città, no. 2, Aprile-June, available on the Internet at
http//www.comune.roma.it/PCR/resources/cms/documents/numero2_06.pdf.
Casacchia O., Crisci M. (2013), La popolazione dell’area metropolitana di Roma. Evoluzione demografica e previsioni
al 2024, Consiglio Nazionale delle Ricerche - Istituto di Ricerche sulla Popolazione e le Politiche Sociali, IRPPS
Working papers n. 56, Roma.
Castles S.., Miller M. J. (2009), The Age of Migration. International Population Movements in the Modern World,
MacMillan, London.
Caudo G. (2006), “Le case di carta e la nuova questione abitativa”, in Comune di Roma, XV Dipartimento, Abitare a
Roma, I dossier di Romaeconomia, Anno I, n.1, Roma.
Christiansen S., Keilman N. (2013), Probabilistic household forecasts based on register data - the case of Denmark and
Finland, «Demographic Research», vol. 28, article n. 43, 1261-1302.
Crisci M. (2002) “Sistemi giornalieri urbani di Roma: un’ipotesi di definizione”, in Morelli Roberta, Sonnino Eugenio,
Travaglini Carlo M., I territori di Roma. Storie, popolazioni, geografie, Università degli studi di Roma “La
Sapienza”, Tor Vergata, Roma Tre, 531-549.
Crisci M. (2006), “La fecondità delle donne straniere a Roma: un tentativo di stima”, in Sonnino E. (cur.), Roma e gli
immigrati: la formazione di una popolazione multiculturale, Franco Angeli, Milano.
Crisci M. (2010), Italiani e stranieri nello spazio urbano. Dinamiche della popolazione di Roma, FrancoAngeli, Roma.
Crisci M., (2013), Lo sprawl residenziale nell’area romana: passato, presente e futuro?, in Proietti E., Periferie
romane e dimensione metropolitana. Valori e contraddizioni di uno scenario di crisi: analisi e proposte, AIC Unione
Borgate, Roma.
Dematteis G., Bonavero P. (1997), Il sistema urbano italiano nello spazio unificato europeo, il Mulino, Bologna.
Eurostat (2007), EUROPOP2007 Convergence Scenario: Summary Note, Working Group on Population Projections
and Working Group on Ageing population and sustainability, doc.estat/f1/pro(2007)02/GL, Luxembourg 26
November.
Gesano G. (1987) La mobilità per lavoro nella provincia di Roma, Editori Riuniti, Roma.
Indovina F. (2003), “La metropolizzazione del territorio. Nuove gerarchie territoriali”, in Economia e società regionale,
n.3/4, FrancoAngeli, Milano.
Martinotti G. (1999), La dimensione metropolitana, il Mulino, Bologna.
Sergei Scherbov, Marija Mamolo, Wolfgang Lutz (2008), «Probabilistic Population Projections for the 27 EU Member
States Based on Eurostat Assumptions», European Demographic Research Papers, IIASA, pp. 75.
Sonnino E. (2006), Roma e gli immigrati. La formazione di una popolazione multiculturale, Franco Angeli, Milano.
Sonnino E., Bertino S., Casacchia O., Crisci M., D’Orio G., Rosati R. (2011), Popolazione e previsioni demografiche
nei municipi di Roma Capitale. Dinamiche attuali e prospettive fino al 2024, Gangemi, Roma, pp. 255.

12
13
Figures, tables and maps
Map 1 – The five sub-areas of the province of Rome
Table 1 – Variants and assumptions adopted for each demographic event
Variants Fertility Mortality
Out-Migration
(leaving the
province)
In-Migration
(entering the
province)
Movements inside
the province
(between sub-
areas)
High Strong increase Decrease Rates unchanged Number increasing Rates unchanged
Medium Slight increase Decrease Rates unchanged Number unchanged Rates unchanged
Low Unchanged Decrease Rates unchanged Number decreasing Rates unchanged
14
Figure 1 - Resident population according to the variants. 2009-24. Rome Province
Figure 2 – Ageing index according to the variants, 2009-24. Rome Province
15
Figure 3 – Resident population in the Rome province sub-areas according to the three variants, 2009-24
Rome intra-GRA Rome extra-GRA
First ring Second ring
Outer municipalities Rome Capital
Table 2 – Percentage population distribution among the Rome province sub-areas
according to the variants, 2009 and 2024
Year and
variant
Rome intra-
GRA
Rome extra-
GRA
First
ring
Second
ring
Outer
municipalities
ROME
province
ROME
Capital
2009 49.9 16.7 18.1 6.4 9.0 100.0 66.5
2024 High 44.1 18.6 20.4 7.4 9.6 100.0 62.6
2024 Medium 44.0 18.6 20.5 7.3 9.6 100.0 62.6
2024 Low 43.3 18.8 20.7 7.4 9.5 100.0 62.1
16
Figure 4 – Stochastic (average and interval values) and deterministic (multiregional) forecasts of the population
in 2024 according to sex and different variants. Rome Province
High variant Medium variant
Low variant
17
Figure 5 – Stochastic (average and interval values) and deterministic (multiregional) forecasts of the population
in 2024 by sex and area. Medium variant.
Rome Intra-Gra Rome Extra-GRA
First ring Second ring
Outer municipalities