stock liquidity and corporate tax avoidance: the tale of ... · stock liquidity and corporate tax...
TRANSCRIPT

1
Stock Liquidity and Corporate Tax Avoidance: The Tale of Two
Tails
Yangyang Chen
Department of Banking and Finance
Monash University
Leon Zolotoy*
Melbourne Business School
University of Melbourne
First draft: May 2013
Current version: January 2014
ABSTRACT
We examine the relation between stock liquidity and corporate tax avoidance.
Utilizing a quantile regression framework for the comprehensive sample of US firms,
we document the following key results: (i) stock liquidity is positively (negatively)
associated with the lower (upper) tail of the tax avoidance distribution; (ii) the effect
of stock liquidity on both tails of tax avoidance distribution is stronger for firms with
high levels of business uncertainty; and (iii) the effect of stock liquidity on the lower
(upper) tail of tax avoidance distribution is mitigated (magnified) for the financially
constrained firms. Our findings are consistent with the positive feedback channel
where, by making share prices more informative to managers, greater stock liquidity
affects firm’s tax planning.
JEL Classification: G10, G30, M40.
Keywords: Stock liquidity; Tax avoidance; Information asymmetry; Financial
constraints; Positive feedback.
* Corresponding author. Address: 200 Leicester Street, Carlton VIC 3053. Email:
[email protected]. Tel: +61 3 9349 8424.
2
I. INTRODUCTION
Corporate tax avoidance has become a substantial issue in both finance and
accounting research in recent years. The statutory corporate tax rate in the United
States is one of the highest in the world. At the same time, there is striking variation
in corporate tax payments among U.S. firms. At one extreme, a substantial share of
profitable U.S. corporations pay very little or even no corporate taxes, which makes
some observers view corporate tax avoidance as the most important compliance issue
in the U.S. tax system today (Desai and Dharmapala, 2006). At the other extreme,
approximately one-fourth of U.S. firms pay corporate taxes in excess of the statutory
tax rate (Dyreng, Hanlon, and Maydew, 2008), suggesting that these firms engage in
little or no tax avoidance. Why do some firms pay little corporate tax while others pay
excessive levels? The determinants of corporate tax avoidance are still far from being
well understood, and are a fertile ground for further research in this important area
(Shackelford and Shevlin, 2001; Hanlon and Heitzman, 2010).
We examine the effect of stock liquidity on corporate tax avoidance. Two strands
of the previous literature motivate our research question. The first strand examines the
determinants of tax avoidance and its implications for shareholder wealth. Studies in
this stream of research view tax avoidance as an investment decision along the
continuum of tax planning strategies available to managers, where in equilibrium a
value-maximizing firm should invest in tax avoidance as long as marginal benefits of
tax avoidance exceed its marginal costs (Hanlon and Heitzman, 2010; Edwards,
Schwab and Shevlin, 2013). However, similar to other investment decisions,

3
managers may deviate from the optimal level of investment in tax avoidance (from
the shareholders’ perspective) by investing either “too little” or “too much” in tax
planning (Armstrong et al., 2013). On the one hand, overly-conservative tax
avoidance (that is, being in the lower end of the continuum of tax planning strategies)
results in loss of potential cash-savings (Graham and Tucker, 2006; Cheng et al.,
2012). On the other hand, overly-aggressive tax avoidance (that is, being in the upper
end of the tax planning continuum) facilitates managerial rent extraction (Desai and
Dharmapala, 2006; Kim, Li and Zhang, 2011), and may also result in additional
auditor fees, legal fines and reputational costs (Mills, 1998; Wilson, 2009; Graham et
al., 2013), and thus will erode shareholder wealth1.
A second strand of related literature examines the effect of stock liquidity on
firm’s investment decisions. Prior studies suggest that firm managers make
investment decisions that are contingent on the information revealed by the firm’s
stock price (e.g., Subrahmanyam and Titman, 2001; and Khana and Sonti, 2004), and
that the sensitivity of firm’s investments to stock price is increasing in stock price
informativeness (Chen, Goldstein and Weng, 2007). Greater stock liquidity facilitates
trading by informed traders (Easley and O’Hara, 2004), thereby making share prices
1 Prior studies provide empirical evidence consistent with investors perceiving both overly-
conservative and overly-aggressive tax avoidance as the value-destroying activities. For the overly-
conservative tax avoidance, Cheng et al. (2012) find that, relative to matched firms, businesses targeted
by hedge fund activists exhibit lower tax avoidance levels prior to hedge fund intervention, but
experience increases in tax avoidance after the intervention. For the overly-aggressive tax avoidance,
Hanlon (2005) document that investors perceive large book-tax differences (book income greater than
taxable income) as a “red flag” and reduce their expectations of future earnings persistence for these
firms. In a similar context, Hanlon and Slemrod (2007) find that, on average, a company’s stock price
declines when there is news about its involvement in tax sheltering.

4
more informative to managers and allowing firm management to make better
investment decisions, a so-called “positive feedback” effect (Fang, Noe, and Tice,
2009).2
High stock liquidity may also improve firm’s investment decisions through the
corporate governance channel. For instance, Maug (1998) shows that stock liquidity
facilitates the formation of larger blockholdings and more liquid trading by these
blocks, thereby enhancing blockholders’ voice and their ability to intervene.
Alternatively, stock liquidity may discipline managers by enhancing the threat of
blockholder exit, when managerial compensation is closely tied to firm’s stock price
(Edmans, 2009; Edmans and Manso, 2011; and Bharath, Jayaraman, and Nagar,
2013).
Collectively, prior research suggests that (i) tax avoidance is a part of firm’s
overall investment strategy, (ii) there are beneficial effects of stock liquidity on firm’s
investment decisions, and (iii) there are adverse implications of both overly-
aggressive and overly-conservative tax avoidance strategies for shareholder wealth.
Integrating these three sets of results, we posit that firms with high stock liquidity will
engage less in both overly-conservative and overly-aggressive tax avoidance, ceteris
paribus.
2 A positive feedback perspective rests on the premise that the extent of share price informativeness is
determined by stock liquidity, and not the other way around, consistent with what prior studies suggest
(e.g., Grossman and Stiglitz, 1980; Kyle, 1985; Easley and O’Hara, 2004; Chordia et al., 2008; and
Jayaraman and Milbourne, 2012). In particular, Chordia et al. (2008) document that liquidity Granger-
causes stock price informativeness, but find no statistical evidence of reverse causality.

5
Consistent with our predictions, we document a positive association between
firm’s stock liquidity and the lower tail of the conditional tax avoidance distribution,
which is symptomatic of firm’s underinvestment in tax avoidance. We also document
a negative association between a firm’s stock liquidity and the upper tail of the
conditional tax avoidance distribution, which is symptomatic of firm’s
overinvestment in tax avoidance. The effect is economically significant and is robust
across different measures of tax avoidance and stock liquidity. We use stock splits as
a positive shock to stock liquidity and the instrumental variable method to address
potential endogeneity concerns, and obtain consistent results.
Next, we examine possible mechanisms for how stock liquidity may affect tax
avoidance. We find that the effect of stock liquidity on both tails of the tax avoidance
distribution is stronger for firms with high levels of business uncertainty. Further, the
effect of stock liquidity on the lower (upper) tail of tax avoidance distribution is
mitigated (magnified) for the financially constrained firms. These results provide
support for the existence of a positive feedback channel. On the other hand, we find
the effect of stock liquidity to be similar across firms with high versus low
shareholder rights, and across firms with high versus low managerial pay-for-
performance-sensitivities. These findings are inconsistent with either blockholder
intervention or blockholder exit channels.
Our paper contributes to the existing literature in several ways. First, at a broader
level, our paper can be viewed as a contribution to the tax avoidance research. Prior
studies on the determinants of tax avoidance mainly focus on firm fundamentals or

6
executive incentives (e.g., Desai and Dharmapala, 2006; Lisowsky, 2010; Armstrong,
Blouin and Larcker, 2012; and Rego and Wilson, 2012). Little is known, however,
about how stock market conditions, and in particular the liquidity of the firm's stock,
affect firm’s tax planning. To the best of our knowledge, our paper is the first to
document the effect of stock liquidity on tax avoidance, thereby establishing an
important link between corporate tax avoidance and firm’s stock market conditions.
Second, our paper also contributes to the corporate finance literature
documenting beneficial effects of stock liquidity on the value of the firm (e.g., Fang et
al., 2009; and Bharath et al., 2013). Our results suggest that greater stock liquidity
mitigates both overly-aggressive and overly-conservative tax planning, and thus
highlight a potential channel through which greater stock liquidity increases firm
value.
Finally, at a methodological level, our study contributes to the tax avoidance
literature by further emphasizing the importance of examining the whole distribution
of tax avoidance, instead of focusing on the mean effect; an essential point raised by
Armstrong et al. (2013).
The rest of the paper is organized as follows. In Section II we discuss the relevant
literature and develop our hypotheses. Section III describes the data. Section IV
outlines the methodology. In Sections V to VII, we report and discuss our empirical
findings. Concluding remarks are presented in Section VIII.

7
II. RELATED LITERATURE AND HYPOTHESES DEVELOPMENT
Corporate Tax Avoidance and Stock Liquidity
We posit that high liquidity firms engage less in both overly-aggressive and
overly-conservative tax avoidance. Our empirical predictions rest on the premise that
tax avoidance is viewed by managers as one of the many investment decisions
(Hanlon and Heitzman, 2010; Armstrong et al., 2013), and thus is considered as a part
of the overall investment strategy of the firm (McGuire, Omer, and Wilde, 2013).
Accordingly, factors that affect firm’s overall investment strategy should also affect
firm’s tax avoidance as shown by McGuire et al. (2013).
The above discussion suggests several causative mechanisms through which
stock liquidity may influence corporate tax avoidance. First, greater stock liquidity
may affect tax avoidance through the feedback channel from stock prices to firm’s tax
planning. Prior studies show that greater stock liquidity stimulates the entry of
informed traders (Grossman and Stiglitz, 1980; Kyle, 1985; and Easley and O’Hara,
2004). Informed investors factor the effect of their trades on firm’s investment
decisions, trade more aggressively, and consequently make stock prices more
informative to firm’s management (Subrahmanyam and Titman, 2001; Khana and
Sonti, 2004; Foucault and Gehrig, 2008; Fang et al., 2009). Information uncertainty
may cause managers to misestimate firm’s potential tax savings over the course of tax
avoidance investment, thereby resulting in over-or underinvestment in tax avoidance.
Thus, by increasing share price informativeness to managers, greater stock liquidity is

8
predicted to facilitate better informed tax planning decisions, and therefore will
influence firm’s tax avoidance.
In particular, our empirical predictions are most closely related to the studies by
Khana and Sonti (2004), Chen et al. (2007), and Edwards et al. (2013). In Khana and
Sonti’s (2004) model higher share prices signal improved prospects to firm managers
and relax firm’s financial constraint. Informed traders factor this effect of share prices
on firm investment decisions and manipulate share prices to get firm to take certain
investments. Chen et al. (2007) show that the sensitivity of investment to share price
increases in the amount of private information in stock price, suggesting that
managers learn from the private information in stock price about their own firm’s
fundamentals (consistent with Khana and Sonti, 2004). Edwards et al. (2013) show
that financially constrained firms resort to a more aggressive tax planning.
Integrating these three sets of results, we posit that greater stock liquidity will
facilitate more informed trading to relax the level of financial constraints for the firms
whose tax avoidance strategies are considered by investors as overly-aggressive.
Similarly, greater stock liquidity will facilitate more informed trading to tighten
financial constraints for the firms whose investment in tax planning is perceived by
investors as overly-conservative. Accordingly, a positive feedback perspective
predicts that high liquidity firms will engage less in both overly-aggressive and
overly-conservative tax avoidance.
Second, a link between stock liquidity and tax avoidance can also be motivated
based on the corporate governance theories. Separation of ownership and control may

9
lead to corporate tax planning that reflects the private interests of the manager. The
resulting agency problems cause managers to engage in overly-aggressive or overly-
conservative tax avoidance (e.g., Chen and Chu, 2005; Desai and Dharmapala, 2006;
and Kim, Li and Zhang, 2011).
Prior research highlights two mechanisms for the beneficial role of stock liquidity
in corporate governance. One strand of literature in this vein suggests that stock
liquidity enhances blockholders’ incentives to intervene by allowing blockholders to
increase their stakes in the firm at lower cost (Maug, 1998). Another agency-based
causative mechanism suggests that liquidity improves corporate governance by
facilitating the threat of blockholder exit (Edmans 2009; and Edmans and Manso
2011). In these models, strategic dumping of firm shares by blockholders exerts a
downward pressure on share price, and thus penalizes management for actions that are
considered not to be in the best interests of blockholders.
Prior studies provide empirical evidence consistent with greater stock liquidity
improving corporate governance (e.g., Bharath et al., 2013; and Edmans et al., 2013).
More directly related to our hypothesis is the study by Armstrong et al. (2013) who
document that corporate governance increases extremely low levels of tax avoidance,
and decreases extremely high levels of tax avoidance. Thus, a corporate governance
perspective suggests that high stock liquidity will deter firm management from
engaging in both overly-aggressive and overly-conservative tax avoidance by either
enhancing blockholder intervention or amplifying the threat of blockholder exit.
10
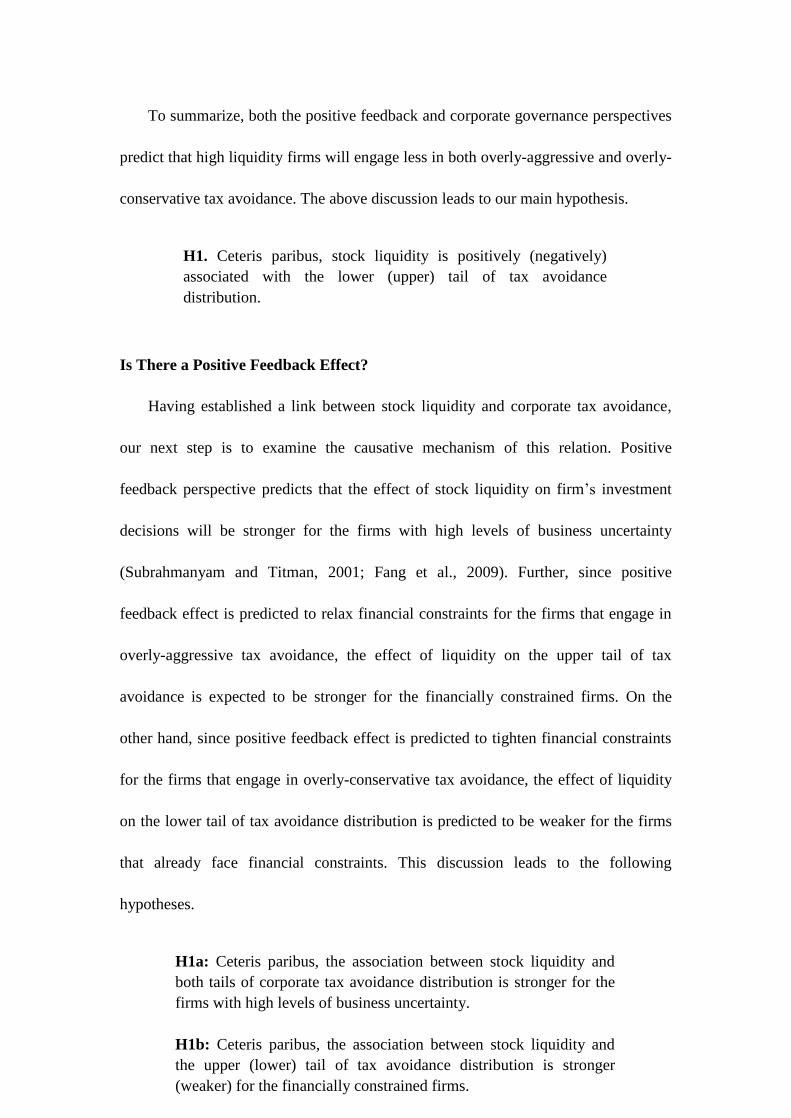
To summarize, both the positive feedback and corporate governance perspectives
predict that high liquidity firms will engage less in both overly-aggressive and overly-
conservative tax avoidance. The above discussion leads to our main hypothesis.
lower (upper) tail of tax avoidance distribution.
Is There a Positive Feedback Effect?
Having established a link between stock liquidity and corporate tax avoidance,
our next step is to examine the causative mechanism of this relation. Positive
feedback perspective predicts that the effect of stock liquidity on firm’s investment
decisions will be stronger for the firms with high levels of business uncertainty
(Subrahmanyam and Titman, 2001; Fang et al., 2009). Further, since positive
feedback effect is predicted to relax financial constraints for the firms that engage in
overly-aggressive tax avoidance, the effect of liquidity on the upper tail of tax
avoidance is expected to be stronger for the financially constrained firms. On the
other hand, since positive feedback effect is predicted to tighten financial constraints
for the firms that engage in overly-conservative tax avoidance, the effect of liquidity
on the lower tail of tax avoidance distribution is predicted to be weaker for the firms
that already face financial constraints. This discussion leads to the following
hypotheses.
H1. Ceteris paribus, stock liquidity is positively (negatively)
associated with the lower (upper) tail of tax avoidance
distribution.
H1a: Ceteris paribus, the association between stock liquidity and
both tails of corporate tax avoidance distribution is stronger for the
firms with high levels of business uncertainty.
H1b: Ceteris paribus, the association between stock liquidity and
the upper (lower) tail of tax avoidance distribution is stronger
(weaker) for the financially constrained firms.

11
Is There Blockholder Intervention Effect?
The effect of blockholder intervention depends on the balance of power between
shareholders and managers. Therefore, if the association between stock liquidity and
tax avoidance occurs through blockholder intervention channel, the effect of liquidity
should be amplified for the firms with high shareholder rights (Fang et al., 2009; and
Bharath et al., 2013). This insight leads to the following hypothesis.
Is There Blockholder Exit Effect?
The disciplining effect of the threat of exit comes through managers' wealth
invested in firm’s stock. Accordingly, the implications of blockholder exit will be
more severe for managers, whose compensation is highly sensitive to changes in share
price (Bharath et al., 2013; and Edmans et al. 2013). Thus, blockholder exit
perspective predicts that the effect of stock liquidity will be magnified for the firms
with high pay-for-performance sensitivity. This discussion leads to the following
hypothesis.
H1c: Ceteris paribus, the association between stock liquidity and
both tails of corporate tax avoidance distribution is stronger for
the firms with high shareholder rights.
H1d: Ceteris paribus, the association between stock liquidity and
both tails of corporate tax avoidance distribution is stronger for the
firms with high managerial pay-for-performance sensitivity.

12
III. SAMPLE SELECTION AND VARIABLES
Sample Selection
Our main measure of stock liquidity is the relative effective spread, calculated
using intra-day data from the Trade and Quote database (TAQ). This measure comes
from Vanderbilt University's Financial Markets Research Centre (hereafter FMRC).3
Because TAQ only provides data since 1993, we restrict our sample period to 1993-
2010. We obtain firm financial information from Compustat fundamental annual files.
Our initial sample consists of all the firms in Compustat over the sample period of
1993-2010. We drop observations without sufficient information for construction of
the tax avoidance and /or stock liquidity measures, and those with negative pre-tax
income. We winsorize all the variables at both the 1st and 99
th percentiles to mitigate
the effect of outliers.
Variables
Tax Avoidance
In our analysis we adopt Hanlon and Heitzman’s (2010) broad definition of tax
avoidance as the reduction of explicit taxes that reflects all transactions that have any
effect on firm’s tax liability. Our primary measure of tax avoidance is GAAP
effective tax rate (GETR) which is computed as follows:
(1)
3 We are grateful to Hans Stoll and Christoph Schenzler from Vanderbilt University for providing the
effective spread data.
it
itit
PI
TXTGETR

13
where i denotes firm, t denotes year, is firm i’s total tax expenses and is firm
i’s pre-tax income. This measure has been extensively adopted by prior research (e.g.,
Dyreng, Hanlon and Maydew, 2010; Armstrong et al., 2012; and Cheng et al., 2012).
In particular, our choice of GETR as the primary measure of tax avoidance is
motivated by the results of Graham at al.’s (2013) survey, who find that management
at public companies places a higher weight on the GAAP effective tax rates compared
to other tax metrics, such as cash taxes paid. Further, Armstrong et al. (2012)
conclude that GETR is a more informative measure of tax director actions, compared
to other tax avoidance metrics. Lower values of GETR indicate more aggressive tax
avoidance.
Stock Liquidity
Our primary measure of stock liquidity (LIQ) is relative effective spread,
computed as the ratio of the difference between the trade price and the midpoint of the
bid-ask quote over the trade price. The relative effective spread is regarded as one of
the best measures of stock liquidity and has been extensively used by prior studies
(e.g., Fang et al., 2009; and Fang, Tian and Tice, 2013). FMRC computes daily
relative effective spread for the stock as the trade-weighted average of the relative
effective spread of all the trades during the day. To obtain the annual relative effective
spread, we take the arithmetic mean of the daily relative effective spreads over the
firm's fiscal year. Since relative effective spread is highly skewed and higher value
indicates lower liquidity, we take the natural logarithm of the ratio to correct for the
14
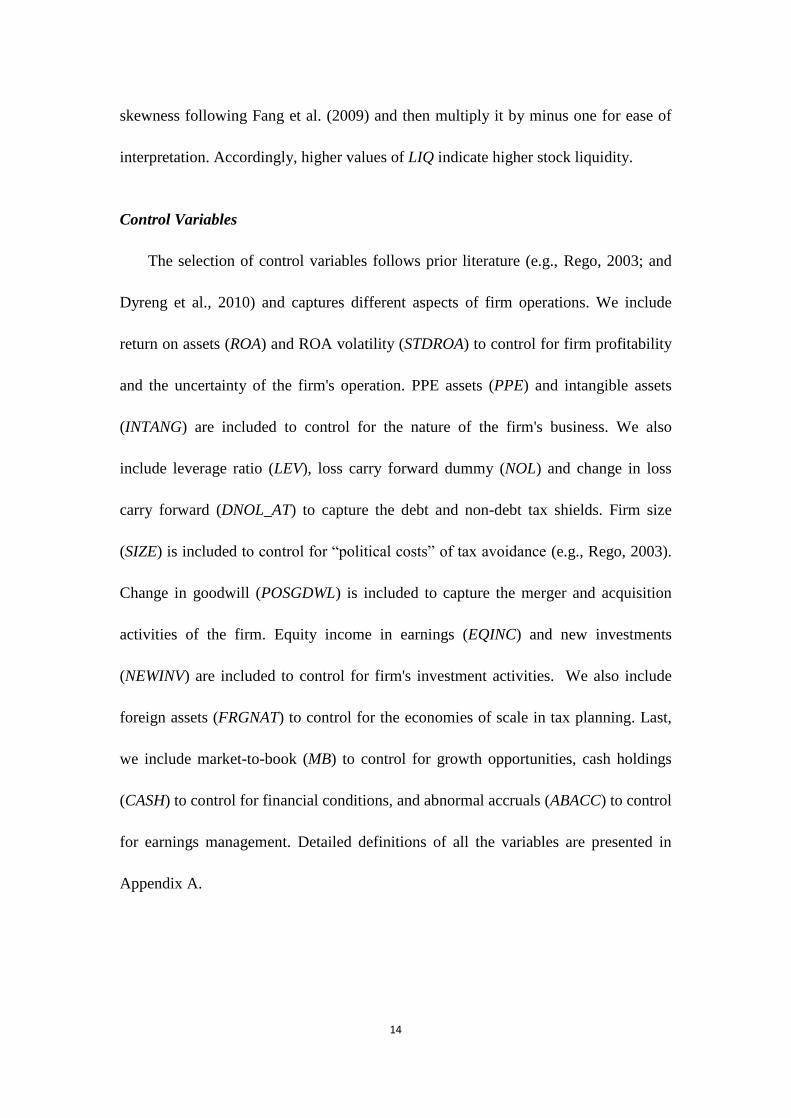
skewness following Fang et al. (2009) and then multiply it by minus one for ease of
interpretation. Accordingly, higher values of LIQ indicate higher stock liquidity.
Control Variables
The selection of control variables follows prior literature (e.g., Rego, 2003; and
Dyreng et al., 2010) and captures different aspects of firm operations. We include
return on assets (ROA) and ROA volatility (STDROA) to control for firm profitability
and the uncertainty of the firm's operation. PPE assets (PPE) and intangible assets
(INTANG) are included to control for the nature of the firm's business. We also
include leverage ratio (LEV), loss carry forward dummy (NOL) and change in loss
carry forward (DNOL_AT) to capture the debt and non-debt tax shields. Firm size
(SIZE) is included to control for “political costs” of tax avoidance (e.g., Rego, 2003).
Change in goodwill (POSGDWL) is included to capture the merger and acquisition
activities of the firm. Equity income in earnings (EQINC) and new investments
(NEWINV) are included to control for firm's investment activities. We also include
foreign assets (FRGNAT) to control for the economies of scale in tax planning. Last,
we include market-to-book (MB) to control for growth opportunities, cash holdings
(CASH) to control for financial conditions, and abnormal accruals (ABACC) to control
for earnings management. Detailed definitions of all the variables are presented in
Appendix A.

15
Descriptive Statistics
Table 1 presents the summary statistics of the data. The mean (median) GAAP
effective tax rate (GETR) of our sample firms is 0.296 (0.348) and the mean (median)
stock liquidity (LIQ) is 5.763 (5.724). These numbers are well in line with those
reported in prior studies (e.g., Fang et al., 2009; and Dyreng et al., 2010). As far as the
control variables are concerned, the mean cash holdings, ROA, and ROA volatility
are 0.186, 0.099, and 0.117, respectively. On average, our sample firms have change
in goodwill of 0.021, new investments of 0.085, leverage ratio of 0.172, foreign assets
of 0.44, equity income in earnings of 0.001, and change in loss carry forward of 0.005.
These firms also have PPE assets of 33.1% and intangible assets of 13.3% of total
assets. 29% of the firms have loss carry forward and 34% of them have foreign
income. Last, the sample firms have mean firm size of 6.182, mean market-to-book of
2.882, and mean abnormal accruals of 0.079.
[Insert Table 1 about here]
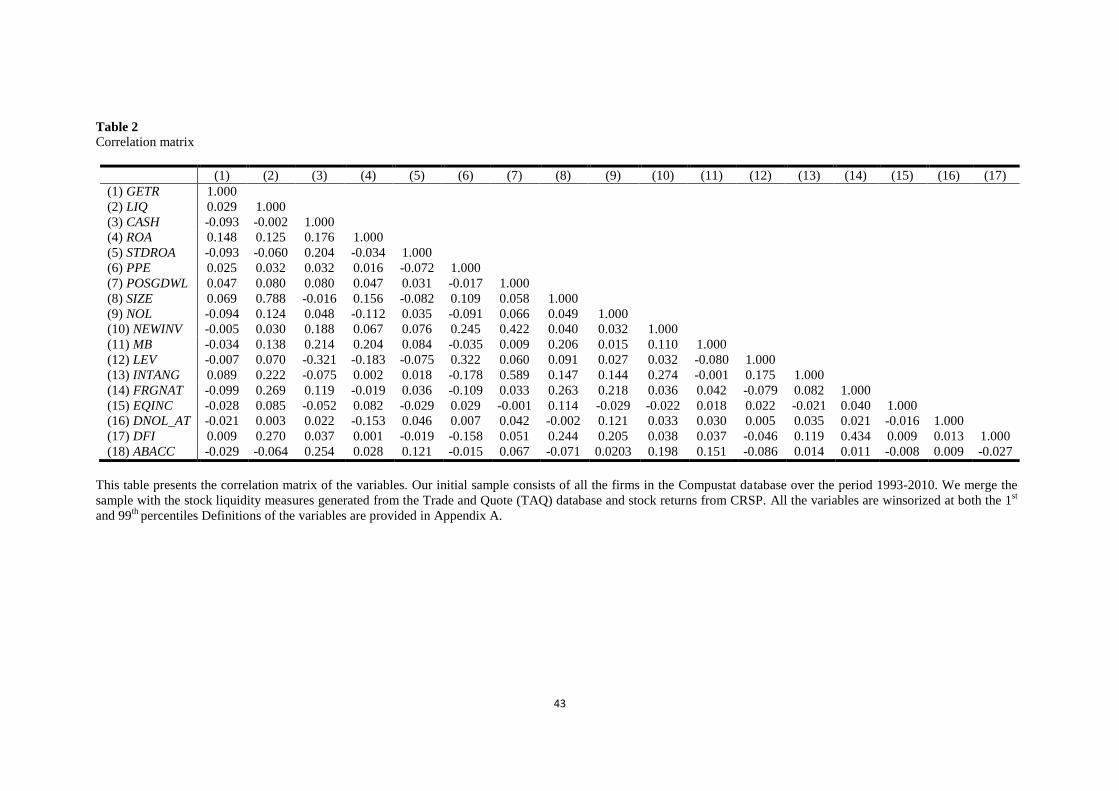
Table 2 presents the correlation matrix of the variables. The table shows that
GETR exhibits weak positive correlation with stock liquidity. GETR is also negatively
correlated with cash holdings, ROA volatility, loss carry forward dummy, new
investments, market-to-book, leverage, foreign assets, equity income in earnings,
change in loss carry forward, and abnormal accruals; while positively correlated with
return on assets, PPE assets, change in goodwill, firm size, intangible assets, and
foreign income dummy.
[Insert Table 2 about here]
16
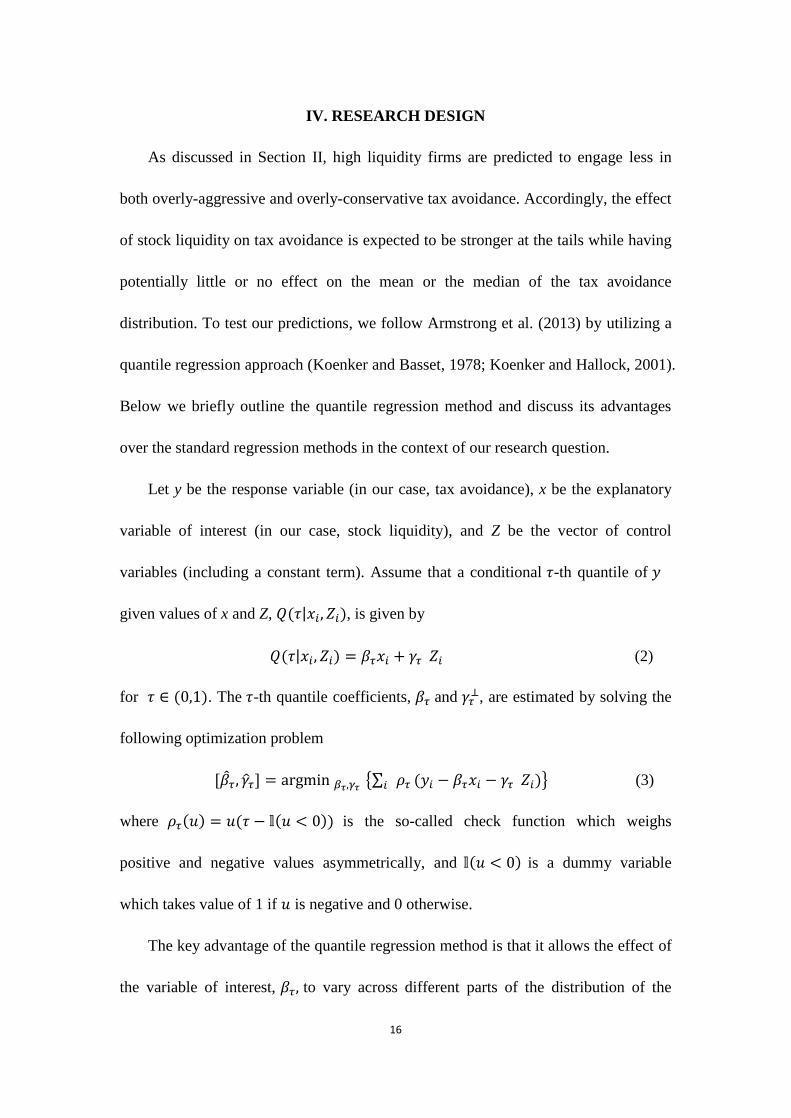
IV. RESEARCH DESIGN
As discussed in Section II, high liquidity firms are predicted to engage less in
both overly-aggressive and overly-conservative tax avoidance. Accordingly, the effect
of stock liquidity on tax avoidance is expected to be stronger at the tails while having
potentially little or no effect on the mean or the median of the tax avoidance
distribution. To test our predictions, we follow Armstrong et al. (2013) by utilizing a
quantile regression approach (Koenker and Basset, 1978; Koenker and Hallock, 2001).
Below we briefly outline the quantile regression method and discuss its advantages
over the standard regression methods in the context of our research question.
Let y be the response variable (in our case, tax avoidance), x be the explanatory
variable of interest (in our case, stock liquidity), and Z be the vector of control
variables (including a constant term). Assume that a conditional -th quantile of
given values of x and Z, | , is given by
| (2)
for . The -th quantile coefficients, and , are estimated by solving the
following optimization problem
{∑ } (3)
where is the so-called check function which weighs
positive and negative values asymmetrically, and is a dummy variable
which takes value of 1 if is negative and 0 otherwise.
The key advantage of the quantile regression method is that it allows the effect of
the variable of interest, to vary across different parts of the distribution of the

17
response variable, y. This feature is particularly important in the context of our study,
where greater stock liquidity is predicted to have a positive (negative) effect on the
lower (upper) tails of the tax avoidance distribution. This effect cannot be captured by
the standard ordinary least squares (OLS) regression method, which focuses solely on
the effect of the variable of interest on the mean of distribution of the response
variable. In contrast to the standard regression methods, quantile regression is
designed to characterize changes in both the location and shape of the distribution of
interest (Armstrong et al., 2013), and thus provides an appealing analytical framework
for our analysis. 4
V. STOCK LIQUIDITY AND CORPORATE TAX AVOIDANCE
Univariate Evidence
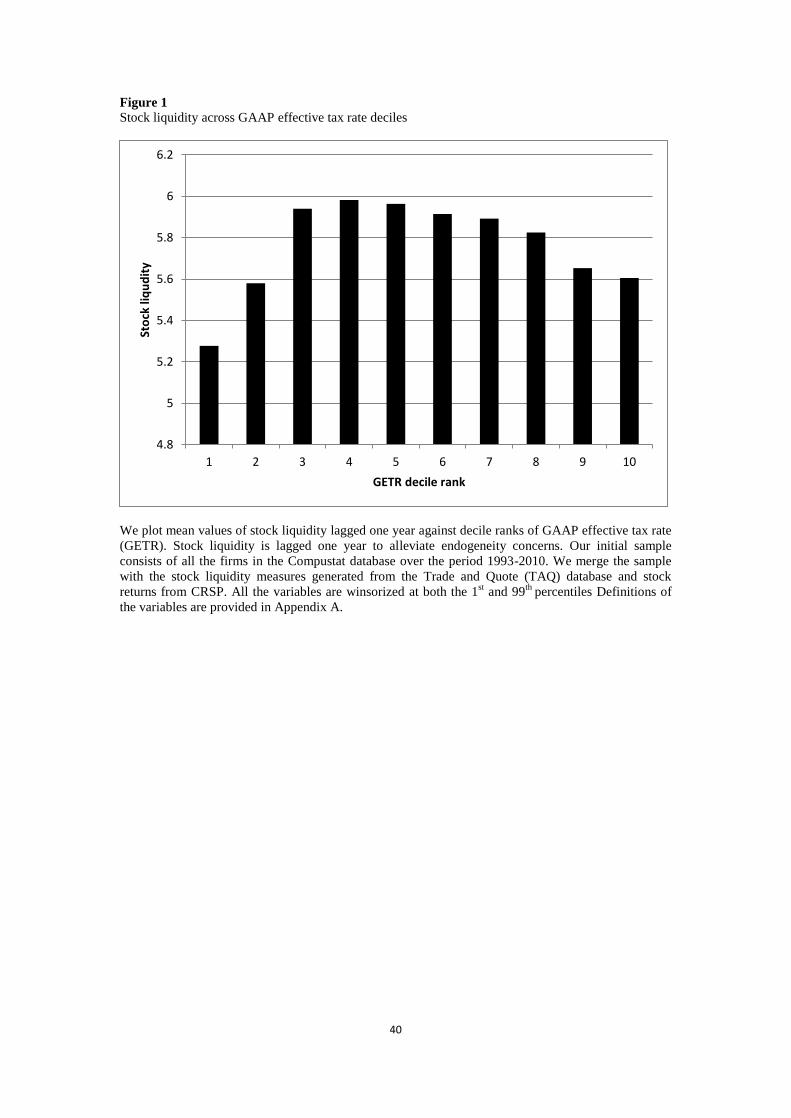
Figure 1 presents the univariate relation between stock liquidity and tax avoidance.
The x-axis plots decile ranks of GETR and y-axis plots mean values of stock liquidity
lagged one year that correspond to these deciles. The relation between the two
variables exhibits a distinct inverted U-shape, with firms in the centre (tails) of the
GETR distribution having higher (lower) stock liquidity. Specifically, the average
relative effective spreads for the firms in the highest and lowest deciles of GETR are
60 and 40 basis points, respectively. In contrast, the relative effective spread for the
firms in the 5-th decile of GETR is only 25 basis points. The difference is also
4
This important point is emphasized by Mosteller and Tukey (1977, p.266), who note that
“....regression often gives a rather incomplete picture. Just as the mean gives an incomplete picture of a
single distribution, so the regression curve gives a corresponding incomplete picture for a set of
distributions”
18
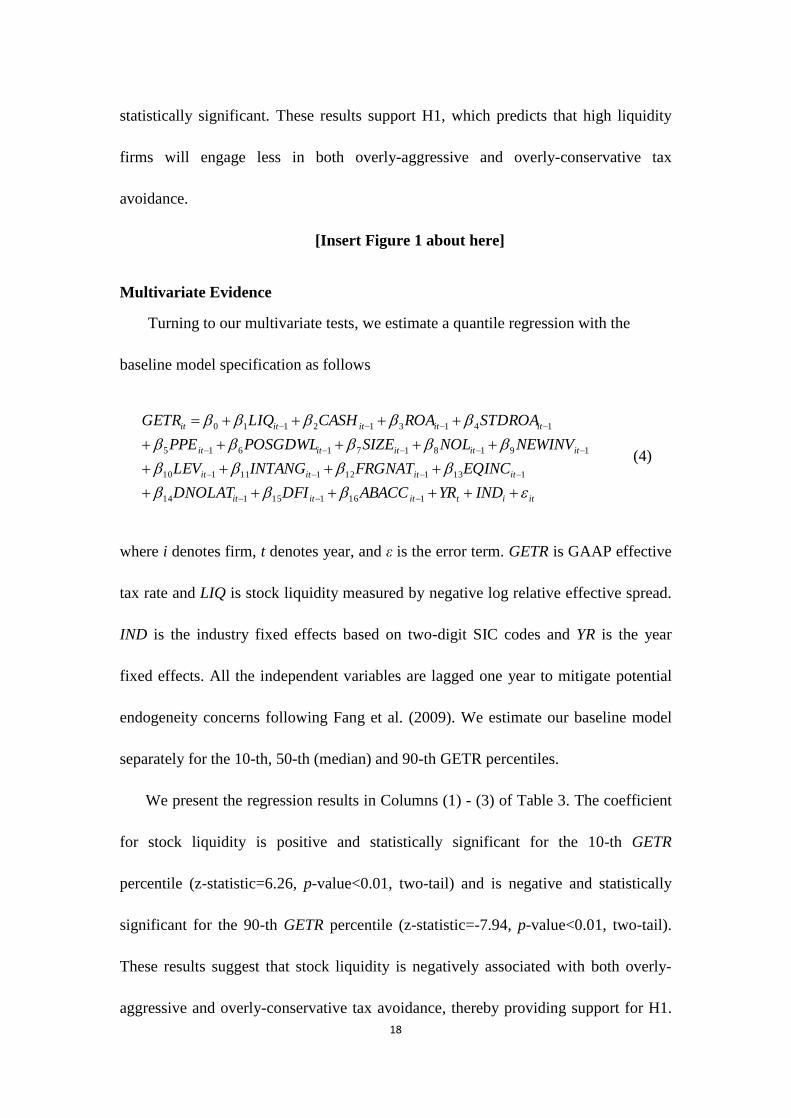
statistically significant. These results support H1, which predicts that high liquidity
firms will engage less in both overly-aggressive and overly-conservative tax
avoidance.
[Insert Figure 1 about here]
Multivariate Evidence
Turning to our multivariate tests, we estimate a quantile regression with the
baseline model specification as follows
ititititit
itititit
ititititit
ititititit
INDYRABACCDFIDNOLAT
EQINCFRGNATINTANGLEV
NEWINVNOLSIZEPOSGDWLPPE
STDROAROACASHLIQGETR
116115114
113112111110
1918171615
141312110
(4)
where i denotes firm, t denotes year, and ε is the error term. GETR is GAAP effective
tax rate and LIQ is stock liquidity measured by negative log relative effective spread.
IND is the industry fixed effects based on two-digit SIC codes and YR is the year
fixed effects. All the independent variables are lagged one year to mitigate potential
endogeneity concerns following Fang et al. (2009). We estimate our baseline model
separately for the 10-th, 50-th (median) and 90-th GETR percentiles.
We present the regression results in Columns (1) - (3) of Table 3. The coefficient
for stock liquidity is positive and statistically significant for the 10-th GETR
percentile (z-statistic=6.26, p-value<0.01, two-tail) and is negative and statistically
significant for the 90-th GETR percentile (z-statistic=-7.94, p-value<0.01, two-tail).
These results suggest that stock liquidity is negatively associated with both overly-
aggressive and overly-conservative tax avoidance, thereby providing support for H1.

19
The coefficient for stock liquidity for the median GETR is positive and statistically
significant (z-statistic=3.98, p-value<0.01, two tail)5.
To facilitate economic interpretation of our results, we rank stock liquidity for
each year, and then partition the resulting ranks into deciles labelled from 1 (lowest
decile) to 10 (highest decile). Next, we estimate our baseline quantile regressions with
the decile ranking of stock liquidity and present the results in Columns (4) - (6) of
Table 3. The results further confirm the positive (negative) relation between the 10-th
(90-th) percentile of GETR and stock liquidity. Further, the coefficient for stock
liquidity in Column (4) suggests that moving from the lower to the upper decile of
stock liquidity increases 10-th percentile of GETR by 0.011*(10-1) = 0.099, or 9.9%
of pre-tax income. The coefficient for stock liquidity reported in Column (6) suggests
that moving from the lower to the upper decile of stock liquidity decreases 90-th
percentile of GETR by 0.004*(10-1) = 0.036, or 3.6% of pre-tax income. Therefore,
we conclude that the effect of stock liquidity on the tails of tax avoidance distribution
is not only statistically significant but is also economically meaningful. For
comparison, stock liquidity has a relatively moderate effect on the median GETR,
where moving from the lower to the upper decile of stock liquidity increases median
GETR by only 0.001*(10-1) =0.009 or 0.9% of pre-tax income.
[Insert Table 3 about here]
To further examine the relation between stock liquidity and tax avoidance, we re-
estimate our baseline model for the 10-th, 15-th, 20-th…, and 90-th percentiles of
5 For robustness purposes, we repeat our analyses with financial firms (SIC codes 6000-6799) excluded
from our sample. The results (untabulated) remain qualitatively similar to those reported in our paper.

20
GETR. Next, we plot in Figure 2 the estimated coefficients for stock liquidity along
with the 95% confidence intervals against the corresponding percentiles of GETR.
Figure 2 reveals several interesting findings. Stock liquidity associates positively with
GETR (i.e., associates negatively with tax avoidance) when moving from the centre to
the upper end of the tax avoidance distribution (i.e., lower percentiles of GETR) On
the other hand, stock liquidity associates negatively with GETR (i.e., associates
positively with tax avoidance) when moving from the centre to the lower end of the
tax avoidance distribution (i.e., upper percentiles of GETR). Furthermore, the
magnitude of the effect monotonously increases when moving from the centre of
distribution to the extreme percentiles of GETR. Overall, these results provide further
support for H1, suggesting that high liquidity firms engage less in both overly-
aggressive and overly-conservative tax avoidance.
[Insert Figure 2 about here]
As far as the control variables are concerned, since prior studies use least squares
regression method in their research design the results for the control variables are not
directly comparable to those reported in prior literature. Nonetheless, examination of
the coefficients for control variables reveals several interesting items. First, the effects
of control variables on the median GETR are largely in line with those reported in
prior studies (e.g., Rego, 2003; and Chen et al., 2010). Specifically, median GETR is
positively related to intangible assets (INTANG) and the return on assets (ROA), and
is negatively associated with equity in earnings (EQINC), proportion of foreign assets
(FRGNAT), loss carried forward (NOL), and firm size (SIZE). Second, while for some
21
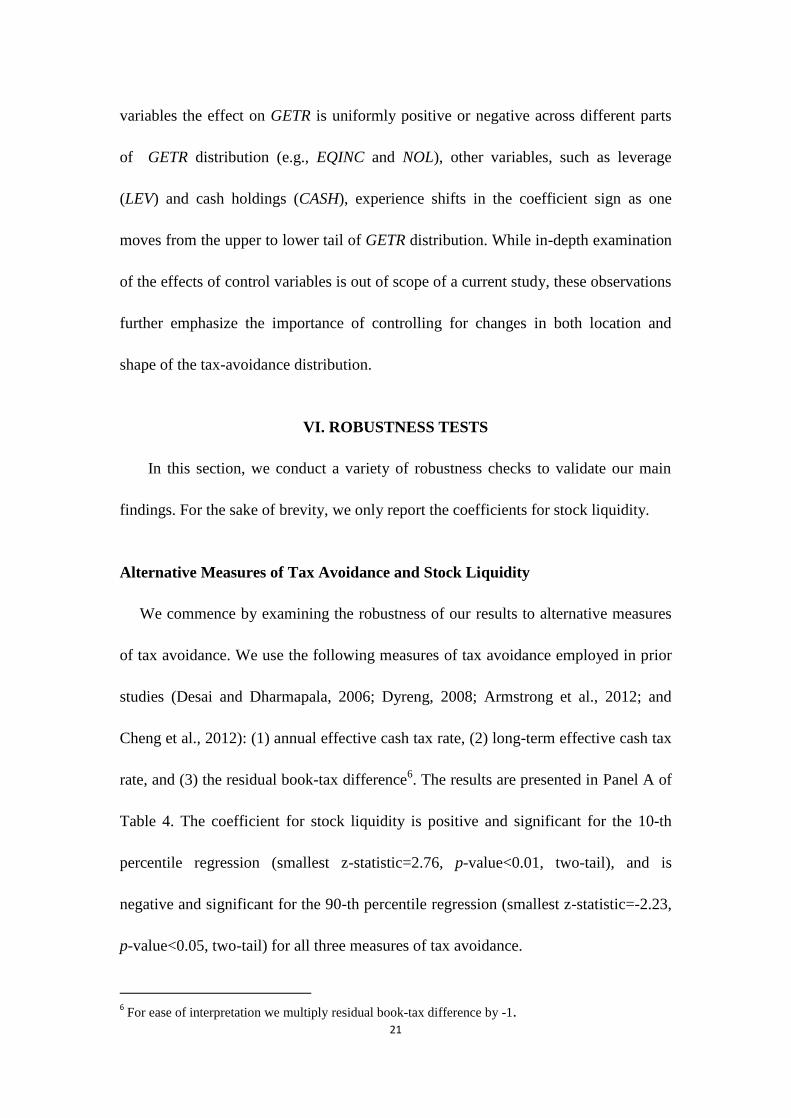
variables the effect on GETR is uniformly positive or negative across different parts
of GETR distribution (e.g., EQINC and NOL), other variables, such as leverage
(LEV) and cash holdings (CASH), experience shifts in the coefficient sign as one
moves from the upper to lower tail of GETR distribution. While in-depth examination
of the effects of control variables is out of scope of a current study, these observations
further emphasize the importance of controlling for changes in both location and
shape of the tax-avoidance distribution.
VI. ROBUSTNESS TESTS
In this section, we conduct a variety of robustness checks to validate our main
findings. For the sake of brevity, we only report the coefficients for stock liquidity.
Alternative Measures of Tax Avoidance and Stock Liquidity
We commence by examining the robustness of our results to alternative measures
of tax avoidance. We use the following measures of tax avoidance employed in prior
studies (Desai and Dharmapala, 2006; Dyreng, 2008; Armstrong et al., 2012; and
Cheng et al., 2012): (1) annual effective cash tax rate, (2) long-term effective cash tax
rate, and (3) the residual book-tax difference6. The results are presented in Panel A of
Table 4. The coefficient for stock liquidity is positive and significant for the 10-th
percentile regression (smallest z-statistic=2.76, p-value<0.01, two-tail), and is
negative and significant for the 90-th percentile regression (smallest z-statistic=-2.23,
p-value<0.05, two-tail) for all three measures of tax avoidance.
6 For ease of interpretation we multiply residual book-tax difference by -1.
22
Next, we examine the sensitivity of our results to using alternative measures of
stock liquidity. We use the following stock liquidity measures: (1) the Amihud (2002)
measure, modified by Gopalan and Pevzner (2012), (2) implicit bid-ask spread
measure of Hasbrouck (2009), and (3) the percentage of zero returns measure of
Lesmond (2005). We take natural log of both Amihud (2002) and the Hasbrouck
(2009) measures, as these two measures are heavily skewed and multiply by the
minus one for ease of interpretation. Similarly, we use Lesmond (2005) measure as
one minus percentage of zero returns. Following Jayaraman and Milbourn (2012) we
combine these three measures into a composite measure using principal components.
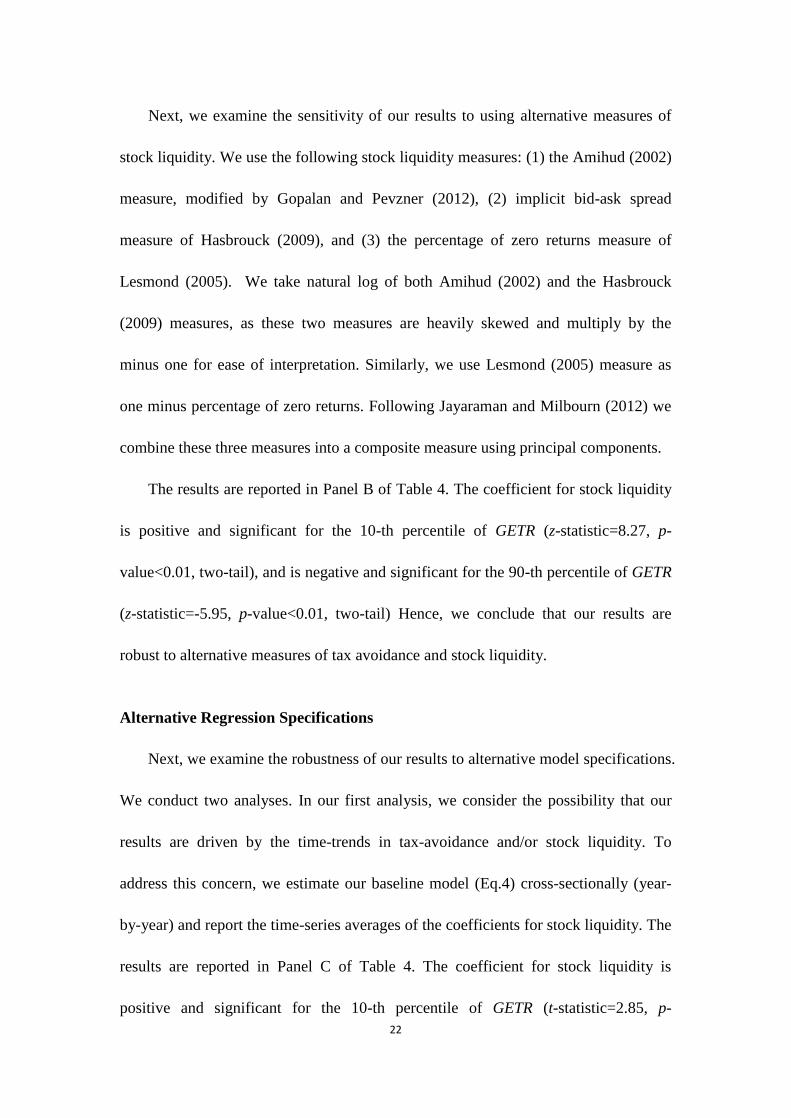
The results are reported in Panel B of Table 4. The coefficient for stock liquidity
is positive and significant for the 10-th percentile of GETR (z-statistic=8.27, p-
value<0.01, two-tail), and is negative and significant for the 90-th percentile of GETR
(z-statistic=-5.95, p-value<0.01, two-tail) Hence, we conclude that our results are
robust to alternative measures of tax avoidance and stock liquidity.
Alternative Regression Specifications
Next, we examine the robustness of our results to alternative model specifications.
We conduct two analyses. In our first analysis, we consider the possibility that our
results are driven by the time-trends in tax-avoidance and/or stock liquidity. To
address this concern, we estimate our baseline model (Eq.4) cross-sectionally (year-
by-year) and report the time-series averages of the coefficients for stock liquidity. The
results are reported in Panel C of Table 4. The coefficient for stock liquidity is
positive and significant for the 10-th percentile of GETR (t-statistic=2.85, p-

23
value=0.01, two-tail), and is negative and significant for the 90-th percentile of GETR
(t-statistic=-2.39, p-value=0.03, two-tail). Hence, we conclude that our findings are
not likely to be driven by the time-trends in variables.
In our second analysis, we augment our baseline model with additional control
variables which were shown by prior literature to be correlated with stock liquidity
and which may also affect firm’s tax avoidance. Specifically, in addition to the
control variables specified in Section III we also include the following variables: (1)
institutional ownership, (2) analyst coverage, (3) board independence (proportion of
independent directors on the board), (4) CEO delta (sensitivity of CEO compensation
to changes in stock price), (5) CEO vega (sensitivity of CEO compensation to
changes in stock volatility), (6) implied firm’s cost of equity, and (7) probability of
informed trading (PIN). The results are reported in Panel C of Table 4. The
coefficient for stock liquidity remains positive and significant for the 10-th percentile
of GETR (z-statistic=4.14, p-value<0.01, two-tail), and negative and significant for
the 90-th percentile of GETR (z-statistic=-2.91, p-value<0.01, two-tail). Overall,
based on the results of these two analyses we conclude that our findings are robust to
alternative regression specifications.
[Insert Table 4 about here]
24
Endogeneity
Stock Splits as a Shock to Stock Liquidity
Given the cross-sectional design of our analysis, our results may suffer from
endogeneity concerns. To address this issue, we conduct two analyses. First, we use
stock splits as a shock to stock liquidity and study its effect on tax avoidance. Prior
studies show that stock splits are associated with increases in stock liquidity (Lin et al.,
2009; Jayaraman and Milbourn, 2012). Furthermore, Chemmanur, Hu, and Huang
(2013) document that stock splits bring in more institutional trading and a consequent
reduction in information asymmetry (consistent with more informative share prices).
Since stock splits are not clustered in calendar time and have no effect on the
underlying firm fundamentals (e.g., Easley et al., 2001), they provide an appealing
framework to examine the causal effect of stock liquidity on corporate tax avoidance.
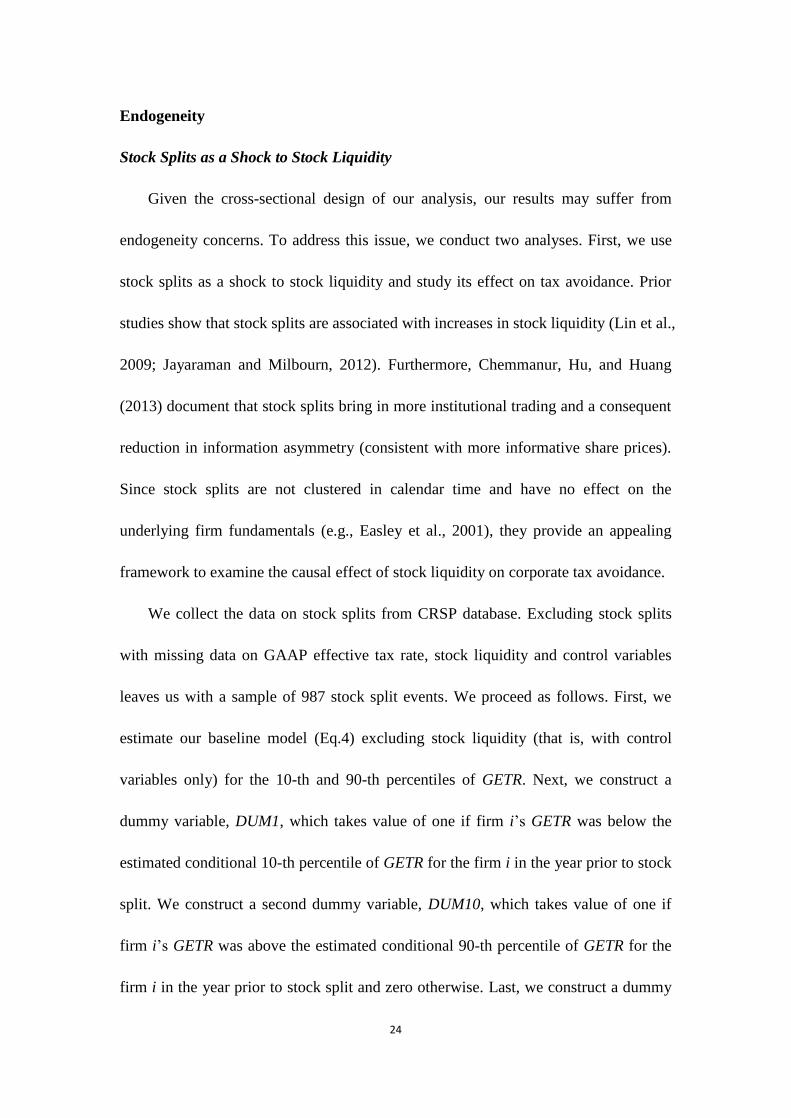
We collect the data on stock splits from CRSP database. Excluding stock splits
with missing data on GAAP effective tax rate, stock liquidity and control variables
leaves us with a sample of 987 stock split events. We proceed as follows. First, we
estimate our baseline model (Eq.4) excluding stock liquidity (that is, with control
variables only) for the 10-th and 90-th percentiles of GETR. Next, we construct a
dummy variable, DUM1, which takes value of one if firm i’s GETR was below the
estimated conditional 10-th percentile of GETR for the firm i in the year prior to stock
split. We construct a second dummy variable, DUM10, which takes value of one if
firm i’s GETR was above the estimated conditional 90-th percentile of GETR for the
firm i in the year prior to stock split and zero otherwise. Last, we construct a dummy

25
variable, DUM_MID, which equals to one minus the sum of DUM1 and DUM10. Our
prediction is that changes in liquidity around stock splits will be positively (negatively)
associated with changes in GETR for the firms that engaged in overly-aggressive
(overly-conservative) tax avoidance prior to stock split, that is, the firms with
DUM1=1 (DUM10=1).
To test our prediction, we perform regression analysis on the changes in the
effective tax rate against changes in stock liquidity around the stock splits. The
dependent variable is the change in GETR over the two years around the stock split
event and the independent variables are the change in stock liquidity, interacted with
DUM1, DUM10 and DUM_MID dummy variables, and the changes in the control
variables7.
The results are presented in Table 5. Consistent with our prediction, the
coefficient for the interaction term of stock liquidity with DUM1 dummy is positive
and significant (t-statistic=2.29, p-value<0.05, two-tail), and the coefficient for the
interaction term of stock liquidity with DUM10 dummy is negative and significant (t-
statistic=-1.84, p-value=0.066, two-tail). These results are consistent with greater
stock liquidity resulting in less overly-aggressive and overly-conservative tax
avoidance.
[Insert Table 5 about here]
7 The advantage of using firm-specific changes regression is that it provides time-series evidence of the
link between the effective tax rate and stock liquidity as well as alleviates concerns about firm-specific
omitted correlated variables (Jayaraman and Milbourn, 2012).
26
Instrumental Variable Quantile Regression
In our second analysis, we employ the instrumental variable quantile regression
method of Chernozhukov and Hansen (2007). Following Fang et al. (2009) and
Jayaraman and Milbourn (2012) we use stock liquidity lagged two years and mean
stock liquidity for the industry as the instruments. The use of stock liquidity lagged
two years further helps mitigate concerns that our results are driven by the omitted
variable correlated with both effective tax rate and stock liquidity in fiscal year t. As
for the industry liquidity, the portion of firm i’s liquidity that is correlated with the
liquidity of its industry is less likely to be correlated with potential firm-specific
omitted variables (Jayaraman and Milbourne, 2012).
The results are reported in Table 6. The coefficient for stock liquidity for the 10-
th percentile of GETR remains positive and significant (z-statistic=6.26, p-
value<0.01, two-tail). The coefficient for stock liquidity for the 90-th percentile of
GETR remains negative and significant (z-statistic=-5.45, p-value<0.01, two-tail).
Overall, based on the results of these two analyses we conclude that our findings are
robust to potential endogenous effects.
[Insert Table 6 about here]
VII. HOW DOES STOCK LIQUIDITY AFFECT TAX AVOIDANCE?
Is There a Positive Feedback Effect?
To test for the positive feedback channel, we examine the effects of business
uncertainty and financial constraints on the association between stock liquidity and
tax avoidance. Specifically, H1a and H1b predict that (1) the effect of stock liquidity

27
on both tails of tax avoidance distribution is stronger for the firms with high levels of
business uncertainty, and (2) the effect of stock liquidity on the upper (lower) tail of
tax avoidance distribution is magnified (mitigated) for the financially constrained
firms.
First, consider the effect of business uncertainty. Following prior studies (e.g.,
Lang and Lundholm, 1996; Diether, Maloy and Scherbina, 2002; and Zhang, 2006)
we employ the dispersion in analyst earnings forecasts (DISP) as a proxy for business
uncertainty. The results are reported in Columns (1) - (3) of Table 7. The coefficient
for the interaction term of stock liquidity with the analyst forecast dispersion is
positive and significant for the 10-th percentile of GETR (z-statistic=2.45, p-
value<0.05, two-tail), and is negative and significant for the 90-the percentile of
GETR (z-statistic=2.96, p-value=0.01, two-tail). Since stock liquidity is positively
(negatively) associated with the 10-th (90-th) percentile of GETR, these results
suggest that the effect of liquidity on both tails of tax avoidance distribution is
stronger for the firms with high levels of business uncertainty, thereby supporting H1a.
Next, consider the effect of financial constraints. We use the Whited-Wu index
(WW) proposed by Whited and Wu (2006) as the proxy for firm financial constraints.
Higher values of the Whited-Wu index indicate firms that are more financially
constrained. The results are reported in Columns (4) - (6) of Table 7. The coefficient
for the interaction term of stock liquidity with the Whited-Wu index is positive and
significant for both 10-th and 90-th percentiles of GETR (smallest z-statistic=4.35, p-
28
value<0.01, two-tail).8 Since stock liquidity is positively (negatively) associated with
the 10-th (90-th) percentile of GETR, these findings imply that the effect of stock
liquidity on the upper (lower) tail of the tax avoidance distribution is magnified
(mitigated) for the financially constrained firms, and thus provide support for
hypothesis H1b9. Overall, we conclude that our findings are consistent with the
positive feedback channel.
[Insert Table 7 about here]
Is There Blockholder Intervention Effect?
To test for the blockholder intervention channel, we examine the effect of
shareholder rights on the association between stock liquidity and tax avoidance.
Specifically, H1c predicts that the effect of stock liquidity on both tails of the tax
avoidance distribution is stronger for the firms with high shareholder rights.
We consider two measures of shareholder rights. Our first measure is the
governance index (GINDEX) of Gompers, Ishii, and Metrick (2003). Following
Gompers et al. (2003) we classify firms with GINDEX<=5 (GINDEX>=14) as the
firms with high (low) shareholder rights. Our second measure is CEO power
(CEO_POWER) which is the principal component of three board governance
measures suggested by prior literature (Jensen, 1993; Mehran, 1995; and Core,
8 For robustness purposes we also try a principal component of the three financial constraints measures
suggested by prior literature: Kaplan-Zingales index (Kaplan and Zingales, 1997), Whited-Wu index
(Whited and Wu, 2006), and Hadlock-Pierce index (Hadlock and Pierce, 2010). The results are
qualitatively similar to those reported for the Whited-Wu index measure. 9 The coefficient for the Whited-Wu index is negative and significant for all three regression models
(smallest z-statistic=-5.00, p-value<0.01, two-tail). These results suggest that financially constrained
firms, on average, engage more in tax avoidance, consistent with Edwards et al’s. (2013) results.

29
Holthausen and Larcker, 1999). These measures include board size, CEO-Chairman
duality, and board independence. Higher values of CEO_POWER indicate lower
shareholder ability to influence CEO decision making. The data used to construct
these measures were obtained from RiskMetrics.10
First, consider the results using GINDEX as a proxy for shareholder rights. The
results are reported in Columns (1) - (3) of Table 8. For the 10-th percentile of GETR
the coefficient for the interaction term of stock liquidity with the LOW_GINDEX
dummy (GINDEX<=5) is negative and significant (z-statistic=-1.94, p-value=0.053,
two-tail). The coefficient for the interaction term of stock liquidity with the
HIGH_GINDEX dummy (GINDEX>=14) is not significant (z-statistic=-0.34, p-
value=0.73, two-tail). The difference between the two coefficients is not significant
(z-statistic=-1.03, p-value=0.30, two-tail). For the 90-th percentile of GETR the
coefficient for the interaction term of stock liquidity with the LOW_GINDEX dummy
is negative and marginally significant (z-statistic=-1.74, p-value=0.08, two-tail). The
coefficient for the interaction term of stock liquidity with the HIGH_GINDEX dummy
is not significant (z-statistic=0.29, p-value=0.76, two-tail), and so is the difference
between the two coefficients (z-statistic=-1.36, p-value=0.18, two-tail).
Next, consider the results for the CEO_POWER measure. The results are reported
in Columns (4) - (6) of Table 8. The coefficient for the interaction term of stock
liquidity with CEO_POWER is not significant for both 10-th and 90-th percentiles of
GETR (largest z-statistic=-1.60, p-value=0.11, two-tail). Overall, since the
10
The RiskMetrics database covers S&P 1500 firms and contains information of the governance index
since 1990 and the board of directors since 1996.

30
blockholder intervention channel predicts the effect of liquidity to be stronger for the
firms with high shareholder rights, the results reported in Table 8 do not support H1c.
[Insert Table 8 about here]
Is There Blockholder Exit Effect?
To test for blockholder exit channel, we examine the effect of pay-for-
performance sensitivity on the association between stock liquidity and tax avoidance.
Specifically, H1d predicts that the effect of stock liquidity on both tails of tax
avoidance distribution is stronger for the firms with high pay-for-performance
sensitivity.
We employ two measures of pay-for-performance sensitivity. The first measure,
outlined in Core and Guay (2002) (PPS_CG), is computed as the natural logarithm of
the dollar value change in managers' stock and option holdings with respect to 1%
change in the firm's stock price. We obtain the data used to construct this measure
from the ExecuComp database.11
The second measure, outlined in Edmans, Gabaix
and Landier (2009) (PPS_EGL), is defined as the dollar change in the CEO wealth for
a one hundred-percentage point change in firm value divided by annual flow
compensation. We obtain the data from Alex Edmans’ website.12
The results are reported in Table 9. Columns (1) to (3) report the results for
PPS_CG. The coefficient for the interaction term of stock liquidity with the pay-for
11
The ExecuComp database covers the stock and option compensation information of the management
of S&P 1500 firms since 1992. 12
http://finance.wharton.upenn.edu/~aedmans/data.html

31
performance sensitivity is negative and significant (z-statistic=-2.14, p-value<0.05,
two-tail) for the 10-th percentile of GETR, and is not significant for the 90-th
percentile of GETR (z-statistic=1.14, p-value=0.25, two-tail).13
Columns (4) to (6)
report the results for the same sample when using scaled pay-for-performance
sensitivity, PPS_EGL. The coefficient for the interaction term of stock liquidity with
scaled pay-for-performance sensitivity is not significant for both the 10-th and 90-th
percentiles of GETR (largest z-statistic=-0.58, p-value=0.59, two-tail). These results
do not support H1d which predicts that the effect of stock liquidity on tax avoidance
is stronger for the firms with high pay-for-performance sensitivity, and thus are
inconsistent with the threat of exit channel.
[Insert Table 9 about here]
VIII. SUMMARY AND CONCLUSIONS
In this study, we investigate the effect of stock liquidity on corporate tax
avoidance. Greater stock liquidity makes share prices more informative to managers,
and thus allows managers to make better informed tax planning decisions. Greater
stock liquidity may also affect tax avoidance through the corporate governance
channel by enhancing blockholders’ voice or amplifying the threat of blockholder exit.
We document a positive (negative) effect of stock liquidity on the lower (upper)
tails of the (conditional) tax avoidance distribution, suggesting that high liquidity
13
Given that PPS_CG is significantly correlated with firm size (Edmans et al., 2009), it is possible that
the negative coefficient for the interaction term of PPS_CG with stock liquidity for the 10-th percentile
of GETR captures the effect of firm size. In our sample the Pearson correlation coefficient between
PPS_CG and firm size is 0.58 while that between PPS_EGL and firm size is only 0.05.

32
firms engage less in both overly-aggressive and overly-conservative tax avoidance.
The effect of stock liquidity on both tails of tax avoidance distribution is stronger for
firms with high level of business uncertainty. Also, the effect of stock liquidity on the
lower (upper) tail of tax avoidance distribution is mitigated (magnified) for the
financially constrained firms. Our findings are consistent with the positive feedback
channel where, by making share prices more informative to managers, greater stock
liquidity improves firm’s tax planning decisions.
Corporate tax avoidance raises substantial interests among both academics and
regulators in recent years. There is also a growing consensus that firm’s stock
liquidity plays a substantial role in corporate governance and firm’s investment
decisions. Nevertheless, the relation between stock liquidity and tax avoidance insofar
remained an uncharted territory. Our paper makes a significant contribution to the
literature by being the first to document an effect of stock liquidity on corporate tax
avoidance, thereby carrying potential implications for further academic research and
stock market legislations.
33
References
Armstrong, C., Blouin, J., and D. Larcker. 2012. The Incentives for Tax Planning.
Journal of Accounting and Economics 53: 391 – 411
Armstrong, C., Blouin, J., Jagonlizer, A., and D. Larcker. 2013. Corporate
Governance, Incentives, and Tax Avoidance. Rock Center for Corporate
Governance working paper series.
Bebchuk, L., Cohen, A., and A. Ferrell. 2009. What Matters in Corporate
Governance? Review of Financial Studies 22: 783:827.
Bharath, T., S. Jayaraman, and V. Nagar. 2013. Exit as Governance: An Empirical
Analysis. Journal of Finance, forthcoming.
Chemmanur, T., Hu, G., and J. Huang. 2013. Institutional Investors and the
Information Production Theory of Stock Splits. Journal of Financial and
Quantitative Analysis, forthcoming
Chen, K.-P., Chu, C., 2005. Internal Control vs. External Manipulation: A Model of
Corporate Income Tax Evasion. RAND Journal of Economics 36, 151–164.
Chen, Q., Goldstein, I., and W. Jiang. 2007. Price Informativeness and Investment
Sensitivity to Stock Price. The Review of Financial Studies 20: 619-650
Chen, S., Chen, X., Cheng, Q., and T. Shevlin, 2010. Are Family Firms More Tax
Aggressive than Non-Family Firms? Journal of Financial Economics 95: 41-61.
Cheng, C.S.A., Huang, H., Li. Y., and J. Stanfield. 2012. The Effect of Hedge Fund
Activism on Corporate Tax Avoidance. The Accounting Review 87: 1493-1526.
Chernozhukov, V., and C. Hansen. 2007. Instrumental Variable Quantile Regression:
A Robust Inference Approach. Journal of Econometrics 142: 379:398.
Chordia, T., Roll, R., and A. Subrahmanyam. 2008. Liquidity and Market Efficiency.
Journal of Financial Economics 87: 249-268.
Core, J. E., Holthausen, R.W., and D. F. Larcker. 1999. Corporate Governance, Chief
Executive Officer Compensation, and Firm Performance, Journal of Financial
Economics 51, 371-406.

34
Core, J. E, and W. Guay. 2002. Estimating the Value of Employee Stock Option
Portfolios and Their Sensitivities to Price and Volatility. Journal of Accounting
Research 40: 613-630.
Desai, M., Dharmapala, D., 2006. Corporate Tax Avoidance and High-Powered
Incentives. Journal of Financial Economics 79, 145–179.
Diether, K. B., Malloy, C.J., and A. Scherbina. 2002. Difference of Opinion and the
Cross Section of Stock Returns. The Journal of Finance 57: 2113–2141.
Dyreng, S. D., Hanlon, M., Maydew, E., 2008. Long-run Corporate Tax Avoidance.
The Accounting Review 83, 61–82.
Dyreng, S., Hanlon, M., and E. L. Maydew. 2010. The Effect of Executives on
Corporate Tax Avoidance. The Accounting Review 85:1163-1189.
Easley, D., and M. O’Hara. 2004. Information and the Cost of Capital. Journal of
Finance 59: 1553-1583.
Edmans, A. 2009. Blockholder Trading, Market Efficiency, and Managerial Myopia.
Journal of Finance 64: 2481-2513.
Edmans, A., X. Gabaix, and A. Landier. 2009. A Multiplicative Model of Optimal
CEO Incentives in Market Equilibrium. Review of Financial Studies 22: 4881-
4917.
Edmans, A., and G. Manso. 2011. Governance through Trading and Intervention: A
Theory of Multiple Blockholders. Review of Financial Studies 24: 2395-2428.
Edmans, A., V. Fang, and E. Zur. 2013. The Effect of Liquidity on Governance.
Review of Financial Studies, forthcoming.
Edwards, A., Schwab, C., and T. Shevlin. 2013. Financial Constraints and The
Incentives for Tax Planning, 2013 American Taxation Association Midyear
Meeting. Available at SSRN: http://ssrn.com/abstract=2216875
Fang, V., T. Noe, and S. Tice. 2009. Stock Market Liquidity and Firm Value. Journal
of Financial Economics 94: 150 – 169.
Fang, V., Tian, X., and S. Tice. 2013. Does Stock Liquidity Enhance or Impede Firm
Innovation? Journal of Finance, forthcoming

35
Foucault, T., and T. Gehrig. 2008. Stock Price Informativeness, Cross-Listings, and
Investment Decisions. Journal of Financial Economics 88: 146-168
Gompers, P., Ishii, J., and A. Metrick. 2003. Corporate Governance and Equity
Prices. Quarterly Journal of Economics 118: 107:156.
Gopalan, R., O. Kadan, and M. Pevzner. 2012. Asset Liquidity and Stock Liquidity.
Journal of Financial and Quantitative Analysis 47: 333-364.
Graham, J., and A. Tucker. 2006. Tax Shelters and Corporate Debt Policy. Journal of
Financial Economics 81: 563-594.
Graham, J.R., Hanlon, M., Shevlin, T., and N. Shroff. 2013. Incentives for Tax
Planning and Avoidance: Evidence from the Field. MIT Sloan Research Paper
No. 4990-12. Available at SSRN: http://ssrn.com/abstract=2148407
Grossman, S., and J. Stiglitz. 1980. On the Impossibility of Informationally Efficient
Markets. American Economic Review 70: 393:408
Hadlock, C.J., and J.R. Pierce. 2010. New Evidence on Measuring Financial
Constraints: Moving Beyond the KZ Index. Review of Financial Studies 23:1909-
1940.
Hanlon, M. 2005. The Persistence and Pricing of Earnings, Accruals, and Cash-Flows
When Firms Have Large Book-Tax Differences. The Accounting Review 80: 137-
166.
Hanlon, M., and S. Heitzman. 2010. A Review of Tax Research. Journal of
Accounting and Economics 50, 127-178.
Hasbrouck, J. 2009. Trading Costs and Returns for U.S. Equities: Estimating
Effective Costs from Daily Data. Journal of Finance 64: 1445-1477.
Jayaraman, S., and T. Milbourn. 2012. The Role of Stock Liquidity in Executive
Compensation. The Accounting Review 87: 537-563.
Jensen, M. C.1993. The Modern Industrial Revolution, Exit, and the Failure of
Internal Control Systems. Journal of Finance 48: 831-880.

36
Kaplan, S., and L. Zingales. 1997. Do Investment-cash flow Sensitivities Provide
Useful Measures of Financing Constraints? Quarterly Journal of Economics 112:
169-215.
Khana, N. and R. Sonti. 2004. Value Creating Stock Manipulation: Feedback Effect
of Stock Prices on Firm Value. Journal of Financial Markets 7: 237–270.
Kim, J-B., Li, Y., and L.Zhang. 2011. Corporate Tax Avoidance and Stock Price
Crash-a Firm-Level Analysis. Journal of Financial Economics 100: 639-662
Koenker, R., and G. Bassett. 1978. Regression Quantiles. Econometrica. 46: 33–50.
Koenker, R., and K.F. Hallock. 2001. Quantile Regression. Journal of Economic
Perspectives 15:143-156
Kyle, A. 1985. Continuous Auctions and Insider Trading. Econometrica 53: 1315-
1336
Lang, M. H., and R. J. Lundholm. 1996. Corporate Disclosure Policy and Analyst
Behaviour. The Accounting Review 71: 467-492.
Lesmond, D., 2005. Liquidity of emerging markets. Journal of Financial Economics
77: 411-452.
Lin, J.C., Singh, A.K., and W. Yu. 2009. Stock Splits, Trading Continuity, and the
Cost of Equity Capital. Journal of Financial Economics 93: 474-489.
Lisowsky, P. 2010. Seeking Shelter: Empirically Modeling Tax Shelters Using
Financial Statement Information. The Accounting Review 85, 1693-1720.
Maug, E. 1998. Large Shareholders as Monitors: Is There a Trade-Off between
Liquidity and Control? Journal of Finance 53: 65-98.
McGuire, S.T., Omer, T.C., and J.H. Wilde. 2013. Investment Opportunity Sets,
Operating Uncertainty and Capital Market Pressure: Determinants of Investments
in Tax Shelter Activities? The Journal of American Taxation Association,
forthcoming
Mehran, H. 1995. Executive Compensation Structure, Ownership, and Firm
Performance. Journal of Financial Economics 38: 163-84.

37
Mills, L., Erickson, M., and E. Maydew. 1998. Investments in tax planning. Journal
of the American Taxation Association. 20: 1-20.
Mosteller, F., and J. Tukey. 1977. Data Analysis and Regression: A Second Course in
Statistics. Reading, Mass.: Addison-Wesley.
Powell, J. 1989. Estimation of Monotonic Regression Models Under Quantile
Restrictions, in Non-parametric and Semiparametric Methods in Econometrics,
W. Barnett, J. Powell, and G. Tauchen, eds., Cambridge: Cambridge University
Press.
Rego, S.O., 2003. Tax-Avoidance Activities of US Multinational Corporations.
Contemporary Accounting Research 20: 805:833.
Rego, S. O., and R. Wilson, 2012. Equity Risk Incentives and Corporate Tax
Aggressiveness. Journal of Accounting Research 50: 775-810.
Shackelford, D. A., and T. Shevlin. 2001. Empirical Tax Research in Accounting.
Journal of Accounting and Economics 31: 312-387.
Subrahmanyam, A. and S. Titman. 2001. Feedback from Stock Prices to Cash Flows.
Journal of Finance 56: 2389–2413.
Whited, T., and G. Wu. 2006. Financial Constraints Risk. Review of Financial Studies
19: 531-559.
Wilson, R. 2009. An examination of corporate tax shelter participants. The
Accounting Review 84: 969-999.
Zhang, X. F. 2006. Information Uncertainty and Stock Returns. The Journal of
Finance 61: 105-137.

38
Appendix A. Variables and Definitions
Characters in parentheses refer to the item name in the Compustat database.
Abnormal accruals
(ABACC)
Absolute value of abnormal accruals, estimated following Kothari et
al. (2005).
Cash effective cash rate
(CETR)
Taxes paid in cash (TXPD) plus tax benefits of stock options
(TXBCO+TXBCOF) scaled by pretax income (PI).
Cash holdings
(CASH) Cash and cash equivalents (CHE) scaled by lagged total assets (AT).
CEO Power
(CEO_POWER)
Principal component of boar size, CEO-Chairman duality, and board
independence. Board size is the natural log of the number of
directors in the board. CEO-Chairman duality is a dummy variable
equal to one if the CEO and the Chairman of the board is the same
person and zero otherwise. Board independence is the proportion of
independent directors in the board.
Change in goodwill
(POSGDWL)
Change in goodwill (GDWL) scaled by lagged total assets (AT). If
the value is negative, then it is set to zero.
Change in loss carryforward
(DNOL_AT)
Change in net operating loss carry forwards (TLCF) over year t
scaled by lagged total assets (AT).
Core-Guay Pay-for-
performance sensitivity
(PPS_CG)
Dollar change in CEO stock and option compensation with respect
to 1% change in share price, estimated following Core and Guay
(2002).
Dispersion of analyst forecasts
(DISP) Standard deviation of analyst earnings forecasts.
Edmans-Gabaix-Landier Pay-
for-performance sensitivity
(PPS_EGL)
Dollar change in CEO wealth for a one hundred-percentage point
change in firm value divided by annual flow compensation,
estimated following Edmans et al. (2009).
Equity income in earnings
(EQINC)
Equity income in earnings (ESUB) scaled by lagged total assets
(AT).
Firm size
(SIZE) Log of market value of equity (PRCC_F×CSHO).
Foreign assets
(FRGNAT) Proportion of foreign assets, estimated following Oler et al. (2007).
Foreign income dummy
(DFI)
An indicator variable set equal to 1 for firm observations reporting
foreign income (PIFO) in year t and zero otherwise;
Governance index
(GINDEX) Governance index of Gompers et al. (2003)
GAAP effective tax rate
(GETR) Income taxes (TXT) scaled by pretax income (PI).
Intangible assets
(INTANG) Intangible assets (INTAN) scaled by lagged total assets (AT).
Leverage
(LEV) Long term debt (DLTT) scaled by total assets (AT).
Long-run cash effective tax rate
(LCETR)
Sum of taxes paid in cash (TXPD) over the last three years scaled
by the sum of pretax income (PI) over the same period.
Loss carryforward dummy
(NOL)
An indicator variable that equals one if net operating loss carry
forwards (TLCF) is positive for year t-1.
Market-to-book
(MB)
Market value of equity (PRCC_F×CSHO) divided by book value of
equity (CEQ).
New Investments
(NEWINV)
New investment, calculated as Compustat (XRD+CAPX+AQC-
SPPE -DPC) scaled by lagged total assets (AT).
PPE assets
(PPE)
Net property, plant and equipement (PPENT) scaled by lagged total
assets (AT).
Residual book-tax difference
(RBTD)
The residual from regression of book-tax difference on firm’s total
accruals (Desai and Dharmapala, 2006). Regression is performed
cross-sectionally for each year and 2-digit SIC code.

39
ROA volatility
(STDROA) Standard deviation of ROA over the past five years.
Return on assets
(ROA) Pre-tax income (PI) divided by lagged total assets (AT).
Stock liquidity
(LIQ)
Minus one times natural logarithm of the relative effective spread.
Relative effective spread is calculated as the difference between the
trade price and the midpoint of the bid-ask quote divided by the
trade price.
Stock liquidity composite
measure
(LIQ_PC)
A principal component of the Amihud (2002) illiquidity measure,
Hasbrouck (2009) implicit bid-ask spread and Lesmond (2005)
percentage of zero-returns
Whited-Wu index
(WW) Financial constraint index proposed by Whited and Wu (2006).
40
Figure 1
Stock liquidity across GAAP effective tax rate deciles
We plot mean values of stock liquidity lagged one year against decile ranks of GAAP effective tax rate
(GETR). Stock liquidity is lagged one year to alleviate endogeneity concerns. Our initial sample
consists of all the firms in the Compustat database over the period 1993-2010. We merge the sample
with the stock liquidity measures generated from the Trade and Quote (TAQ) database and stock
returns from CRSP. All the variables are winsorized at both the 1st and 99
th percentiles Definitions of
the variables are provided in Appendix A.
4.8
5
5.2
5.4
5.6
5.8
6
6.2
1 2 3 4 5 6 7 8 9 10
Sto
ck li
qu
dit
y
GETR decile rank

41
Figure 2
Stock liquidity coefficients for various percentiles of the GAAP effective tax rate
We estimate quantile regressions of GAAP effective tax rate on stock liquidity and control variables
for 10-th, 15-th…90-th percentile of GAAP ETR. The estimated coefficients for stock liquidity (solid
line) and the 95% confidence intervals (dashed lines) are plotted against the estimation quantiles. Our
initial sample consists of all the firms in the Compustat database over the period 1993-2010. We merge
the sample with the stock liquidity measures generated from the Trade and Quote (TAQ) database and
stock returns from CRSP. All the variables are winsorized at both the 1st and 99
th percentiles
Definitions of the variables are provided in Appendix A.
-0.02
-0.01
0
0.01
0.02
0.03
0.04
10 20 30 40 50 60 70 80 90Sto
ck L
iqu
idit
y C
oe
ffic
ien
t
GETR percentile

42
Table 1
Summary statistics
Mean S.D. 10% Median 90%
GETR 0.296 0.185 0.024 0.348 0.427
LIQ 5.763 1.302 4.069 5.724 7.555
CASH 0.186 0.267 0.008 0.088 0.486
ROA 0.099 0.154 -0.015 0.088 0.249
STDROA 0.117 0.351 0.014 0.053 0.206
PPE 0.331 0.294 0.036 0.247 0.759
POSGDWL 0.021 0.065 0.000 0.000 0.055
SIZE 6.182 2.008 3.546 6.158 8.965
NOL 0.290 0.454 0.000 0.000 1.000
NEWINV 0.085 0.165 -0.019 0.038 0.233
MB 2.882 3.950 0.859 2.039 5.636
LEV 0.172 0.180 0.000 0.129 0.412
INTANG 0.133 0.196 0.000 0.043 0.405
FRGNAT 0.440 0.694 0.000 0.000 1.000
EQINC 0.001 0.006 0.000 0.000 0.003
DNOL_AT 0.005 0.122 -0.011 0.000 0.016
DFI 0.340 0.474 0.000 0.000 1.000
ABACC 0.079 0.094 0.009 0.053 0.172
Obs. 34,221
This table presents the mean, standard deviation (S.D.), 10th percentile (10%), median, and 90th
percentile (90%) of the variables. Our initial sample consists of all the firms in the Compustat database
over the period 1993-2010. We merge the sample with the stock liquidity measures generated from the
Trade and Quote (TAQ) database and stock returns from CRSP. All the variables are winsorized at
both the 1st and 99
th percentiles Definitions of the variables are provided in Appendix A.
43
Table 2
Correlation matrix
(1) (2) (3) (4) (5) (6) (7) (8) (9) (10) (11) (12) (13) (14) (15) (16) (17)
(1) GETR 1.000
(2) LIQ 0.029 1.000
(3) CASH -0.093 -0.002 1.000
(4) ROA 0.148 0.125 0.176 1.000
(5) STDROA -0.093 -0.060 0.204 -0.034 1.000
(6) PPE 0.025 0.032 0.032 0.016 -0.072 1.000
(7) POSGDWL 0.047 0.080 0.080 0.047 0.031 -0.017 1.000
(8) SIZE 0.069 0.788 -0.016 0.156 -0.082 0.109 0.058 1.000
(9) NOL -0.094 0.124 0.048 -0.112 0.035 -0.091 0.066 0.049 1.000
(10) NEWINV -0.005 0.030 0.188 0.067 0.076 0.245 0.422 0.040 0.032 1.000
(11) MB -0.034 0.138 0.214 0.204 0.084 -0.035 0.009 0.206 0.015 0.110 1.000
(12) LEV -0.007 0.070 -0.321 -0.183 -0.075 0.322 0.060 0.091 0.027 0.032 -0.080 1.000
(13) INTANG 0.089 0.222 -0.075 0.002 0.018 -0.178 0.589 0.147 0.144 0.274 -0.001 0.175 1.000
(14) FRGNAT -0.099 0.269 0.119 -0.019 0.036 -0.109 0.033 0.263 0.218 0.036 0.042 -0.079 0.082 1.000
(15) EQINC -0.028 0.085 -0.052 0.082 -0.029 0.029 -0.001 0.114 -0.029 -0.022 0.018 0.022 -0.021 0.040 1.000
(16) DNOL_AT -0.021 0.003 0.022 -0.153 0.046 0.007 0.042 -0.002 0.121 0.033 0.030 0.005 0.035 0.021 -0.016 1.000
(17) DFI 0.009 0.270 0.037 0.001 -0.019 -0.158 0.051 0.244 0.205 0.038 0.037 -0.046 0.119 0.434 0.009 0.013 1.000
(18) ABACC -0.029 -0.064 0.254 0.028 0.121 -0.015 0.067 -0.071 0.0203 0.198 0.151 -0.086 0.014 0.011 -0.008 0.009 -0.027
This table presents the correlation matrix of the variables. Our initial sample consists of all the firms in the Compustat database over the period 1993-2010. We merge the
sample with the stock liquidity measures generated from the Trade and Quote (TAQ) database and stock returns from CRSP. All the variables are winsorized at both the 1st
and 99th
percentiles Definitions of the variables are provided in Appendix A.

44
Table 3
Tax avoidance and stock liquidity: main results
This table presents the results of regressing GAAP effective tax rate (GETR) on stock liquidity. Our
initial sample consists of all the firms in the Compustat database over the period 1993-2010. We merge
the sample with the stock liquidity measures generated from the Trade and Quote (TAQ) database and
stock returns from CRSP. All the variables are winsorized at both the 1st and 99
th percentiles
Definitions of the variables are provided in Appendix A. Constant, industry fixed effects based on two-
digit SIC codes, and year fixed effects are included in all regressions. The regressions are performed by
quantile regression method, with the z-statistics (in parentheses) computed using Powel (1989)
standard errors. The independent variables are lagged one year in all the regressions. ***, ** and *
denote statistical significance at the 1%, 5% and 10% levels, respectively
Raw liquidity Decimalized liquidity
Dependent
Variable: GETR GETR GETR GETR GETR GETR
Percentile 10 50 90 10 50 90
(1) (2) (3) (4) (5) (6)
LIQ 0.028 0.003 -0.013 0.011 0.001 -0.004
(6.258)*** (3.976)*** (-7.941)*** (7.016)*** (5.074)** (-5.981)***
CASH -0.118 -0.039 0.019 -0.118 -0.039 0.018
(-7.319)*** (-10.31)*** (3.406)*** (-7.217)*** (-10.47)*** (3.186)***
ROA 0.414 0.138 -0.045 0.404 0.137 -0.049
(18.01)*** (17.71)*** (-4.858)*** (17.39)*** (17.72)*** (-4.898)***
STDROA -0.108 -0.028 0.014 -0.102 -0.028 0.015
(-5.834)*** (-8.152)*** (0.692) (-2.469)** (-8.307)*** (0.771)
PPE -0.035 0.001 -0.019 -0.028 0.000 -0.021
(-2.935)*** (0.356) (-4.245)*** (-2.297)** (0.241) (-4.704)***
POSGDWL -0.067 -0.011 -0.038 -0.077 -0.009 -0.042
(-1.625) (-1.403) (-2.064)** (-1.897)* (-1.152) (-2.292)**
SIZE 0.011 -0.002 0.002 0.011 -0.002 0.000
(5.095)*** (-4.045)*** (2.243)** (5.301)*** (-4.852)*** (0.439)
NOL -0.058 -0.006 0.007 -0.058 -0.006 0.007
(-10.60)*** (-4.899)*** (2.689)*** (-10.32)*** (-5.039)*** (2.705)***
NEWINV 0.014 -0.025 -0.008 0.011 -0.026 -0.005
(0.869) (-6.227)*** (-1.179) (0.594) (-6.314)*** (-0.691)
MB -0.004 -0.001 -0.000 -0.004 -0.001 -0.000
(-7.071)*** (-6.480)*** (-1.106) (-6.906)*** (-6.484)*** (-0.853)
LEV -0.113 0.001 0.031 -0.114 0.002 0.030
(-7.299)*** (0.322) (4.309)*** (-7.466)*** (0.414) (4.291)***
INTANG 0.077 0.049 0.065 0.085 0.049 0.063
(4.034)*** (15.01)*** (6.682)*** (4.519)*** (14.86)*** (6.494)***
FRGNAT -0.028 -0.031 0.009 -0.028 -0.031 0.009
(-7.832)*** (-23.36)*** (2.697)*** (-7.808)*** (-23.35)*** (2.582)***
EQINC -1.625 -0.787 -0.830 -1.588 -0.786 -0.791
(-5.193)*** (-7.953)*** (-7.305)*** (-5.433)*** (-7.897)*** (-6.286)***
DNOL_AT 0.033 -0.002 0.034 0.029 -0.002 0.034
(2.212)** (-0.135) (2.016)** (2.188)** (-0.116) (2.031)**
DFI 0.016 0.003 0.008 0.017 0.003 0.009
(3.230)*** (2.676)*** (3.180)*** (3.567)*** (2.573)*** (3.395)***
ABACC -0.048 0.001 0.015 -0.043 0.000 0.015
(-1.567) (0.197) (1.309) (-1.499) (0.042) (1.303)
Obs. 34,221 34,221 34,221 34,221 34,221 34,221
Adj. Pseudo R2 0.156 0.107 0.042 0.157 0.106 0.041

45
Table 4
Tax avoidance and stock liquidity: robustness tests
Dependent variable: Tax Avoidance
Percentile: 10 50 90
Panel A. Alternative tax avoidance measures (1) Annual effective cash tax-rate 0.006 0.004 -0.013
(2.755)*** (2.029)** (-2.299)**
(2) Long-term effective cash tax-rate 0.008 0.004 -0.016
(3.115)*** (2.244)** (-3.003)***
(3) Residual book-tax difference 0.006 -0.001 -0.010
(-2.646)*** (-0.749) (-3.284)***
Panel B. Alternative liquidity measures
(1) Principal component of Amihud
(2002), Hasbrouck (2009), and Lesmond
(2005) measures 0.025 0.002 -0.008
(8.272)*** (3.412)*** (-5.956)***
Panel C. Alternative regression specifications
(1) Cross-sectional regressions 0.025 0.004 -0.010
(2.854)** (1.499) (-2.389)**
(2) Additional controls 0.032 0.004 -0.012
(4.144)*** (2.187)** (-2.905)***
This table presents the results of robustness tests for our main hypothesis. Our initial sample consists of
all the firms in the Compustat database over the period 1993-2010. We merge the sample with the stock
liquidity measures generated from the Trade and Quote (TAQ) database and stock returns from CRSP.
All the variables are winsorized at both the 1st and 99
th percentiles Definitions of the variables are
provided in Appendix A. Constant, industry fixed effects based on two-digit SIC codes, and year fixed
effects are included in all analyses except for the cross-sectional regressions where only constant and
industry fixed effects are included. The regressions are performed by quantile regression method, with
the z-statistics (in parentheses) computed using Powel (1989) standard errors except for the cross-
sectional regressions where we report Newey-West t-statistics adjusted for heteroskedasticity and serial
correlation. The independent variables are lagged one year in all the regressions. ***, ** and * denote
statistical significance at the 1%, 5% and 10% levels, respectively
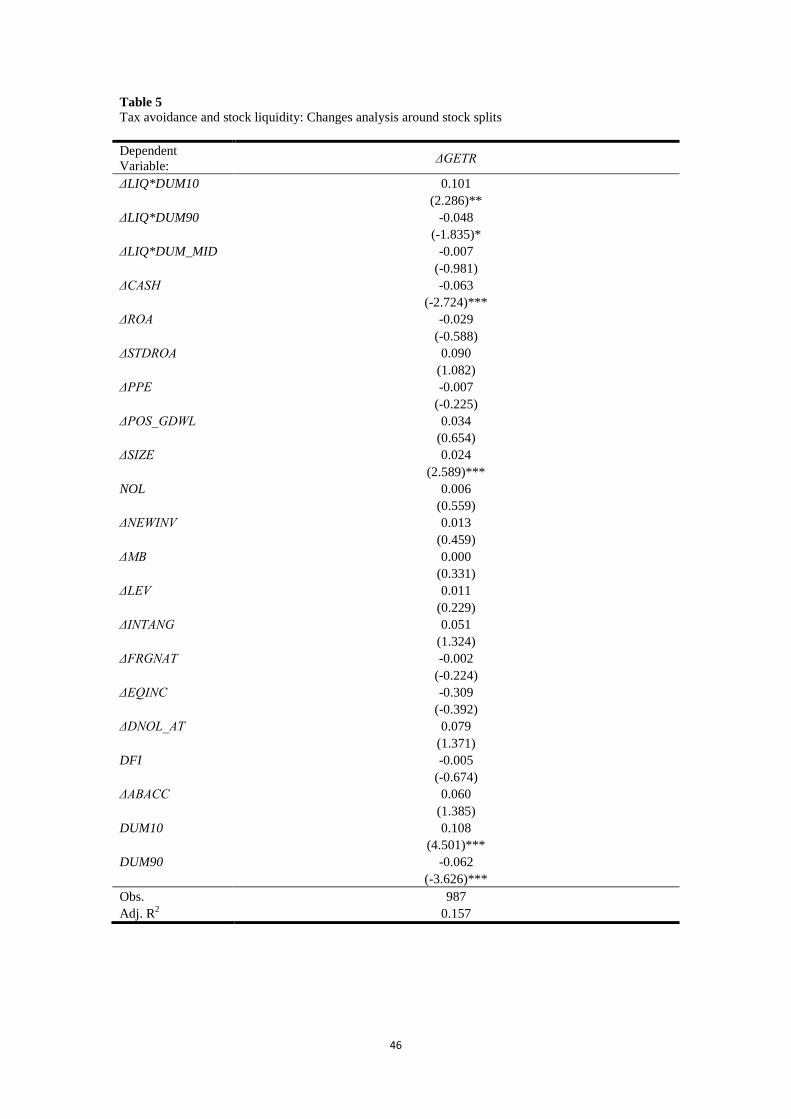
46
Table 5
Tax avoidance and stock liquidity: Changes analysis around stock splits
Dependent
Variable: ΔGETR
ΔLIQ*DUM10 0.101
(2.286)**
ΔLIQ*DUM90 -0.048
(-1.835)*
ΔLIQ*DUM_MID -0.007
(-0.981)
ΔCASH -0.063
(-2.724)***
ΔROA -0.029
(-0.588)
ΔSTDROA 0.090
(1.082)
ΔPPE -0.007
(-0.225)
ΔPOS_GDWL 0.034
(0.654)
ΔSIZE 0.024
(2.589)***
NOL 0.006
(0.559)
ΔNEWINV 0.013
(0.459)
ΔMB 0.000
(0.331)
ΔLEV 0.011
(0.229)
ΔINTANG 0.051
(1.324)
ΔFRGNAT -0.002
(-0.224)
ΔEQINC -0.309
(-0.392)
ΔDNOL_AT 0.079
(1.371)
DFI -0.005
(-0.674)
ΔABACC 0.060
(1.385)
DUM10 0.108
(4.501)***
DUM90 -0.062
(-3.626)***
Obs. 987
Adj. R2 0.157

47
This table presents the results of changes analysis around stock splits. DUM10 (DUM90) is the dummy
variable that takes value of 1 if GETR was below the 10-th conditional percentile (above 90-th
conditional percentile) during the year prior to stock split and zero otherwise. DUM_MID is the dummy
variable, which equals one minus the sum of DUM10 and DUM90. The 10-th and 90-th percentiles are
estimated using our baseline specification (Eq. 4) with stock liquidity excluded from the explanatory
variables. Our sample consists of all the firms in the Compustat database over the period 1993-2010,
merged with the stock liquidity measures generated from the Trade and Quote (TAQ) database and
stock splits from CRSP. All the variables are winsorized at both the 1st and 99
th percentiles Definitions
of the variables are provided in Appendix A. Constant term is included. The regressions are performed
by ordinary least squares (OLS), with the t-statistics (in parentheses) computed using standard errors
robust to heteroskedasticity. ***, ** and * denote statistical significance at the 1%, 5% and 10%
levels, respectively.
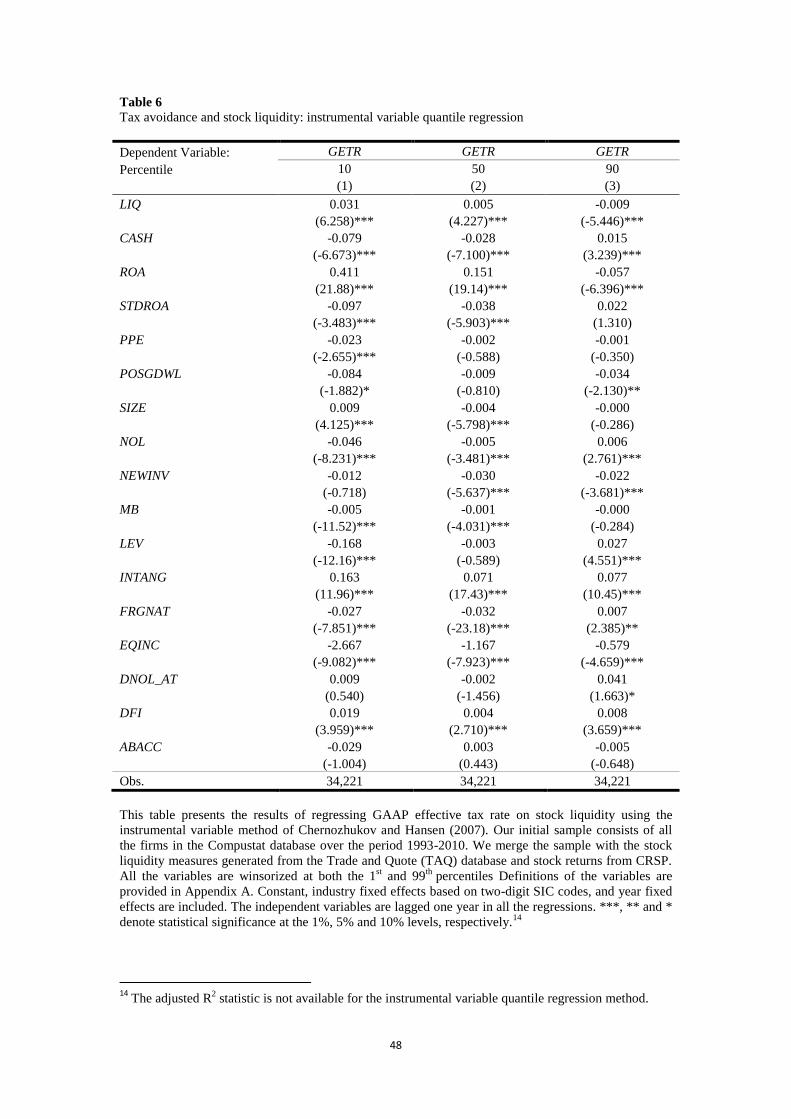
48
Table 6
Tax avoidance and stock liquidity: instrumental variable quantile regression
Dependent Variable: GETR GETR GETR
Percentile 10 50 90
(1) (2) (3)
LIQ 0.031 0.005 -0.009
(6.258)*** (4.227)*** (-5.446)***
CASH -0.079 -0.028 0.015
(-6.673)*** (-7.100)*** (3.239)***
ROA 0.411 0.151 -0.057
(21.88)*** (19.14)*** (-6.396)***
STDROA -0.097 -0.038 0.022
(-3.483)*** (-5.903)*** (1.310)
PPE -0.023 -0.002 -0.001
(-2.655)*** (-0.588) (-0.350)
POSGDWL -0.084 -0.009 -0.034
(-1.882)* (-0.810) (-2.130)**
SIZE 0.009 -0.004 -0.000
(4.125)*** (-5.798)*** (-0.286)
NOL -0.046 -0.005 0.006
(-8.231)*** (-3.481)*** (2.761)***
NEWINV -0.012 -0.030 -0.022
(-0.718) (-5.637)*** (-3.681)***
MB -0.005 -0.001 -0.000
(-11.52)*** (-4.031)*** (-0.284)
LEV -0.168 -0.003 0.027
(-12.16)*** (-0.589) (4.551)***
INTANG 0.163 0.071 0.077
(11.96)*** (17.43)*** (10.45)***
FRGNAT -0.027 -0.032 0.007
(-7.851)*** (-23.18)*** (2.385)**
EQINC -2.667 -1.167 -0.579
(-9.082)*** (-7.923)*** (-4.659)***
DNOL_AT 0.009 -0.002 0.041
(0.540) (-1.456) (1.663)*
DFI 0.019 0.004 0.008
(3.959)*** (2.710)*** (3.659)***
ABACC -0.029 0.003 -0.005
(-1.004) (0.443) (-0.648)
Obs. 34,221 34,221 34,221
This table presents the results of regressing GAAP effective tax rate on stock liquidity using the
instrumental variable method of Chernozhukov and Hansen (2007). Our initial sample consists of all
the firms in the Compustat database over the period 1993-2010. We merge the sample with the stock
liquidity measures generated from the Trade and Quote (TAQ) database and stock returns from CRSP.
All the variables are winsorized at both the 1st and 99
th percentiles Definitions of the variables are
provided in Appendix A. Constant, industry fixed effects based on two-digit SIC codes, and year fixed
effects are included. The independent variables are lagged one year in all the regressions. ***, ** and *
denote statistical significance at the 1%, 5% and 10% levels, respectively.14
14
The adjusted R2 statistic is not available for the instrumental variable quantile regression method.
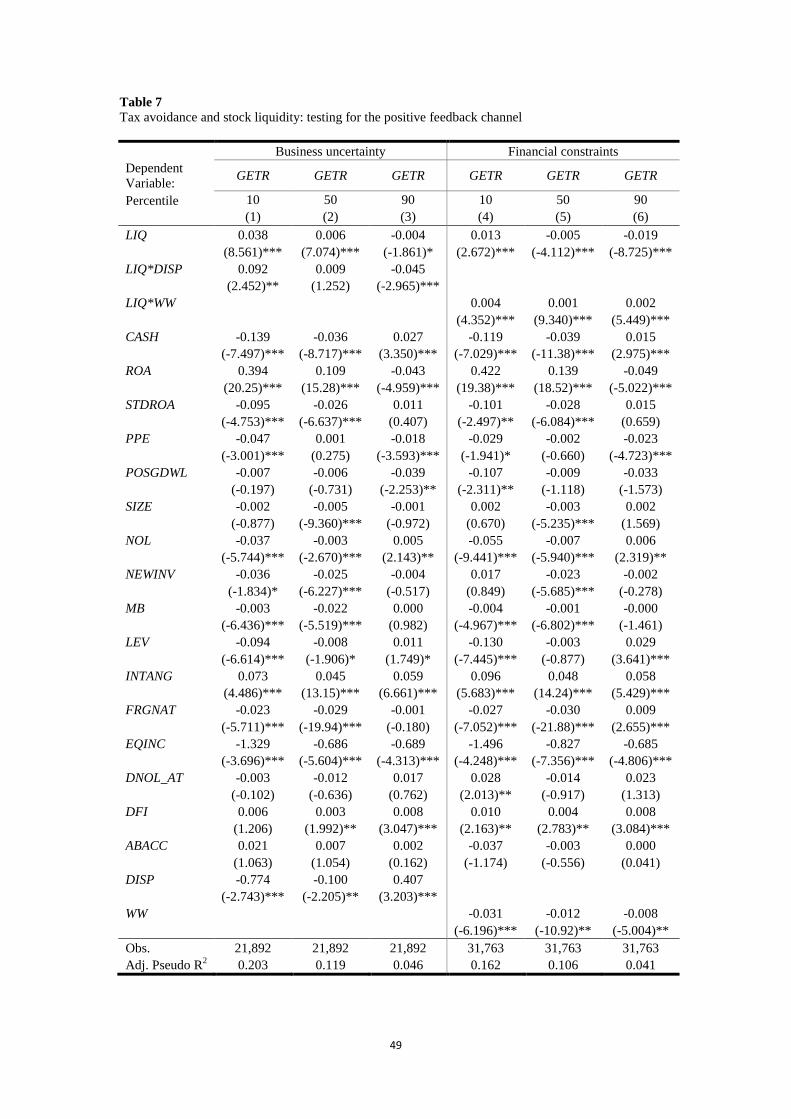
49
Table 7
Tax avoidance and stock liquidity: testing for the positive feedback channel
Business uncertainty Financial constraints
Dependent
Variable: GETR GETR GETR GETR GETR GETR
Percentile 10 50 90 10 50 90
(1) (2) (3) (4) (5) (6)
LIQ 0.038 0.006 -0.004 0.013 -0.005 -0.019
(8.561)*** (7.074)*** (-1.861)* (2.672)*** (-4.112)*** (-8.725)***
LIQ*DISP 0.092 0.009 -0.045
(2.452)** (1.252) (-2.965)***
LIQ*WW 0.004 0.001 0.002
(4.352)*** (9.340)*** (5.449)***
CASH -0.139 -0.036 0.027 -0.119 -0.039 0.015
(-7.497)*** (-8.717)*** (3.350)*** (-7.029)*** (-11.38)*** (2.975)***
ROA 0.394 0.109 -0.043 0.422 0.139 -0.049
(20.25)*** (15.28)*** (-4.959)*** (19.38)*** (18.52)*** (-5.022)***
STDROA -0.095 -0.026 0.011 -0.101 -0.028 0.015
(-4.753)*** (-6.637)*** (0.407) (-2.497)** (-6.084)*** (0.659)
PPE -0.047 0.001 -0.018 -0.029 -0.002 -0.023
(-3.001)*** (0.275) (-3.593)*** (-1.941)* (-0.660) (-4.723)***
POSGDWL -0.007 -0.006 -0.039 -0.107 -0.009 -0.033
(-0.197) (-0.731) (-2.253)** (-2.311)** (-1.118) (-1.573)
SIZE -0.002 -0.005 -0.001 0.002 -0.003 0.002
(-0.877) (-9.360)*** (-0.972) (0.670) (-5.235)*** (1.569)
NOL -0.037 -0.003 0.005 -0.055 -0.007 0.006
(-5.744)*** (-2.670)*** (2.143)** (-9.441)*** (-5.940)*** (2.319)**
NEWINV -0.036 -0.025 -0.004 0.017 -0.023 -0.002
(-1.834)* (-6.227)*** (-0.517) (0.849) (-5.685)*** (-0.278)
MB -0.003 -0.022 0.000 -0.004 -0.001 -0.000
(-6.436)*** (-5.519)*** (0.982) (-4.967)*** (-6.802)*** (-1.461)
LEV -0.094 -0.008 0.011 -0.130 -0.003 0.029
(-6.614)*** (-1.906)* (1.749)* (-7.445)*** (-0.877) (3.641)***
INTANG 0.073 0.045 0.059 0.096 0.048 0.058
(4.486)*** (13.15)*** (6.661)*** (5.683)*** (14.24)*** (5.429)***
FRGNAT -0.023 -0.029 -0.001 -0.027 -0.030 0.009
(-5.711)*** (-19.94)*** (-0.180) (-7.052)*** (-21.88)*** (2.655)***
EQINC -1.329 -0.686 -0.689 -1.496 -0.827 -0.685
(-3.696)*** (-5.604)*** (-4.313)*** (-4.248)*** (-7.356)*** (-4.806)***
DNOL_AT -0.003 -0.012 0.017 0.028 -0.014 0.023
(-0.102) (-0.636) (0.762) (2.013)** (-0.917) (1.313)
DFI 0.006 0.003 0.008 0.010 0.004 0.008
(1.206) (1.992)** (3.047)*** (2.163)** (2.783)** (3.084)***
ABACC 0.021 0.007 0.002 -0.037 -0.003 0.000
(1.063) (1.054) (0.162) (-1.174) (-0.556) (0.041)
DISP -0.774 -0.100 0.407
(-2.743)*** (-2.205)** (3.203)***
WW -0.031 -0.012 -0.008
(-6.196)*** (-10.92)** (-5.004)**
Obs. 21,892 21,892 21,892 31,763 31,763 31,763
Adj. Pseudo R2 0.203 0.119 0.046 0.162 0.106 0.041

50
This table presents the results of the interactions between stock liquidity and business
uncertainty/financial constraints. Our initial sample consists of all the firms in the Compustat database
over the period 1993-2010. We merge the sample with the stock liquidity measures generated from the
Trade and Quote (TAQ) database and stock returns from CRSP. All the variables are winsorized at
both the 1st and 99
th percentiles Definitions of the variables are provided in Appendix A. Constant,
industry fixed effects based on two-digit SIC codes, and year fixed effects are included. The
regressions are performed by quantile regression method, with the z-statistics (in parentheses)
computed using Powel (1989) standard errors. The independent variables are lagged one year in all the
regressions. ***, ** and * denote statistical significance at the 1%, 5% and 10% levels, respectively.

51
Table 8
Tax avoidance and stock liquidity: testing for blockholder intervention channel
Shareholder rights measure GINDEX CEO_POWER
Dependent
Variable: GETR GETR GETR GETR GETR GETR
Percentile 10 50 90 10 50 90
(1) (2) (3) (4) (5) (6)
LIQ 0.033 0.004 -0.010 0.027 0.004 -0.010
(5.090)*** (3.318)*** (-3.394)*** (4.278)*** (3.203)*** (-2.879)***
LIQ*LOW_GINDEX -0.014 -0.003 -0.007
(-1.936)* (-1.612) (-1.737)*
LIQ*HIGH_GINDEX -0.003 -0.003 0.002
(-0.339) (-1.009) (0.296)
LIQ*CEO_POWER 0.002 -0.000 -0.002
(1.251) (-1.329) (-1.601)
CASH -0.075 -0.032 0.021 -0.109 -0.017 0.034
(-3.875)*** (-5.339)*** (3.140)*** (-6.876)*** (-3.254)*** (4.000)***
ROA 0.388 0.094 -0.059 0.349 0.067 -0.071
(17.85)*** (11.29)*** (-4.009)*** (17.37)*** (8.788)*** (-5.271)***
STDROA -0.287 -0.035 0.106 -0.094 -0.001 0.066
(-2.619)*** (-1.682)* (3.023)*** (-1.722)* (-0.359) (1.141)
PPE 0.071 0.003 -0.005 0.037 0.005 0.002
(4.210)*** (0.767) (-0.666) (1.885)* (1.401) (0.221)
POSGDWL -0.096 -0.009 -0.021 -0.074 -0.003 -0.019
(-1.848)* (-0.774) (-0.806) (-1.427) (-0.259) (-0.811)
SIZE 0.002 -0.004 -0.001 -0.006 -0.006 -0.004
(0.769) (-6.042)*** (-0.718) (-1.965)** (-8.004)*** (-2.351)
NOL -0.028 -0.005 0.002 -0.023 -0.003 0.003
(-3.318)*** (-3.217)*** (0.535) (-3.306)*** (-2.065)** (0.845)
NEWINV -0.023 -0.028 -0.029 -0.045 -0.019 -0.019
(-0.872) (-4.655)*** (-1.892)* (-1.696)* (-3.367)*** (-1.622)
MB -0.003 -0.000 -0.000 -0.002 0.000 0.000
(-4.561)*** (-1.730)* (0.705) (-3.153)*** (0.494) (2.164)
LEV -0.111 -0.001 0.033 -0.081 -0.007 0.003
(-5.258)*** (-0.122) (3.274)*** (-3.808)*** (-1.415) (0.337)
INTANG 0.119 0.039 0.049 0.106 0.035 0.045
(5.815)*** (8.037)*** (4.416)*** (4.744)*** (7.782)*** (4.404)***
FRGNAT -0.035 -0.028 -0.005 -0.034 -0.029 -0.007
(-5.056)*** (-14.93)*** (-1.725)* (-5.141)*** (-15.80)*** (-1.954)**
EQINC -0.944 -0.609 -0.473 -1.091 -0.684 -0.217
(-2.332)** (-4.472)*** (-2.173)** (-2.499)** (-5.106)*** (-1.024)
DNOL_AT 0.017 -0.003 0.054 -0.048 -0.017 0.083
(0.693) (-0.162) (1.009) (-0.926) (-1.218) (2.879)***
DFI -0.002 -0.000 0.008 -0.013 -0.002 0.006
(-0.287) (-0.293) (3.225)*** (-2.025)** (-0.914) (1.786)*
ABACC -0.039 0.013 0.024 -0.003 0.005 0.023
(-1.487) (1.308) (1.293) (-0.119) (0.606) (1.199)
LOW_GINDEX 0.111 0.018 0.051
(2.166)** (1.506) (1.706)*
HIGH_GINDEX 0.045 0.024 -0.005
(0.788) (1.412) (-0.138)
CEO_POWER -0.014 0.007 0.016
(-1.062) (1.689)* (2.450)**

52
Obs. 11,463 11,463 11,463 10,047 10,047 10,047
Adj. Pseudo R2 0.199 0.112 0.064 0.193 0.121 0.052
This table presents the results of the interactions between stock liquidity and measures of shareholder
rights. Our initial sample consists of all the firms in the Compustat database over the period 1993-2010.
We merge the sample with the stock liquidity measures generated from the Trade and Quote (TAQ)
database and stock returns from CRSP. All the variables are winsorized at both the 1st and 99
th
percentiles Definitions of the variables are provided in Appendix A. Constant, industry fixed effects
based on two-digit SIC codes, and year fixed effects are included. The regressions are performed by
quantile regression method, with the z-statistics (in parentheses) computed using Powel (1989)
standard errors. The independent variables are lagged one year in all the regressions. ***, ** and *
denote statistical significance at the 1%, 5% and 10% levels, respectively.

53
Table 9
Tax avoidance and stock liquidity: testing for blockholder exit channel
Pay-for-performance sensitivity measure PPS_CG PPS_EGL
Dependent
Variable: GETR GETR GETR GETR GETR GETR
Percentile 10 50 90 10 50 90
(1) (2) (3) (4) (5) (6)
LIQ 0.061 0.004 -0.017 0.035 0.003 -0.010
(3.699)*** (1.348) (-2.559)* (4.166)** (2.342)** (-3.235)***
LIQ*PPS_CG -0.004 -0.000 0.001
(-2.141)** (-0.107) (1.143)
LIQ*PPS_EGL -0.022 -0.005 -0.007
(-0.579) (-0.646) (-0.533)
CASH -0.137 -0.023 0.043 -0.133 -0.022 0.042
(-5.944)*** (-4.069)*** (4.996)*** (-5.285)*** (-4.011)*** (4.826)***
ROA 0.378 0.077 -0.083 0.392 0.078 -0.0483
(11.99)*** (8.389)*** (-6.081)*** (14.06)*** (8.490)*** (-5.859)***
STDROA -0.092 -0.004 0.034 -0.112 -0.004 0.036
(-0.584) (-1.201) (0.832) (-0.951) (-1.310) (0.880)
PPE 0.033 0.004 -0.009 0.029 0.005 -0.011
(1.722) (1.057) (-1.395) (1.303)** (1.182) (-1.579)
POSGDWL -0.066 -0.008 0.012 -0.066 -0.008 0.006
(-1.375) (-0.734) (0.622) (-1.358) (-0.732) (0.279)
SIZE -0.008 -0.005 -0.002 -0.001 -0.005 -0.002
(-2.017)* (-6.423)*** (-1.441) (-0.356)*** (-6.296)*** (-1.446)
NOL -0.025 -0.004 0.002 -0.025 -0.004 0.002
(-2.769)** (-2.833)*** (0.656) (-2.885)*** (-2.752)*** (0.643)
NEWINV -0.026 -0.017 -0.000 -0.011 -0.016 0.001
(-0.786) (-2.945)*** (-0.032) (-0.349) (-3.011)*** (0.073)
MB -0.003 -0.000 0.001 -0.003 -0.000 0.001
(-3.721)*** (-0.533) (1.748)* (-4.370)*** (-0.681) (1.945)**
LEV -0.101 -0.013 0.000 -0.097 -0.014 0.002
(-4.794)*** (-2.509)** (0.037) (-4.529)*** (-2.673) (0.198)***
INTANG 0.086 0.036 0.038 0.081 0.037 0.037
(4.536)*** (7.565)*** (4.203)*** (3.753)*** (7.815)*** (4.100)***
FRGNAT -0.039 -0.033 -0.008 -0.037 -0.032 -0.008
(-4.946)*** (-16.11)*** (-2.649)*** (-4.229)*** (-16.21)*** (2.552)**
EQINC -0.579 -0.678 -0.498 -0.545 -0.656 -0.527
(-1.140) (-4.226)*** (-2.404)** (-1.207) (-4.111)*** (-2.740)***
DNOL_AT -0.016 -0.005 0.052 -0.007 -0.006 0.054
(-0.639) (-0.443) (0.943) (-0.406) (-0.538) (0.809)
DFI -0.017 -0.001 0.006 -0.018 -0.001 0.007
(-2.274)** (-0.355) (2.437)** (-2.714)*** (-0.387) (2.462)**
ABACC -0.002 0.012 0.022 -0.013 0.011 0.023
(-0.053) (1.224) (1.079) (-0.343) (1.146) (1.174)
PPS 0.038 0.001 -0.008
(2.565)** (0.319) (-1.070)
PPS_SCALED -0.158 0.038 0.048
(0.596) (0.592) (0.453)
Obs. 10,038 10,038 10,038 10,033 10,033 10,033
Adj. Pseudo R2 0.206 0.111 0.049 0.204 0.111 0.049

54
This table presents the results of the interactions between stock liquidity and measures of managerial
pay-for-performance sensitivity. Our initial sample consists of all the firms in the Compustat database
over the period 1993-2010. We merge the sample with the stock liquidity measures generated from the
Trade and Quote (TAQ) database and stock returns from CRSP. All the variables are winsorized at
both the 1st and 99
th percentiles Definitions of the variables are provided in Appendix A. Constant,
industry fixed effects based on two-digit SIC codes, and year fixed effects are included. The
regressions are performed by quantile regression method, with the z-statistics (in parentheses)
computed using Powel (1989) standard errors. The independent variables are lagged one year in all the
regressions. ***, ** and * denote statistical significance at the 1%, 5% and 10% levels, respectively.