stock market betas for cyclical and defensive sectors: a
TRANSCRIPT

Philippine Management Review 2018, Vol. 25, 99-114.
Stock Market Betas for Cyclical and Defensive Sectors: A Practitioner’s Perspective
Mark Adrian S. Asinas*
University of the Philippines, Cesar E.A. Virata School of Business, Diliman, Quezon City 1101, Philippines
Companies can be categorized as cyclical or defensive based on their performance in various phases of the business cycle. Cyclical companies exhibit performance directly related to the business cycle, while defensive companies tend to display stability in the face of economic booms and busts. Given the link between earnings and stock price, as well as the stock market index as an indicator of the economic cycle, cyclical company stocks are commonly expected to exhibit returns highly correlated to the stock market index, while returns on defensive company stocks are generally believed to display low correlation to index returns. The above is especially useful in equity valuation, particularly in the use of the capital asset pricing model (CAPM) and the beta coefficient, where analysts typically perform valuation sense-checks on the beta variable – cyclical company stocks should generally have beta coefficients greater than 1, while defensive company stocks should generally have beta coefficients less than 1. Based on selected Philippine stock price data, the above sense-check holds true for defensive company stocks, while it does not hold true for cyclical company stocks.
1 Introduction
1.1 The Concept of Cyclical and Defensive Industries Finance theory suggests that companies can be categorized based on their performance in various
phases of the business cycle, particularly in expansions and recessions. Cyclical companies are firms that tend to depend on the business cycle for their performance. Cyclical firms are typically characterized by sales and earnings volatility as well as significant business risk, especially since product and/or service demand is affected by the current state of the economy. On the other hand, defensive companies are those companies which maintain stable performance in the face of business booms and busts. These companies are typically characterized by low business risk in the sense that the level of demand for their products and/or services is sustained, especially during economic downturns (Reilly & Brown, 2003).
1.2 Earnings as Key Driver to Stock Price Performance It is generally accepted in the field of finance that a company’s earnings power is a key driver of
investment value, highlighted by the empirical research conducted by Ball & Brown (1968), which was recently replicated by Dechow, Sloan, and Zha (2014). Empirical research has shown that relative differences in the earnings power of firms, as measured by price-earnings ratios, are significantly related to long-run average stock returns. As such, in conjunction with the above discussion on cyclical and defensive industries, if a defensive company exhibits stable earnings throughout the business cycle, then that particular company’s stock should also exhibit price stability. Furthermore, since stock market indices are generally representative of the economic conditions of a particular market, determining the sensitivity of a company’s earnings to the business cycle is tantamount to determining the sensitivity of a company’s stock price to a stock market index. Following the general logic of the above discussion, the returns on the stocks of defensive companies should reflect low correlation with the returns on the market index, which is characterized by a low stock market beta. Similarly, the returns on the stocks of cyclical companies should reflect high correlation with the returns on the market index, which is characterized by a high stock market beta.
*Correspondence: Tel: +63 2 928 4571; Fax: +63 2 929 7991. Email: [email protected]

100 Stock Market Betas for Cyclical and Defensive Sectors: A Practitioner’s Perspective
1.3 The GICS Sector Classification Methodology The objective of the Global Industry Classification Standard (GICS), which was developed by S&P
Dow Jones Indices and MSCI, is to help establish a standard analytical framework for investment analysis and portfolio management. Central to the appeal of GICS is its universality, with a classification methodology that is applied consistently across all companies worldwide. Such a well-defined, globally accepted system enables comparability of industry analyses and ease of performing relative valuation methods.
Generally, the GICS approach entails grouping companies under a specific sub-industry, which in turn belongs under broader industry, industry group, and finally, sector classifications. The initial sub-industry classification is assigned based on analysis of the company’s primary business – which in turn is based mainly on understanding the business activities that generate majority of the company’s revenues. While revenues are the chief determinant of the sub-industry assignment, earnings and market perception also factor into the classification methodology.
Other more specific GICS classification guidelines include: (1) when a company’s revenue streams are split between or among two or more sub-industries, and no single sub-industry contributes at least 60% of revenues, the company is assigned to the sub-industry which contribute majority of both revenues and profits – and if no sub-industry contributes majority of both, further analysis is performed to determine a primary sub-industry; (2) when a company’s revenue streams are diversified across three or more sectors, and no sector contributes majority of profits and/or revenues, the company will be assigned either to the Industrial Conglomerates sub-industry under the Industrials sector, or to the Multi-Sector Holdings sub-industry under the Financials sector; and (3) for new companies, classification is based on description of business activities and projected revenues and earnings from the prospectus.
An example of guideline (2) discussed above is Ayala Corporation (AC), which is assigned to the Multi-Sector Holdings sub-industry under the Financials sector given its diversified revenue stream from subsidiaries across several GICS sectors, such as Ayala Land (Real Estate), Bank of the Philippine Islands (Financials), Globe Telecom (Telecommunications), and Manila Water (Utilities), among others. The following charts break down AC’s consolidated revenues and profits for the year 20161:
Figure 1. 2016 Segment Revenue Share, Ayala Corp.
1 Ayala Corporation (2018). 2017 Annual Report (SEC Form 17-A).
57%
0% 0%
12%
18%
13%
Real Estate
Financials
Telecommunications
Utilities
Industrials
Consumer Discretionary
Mark Adrian S. Asinas 101
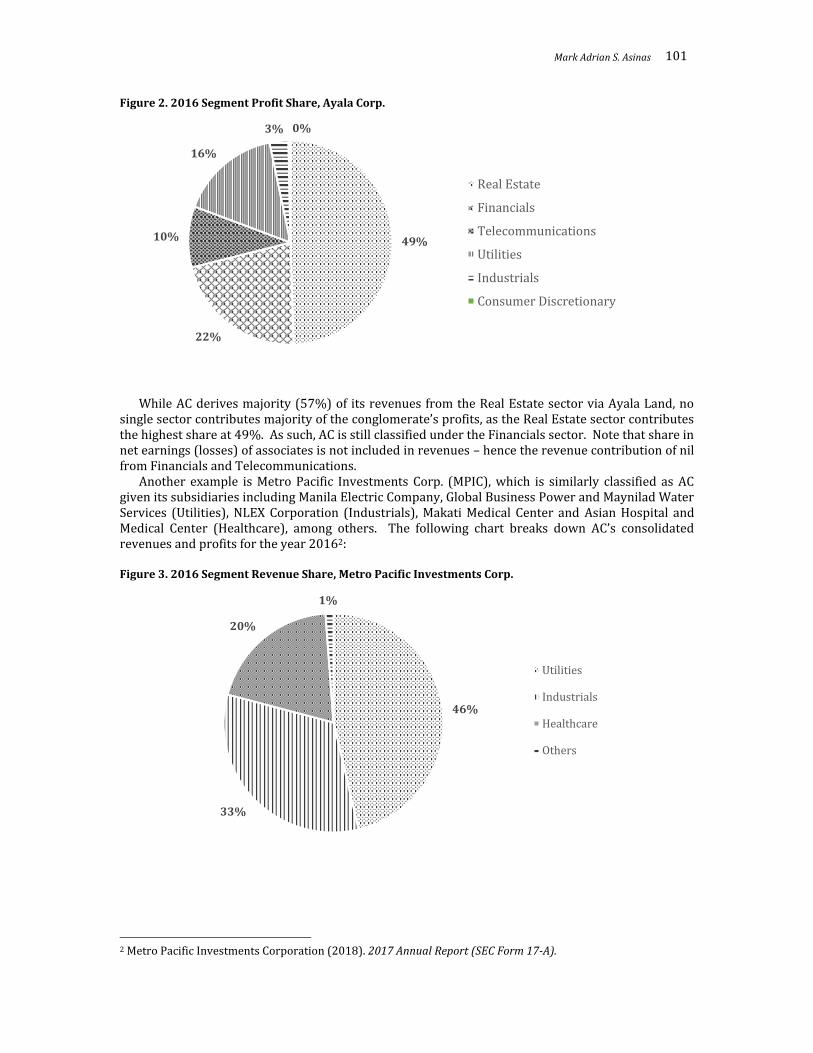
Figure 2. 2016 Segment Profit Share, Ayala Corp.
While AC derives majority (57%) of its revenues from the Real Estate sector via Ayala Land, no single sector contributes majority of the conglomerate’s profits, as the Real Estate sector contributes the highest share at 49%. As such, AC is still classified under the Financials sector. Note that share in net earnings (losses) of associates is not included in revenues – hence the revenue contribution of nil from Financials and Telecommunications.
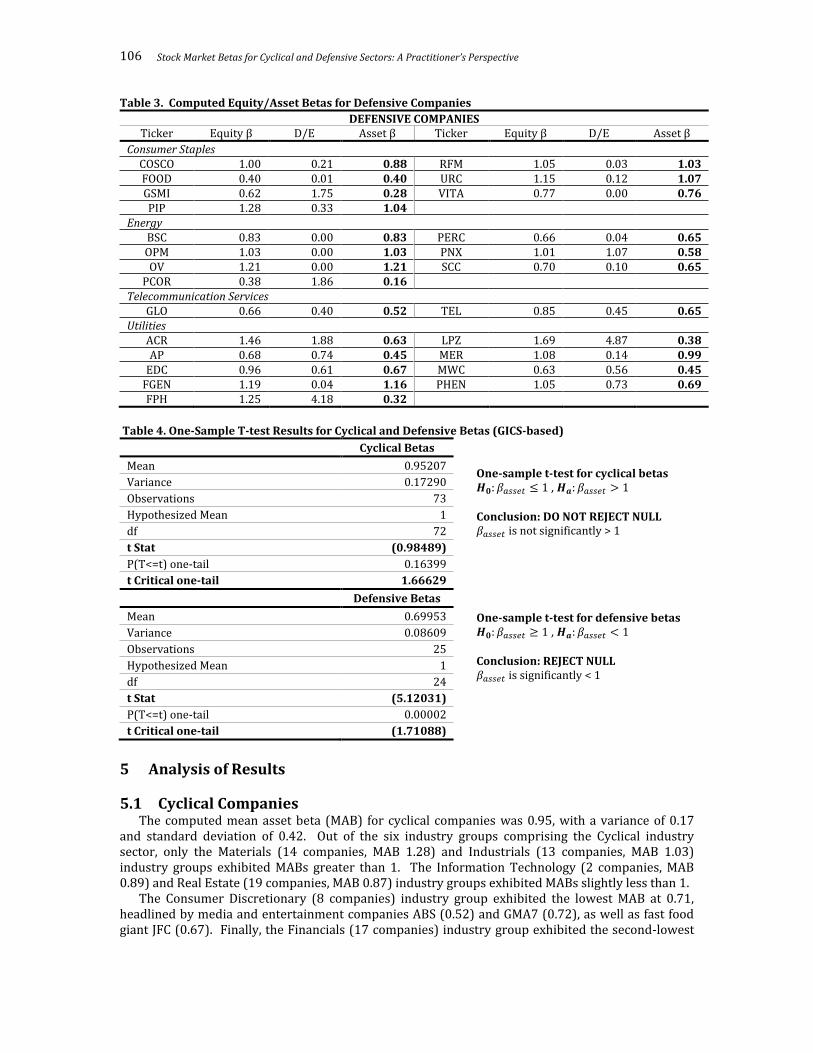
Another example is Metro Pacific Investments Corp. (MPIC), which is similarly classified as AC given its subsidiaries including Manila Electric Company, Global Business Power and Maynilad Water Services (Utilities), NLEX Corporation (Industrials), Makati Medical Center and Asian Hospital and Medical Center (Healthcare), among others. The following chart breaks down AC’s consolidated revenues and profits for the year 20162: Figure 3. 2016 Segment Revenue Share, Metro Pacific Investments Corp.
2 Metro Pacific Investments Corporation (2018). 2017 Annual Report (SEC Form 17-A).
49%
22%
10%
16%
3% 0%
Real Estate
Financials
Telecommunications
Utilities
Industrials
Consumer Discretionary
46%
33%
20%
1%
Utilities
Industrials
Healthcare
Others

102 Stock Market Betas for Cyclical and Defensive Sectors: A Practitioner’s Perspective
Figure 4. 2016 Segment Profit Share, Metro Pacific Investments Corp.
MPIC does not derive majority of its revenues from any single sector, with its Utilities businesses contributing 46% of revenues. Therefore, MPIC is still classified under the Financials sector, even as the Utilities sector contributes 72% of total profits after considering the share in net earnings (losses) of associates.
1.4 GICS Identification of Cyclical and Defensive Sectors Using the GICS sector classifications, MSCI Barra developed a method for identifying cyclical and
defensive sectors by measuring “the correlation between a sector’s relative performance to the market and the year-on-year change in the leading economic indicator of the corresponding region,” (Applied Research MSCI, 2009, p. 1) where the leading economic indicator used was the Organization for Economic Cooperation and Development’s (OECD) Composite Leading Indicator (CLI) series. MSCI Barra (2009) posited that, relative to each sector’s parent index (MSCI World/USA/Europe/Japan), the annual returns of each cyclical (defensive) sector is positively (negatively) correlated to the annual rate of change in the corresponding OECD-CLI. Long-run historical data from 1976 to 2009 was used in MSCI Barra’s study.
The results of MSCI Barra’s study show that the following sector indices (see Appendix A for GICS sector descriptions) exhibited cyclical behavior: Consumer Discretionary, Financials, Industrials, Information Technology, and Materials. On the other hand, the following sectors exhibited defensive behavior: Consumer Staples, Energy, Healthcare, Telecommunication Services, and Utilities. The Real Estate sector, while not technically included as an individual sector in MSCI Barra’s 2009 study, is also classified as cyclical, having been carved out of the Financials sector and upgraded to its own separate sector last September 2016.
1.5 Cyclical/Defensive Sectors in Portfolio Management Several research papers have acknowledged the role of cyclical/defensive investments in
portfolio management. Novy-Marx (2016) noted the recent popularity of “defensive equity strategies”, which overweight low-beta or defensive stocks and underweight high-beta or cyclical stocks. This investment strategy utilizes empirical research by Blitz and Van Vliet (2007) that pointed to low-volatility portfolios earning high risk-adjusted returns, as well as research by Baker, Bradley, and Wurgler (2011) that sought to explain the consistent underperformance of high-volatility/high-beta stocks versus low-volatility/low-beta stocks in the US market. Building on the above observations, Frazzini and Pedersen (2014) introduced an investment model using a “betting against beta” factor where high-beta stocks are shorted to effectively lever up investments in low-beta stocks, further highlighting the importance of identifying cyclical/defensive investments using estimated volatility/beta.
72%
24%
4% 0%
Utilities
Industrials
Healthcare
Others

Mark Adrian S. Asinas 103
2 Objective
From a practitioner’s perspective, equity valuation is both a science and an art. As such, it is always difficult to assess the accuracy or the precision of a stock’s estimated value. In some cases, firms do not even choose to provide a single point estimate of a stock’s value; rather, they provide a reasonable range of values that approximate the stock’s price. In either case, whether a point estimate or a range of values is provided, the inherent inaccuracies in equity valuation necessitate a check of reasonableness to more or less validate the estimated value. In checking for the reasonableness of the estimate, equity analysts commonly perform sensitivity analysis on their inputs, such as cash flow forecasts and discount rates.
One of the most common sensitivity analyses performed by equity analysts is on the stock’s beta, which affects stock price through its role in the derivation of the capital asset pricing model (CAPM)-based discount rate. Beta is the variable most commonly open to adjustments in the discount rate derivation since the other variables – the risk-free rate and the equity risk premium – can be readily identified and obtained from market data and empirical market studies, as well as through industry rules of thumb. On the other hand, there is no standard industry practice for obtaining beta, other than the use of regression analysis of the stock’s returns against the relevant stock market index. Analysts can choose from various return frequencies (daily, weekly, monthly) as well as the historical period (normally 2-10 years) from which the historical returns are obtained in deriving beta. The varying methodologies can sometimes result in wildly fluctuating discount rates, and consequently, a wide range of equity values. This decreases the usefulness of the equity value analysis, especially in cases wherein acquirers request for valuations of their potential target companies in order to obtain a base value for negotiations.
In practice, a common way of validating the usefulness of the computed beta coefficient is to sense-check the obtained beta against the sector classification of the subject company. As discussed above, companies belonging in defensive sectors are usually regarded as low-beta stocks and should not be expected to have beta coefficients greater than 1. On the other hand, companies belonging in cyclical sectors are usually regarded as high-beta stocks and should not be expected to have beta coefficients less than 1.
The objective of the study is to validate the above practical test of reasonableness in the Philippine setting in order to aid equity analysts in estimating values for local stocks, and see whether such sense-check procedures can help mitigate wide-ranged equity valuations that end up not being useful in view of the purpose they were commissioned for in the first place.
3 Methodology
This paper aims to study the robustness of the practitioner’s test of reasonableness in the Philippine setting through the following methodology:
1. Philippine stocks from various industries were selected and categorized under Cyclical and Defensive. Classification was done in accordance with the GICS, where each company was categorized in one of eleven industry sectors: Energy, Materials, Industrials, Consumer Discretionary, Consumer Staples, Health Care, Financials (which includes diversified, multi-sectoral holding companies as part of its Diversified Financials industry group), Information Technology, Telecommunication Services, Utilities, and Real Estate. Each industry sector, in turn, was further classified as Cyclical or Defensive based on MSCI’s Cyclical and Defensive Sectors Indices – where the Consumer Discretionary, Financials, Real Estate, Industrials, Information Technology, and Materials industry sectors are classified as Cyclical sectors, while the Consumer Staples, Energy, Health Care, Telecommunication Services, and Utilities industry sectors are classified as Defensive Sectors. A similar classification procedure was previously done by Bacmann, Dubois, and Isakov (2001), although such classification was based on indices from Datastream and FTSE instead of GICS and MSCI (Bacmann et al., 2001).
2. Monthly returns of selected Philippine stocks were computed from June 29, 2007 to June 30, 2017 (120 return observations). Monthly returns for certain stocks that only began trading after June 2007 were computed from the first available monthly return to June 2017. In

104 Stock Market Betas for Cyclical and Defensive Sectors: A Practitioner’s Perspective
order to preserve the relative comparability with other stocks in terms of number of return observations, only stocks that started trading before June 2008 were included in this study. Furthermore, in order to minimize the potential understatement of return correlations that can arise due to lack of trading activity (Damodaran, 2002), stocks that exhibited zero trading activity for one month (i.e., 20 consecutive trading days) at any time from June 2007 to June 2017 were excluded from the study.
3. Monthly returns of the Philippine Stock Exchange Index were computed from June 29, 2007 to June 30, 2017.
4. Monthly returns of individual stocks were regressed against the monthly returns of the PSE Index in order to derive their respective equity betas.
5. To remove the effect of leverage on the beta coefficient, each stock’s equity beta was unlevered using its debt-to-equity ratio as of June 2017, resulting in individual asset betas. The Hamada equation below was used in unlevering the equity betas to asset betas:
𝛽𝑎𝑠𝑠𝑒𝑡 =
𝛽𝑒𝑞𝑢𝑖𝑡𝑦
[1 + (1 − 𝑡)(𝐷 𝐸⁄ )] (1)
Where t is the Philippine corporate tax rate of 30%; D is the book value of the company’s financial debt, and E is the market value of the company’s equity.
6. One-sample t-tests at 5% significance were performed on the resulting asset betas in order to determine whether the coefficients are significantly less than the market beta of 1.0 (for defensive companies) or significantly greater than the market beta of 1.0 (for cyclical companies).
4 Results of the Study
Based on the methodology discussed above, a total of 98 companies (see Appendix B for the full company names associated with the tickers listed in the table) were included in the study, with 73 companies belonging in Cyclical sectors and 25 companies belonging in Defensive sectors. The following tables summarize the results of the study: Table 1. GICS Classifications for Selected Companies (see Appendix A for sector descriptions)
CYCLICAL COMPANIES (73) DEFENSIVE COMPANIES (25)
Consumer Discretionary (8) Consumer Staples (7) ABS GMA7 JFC LOTO COSCO FOOD GSMI LR PLC WEB WPI PIP RFM URC
Financials (17) VITA AC APO BDO BKR Energy (7) BPI CEI CHIB COL BSC OPM OV
LIHC MBT MPI PNB PCOR PERC PNX PSE RCB SECB UBP SCC
V Industrials (13) Telecommunication Services (2)
AEV AGI ANS APC GLO TEL DMC EEI ICT IPM Utilities (9) JGS MAC PAX SM ACR AP EDC
SMC FGEN FPH LPZ Information Technology (2) MER MWC PHEN
GREEN ISM Materials (14)
APX AR AT GEO HLCM LC MA MARC
NI ORE PX T UPM VUL
Real Estate (19) ABA ALI BEL BRN CHI ELI FDC FLI

Mark Adrian S. Asinas 105
CYCLICAL COMPANIES (73) DEFENSIVE COMPANIES (25)
GERI MEG MRC OM RLC RLT SHNG SLI
SMPH VLL WIN
Table 2. Computed Equity/Asset Betas for Cyclical Companies
CYCLICAL COMPANIES Ticker Equity β D/E Asset β Ticker Equity β D/E Asset β
Consumer Discretionary ABS 0.73 0.57 0.52 LR 0.74 0.36 0.59
GMA7 0.73 0.03 0.72 PLC 1.33 0.00 1.33 JFC 0.69 0.05 0.67 WEB 0.56 0.00 0.56
LOTO 0.38 0.02 0.38 WPI 1.04 0.19 0.92 Financials
AC 1.20 0.59 0.85 MBT 1.29 0.75 0.85 APO 0.66 0.00 0.66 MPI 1.24 0.49 0.92 BDO 1.15 0.17 1.03 PNB 1.55 0.54 1.12 BKR 0.44 0.96 0.26 PSE 1.32 0.00 1.32 BPI 0.83 0.15 0.75 RCB 1.20 0.98 0.71 CEI 1.22 0.00 1.22 SECB 1.07 1.42 0.54
CHIB 0.46 0.16 0.41 UBP 0.73 0.20 0.64 COL 1.07 0.00 1.07 V 0.62 0.10 0.58 LIHC 1.27 0.00 1.27
Industrials AEV 0.66 0.60 0.46 IPM 1.13 0.02 1.11 AGI 1.64 1.06 0.94 JGS 1.81 0.39 1.42 ANS 0.64 0.15 0.58 MAC 0.39 0.02 0.39 APC 1.58 0.00 1.58 PAX 1.76 0.00 1.76 DMC 1.38 0.22 1.20 SM 1.13 0.35 0.90 EEI 1.95 0.38 1.54 SMC 0.41 2.78 0.14 ICT 1.31 0.01 1.30
Information Technology GREEN 0.96 0.03 0.94 ISM 0.84 0.00 0.84
Materials APX 1.18 0.30 0.97 MARC 1.37 0.05 1.33 AR 0.84 0.00 0.84 NI 1.95 0.00 1.95 AT 1.59 2.93 0.52 ORE 1.96 0.00 1.96
GEO 1.45 0.00 1.45 PX 1.27 0.22 1.10 HLCM 1.11 0.00 1.11 T 1.12 0.81 0.72
LC 2.03 0.01 2.01 UPM 1.79 0.00 1.79 MA 1.42 0.00 1.42 VUL 0.71 0.00 0.71
Real Estate ABA 0.57 0.12 0.53 MRC 1.17 0.01 1.16 ALI 1.26 0.28 1.06 OM 1.15 0.00 1.15 BEL 1.10 0.23 0.95 RLC 1.39 0.43 1.06 BRN 0.63 0.70 0.42 RLT 1.28 0.06 1.22 CHI 0.84 0.65 0.57 SHNG 0.78 0.80 0.50 ELI 1.17 0.18 1.04 SLI 1.08 0.73 0.72 FDC 1.36 1.67 0.63 SMPH 0.73 0.18 0.65 FLI 1.55 1.33 0.80 VLL 1.64 1.08 0.94
GERI 1.39 0.37 1.11 WIN 0.67 0.00 0.67 MEG 1.94 0.53 1.42
106 Stock Market Betas for Cyclical and Defensive Sectors: A Practitioner’s Perspective
Table 3. Computed Equity/Asset Betas for Defensive Companies
DEFENSIVE COMPANIES Ticker Equity β D/E Asset β Ticker Equity β D/E Asset β
Consumer Staples COSCO 1.00 0.21 0.88 RFM 1.05 0.03 1.03 FOOD 0.40 0.01 0.40 URC 1.15 0.12 1.07 GSMI 0.62 1.75 0.28 VITA 0.77 0.00 0.76 PIP 1.28 0.33 1.04
Energy BSC 0.83 0.00 0.83 PERC 0.66 0.04 0.65 OPM 1.03 0.00 1.03 PNX 1.01 1.07 0.58 OV 1.21 0.00 1.21 SCC 0.70 0.10 0.65
PCOR 0.38 1.86 0.16 Telecommunication Services
GLO 0.66 0.40 0.52 TEL 0.85 0.45 0.65 Utilities
ACR 1.46 1.88 0.63 LPZ 1.69 4.87 0.38 AP 0.68 0.74 0.45 MER 1.08 0.14 0.99
EDC 0.96 0.61 0.67 MWC 0.63 0.56 0.45 FGEN 1.19 0.04 1.16 PHEN 1.05 0.73 0.69 FPH 1.25 4.18 0.32
Table 4. One-Sample T-test Results for Cyclical and Defensive Betas (GICS-based)
Cyclical Betas
Mean 0.95207
Variance 0.17290
Observations 73
Hypothesized Mean 1
df 72
t Stat (0.98489)
P(T<=t) one-tail 0.16399
t Critical one-tail 1.66629
Defensive Betas
Mean 0.69953
Variance 0.08609
Observations 25
Hypothesized Mean 1
df 24
t Stat (5.12031)
P(T<=t) one-tail 0.00002
t Critical one-tail (1.71088)
5 Analysis of Results
5.1 Cyclical Companies The computed mean asset beta (MAB) for cyclical companies was 0.95, with a variance of 0.17
and standard deviation of 0.42. Out of the six industry groups comprising the Cyclical industry sector, only the Materials (14 companies, MAB 1.28) and Industrials (13 companies, MAB 1.03) industry groups exhibited MABs greater than 1. The Information Technology (2 companies, MAB 0.89) and Real Estate (19 companies, MAB 0.87) industry groups exhibited MABs slightly less than 1.
The Consumer Discretionary (8 companies) industry group exhibited the lowest MAB at 0.71, headlined by media and entertainment companies ABS (0.52) and GMA7 (0.72), as well as fast food giant JFC (0.67). Finally, the Financials (17 companies) industry group exhibited the second-lowest
One-sample t-test for cyclical betas 𝑯𝟎: 𝛽𝑎𝑠𝑠𝑒𝑡 ≤ 1 , 𝑯𝒂: 𝛽𝑎𝑠𝑠𝑒𝑡 > 1
Conclusion: DO NOT REJECT NULL 𝛽𝑎𝑠𝑠𝑒𝑡 is not significantly > 1 One-sample t-test for defensive betas 𝑯𝟎: 𝛽𝑎𝑠𝑠𝑒𝑡 ≥ 1 , 𝑯𝒂: 𝛽𝑎𝑠𝑠𝑒𝑡 < 1
Conclusion: REJECT NULL 𝛽𝑎𝑠𝑠𝑒𝑡 is significantly < 1

Mark Adrian S. Asinas 107
MAB at 0.84, with major financial institutions such as BPI (0.75), CHIB (0.41), MBT (0.85), RCB (0.71), and SECB (0.54) all with asset betas less than 1.
It was noted that a few companies included in the study currently do not have operations, such as LIHC (Financials group), and GEO, UPM, and VUL (Materials group). However, testing the MAB computations excluding these companies do not significantly change the results, with the Materials group’s MAB barely unchanged from 1.28 to 1.27 and the Financial group’s MAB further declining from 0.84 to 0.81.
5.2 Defensive Companies The computed mean asset beta (MAB) for defensive companies was 0.70, with a variance of 0.09
and standard deviation of 0.29. All four industry groups (no Health Care companies were included in the study) comprising the Defensive industry sector – Consumer Staples (7 companies, MAB 0.78), Energy (7 companies, MAB 0.73), Utilities (9 companies, MAB 0.64), and Telecommunication Services (2 companies, MAB 0.58) – exhibited MABs less than 1, which is consistent with expectations.
5.3 Sector Earnings Variability and Mean Asset Beta Based on the above, the mean asset betas for four cyclical sectors – Consumer Discretionary,
Financials, Information Technology, and Real Estate – were not found to be greater than 1.0 as expected. A possible explanation for this counter-intuitive behavior is that while they are classified as cyclical sectors, companies within those sectors may exhibit defensive characteristics, most especially in terms of earnings variability relative to the overall economy. Note that the GICS methodology – as it classified cyclical and defensive sectors using stock returns – does not explicitly consider the earnings variability of the companies.
As such, additional procedures were conducted in order to see whether sector earnings variability can be related to the observed mean asset betas for each sector:
1. Quarterly earnings starting March 31, 1999 (earliest available data) of the selected firms in the four cyclical sectors and in the defensive sectors were obtained, and quarter-on-quarter % changes were computed.
2. For the four cyclical sectors, the percentage changes were averaged across the firms within the same sector. Each firm was given equal weight in computing the mean quarterly earnings % change per sector, for consistency with the equal weighting in determining the mean asset beta.
3. For the defensive sectors, the percentage changes were averaged across all firms in all sectors for purposes of determining a “defensive earnings variability” benchmark. Each firm was also given equal weight in computing the mean quarterly earnings % change.
4. Corresponding quarterly levels of the PSEi were obtained, and quarter-on-quarter % changes were computed.
5. The computed mean quarterly earnings % change per cyclical sector was correlated against the quarterly % change in the PSEi.
6. The computed mean quarterly earnings % change for the defensive sectors was correlated against the quarterly % earnings change in the PSEi.
The results of the correlation analysis are as follows:
Table 5. Sector Earnings Correlation against PSEi
Sector Correlation Coefficient
Consumer Discretionary -0.023 Financials 0.078 Information Technology 0.020 Real Estate 0.032 Defensive Average 0.057
The above results showed that three out of the four cyclical sectors displayed earnings variability
relative to PSEi performance below the defensive average (which, as expected, shows only a very

108 Stock Market Betas for Cyclical and Defensive Sectors: A Practitioner’s Perspective
weak positive correlation), while the Financials sector was above the defensive average but still exhibited weak correlation against the economy. The above procedure illustrates that earnings variability may help explain why the above cyclical sectors all have MABs lower than 1.0, which are consistent with defensive sector averages.
5.4 Cyclical/Defensive Reclassification Based on Earnings Variability Another way to check the impact of earnings variability is to ignore sectoral classifications and
simply group all companies with respect to their correlation of their earnings to economic performance, i.e., companies with quarterly earnings movements positively correlated to quarterly PSEi returns are classified as Cyclical, while companies with quarterly earnings movements negatively correlated to quarterly PSEi returns are classified as Defensive.
Based on this methodology, a total of 68 companies were classified as Cyclical and 30 companies were classified as Defensive. As with the original, sector-based methodology, one-sample t-tests at 5% significance were performed on the resulting asset betas in order to determine whether the coefficients are significantly different from the market beta of 1.0. The results of the t-tests are summarized below: Table 6. One-Sample T-test Results for Cyclical and Defensive Betas (Earnings-based)
Cyclical Betas
Mean 0.87000
Variance 0.18082
Observations 68
Hypothesized Mean 1
df 67
t Stat (2.52100)
P(T<=t) one-tail 0.00704
t Critical one-tail 1.66792
Defensive Betas
Mean 0.92633
Variance 0.11989
Observations 30
Hypothesized Mean 1
df 29
t Stat (1.16529)
P(T<=t) one-tail 0.12670
t Critical one-tail (1.69913)
The above test was inconclusive for both Cyclical and Defensive stocks (with Cyclical MAB
actually lower than the Defensive MAB), but the results may be attributable to the observation that the earnings correlations for both Cyclical and Defensive stocks may not be strong enough to exhibit significant differences from the market – average correlation for Cyclical stocks is +0.13, while average correlation for Defensive stocks is -0.08. Furthermore, specific earnings adjustments may be necessary for the stocks covered in the study.
Overall, earnings variability may indeed have an impact in the beta estimation for Cyclical and Defensive companies, although the magnitude of such impact is beyond the scope and objective of this paper.
One-sample t-test for cyclical betas 𝑯𝟎: 𝛽𝑎𝑠𝑠𝑒𝑡 ≤ 1 , 𝑯𝒂: 𝛽𝑎𝑠𝑠𝑒𝑡 > 1
Conclusion: DO NOT REJECT NULL 𝛽𝑎𝑠𝑠𝑒𝑡 is not significantly > 1 One-sample t-test for defensive betas 𝑯𝟎: 𝛽𝑎𝑠𝑠𝑒𝑡 ≥ 1 , 𝑯𝒂: 𝛽𝑎𝑠𝑠𝑒𝑡 < 1
Conclusion: DO NOT REJECT NULL 𝛽𝑎𝑠𝑠𝑒𝑡 is not significantly < 1

Mark Adrian S. Asinas 109
6 Conclusion
The business nature of a company provides a clue to the sensitivity of its operations to the economy, which is reflected in the asset beta of the company’s stock. However, as seen in the study, Cyclical companies on average do not conform to the practitioner’s industry asset beta sense-check of > 1, while Defensive companies on average are consistent with the sense-check of < 1.
The results of the study suggest that, in performing tests of reasonableness or practical, quick-and-dirty valuations, a reasonable asset beta estimate of 0.70 may be used for Defensive companies – or better yet, sector-specific MABs ranging from 0.60-0.80 depending on which defensive sector the subject company belongs in. Company-specific asset betas are usually not preferred as the basis for the beta estimate in the valuation process – Damodaran (2002) noted that “while regression betas are noisy and have large standard errors, averaging across regression betas reduces the noise in the estimate” (p. 29).
However, for Cyclical companies, the preferred approach is to dispense with a practical, rule-of-thumb estimate and instead focus on scrutinizing the company’s business closely to determine whether its beta estimate is reasonable or not. In particular, the analyst may examine accounting metrics such as earnings variability, which was empirically tested to be related to beta by Beaver, Kettler, and Scholes (1970) and updated by Jarvela, Kovyra, and Potter (2009)—although the 2009 study found weaker relationships relative to the 1970 study.
Other beta derivation procedures should also be refined. Instead of merely relying on sector classifications, particular care must be taken in filtering peer companies to be used in the asset beta determination for close comparability primarily in terms of business activities and size of operations. For holding companies and conglomerates, instead of using an overall beta estimate, segment betas should be used to capture the specific risks present in each business segment.
Overall, the analyst must watch out for company-specific phenomena and appreciate the nature and operations of the company in order to determine appropriate beta coefficients for valuation.

110 Stock Market Betas for Cyclical and Defensive Sectors: A Practitioner’s Perspective
References Applied Research MSCI. (2009). Sector performance across business cycles. MSCI Barra Research
Bulletin, November 2009. Retrieved from http://www.finance-inst.co.il/image/users/171540/ ftp/my_files/articles/international/%D7%94%D7%90%D7%9D%20%D7%99%D7%A9%20%D7%94%D7%91%D7%93%D7%9C%20%D7%91%D7%91%D7%99%D7%A6%D7%95%D7%A2%D7%99%D7%9D%20%D7%A9%D7%9C%20%D7%A1%D7%A7%D7%98%D7%95%D7%A8%D7%99%D7%9D%20%D7%A9%D7%95%D7%A0%D7%99%D7%9D%20%D7%91%D7%9E%D7%97%D7%96%D7%95%D7%A8%D7%99%20%D7%A2%D7%A1%D7%A7%D7%99%D7%9D%20%D7%A9%D7%95%D7%A0%D7%99%D7%9D201109.pdf?id=7714158
Ayala Corporation. (2018). 2017 Annual Report (SEC Form 17-A). Bacmann, J. F., Dubois, M., & Isakov, D. (2001). Industries, business cycle and profitability of
momentum strategies: An international perspective [Working paper]. Université de Neuchâtel. Baker, M., Bradley, B., & Wurgler, J. (2011). Benchmarks as limits to arbitrage: Understanding the
low-volatility anomaly. Financial Analysts Journal, 67(1), 40-54. Ball, R., & Brown, P. (1968). An empirical evaluation of accounting income numbers. Journal of
Accounting Research, 6, 159-177. Beaver, W.H., Kettler, P., & Scholes, M. (1970). The association between market-determined and
accounting-determined risk measures. The Accounting Review, (XLV)4, 654-682. Blitz, D., & Van Vliet, P. (2007). The volatility effect: Lower risk without lower return. Journal of
Portfolio Management, 34(1), 102-113. Damodaran, A. (2002). Estimating risk parameters [Working paper]. NYU Stern School of Business. Dechow, P., Sloan, R., & Zha, J. (2014). Stock prices and earnings: A history of research. Annual
Review of Financial Economics, 6(1), 343–363. Frazzini, A., & Pedersen, L.H. (2014). Betting against beta. Journal of Financial Economics, 111(1), 1-
25. GICS Sector Definitions. Retrieved from https://www.msci.com/documents/10199/4547797/
GICS+Sector+definitions-Sep+2016.pdf/7e5236a8-2ddd-4e29-a8bf-18f394c7f0fb Jarvela, M., Kozyra, J., & Potter, C. (2009). The relationship between market and accounting
determined risk measures: Reviewing and updating the Beaver, Kettler, Scholes (1970) study. College Teaching Methods & Styles Journal – Special Edition, 5(1), 1-9.
Metro Pacific Investments Corporation (2018). 2017 Annual Report (SEC Form 17-A). Novy-Marx, R. (2016). Understanding defensive equity [Working paper]. University of Rochester and
NBER. Reilly, F., & Brown, K. (2003). Investment analysis and portfolio management. Mason, Ohio: South-
Western/Thomson Learning. Solnik, B., & McLeavy, D. (2004). International investments. Salt Lake City: Pearson-Addison Wesley.

Mark Adrian S. Asinas 111
Appendix A Definition of GICS Sectors (effective September 1, 2016)3
Energy Sector The Energy Sector comprises companies engaged in exploration & production, refining & marketing, and storage & transportation of oil & gas and coal & consumable fuels. It also includes companies that offer oil & gas equipment and services. Materials Sector The Materials Sector includes companies that manufacture chemicals, construction materials, glass, paper, forest products and related packaging products, and metals, minerals and mining companies, including producers of steel. Industrials Sector The Industrials Sector includes manufacturers and distributors of capital goods such as aerospace & defense, building products, electrical equipment and machinery and companies that offer construction & engineering services. It also includes providers of commercial & professional services including printing, environmental and facilities services, office services & supplies, security & alarm services, human resource & employment services, research & consulting services. It also includes companies that provide transportation services. Consumer Discretionary Sector The Consumer Discretionary Sector encompasses those businesses that tend to be the most sensitive to economic cycles. Its manufacturing segment includes automotive, household durable goods, leisure equipment and textiles & apparel. The services segment includes hotels, restaurants and other leisure facilities, media production and services, and consumer retailing and services. Consumer Staples Sector The Consumer Staples Sector comprises companies whose businesses are less sensitive to economic cycles. It includes manufacturers and distributors of food, beverages and tobacco and producers of non-durable household goods and personal products. It also includes food & drug retailing companies as well as hypermarkets and consumer supercenters. Health Care Sector The Health Care Sector includes health care providers & services, companies that manufacture and distribute health care equipment & supplies, and health care technology companies. It also includes companies involved in the research, development, production and marketing of pharmaceuticals and biotechnology products. Financials Sector The Financials Sector contains companies involved in banking, thrifts & mortgage finance, specialized finance, consumer finance, asset management and custody banks, investment banking and brokerage and insurance. It also includes Financial Exchanges & Data and Mortgage REITs. Information Technology Sector The Information Technology Sector comprises companies that offer software and information technology services, manufacturers and distributors of technology hardware & equipment such as communications equipment, cellular phones, computers & peripherals, electronic equipment and related instruments, and semiconductors.
3 GICS Sector Definitions. Retrieved from https://www.msci.com/documents/10199/4547797/GICS+Sector+definitions-Sep+2016.pdf/7e5236a8-2ddd-4e29-a8bf-18f394c7f0fb

112 Stock Market Betas for Cyclical and Defensive Sectors: A Practitioner’s Perspective
Telecommunication Services Sector The Telecommunication Services Sector contains companies that provide communications services primarily through a fixed-line, cellular or wireless, high bandwidth and/or fiber optic cable network. Utilities Sector The Utilities Sector comprises utility companies such as electric, gas and water utilities. It also includes independent power producers & energy traders and companies that engage in generation and distribution of electricity using renewable sources. Real Estate Sector The Real Estate Sector contains companies engaged in real estate development and operation. It also includes companies offering real estate related services and Equity Real Estate Investment Trusts (REITs).

Mark Adrian S. Asinas 113
Appendix B Company Names and Tickers
CYCLICAL COMPANIES Ticker Company Name Ticker Company Name
Consumer Discretionary ABS ABS-CBN Corporation LR Leisure & Resorts World Corporation GMA7 GMA Network, Inc. PLC Premium Leisure Corp. JFC Jollibee Foods Corporation WEB PhilWeb Corporation LOTO Pacific Online Systems Corporation WPI Waterfront Philippines, Incorporated Financials AC Ayala Corporation MBT Metropolitan Bank & Trust Company APO Anglo Philippine Holdings Corporation MPI Metro Pacific Investments Corporation BDO BDO Unibank, Inc. PNB Philippine National Bank BKR Bright Kindle Resources & Investments Inc. PSE The Philippine Stock Exchange, Inc. BPI Bank of the Philippine Islands RCB Rizal Commercial Banking Corporation CEI Crown Equities, Inc. SECB Security Bank Corporation CHIB China Banking Corporation UBP Union Bank of the Philippines, Inc. COL COL Financial Group, Inc. V Vantage Equities, Inc. LIHC Lodestar Investment Holdings Corporation Industrials AEV Aboitiz Equity Ventures, Inc. IPM IPM Holdings, Inc. AGI Alliance Global Group, Inc. JGS JG Summit Holdings, Inc. ANS A. Soriano Corporation MAC MacroAsia Corporation APC APC Group, Inc. PAX Paxys, Inc. DMC DMCI Holdings, Inc. SM SM Investments Corporation EEI EEI Corporation SMC San Miguel Corporation ICT International Container Terminal Services,
Inc.
Information Technology GREEN Greenergy Holdings Incorporated ISM ISM Communications Corporation Materials APX Apex Mining Co., Inc. MARC Marcventures Holdings, Inc. AR Abra Mining and Industrial Corporation NI NiHAO Mineral Resources International, Inc. AT Atlas Consolidated Mining and Development
Corporation ORE Oriental Peninsula Resources Group, Inc.
GEO GEOGRACE Resources Philippines, Inc. PX Philex Mining Corporation HLCM Holcim Philippines, Inc. T TKC Metals Corporation LC Lepanto Consolidated Mining Company UPM United Paragon Mining Corporation MA Manila Mining Corporation VUL Vulcan Industrial & Mining Corporation Real Estate ABA AbaCore Capital Holdings, Inc. MRC MRC Allied, Inc. ALI Ayala Land, Inc. OM Omico Corporation BEL Belle Corporation RLC Robinsons Land Corporation BRN A Brown Company, Inc. RLT Philippine Realty and Holdings Corp. CHI Cebu Holdings, Incorporated SHNG Shang Properties, Inc. ELI Empire East Land Holdings, Inc. SLI Sta. Lucia Land, Inc. FDC Filinvest Development Corporation SMPH SM Prime Holdings, Inc. FLI Filinvest Land, Inc. VLL Vista Land & Lifescapes, Inc. GERI Global-Estate Resorts, Inc. WIN Wellex Industries, Incorporated MEG Megaworld Corporation

114 Stock Market Betas for Cyclical and Defensive Sectors: A Practitioner’s Perspective
DEFENSIVE COMPANIES Ticker Company Name Ticker Company Name
Consumer Staples COSCO Cosco Capital, Inc. RFM RFM Corporation FOOD Alliance Select Foods International, Inc. URC Universal Robina Corporation GSMI Ginebra San Miguel, Inc. VITA Vitarich Corporation PIP Pepsi-Cola Products Philippines, Inc. Energy BSC Basic Energy Corporation PERC PetroEnergy Resources Corporation OPM Oriental Petroleum and Minerals
Corporation PNX Phoenix Petroleum Philippines, Inc.
OV The Philodrill Corporation SCC Semirara Mining and Power Corporation PCOR Petron Corporation Telecommunication Services GLO Globe Telecom, Inc. TEL PLDT Inc. Utilities ACR Alsons Consolidated Resources, Inc. LPZ Lopez Holdings Corporation AP Aboitiz Power Corporation MER Manila Electric Company EDC Energy Development Corporation MWC Manila Water Company, Inc. FGEN First Gen Corporation PHEN PHINMA Energy Corporation FPH First Philippine Holdings Corporation