stocks 2010 the investor's guide to the year ahead
TRANSCRIPT
STOCKS 2010The Investor’s Guide to the Year Ahead
Published by
The Motley Fool, LLC2000 Duke Street, Alexandria, VA 22314, USAPublished November 2009
The studies in this book are not complete analyses of every material fact regarding any company, industry, or investment, and they are not “buy” or “sell” recommendations. The opinions expressed here are subject to change without notice, and the authors and The Motley Fool, LLC, make no warranty or representations as to their accuracy, usefulness, or entertainment value. Data and statements of facts were obtained from or based upon publicly available sources that we believe are reliable, but the individual authors and publisher reserve the right to be wrong, stupid, or even foolish (with a small “f”). It is sold with the understanding that the authors and publisher are not engaged in rendering financial or other professional services. Readers should not rely on this (or any other) publication for financial guidance, but should do their own homework and make their decisions. Remember, past results are not necessarily an indication of future performance.
The authors and publisher specifically disclaim any responsibility for any liability, loss, or risk, personal or otherwise, incurred as a consequence, directly or indirectly, of the use and application of any of the contents of this book.
Copyright © 2009 The Motley Fool, LLC. All rights reserved.
The Motley Fool, Fool, Foolish, Hidden Gems, Rule Breakers, and the Jester logo are registered trademarks and Rule Makers is a trademark of The Motley Fool Holdings, Inc.
Published in the United States of America
Without limiting the rights under copyright reserved above, no part of this publication may be reproduced or distributed in any form or by any means, or stored in a database or retrieval system, without the prior written permission of The Motley Fool.
Editor: Kate Herman
Financial Editor: Todd Wenning
Publishing Manager: Adrienne Perryman
Design and Production: Sara Klieger
Cover Design: Dari Fitzgerald

STOCKS 2010
Contents
t h e m o t l e y f o o l | S t o c k S 2 0 1 0 : t h e I n v e s t o r ’ s G u I d e t o t h e y e a r a h e a d | p a G e I I I
I n t r o d u c t I o n . . . . . . . . . . . . . . . . . . . . . . . . . . . . . . . . . . . . . . . . . . . . . . . . . . . . . . . . . . . . . . . . . . . . . . . . . I vb y t o d d w e n n i n g
B d : A h e A lt h - c A r e p l Ay t h At ’s w o r t h t h e r I s k . . . . . . . . . . . . . . . . . . . . . . . . 1b y m i c h a e l o l s e n
c h I n A M o B I l e : d I A l u p s u cc e s s f o r yo u r p o r t f o l I o . . . . . . . . . . . . . . . . . . . . . . . . . . . . . . . . . . 4b y t i m h a n s o n
co M pA s s M I n e r A l s : d I g g I n g d e e p f o r d I v I d e n d g o l d . . . . . . . . . . . . . . . . . . . . . . . . . . . . . . . . . . . . . . . . 7b y j a m e s e a r l y
d e v o n e n e r g y: g e n e r At e r e t u r n s yo u c A n co u n t o n . . . . . . . . . . . . . . . . . . . . . . . . . . . . . . . 10b y p h i l i p d u r e l l
h I l l e n B r A n d : A f u n e r A l B u s I n e s s w I t h c Au s e to c e l e B r At e . . . . . . . . . . . . . . . . . . 12b y t o d d w e n n i n g
n I k e : s w o o s h ! t h At ’s t h e s o u n d o f s u cc e s s . . . . . . . . . . . . . . . . . . . . . . . . . . . . . 15b y a l e x s c h e r e r, c f a
o l I n co r p.: A n I n v e s t M e n t to f I r e u p yo u r p o r t f o l I o . . . . . . . . . . . . . . . . . . . . . . . 18b y r o n g r o s s
s o M A n e t I c s : A M e d I c A l t r A I l B l A z e r c l e A r s A pAt h to r e t u r n s . . . . . . . . . . . 20b y j i m g i l l i e s
tA k e - t w o I n t e r Ac t I v e : A t u r n A r o u n d tA l e s co r e s B I g . . . . . . . . . . . . . . . . . . . . . . . . . . . . . . . . . . . . . . . . . 23b y d a v i d g a r d n e r a n d t i m b e y e r s
y u M B r A n d s : t h e s e s h A r e s A r e A tA s t y t r e At . . . . . . . . . . . . . . . . . . . . . . . . . . . . . . . . . . . . . . . . 26b y j o e m a g y e r

p a G e I v | t h e m o t l e y f o o l | S t o c k S 2 0 1 0 : t h e I n v e s t o r ’ s G u I d e t o t h e y e a r a h e a d
STOCKS 2010
Introductionby tODD WENNING
deAr fellow fool,There’s another bubble brewing right under our noses.Investors, despite fresh memories of two equity bubbles in the
matter of a decade, continue to make highly emotional decisions when it comes to investing. This new bubble, however, is not in the stock market.
It’s in the bond market.Through October, investors have sent $306 billion to bond
mutual funds, while withdrawing more than $20 billion from equity funds.
When the herd moves in such a pronounced way, prudent investors must ask themselves: “Why is everyone doing this?” And more important: “How can I profit from it?”
the whysIt’s easy to see why people would seek relative refuge in the
less-volatile bond market — we’ve seen this before, as recently as the dot-com crash at the turn of this century. But as nauseating as those days were, it’s the latest bust that has really shaken equity investors to the core.
Leading up to last year’s crash, individuals on the whole were overexposed to the more volatile equities and real estate markets. In fact, a 2008 survey done by the Investment Company Institute found that 35% of households whose head is 65 or older had more than 51% of their financial assets in equities, and just 7% of them had more than 50% in bonds.
The financial impact was simply devastating to those approaching retirement. Between 2004 and 2009, the median household whose heads were between the ages of 45 to 54 lost 45% of their net worth; those aged 55 to 64 saw half of their net worth evaporate.
It’s no wonder, then, why investors needed to undergo a serious reexamination of their risk tolerance, lest the economy hit the brakes again and really put them into dire straits.
It’s human nature, of course, to be once-bitten, twice-shy — and it’s a good thing for investors to be honest about their unique risk tolerance. But flocking en masse to bonds after the crash could be just as disastrous as being underexposed to bonds before the crash.
A MAtter of tIMeWarren Buffett’s two golden rules of investing are:
Never lose money.1. Never forget rule No.1.2.
What’s missing from this clever axiom is, “By when?” If you don’t want to lose money today, you simply save it — but over time, inflation will eat away the value of today’s dollar saved. That dollar needs to be invested if you plan to not lose purchasing power down the road.
And while bonds can and should play a role in a balanced portfolio, they can’t do it alone. According to data from Wharton Professor Jeremy Siegel, bonds averaged a real return of just under 2% from 1900-2003. Stocks, by contrast, averaged just over 6%.
Moreover, just as is the case with buying stocks, when it comes to buying bonds, price is what you pay, and value is what you get. This year’s flood into fixed income has driven bond yields, which move inversely to prices, to absurd levels. Consider that a McDonald’s (NYSE: MCD) bond maturing in 2019 recently quoted a yield-to-maturity of 3.98%. Meanwhile, McDonald’s dividend yield was 3.8%.
Call me crazy, but I think if you invested equal amounts in the bond and the stock and locked both away until 2019, you’d be more satisfied with the ultimate results of the stock. With the McDonald’s stock, not only would you receive a comparable income stream to the bond — indeed, McDonald’s will likely increase its dividend payout at least once during this period — but you’d also be entitled to a share of McDonald’s profit growth.
Sadly, this example is not unique today. This environment, in which a number of high-quality companies’ 10-year bonds are yielding about the same as the stock dividend, is unsustainable. The fact is that interest rates have only one way to go from zero. As the global economy begins to recover, central bankers will be under mounting pressure to increase rates in order to fend off inflation from the trillions spent on stimulus programs during the recession. And since bond prices decline when interest rates rise, you don’t want to be holding longer-term bonds if you believe we’re on the road to economic recovery. Like any bubble, it too will burst. we Must protect thIs house
Your Foolish advisors and analysts felt the slings and arrows of last winter’s stock market panic right alongside you. If anything, the panic and subsequent rally reinforced our belief that the best time to be buying stocks is when other people aren’t. Today, with hundreds of billions being redirected to an already overbought bond market, it’s still a good time — despite the recent rally — to give stocks more attention.
This report features 10 quality companies from diverse industries — funeral products, video games, medical companies, and more — and their growth profiles, from the slow-and-steady to the full-steam ahead. So no matter what type of companies you prefer, you’ll be sure to enjoy Stocks 2010.
And no matter what the markets may throw our way in the coming years, always remember: Stay focused. Stay patient. Stay Foolish.
Foolish best,
Todd Wenning
t h e m o t l e y f o o l | S t o c k S 2 0 1 0 : t h e I n v e s t o r ’ s G u I d e t o t h e y e a r a h e a d | p a G e v
STOCKS 2010
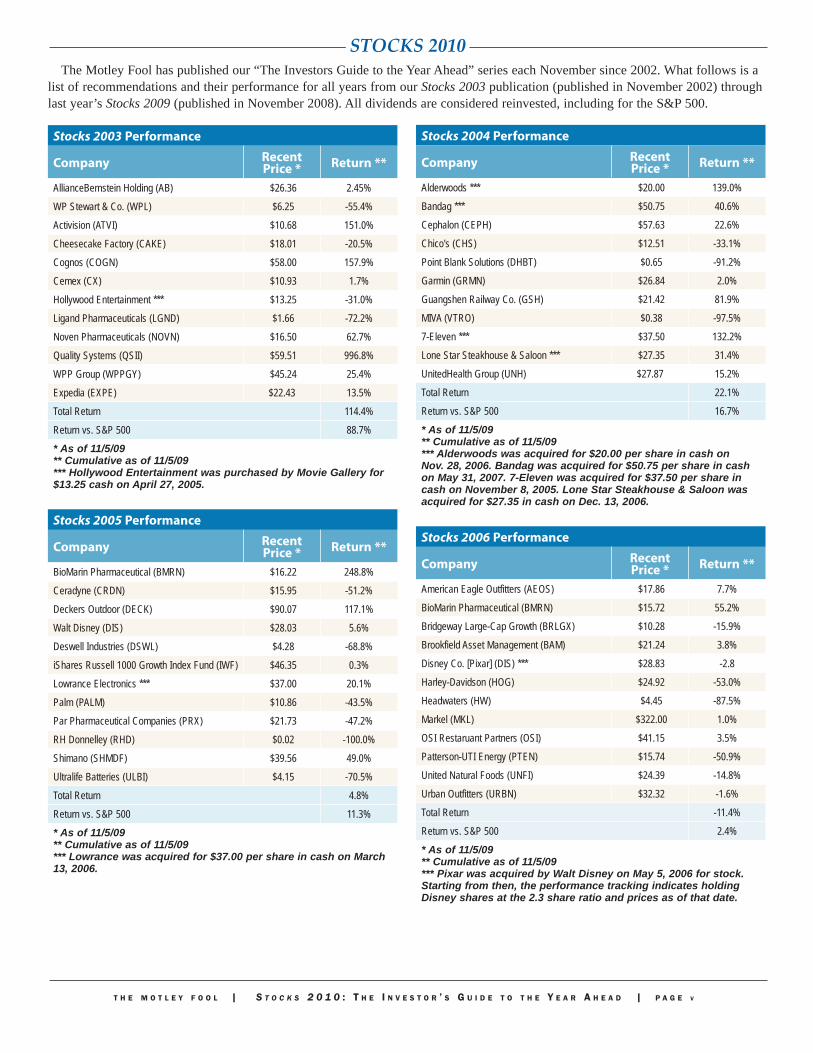
Stocks 2003 performance
company recent price * return **
AllianceBernstein Holding (AB) $26.36 2.45%
WP Stewart & Co. (WPL) $6.25 -55.4%
Activision (ATVI) $10.68 151.0%
Cheesecake Factory (CAKE) $18.01 -20.5%
Cognos (COGN) $58.00 157.9%
Cemex (CX) $10.93 1.7%
Hollywood Entertainment *** $13.25 -31.0%
Ligand Pharmaceuticals (LGND) $1.66 -72.2%
Noven Pharmaceuticals (NOVN) $16.50 62.7%
Quality Systems (QSII) $59.51 996.8%
WPP Group (WPPGY) $45.24 25.4%
Expedia (EXPE) $22.43 13.5%
Total Return 114.4%
Return vs. S&P 500 88.7%* As of 11/5/09** Cumulative as of 11/5/09*** Hollywood Entertainment was purchased by Movie Gallery for $13.25 cash on April 27, 2005.
Stocks 2005 performance
company recent price * return **
BioMarin Pharmaceutical (BMRN) $16.22 248.8%
Ceradyne (CRDN) $15.95 -51.2%
Deckers Outdoor (DECK) $90.07 117.1%
Walt Disney (DIS) $28.03 5.6%
Deswell Industries (DSWL) $4.28 -68.8%
iShares Russell 1000 Growth Index Fund (IWF) $46.35 0.3%
Lowrance Electronics *** $37.00 20.1%
Palm (PALM) $10.86 -43.5%
Par Pharmaceutical Companies (PRX) $21.73 -47.2%
RH Donnelley (RHD) $0.02 -100.0%
Shimano (SHMDF) $39.56 49.0%
Ultralife Batteries (ULBI) $4.15 -70.5%
Total Return 4.8%
Return vs. S&P 500 11.3%* As of 11/5/09** Cumulative as of 11/5/09*** Lowrance was acquired for $37.00 per share in cash on March 13, 2006.
Stocks 2004 performance
company recent price * return **
Alderwoods *** $20.00 139.0%
Bandag *** $50.75 40.6%
Cephalon (CEPH) $57.63 22.6%
Chico's (CHS) $12.51 -33.1%
Point Blank Solutions (DHBT) $0.65 -91.2%
Garmin (GRMN) $26.84 2.0%
Guangshen Railway Co. (GSH) $21.42 81.9%
MIVA (VTRO) $0.38 -97.5%
7-Eleven *** $37.50 132.2%
Lone Star Steakhouse & Saloon *** $27.35 31.4%
UnitedHealth Group (UNH) $27.87 15.2%
Total Return 22.1%
Return vs. S&P 500 16.7%* As of 11/5/09** Cumulative as of 11/5/09*** Alderwoods was acquired for $20.00 per share in cash on Nov. 28, 2006. Bandag was acquired for $50.75 per share in cash on May 31, 2007. 7-Eleven was acquired for $37.50 per share in cash on November 8, 2005. Lone Star Steakhouse & Saloon was acquired for $27.35 in cash on Dec. 13, 2006.
Stocks 2006 performance
company recent price * return **
American Eagle Outfitters (AEOS) $17.86 7.7%
BioMarin Pharmaceutical (BMRN) $15.72 55.2%
Bridgeway Large-Cap Growth (BRLGX) $10.28 -15.9%
Brookfield Asset Management (BAM) $21.24 3.8%
Disney Co. [Pixar] (DIS) *** $28.83 -2.8
Harley-Davidson (HOG) $24.92 -53.0%
Headwaters (HW) $4.45 -87.5%
Markel (MKL) $322.00 1.0%
OSI Restaruant Partners (OSI) $41.15 3.5%
Patterson-UTI Energy (PTEN) $15.74 -50.9%
United Natural Foods (UNFI) $24.39 -14.8%
Urban Outfitters (URBN) $32.32 -1.6%
Total Return -11.4%
Return vs. S&P 500 2.4%* As of 11/5/09** Cumulative as of 11/5/09*** Pixar was acquired by Walt Disney on May 5, 2006 for stock. Starting from then, the performance tracking indicates holding Disney shares at the 2.3 share ratio and prices as of that date.
The Motley Fool has published our “The Investors Guide to the Year Ahead” series each November since 2002. What follows is a list of recommendations and their performance for all years from our Stocks 2003 publication (published in November 2002) through last year’s Stocks 2009 (published in November 2008). All dividends are considered reinvested, including for the S&P 500.
p a G e v I | t h e m o t l e y f o o l | S t o c k S 2 0 1 0 : t h e I n v e s t o r ’ s G u I d e t o t h e y e a r a h e a d
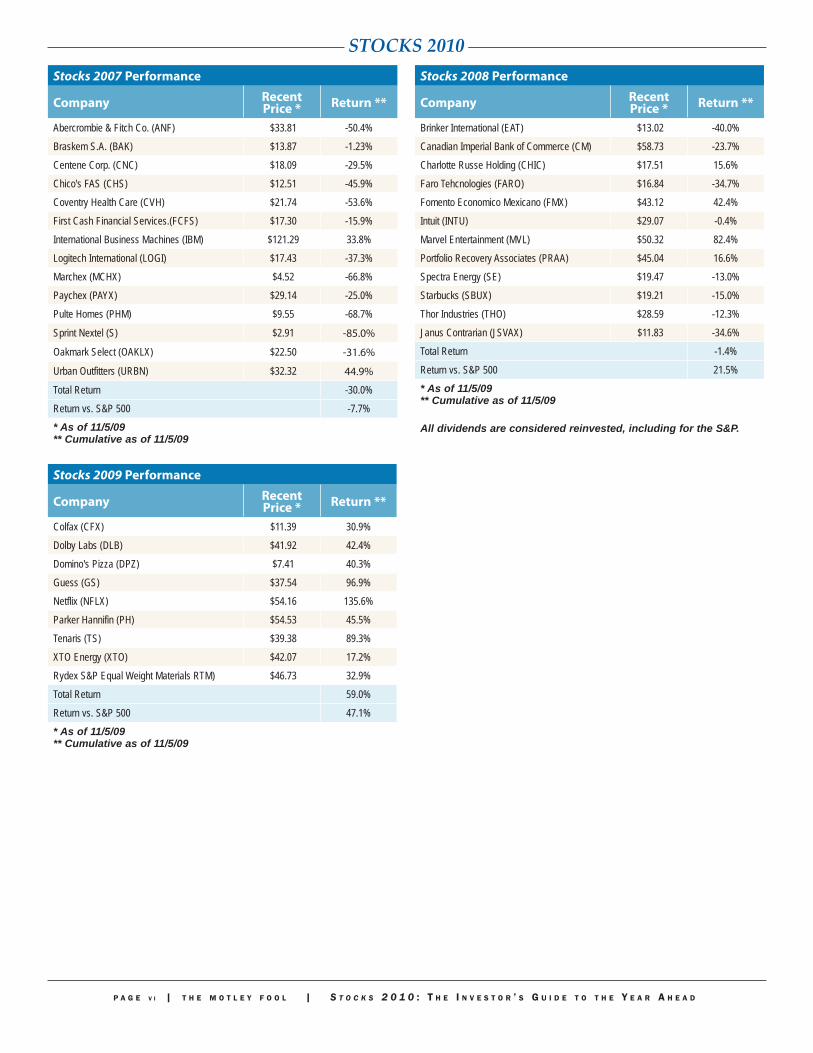
STOCKS 2010Stocks 2007 performance
company recent price * return **
Abercrombie & Fitch Co. (ANF) $33.81 -50.4%
Braskem S.A. (BAK) $13.87 -1.23%
Centene Corp. (CNC) $18.09 -29.5%
Chico's FAS (CHS) $12.51 -45.9%
Coventry Health Care (CVH) $21.74 -53.6%
First Cash Financial Services.(FCFS) $17.30 -15.9%
International Business Machines (IBM) $121.29 33.8%
Logitech International (LOGI) $17.43 -37.3%
Marchex (MCHX) $4.52 -66.8%
Paychex (PAYX) $29.14 -25.0%
Pulte Homes (PHM) $9.55 -68.7%
Sprint Nextel (S) $2.91 -85.0%
Oakmark Select (OAKLX) $22.50 -31.6%
Urban Outfitters (URBN) $32.32 44.9%
Total Return -30.0%
Return vs. S&P 500 -7.7%* As of 11/5/09** Cumulative as of 11/5/09
Stocks 2009 performance
company recent price * return **
Colfax (CFX) $11.39 30.9%
Dolby Labs (DLB) $41.92 42.4%
Domino's Pizza (DPZ) $7.41 40.3%
Guess (GS) $37.54 96.9%
Netflix (NFLX) $54.16 135.6%
Parker Hannifin (PH) $54.53 45.5%
Tenaris (TS) $39.38 89.3%
XTO Energy (XTO) $42.07 17.2%
Rydex S&P Equal Weight Materials RTM) $46.73 32.9%
Total Return 59.0%
Return vs. S&P 500 47.1%* As of 11/5/09** Cumulative as of 11/5/09
Stocks 2008 performance
company recent price * return **
Brinker International (EAT) $13.02 -40.0%
Canadian Imperial Bank of Commerce (CM) $58.73 -23.7%
Charlotte Russe Holding (CHIC) $17.51 15.6%
Faro Tehcnologies (FARO) $16.84 -34.7%
Fomento Economico Mexicano (FMX) $43.12 42.4%
Intuit (INTU) $29.07 -0.4%
Marvel Entertainment (MVL) $50.32 82.4%
Portfolio Recovery Associates (PRAA) $45.04 16.6%
Spectra Energy (SE) $19.47 -13.0%
Starbucks (SBUX) $19.21 -15.0%
Thor Industries (THO) $28.59 -12.3%
Janus Contrarian (JSVAX) $11.83 -34.6%
Total Return -1.4%
Return vs. S&P 500 21.5%* As of 11/5/09** Cumulative as of 11/5/09
All dividends are considered reinvested, including for the S&P.

t h e m o t l e y f o o l | S t o c k S 2 0 1 0 : t h e I n v e s t o r ’ s G u I d e t o t h e y e a r a h e a d | p a G e 1
STOCKS 2010
BD: A Health-Care Play That’s Worth the Risk
by MIchaEl OlsEN
Bd
NYSE: BDXHeadquarters: Franklin Lakes, N.J.www.bd.com
fInAncIAl snApshot
Recent Price:. . . . . . . . . . . . . . . . . . . . . . . . .$71.87Market Cap: . . . . . . . . . . . . . . . . . . . $17.2 billionDividend Yield: . . . . . . . . . . . . . . . . . . . . . . . 1.9%CAPS Rating:. . . . . . . . . . . . . . . . . . . . . . . . .5 StarsBuy guidance:. . . . . . . . . . . . . . . . Below $75Data as of 11/10/09
why Buy
Health-care reform or not, this is a »reliable way to invest in health care.
BD boasts a history of medical »innovation and high returns on capital.
The price is right thanks to widespread »concerns about the economy and health-care reform.
I learned two things early in my childhood: Avoid sharp objects and hot surfaces. They mean you no good. That’s fine advice for kids, but now that I’m an adult who makes a living as an investor, I have to say: I’m drawn to edgy things and the fiery lure of the metaphorical stove. The specter of being burnt, cut, or otherwise bruised affords opportunity in investing, where fear manifests itself not in scars, but in discounted securities.
So I present BD (NYSE: BDX), a stock that looks a little hairy given the consternation surrounding health-care reform and a still-wounded economy. But it actually isn’t. Remember, to make money in a gold rush, you should sell picks and shovels. And BD is a picks-and-shovels play on health care.
BD makes medical necessities — scalpels, diagnostic tools, and equipment that help PhD-types look at cells. It’s a company whose products serve a critical and continuous need — think insulin systems and blood-collection services. Companies cut from this mold rarely come at good prices, but today, this one does — and we’re getting a deal.
the coMpAnyBecton, Dickinson & Co. was born of a handshake between businessmen more than
century ago. Eight months later, it made its first sale: a glass syringe for $2.50 (about $70 in today’s money). BD has since evolved into a global behemoth, ringing up $7.2 billion in sales over the past 12 months.
BD’s products help medical professionals do their jobs better. Think of it as a critical, and somewhat under-the-radar, backbone to the worldwide health-care infrastructure. BD remains keenly focused on two things: R&D and return on invested capital. That focus has created an enviable core business, its medical franchise. The business is fairly simple: BD makes scalpels, needles, IVs, syringes, prefilled drug delivery systems (essentially, IVs with drugs in them), and so on. As consequence of their ubiquity, these products enjoy steady demand and recurring purchases. BD’s focus on safety-engineered products and innovation has secured its position as a market leader.
Now, meet the Medical business’ brothers, Diagnostic and Biosciences. The diagnostic division manufactures products for the safe collection and transport of medical specimens, as well as instruments and substances used to spot cancer and other infectious diseases. The products and their revenue streams vary: Some are recurring, others are one-time in nature, and still others are of the razor-and-blade variety, where customers buy an initial system and then continually replenish its supplies. All of the products serve the same purpose: finding and diagnosing health problems, or a lack thereof. Like its medical-division counterpart, BD’s diagnostics business holds a market-leading position.
The biosciences group is the baby of the trio, but it’s an important member of the BD family. It makes flow cytometry instruments, among others. You know what those are, right? Not to worry — all you need to know is that these and other bioscience products are used by clinical researchers, lab researchers, and other folks in white coats to look at cells’ innards. The insights help them understand diseases, develop vaccines, and become smarter on sickness.

p a G e 2 | t h e m o t l e y f o o l | S t o c k S 2 0 1 0 : t h e I n v e s t o r ’ s G u I d e t o t h e y e a r a h e a d
STOCKS 2010why Invest?
Nestled firmly in the health-care industry, BD is a blue chip in a sector that’s only getting bigger. From its safer tools to diagnostic innovations to lab materials, BD is at the heart of medicine. Its robust returns on capital, commitment to research and development, and relationships have kept it at the head of its class, and it shows no signs of slowing down.
The company’s early success in safety-engineered needles and syringes earned it critical sales mass, robust returns on investment, and the ability to fuel its R&D machine. That monster has fed itself from there. Better products beget more sales, more R&D, and economies of scale, which in turn have discouraged competition, whittling the industry to an oligopoly of sorts with the likes of Roche Holding (OTC: RHHBF.PK), Abbott Laboratories (NYSE: ABT), Sanofi-Aventis (NYSE: SNY), and Eli Lilly (NYSE: LLY).
What’s left is a cash cow — BD’s medical business — with delightful predictability that has helped BD expand into the diagnostics and bioscience sphere. These are attractive, high-return businesses serving similar, unwaveringly necessary ends: improving products and processing for patients and practitioners. It’s also a business that does what many comparable firms can’t — contain costs while consistently earning high returns on capital.
Alongside that consistent profitability, BD offers a compelling opportunity in emerging markets. Its medical business is fairly mature in developed markets, so it took its R&D ethos and proficiency on the road. BD has aggressively pursued the adoption of safety-engineered technologies in these new markets, opening growth avenues. Further, a push toward improved health standards in emerging markets makes for a key growth venue in BD’s biosciences division. With help from acquisitions, sales are up 60%, and operating profits doubled in the past five years — and today, 55% of sales come from outside the United States.
It’s a rare day when the market hands these enterprises out cheap — but today’s that day.
fInAncIAls And vAluAtIonThe 800-pound gorilla for a potential BD investor is pending
health-care reform. A bill recently passed by the U.S. House of Representatives intends to subsidize universal coverage via a U.S.-market share-based tax on medical-device companies. BD, among others, would suffer if this bill passes — but the potential pain would be lessened by BD’s significant international sources of revenue, which aren’t considered in the House bill’s calculation of market share.
Also, BD shares have suffered the same ailments the rest of the market has. Still, doctors can hardly delay the purchase of scalpels, test kits, or IVs. Now consider that 53% of revenue comes from its medical division, the beneficiary of steady and recurring revenue. A decent chunk — 30% — comes from its
diagnostics group, which also enjoys some recurring revenue elements in test kits, reagents, and sample collection kits. The remaining 17% comes from BD’s biosciences division. These products are sensitive to the state of research budgets, government funding, and the economy at large. But, as we’ve said, they’re a fabulous growth opportunity — unfortunately, diseases won’t cure themselves, and BD is at the forefront of finding treatments that work.
BD’s research successes, economies of scale, and its products’ recurring revenue dynamics show in the numbers: Returns on invested capital have consistently hovered above 20%. Sales and operating profits have grown at 8% and 13.9%, respectively, for the past five years. Total debt-to-equity sits at a manageable 36%, and cash-on-hand covers about 70% of BD’s debt obligations.
So what’s it all worth? Let’s start with the big picture. As it stands, BD shares are priced as if the company will increase its cash flow just north of 4% in perpetuity. That’s pretty cheap, considering its annuity-like characteristics in developed markets and its emerging market potential.
I expect long-term revenue growth of 6% to 8%, on a combination of growth in its biosciences business, increased penetration in emerging markets, and steady-as-she-goes performance in developed markets. That’s just south of the company’s expectations of 7% to 9%. BD’s business has a significant manufacturing component, so I expect growth to come with margin expansion of about 100 basis points. At a 10.5% cost of equity, that gets us to $92 to $100 per share.
For good measure, let’s not forget that there are some 48 million uninsured Americans and a flurry of legislative activity under way to address that issue. To account for the possibility of legislation, I’ve done what makes most sense given very limited — and fluid — information: I’ve docked BD’s U.S. operating margins by 200 basis points, or 2 percentage points. Otherwise, my assumptions remain intact. And even by that conservative standard, the stock’s still worth about $90.
rIsks And when we’d sellThe principal risks here are straightforward: health-care
reform, a failure to invest in R&D, and well-resourced competitors. At current prices, I believe any risks related to health-care reform are reflected in the price. Similarly, a failure to invest in R&D may erode the very root of BD’s competitive advantage: product innovation and scale. If the company curtailed R&D to such an extent that product quality suffered and customers defected, I’d sell. I take heart in management’s record of savvy capital allocation and the consistency of returns on invested capital, though, and am still comfortable despite these risks.
As for the competitive landscape, the diagnostics and biosciences realms are populated by some very well-heeled
t h e m o t l e y f o o l | S t o c k S 2 0 1 0 : t h e I n v e s t o r ’ s G u I d e t o t h e y e a r a h e a d | p a G e 3
STOCKS 2010challengers. Because all parties enjoy a favorable competitive dynamic and high returns, it wouldn’t make great sense for them to do anything that might reduce returns — but if it happens, BD could end up on the wrong end of the stick. A lot of big boys play here.
the foolIsh BottoM lIneA slightly charred exterior can mask what actually matters.
In BD, a remarkably stable operation sells at a nice discount to its prospects. BD offers three things: blue-chip innovation, a stalwart play on health care, and fabulous growth prospects strapped to a cash cow. Forget the childhood advice on this one — it’s worth a little risk to have BD in your portfolio.
Michael Olsen is a senior analyst for Hidden Gems, the Fool’s small-cap stocks investing service.
STOCKS 2010
p a G e 4 | t h e m o t l e y f o o l | S t o c k S 2 0 1 0 : t h e I n v e s t o r ’ s G u I d e t o t h e y e a r a h e a d
China Mobile: Dial Up Success for Your Portfolio
by tIM haNsON
chInA MoBIle
NYSE: CHLHeadquarters: Hong Kongwww.chinamobileltd.com
fInAncIAl snApshot
Recent Price: . . . . . . . . . . . . . . . . . . . . . . . $47.75Market Cap: . . . . . . . . . . . . . . . . . $191.6 billionDividend Yield: . . . . . . . . . . . . . . . . . . . . . . . 3.5%CAPS Rating: . . . . . . . . . . . . . . . . . . . . . . . .5 StarsBuy guidance: . . . . . . . . . . . . . . . Below $51
Data as of 11/10/09
why Buy
China’s largest cell-phone service »provider has more than 70% market share and more than 99% coverage in China.
Investors today are focusing too much »on rival China Unicom’s introduction of the iPhone into the market and the declining margins associated with competition in tier 1 markets — but both concerns are overblown.
China Mobile dominates rural China, »which is the fastest-growing part of the country and a place with significant growth potential for minutes billed and value-added services.
“The iPhone is coming, the iPhone is coming!”
Given the market’s reaction to news that China Unicom (NYSE: CHU) would be introducing Apple’s (Nasdaq: AAPL) flagship product to China, one would think competitors like China Mobile (NYSE: CHL) are about to get crushed. But I expect China Mobile — the dominant player in China and owner of the world’s largest mobile network and subscriber base — to shrug off the iPhone challenge and go on reaping free cash flow for years to come.
My renegade perspective isn’t appreciated by the market today, so investors can buy shares of China Mobile for a price that significantly understates the value of the company’s network, brand, market dominance, and ability to generate cash flow. Let’s see if I can help you see things my way.
the coMpAnyChina Mobile defines China’s mobile telecommunications sector, with nearly 500
million customers, 72.4% market share, and 99.2% geographic coverage in China. The company was formed in 2000 when the mobile assets of state-owned China Telecom (NYSE: CHA), which retained dominance of the fixed-line business in China, were split off from the parent. Like China Telecom, China Mobile is state-owned, with government-run China Mobile Communications owning almost 75% of China Mobile’s outstanding equity. This structure has both benefits and drawbacks for the company, but because the government considers telecommunications a strategic sector like banking or national defense, I don’t expect it to change.
Due in part to that government influence, China Mobile is facing three main challenges. First, at the beginning of 2009, competitor China Unicom was awarded a license by the Ministry of Industry and Information Technology to operate the international 3G WCDMA network in China, while China Mobile was licensed to operate the Chinese TD-SCDMA 3G standard. The problem is that the TD-SCDMA standard is technologically inferior to WCDMA, which means China Mobile won’t have the best 3G network in China. The government owns 75% of China Mobile — so why would it put the company at a disadvantage? Because it’s looking to help consumers by increasing competition and reducing China Mobile’s market share.
Compounding that problem, China Unicom introduced the iPhone into China in October 2009 after signing an exclusive three-year agreement with Apple. Since the iPhone is a superior product that will be running on China Unicom’s superior 3G network, analysts expect China Unicom to steal some of China Mobile’s most profitable power users.
Finally, with the economic downturn, China Mobile has seen a drop in subscriber growth as well as a decline in profit margins as competition erodes its pricing power and consumers restrict their minutes of use per month (known in the industry as MOUs). This downward shift caused the company’s earnings for the first half of 2009 to come up short of analyst expectations.
Taken together, these challenges have soured the market on the stock and prompted a sell-off of more than 15% since mid-August. That gives us a compelling entry point
t h e m o t l e y f o o l | S t o c k S 2 0 1 0 : t h e I n v e s t o r ’ s G u I d e t o t h e y e a r a h e a d | p a G e 5
STOCKS 2010into a company that I expect to handle and even take advantage of these challenges.
why Invest?
Although China Unicom and China Telecom are becoming better competitors in the mobile space, China Mobile’s market share, customer base, and coverage network make it the best-in-class company with a stellar reputation for quality in China. This positioning provides significant growth potential as the Chinese cell-phone market continues its rapid development.
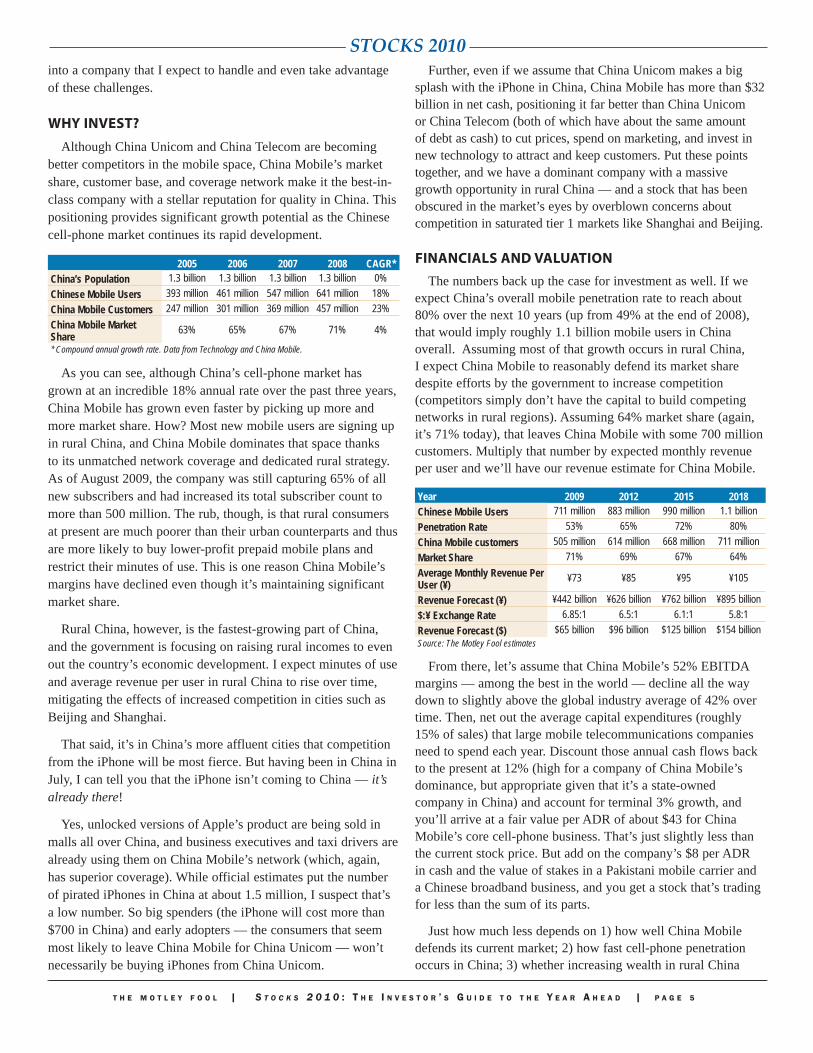
2005 2006 2007 2008 CAGR*China’s Population 1.3 billion 1.3 billion 1.3 billion 1.3 billion 0%Chinese Mobile Users 393 million 461 million 547 million 641 million 18%China Mobile Customers 247 million 301 million 369 million 457 million 23%China Mobile Market Share 63% 65% 67% 71% 4%
* Compound annual growth rate. Data from Technology and China Mobile.
As you can see, although China’s cell-phone market has grown at an incredible 18% annual rate over the past three years, China Mobile has grown even faster by picking up more and more market share. How? Most new mobile users are signing up in rural China, and China Mobile dominates that space thanks to its unmatched network coverage and dedicated rural strategy. As of August 2009, the company was still capturing 65% of all new subscribers and had increased its total subscriber count to more than 500 million. The rub, though, is that rural consumers at present are much poorer than their urban counterparts and thus are more likely to buy lower-profit prepaid mobile plans and restrict their minutes of use. This is one reason China Mobile’s margins have declined even though it’s maintaining significant market share.
Rural China, however, is the fastest-growing part of China, and the government is focusing on raising rural incomes to even out the country’s economic development. I expect minutes of use and average revenue per user in rural China to rise over time, mitigating the effects of increased competition in cities such as Beijing and Shanghai.
That said, it’s in China’s more affluent cities that competition from the iPhone will be most fierce. But having been in China in July, I can tell you that the iPhone isn’t coming to China — it’s already there!
Yes, unlocked versions of Apple’s product are being sold in malls all over China, and business executives and taxi drivers are already using them on China Mobile’s network (which, again, has superior coverage). While official estimates put the number of pirated iPhones in China at about 1.5 million, I suspect that’s a low number. So big spenders (the iPhone will cost more than $700 in China) and early adopters — the consumers that seem most likely to leave China Mobile for China Unicom — won’t necessarily be buying iPhones from China Unicom.
Further, even if we assume that China Unicom makes a big splash with the iPhone in China, China Mobile has more than $32 billion in net cash, positioning it far better than China Unicom or China Telecom (both of which have about the same amount of debt as cash) to cut prices, spend on marketing, and invest in new technology to attract and keep customers. Put these points together, and we have a dominant company with a massive growth opportunity in rural China — and a stock that has been obscured in the market’s eyes by overblown concerns about competition in saturated tier 1 markets like Shanghai and Beijing.
fInAncIAls And vAluAtIonThe numbers back up the case for investment as well. If we
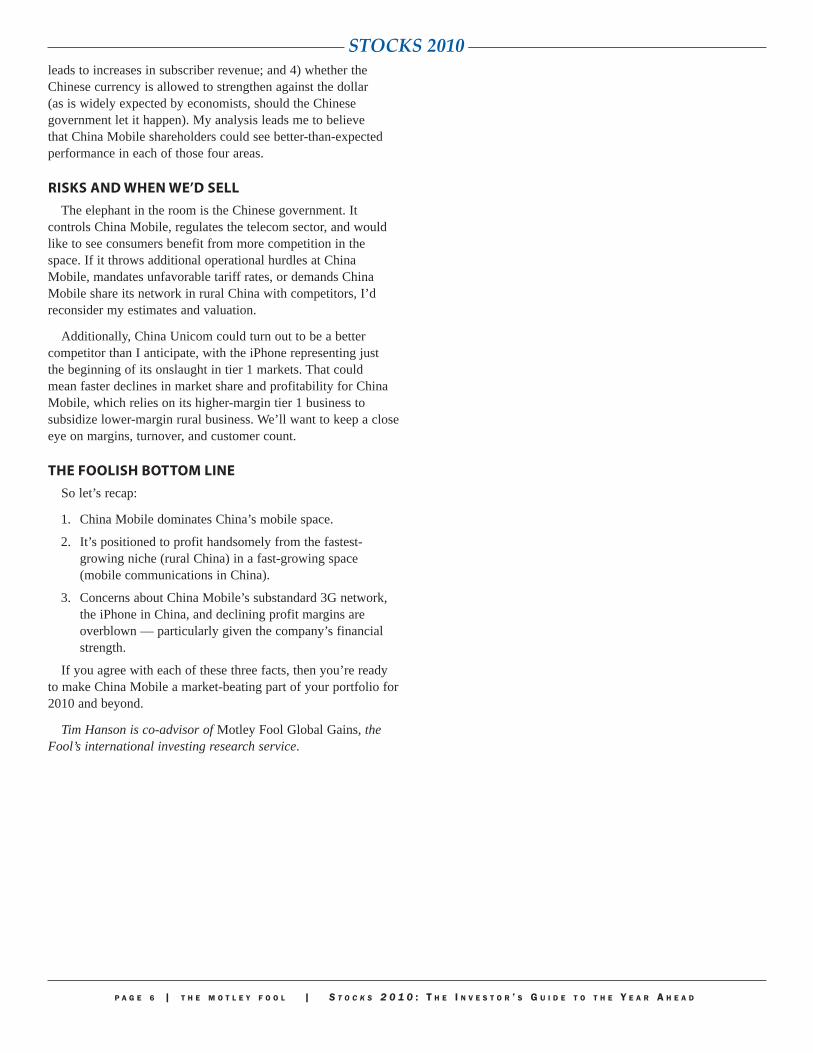
expect China’s overall mobile penetration rate to reach about 80% over the next 10 years (up from 49% at the end of 2008), that would imply roughly 1.1 billion mobile users in China overall. Assuming most of that growth occurs in rural China, I expect China Mobile to reasonably defend its market share despite efforts by the government to increase competition (competitors simply don’t have the capital to build competing networks in rural regions). Assuming 64% market share (again, it’s 71% today), that leaves China Mobile with some 700 million customers. Multiply that number by expected monthly revenue per user and we’ll have our revenue estimate for China Mobile.
Year 2009 2012 2015 2018Chinese Mobile Users 711 million 883 million 990 million 1.1 billionPenetration Rate 53% 65% 72% 80%China Mobile customers 505 million 614 million 668 million 711 millionMarket Share 71% 69% 67% 64%Average Monthly Revenue Per User (¥) ¥73 ¥85 ¥95 ¥105
Revenue Forecast (¥) ¥442 billion ¥626 billion ¥762 billion ¥895 billion$:¥ Exchange Rate 6.85:1 6.5:1 6.1:1 5.8:1Revenue Forecast ($) $65 billion $96 billion $125 billion $154 billionSource: The Motley Fool estimates
From there, let’s assume that China Mobile’s 52% EBITDA margins — among the best in the world — decline all the way down to slightly above the global industry average of 42% over time. Then, net out the average capital expenditures (roughly 15% of sales) that large mobile telecommunications companies need to spend each year. Discount those annual cash flows back to the present at 12% (high for a company of China Mobile’s dominance, but appropriate given that it’s a state-owned company in China) and account for terminal 3% growth, and you’ll arrive at a fair value per ADR of about $43 for China Mobile’s core cell-phone business. That’s just slightly less than the current stock price. But add on the company’s $8 per ADR in cash and the value of stakes in a Pakistani mobile carrier and a Chinese broadband business, and you get a stock that’s trading for less than the sum of its parts.
Just how much less depends on 1) how well China Mobile defends its current market; 2) how fast cell-phone penetration occurs in China; 3) whether increasing wealth in rural China
p a G e 6 | t h e m o t l e y f o o l | S t o c k S 2 0 1 0 : t h e I n v e s t o r ’ s G u I d e t o t h e y e a r a h e a d
STOCKS 2010leads to increases in subscriber revenue; and 4) whether the Chinese currency is allowed to strengthen against the dollar (as is widely expected by economists, should the Chinese government let it happen). My analysis leads me to believe that China Mobile shareholders could see better-than-expected performance in each of those four areas.
rIsks And when we’d sellThe elephant in the room is the Chinese government. It
controls China Mobile, regulates the telecom sector, and would like to see consumers benefit from more competition in the space. If it throws additional operational hurdles at China Mobile, mandates unfavorable tariff rates, or demands China Mobile share its network in rural China with competitors, I’d reconsider my estimates and valuation.
Additionally, China Unicom could turn out to be a better competitor than I anticipate, with the iPhone representing just the beginning of its onslaught in tier 1 markets. That could mean faster declines in market share and profitability for China Mobile, which relies on its higher-margin tier 1 business to subsidize lower-margin rural business. We’ll want to keep a close eye on margins, turnover, and customer count.
the foolIsh BottoM lIneSo let’s recap:
China Mobile dominates China’s mobile space.1.
It’s positioned to profit handsomely from the fastest-2. growing niche (rural China) in a fast-growing space (mobile communications in China).
Concerns about China Mobile’s substandard 3G network, 3. the iPhone in China, and declining profit margins are overblown — particularly given the company’s financial strength.
If you agree with each of these three facts, then you’re ready to make China Mobile a market-beating part of your portfolio for 2010 and beyond.
Tim Hanson is co-advisor of Motley Fool Global Gains, the Fool’s international investing research service.
t h e m o t l e y f o o l | S t o c k S 2 0 1 0 : t h e I n v e s t o r ’ s G u I d e t o t h e y e a r a h e a d | p a G e 7
STOCKS 2010
Compass Minerals: Digging Deep for Dividend Gold
by JaMEs Early
Want an easy-to-follow company? You’ve got it in Compass Minerals, the No. 1 salt producer in both North America and the U.K. It boasts a line of exactly two products: salt itself, and a salt-based fertilizer called sulfate of potash (known as SOP), which supplies potassium to plants. The salt division contributes about 80% of Compass’ revenue (mostly through rock salt for deicing roads, which makes up about 46% of the company’s total revenue). The fertilizer business — a summer-oriented seasonal supplement to winter-based road-salt — makes up the remaining 20%.
Besides being the top overall salt company in North America, Compass is also the No. 1 highway deicing salt maker, the No. 1 SOP maker, and the No. 1 producer of magnesium chloride, a less-toxic (and liquid) deicer that’s a popular alternative to road salt and is also sprayed on gravel roads to reduce dust. If you’re familiar with my Motley Fool Income Investor newsletter, you know that I like market leaders, and Compass is right at the top.
the coMpAnySalt is a slow-and-steady industry in North America — and that’s just fine with
me. Compass has cited U.S. Geological Survey data showing that the volume of rock salt has grown 2% on average for the past 20 years, while evaporated salt (food, water softening, and other applications) has grown 1% yearly. Meanwhile, prices have increased 3% per year for each, which indicates a market growing roughly along with inflation and the U.S. economy. As long as the company is steadily making money, I’m quite happy with this modest pace. Plus, Compass’ prices for 2009-2010 rock salt contracts are up 8%, which is more than double the yearly average — and its overall salt business has grown at an 11% yearly compounded rate since 2003.
Roughly 60% of the U.S.’ salt use is for highway deicing, according to Compass, with transportation departments doing much of the buying. Salt ranges in grade and price, with low-end rock salt (used primarily to treat snow- and ice-covered roads) constituting about 84% of the company’s salt production.
Beyond its salt production lies Compass’ fertilizer business. Potash — which took its name from U.S. colonials who scraped pots for residual cooking ashes to use as both a fertilizer and explosive — infuses potassium into corn and many other plants. If you’ve got plants in your garden that are properly watered and still have yellowish, sick-looking leaf edges, you may need a little potash yourself.
Behind nitrogen, potassium is the most-needed nutrient in plants (and the third most common mineral in the human body). But in the U.S. corn belt, Canadian hay regions, and elsewhere in the world, intensive farming methods have led to more potassium being leached from the soil than is being replaced by fertilizer — not a good sign for wimpy plants that need their Wheaties to grow big and strong.
Sulfate of potash (potassium sulfate) is a premium source of potassium — though it accounts for just 10% of global potash production — because unlike the cheaper muriate of potash (potassium chloride), it doesn’t deposit root- and beneficial bacteria-killing chlorine into the soil. It’s used for crops like fruits, vegetables, and nuts, which constitute just 4% of U.S. cropland acreage but fuel 40% of total crop production value.
coMpAss MInerAls
NYSE: CMPHeadquarters: Overland Park, Kan.www.compassminerals.com
fInAncIAl snApshot
Recent Price:. . . . . . . . . . . . . . . . . . . . . . . . .$64.66Market Cap: . . . . . . . . . . . . . . . . . . . . $2.1 billionDividend Yield: . . . . . . . . . . . . . . . . . . . . . . . 2.2%CAPS Rating:. . . . . . . . . . . . . . . . . . . . . . . . .4 StarsBuy guidance:. . . . . . . . . . . . . . . . Below $70
Data as of 11/10/09
why Buy
This protected business has few »competitors and an inherently stable mineral supply.
Its attractive valuation is supported by »steady salt demand, but the stock also has potential upside from fertilizer.
The investment should perform well »even with no major catalysts.
p a G e 8 | t h e m o t l e y f o o l | S t o c k S 2 0 1 0 : t h e I n v e s t o r ’ s G u I d e t o t h e y e a r a h e a d
STOCKS 2010Moreover, assuming it contains no additives, evaporated salt counts as an organic amendment for agriculture, which will be a boon as the diet of the developed world goes greener.
Canada is the world’s largest producer of potash, and while North America does have thousands of years of potash in reserve, the U.S. produces only 6% of the world’s SOP. This makes Compass’ Utah-based Great Salt Lake production facility — the largest in North America — geographically desirable for company and country alike, given that the U.S. uses 65% of Compass’ potash production.
And here’s a fun bonus: At Compass, old salt mines don’t die — they’re used to store documents, or at least they are at a 160-year-old Compass mine in Manchester, England. This small business division brings in just 1% of sales, but I applaud Compass’ neat use of otherwise-idle resources.
why Invest?When it comes to investment theses, I like ’em simple. I’m
a sucker for a straightforward company that just does its job incrementally better year after year and isn’t dependent on a string of “must-happen” catalysts working out. Compass is exactly that kind of company, especially given its mainstay rock-salt business. This reliable revenue stream is more like a quiet backwater, minding its own business — and minding it well.
In addition to a solar evaporation facility in Utah, mechanical evaporation facilities at four other locations, and a number of packaging facilities, Compass sports big underground salt mines in Louisiana, Ontario, and Great Britain. With at least 100 years’ worth of salt in its reserves, its supply is essentially guaranteed for a few generations, and the fact that Compass’ rock mines are located near water transportation routes helps satisfy demand more cheaply, too. Rock salt is heavy, and moving it on the water is half as expensive as rail transport and one-third that of trucking.
Speaking of demand, while salt needs are both seasonal and straightforward, SOP demand fluctuates — typically with variations in agricultural demand and prices, which are affected by many factors, including weather. Fortunately, an ever-growing number of bellies to fill the world over makes me confident that SOP’s percentage contribution to Compass’ revenue will grow over the years.
Reliable management will be key to shepherding that growth over time. For an old company, Compass has a relatively new CEO in Angelo Brisimitzakis (say that five times fast), who started his tenure in 2006. But I like how things are moving under his leadership and that he’s reportedly fixated on supplementing the company’s summer business to smooth out seasonality a bit.
Compass has squeezed more profit out of its business recently, boosting operating margin by 7 full percentage points
from 2008 through the first nine months of 2009. In fact, 2008 itself was a banner year for return on invested capital, which soared from 16% in 2007 to more than 30% a year later thanks to rising prices.
Brisimitzakis has continued Compass’ deleveraging trend begun in 2003, when debt was 4.6 times earnings before interest, taxes, depreciation, and amortization. Over the past 12 months, that number was just 1.4. Deleveraging while simultaneously generating higher operational returns (even if that’s because of higher sales prices) is the mark of a well-structured company.
fInAncIAls And vAluAtIonThough valuation culminates with a bottom-line number —
which I’ve pegged at $79 per share for Compass — I like to look at a range of possibilities for a stock, as investing is simply a continuum of probabilities at the end of the day. In all cases with Compass, I work with a middle-of-the-road cost of equity of 10.5% and a 7% after-tax cost of debt. These discount rates aren’t particularly high or low, making them perfect for a middle-of-the-road company like Compass. (Truth be told, it skews toward the safe side, but I like to play my valuations conservative.)
For my $79 midpoint, I assume earnings growth of 3.3% yearly for the next five years, eventually tapering to 2.5%. Compass uses a lot of working capital (a bit like cash in the wallet for the day-to-day operations of a business, though ironically, we exclude cash itself for the calculation), and I’ve included that capital in my model. The company’s capital expenditures have been modest lately, and while they could increase with an acquisition, so, too, would revenue.
If I use the 5% annual earnings growth that Wall Street analysts are predicting for the next five years — bumping up capital expenditures a bit to help pay for it, too — Compass’ valuation increases to $86. Conversely, earnings growth of just 1% annually brings the valuation down to $71. But I’m going with $79 as my number.
rIsks And when we’d sellMining is a heavy industry, and as Compass is quick to point
out, it’s exposed to a range of nasties — from accidents to regulation to obligations to clean up messes made by previous facility owners.
A more consistent risk is weather. A warm, dry winter — which is abhorrent to me as an avid skier, but may please many others — wouldn’t require much rock salt. Fortunately, over time, statistics prevail, with global warming juxtaposed with a trend toward more roads and more cars on them. Of course, weather can affect crops, and thus demand for SOP, as well — for the worse, but also for the better.
What would cause me to sell? That’s a tough question, but I’d say a move away from salt-based products for deicing would do it, or a similar move away from SOP in agriculture.

t h e m o t l e y f o o l | S t o c k S 2 0 1 0 : t h e I n v e s t o r ’ s G u I d e t o t h e y e a r a h e a d | p a G e 9
STOCKS 2010the foolIsh BottoM lIne
Compass isn’t a shoot-for-the-moon stock. It’s a steady performer that should bring you returns over time. It owns some of the biggest and best-located production facilities around, has no supply worries to speak of, and leads the market in a steady industry. And for those who don’t mind earning a dividend yield while waiting for larger returns, Compass pays 2.2%. Nothing fancy here — but if that’s your fancy, as it is mine, Compass could be your next investment.
James Early is the advisor of Income Investor, the Fool’s dividend-focused investing service.

STOCKS 2010
p a G e 1 0 | t h e m o t l e y f o o l | S t o c k S 2 0 1 0 : t h e I n v e s t o r ’ s G u I d e t o t h e y e a r a h e a d
Devon Energy: Generate Returns You Can Count On
by PhIlIP DurEll
Let’s play a word-association game. When I say “Big Oil,” what do you think of? Big profit, probably. Then maybe ExxonMobil (NYSE: XOM). BP (NYSE: BP). Chevron (NYSE: CVX). I’ll wager that Devon Energy (NYSE: DVN) doesn’t make your list — though it should. True, it’s not one of the super-major energy companies, but the stock’s 50% upside potential can generate big profit for your portfolio.
the coMpAnyDevon is the largest independent producer of oil and natural gas in the United
States. More than 90% of its proven reserves, production, and revenue comes from its North America operations in the Gulf of Mexico, the continental United States, and the Canadian oil sands. But its business isn’t limited to the Northern and Western Hemispheres: Devon’s international presence — currently in Azerbaijan, Brazil, China, and Russia — is growing, too.
Energy producers are only as profitable as the resources they have access to — and Devon has some top-notch properties, both for oil and natural gas production. Some of the company’s most lucrative gas operations are in the Barnett (Texas), Cana-Woodford (Oklahoma), and Haynesville (Louisiana/Texas) shale areas, which have ample reserves and the added advantage of relatively cheap extraction costs. Devon also has extensive coal bed natural gas operations in the Rocky Mountains. By concentrating its operations in these key areas, Devon maximizes the use of collection systems and minimizes complicated servicing logistics, which helps keep production costs low.
The company’s star performers in Canada are its Jackfish 1 and 2 projects in the Alberta oil sands. The oil sands are widely reported to be the largest proved reserves outside Saudi Arabia. Jackfish 1 is already contributing nearly 5% of Devon’s daily oil and natural gas production, and the company’s oil sands production should double when Jackfish 2 is 100% online.
Devon also has shallow- and deep-water operations in the Gulf of Mexico, including a huge deep-water acreage that isn’t yet producing. That area requires expensive technology and expertise to develop, though it represents a tremendous opportunity for the company and will probably begin to contribute to cash flow after 2013. Devon also is building out its international operations, another future source of growth.
Spreading out its interests has bolstered Devon’s position as a strong competitor in its space. For the first half of 2009, 31% of the company’s revenue came from oil, 40% from natural gas, and 7% from natural gas liquids. This diversification protects Devon from volatility in a single commodity’s price.
A company can have access to all the resources in the world, though, and still be a poor investment if it’s not run well. Fortunately, the management at Devon is excellent. Chairman and CEO J. Larry Nichols founded the company with his father in 1971, so Nichols has a vested interest in the company’s — and its shareholders’ — success. In fact, one of the company’s goals is to increase shareholder value, something it’s been careful to do by maintaining a strong balance sheet. Devon rarely exceeds its own cash resources when it acquires and develops reserves, and it’s one of just a handful of companies to have its reserves audited by a third party. Its exemplary corporate
devon energy
NYSE: DVNHeadquarters: Oklahoma City, Okla.www.devonenergy.com
fInAncIAl snApshot
Recent Price:. . . . . . . . . . . . . . . . . . . . . . . . .$69.75Market Cap: . . . . . . . . . . . . . . . . . . . $30.9 billionDebt: . . . . . . . . . . . . . . . . . . . . . . . . . . . $7.4 billionCAPS Rating: . . . . . . . . . . . . . . . . . . . . . . . .4 StarsBuy guidance: . . . . . . . . . . . . . . . Below $73
11/10/2009
why Buy
The oil and natural gas producer should »benefit from long-term price increases in gas.
It has key leaseholds in booming U.S. »natural gas shale areas.
There is still money to be made from »promising deep-water operations in the Gulf of Mexico.

t h e m o t l e y f o o l | S t o c k S 2 0 1 0 : t h e I n v e s t o r ’ s G u I d e t o t h e y e a r a h e a d | p a G e 1 1
STOCKS 2010culture has earned Devon slots on Forbes’ 100 Best Companies to Work For and Fortune’s Most Admired Companies lists. Most important, management isn’t afraid to take appropriate investment risks for future benefits — see its projects in the oil sands and the Gulf of Mexico as proof.
why Invest?
Natural gas is really cheap right now thanks to rapidly developed shale deposits and decreased demand, which have pushed storage levels to record highs. Producers can’t justify the expense of drilling in these conditions, so the number of rigs in use across the industry has been halved since the 2008 peak. (Devon, too, plans to shutter its marginal gas wells in the third and fourth quarters.) At first glance, this doesn’t look like a thriving industry. But eventually, the curtailed rig count combined with the short depletion cycles of most new wells will slow the production of natural gas — and the supply/demand balance will once again tip in favor of higher gas prices.
On top of that, demand for gas will pick up with increased economic activity, especially because natural gas is currently so much cheaper than oil. The price ratio between gas and oil is usually from 6:1 to 10:1. Today it’s 17.5:1 ($4.50 gas and $79 oil). The longer this disparity exists, the greater the incentive for energy consumers to switch from oil to natural gas (which emits less carbon dioxide to boot). And we’re in luck: Futures indicate that gas will cost $5 to $6 per million British thermal units in 2010 and will gradually rise to $7 to $8 in the longer term. Oil futures indicate a gradual increase from $80 to $95 a barrel over the long term.
fInAncIAls And vAluAtIon
At $6.5 billion, the company’s net debt is manageable against its $30.9 billion market cap. Devon will have to pony up $2 billion in 2011, but it shouldn’t have any problems issuing new debt to pay for it, and I don’t expect the interest on any new debt to be much higher than the current average of about 7%.
My baseline valuation scenario pegs Devon at about $105 per share. This assumes that by 2011, natural gas prices will have risen to $7.50 per thousand cubic feet equivalent from the current $4.50 and that oil will have risen to $85 per barrel from $80. Changing the price forecasts significantly changes the valuation. For example, if long-term gas prices top out at $6 and oil at $60, the valuation would be close to today’s share price of $70. If I use more optimistic projections — with oil at $100 and gas at $10 — my valuation jumps to about $140.
Based on all this, Devon appears significantly undervalued now — it has upside potential of about 50% — though I expect its share price will gradually increase as investors start to anticipate higher natural gas prices.
rIsks And when we’d sellThe biggest challenges ahead for Devon are prolonged low
natural gas prices and a significant drop in oil prices, as the stock price will invariably follow the short-term prices of the commodities. But long-term investors know that this volatility presents an investment opportunity — even as others consider it a risk.
Devon’s presence in Azerbaijan, Brazil, China and Russia exposes it to added political risks. Canada too poses additional risk because the provincial government in Alberta has been known to increase royalties on energy companies. Even in the U.S., “windfall taxes” on energy companies loom as a possibility. Devon’s operations in and around the Gulf of Mexico are susceptible to hurricanes, production delays, and unexpected cost overruns. If any of these things start to erode Devon’s profits, I’d consider selling.
However, I instead expect to be selling Devon shares because the stock is performing well. When energy prices are high and Devon’s share price exceeds my valuation estimate, I’ll know it’s time to sell and cash out — and to start watching for another opportunity to buy Devon at an attractively low valuation.
the foolIsh BottoM lIneDevon is a premier independent oil and gas producer, but
investors are overlooking it because natural gas prices are so low — though they won’t stay low forever. Diversification into both oil and gas protects Devon’s profits from a fall in a single commodity price, and the company’s management is dedicated to serving shareholders. Shares are trading around the bottom of their cycle now, so investors who jump into this timely opportunity might very well begin to associate Devon with Big Oil-sized profit.
A final tip: Because Devon’s stock tracks short-term commodity prices, I recommend spreading out your investment over several purchases to protect against a sudden, temporary drop in the share price.
Philip Durell is the advisor of Inside Value, the Fool’s value-driven investing service.
STOCKS 2010
p a G e 1 2 | t h e m o t l e y f o o l | S t o c k S 2 0 1 0 : t h e I n v e s t o r ’ s G u I d e t o t h e y e a r a h e a d
Hillenbrand: A Funeral Business With Cause to Celebrate
by tODD WENNING
As macabre as it might be, there’s no denying that death is a necessary business — and at $15 billion a year, it can be quite profitable. Funeral products alone are a $2.6 billion-a-year industry, and half of that goes to casket manufacturers like Hillenbrand (NYSE: HI).
The company is home to the iconic century-old Batesville Casket, the world’s largest casket maker that dominates more than half of the $1.3 billion industry. Its products have been used for the burials of Presidents Reagan, Nixon, Kennedy, and Truman and celebrities from James Brown to Michael Jackson.
the coMpAnyFor 80 years, Batesville Casket was part of a conglomerate known as Hillenbrand
Industries, which was owned by generations of the Hillenbrand family and included Hill-Rom, a medical equipment and technology company. In 2008, Hillenbrand Industries spun off the funeral services business, retained Hill-Rom, and renamed itself Hill-Rom Holdings (NYSE: HRC), while the funeral services division kept the name Hillenbrand.
Finally free to focus exclusively on funeral products and services, the new Hillenbrand can better leverage the Batesville Casket brand name to expand into higher growth areas of the industry. Today, the company is divided into three main areas: Batesville Casket-branded, premium caskets; Options by Batesville, which makes cremation products including urns, keepsakes, and jewelry and was created in 1992; and NorthStar, which makes private-label, lower-priced caskets and was launched in 2005.
And as you can see, the $678 million in sales Hillenbrand generated in 2008 was heavily weighted toward traditional caskets:
Product Division % of SalesBatesville Caskets 90%Options by Batesville 7%Other (e-business initiatives, funeral home website hosting) 2%NorthStar Caskets 1%
With more than a century of experience in the business, Hillenbrand has casket-making and distribution down to a science with lean, multiple award-winning manufacturing plants and a delivery system favorably benchmarked against FedEx (NYSE: FDX) and UPS (NYSE: UPS) that boasts 99.2% on-time accuracy. This has helped keep margins high and cash flow plentiful despite anemic sales growth in the casket business over the past decade.
But Hillenbrand’s most important competitive advantage is its extensive client base: 16,000 of the 22,000 funeral homes in the U.S. and Canada buy Batesville. With its foot in the door of nearly three-quarters of the funeral homes in those markets, Hillenbrand can quickly and widely introduce and cross-sell new products to its customers.
why Invest?Despite past success, Hillenbrand must adapt to a significant secular change
occurring in the funeral services industry — the increasing preference for cremations over traditional burials — or risk a slow and steady decline in business. In the North American markets that Hillenbrand serves, deaths have increased at 0.3% per year on average over the past 10 years while burials have decreased at a faster rate of 1.3% per
hIllenBrAnd
NYSE: HIHeadquarters: Batesville, Ind.www.hillenbrandinc.com
fInAncIAl snApshot
Recent Price:. . . . . . . . . . . . . . . . . . . . . . . . .$20.28Market Cap: . . . . . . . . . . . . . . . . . . . . $1.3 billionDividend Yield: . . . . . . . . . . . . . . . . . . . . . . . 3.7%CAPS Rating:. . . . . . . . . . . . . . . . . . . . . . . . .4 StarsBuy guidance:. . . . . . . . . . . . . . . . Below $22
Data as of 11/10/09
why Buy
The U.S. market leader in funeral services »is anchored by 103-year-old Batesville Casket Co., the country’s largest casket manufacturer by a wide margin.
As a stand-alone company, Hillenbrand »can now leverage its industry knowledge and strong balance sheet to make acquisitions and fuel growth.
A steady cash flow generator with a 3.7% »dividend, Hillenbrand is an ideal candidate for any income-focused portfolio.

t h e m o t l e y f o o l | S t o c k S 2 0 1 0 : t h e I n v e s t o r ’ s G u I d e t o t h e y e a r a h e a d | p a G e 1 3
STOCKS 2010year. Meanwhile, Hillenbrand expects cremations to grow at a measured pace over the next few decades, accounting for 60% to 65% of burials by 2048, up from about 35% today.
A powerful combination of demographic, cultural, and economic headwinds is forcing this change. First is the simple fact that many cemeteries around the world are running out of land. In coming years, traditional burial may not even be an option in more populated areas of the country.
Affordability is also an issue: A traditional adult burial service with a casket costs between $9,000 and $13,000, while a typical cremation ranges from $3,300 to $4,500. The margins Hillenbrand can make on cremation accessories are similar to caskets, though the prices they command are also lower.
Regardless, the funeral services industry will remain necessary and profitable over the next decade and beyond, even if it takes on a different shape. With change comes opportunity, however, and Hillenbrand has the financial strength, expertise, and deep and extensive client base to capitalize on the emerging opportunities in the industry.
Hillenbrand is led by experienced executives with a deep understanding of the business and decades of experience with the company. Take CEO Ken Camp, for example. He has been with the company for 28 years and served as president of Batesville Casket for seven years before the spin-off.
Management is fully aware of and forthcoming about the secular decline in casket demand and has laid out an aggressive, but achievable, growth strategy. Over the next three years (through 2011), Hillenbrand plans to deliver 2% to 3% annualized revenue growth in the existing core business and complete $100 million to $200 million in acquisitions to deliver an additional 3% to 5% annualized sales growth.
Potential acquisition targets will likely be in the manufacturing or assembly business so Hillenbrand can leverage its operational expertise, and they’ll have above-average growth and profit potential. By making such a large commitment to acquisitions — it’s only made six small ones (below $10 million each, on average) over the past 15 years — Hillenbrand is revealing its eagerness to stay a relevant player in a changing industry rather than accept the fate of a vanishing star.
fInAncIAls And vAluAtIon For the growth and acquisition strategy to be successful, it
must be built on solid financial footing, which Hillenbrand certainly has:
Current S&P SmallCap 600 MedianReturn on Equity 32.4% 5.9%Interest Coverage 61.3x 6.9xGross Margin 41.9% 33.6%Debt to Capital 19.7% 31.5%*Source: CapitalIQ, as of Oct. 18, 2009
Most important, though, is Hillenbrand’s ability to consistently generate gobs of free cash flow, which CEO Camp says is “the best measure of an enterprise’s value” rather than simple profits, which are “an accountant’s opinion.” In such an earnings-obsessed market like we have, it’s refreshing to hear a CEO focused on generating cold, hard cash that can be used to increase shareholder value through dividend payouts, share repurchases, debt retirement, and reinvestment in the business.
If this weren’t enough, you’ll collect a well-covered 3.7% dividend — more than 60% higher than the yield on the S&P 500 — while you wait for Hillenbrand to achieve a fairer value. Only 54% of the free cash flow Hillenbrand generated over the past year went to dividend payouts, so the healthy 3.7% yield appears to be nearly as certain as death and taxes.
With a market cap of just $1.3 billion, Hillenbrand still has plenty of room to grow, but the slow-yet-reliable nature of the business means the company is unlikely to be a 10-bagger overnight. Using a discounted free cash flow-to-equity model and assuming 5% to 7% annualized net income growth over the next decade with growth slowing thereafter, a fair value range for Hillenbrand is $26 to $28 a share, offering a 22% to 27% margin of safety from today’s prices.
rIsks And when we’d sellUneasy lies the head that wears a crown (thank you,
Bard). Any company that’s achieved a state of sheer market dominance — see Microsoft (Nasdaq: MSFT) or Oracle (Nasdaq: ORCL) — is prone to antitrust litigation, and given its success in the funeral services industry, Hillenbrand is no exception. In 2005, the nonprofit Funeral Consumers Alliance brought a class-action antitrust suit against then-Hillenbrand Industries and three national funeral home businesses alleging a conspiracy to suppress competition of “independent casket discounters.” The plaintiffs were denied in July 2009 by the Federal Court of Appeals. The last available step now is to file with the Supreme Court.
A number of similar class-action suits have been filed in various courts throughout the U.S., but so far they have not been successful. These cases aren’t cheap to defend, so if it becomes an issue, I’d dig deeper and determine the potential impact on future growth.
Other risks include an inability to find good acquisition targets or paying too much for acquisitions, an inability to adjust to the new reality in funeral services, increasing commodity costs for manufacturing and transportation, and labor disruptions with the unionized workforce (approximately 35% of all employees).
the foolIsh BottoM lIneAfter a decade that saw two massive bubbles and subsequent
bursts, investors should be more receptive to a slow-and-steady grower that offers strong income and modest opportunities
p a G e 1 4 | t h e m o t l e y f o o l | S t o c k S 2 0 1 0 : t h e I n v e s t o r ’ s G u I d e t o t h e y e a r a h e a d
STOCKS 2010for capital appreciation. Hillenbrand offers just about everything a defensive investor could want: a market-leading, recession-resistant product; a strong balance sheet; and fiscally disciplined management. It may not be the most exciting addition to your portfolio — indeed, it may even be a little haunting — but it’s important to own at least a few things that people can’t do without. For better or worse, funeral services are a pretty safe bet.
Todd Wenning is an analyst for Motley Fool Pro, a real-money portfolio that uses stocks, ETFs, and options strategies. He is also the financial editor of Stocks 2010.
t h e m o t l e y f o o l | S t o c k S 2 0 1 0 : t h e I n v e s t o r ’ s G u I d e t o t h e y e a r a h e a d | p a G e 1 5
STOCKS 2010
Nike: Swoosh! That’s the Sound of Success
by alEx schErEr, cFa
So many Wall Street stock recommendations are chock-full of details about unique opportunities over the next quarter or next year. They talk about how gross margins are set to improve, how sales growth will surely accelerate, or how currency exposure will become a tailwind in the coming quarters, how P/E ratios are sure to trend higher — all to your benefit if you invest right now!
Of course, all of those forward-looking “hows” apply to Nike (NYSE: NKE), too — but the advantage offered by those insights is fleeting, and what makes Nike a worthy investment has so much more significance than these passing issues. Simply put, to tactically focus on select opportunities in such a vast global portfolio misses the forest for the trees. Focus on the forest, Fools: Nike hits the sweet spot of global growth opportunity in a way few can compete with, especially among U.S.-based investments.
Here’s the bad news up front: Nike isn’t cheap. But there’s no reason to believe it ever will be. Nike, alongside the Coca-Colas (NYSE: KO) and American Expresses (NYSE: AXP) of the world, is Warren Buffett’s proverbial “great company at a good price.” Companies like Nike that have a truly sustainable competitive advantage are able produce market-beating returns for decades even though they’re not cheap by traditional valuation metrics, save the odd market collapse.
the coMpAnyFounded as Blue Ribbon Sports in 1964, Nike took its current name — honoring
the Greek goddess of victory — in 1971. Today, the iconic brand with its swoosh logo is the most recognized footwear and athletic apparel company in the world. In 2008 alone, it sold $18 billion worth of its shoes, shirts, golf clubs, and more across 170-plus countries.
A marketing machine, Nike spends billions of dollars on advertising and sponsorship deals with the world’s leading athletes to maintain its brand dominance. The golden arches, the Coke bottle, the swoosh — these images have power that others only aspire to. The costs involved in maintaining and increasing that brand power, not just through marketing but only through continued product innovation, are substantial. For that reason, Nike — with more than $3 billion net cash and a real culture of original invention — is one of the few companies positioned to achieve it.
Nike’s powerful brand recognition gives it considerable market share. The figures are impressive: In footwear, which accounts for more than half of Nike’s sales, it commands a 41% share in the U.S. and a bit lower globally. Nike’s main competitor, Adidas (OTC: ADDYY.PK), sits a distant second at 12% in the U.S. Though it’s thought of primarily as a shoe company, Nike’s branded apparel sales are also significant at about 28% of sales, and its leading share (around 8%) is growing as the company continues to extend its brand and distribution into this fragmented category.
On the surface, Nike is an easy company to understand, but the investment opportunity comes from a true appreciation of the scope and dimension of its various businesses. Although Nike is widely viewed as an American company, the fact is that it generated 58% of sales and 63% of its pre-tax profit (before shared expenses) overseas in fiscal 2009. Already a dominant force worldwide, the primary driver of Nike’s future
nIke
NYSE: NKEHeadquarters: Beaverton, Ore.www.nike.com
fInAncIAl snApshot
Recent Price:. . . . . . . . . . . . . . . . . . . . . . . . .$64.24Market Cap: . . . . . . . . . . . . . . . . . . . $31.3 billionDividend Yield: . . . . . . . . . . . . . . . . . . . . . . . 1.5%CAPS Rating:. . . . . . . . . . . . . . . . . . . . . . . . .4 StarsBuy guidance:. . . . . . . . . . . . . . . . Below $80
Data as of 11/10/09
why Buy
Nike has a market-leading position in the »growing Chinese consumer market.
Its consistent growth, global brand »recognition, and strong balance sheet give Nike the edge over weaker competitors.
Though Nike has rarely been cheap, »today’s prices are a good place to begin building a new position or adding to an existing one.

p a G e 1 6 | t h e m o t l e y f o o l | S t o c k S 2 0 1 0 : t h e I n v e s t o r ’ s G u I d e t o t h e y e a r a h e a d
STOCKS 2010growth will be its continued expansion in emerging markets — most notably in China. Though already well-established there (Nike has a larger market share than the leading domestic brand, Li Ning), Nike has a multi-decade growth runway, particularly as it moves out of the major cities like Shanghai and Beijing. Of China’s 660 cities, Nike is only distributed in about 350, with plans to be in 500 cities over the next three years.
Though future growth looks to be dominated by international opportunities, investors certainly can’t bench the domestic business. The U.S. retail industry is going through a structurally challenging period. Consumers accustomed to shopping sprees fueled by widely available credit have curtailed their habits, and recovering from that burst bubble won’t be a simple matter for retailers. Profitability pressures and significant overcapacity in retail will lead to industry restructuring (bankruptcies at Circuit City and Linens ’n Things were just the beginning). As the receding tide exposes those swimming naked, Nike’s outstanding free cash flow ($1.6 billion in the past 12 months), gives it a competitive edge in this environment.
Further, brand identity is becoming increasingly critical to creating value, as the competition for a shrinking profit pool heats up between manufacturers, retailers, and brand owners. As we’ve already seen, Nike’s market share in the U.S. — evidence of its brand power — has taken off as fast as the University of Oregon’s legendary track teams through the years. It’s one of the few branded apparel companies able to drive marginal dollars into its own coffers rather than the retailers’. Fully 64% of Foot Locker’s inventory purchases, for instance, are Nike products — a healthier relationship for Nike than it is for Foot Locker and one that allows Nike to set the tone during negotiations.
One final point is becoming more and more important for global corporations every day: Consumer and government expectations for companies to play a social role are rising. Customers are increasingly prepared to abandon a product if they believe a company is acting irresponsibly. Similarly, governments around the world are becoming more active in demanding companies’ attention to their effect on the environment and their treatment of employees. On this factor, Nike survived a trial by fire years ago (its sweat shops were a hot topic when I was in college), and as a result, this company is at the forefront of labor, environmental, and government relations issues in emerging markets today.
fInAncIAls And vAluAtIon All these business characteristics spring from Nike’s
entrenched industry position, and together they drive attractive growth prospects with geographic diversification, industry-leading margins, and cash-generation power deserving to make your portfolio’s team. Sales growth has averaged nearly 8% over the past decade, including during today’s economic slowdown. Market dominance has led to measured margin expansion in the past five years, with operating margins
consistently at industry-leading levels despite huge spending on sales and marketing to maintain its dominant position. The resulting free cash flow has allowed for significant share repurchases over the years, driving average EPS growth of 15% over the past decade. Finally, return on net operating assets — or RNOA, a measure of how profitable the company’s investment in its operations is — has risen from a decent 14% 10 years ago to an astounding 32% today.
This steady, dominating performance has been accomplished with little use of debt, and Nike now sports a pristine balance sheet. Its $6 in net cash per share and its highly liquid balance sheet give it the flexibility to pursue growth initiatives that build long-term shareholder value. It also allows the company to return significant cash to shareholders through a dividend that has grown 20% annually for the past five years (Nike only yields 1.5% today but generates enough cash to pay out substantially more), in addition to its share buyback program. There’s no trick here; simply holding these trends will lead to market-beating performance, and that’s what I expect. Despite valuations regularly over 20 times earnings throughout its history, Nike shareholders have almost never been disappointed after buying the stock. From today’s vantage point, prices under $80 are fine to start building your long-term stake; should a double-dip recession give us sub-60 prices again, I’d recommend picking up the buying pace.
rIsks And when we’d sell The danger inherent in market leadership is that you are
constantly in the bulls-eye of the competition. On this front, Nike could be its own worst enemy, as complacency is a quick way to drain any moat. This isn’t easy to identify until it’s potentially too late, but if we see evidence of market share slipping, that could be a sign of danger.
The firm’s large cash hoard poses a risk, as well. With more than $6 per share in net cash on the balance sheet, Nike remains extremely underleveraged for an increasingly stable global growth company. And while those RNOA trends look fantastic, returns on equity — the ultimate measure of shareholder profitability — can suffer from the dead weight of too much unproductive cash. We need Nike to continue to step up its share buybacks (since large acquisitions are unlikely) — otherwise a decoupling of ROE and RNOA could hold back the market’s valuation of the shares.
Finally, having a general fear of changing consumer spending habits is probably healthy. Consumer behavior this year hasn’t reflected the past decade to say the least, and if buying habits over the next decade look more like 2009 than 1999-2008, Nike will have a headwind, as will just about every other consumer products company in the world. That said, I believe Nike will still be a relative outperformer even in this scenario given its economies of scale and brand recognition.

t h e m o t l e y f o o l | S t o c k S 2 0 1 0 : t h e I n v e s t o r ’ s G u I d e t o t h e y e a r a h e a d | p a G e 1 7
STOCKS 2010the foolIsh BottoM lIne
Nike co-founder Bill Bowerman believed that “if you have a body, you are an athlete.” That vision extends to the fiercely competitive nature of today’s Nike. This behemoth has stared down some pretty fit challengers and is now looking to flex its muscles further in emerging markets. With an outstanding history of connecting the dots between its substantial strengths, market opportunities, and real cash flow, Nike is positioned to win both domestically and globally in this environment. The goddess of victory herself might consider an investment in Nike — and you should, too.
Alex Scherer is an associate advisor for Stock Advisor, the Fool’s flagship general equity newsletter service.
STOCKS 2010
p a G e 1 8 | t h e m o t l e y f o o l | S t o c k S 2 0 1 0 : t h e I n v e s t o r ’ s G u I d e t o t h e y e a r a h e a d
Olin Corp.: An Investment to Fire Up Your Portfolio
by rON GrOss
What do bleach and small-caliber ammunition have in common? If you answered Olin Corp. (NYSE: OLN), you’re absolutely correct, and you might be ready to be a contestant on Jeopardy — or at least Are You Smarter Than a Stock Analyst?
Olin manufactures two completely different products: The chlor alkali division produces chemicals such as chlorine and bleach, and the Winchester division is a leading supplier of small-caliber ammunition. These businesses provide some diversification, but the recent weakness in the chemicals arena because of the economic slowdown provides an opportunity to pick up the grand prize: Olin stock at a nice discount, with 26% potential upside complemented by a fat 5.1% dividend.
the coMpAnyI’m the first to say it: Chlor alkali is the kind of business that can bring on a big ol’
yawn. This humdrum chemical manufacturing division, which represents about 72% of Olin’s total sales, makes chlorine and caustic soda, sodium hydrosulfite, hydrochloric acid, hydrogen, bleach products, and potassium hydroxide. The company has been making these chemicals for more than 100 years and is the largest producer of industrial bleach and the third-largest North American maker of chlorine and caustic soda. Still awake? Come on — stick with me here.
Before you go on that quiz show, you need to know that chlorine is used to make thousands of products, including vinyls, polyvinyl chloride (commonly known as PVC), and water-treatment supplies. Caustic soda also has a number of uses and comes into play in the pulp and paper industry and in the manufacture of detergents, soaps, and a variety of chemicals.
The Winchester business is certainly more exciting, especially if you’re a fan of old Westerns or the Second Amendment. Winchester represents about 28% of total sales and has been around for more than 142 years — the past 78 as part of Olin. This division makes sporting ammunition, reloading components, small-caliber military ammunition, and industrial cartridges. Winchester’s customers include retailers, law enforcement agencies, and domestic and international militaries.
Olin is in good hands with Chairman, CEO, and President Joseph Rupp, a 37-year company veteran who rose through various executive positions before being named CEO in 2002. Ideally I’d like him to have more skin in the game through greater company stock ownership, yet I’m impressed with his stewardship.
Solid leadership is key in an industry as competitive as chlor alkali’s. North American manufacturers make up about 20% of worldwide capacity, and according to Chemical Market Associates, Olin is the third-largest North American chlor alkali producer behind Dow Chemical (NYSE: DOW) and Occidental Chemical, a subsidiary of Occidental Petroleum (NYSE: OXY). A highly cyclical and largely commodity-based business, Olin’s competitive strategy for this division is to be the low-cost producer.
Winchester, Alliant Techsystems (NYSE: ATK), and Remington Arms are the three largest commercial ammunition manufacturers in the United States. The ammunition
olIn corp.
NYSE: OLNHeadquarters: Clayton, Mo.www.olin.com
fInAncIAl snApshot
Recent Price: . . . . . . . . . . . . . . . . . . . . . . . $16.62Market Cap: . . . . . . . . . . . . . . . . . . . $1.31 billionDividend Yield: . . . . . . . . . . . . . . . . . . . . . . . 5.1%CAPS Rating: . . . . . . . . . . . . . . . . . . . . . . . .4 StarsBuy guidance: . . . . . . . . . . . . Below $17.50
Data as of 11/10/09
why Buy
Olin has strong market positions in two »distinct business divisions.
The company has a solid balance sheet »and the ability to generate considerable free cash flow.
The stock offers significant appreciation »potential — plus a 5.1% dividend yield.

t h e m o t l e y f o o l | S t o c k S 2 0 1 0 : t h e I n v e s t o r ’ s G u I d e t o t h e y e a r a h e a d | p a G e 1 9
STOCKS 2010industry is also highly competitive, with the primary differentiating factors being price, product recognition and quality, and innovation.
why Invest?Olin’s stock price has rebounded sharply off its 52-week low
(show me a stock that hasn’t), but we can still take advantage of a nice upside. Although the business performance will stay depressed for the next several quarters, a number of favorable industry dynamics are on the horizon. Among them, rising prices and increasing demand in the chemicals business should significantly boost Olin’s free cash flow.
Meanwhile, the largely recession-resistant Winchester ammunition business recently achieved the highest quarterly sales and earnings in its history. Although Winchester is the smaller division, its strength is helping to offset the cyclical weakness in the chemicals business.
Once the cycle turns and the company’s current projects are complete, strong free cash flow should follow. Based on my cash flow estimates, the company has an intrinsic value of about $21 per share, which translates to appreciation potential of about 26%. Olin could potentially further enhance shareholder value by selling or spinning off the Winchester business, but I think the likelihood of that is low. Further brightening the picture is that Olin has paid 331 consecutive quarterly dividends, and its current yield stands at a very substantial 5.1%.
fInAncIAls And vAluAtIon Olin has a solid operating history and has grown nicely over
the years. In the five years through 2008, operating income increased at a whopping 42% compound annual growth rate. In 2008, return on equity clocked in at a strong 23%, and a return on capital of 16.6% wasn’t too shabby either.
Following a recent $150 million debt offering that bolstered Olin’s already strong balance sheet, I estimate its pro forma cash balance at about $340 million and total debt near $400 million, which translates into a healthy debt-to-capital ratio of approximately 33%.
The cyclical nature of Olin’s business has caused cash flow to fluctuate, and the divestiture of its metals division in 2007, a relatively large acquisition in 2007, and higher-than-normal capital expenditures in 2008 further muddy the waters. Slowing in the chlor alkali business reflects lower shipment volume and weaker pricing, but the good news is the Winchester business is very strong. However, because of a reduction in capacity and consolidation in the industry, I have reason to believe that a rebound in demand and pricing is on the horizon. In fact, Olin’s third-quarter results showed an unexpected profit in the chemicals division, and the fourth quarter is shaping up to have similar results.
Olin’s stock looks inexpensive based on several metrics. First, shares are trading at only 3.9 times earnings before interest, taxes, depreciation, and amortization. This isn’t a perfect comparison, but by contrast, other chemical producers are trading in excess of 6 times EBITDA. The company also looks inexpensive on a discounted cash flow basis. For that valuation, I looked at Olin’s normalized free cash flow, assuming that results will stabilize and then begin to improve within a year. I also normalized capital expenditures, considered environmental liabilities, allowed for cost savings from the recent Pioneer acquisition, and accounted for increased interest expense. Starting with free cash flow of $80 million and 7% average annual growth over the next 10 years, I get an intrinsic value estimate of $21 per share. And factoring in Olin’s fantastic 5.1% dividend yield, we have a very interesting investment opportunity.
rIsks And when we’d sellOlin is up against a few serious risks. First, the company’s
chlor alkali business is cyclical, as I’ve mentioned, and there will be peaks and valleys. A weak period, like the one Olin is in now, can create opportunities, but there will be times when business slows and Olin will be powerless to influence it in any significant way. The silver lining here is that its competitors get caught up in the same cycle, rendering them just as powerless.
Second, legislation before Congress that would ban the use of mercury-cell technology for the production of chlor alkali products could affect Olin’s two mercury-cell plants that represent about 18% of its total capacity. The fate of this legislation is uncertain, but if it’s approved, Olin would face increased costs to replace its technology.
Finally, it’s important to keep an eye on Olin’s credit rating and the stability of its dividend. While the company’s 38% dividend payout ratio is very reasonable, it’s worth watching during times like this when parts of Olin’s business are weak. Recognizing this weakness, Standard & Poor’s recently lowered Olin’s credit rating by two notches from “BB-plus” to “BB-minus.” Olin has sufficient liquidity and its balance sheet is strong, but investors should keep a watchful eye on Olin’s cash flow and debt profile. If at any time the dividend appears to be in jeopardy, I’d consider selling the stock.
the foolIsh BottoM lIneNow, it’s time to smile for the camera and pick up that quiz
show prize: Olin operates two completely different businesses that offer some diversity. Once the business cycle turns, though, the company is well positioned to generate considerable free cash flow. Based on uncertainties, an investment in Olin has moderate to high risk, but at the current price, investors are being well compensated for that risk. With 26% potential upside and a 5.1% dividend yield, now is a great time to pick up shares of Olin.
Ron Gross is the advisor of Million Dollar Portfolio.
STOCKS 2010
p a G e 2 0 | t h e m o t l e y f o o l | S t o c k S 2 0 1 0 : t h e I n v e s t o r ’ s G u I d e t o t h e y e a r a h e a d
Somanetics: A Medical Trailblazer Clears a Path to Returns
by JIM GIllIEs
It’s not overstating the case to say that Somanetics (Nasdaq: SMTS) is improving the lives of adults, children, and infants. Its cerebral oximetry monitoring system (don’t worry, I’ll explain in a moment) cuts down on bad outcomes during and immediately after various surgical procedures, and promises improved care of the most fragile among us: infants and premature babies. The potential market, for better or worse, is huge, the company is well-run, and the stock is a value at current prices — that’s a prescription for investment in my book.
the coMpAnySo what’s all this cerebral oximetry stuff? In the simplest terms, it’s a process for
monitoring how much oxygen is in the blood flowing to and from the brain. Anyone who’s ever watched ER or even M*A*S*H knows why this is so important: Brain cells deprived of oxygen die within minutes, and even short-term oxygen deprivation can result in long-term damage.
To combat that scenario, Somanetics’ INVOS (In Vivo Optical Spectroscopy) system monitors changes in blood-oxygen levels in brain or other bodily tissue. The system consists of a portable monitor and disposable sensors that measure blood-oxygen levels in the underlying organs using harmless near-infrared light. INVOS is continuous and non-invasive (hands up if you enjoy catheters), allowing for immediate intervention if oxygen levels go suddenly awry.
The business model is classic “razor and blade,” in which the one-time sale of a system leads to recurring sales of its supporting parts. On average, about a quarter of Somanetics’ revenue comes from monitor hardware sales (the “razors”). The greater percentage of revenue is recurring — it stems from sensor sales (the “blades”) to the ever-larger installed monitor base. A direct sales force heads up sales and practitioner education in the United States, while in Europe, Canada, South Africa, and the Middle East, distribution is handled via a recently renewed deal with Covidien (NYSE: COV).
Clinical results are piling up in the company’s favor. Trials have shown statistically significant evidence that using INVOS reduces the incidence of major organ dysfunction, strokes, and other unfortunate outcomes. But the Holy Grail would be if INVOS eventually became the standard of care for the cardiovascular surgery theater. Fortunately, the medical professionals and researchers who will shape that outcome are compiling data to evaluate the usefulness of cerebral oximetry monitoring.
Somanetics is focused on expanding its reach. Having gotten its start in the adult cardiovascular surgery arena, it’s branched out in recent years into pediatric and neonatal intensive care. It also has received FDA clearance to expand its system’s use on these most sensitive of patients.
why Invest?Somanetics is a solid, quality business, run by long-term, conservative managers who
understand their product and their market opportunities.
That said, they manage the business a little differently than do similar medical technology companies backed by deep-pocketed venture capitalists. Essentially, the team
soMAnetIcs
Nasdaq: SMTSHeadquarters: Troy, Mich.www.somanetics.net
fInAncIAl snApshot
Recent Price: . . . . . . . . . . . . . . . . . . . . . . . $14.37Market Cap: . . . . . . . . . . . . . . . . . . $180 millionCash / Debt: . . . . . . . . . . . . . . $49.7 million / $0CAPS Rating: . . . . . . . . . . . . . . . . . . . . . . . .4 StarsBuy guidance: . . . . . . . . . . . . . . . Below $16
Data as of 11/10/09
why Buy
The company’s low-capital “razor and »blade” business model features high-margin recurring revenue.
The present valuation assumes that »a lull in monitor sales to hospitals will continue into any economic recovery and ignores an upcoming cash bump from an international sales partner.
It could be an acquisition target, »possibly within the next five years.

t h e m o t l e y f o o l | S t o c k S 2 0 1 0 : t h e I n v e s t o r ’ s G u I d e t o t h e y e a r a h e a d | p a G e 2 1
STOCKS 2010manages growth as a sort of “step function” — it methodically increases the company’s top line with existing resources until it feels it can take the next step toward exploiting growth opportunities. At that point, the team invests in new people and research. Such steps take time to pay off — but the associated costs ramp up immediately. This tends to scare off analysts who have difficulty getting past the near-term, “margins are going to get creamed” line of thinking. The company last announced one of these ramp-ups in January 2009. As we head into 2010, I’d expect to see the benefits of this investment start to play out and profit margins expand.
The company also has signed a new three-year distribution deal with Covidien. The original version was struck when Somanetics was much smaller and had less negotiating power. The new deal (commencing in February 2010) improves the transfer pricing between companies and will result in higher revenue, cash flow, and earnings even from flat sensor sales. And with an expanding monitor base in Europe, sensor sales are unlikely to be flat.
Somanetics definitely has momentum on its side right now. The company is systematically expanding its target markets via new FDA-approved labeling and new sensors developed for pediatric or neonatal intensive care patients. Plus, in 2008 the Society of Thoracic Surgeons (chest surgery), which drives best practices, added cerebral oximetry as a metric of interest. If analysis of the steadily compiling data is consistent with past clinical trials, it could move cerebral oximetry forward as a standard operating procedure. And in a health-care system that pays for good outcomes — and sues for the bad ones — such a distinction could greatly benefit Somanetics. Finally, I suspect that Somanetics could go the way of many medical-device makers and be acquired as it grows in size and scale. My lead horse would be distribution partner Covidien, which recently purchased Aspect Medical — maker of an operating-room anesthesia-monitoring system — for a fat 56% premium.
fInAncIAls And vAluAtIonI believe Somanetics is cheap in relation to its future
prospects. Today’s financial picture shows stalled growth as a result of sluggish hospital spending — but if these are the bad times, just imagine what’ll happen when things get good. I doubt the sluggishness will persist forever, and the more distant past was a pretty picture of consistency:
FY05 FY06 FY07 FY08 TTM*Revenue $20.5 $28.7 $38.6 $47.5 $49.2Cash Flow From Operations (CFO) $3.7 $7.3 $13.1 $15.9 $12.6CapEx $0.1 $0.6 $0.3 $0.7 $0.4Gross Margin 87% 88% 88% 87% 87%Operating Margin 25% 25% 28% 29% 25%Source: Company filings and analyst calculations. Fiscal years end Nov. 30. Trailing 12 months ends Aug. 30, 2009. Dollar amounts in millions.
Yes, recent revenue growth has slowed, and cash generation has fallen from its previous trajectory. But those are the result of
the one-two punch of hesitant hospital spending and increased R&D expenses, making results arguably look worse than they would under normal conditions. Ultimately, I believe cash generation will bounce back and operating margins will widen again — and then the market will likely pay up for such things.
We can sum up the balance sheet in four words: cash rich, debt free. The $180 million company has about 28% of its value backed by cold, hard cash. And even with the money-making lull illustrated above, it continues to crank out the green. So what to pay for it?
Somanetics is a very nominal cash tax payer, but with that changing in late 2010, I estimate that fully taxed trailing free cash flow is $10.7 million. This number leaves out the incremental benefit from the retooled Covidien agreement, though, leaving us at a depressed hardware sales level. Employing a weighted-outcome discounted cash flow model at a 12% discount and using three different growth scenarios suggests shares are worth north of $21 today.
Low Growth Medium Growth High GrowthYears 1-5 10% 12.5% 15%Years 6-10 5% 7.5% 10%Terminal Rate 3% 3% 3%Firm Value * $254.1 $286.6 $325.6Less – Direct and Contingent Liabilities ** $22.3 $22.3 $22.3
Equity Value $231.8 $264.4 $303.3Equity Value Per Share $19.18 $21.87 $25.09Valuation Weighting 40% 35% 25%Estimated Intrinsic Value Per Share $21.60
*Includes modest assumed cash value of remaining net operating loss carryforwards.**Present value of operating leases and outstanding stock options.Source: Analyst calculations. Dollars in millions.
So why the current undervaluation? I think it’s a combination of things that will pass with time: the constrained state of hospital budgets and potential health-care reform, Wall Street’s short-term focus (it’s uninterested in why profit margins are down — just the fact that they are down), and likely a fear of growing competitive threats. I believe those fears are overblown, but they’re worth acknowledging nevertheless.
rIsks And when we’d sellThat potential competition in the market for cerebral-oximetry
monitors does rank as a risk. Until now, Somanetics has largely had the field to itself, but micro-sized competitor CAS Medical (Nasdaq: CASM) has ramped up its competing Fore-Sight product. This is a low-grade threat: CAS has a poor history of value creation, and it has a cumulative record of negative free cash flow over the past decade. Moreover, it’s somewhat leveraged and is bleeding cash to meet its obligations.
The proverbial knife to the heart for CAS might be Somanetics’ recently filed patent-infringement suit. Somanetics asserts that CAS is stepping on its intellectual property, some
p a G e 2 2 | t h e m o t l e y f o o l | S t o c k S 2 0 1 0 : t h e I n v e s t o r ’ s G u I d e t o t h e y e a r a h e a d
STOCKS 2010of which has a decade of remaining exclusivity. Somanetics estimates that it will spend about $3 million pursuing this lawsuit, and I’m dubious that CAS can raise a similar amount to defend itself. While I expect Somanetics to achieve a favorable outcome — perhaps shelving CAS’ device for a while until CAS finds a patent workaround — the reality is that a deeper-pocketed competitor’s entry could spark an arms race that would leave all players somewhat impaired.
Another unforgiving fact is that Somanetics is something of a one-trick pony: It’s INVOS or bust. If future clinical data doesn’t match up with past research, the company’s bottom line could pay the price. And on the U.S. health-care reform front, management doesn’t believe that whatever reform eventually emerges will have much of an impact — positive or negative — on the company’s present results. But since reform remains an unknown, there’s inherent risk just being in this market.
the foolIsh BottoM lIneSomanetics offers that most compelling of value opportunities:
one tinged with tremendous growth potential, yet priced as if the temporary lull in growth is permanent. These types of situations — fat margins and cash generation — invariably attract competition, but Somanetics appears well-positioned on that front and may effectively cripple the one present competitor of consequence. And with the positive effect Somanetics has on people’s lives, you might find even more satisfaction with an investment here.
Jim Gillies is associate advisor of Motley Fool Options and an analyst at Motley Fool Hidden Gems. He owns shares of Somanetics.

t h e m o t l e y f o o l | S t o c k S 2 0 1 0 : t h e I n v e s t o r ’ s G u I d e t o t h e y e a r a h e a d | p a G e 2 3
STOCKS 2010
Take-Two Interactive: A Turnaround Tale Scores Big
by DaVID GarDNEr aND tIM bEyErs
tAke-two InterActIve
Nasdaq: TTWOHeadquarters: New York, N.Y.www.take2games.com
fInAncIAl snApshot
Recent share price:. . . . . . . . . . . . . . . . . . .$11.56Market Cap: . . . . . . . . . . . . . . . . . . 938.5 millionDividend Yield: . . . . . . . . . . . . . . . . . . . . . . . . . n/aCAPS Rating: . . . . . . . . . . . . . . . . . . . . . . . .4 StarsBuy guidance: . . . . . . . . . . . . . . . Below $13
Data as of 11/10/09
why Buy
Take-Two’s » Grand Theft Auto franchise is on the fast track to billion-dollar greatness, and it’s only getting better.
Wall Street hasn’t yet caught on to the »impressive opportunity with Take-Two.
New leadership is breathing fresh life »into an already healthy company.
In the video game business just like in Hollywood, franchises are the brass ring. And among gamers, few franchises equal Grand Theft Auto. We believe the GTA series is a billion-dollar brand by itself, yet its maker, Take-Two Interactive (Nasdaq: TTWO), trades for just over $900 million in market cap.
We believe the stock is worth much more, which is why Take-Two is such a great opportunity for 2010 and beyond. But this story is about more than just Grand Theft Auto, thanks to Take-Two’s underappreciated other titles, including sequels to BioShock, Max Payne, and Red Dead Redemption, which should unlock the hidden value that led Electronic Arts (Nasdaq: ERTS) to try to acquire the company in 2008. What EA didn’t do, you can — and it’s an investment where we think you’ll come out a winner.
the coMpAnyIf video games have gone Hollywood, it’s for good reason: Publishers are like
studios, and the biggest are just holding companies for the brands you’ve seen when the movie credits roll. Time Warner (NYSE: TWX) oversees Warner Bros.; Viacom (NYSE: VIA.B) owns Paramount Pictures; Sony (NYSE: SNE) is home to Columbia Pictures. The list goes on.
Each producer has delivered its hits, but Columbia — the third-highest grossing studio in 2009, according to Box Office Mojo — may be best known for producing the multibillion-dollar Spider-Man franchise and a series of similar action-adventure hits. In video games, Take-Two is Columbia Pictures, and Grand Theft Auto is Spider-Man.
But Take-Two isn’t without its troubles. Former management put the company through a stock options backdating scandal that dates to early 2007 and was recently settled out of court.
Since then, Chairman Strauss Zelnick has taken control of Take-Two in an investor coup. CEO Ben Feder remains a partner in Zelnick’s firm. That’s good news: ZelnickMedia helped orchestrate turnarounds at BMG Entertainment and Time Life.
We believe in Take-Two’s turnaround story and not just because of Zelnick’s and Feder’s management. We like the company’s assets, and we like Grand Theft Auto most of all.
why Invest?We see GTA, now in its 12th year, as a billion-dollar franchise. Here’s why: Roughly
one-third of those who own a video game console keep a copy of GTA in their library, Feder said at a recent investor conference hosted by Kaufman Bros. Can you imagine? There are millions of consoles in use around the world, and almost one-third of their owners spend time boosting virtual cars. As you let that sink in, consider this: Researcher NPD says that while U.S. console software sales reached $8.9 billion in 2008, Grand Theft Auto IV, by itself, generated $500 million in sales in its opening week in May.
Thinking of this in basketball terms: Grand Theft Auto is our franchise center. What makes this a championship stock for 2010 is Take-Two’s bench:

p a G e 2 4 | t h e m o t l e y f o o l | S t o c k S 2 0 1 0 : t h e I n v e s t o r ’ s G u I d e t o t h e y e a r a h e a d
STOCKS 2010Franchise Winners Games SoldGrand Theft Auto 88 millionCivilization 9 millionBioShock 3 millionMafia 2 millionSource: Management comments
Overall, 16 of Take-Two’s franchises have sold more than 1 million copies. We think that says something. Just as Columbia is the studio you want to work with if you’re an action movie producer, Take-Two is the studio that hardcore gamers turn to for action-adventure titles.
Consider Borderlands, a new shooter that Feder praised effusively at the Kaufman Bros. conference. His enthusiasm could prove prescient. Ars Technica reviewer Ben Kuchera gave the game his Buy recommendation, and GameSpot’s critics give it an 8.5 out of 10 — and its users score it even higher, a 9.0 out of 10.
These high ratings are right in line for Take-Two’s games. A lesser-known title, Red Dead Redemption, is due next year and is already collecting raves for impressive graphics and storytelling in the trailer. “As good as RDR looks, its gameplay sounds equally impressive given the demo we got during PAX 2009,” wrote joystiq’s Randy Nelson. His comments confirm what we have long known but the market doesn’t seem to understand: Take-Two is about a lot more than just Grand Theft Auto.
fInAncIAls And vAluAtIonPricing Take-Two is at once simple and complex. Let’s do
the easy part first. We know from sales figures and third-party research that GTA is a wonderful franchise. Given the billions in revenue it has produced, and its level of global penetration, we believe it’s safe to value Grand Theft Auto at $1 billion.
Second, we know others value Take-Two’s assets — Electronic Arts, specifically. In 2008, EA was willing to pay roughly $2 billion for the company. We concede that plenty has changed since EA’s pursuit of Take-Two last year, but we also think $2 billion is a reasonable target market value for the business. Remember: This is a company that develops, markets, and sells dozens of franchises, 16 of which have achieved the video game world’s equivalent of gold-record status: 1 million copies sold. At current prices, we’re not only are paying less than what the GTA franchise is worth, but also 15 other gold-record franchises.
We’re also encouraged by history. In December of 2005, EA pledged $671 million to acquire JAMDAT Mobile — roughly 50 times EBITDA (earnings before interest, taxes, depreciation and amortization expenses), and within spitting distance of what the company was willing to pay for Take-Two last year.
Today, Take-Two’s enterprise value to EBITDA sits at just 16 times. Even if you discount for the fear and loathing that exists in today’s market, we can see EA or someone else bidding for
Take-Two at twice that multiple if the company can execute on upcoming product launches.
Why do we believe the stock is poised to pop? Just look at Take-Two’s upcoming schedule. Four high-profile sequels — all gritty shooters, cut from the GTA mold — are due in 2010:
Expected 2010 Releases Platforms Sales Expectations (?)BioShock 2 PS3, Xbox 360, PC ShooterMafia II PS3, Xbox 360, PC ShooterMax Payne 3 PS3, Xbox 360, PC ShooterRed Dead Redemption PS3, Xbox 360 ShooterSource: SEC filings
BioShock is an undersea adventure in a ruined city of mutants and misanthropes. Fans have flocked to the game, buying more than 3 million copies since 2007. History tells us that Take-Two has a reasonable chance to top that total with the sequel. Investors also see value in BioShock 2. After announcing a delay in the game’s scheduled release — and a corresponding reduction in revenue and earnings guidance — Take-Two’s stock fell nearly 10% in a day. Take-Two is now on schedule to release BioShock 2 in February.
rIsks And when we’d sellAt today’s $11 stock price, Take-Two is a growth story gone
wrong. A turnaround could be in the making, as we suspect, but it’s important to remember that this stock trades on the cheap not because Wall Street is stupid but because Take-Two didn’t deliver when it was supposed to.
History tells a sobering story. Take-Two cut guidance in 2005 because of product delays. Grand Theft Auto IV — the $500 million record-setter — was delayed multiple times, and Mafia II, Red Dead Redemption, and BioShock 2 were all delayed into fiscal 2010. What’s to keep Take-Two on schedule this time?
Desperation may very well be the only answer, because these are unprecedented times. Take-Two bled through $164 million in cash over the past year. Never before has Take-Two spent so much in a given fiscal year. Worse, the company has never turned a $100 million full-year profit. Further delays would mean more red ink, and more red ink could lead to unprecedented losses.
Of course, Zelnick, Feder, and the team know this, and we believe that Feder wouldn’t have been touting Take-Two’s 2010 schedule at the Kaufman Bros. conference if he hadn’t taken steps to hold the line on its latest schedule. Should there be new delays with BioShock 2 or any of the other key 2010 titles mentioned above, we’d advise selling.
the foolIsh BottoM lIneTake-Two Interactive is already selling for less than what we
believe is the fair value of its Grand Theft Auto franchise. Odder still is that the Street is unaware of the budding value of its
t h e m o t l e y f o o l | S t o c k S 2 0 1 0 : t h e I n v e s t o r ’ s G u I d e t o t h e y e a r a h e a d | p a G e 2 5
STOCKS 2010in-development franchises — winners such as BioShock, which has already sold more than 3 million copies worldwide.
Fortunately, ignorance is a short-term phenomenon on Wall Street. Analysts will finally wake-up when BioShock puts up good numbers, forcing them to revisit the reasons EA bid $2 billion for Take-Two last year. We believe that’s fair value here, Fools, and it gives today’s investors plenty of room to ride.
David Gardner, co-founder of The Motley Fool, is the advisor for Motley Fool Rule Breakers and co-advisor of Motley Fool Stock Advisor with his brother and Fool co-founder, Tom. David owns shares of Activision Blizzard, Electronic Arts, and Time Warner.
Tim Beyers is a member of David’s Rule Breakers stock-picking team and a contributor to The Motley Fool’s online content and special reports.
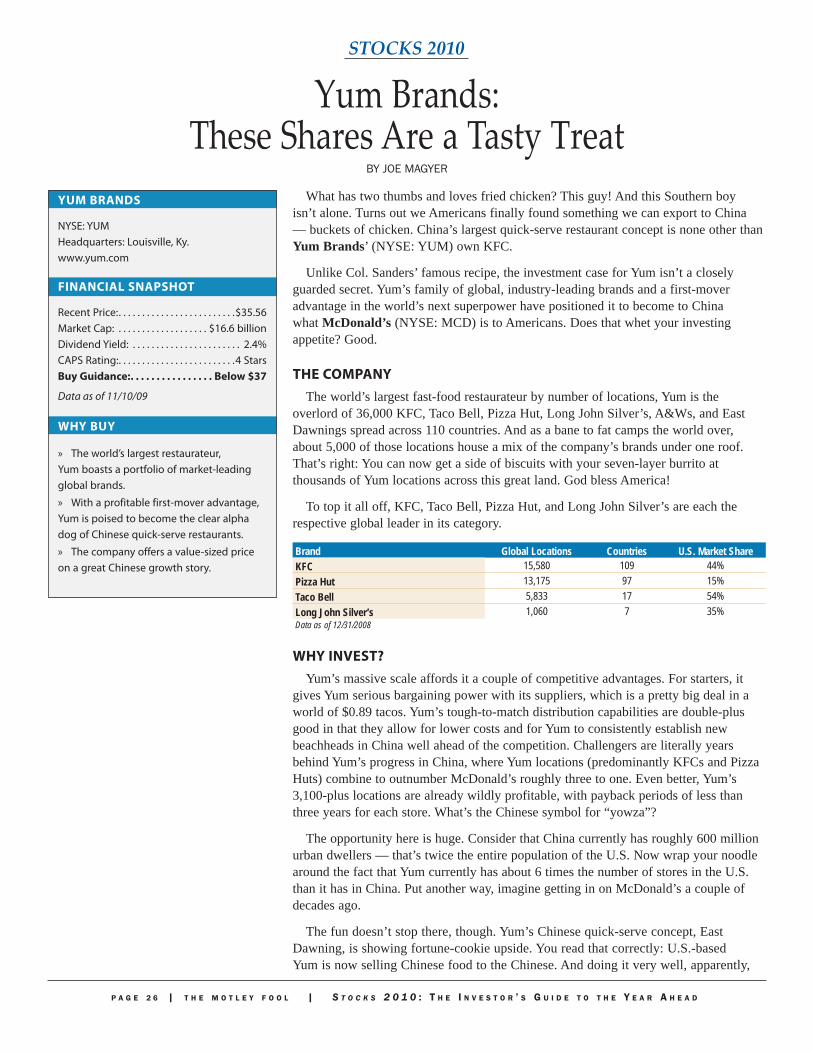
STOCKS 2010
p a G e 2 6 | t h e m o t l e y f o o l | S t o c k S 2 0 1 0 : t h e I n v e s t o r ’ s G u I d e t o t h e y e a r a h e a d
Yum Brands: These Shares Are a Tasty Treat
by JOE MaGyEr
What has two thumbs and loves fried chicken? This guy! And this Southern boy isn’t alone. Turns out we Americans finally found something we can export to China — buckets of chicken. China’s largest quick-serve restaurant concept is none other than Yum Brands’ (NYSE: YUM) own KFC.
Unlike Col. Sanders’ famous recipe, the investment case for Yum isn’t a closely guarded secret. Yum’s family of global, industry-leading brands and a first-mover advantage in the world’s next superpower have positioned it to become to China what McDonald’s (NYSE: MCD) is to Americans. Does that whet your investing appetite? Good.
the coMpAnyThe world’s largest fast-food restaurateur by number of locations, Yum is the
overlord of 36,000 KFC, Taco Bell, Pizza Hut, Long John Silver’s, A&Ws, and East Dawnings spread across 110 countries. And as a bane to fat camps the world over, about 5,000 of those locations house a mix of the company’s brands under one roof. That’s right: You can now get a side of biscuits with your seven-layer burrito at thousands of Yum locations across this great land. God bless America!
To top it all off, KFC, Taco Bell, Pizza Hut, and Long John Silver’s are each the respective global leader in its category.
Brand Global Locations Countries U.S. Market ShareKFC 15,580 109 44%Pizza Hut 13,175 97 15%Taco Bell 5,833 17 54%Long John Silver’s 1,060 7 35%Data as of 12/31/2008
why Invest?Yum’s massive scale affords it a couple of competitive advantages. For starters, it
gives Yum serious bargaining power with its suppliers, which is a pretty big deal in a world of $0.89 tacos. Yum’s tough-to-match distribution capabilities are double-plus good in that they allow for lower costs and for Yum to consistently establish new beachheads in China well ahead of the competition. Challengers are literally years behind Yum’s progress in China, where Yum locations (predominantly KFCs and Pizza Huts) combine to outnumber McDonald’s roughly three to one. Even better, Yum’s 3,100-plus locations are already wildly profitable, with payback periods of less than three years for each store. What’s the Chinese symbol for “yowza”?
The opportunity here is huge. Consider that China currently has roughly 600 million urban dwellers — that’s twice the entire population of the U.S. Now wrap your noodle around the fact that Yum currently has about 6 times the number of stores in the U.S. than it has in China. Put another way, imagine getting in on McDonald’s a couple of decades ago.
The fun doesn’t stop there, though. Yum’s Chinese quick-serve concept, East Dawning, is showing fortune-cookie upside. You read that correctly: U.S.-based Yum is now selling Chinese food to the Chinese. And doing it very well, apparently,
yuM BrAnds
NYSE: YUMHeadquarters: Louisville, Ky.www.yum.com
fInAncIAl snApshot
Recent Price:. . . . . . . . . . . . . . . . . . . . . . . . .$35.56Market Cap: . . . . . . . . . . . . . . . . . . . $16.6 billionDividend Yield: . . . . . . . . . . . . . . . . . . . . . . . 2.4%CAPS Rating:. . . . . . . . . . . . . . . . . . . . . . . . .4 StarsBuy guidance:. . . . . . . . . . . . . . . . Below $37
Data as of 11/10/09
why Buy
The world’s largest restaurateur, »Yum boasts a portfolio of market-leading global brands.
With a profitable first-mover advantage, »Yum is poised to become the clear alpha dog of Chinese quick-serve restaurants.
The company offers a value-sized price »on a great Chinese growth story.

t h e m o t l e y f o o l | S t o c k S 2 0 1 0 : t h e I n v e s t o r ’ s G u I d e t o t h e y e a r a h e a d | p a G e 2 7
STOCKS 2010with the average East Dawning posting sales of about 85% of typical Chinese KFC locations. With only 19 units currently operating, it will take East Dawning more than a little time to meaningfully contribute to Yum’s bottom line. Still, there’s great potential to leverage Yum’s existing scale and add fuel to this grease fire of growth.
Yum isn’t your traditional restaurant play in that it actually owns only about 20% of its system restaurants — most of the rest are operated by franchisees. Along with footing the bulk of restaurant-level costs, franchisees pay Yum a fixed rate on their stores’ gross revenue. Here in the states, that typically shakes out in the realm of 5% to 6%. Essentially, Yum is renting its brands to franchisees in exchange for a cut of their sales. Reflecting the joys of that high-return, asset-light approach, CEO and Chairman David Novak is looking to slash Yum’s percentage of owned U.S. stores to less than 10% by the end of 2010. Yum’s franchising model dominates its corporate strategy with one glaring exception — China — where the stores are so profitable that Yum wants to own the whole profit pie outright.
fInAncIAls And vAluAtIon Yum has a long history of taking care of shareholders. The
company consistently gins out several hundred million in free cash flow, fueling a 2.4% dividend yield and a solid reputation for share repurchases.
Yum’s cash flows are steady, but its debt load is nothing to sneeze at. Net debt stands at about $2.9 billion, with $650 million of that coming due in 2011. That might be a concern for a lesser company, but Yum’s consistent profitability affords it ready access to the credit markets to refinance the debt, meaning that you have nothing to lose sleep over.
2005 2006 2007 2008Revenue (in millions) $9,349 $9,561 $10,416 $11,279Operating margin 11.6% 13.0% 12.6% 12.7%Earnings per share $1.28 $1.46 $1.68 $1.96Weighted-average shares outstanding (in millions) 597 564 541 491
I approached Yum’s valuation from two angles. The first is the relative sniff test. Yum’s shares trade at about 16 times earnings. That may not instantly appeal to you value types out there, but this smacks of a bargain given that we’re talking about a solid cash generator that makes a third of its operating profits from an established, growing, and almost laughably profitable unit in China. When you consider that Chinese-listed stocks trade at much higher valuations than U.S. companies and that an increasing portion of Yum’s profits are coming from China, paying 16 times earnings suddenly doesn’t seem the least bit pricy. That passes the sniff test.
Now for the ringer. I ran Yum’s business through a discounted cash flow analysis, allowing for what averages out to be 5% annual revenue growth over the next 15 years alongside a smidge of margin expansion thanks to heightened focus on franchising
and the fat-margined profits of the fast-growing Chinese locations. Assuming an 11.5% required return of the equity in my discount rate, I value the shares at $43 apiece, making for about 21% upside from recent prices.
But there’s a sneaky kicker: I valued Yum assuming that the dollar’s relationship to the Chinese yuan remains unchanged. Given our soaring deficits and trade imbalance with China, though, it’s likely that the dollar will weaken against the yuan as the Chinese slowly move to allow their currency to float more freely in the years ahead. A stronger yuan means bigger profits for Yum — and higher returns for shareholders. Think of that currency swing as pure potential, while also acting as a low-key hedge for your portfolio.
rIsks And when we’d sellYum isn’t without its challenges. Its U.S. results have been
stagnant for several years running, and there’s no silver bullet for a quick turnaround. Yes, Yum has had recent wins with the likes of its successful Kentucky Grilled Chicken launch, but quick-serve rivals McDonald’s, Chipotle Mexican Grill (NYSE: CMG), and Domino’s Pizza (NYSE: DPZ) aren’t exactly taking their toys and going home. These guys came to play. For that matter, I also expect McDonald’s, which already has more than 1,000 locations in China to continue to expand there, though there’s certainly room for both companies to light it up in their respective niches.
Another Yum-specific risk is its slow shift to a franchise-focused model here in the U.S. A lower proportion of company-owned restaurants will amp up returns on invested capital, which I love, but the move also places more control in the hands of franchisees. Like all restaurant plays, Yum is also exposed to commodity price swings.
That said, the Yum investment thesis hinges on growth in China. I would consider cutting bait if the Chinese growth story sputtered out for more than a couple of quarters. I’m not too concerned about that angle, but that and the blanket risks associated with investing in China are worth keeping tabs on. Also, if Mr. Market offered me north of 25 times earnings for my shares, I’d oblige him. Yum could be operating on all cylinders, but I’m not interested in hanging onto overvalued stocks.
the foolIsh BottoM lIneFried chicken and free cash — that’s a winning recipe. Yum
boasts market-leading positions with several key brands and an already-profitable first-mover advantage in what could become the world’s largest dining market. Yum.
Joe Magyer is senior analyst for Inside Value, the Fool’s value-driven investing service.
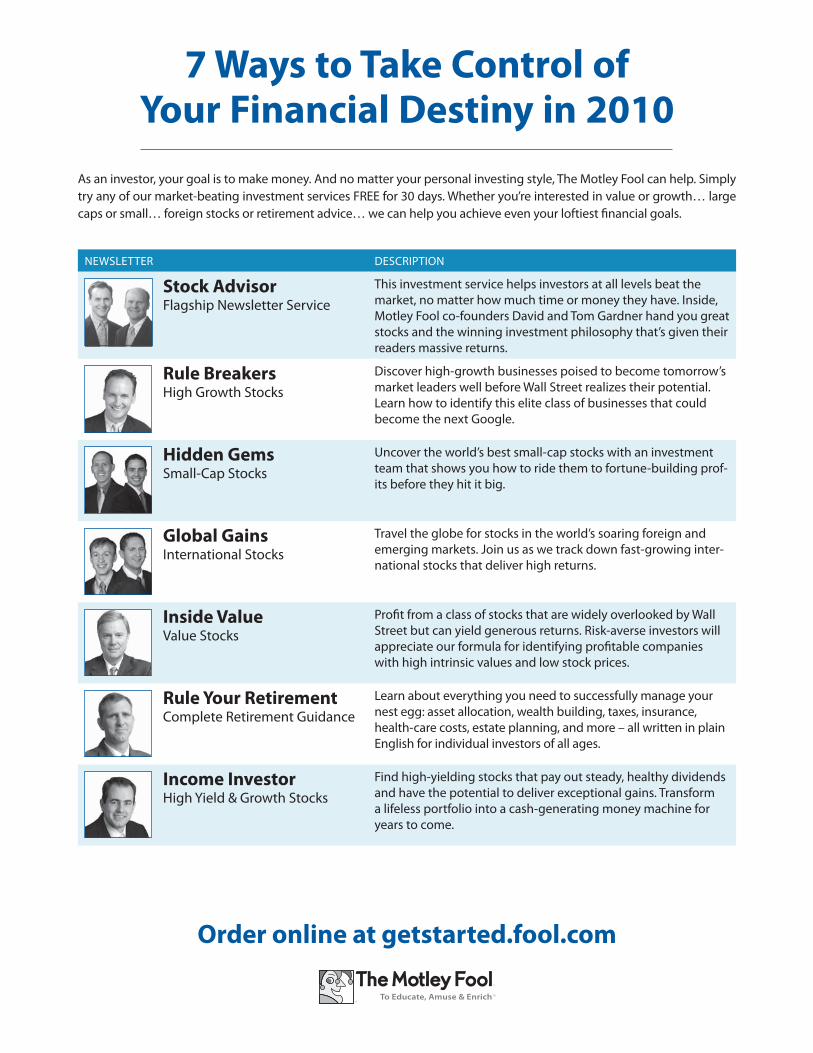
NEWSLETTER DESCRIPTION
stock Advisor Flagship Newsletter Service
This investment service helps investors at all levels beat the market, no matter how much time or money they have. Inside, Motley Fool co-founders David and Tom Gardner hand you great stocks and the winning investment philosophy that’s given their readers massive returns.
rule Breakers High Growth Stocks
Discover high-growth businesses poised to become tomorrow’s market leaders well before Wall Street realizes their potential. Learn how to identify this elite class of businesses that could become the next Google.
hidden gems Small-Cap Stocks
Uncover the world’s best small-cap stocks with an investment team that shows you how to ride them to fortune-building prof-its before they hit it big.
global gains International Stocks
Travel the globe for stocks in the world’s soaring foreign and emerging markets. Join us as we track down fast-growing inter-national stocks that deliver high returns.
Inside value Value Stocks
Profit from a class of stocks that are widely overlooked by Wall Street but can yield generous returns. Risk-averse investors will appreciate our formula for identifying profitable companies with high intrinsic values and low stock prices.
rule your retirement Complete Retirement Guidance
Learn about everything you need to successfully manage your nest egg: asset allocation, wealth building, taxes, insurance, health-care costs, estate planning, and more – all written in plain English for individual investors of all ages.
Income Investor High Yield & Growth Stocks
Find high-yielding stocks that pay out steady, healthy dividends and have the potential to deliver exceptional gains. Transform a lifeless portfolio into a cash-generating money machine for years to come.
7 ways to take control of your financial destiny in 2010
order online at getstarted.fool.com
As an investor, your goal is to make money. And no matter your personal investing style, The Motley Fool can help. Simply try any of our market-beating investment services FREE for 30 days. Whether you’re interested in value or growth… large caps or small… foreign stocks or retirement advice… we can help you achieve even your loftiest financial goals.