stokes shift: synthesis, characterization and bio … 7kh5r\do6rflhw\ri&khplvwu\ s2 ellipsoids...
TRANSCRIPT
S1
Highly fluorescent water soluble spirobifluorene dye with large Stokes shift: synthesis, characterization and bio-applicationsFriederike Schlüter, Kristina Riehemann, Nermin Seda Kehr, Silvio Quici, Constantin G. Daniliuc, Fabio Rizzo*
Supporting Information
Table of Contents1. General Information
2. Synthesis
3. Crystal structure
4. Photophysical Characterization
5. Fluorescence Microscopy and Cell Viability Assay
6. NMR and Mass Spectra
7. References
1. General Information
Chemicals. All reagents from commercial sources were uses without further purification, unless
otherwise noted. All dry reactions were performed under Ar atmosphere using glassware that was
flamed under high-vacuum and backfilled with Ar. Organic solvents were dried by keeping them over
molecular sieves 4A. Column chromatography was carried out on silica gel Si60, mesh size 0.040-
0.063 mm (Merck, Darmstadt, Germany). Flash chromatography was carried out on silica gel mesh
size 230-400 (J. T. Baker) and TLC on aluminum sheets pre-coated with silica gel 60 F254 (E.
Merck). 1H NMR (400 MHz) and 13C NMR (101 MHz) spectra were obtained with a Bruker Avance
400 spectrometer. Chemical shifts (δ) are given as part per million (ppm) downfield from
tetramethylsilane. The assignment of protons and carbon atoms was carried out by bidimensional
NMR experiments (COSY, heterocorrelate 1H-13C). The coupling constants J are given in Hz.
Electrospray ionization (ESI) mass spectroscopy was performed by using a Fourier Transform Ion
Cyclotron Resonance (FT-ICR) Mass Spectrometer APEX II and Xmass Software (Bruker Daltonics)
at the Centro Interdipartimentale Grandi Apparecchiature (University of Milano).
X-Ray diffraction: Data sets for the compound 4 were collected with a D8 Venture Dual Source 100
CMOS diffractometer. Programs used: data collection: APEX2 V2014.5-0;[S1] cell refinement: SAINT
V8.34A;[S1] data reduction: SAINT V8.34A;[S1] absorption correction, SADABS V2014/2;[S1] structure
solution SHELXT-2014;[S2] structure refinement SHELXL-2014[S2] and graphics, XP.[S3] Thermals
Electronic Supplementary Material (ESI) for ChemComm.This journal is © The Royal Society of Chemistry 2017

S2
ellipsoids are shown with 50% probability. R-values are given for observed reflections, and wR2
values are given for all reflections.
Photophysical experiments. UV-Vis measurements were performed on a Varian Cary 100 double-
beam spectrophotometer and baseline corrected. Extinction molar coefficients were calculated by
interpolation of data obtained from 5 solutions. UV-Vis measurements at different temperature were
carried out on a Jasco V-650 double-beam spectrophotometer equipped with temperature controller
and cooling system, and baseline corrected. Steady-state emission and excitation spectra were
recorded on a Fluorolog-3 (Horiba Jobin Yvon) spectrofluorimeter equipped with double-grating
monochromator in both the excitation and emission sides, and coupled to a R928P Hamamatsu
photomultiplier; a 450 W Xe arc lamp was used as the excitation source. The emission spectra were
corrected for detection and optical spectral response of the spectrofluorimeter through a calibration
curve supplied by the manufacturer. Fluorescence lifetimes were recorded on a FluoTime300
spectrometer from PicoQuant equipped with two emission monochromators (Czerny-Turner,
selectable gratings blazed at 500 nm with 2.7 nm/mm dispersion and 1200 grooves/mm, or blazed
at 1250 nm with 5.4 nm/mm dispersion and 600 grooves/mm), Glan-Thompson polarizers for
emissions, PMA Hybrid 40 (transit time spread FWHM < 120 ps, 300 –720 nm) as detector and used
in TCSPC mode by a PicoHarp 300 (minimum base resolution of 4 ps). Lifetime analysis was
performed using the commercial FluoFit software. The quality of the fit was assessed by minimizing
the reduced 2 function and visual inspection of the weighted residuals and their autocorrelation.
Luminescence quantum yields were measured with a Hamamatsu Photonics absolute PL quantum
yield measurement system (C9920-02) equipped with a L9799-01 CW xenon light source (150 W),
monochromator, C7473 photonic multichannel analyzer, integrating sphere and employing U6039-
05 PLQY measurement software (Hamamatsu Photonics, Ltd., Shizuoka, Japan).
2. Synthesis
Br Br Br
O
Br Br
Mg1)
2)
Et2O dry
Br Br
OH H+
2
Scheme S1. Synthesis of 2,7-dibromo-9,9’-spirobifluorene (2).
2,7-dibromo-9,9’-spirobifluorene (2). The spirobifluorene core 2 were synthesized following the procedure
reported in literature.[S4] 2-Bromobiphenyl (1.65 ml, 9.73 mmol) dissolved in dry Et2O (40 ml) was slowly added
dropwise to a flask containing Mg (262 mg, 10.76 mmol) under Ar and then refluxed for 4 h to form the
corresponding Grignard compound. The solution was added dropwise to a suspension of 2,7-dibromo-9-
fluorenone (3.27 g, 9.67 mmol) in dry Et2O (70 ml), thus refluxed overnight. After cooling to RT, the reaction
was quenched by adding saturated NH4Cl aqueous solution (100 ml). After separation of the two phases, the

S3
aqueous phase was extracted with Et2O (2 x 30 ml). The collected organic phases were washed with H2O (1
x 30 ml) and dried over MgSO4 before removing the solvent in vacuo. The fluorenol intermediate product
crystallized from CH2Cl2/Hexane mixture as white solid (3.55 g, 7.22 mmol, 75%) was then solubilized in hot
glacial acetic acid (50 ml). The addition of few drops of concentrated HCl under stirring induced the precipitation
of the desired product as white solid, which was collected by filtration (2.83 g, 83%, 61% overall yield).
NH2 Br
O
N
O O
N
O ON
O O
B
Br
O O
+Toluene dry
Pd(OAc)2
PtBu3
NaOtBu
NBSCHCl3
nBuLi
OB O
O
THF dry
2)
-78 °C RT
1)
3
A
B
95%
90%
79%
0 °C RT
Scheme S2. Synthesis of 4-(N,N-di(4-methoxyphenyl)amino)phenylboronic pinacol ester (3).
N,N-di(4-methoxyphenyl)aniline (A). The catalyst was obtained by stirring at RT for 30 minutes Pd(OAc)2
(74 mg, 0.329 mmol) and PtBu3 (1M in toluene, 0.53 ml) in dry toluene (1 ml) under Ar in a Schlenk tube. The
yellow solution was transferred to a Schlenk tube containing aniline (1.0 ml, 10.95 mmol), 4-bromo-anisole
(3.0 ml, 23.96 mmol) and NaOtBu (3.14 g, 32.67 mmol) in dry toluene (12 ml) and refluxed overnight under
vigorous stirring. After cooling to RT, saturated NH4Cl aqueous solution (20 ml) was added and the phases
separated. The aqueous phase was extracted with EtOAc (2 x 20 ml) and dried over MgSO4 before removing
the solvent under vacuum. The crude was purified over silica gel column by eluting with Cyclohexane/EtOAc
(10:1) to give the desired product as off-white solid (3.2 g, 95%). 1H NMR (300 MHz, CD2Cl2, 25 °C): 7.19-6.80 (m, 13H, H-phenyl), 3.78 (s, 6H, OCH3) ppm.
4-bromo-N,N-di(4-methoxyphenyl)aniline (B). In a flask A (6.71 g, 21.99 mmol) was solubilized in CHCl3
(30 ml) and cooled to 0 °C with an ice bath. N-bromosuccinimide (NBS) (3.93 g, 22.08 mmol) solubilized in
CHCl3 (30 ml) was added dropwise at 0 °C, afterwards the solution was stirred overnight at RT. The solution
was poured in H2O (100 ml), thus the phases were separated. The organic phase was dried over MgSO4
before removing the solvent under vacuum and the crude was purified over silica gel column by eluting with
pentane/CH2Cl2 (4:1) to give the product as off-white solid (7.6 g, 90%).1H NMR (300 MHz, CD2Cl2, 25 °C): 7.23 (d, 2H, J = 8.9 Hz, H-phenyl), 7.03 (d, 4H, J = 9.0 Hz, H-phenyl), 6.83
(d, 4H, J = 9.0 Hz, H-phenyl), 6.76 (d, 2H, J = 8.9 Hz, H-phenyl), 3.77 (s, 6H, OCH3) ppm.
S4
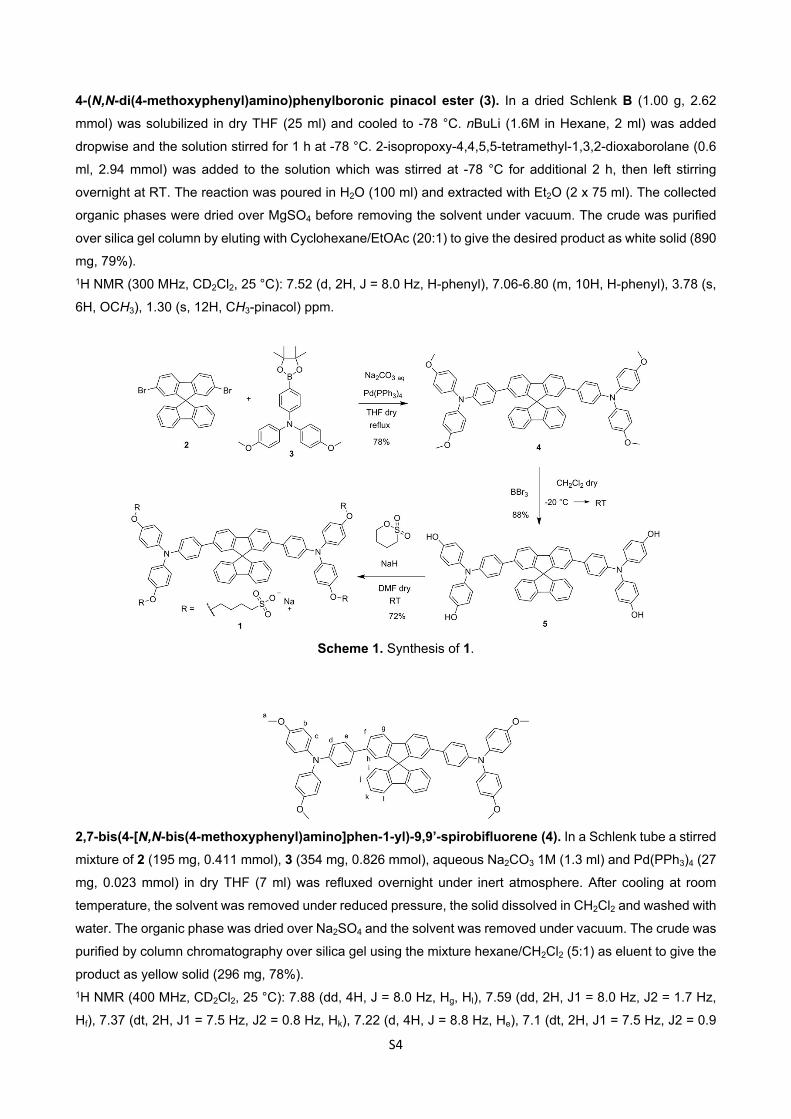
4-(N,N-di(4-methoxyphenyl)amino)phenylboronic pinacol ester (3). In a dried Schlenk B (1.00 g, 2.62
mmol) was solubilized in dry THF (25 ml) and cooled to -78 °C. nBuLi (1.6M in Hexane, 2 ml) was added
dropwise and the solution stirred for 1 h at -78 °C. 2-isopropoxy-4,4,5,5-tetramethyl-1,3,2-dioxaborolane (0.6
ml, 2.94 mmol) was added to the solution which was stirred at -78 °C for additional 2 h, then left stirring
overnight at RT. The reaction was poured in H2O (100 ml) and extracted with Et2O (2 x 75 ml). The collected
organic phases were dried over MgSO4 before removing the solvent under vacuum. The crude was purified
over silica gel column by eluting with Cyclohexane/EtOAc (20:1) to give the desired product as white solid (890
mg, 79%).1H NMR (300 MHz, CD2Cl2, 25 °C): 7.52 (d, 2H, J = 8.0 Hz, H-phenyl), 7.06-6.80 (m, 10H, H-phenyl), 3.78 (s,
6H, OCH3), 1.30 (s, 12H, CH3-pinacol) ppm.
Scheme 1. Synthesis of 1.
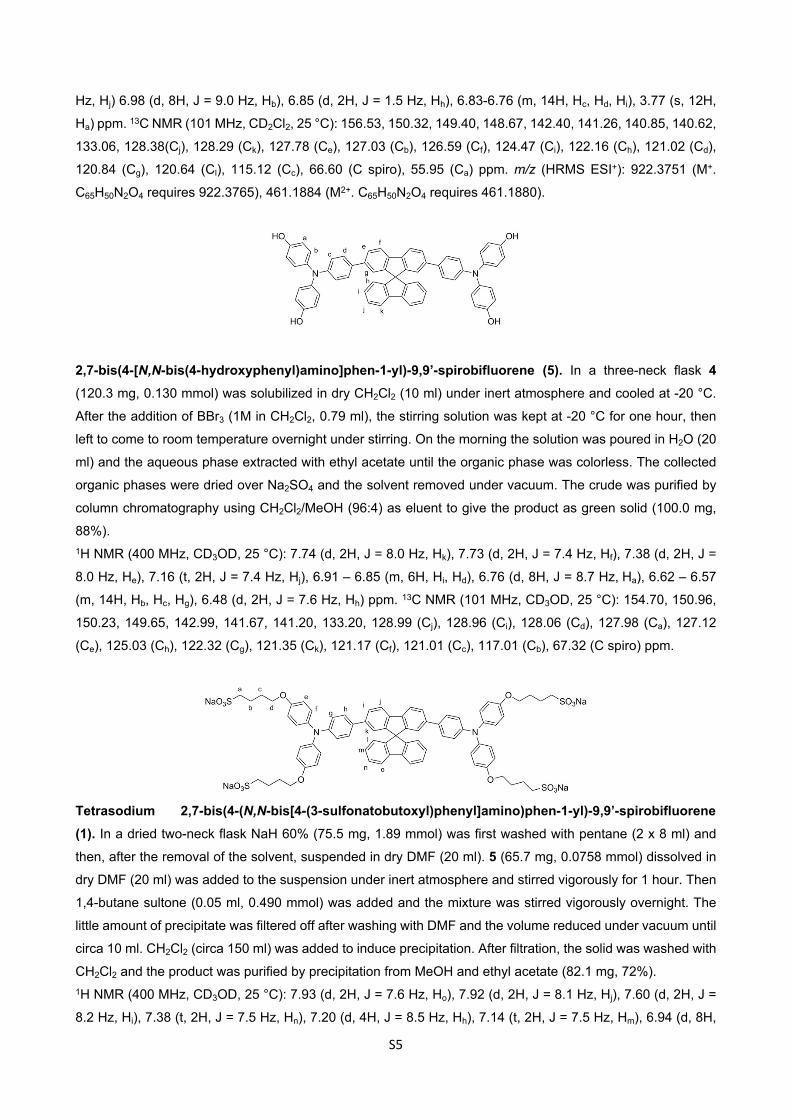
2,7-bis(4-[N,N-bis(4-methoxyphenyl)amino]phen-1-yl)-9,9’-spirobifluorene (4). In a Schlenk tube a stirred
mixture of 2 (195 mg, 0.411 mmol), 3 (354 mg, 0.826 mmol), aqueous Na2CO3 1M (1.3 ml) and Pd(PPh3)4 (27
mg, 0.023 mmol) in dry THF (7 ml) was refluxed overnight under inert atmosphere. After cooling at room
temperature, the solvent was removed under reduced pressure, the solid dissolved in CH2Cl2 and washed with
water. The organic phase was dried over Na2SO4 and the solvent was removed under vacuum. The crude was
purified by column chromatography over silica gel using the mixture hexane/CH2Cl2 (5:1) as eluent to give the
product as yellow solid (296 mg, 78%).1H NMR (400 MHz, CD2Cl2, 25 °C): 7.88 (dd, 4H, J = 8.0 Hz, Hg, Hl), 7.59 (dd, 2H, J1 = 8.0 Hz, J2 = 1.7 Hz,
Hf), 7.37 (dt, 2H, J1 = 7.5 Hz, J2 = 0.8 Hz, Hk), 7.22 (d, 4H, J = 8.8 Hz, He), 7.1 (dt, 2H, J1 = 7.5 Hz, J2 = 0.9
S5
Hz, Hj) 6.98 (d, 8H, J = 9.0 Hz, Hb), 6.85 (d, 2H, J = 1.5 Hz, Hh), 6.83-6.76 (m, 14H, Hc, Hd, Hi), 3.77 (s, 12H,
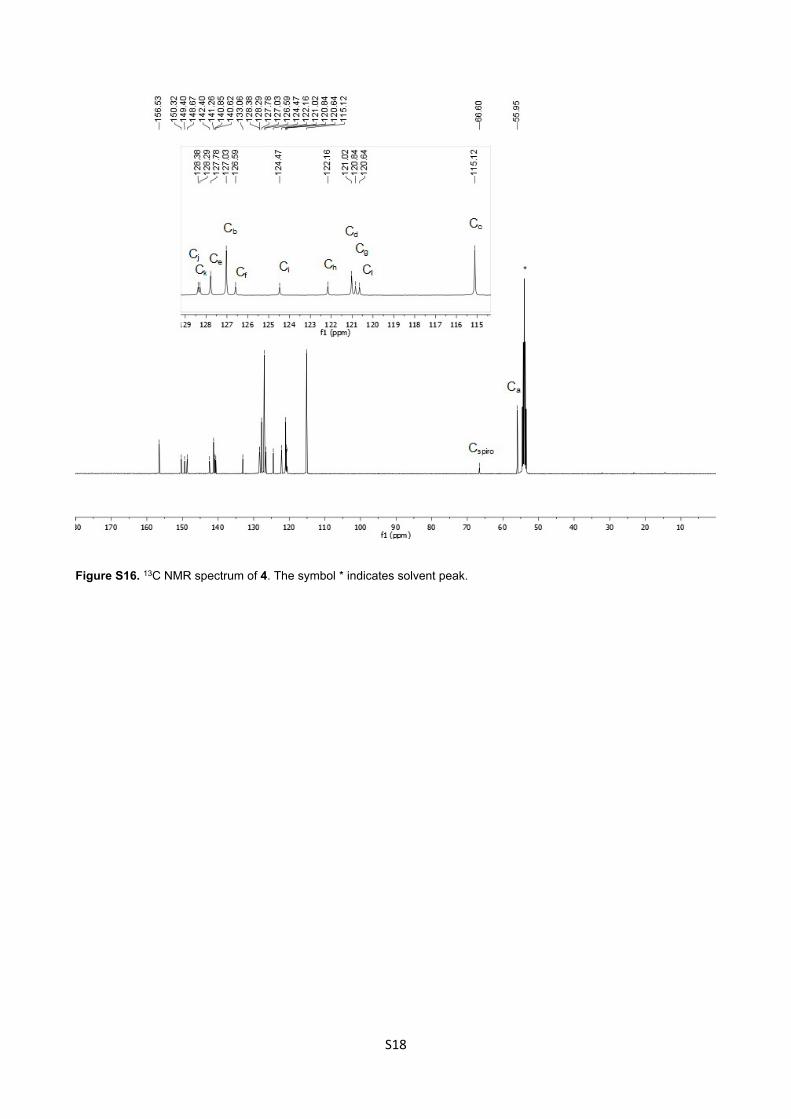
Ha) ppm. 13C NMR (101 MHz, CD2Cl2, 25 °C): 156.53, 150.32, 149.40, 148.67, 142.40, 141.26, 140.85, 140.62,
133.06, 128.38(Cj), 128.29 (Ck), 127.78 (Ce), 127.03 (Cb), 126.59 (Cf), 124.47 (Ci), 122.16 (Ch), 121.02 (Cd),
120.84 (Cg), 120.64 (Cl), 115.12 (Cc), 66.60 (C spiro), 55.95 (Ca) ppm. m/z (HRMS ESI+): 922.3751 (M+.
C65H50N2O4 requires 922.3765), 461.1884 (M2+. C65H50N2O4 requires 461.1880).
2,7-bis(4-[N,N-bis(4-hydroxyphenyl)amino]phen-1-yl)-9,9’-spirobifluorene (5). In a three-neck flask 4
(120.3 mg, 0.130 mmol) was solubilized in dry CH2Cl2 (10 ml) under inert atmosphere and cooled at -20 °C.
After the addition of BBr3 (1M in CH2Cl2, 0.79 ml), the stirring solution was kept at -20 °C for one hour, then
left to come to room temperature overnight under stirring. On the morning the solution was poured in H2O (20
ml) and the aqueous phase extracted with ethyl acetate until the organic phase was colorless. The collected
organic phases were dried over Na2SO4 and the solvent removed under vacuum. The crude was purified by
column chromatography using CH2Cl2/MeOH (96:4) as eluent to give the product as green solid (100.0 mg,
88%).1H NMR (400 MHz, CD3OD, 25 °C): 7.74 (d, 2H, J = 8.0 Hz, Hk), 7.73 (d, 2H, J = 7.4 Hz, Hf), 7.38 (d, 2H, J =
8.0 Hz, He), 7.16 (t, 2H, J = 7.4 Hz, Hj), 6.91 – 6.85 (m, 6H, Hi, Hd), 6.76 (d, 8H, J = 8.7 Hz, Ha), 6.62 – 6.57
(m, 14H, Hb, Hc, Hg), 6.48 (d, 2H, J = 7.6 Hz, Hh) ppm. 13C NMR (101 MHz, CD3OD, 25 °C): 154.70, 150.96,
150.23, 149.65, 142.99, 141.67, 141.20, 133.20, 128.99 (Cj), 128.96 (Ci), 128.06 (Cd), 127.98 (Ca), 127.12
(Ce), 125.03 (Ch), 122.32 (Cg), 121.35 (Ck), 121.17 (Cf), 121.01 (Cc), 117.01 (Cb), 67.32 (C spiro) ppm.
Tetrasodium 2,7-bis(4-(N,N-bis[4-(3-sulfonatobutoxyl)phenyl]amino)phen-1-yl)-9,9’-spirobifluorene (1). In a dried two-neck flask NaH 60% (75.5 mg, 1.89 mmol) was first washed with pentane (2 x 8 ml) and
then, after the removal of the solvent, suspended in dry DMF (20 ml). 5 (65.7 mg, 0.0758 mmol) dissolved in
dry DMF (20 ml) was added to the suspension under inert atmosphere and stirred vigorously for 1 hour. Then
1,4-butane sultone (0.05 ml, 0.490 mmol) was added and the mixture was stirred vigorously overnight. The
little amount of precipitate was filtered off after washing with DMF and the volume reduced under vacuum until
circa 10 ml. CH2Cl2 (circa 150 ml) was added to induce precipitation. After filtration, the solid was washed with
CH2Cl2 and the product was purified by precipitation from MeOH and ethyl acetate (82.1 mg, 72%).1H NMR (400 MHz, CD3OD, 25 °C): 7.93 (d, 2H, J = 7.6 Hz, Ho), 7.92 (d, 2H, J = 8.1 Hz, Hj), 7.60 (d, 2H, J =
8.2 Hz, Hi), 7.38 (t, 2H, J = 7.5 Hz, Hn), 7.20 (d, 4H, J = 8.5 Hz, Hh), 7.14 (t, 2H, J = 7.5 Hz, Hm), 6.94 (d, 8H,

S6
J = 9.0 Hz, He), 6.83 – 6.79 (m, 12H, Hf, Hg), 6.75 – 6.71 (m, 4H, Hk, Hl), 3.96 (t, 8H, J = 6.0 Hz, Hd), 2.87 (t,
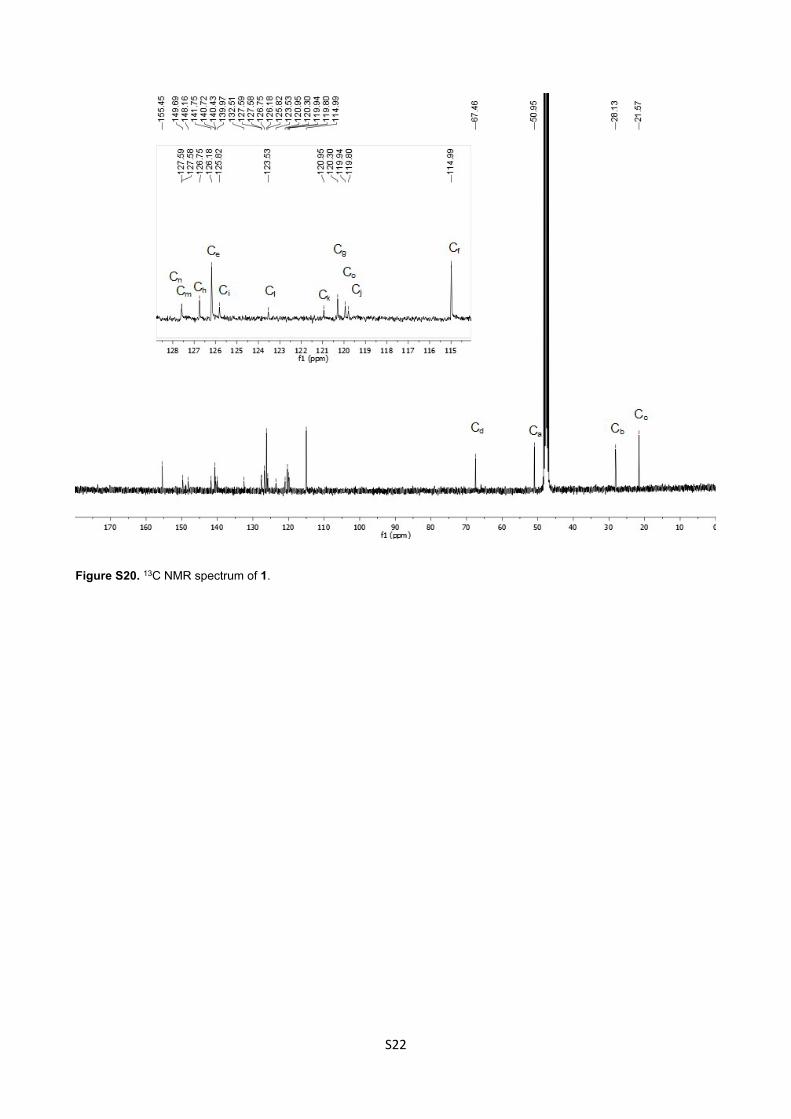
8H, J1 = 7.3, J2 = 7,9, Ha), 2.00 – 1.85 (m, 16H, Hb, Hc) ppm. 13C NMR (101 MHz, CD3OD, 25 °C): 155.45,
149.69, 148.16, 141.75, 140.72, 140.43, 139.97, 132.51, 127.59 (Cn), 127.58 (Cm), 126.75 (Ch), 126.18 (Ce),
125.82 (Ci), 123.53 (Cl), 120.95 (Ck), 120.30 (Cg), 119.94(Co), 119.80 (Cj), 114.99 (Cf), 67.47 (Cd), 50.95 (Ca),
28.12 (Cb), 21.57 (Cc) ppm.
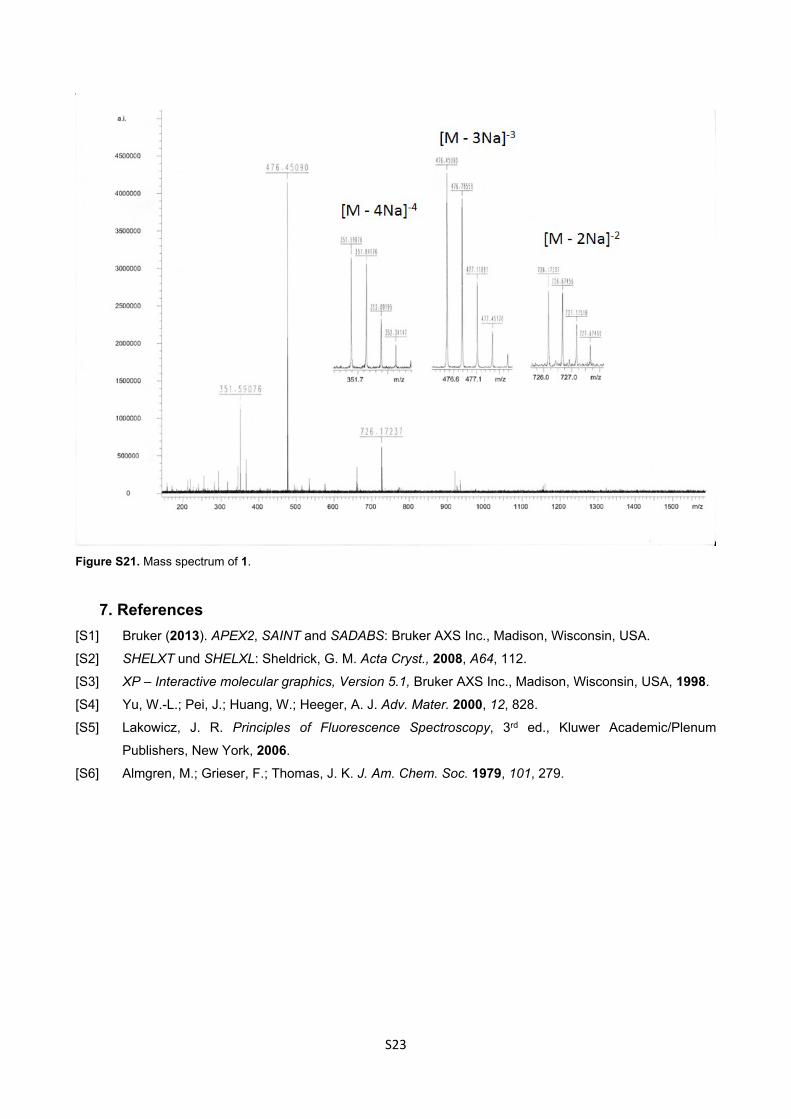
m/z (HRMS ESI+): 351.5907 (M4-. C77H70N2O16S4 requires 351.5907), 476.4509 (M3-. C77H70N2O16S4Na
requires 476.4507), 726.1724 (M2-. C77H70N2O16S4Na2 requires 726.1707).
3. Crystal structure
X-ray crystal structure analysis of 4: A pale yellow prism-like specimen of C65H50N2O4,
approximate dimensions 0.030 mm x 0.049 mm x 0.231 mm, was used for the X-ray crystallographic
analysis. The X-ray intensity data were measured. A total of 839 frames were collected. The total
exposure time was 19.81 hours. The frames were integrated with the Bruker SAINT software
package using a narrow-frame algorithm. The integration of the data using a monoclinic unit cell
yielded a total of 52300 reflections to a maximum θ angle of 25.03° (0.84 Å resolution), of which
8385 were independent (average redundancy 6.237, completeness = 99.9%, Rint = 12.89%, Rsig =
11.35%) and 5434 (64.81%) were greater than 2σ(F2). The final cell constants of a = 14.9397(9) Å,
b = 9.2935(5) Å, c = 34.6459(18) Å, β = 98.609(2)°, volume = 4756.1(5) Å3, are based upon the
refinement of the XYZ-centroids of 9938 reflections above 20 σ(I) with 4.541° < 2θ < 55.03°. Data
were corrected for absorption effects using the multi-scan method (SADABS). The ratio of minimum
to maximum apparent transmission was 0.756. The calculated minimum and maximum transmission
coefficients (based on crystal size) are 0.9820 and 0.9980. The structure was solved and refined
using the Bruker SHELXTL Software Package, using the space group P21/n, with Z = 4 for the
formula unit, C65H50N2O4. The final anisotropic full-matrix least-squares refinement on F2 with 739
variables converged at R1 = 9.91%, for the observed data and wR2 = 16.04% for all data. The
goodness-of-fit was 1.186. The largest peak in the final difference electron density synthesis was
0.294 e-/Å3 and the largest hole was -0.276 e-/Å3 with an RMS deviation of 0.066 e-/Å3. On the basis
of the final model, the calculated density was 1.289 g/cm3 and F(000), 1944 e-.

S7
Figure S1. Crystal structure of compound 4. Thermal ellipsoids are shown at 50% probability
(A)
(B)
Figure S2. Excerpt of packing diagram of compound 4 presenting non-covalent interactions. (A) CH… interactions along
the a-axis, (B) CH…O interactions involving all four methoxy groups in 4. Only the involved hydrogen atoms are shown.
S8
Table S1. Non-covalent intermolecular interactions CH…O and CH… in compound 1 (Å and deg)a
D-H...A d(D-H) d(H...A) d(D...A) (DHA)C53-H53…O2#1 0.95 2.687 3.421 134.6C23-H23…O1#2 0.95 2.790 3.603 144.0C14-H14…O3#3 0.95 2.771 3.705 168.0C36-H36…O3#3 0.95 2.590 3.300 131.7C17-H17…O4#4 0.95 2.566 3.434 151.9C42-H42…Cg#5, a 0.95 2.477 3.301 144.9C46-H46…Cg#6, b 0.95 2.883 3.741 150.9C47-H47…Cg#7, c 0.98 2.678 3.461 137.2C56-H56…Cg#5, d 0.95 2.877 3.819 171.0C57-H57…Cg#8, e 0.95 2.661 3.621 166.2C83-H83…Cg#9, f 0.95 2.635 3.576 155.7C76-H76…Cg#10, g 0.95 2.887 3.719 146.9C87-H87…Cg#10, h 0.98 2.957 3.862 154.0
a Symmetry transformations used to generate equivalent atoms: #1 –x, -y+2, -z+1; #2 –x+1/2, y-1/2, -z+1/2; #3 –x+3/2, y-1/2, -z+1/2; #4 –x+2, -y, -z+1; #5 x-1, y-1, z; #6 x-1, y+1, z; #7 –x+1/2, y+1/2, -z+1/2; #8 –x+1, -y+1, -z+1; #9 x+1, y-1, z; #10 x+1, y, z; a Cg is the ring centroid of atoms C61/C62/C63/C64/C65/C66; b Cg is the centroid of atoms C65/C66; c Cg is the ring centroid of atoms C6/C7/C18/C19/C20/C21; d Cg is the centroid of atoms C12/C13; e Cg is the centroid of atoms C82/C83/C84; f Cg is the centroid of atoms C31/C32/C33; g Cg is the centroid of atoms C42/C43; h Cg is the centroid of atoms C5/C17.
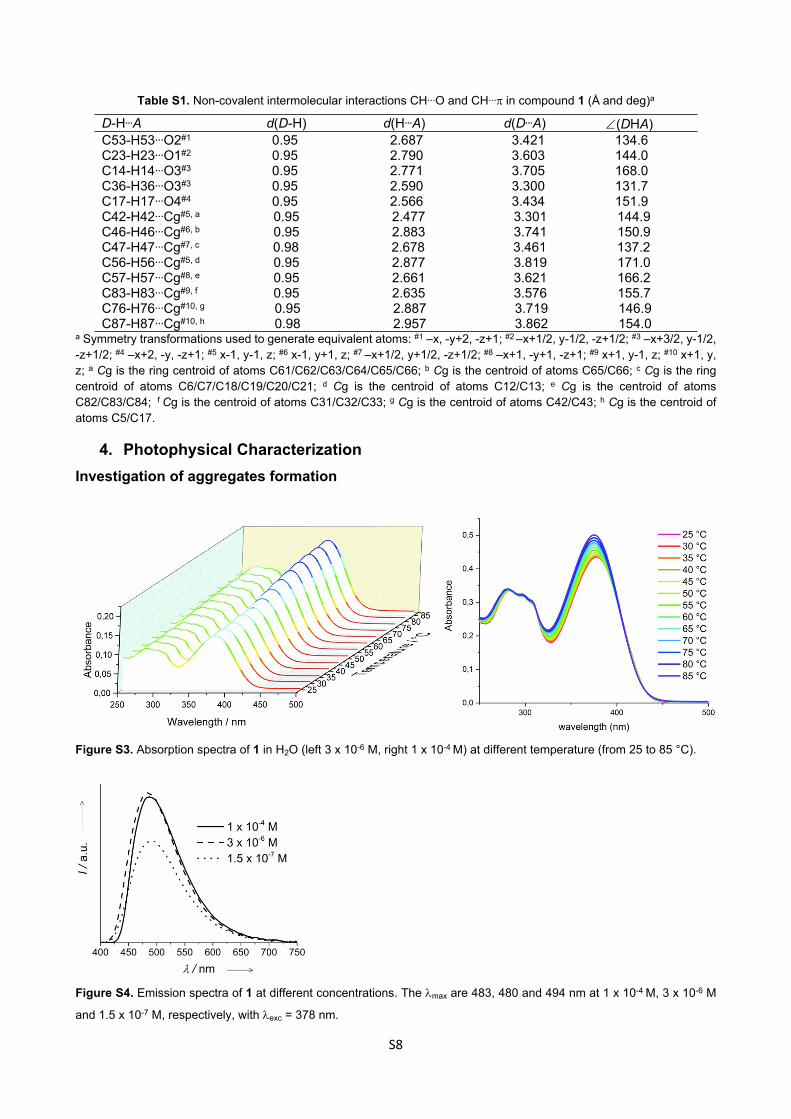
4. Photophysical CharacterizationInvestigation of aggregates formation
Figure S3. Absorption spectra of 1 in H2O (left 3 x 10⁻⁶ M, right 1 x 10⁻⁴ M) at different temperature (from 25 to 85 °C).
Figure S4. Emission spectra of 1 at different concentrations. The max are 483, 480 and 494 nm at 1 x 10⁻⁴ M, 3 x 10⁻⁶ M
and 1.5 x 10⁻⁷ M, respectively, with exc = 378 nm.

S9
Viscosity experiments
Table S2. Summary of viscosity experiment data.
MeOH/glycerol Viscosity (cP)
Abs(nm)
Emission (nm)
Lifetime(ns) Chi2
10:0 0.54 379 487 2.74 (93%) 0.08 (7%) 0.987
9:1 1.1 379 488 2.88 (98%) 0.17 (2%) 1.049
7:3 5.1 380 492 2.98 (98%) 0.27 (2%) 1.041
5:5 22.5 382 4923.00 (94%) 0.88 (4%) 0.12 (2%)
1.013
3:7 100.0 383 4922.92 (90%) 0.92 (7%) 0.17 (3%)
0.985
1:9 443.2 385 4842.86 (74%) 1.26 (17%) 0.39 (8%)
0.988
Figure S5. Change of the intensity emission with the concentration of glycerol.
Effect of pH on photophysical properties of the free dye 1The measurements were performed by solubilizing 1 in solution with different pH: aqueous
HCl (pH 2.4), acetate buffer (pH 3.8), phosphate buffer (pH 5.9), phosphate buffer (pH 8.1), aqueous
NaOH (pH 12.2).

S10
Figure S6. a) PL of 1 recorded at different pH (3 µM, exc = 378 nm); b) change of the intensity at PL maximum vs. pH.
Interaction with BSATwo stock solutions of BSA (3.00 x 10⁻⁵ M) and of 1 (1.00 x 10⁻⁴ M) in PBS (pH 7.2) was
prepared and the aliquots of biomolecule stock solutions were incubated with 3 μM solution of 1 in
a total volume of 3 ml for each probe for absorption and emission experiments.
a) b)
Figure S7. Effect of the presence of BSA in aqueous solution of 1 (3 µM) a) in absorption, b) under common UV laboratory
lamp (left: without protein; right: with BSA (0.8 µM)).
Calculation of the detection limitThe detection limit (or limit of detection, LOD) was calculated using the formula:
𝐿𝑂𝐷 = 𝑆 𝑁𝜎𝑠
where S/N is the signal-to-noise ratio (= 3), the standard deviation of the blank solution and s the
slope of the calibration curve. The standard deviation was obtained measuring 10 independent
samples of 1 (3 µM) as blank and calculating the corresponding standard deviation. The calibration
curve is obtained measuring the fluorescence intensity at different concentration of BSA and s is the
slope obtained fitting the points in the linear range.

S11
Table S3. Summary of photophysical data of 1 in different local environment.
[a] Measurements performed using 3 µM of 1. [b] Recorded exciting at 378 nm.
Binding Constant EvaluationStern-Volmer Analysis
Two stock solutions of BSA (3.00 x 10⁻⁵ M) and of 1 (1.00 x 10⁻⁴ M) in PBS (pH 7.2) were
prepared and the aliquots of dye stock solutions were incubated with 2.5 μM solution of BSA in a
total volume of 3 ml for each probe for absorption and emission experiments.
The quenching of the BSA emission can be described by the standard Stern-Volmer equation𝐼0 𝐼 = 1 + 𝐾𝑆𝑉[𝑄] = 1 + 𝑘𝑞𝜏0[𝑄]
where I0 and I are respectively the fluorescence intensities in the absence and presence of 1, KSV is
the Stern-Volmer quenching constant, kq is the bimolecular quenching rate constant, 0 is the
average lifetime of BSA without the quencher (= 1 x 10⁻⁸ s)[S5] and [Q] is the concentration of 1. The
I values have been corrected by the inner filter effect.[S5]
solvent[a]Abs
nm
PL[b]
nm
Stokes shift
cm-1 (nm)
fwhm
cm-1
PBS 378 4805620
(102)3610
PBS with
BSA378 461
4760
(83)3210
Triton X-100 385 4624280
(77)3580
SDS 378 4775490
(99)3670
CTAB 382 4925850
(110)3890
Tween 20 385 4764970
(91)3680
S12
a) b)
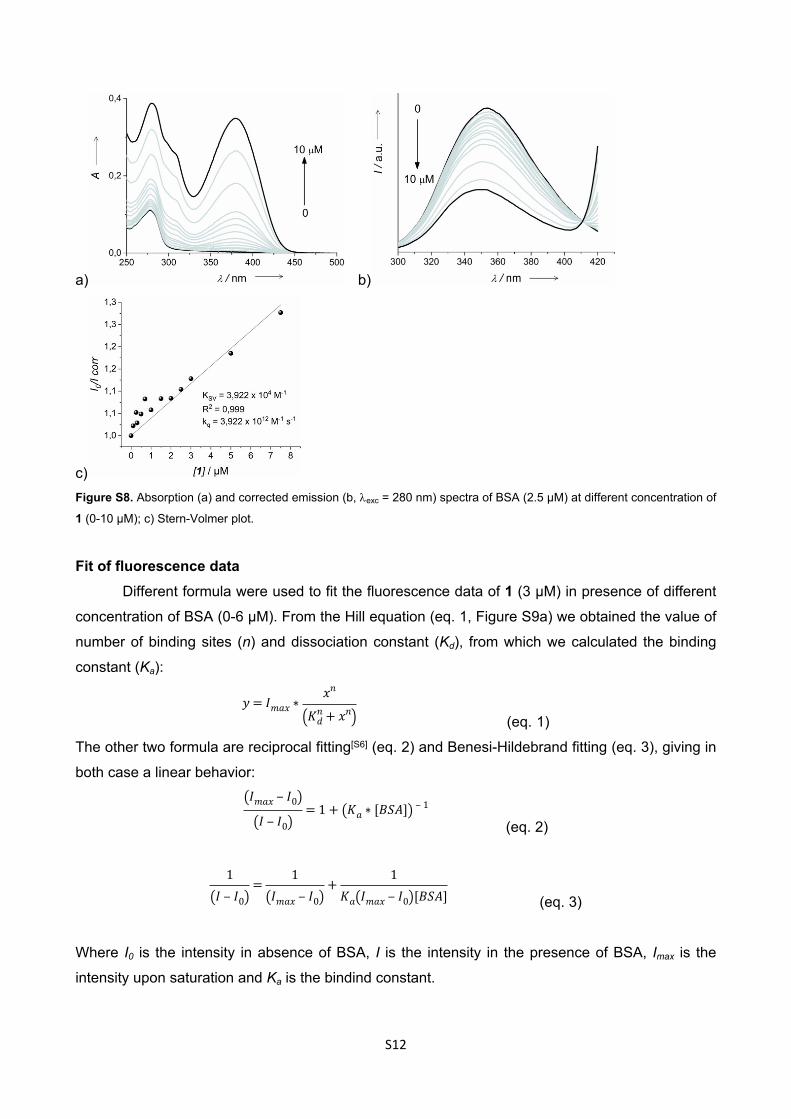
c)Figure S8. Absorption (a) and corrected emission (b, exc = 280 nm) spectra of BSA (2.5 µM) at different concentration of
1 (0-10 µM); c) Stern-Volmer plot.
Fit of fluorescence dataDifferent formula were used to fit the fluorescence data of 1 (3 µM) in presence of different
concentration of BSA (0-6 µM). From the Hill equation (eq. 1, Figure S9a) we obtained the value of
number of binding sites (n) and dissociation constant (Kd), from which we calculated the binding
constant (Ka):
(eq. 1)𝑦 = 𝐼𝑚𝑎𝑥 ∗
𝑥𝑛
(𝐾𝑛𝑑 + 𝑥𝑛)
The other two formula are reciprocal fitting[S6] (eq. 2) and Benesi-Hildebrand fitting (eq. 3), giving in
both case a linear behavior:
(eq. 2)
(𝐼𝑚𝑎𝑥 ‒ 𝐼0)(𝐼 ‒ 𝐼0)
= 1 + (𝐾𝑎 ∗ [𝐵𝑆𝐴]) ‒ 1
(eq. 3)
1
(𝐼 ‒ 𝐼0)=
1
(𝐼𝑚𝑎𝑥 ‒ 𝐼0)+
1𝐾𝑎(𝐼𝑚𝑎𝑥 ‒ 𝐼0)[𝐵𝑆𝐴]
Where I0 is the intensity in absence of BSA, I is the intensity in the presence of BSA, Imax is the
intensity upon saturation and Ka is the bindind constant.

S13
Figure S9. Different fitting of fluorescence data of 1 in presence of BSA.
Interaction with other proteinsStock solutions of BSA (3.00 x 10⁻⁵ M), pepsin (2.00 x 10⁻⁵ M), protamine sulfate (1.00 x 10⁻⁴
M), horseradish peroxidase (HRP, 2.00 x 10⁻⁵ M) and of 1 (1.00 x 10⁻⁴ M) in PBS (pH 7.2) were
prepared. Aliquots of biomolecule stock solutions (1 µM) were incubated with 3 μM solution of 1 in a
total volume of 3 ml for each probe for absorption and emission experiments.
Figure S10. Absorption spectra (left) of 1 in presence of different proteins (1 µM); PL spectra (right, exc = 378 nm) of
1 (3 µM, PBS): a) with different proteins (1 µM), b) variations on the intensity depending on the proteins.
Selective-site determination in 1:BSA binary systemStock solutions of 1:BSA (3:1 µM) in water, dansylamide (DNSA) and Ibuprofen in DMSO
(3 mM) were prepared. The dye:protein solution was divided in two parts. PL intensity was
measured after successive addition of competitive ligand for every solution. The displacement was
calculated by using the following formula:
𝑑𝑖𝑠𝑝𝑙𝑎𝑐𝑒𝑚𝑒𝑛𝑡(%) = (𝐼0 𝐼 ‒ 1) ∗ 100
S14
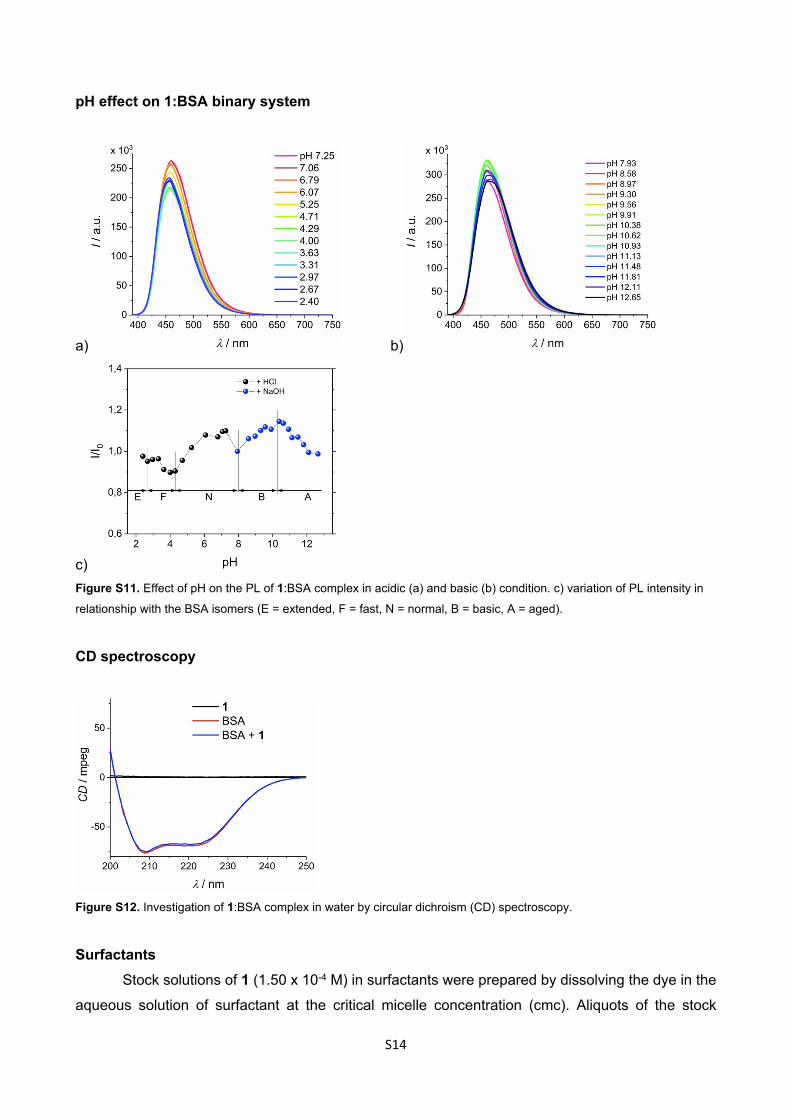
pH effect on 1:BSA binary system
a) b)
c)Figure S11. Effect of pH on the PL of 1:BSA complex in acidic (a) and basic (b) condition. c) variation of PL intensity in
relationship with the BSA isomers (E = extended, F = fast, N = normal, B = basic, A = aged).
CD spectroscopy
Figure S12. Investigation of 1:BSA complex in water by circular dichroism (CD) spectroscopy.
SurfactantsStock solutions of 1 (1.50 x 10⁻⁴ M) in surfactants were prepared by dissolving the dye in the
aqueous solution of surfactant at the critical micelle concentration (cmc). Aliquots of the stock

S15
solutions (60 µl) were diluted in a total volume of 3 ml to have 3 µM as final concentration for
absorption and emission experiments.
Figure S13. Top: Absorption spectra of 1 (3 µM) in different surfactants. Below: PL spectra (exc = 378 nm) of 1 (3 µM,
PBS): a) in different surfactants, b) normalized PL.
5. Fluorescence Microscopy and Cell Viability Assay
Cell Culture and Fluorescence MicroscopyThe primary dermal fibroblast cells (ATCC, USA) were cultured in fibroblast basal medium
supplemented with fibroblast growth kit low serum (ATCC, USA). Human Umbilical Vein Endothelial
cells (HUVECs; ATCC, USA) were cultured in Endothelial Cell Growth Medium.
Macrophages were isolated from buffycoats of the peripheral blood obtained from the Red Cross
taken from healthy volunteers. Briefly, mononuclear cells were prepared via Ficoll gradient
centrifugation followed by subsequent isolation of CD14 positive cells by magnetic associated cell
sorting (MACS, Miltenyi Biotec GmbH, Bergisch Gladbach, Germany). The purity of at least 95% of
positive cells was determined by flow cytometry in an Agilent 2100 Bioanalyzer (Agilent Technologies
Deutschland GmbH, Waldbronn, Germany).
The cells were incubated at 37° C and 5% CO2 in a humidified atmosphere. For microscopically
analysis cell were cultured on coverslips and incubated for 24h hours with substance 1 (1 µM or 50
µM), subsequently followed by microscopically analysis with a fluorescence microscope (Nikon
Instruments Europe B. V., Germany).
S16
Cell Viability XTT Assay
The cells were cultured as described above. The cell viability assay (XTT, Sigma-Aldrich
Chemie Gmbh, Munich, Germany) was applied according to the manufacturers protocol. Briefly, cells
were seeded in a 96 well plate. For the test cells were incubated for 18 h with substance 1 (1 µM
and 50 µM), for solvent control for the same time with 10 µL H2O. For positive control cells were
incubated for 0.5 h with 60 µg/ml Digitonin. Absorbance was measured using a microplate reader
(FluoStar Optima, Agilent Technologies, Santa Clara, USA). For evaluation, cell viability was
determined as percentage of the negative control. Digitonin served as positive control, water solvent
as negative control, respectively.
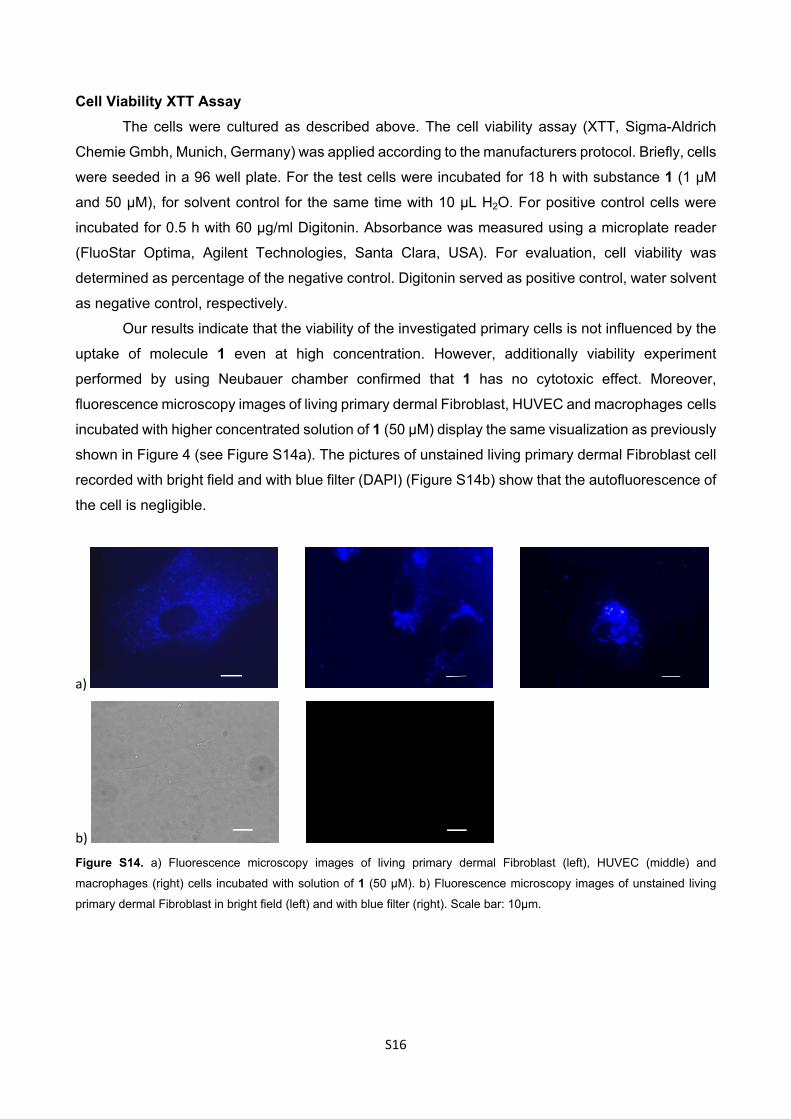
Our results indicate that the viability of the investigated primary cells is not influenced by the
uptake of molecule 1 even at high concentration. However, additionally viability experiment
performed by using Neubauer chamber confirmed that 1 has no cytotoxic effect. Moreover,
fluorescence microscopy images of living primary dermal Fibroblast, HUVEC and macrophages cells
incubated with higher concentrated solution of 1 (50 µM) display the same visualization as previously
shown in Figure 4 (see Figure S14a). The pictures of unstained living primary dermal Fibroblast cell
recorded with bright field and with blue filter (DAPI) (Figure S14b) show that the autofluorescence of
the cell is negligible.
a)
b)
Figure S14. a) Fluorescence microscopy images of living primary dermal Fibroblast (left), HUVEC (middle) and
macrophages (right) cells incubated with solution of 1 (50 µM). b) Fluorescence microscopy images of unstained living
primary dermal Fibroblast in bright field (left) and with blue filter (right). Scale bar: 10µm.

S17
6. NMR and Mass Spectra
Figure S15. 1H NMR spectrum of 4. The symbol * indicates solvent peak.
S18
Figure S16. 13C NMR spectrum of 4. The symbol * indicates solvent peak.

S19
Figure S17. 1H NMR spectrum of 5. The symbol * indicates solvent peak.

S20
Figure S18. 13C NMR spectrum of 5. The symbol * indicates solvent peak.

S21
Figure S19. 1H NMR spectrum of 1. The symbol * indicates solvent peak.
S22
Figure S20. 13C NMR spectrum of 1.
S23
Figure S21. Mass spectrum of 1.
7. References[S1] Bruker (2013). APEX2, SAINT and SADABS: Bruker AXS Inc., Madison, Wisconsin, USA.
[S2] SHELXT und SHELXL: Sheldrick, G. M. Acta Cryst., 2008, A64, 112.
[S3] XP – Interactive molecular graphics, Version 5.1, Bruker AXS Inc., Madison, Wisconsin, USA, 1998.
[S4] Yu, W.-L.; Pei, J.; Huang, W.; Heeger, A. J. Adv. Mater. 2000, 12, 828.
[S5] Lakowicz, J. R. Principles of Fluorescence Spectroscopy, 3rd ed., Kluwer Academic/Plenum
Publishers, New York, 2006.
[S6] Almgren, M.; Grieser, F.; Thomas, J. K. J. Am. Chem. Soc. 1979, 101, 279.