stop “qe” insanity - · pdf fileinsanity don schreiber, jr. ... wbi shares...
TRANSCRIPT
T H E M A G A Z I N E
Stop “QE” Insanity
WBI's Investment Management Style
p.01
p.05

Stop
SInsanity
Don Schreiber, Jr.Founder & CEO of WBI
top the Insanity!In response to the 2008 Financial Crisis, governments around the world, led by the U.S. Federal Reserve, developed a series of monetary policy tools to try to stabilize the financial
system. The two primary policy tools they have employed are a zero interest rate policy (ZIRP) and quantitative easing (QE).
WBI Shares Magazine sat down with Mr. Don Schreiber, Jr., Founder and CEO of WBI, to find out his thoughts on the current market environment.
WBI Shares Magazine: Mr. Schreiber, you believe these QE policies have created a high-risk paradigm for investors. Can you explain your views?
Don Schreiber, Jr.: We fear that investors who fail to understand the growing gap between fundamental value and current market prices are at risk of buying high and selling low once again.
Why “ZIRP and QE”?The main ideas behind these policies were to provide excess liquidity to the banking system to foster loan growth and to encourage investors to move into riskier assets, including corporate bonds, high-yield bonds, and stocks with higher yields. The Fed has argued that these policies would create a “wealth effect,” increasing asset prices which would increase consumption and economic growth. Many investors bought
in on each positive ZIRP and QE announcement believing the Fed provided a backstop to asset prices and piled into risky assets blindly.
WBI Mag: With the Fed reversing course on monetary policy for the first time since December of 2008, how do you feel investors should proceed?
Don: We believe investors need a reality check. We suggest taking a quick inventory of where we are so investors can review their assumptions about stock and bond prices before the bubbles start bursting.
WBI Mag: With “ZIRP and QE” monetary policy prescriptions the Fed has been trying to spur inflation, promote full employment, and generate sustained economic activity. So far, the results seem mixed at best. Can you speak to where
you feel things are?
Don: It is tough to find inflation, and we seem to be getting farther away from achieving the Fed’s 2% inflation target. While the headline employment statistics have improved dramat ica l ly and the “unemployment rate” has fallen nicely, workforce participation statistics and the low quality of employment continue to create concern. Economic growth, as measured by growth in GDP, has yet to achieve the 3% threshold that many economists believe is the minimum growth rate required to promote sustained recovery. Already the weakest recovery since WWII, growth in GDP has failed to eclipse 2.5% in any calendar year.1 GDP stats for 2015 seem to suggest that GDP
QE“ ”
p.01WBI SHARES - THE MAGAZINE VOL.1

growth may be getting weaker, not stronger. Even with tepid economic growth the U.S. economy is posting the best performance among developed economies, indicating the economic picture outside the U.S. is far less sanguine. Euro economies are struggling to find growth, and for the first time Germany, the main driver of growth in Europe, seems to be faltering. China, once the global driver of growth, has slipped badly causing a commodity price collapse — creating negative growth rates among many emerging market, commodity-producing countries. Japan launched a massive QE program they coined “Abenomics” to lift the country from deflation into inflation, but has not yet turned the corner.
A Fundamental Disconnect?WBI Mag: Currently you feel there is a fundamental disconnect economically. Can you speak to your concerns?
Don: We are highly concerned that the disconnect between corporate earnings performance and stock price fundamentals may shortly be reconciled by a significant market correction.
WBI Mag: Much of the media discussion on earnings reports has focused on companies meeting or beating earnings expectations — how do you think this is affecting investor psyches?
Don: The media rhetoric can lead investors to think corporate performance is better than it is. We believe analyst earnings expectations are so fungible and fast changing that they are poor indicators of earning quality or trends for corporations.
WBI Mag: So what you’re saying is that just beating expectations can be immaterial if earnings are negative?
Don: Yes. We believe earning trends quarter-over-prior-year-quarter are material.
According to Dow Jones S&P 500 Index data, with 99% of the S&P 500 having reported 3rd quarter results through December 17, 2015, 69% have lower operating earnings year-over-year. And this is the fourth consecutive quarter decline in quarter-over-prior-year quarter operating earnings. Yet equity prices remain elevated with the S&P 500 Index trading at a P/E of 22 times trailing earnings. In reviewing historical measures, it seems this high P/E is counterintuitive against a backdrop of falling earnings, falling corporate
revenue, weakening economic performance, and a potential monetary policy reversal that removes the Fed’s backstop to asset prices.2
Summing It UpWBI Mag: The long run economic benefits of ZIRP and QE seem questionable at best. What are your closing sentiments?
Don: We feel the current round of QE programs being used in Europe and Asia is unlikely to solve today’s economic issues any more effectively than it has in the past. A definition of insanity is doing the same thing over and over again but expecting different results. We believe it is time to stop the insanity of blindly believing that asset prices are going to move ever higher on more QE. Real GDP growth, corporate
revenue and earnings growth are the fuel that drive bull markets. Sooner or later investors may come to their senses and see that monetary policy by itself is not a panacea. Sometimes the markets make investing look easy and that fundamentals don’t really matter. At WBI, we believe that disciplined investing requires strict attention to the fundamental value of the markets and securities you invest in so you do not get caught up in the insanity of emotionally-biased decision making. We strongly feel that now is the time for investors to reevaluate how much risk they are taking and how
willing they are to take another significant loss. Successful investing is never easy and that is why WBI’s first priority is to attempt to protect your capital from large losses.
p.02WBI SHARES - THE MAGAZINE VOL.1
Stop “QE” InsanityARTICLE
” “We believe it is timeto stop the insanity ofblindly believing that asset prices are goingto move ever higher
on more QE.
Source: Dow Jones S&P 500 Indices, Howard Silverblatt, 12/17/2015.
12/31/2014
03/31/2015
06/30/2015
09/30/2015
-5.31%
-5.53%
-10.91%
-14.05%
Last 4 Quarters
26.75
25.81
26.14
25.44
OperatingEarnings/Share
Quarter/PriorYear Quarter +/-%
Please see the Important Information section beginning on p.09 for additional disclosure information regarding the content presented.
With over $1.51 billion in assets under management as of November 30, 2015, WBI Shares ranks #5 on the list of active ETF issuers. The firm’s breakout star, WBI Tactical Income Shares (Ticker: WBII) ranks #14 on AdvisorShares’ Active ETF Report Top 20 Active ETFs by AUM list, raising approximately $176 million in 2015.
“Given the recent market volatility, we feel investors should be looking for vehicles that aim to protect their capital,” said Matt Schreiber, President of WBI. “WBI’s goal has always been to first and foremost protect capital, and while we don’t get all of the upside, we may get significantly less of the down.”
WBII Strong 2015 Performance HighlightsIn 2015, the WBI Tactical Income Shares ETF (ticker: WBII) produced a total net return of -0.78%, outpacing the U.S.
p.03WBI SHARES - THE MAGAZINE VOL.1
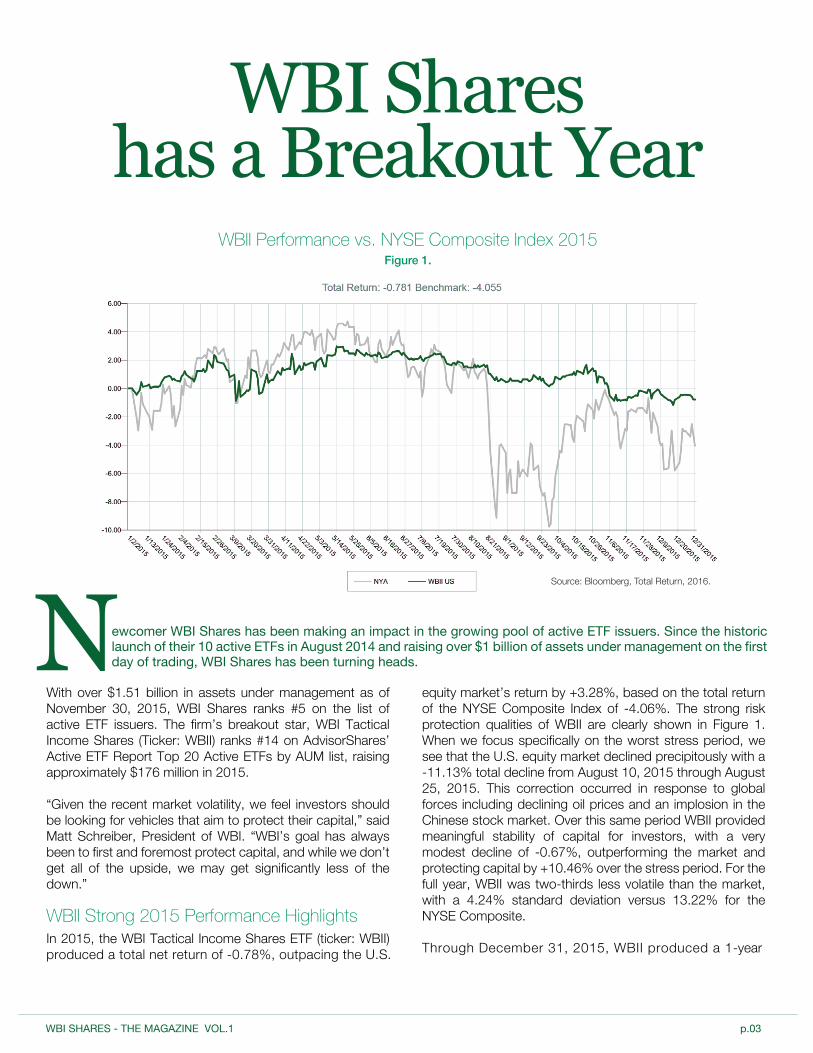
WBII Performance vs. NYSE Composite Index 2015Figure 1.
equity market’s return by +3.28%, based on the total return of the NYSE Composite Index of -4.06%. The strong risk protection qualities of WBII are clearly shown in Figure 1. When we focus specifically on the worst stress period, we see that the U.S. equity market declined precipitously with a -11.13% total decline from August 10, 2015 through August 25, 2015. This correction occurred in response to global forces including declining oil prices and an implosion in the Chinese stock market. Over this same period WBII provided meaningful stability of capital for investors, with a very modest decline of -0.67%, outperforming the market and protecting capital by +10.46% over the stress period. For the full year, WBII was two-thirds less volatile than the market, with a 4.24% standard deviation versus 13.22% for the NYSE Composite.
Through December 31, 2015, WBII produced a 1-year
ewcomer WBI Shares has been making an impact in the growing pool of active ETF issuers. Since the historic launch of their 10 active ETFs in August 2014 and raising over $1 billion of assets under management on the first day of trading, WBI Shares has been turning heads.N
WBI Shareshas a Breakout Year
Source: Bloomberg, Total Return, 2016.
Source: Morningstar, 2016.
Source: Morningstar, 2016.
annual return of -0.70%, outpacing the Morningstar Conservative Allocation category return (-2.56%) and ranking the fund #1 in its category based on total return, out of seven funds.3
In the first half of the year, WBII outperformed a blended benchmark (50% NYSE Composite Index and 50% Barclays Aggregate Bond Index) by 1.49%, with a return of +2.04% versus the blended benchmark’s total return of +0.55% in the first half of 2015. In the second half, the Fund again participated meaningfully in the market’s upside, while strongly protecting capital during the turbulent market retracements of August and September. By year-end, WBII produced a total net return of -0.78%, outpacing the blended benchmark’s loss of -1.41%.
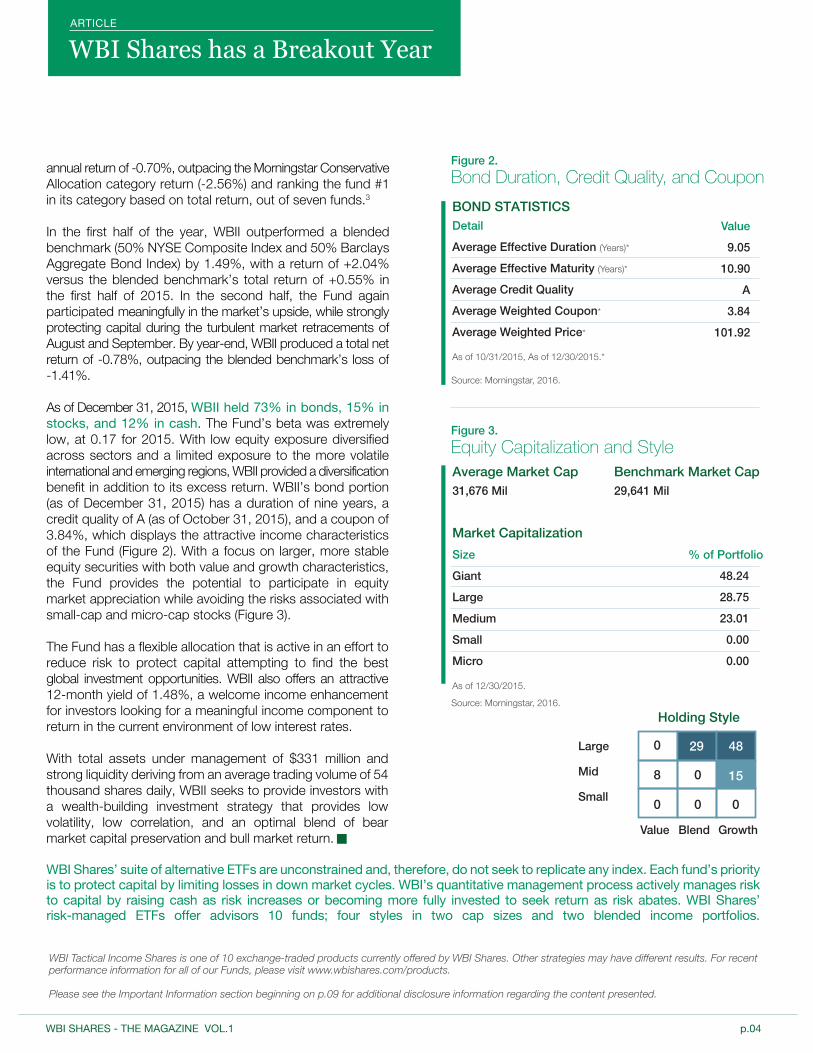
As of December 31, 2015, WBII held 73% in bonds, 15% in stocks, and 12% in cash. The Fund’s beta was extremely low, at 0.17 for 2015. With low equity exposure diversified across sectors and a limited exposure to the more volatile international and emerging regions, WBII provided a diversification benefit in addition to its excess return. WBII’s bond portion (as of December 31, 2015) has a duration of nine years, a credit quality of A (as of October 31, 2015), and a coupon of 3.84%, which displays the attractive income characteristics of the Fund (Figure 2). With a focus on larger, more stable equity securities with both value and growth characteristics, the Fund provides the potential to participate in equity market appreciation while avoiding the risks associated with small-cap and micro-cap stocks (Figure 3).
The Fund has a flexible allocation that is active in an effort to reduce risk to protect capital attempting to find the best global investment opportunities. WBII also offers an attractive 12-month yield of 1.48%, a welcome income enhancement for investors looking for a meaningful income component to return in the current environment of low interest rates.
With total assets under management of $331 million and strong liquidity deriving from an average trading volume of 54 thousand shares daily, WBII seeks to provide investors with a wealth-building investment strategy that provides low volatility, low correlation, and an optimal blend of bear market capital preservation and bull market return.
WBI Shares’ suite of alternative ETFs are unconstrained and, therefore, do not seek to replicate any index. Each fund’s priority is to protect capital by limiting losses in down market cycles. WBI’s quantitative management process actively manages risk to capital by raising cash as risk increases or becoming more fully invested to seek return as risk abates. WBI Shares’ risk-managed ETFs offer advisors 10 funds; four styles in two cap sizes and two blended income portfolios.
WBI Shares has a Breakout YearARTICLE
p.04WBI SHARES - THE MAGAZINE VOL.1
Figure 2.
Bond Duration, Credit Quality, and Coupon
Figure 3.
Equity Capitalization and Style
BOND STATISTICSDetail
Average Effective Duration (Years)*
Average Effective Maturity (Years)*
Average Credit Quality
Average Weighted Coupon*
Average Weighted Price*
As of 10/31/2015, As of 12/30/2015.*
Value
9.05
10.90
A
3.84
101.92
Benchmark Market Cap29,641 Mil
Holding Style
0 29 48
158
0
0
0 0
Value Blend Growth
Average Market Cap31,676 Mil
Market CapitalizationSize
Giant
Large
Medium
Small
Micro
As of 12/30/2015.
Large
Mid
Small
48.24
28.75
23.01
0.00
0.00
% of Portfolio
WBI Tactical Income Shares is one of 10 exchange-traded products currently offered by WBI Shares. Other strategies may have different results. For recent performance information for all of our Funds, please visit www.wbishares.com/products.
Please see the Important Information section beginning on p.09 for additional disclosure information regarding the content presented.
WBI’sInvestment Management Style
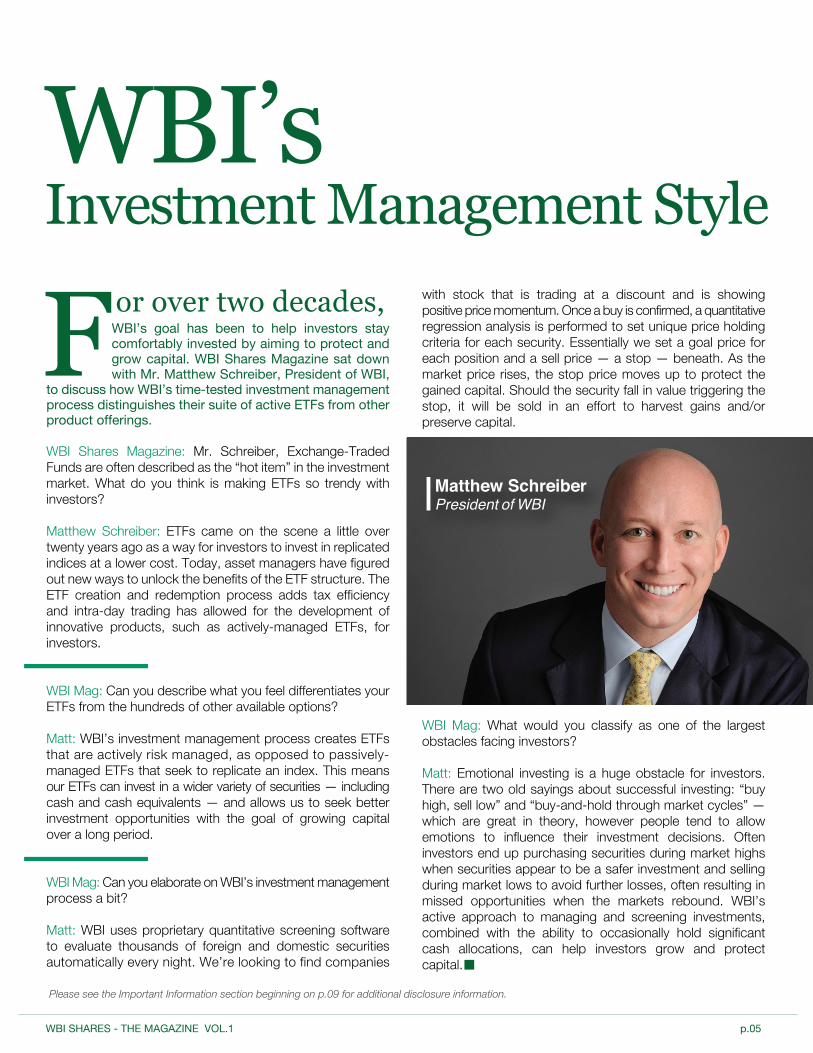
FMatthew SchreiberPresident of WBI
or over two decades, WBI’s goal has been to help investors stay comfortably invested by aiming to protect and grow capital. WBI Shares Magazine sat down with Mr. Matthew Schreiber, President of WBI,
to discuss how WBI’s time-tested investment management process distinguishes their suite of active ETFs from other product offerings.
WBI Shares Magazine: Mr. Schreiber, Exchange-Traded Funds are often described as the “hot item” in the investment market. What do you think is making ETFs so trendy with investors?
Matthew Schreiber: ETFs came on the scene a little over twenty years ago as a way for investors to invest in replicated indices at a lower cost. Today, asset managers have figured out new ways to unlock the benefits of the ETF structure. The ETF creation and redemption process adds tax efficiency and intra-day trading has allowed for the development of innovative products, such as actively-managed ETFs, for investors.
WBI Mag: Can you describe what you feel differentiates your ETFs from the hundreds of other available options?
Matt: WBI’s investment management process creates ETFs that are actively risk managed, as opposed to passively-managed ETFs that seek to replicate an index. This means our ETFs can invest in a wider variety of securities — including cash and cash equivalents — and allows us to seek better investment opportunities with the goal of growing capital over a long period.
WBI Mag: Can you elaborate on WBI’s investment management process a bit?
Matt: WBI uses proprietary quantitative screening software to evaluate thousands of foreign and domestic securities automatically every night. We’re looking to find companies
with stock that is trading at a discount and is showing positive price momentum. Once a buy is confirmed, a quantitative regression analysis is performed to set unique price holding criteria for each security. Essentially we set a goal price for each position and a sell price — a stop — beneath. As the market price rises, the stop price moves up to protect the gained capital. Should the security fall in value triggering the stop, it will be sold in an effort to harvest gains and/or preserve capital.
WBI Mag: What would you classify as one of the largest obstacles facing investors?
Matt: Emotional investing is a huge obstacle for investors. There are two old sayings about successful investing: “buy high, sell low” and “buy-and-hold through market cycles” — which are great in theory, however people tend to allow emotions to influence their investment decisions. Often investors end up purchasing securities during market highs when securities appear to be a safer investment and selling during market lows to avoid further losses, often resulting in missed opportunities when the markets rebound. WBI’s active approach to managing and screening investments, combined with the ability to occasionally hold significant cash allocations, can help investors grow and protect capital.
p.05WBI SHARES - THE MAGAZINE VOL.1
Please see the Important Information section beginning on p.09 for additional disclosure information.
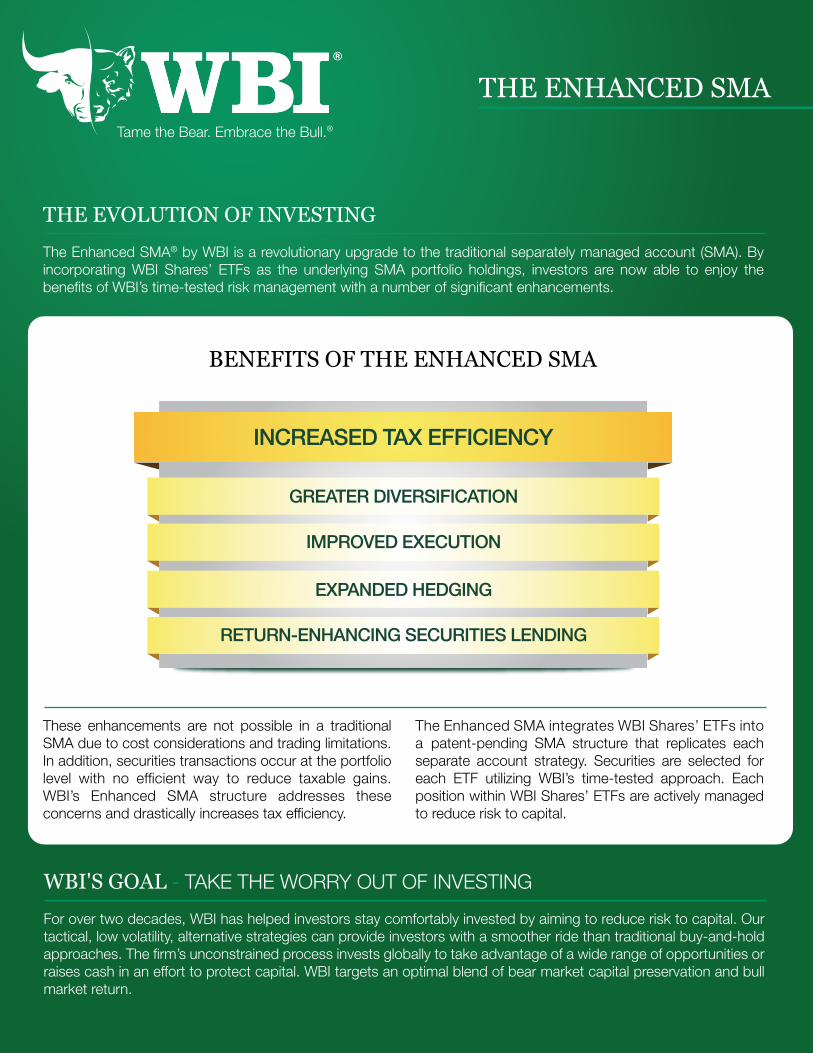
WBI'S GOAL - TAKE THE WORRY OUT OF INVESTING
For over two decades, WBI has helped investors stay comfortably invested by aiming to reduce risk to capital. Our tactical, low volatility, alternative strategies can provide investors with a smoother ride than traditional buy-and-hold approaches. The firm’s unconstrained process invests globally to take advantage of a wide range of opportunities or raises cash in an effort to protect capital. WBI targets an optimal blend of bear market capital preservation and bull market return.
THE EVOLUTION OF INVESTINGThe Enhanced SMA® by WBI is a revolutionary upgrade to the traditional separately managed account (SMA). By incorporating WBI Shares’ ETFs as the underlying SMA portfolio holdings, investors are now able to enjoy the benefits of WBI’s time-tested risk management with a number of significant enhancements.
Tame the Bear. Embrace the Bull.®
THE ENHANCED SMA
These enhancements are not possible in a traditional SMA due to cost considerations and trading limitations. In addition, securities transactions occur at the portfolio level with no efficient way to reduce taxable gains. WBI’s Enhanced SMA structure addresses these concerns and drastically increases tax efficiency.
The Enhanced SMA integrates WBI Shares’ ETFs into a patent-pending SMA structure that replicates each separate account strategy. Securities are selected for each ETF utilizing WBI’s time-tested approach. Each position within WBI Shares’ ETFs are actively managed to reduce risk to capital.
RETURN-ENHANCING SECURITIES LENDING
EXPANDED HEDGING
IMPROVED EXECUTION
GREATER DIVERSIFICATION
INCREASED TAX EFFICIENCY
BENEFITS OF THE ENHANCED SMA
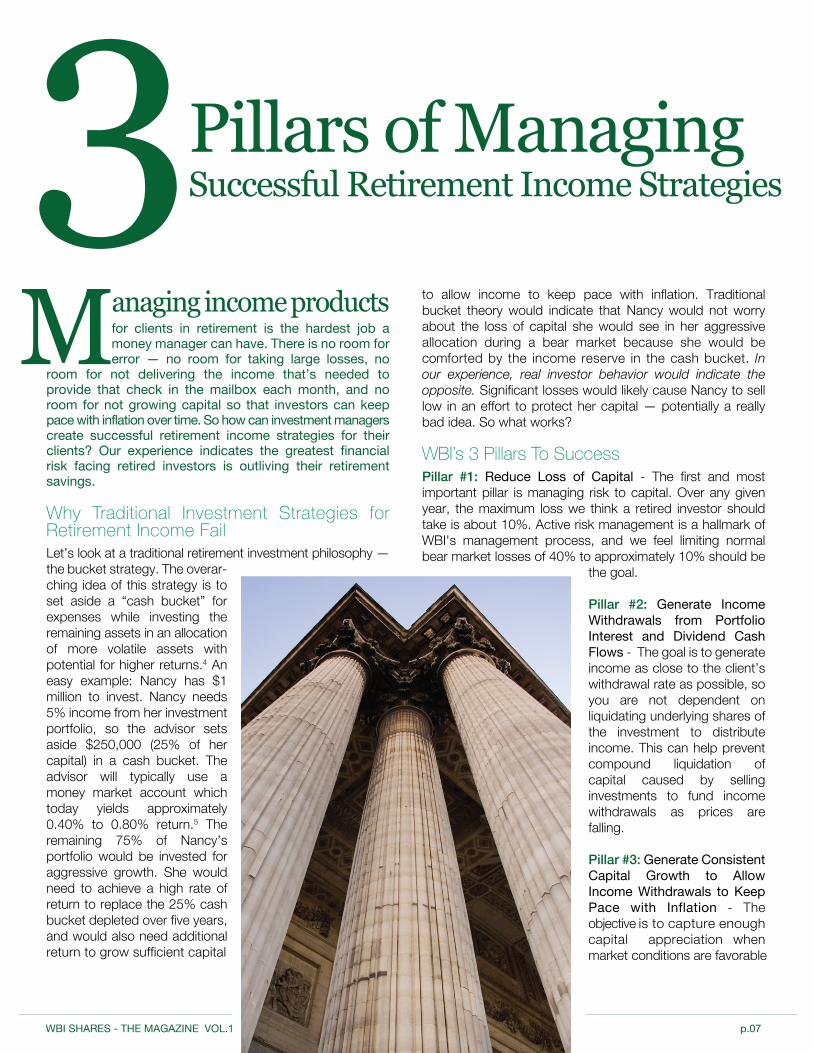
M
Pillars of Managing Successful Retirement Income Strategies
anaging income products for clients in retirement is the hardest job a money manager can have. There is no room for error — no room for taking large losses, no
room for not delivering the income that’s needed to provide that check in the mailbox each month, and no room for not growing capital so that investors can keep pace with inflation over time. So how can investment managers create successful retirement income strategies for their clients? Our experience indicates the greatest financial risk facing retired investors is outliving their retirement savings.
Why Traditional Investment Strategies for Retirement Income FailLet’s look at a traditional retirement investment philosophy — the bucket strategy. The overar-ching idea of this strategy is to set aside a “cash bucket” for expenses while investing the remaining assets in an allocation of more volatile assets with potential for higher returns.4 An easy example: Nancy has $1 million to invest. Nancy needs 5% income from her investment portfolio, so the advisor sets aside $250,000 (25% of her capital) in a cash bucket. The advisor will typically use a money market account which today yields approximately 0.40% to 0.80% return.5 The remaining 75% of Nancy’s portfolio would be invested for aggressive growth. She would need to achieve a high rate of return to replace the 25% cash bucket depleted over five years, and would also need additional return to grow sufficient capital
to allow income to keep pace with inflation. Traditional bucket theory would indicate that Nancy would not worry about the loss of capital she would see in her aggressive allocation during a bear market because she would be comforted by the income reserve in the cash bucket. In our experience, real investor behavior would indicate the opposite. Significant losses would likely cause Nancy to sell low in an effort to protect her capital — potentially a really bad idea. So what works?
WBI’s 3 Pillars To SuccessPillar #1: Reduce Loss of Capital - The first and most important pillar is managing risk to capital. Over any given year, the maximum loss we think a retired investor should take is about 10%. Active risk management is a hallmark of WBI's management process, and we feel limiting normal bear market losses of 40% to approximately 10% should be
the goal.
Pillar #2: Generate Income Withdrawals from Portfolio Interest and Dividend Cash Flows - The goal is to generate income as close to the client’s withdrawal rate as possible, so you are not dependent on liquidating underlying shares of the investment to distribute income. This can help prevent compound liquidation of capital caused by selling investments to fund income withdrawals as prices are falling.
Pillar #3: Generate Consistent Capital Growth to Allow Income Withdrawals to Keep Pace with Inflation - The objective is to capture enough capital appreciation when market conditions are favorable
3
p.07WBI SHARES - THE MAGAZINE VOL.1
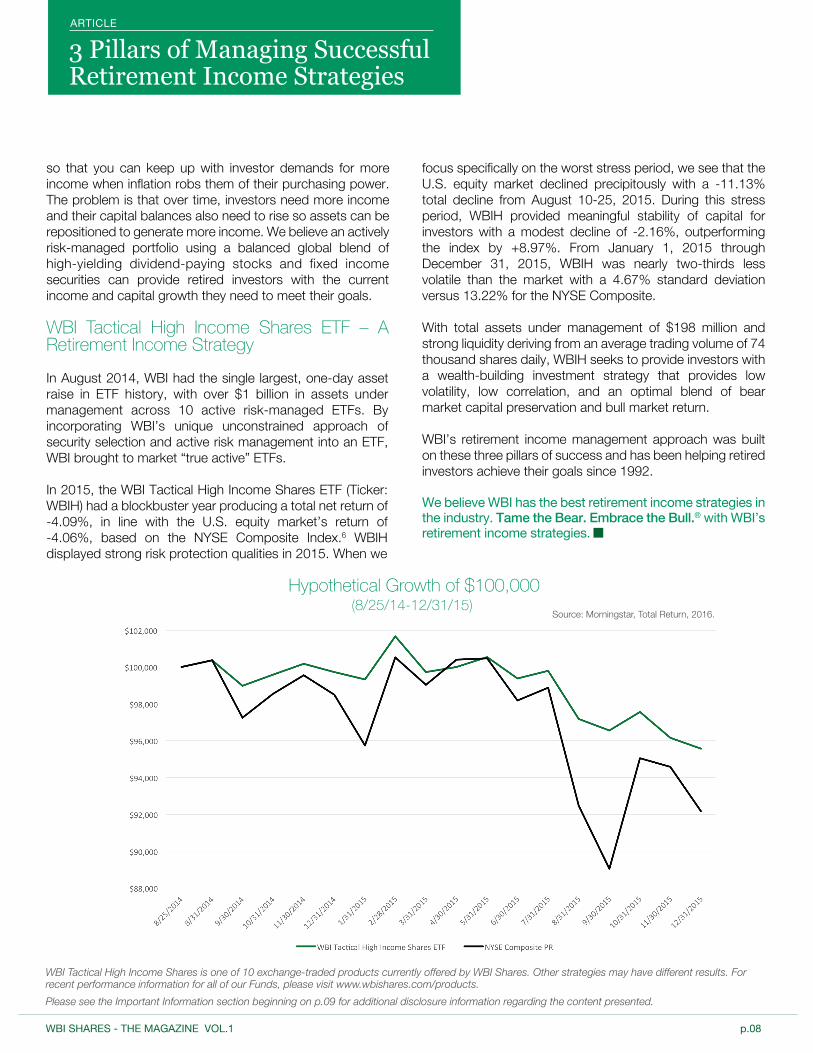
Source: Morningstar, Total Return, 2016.
Hypothetical Growth of $100,000(8/25/14-12/31/15)
so that you can keep up with investor demands for more income when inflation robs them of their purchasing power. The problem is that over time, investors need more income and their capital balances also need to rise so assets can be repositioned to generate more income. We believe an actively risk-managed portfolio using a balanced global blend of high-yielding dividend-paying stocks and fixed income securities can provide retired investors with the current income and capital growth they need to meet their goals.
WBI Tactical High Income Shares ETF – A Retirement Income Strategy
In August 2014, WBI had the single largest, one-day asset raise in ETF history, with over $1 billion in assets under management across 10 active risk-managed ETFs. By incorporating WBI’s unique unconstrained approach of security selection and active risk management into an ETF, WBI brought to market “true active” ETFs.
In 2015, the WBI Tactical High Income Shares ETF (Ticker: WBIH) had a blockbuster year producing a total net return of -4.09%, in line with the U.S. equity market’s return of -4.06%, based on the NYSE Composite Index.6 WBIH displayed strong risk protection qualities in 2015. When we
focus specifically on the worst stress period, we see that the U.S. equity market declined precipitously with a -11.13% total decline from August 10-25, 2015. During this stress period, WBIH provided meaningful stability of capital for investors with a modest decline of -2.16%, outperforming the index by +8.97%. From January 1, 2015 through December 31, 2015, WBIH was nearly two-thirds less volatile than the market with a 4.67% standard deviation versus 13.22% for the NYSE Composite.
With total assets under management of $198 million and strong liquidity deriving from an average trading volume of 74 thousand shares daily, WBIH seeks to provide investors with a wealth-building investment strategy that provides low volatility, low correlation, and an optimal blend of bear market capital preservation and bull market return.
WBI’s retirement income management approach was built on these three pillars of success and has been helping retired investors achieve their goals since 1992.
We believe WBI has the best retirement income strategies in the industry. Tame the Bear. Embrace the Bull.® with WBI’s retirement income strategies.
p.08WBI SHARES - THE MAGAZINE VOL.1
3 Pillars of Managing Successful Retirement Income Strategies
ARTICLE
WBI Tactical High Income Shares is one of 10 exchange-traded products currently offered by WBI Shares. Other strategies may have different results. For recent performance information for all of our Funds, please visit www.wbishares.com/products.
Please see the Important Information section beginning on p.09 for additional disclosure information regarding the content presented.
Important Information Past performance does not guarantee future results.
The views presented are those of Don Schreiber, Jr. and Matthew Schreiber and should not be construed as investment advice.
This material has been prepared for informational purposes only, and is not intended to provide, and should not be relied on for tax, legal or accounting advice. You should consult your own tax, legal and accounting advisors before engaging in any transaction.
All economic and performance information is historical and not indicative of future results. Different types of investments involve varying degrees of risk, and there can be no assurance that the future performance of any specific investment, investment strategy, or product made reference to directly or indirectly in this document, will be profitable, equal any corresponding indicated historical performance level(s), or be suitable for your portfolio. WBI Enhanced SMA® Program accounts are subject to investment risk, including the possible loss of principal amount invested. The ETFs used in WBI Enhanced SMA Program accounts may invest in other ETFs, mutual funds, and Exchange-Traded Notes (ETNs) which will subject the account to the additional expenses of each ETF, mutual fund, or ETN, as well as to the risk of owning the underlying securities held by each. Options on securities held in an ETF may be subject to greater fluctuations in value than an investment in the underlying securities. In addition, ETFs may be subject to one or more of the following risks: market risk, model risk, management risk, dividend risk, growth risk, value risk, debt security risk, foreign market and currency risk, high-yield security risk, small and medium company risk, portfolio turnover risk, securities business risk, mortgage-backed securities risk, and trading price risk. Moreover, you should not assume that any discussion or information provided here serves as the receipt of, or as a substitute for, personalized investment advice from WBI or from any other investment professional. To the extent that you have any questions regarding the applicability of any specific issue discussed to your individual situation, you are encouraged to consult with WBI or the professional advisor of your choosing. All information, including that used to compile charts, is obtained from sources believed to be reliable, but WBI does not guarantee its reliability. Although a company may pay a dividend, prices of equity securities – including those that pay dividends – fluctuate. Investing on the basis of dividends alone may cause an investor to buy or sell certain securities when circumstances may or may not be favorable. Information pertaining to WBI’s advisory operations, services, and fees is set forth in WBI’s current disclosure statement, as same is on file with the United States Securities and Exchange Commission, a copy of which is available from WBI upon request.
The performance data quoted represents past performance and is not a guarantee of future results. Investment return and principal value of an investment will fluctuate so that an investor’s shares, when redeemed, may be worth more or less than their original cost. Current performance may be lower or higher than performance data quoted. For most recent month-end performance please visit www.wbishares.com.
Investors should consider the investment objectives, risks, charges, and expenses carefully before investing. For a prospectus with this and other information about the Funds please visit our website at www.wbishares.com. Read the prospectus carefully before investing.
WBI has an inherent conflict of interest in investing in or recommending the Proprietary ETFs to clients for the following reasons: 1) WBI and its affiliates receive management fees from the Proprietary ETFs. To avoid receiving two layers of manage-ment fees in those situations where clients invest in the Proprietary ETFs through SMA and Platform accounts, WBI will either: (i) waive the management fee charged at the account level; or (ii) credit the portion of the management fees paid by the Propri-etary ETFs to WBI and its affiliates with respect to an account’s investments in Proprietary ETFs against the account-level advisory fees the particular SMA or Platform account owes WBI, and 2) WBI’s affiliated broker/dealer, Millington Securities, Inc., receives brokerage commissions and other compensation (including payment for order flow) for transactions effected on behalf of the Proprietary ETFs. Any trades that WBI places through Millington will be subject to WBI’s duty of best execution and applicable law.
Net of Fee Performance reflects actual performance after deducting investment management fees, brokerage commissions, and other expenses and includes the reinvestment of dividends and other earnings. Net of Fee Performance was restated effected December 31, 2014 to deduct only the highest investment management fee of 1.00% charged by WBI. The Net of Fee Performance no longer reflects the deduction of the additional asset-based service fees or other fees (of up to 1.25%) charged by solicitors or introducing advisers; when compounded over a period of years, these would decrease returns. Information about these additional asset-based fees is available through the client’s solicitor or introducing adviser. The historical performance results of benchmarks do not include the deduction of transaction and custodial charges, or the deduction of an investment management fee, which would likely reduce indicated historical performance results.
The WBI Dynamic Trailing Stop (DTS) is not a stop loss order or stop limit order placed with a brokerage firm, but an internal process for monitoring price movements. While the DTS may be used to initiate WBI’s process for selling a security, it does not assure that a particular execution price will be received.
p.09WBI SHARES - THE MAGAZINE VOL.1
Quantitative Easing is when a central bank purchases government securities from the market as an effort to lower interest rates and increase the money supply.
Zero Interest Rate Policy is when the central bank sets the interest rate at base rate (0%) as an attempt to increase demand in the economy, thus making the supply of money cheaper.
NYSE Composite Index: designed to measure the performance of all common stocks listed on the NYSE, including ADRs, REITs, and tracking stocks. The index is weighted using free‐float market capitalization and calculated on both price and total return basis.
S&P 500 TR Index: includes a representative sample of large-cap U.S. companies in leading industries where all cash payouts (dividends) are reinvested automatically.
Barclays U.S. Aggregate Bond Total Return Index: a component of the U.S. Universal Index and covers the USD‐denomi-nated, investment‐grade, fixed‐rate, taxable bond market of SEC‐registered securities.
Blended Index: 50% NYSE Composite Index/50% Barclays U.S. Aggregate Bond Total Return Index.
Because the strategy involves active management of a potentially wide range of assets, no widely recognized benchmark is likely to be representative of the performance of any managed account. Therefore, WBI managed accounts may own assets and follow investment strategies which cause them to differ materially from the composition and performance of the bench-marks shown on performance or other reports. Benchmark indices are unmanaged and may not be invested in directly.
1 Lim, Diane. “Health Care Distortions Hurt America’s Businesses and Patients.” Committee for Economic Development of the Conference Board. 03 Feb. 2015. Web. 16. Nov. 2015
Rainey, Michael. “The Weakest Economic Recovery Since World War II Putters Along.” The Fiscal Times. 30 June 2015. Web. 16 Nov. 2015.
2 “Markets.” Bloomberg.com/Markets. Bloomberg, Web. 16. Nov. 2015.
3 As of 12/31/2015, WBII has returned 0.06% and 0.00% since inception (8/25/2014), on NAV and Market Price respectively. Per the Prospectus, the Fund’s annual operating expense (gross) is 1.08%.
4 Benz, Christine. “The Bucket Approach to Retirement Portfolio Construction.” Morningstar. 20 Mar. 2015. Web. 16 Dec. 2015.
5 Latham, Saundra. "Best Money Market Account for 2016 - The Simple Dollar." The Simple Dollar Best Money Market Account for 2016 Comments. 7 Dec. 2015. Web. 6 Jan. 2016.
6 As of 12/31/2015, WBIH has returned -3.30% and -3.21% since inception (8/25/2014), on NAV and Market Price respectively. Per the Prospectus, the Fund’s annual operating expense (gross) is 1.12%.
Foreside Fund Services, LLC, Distributor.
p.10WBI SHARES - THE MAGAZINE VOL.1
Tame the Bear. Embrace the Bull.®
WBIINVESTMENTS.COM
In August 2014, WBI Shares made history with the launch of their 10 actively risk-managed, liquid alternative ETFs, raising over $1 billion their first day out. With just over a year in the ETF industry, WBI has become the fifth largest active ETF provider.
Investing involves risk including possible loss of principal. Investors should consider the investment objectives, risks, charges and expenses carefully before investing. For a prospectus with this and other information about the Fund please visit our website at www.wbishares.com. Read the prospectus carefully before investing.
Foreside Fund Services, LLC, Distributor.
Active ETFs by WBI