stop refreshing vanity metrics & start focusing on the metrics that inform decisions
TRANSCRIPT

Colin Zima
Chief Analytics Officer, Looker
Beyond Vanity Metrics

250+Customers

Everyone Loves Dashboards

The Case for Dashboards
Increased EngagementUsing visual to draws in the less data inclined
Clarity and PriorityTeams driving towards a singular goal set
“Data Culture”Data as the source of truth
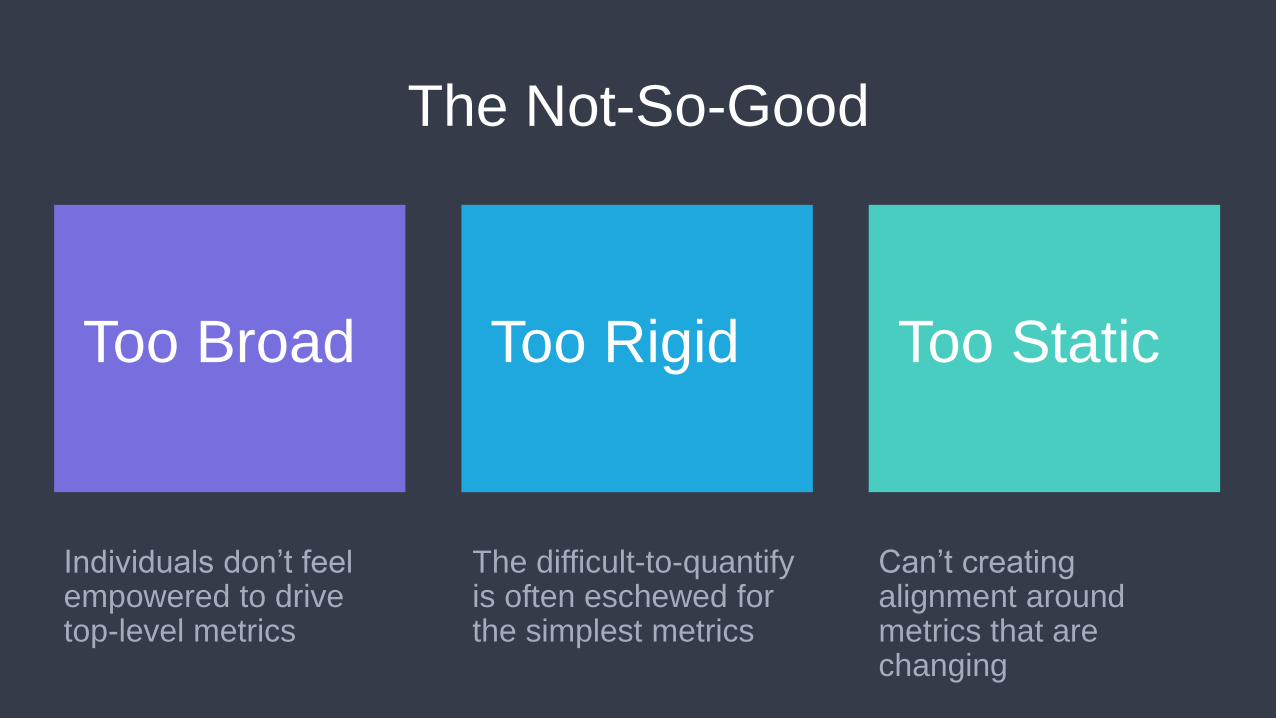
Too Broad Too Rigid Too Static
The Not-So-Good
Individuals don’t feel empowered to drive top-level metrics
The difficult-to-quantify is often eschewed for the simplest metrics
Can’t creating alignment around metrics that are changing

Define Behavior
Quantify
Act and Refine
“Custom” Analytics
• How can we understand this behavior with data?
• Find correlated action if necessary.
• Set up tracking as needed
• Define ongoing metrics
• What are we actually trying to measure?
• Create more targeted, individualized dashboards and
views
• Track over time and monitor performance
• Build better metrics

Four Examples
1. Quantifying bad user experience at Venmo
2. Prioritizing new market launches at a delivery start-up
3. Better understanding of the best performing content at Upworthy
4. Driving deeper retention in mobile gaming

Venmo’s Design Challenge
Before: After:

The Result

Custom Analytics To The Rescue

The Localization Challenge

Finding Engaged Customers

Now Quantify It

The Pageview Trap

Attention Minutes
• What action are we really trying to drive – Engagement
• Then measure engagement
• Upworthy’s attention minutes aim to do just that
• Total Attention on Site (per hour, day, week, month, whatever) — that tells us (like total uniques or total pageviews) how good of a job Upworthy is doing overall at drawing attention to important topics.
• And Total Attention per Piece, which is a combination of how many people watch something on Upworthy and how much of it they actually watch. Pieces with higher Total Attention should be promoted more.
Source: http://blog.upworthy.com/post/89621755036/the-code-literally-to-what-lies-between-
the

The Results
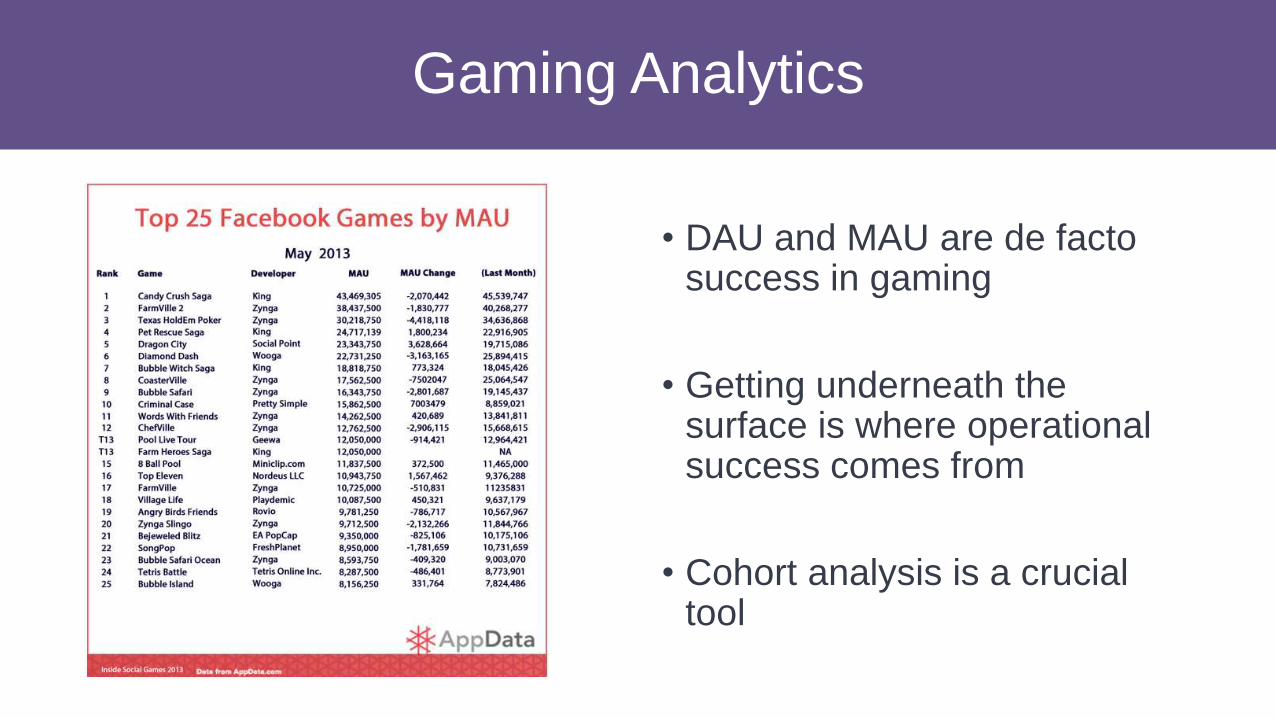
Gaming Analytics
• DAU and MAU are de facto success in gaming
• Getting underneath the surface is where operational success comes from
• Cohort analysis is a crucial tool

Level Balancing

Level Balancing

Level Balancing

TwoDots
TwoDots: 15 app releases, 40+ level rebalances
Before: After:

Takeaways
Define the behaviors you want to quantify
Measure them and create tangible progress
And keep the TV Dashboards, at least you’ll get people excited about data
