stop the flood of plastic
TRANSCRIPT

A guide for policy-makers in Turkey
STOP THE FLOODOF PLASTIC
2019REPORT
page 2 | TURKEY A plastic system guidebook − A guide for policy-makers in Turkey
TURKEYEXECUTIVE SUMMARYTURKEY’S POLICY PRIORITIES FOR PLASTIC POLLUTION SHOULD FOCUS ON ELIMINATING OPEN DUMPING, INCREASING INDUSTRY STEWARDSHIP AND RECYCLING.
Turkey launched its national ‘Zero Waste’ program aiming to close the loop for all waste materials. Turkey’s policies focus on national waste reduction and management to achieve these targets. For the moment, few policies focus on municipal-level improvements while municipalities primarily lead waste management. Improving the capacity of municipalities, in tourism hotspots and regions with open dumping issues, is vital for the waste management outcomes of ‘Zero Waste’ program. Upstream actions must be implemented to reduce plastic production, develop alternatives, and design products for recycling. New policies should encourage industry actors to
reduce unnecessary plastic use, pay for their non-reusable waste, and invest in downstream waste management infrastructure. Growing recycling capacity requires improving collection and sorting systems to increases the quality of material, and investing in sorting and recycling facilities across the country. Turkey has set some ambitious targets to create a ‘zero waste’ community, and will need bolder action to realize this goal.
TURKEY’S MAIN CHALLENGE IN STOPPING PLASTIC LEAKING INTO THE MEDITERRANEAN IS ITS UNDERDEVELOPED WASTE MANAGEMENT SYSTEM.
Turkey is the 3rd waste generator in the region, generating 3.7 MTs of plastic waste in 2016. Only 6% of this plastic waste was recycled, while landfills managed 61% of waste. The remaining 33% of this plastic waste was uncollected, or openly dumped, resulting in 1.1MT leaking into nature. Limited municipal waste separation and sorting capabilities make local plastic recycling unprofitable. High plastic leakage hotspots exist in the Eastern Anatolia Region, where 74% of waste is openly dumped. As a result, Turkey is the second largest land-based source of plastic into the Mediterranean Sea. Turkey’s economy loses over $95M (€84M) annually due to plastic pollution, as it affects the tourism, shipping and fishing economies.
page 3 | TURKEY Stop the flood of plastic − A guide for policy-makers in Turkey
TURKEY
1. MAPPING THE LIFECYCLE OF PLASTIC IN TURKEY Value chain analysis of plastics’ lifecycle from production to waste
management Evaluation of the main sources of plastic leakage into Nature
3. EVALUATING THE POLICY LANDSCAPE REGARDING PLASTIC IN TURKEY Review of the existing policy landscape and initiatives to curb plastic
pollution Roadmap to recommended future interventions
2. UNDERSTANDING THE IMPACT OF PLASTIC IN TURKEY Overview of the impact of plastic on the country’s environment and
economy Spotlight on the top Mediterranean hotspots
INDEX
Published in June 2019
By WWF – World Wide Fund for Nature (formerly World Wildlife Fund)
Any reproduction in full or in part must mention the title, the lead author, and credit the above-mentioned publisher as the copyright owner.
Citation of this report: Dalberg Advisors, WWF Mediterranean Marine Initiative, 2019 “Stop the Flood of Plastic: How Mediterranean countries can save their sea”
Authors: Dalberg Advisors, and the team comprised of Wijnand de Wit, Adam Hamilton, and Arianna Freschi.
Communications: Stefania Campogianni, WWF
Editing: Alona Rivord
Design/Layout/Infographics: Bianco Tangerine Snc
Front cover © Shutterstock / John Cuyos / WWF
ANNEX The plastics value chain and stakeholders Glossary Methodology Overview Plastic waste system activities causing controlled and mismanaged waste
page 4 | TURKEY Stop the flood of plastic − A guide for policy-makers in Turkey
TURKEY
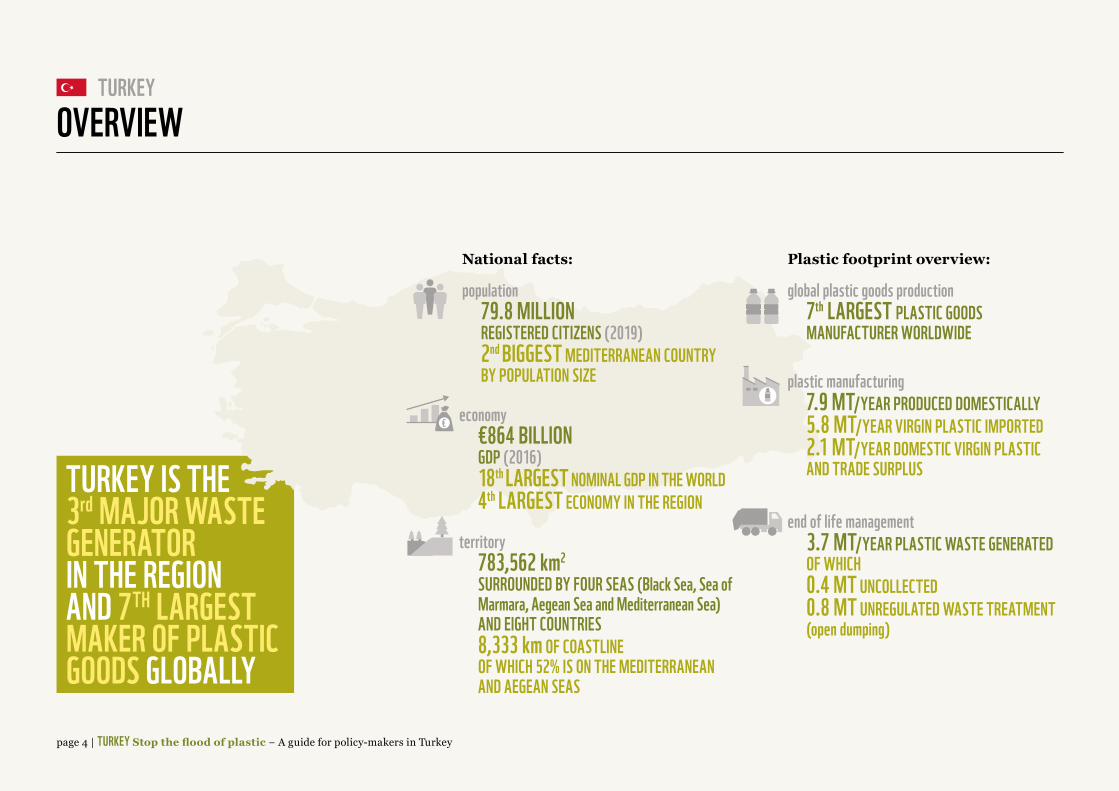
TURKEY IS THE 3rd MAJOR WASTE GENERATOR IN THE REGION AND 7TH LARGEST MAKER OF PLASTIC GOODS GLOBALLY
OVERVIEW
ITALY IS THE LARGEST PRODUCER OF PLASTIC GOODS AND THE 2ND LARGEST WASTE GENERATOR IN THE REGION
population79.8 MILLION REGISTERED CITIZENS (2019)2nd BIGGEST MEDITERRANEAN COUNTRYBY POPULATION SIZE
economy€864 BILLIONGDP (2016)18th LARGEST NOMINAL GDP IN THE WORLD4th LARGEST ECONOMY IN THE REGION
territory783,562 km2
SURROUNDED BY FOUR SEAS (Black Sea, Sea of Marmara, Aegean Sea and Mediterranean Sea) AND EIGHT COUNTRIES8,333 km OF COASTLINE OF WHICH 52% IS ON THE MEDITERRANEAN AND AEGEAN SEAS
global plastic goods production7th LARGEST PLASTIC GOODS MANUFACTURER WORLDWIDE
end of life management3.7 MT/YEAR PLASTIC WASTE GENERATEDOF WHICH0.4 MT UNCOLLECTED0.8 MT UNREGULATED WASTE TREATMENT (open dumping)
plastic manufacturing7.9 MT/YEAR PRODUCED DOMESTICALLY5.8 MT/YEAR VIRGIN PLASTIC IMPORTED2.1 MT/YEAR DOMESTIC VIRGIN PLASTIC AND TRADE SURPLUS
National facts: Plastic footprint overview:
€
page 5 | TURKEY Stop the flood of plastic − A guide for policy-makers in Turkey
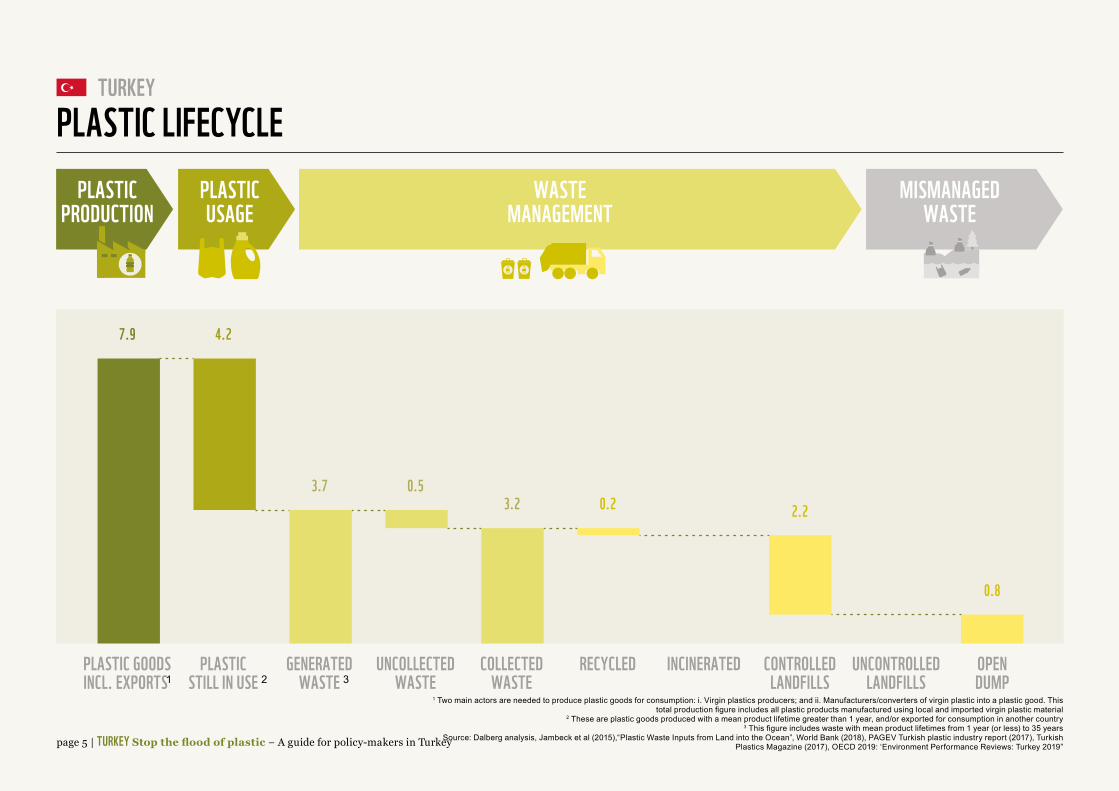
TURKEYPLASTIC LIFECYCLE
PLASTIC GOODSINCL. EXPORTS
OPENDUMP
UNCONTROLLEDLANDFILLS
CONTROLLEDLANDFILLS
INCINERATEDRECYCLEDCOLLECTEDWASTE
UNCOLLECTEDWASTE
GENERATEDWASTE
PLASTICSTILL IN USE
PLASTICPRODUCTION
PLASTICUSAGE
WASTEMANAGEMENT
MISMANAGEDWASTE
7.9 4.2
3.7 0.53.2 0.2 2.2
0.81.3
1 Two main actors are needed to produce plastic goods for consumption: i. Virgin plastics producers; and ii. Manufacturers/converters of virgin plastic into a plastic good. This total production figure includes all plastic products manufactured using local and imported virgin plastic material
2 These are plastic goods produced with a mean product lifetime greater than 1 year, and/or exported for consumption in another country3 This figure includes waste with mean product lifetimes from 1 year (or less) to 35 years
Source: Dalberg analysis, Jambeck et al (2015),“Plastic Waste Inputs from Land into the Ocean”, World Bank (2018), PAGEV Turkish plastic industry report (2017), Turkish Plastics Magazine (2017), OECD 2019: ‘Environment Performance Reviews: Turkey 2019”
1 2 3
page 6 | TURKEY Stop the flood of plastic − A guide for policy-makers in Turkey
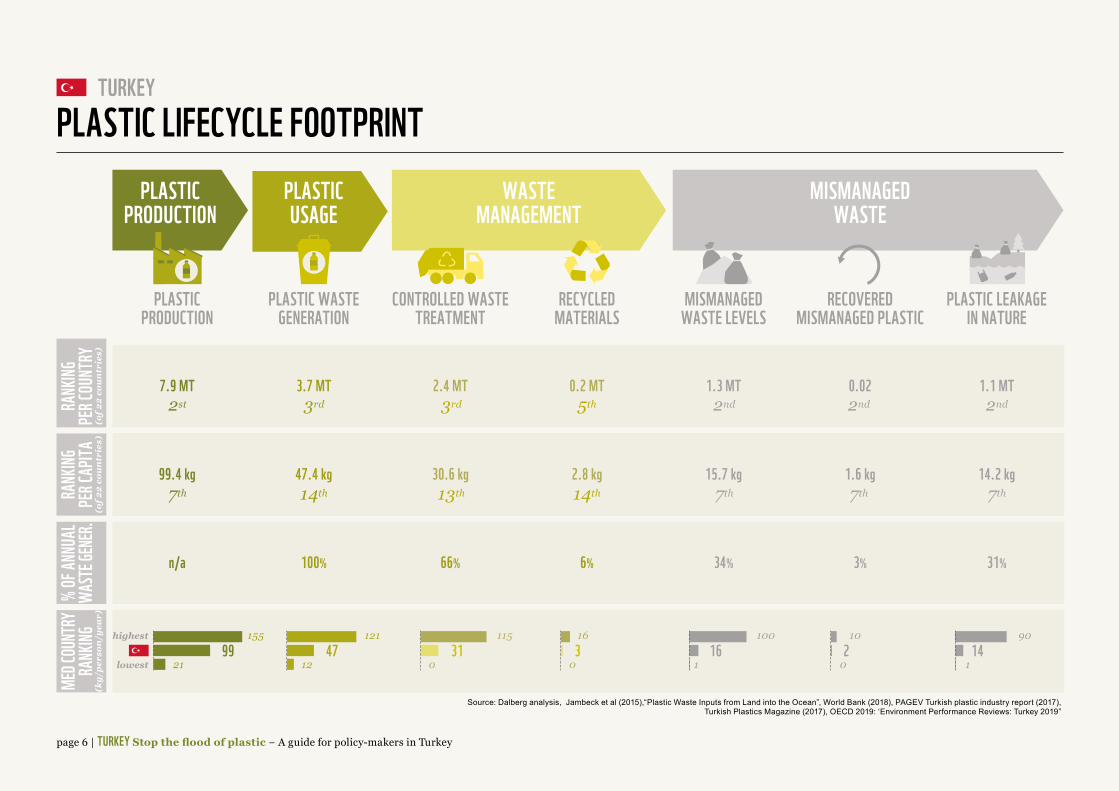
TURKEYPLASTIC LIFECYCLE FOOTPRINT
PLASTICPRODUCTION
PLASTIC WASTEGENERATION
CONTROLLED WASTETREATMENT
MISMANAGEDWASTE LEVELS
PLASTIC LEAKAGEIN NATURE
RECOVEREDMISMANAGED PLASTIC
RECYCLEDMATERIALS
PLASTICPRODUCTION
PLASTICUSAGE
WASTEMANAGEMENT
MISMANAGEDWASTE
7.9 MT 3.7 MT2st 3rd 3rd 5th 2nd 2nd 2nd
7th 14th 13th 14th 7th 7th 7th
2.4 MT 1.3 MT 0.02 1.1 MT
99.4 kg 47.4 kg 30.6 kg 15.7 kg 1.6 kg 14.2 kg
n/a 100% 66% 34% 3% 31%
0.2 MT
2.8 kg
6%
RANK
INGPE
R COU
NTRY
(of 2
2 co
un
trie
s)
RANK
INGPE
R CAP
ITA(o
f 22
cou
ntr
ies)
% OF
ANNU
ALWA
STE G
ENER
.ME
D COU
NTRY
RANK
ING(k
g/pe
rson
/yea
r)
highest
lowest99
155
2147
121
1231
115
0316
016
100
12
10
014
90
1
Source: Dalberg analysis, Jambeck et al (2015),“Plastic Waste Inputs from Land into the Ocean”, World Bank (2018), PAGEV Turkish plastic industry report (2017), Turkish Plastics Magazine (2017), OECD 2019: ‘Environment Performance Reviews: Turkey 2019”
page 7 | TURKEY Stop the flood of plastic − A guide for policy-makers in Turkey
TURKEY
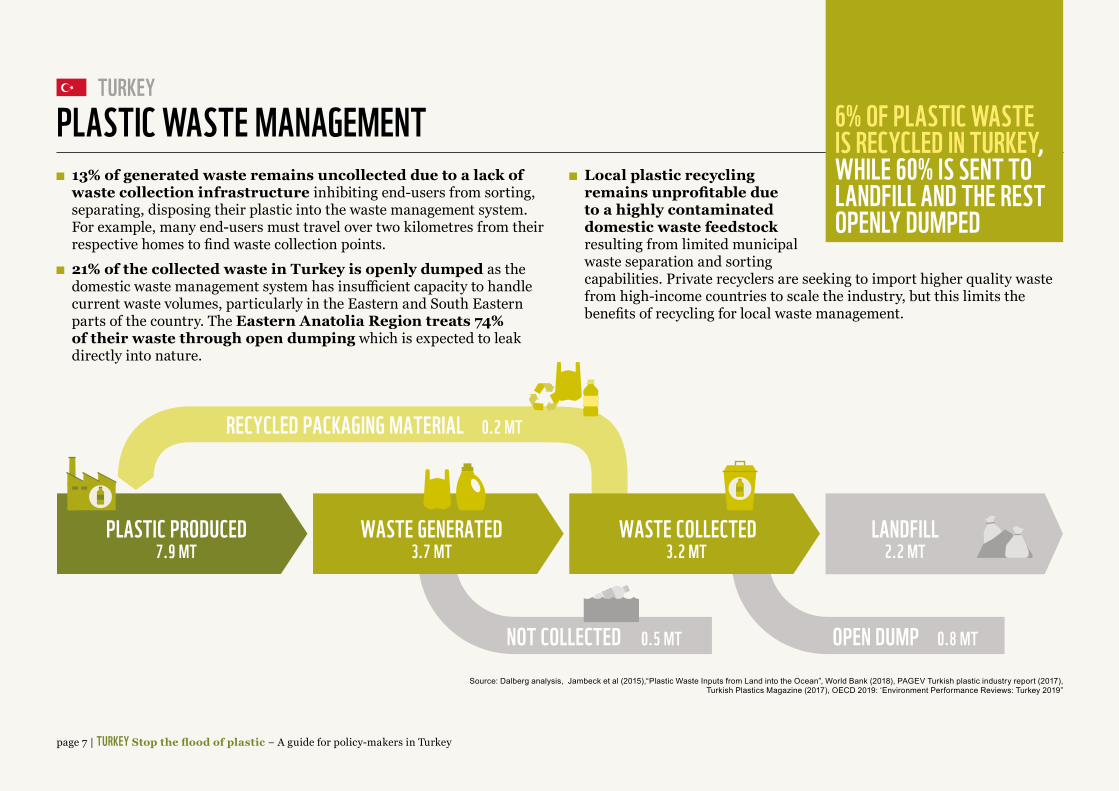
13% of generated waste remains uncollected due to a lack of waste collection infrastructure inhibiting end-users from sorting, separating, disposing their plastic into the waste management system. For example, many end-users must travel over two kilometres from their respective homes to find waste collection points.
21% of the collected waste in Turkey is openly dumped as the domestic waste management system has insufficient capacity to handle current waste volumes, particularly in the Eastern and South Eastern parts of the country. The Eastern Anatolia Region treats 74% of their waste through open dumping which is expected to leak directly into nature.
PLASTIC WASTE MANAGEMENT Local plastic recycling remains unprofitable due to a highly contaminated domestic waste feedstock resulting from limited municipal waste separation and sorting capabilities. Private recyclers are seeking to import higher quality waste from high-income countries to scale the industry, but this limits the benefits of recycling for local waste management.
6% OF PLASTIC WASTE IS RECYCLED IN TURKEY, WHILE 60% IS SENT TO LANDFILL AND THE REST OPENLY DUMPED
PLASTIC PRODUCED7.9 MT
WASTE GENERATED3.7 MT
WASTE COLLECTED3.2 MT
NOT COLLECTED 0.5 MT OPEN DUMP 0.8 MT
RECYCLED PACKAGING MATERIAL 0.2 MT
LANDFILL2.2 MT
Source: Dalberg analysis, Jambeck et al (2015),“Plastic Waste Inputs from Land into the Ocean”, World Bank (2018), PAGEV Turkish plastic industry report (2017), Turkish Plastics Magazine (2017), OECD 2019: ‘Environment Performance Reviews: Turkey 2019”

page 8 | TURKEY Stop the flood of plastic − A guide for policy-makers in Turkey
TURKEY
US $ 1.6 bn of foreign capital was invested the Turkish plastic industry since 2002 and focused mainly on plastic goods manufacturing rather than virgin plastic material production.
Turkey is 2nd largest producer of plastic goods in the region and production of plastic goods reached 7.9MT for the Turkish market in 2016 growing at 3.7% over the last five years.
Turkey is an attractive market as domestic consumption of plastic products grew at 4.1% over the last five years outstripping production growth.
Packaging is the largest industry producing 40% of plastic goods, and source of 90% of local plastic waste given their product lifetime of less than one year.
Turkey imports 87% of its virgin plastic for domestic consumption, and LDPE and PET virgin plastics make up over half of the annual plastic material usage in Turkey.
LIFESPAN AND INDUSTRY LOCAL PLASTIC GOODS REACHED 7.9MT IN 2016, 85% OF WHICH WAS DRIVEN BY THE PACKAGING INDUSTRY
TOTA
L PLA
STIC
PROD
UCTIO
N (mt
)
MEAN PRODUCT LIFETIME (years)
PACKAGING
ELECTRICAL/ELECTRONICTEXTILES
TRANSPORTATION
BUILDINGAND CONSTRUCTIONother sectors
4
3
2
1
5 10 15 20 25 30 35 40
85% of annual plastic waste is generated by the packaging industry
Almost two-thirds of Turkish plastic goods have a mean lifetime below 5 years
Source: PAGEV Turkish plastic industry report (2017)
page 9 | TURKEY Stop the flood of plastic − A guide for policy-makers in Turkey
TURKEYRECYCLING
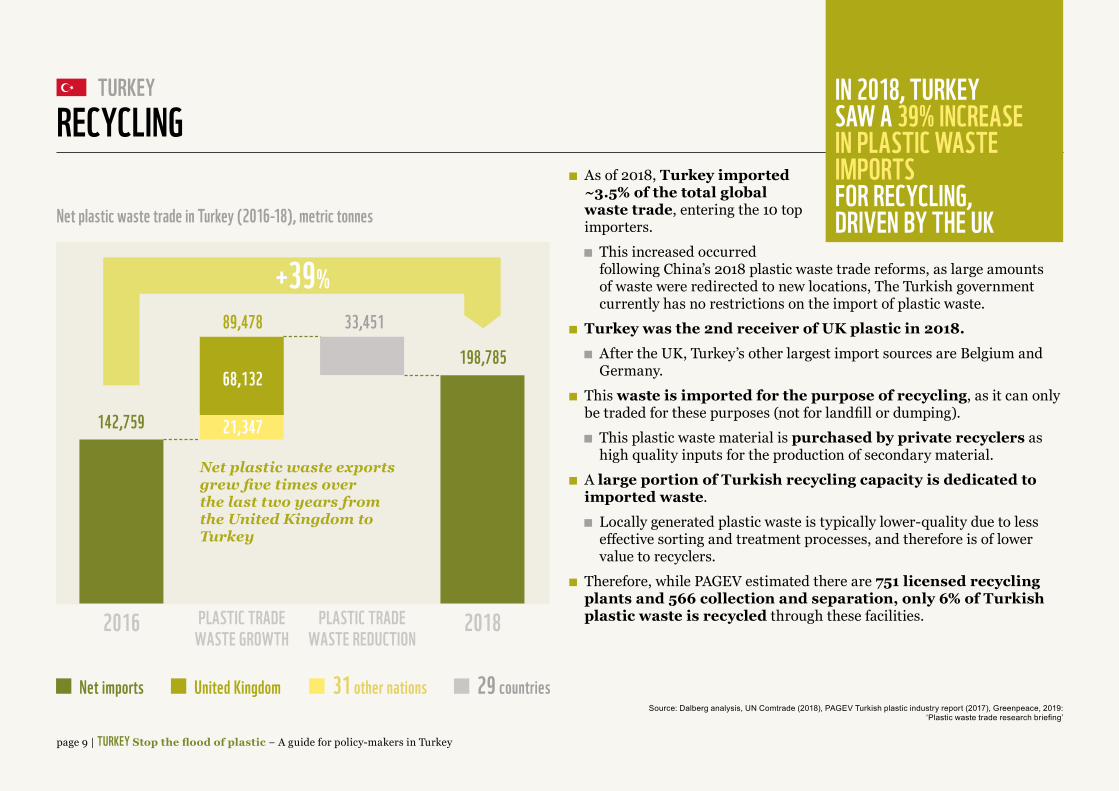
As of 2018, Turkey imported ~3.5% of the total global waste trade, entering the 10 top importers.
This increased occurred following China’s 2018 plastic waste trade reforms, as large amounts of waste were redirected to new locations, The Turkish government currently has no restrictions on the import of plastic waste.
Turkey was the 2nd receiver of UK plastic in 2018. After the UK, Turkey’s other largest import sources are Belgium and
Germany. This waste is imported for the purpose of recycling, as it can only
be traded for these purposes (not for landfill or dumping). This plastic waste material is purchased by private recyclers as
high quality inputs for the production of secondary material. A large portion of Turkish recycling capacity is dedicated to imported waste.
Locally generated plastic waste is typically lower-quality due to less effective sorting and treatment processes, and therefore is of lower value to recyclers.
Therefore, while PAGEV estimated there are 751 licensed recycling plants and 566 collection and separation, only 6% of Turkish plastic waste is recycled through these facilities.
IN 2018, TURKEY SAW A 39% INCREASE IN PLASTIC WASTE IMPORTS FOR RECYCLING, DRIVEN BY THE UK
198,785
142,759
+39%33,45189,478
68,132
21,347
2016 2018PLASTIC TRADEWASTE GROWTH
PLASTIC TRADEWASTE REDUCTION
Net imports United Kingdom 31 other nations 29 countriesSource: Dalberg analysis, UN Comtrade (2018), PAGEV Turkish plastic industry report (2017), Greenpeace, 2019:
‘Plastic waste trade research briefing’
Net plastic waste trade in Turkey (2016-18), metric tonnes
Net plastic waste exports grew five times over the last two years from the United Kingdom to Turkey
page 10 | TURKEY Stop the flood of plastic − A guide for policy-makers in Turkey
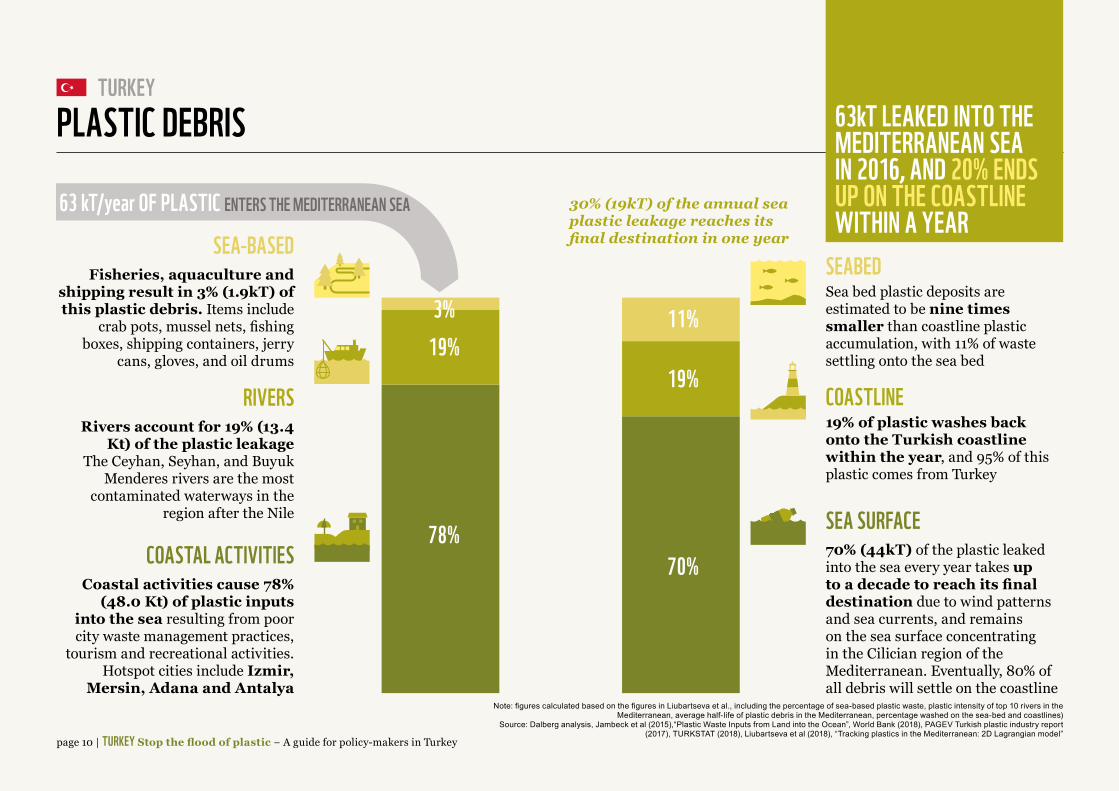
TURKEYPLASTIC DEBRIS 63kT LEAKED INTO THE
MEDITERRANEAN SEA IN 2016, AND 20% ENDS UP ON THE COASTLINE WITHIN A YEAR
Sea based seasurface
Sea bedCoastalactivities
Rivers Coastline
78%
19%11%
19%
70%
3%
63 kT/year OF PLASTIC ENTERS THE MEDITERRANEAN SEA
SEA-BASEDSEABED
Rivers account for 19% (13.4 Kt) of the plastic leakage
The Ceyhan, Seyhan, and Buyuk Menderes rivers are the most
contaminated waterways in the region after the Nile
Sea bed plastic deposits are estimated to be nine times smaller than coastline plastic accumulation, with 11% of waste settling onto the sea bed
RIVERS
Fisheries, aquaculture and shipping result in 3% (1.9kT) of this plastic debris. Items include
crab pots, mussel nets, fishing boxes, shipping containers, jerry
cans, gloves, and oil drums
COASTLINE19% of plastic washes back onto the Turkish coastline within the year, and 95% of this plastic comes from Turkey
COASTAL ACTIVITIESCoastal activities cause 78%
(48.0 Kt) of plastic inputs into the sea resulting from poor city waste management practices,
tourism and recreational activities. Hotspot cities include Izmir,
Mersin, Adana and Antalya
SEA SURFACE70% (44kT) of the plastic leaked into the sea every year takes up to a decade to reach its final destination due to wind patterns and sea currents, and remains on the sea surface concentrating in the Cilician region of the Mediterranean. Eventually, 80% of all debris will settle on the coastline
Note: figures calculated based on the figures in Liubartseva et al., including the percentage of sea-based plastic waste, plastic intensity of top 10 rivers in the Mediterranean, average half-life of plastic debris in the Mediterranean, percentage washed on the sea-bed and coastlines)
Source: Dalberg analysis, Jambeck et al (2015),“Plastic Waste Inputs from Land into the Ocean”, World Bank (2018), PAGEV Turkish plastic industry report (2017), TURKSTAT (2018), Liubartseva et al (2018), “Tracking plastics in the Mediterranean: 2D Lagrangian model”
30% (19kT) of the annual sea plastic leakage reaches its final destination in one year
page 11 | TURKEY Stop the flood of plastic − A guide for policy-makers in Turkey
TURKEY
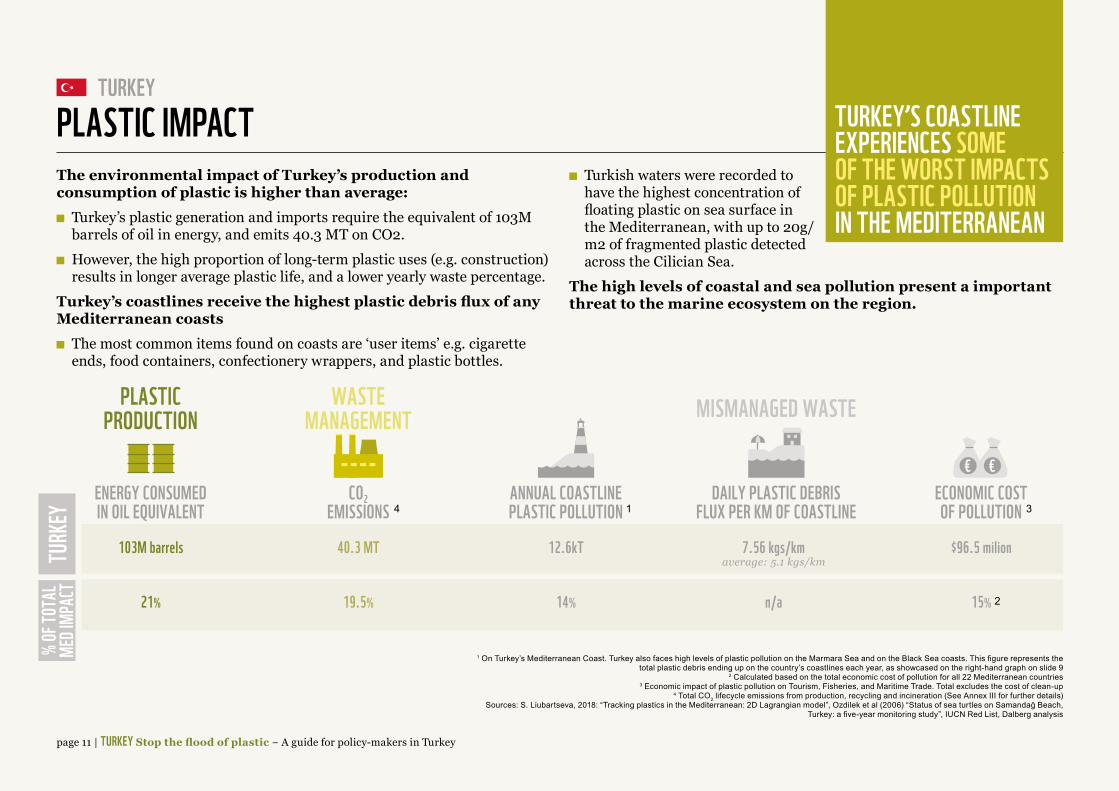
The environmental impact of Turkey’s production and consumption of plastic is higher than average:
Turkey’s plastic generation and imports require the equivalent of 103M barrels of oil in energy, and emits 40.3 MT on CO2.
However, the high proportion of long-term plastic uses (e.g. construction) results in longer average plastic life, and a lower yearly waste percentage.
Turkey’s coastlines receive the highest plastic debris flux of any Mediterranean coasts
The most common items found on coasts are ‘user items’ e.g. cigarette ends, food containers, confectionery wrappers, and plastic bottles.
PLASTIC IMPACT Turkish waters were recorded to
have the highest concentration of floating plastic on sea surface in the Mediterranean, with up to 20g/m2 of fragmented plastic detected across the Cilician Sea.
The high levels of coastal and sea pollution present a important threat to the marine ecosystem on the region.
TURKEY’S COASTLINE EXPERIENCES SOME OF THE WORST IMPACTS OF PLASTIC POLLUTION IN THE MEDITERRANEAN
1 On Turkey’s Mediterranean Coast. Turkey also faces high levels of plastic pollution on the Marmara Sea and on the Black Sea coasts. This figure represents the total plastic debris ending up on the country’s coastlines each year, as showcased on the right-hand graph on slide 9
2 Calculated based on the total economic cost of pollution for all 22 Mediterranean countries 3 Economic impact of plastic pollution on Tourism, Fisheries, and Maritime Trade. Total excludes the cost of clean-up
4 Total CO2 lifecycle emissions from production, recycling and incineration (See Annex III for further details) Sources: S. Liubartseva, 2018: “Tracking plastics in the Mediterranean: 2D Lagrangian model”, Ozdilek et al (2006) “Status of sea turtles on Samandağ Beach,
Turkey: a five-year monitoring study”, IUCN Red List, Dalberg analysis
TURK
EY%
OF TO
TAL
MED I
MPAC
T
103M barrels
21%
average: 5.1 kgs/km40.3 MT
19.5%
12.6kT
14%
7.56 kgs/km
n/a
$96.5 milion
15%
ENERGY CONSUMEDIN OIL EQUIVALENT
ANNUAL COASTLINEPLASTIC POLLUTION
ECONOMIC COSTOF POLLUTION
DAILY PLASTIC DEBRISFLUX PER KM OF COASTLINE
CO2EMISSIONS
€€
PLASTICPRODUCTION
WASTEMANAGEMENT MISMANAGED WASTE
14
2
3
page 12 | TURKEY Stop the flood of plastic − A guide for policy-makers in Turkey
TURKEY
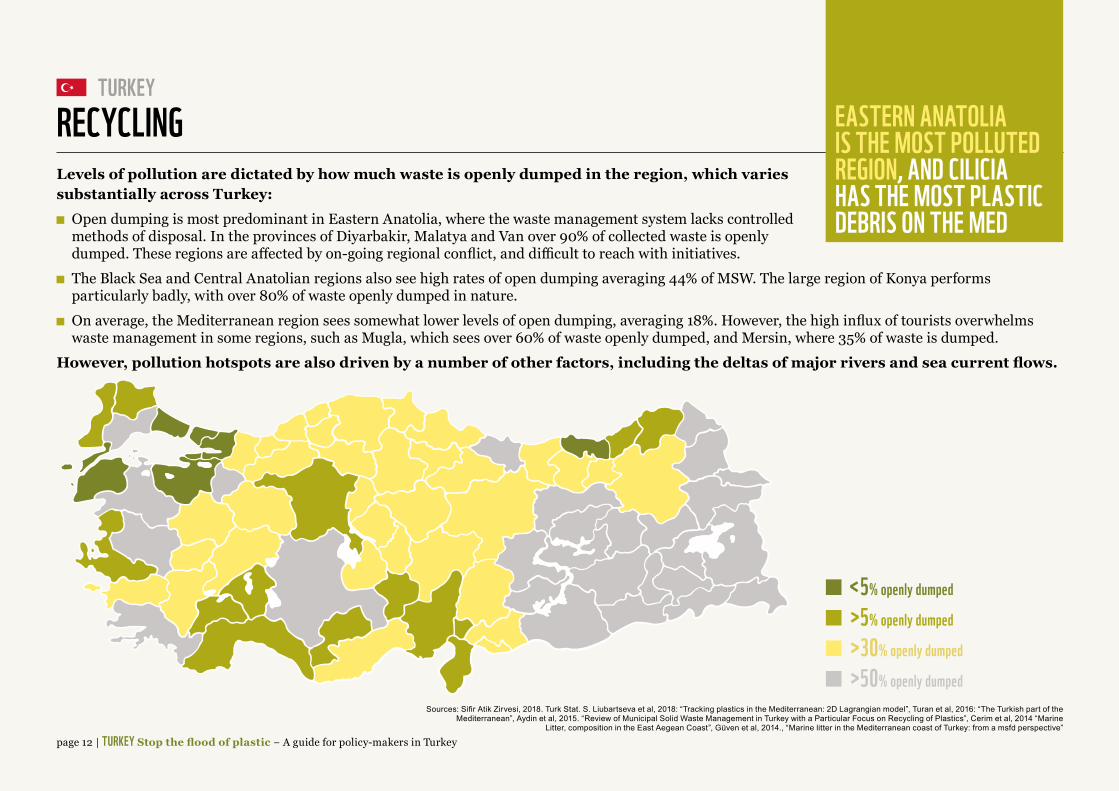
Levels of pollution are dictated by how much waste is openly dumped in the region, which varies substantially across Turkey:
Open dumping is most predominant in Eastern Anatolia, where the waste management system lacks controlled methods of disposal. In the provinces of Diyarbakir, Malatya and Van over 90% of collected waste is openly dumped. These regions are affected by on-going regional conflict, and difficult to reach with initiatives.
The Black Sea and Central Anatolian regions also see high rates of open dumping averaging 44% of MSW. The large region of Konya performs particularly badly, with over 80% of waste openly dumped in nature.
On average, the Mediterranean region sees somewhat lower levels of open dumping, averaging 18%. However, the high influx of tourists overwhelms waste management in some regions, such as Mugla, which sees over 60% of waste openly dumped, and Mersin, where 35% of waste is dumped.
However, pollution hotspots are also driven by a number of other factors, including the deltas of major rivers and sea current flows.
RECYCLING EASTERN ANATOLIA IS THE MOST POLLUTED REGION, AND CILICIA HAS THE MOST PLASTIC DEBRIS ON THE MED
<5% openly dumped
>5% openly dumped
>30% openly dumped
>50% openly dumpedSources: Sifir Atik Zirvesi, 2018. Turk Stat. S. Liubartseva et al, 2018: “Tracking plastics in the Mediterranean: 2D Lagrangian model”, Turan et al, 2016: “The Turkish part of the
Mediterranean”, Aydin et al, 2015. “Review of Municipal Solid Waste Management in Turkey with a Particular Focus on Recycling of Plastics”, Cerim et al, 2014 “Marine Litter, composition in the East Aegean Coast”, Güven et al, 2014., “Marine litter in the Mediterranean coast of Turkey: from a msfd perspective”
page 13 | TURKEY Stop the flood of plastic − A guide for policy-makers in Turkey
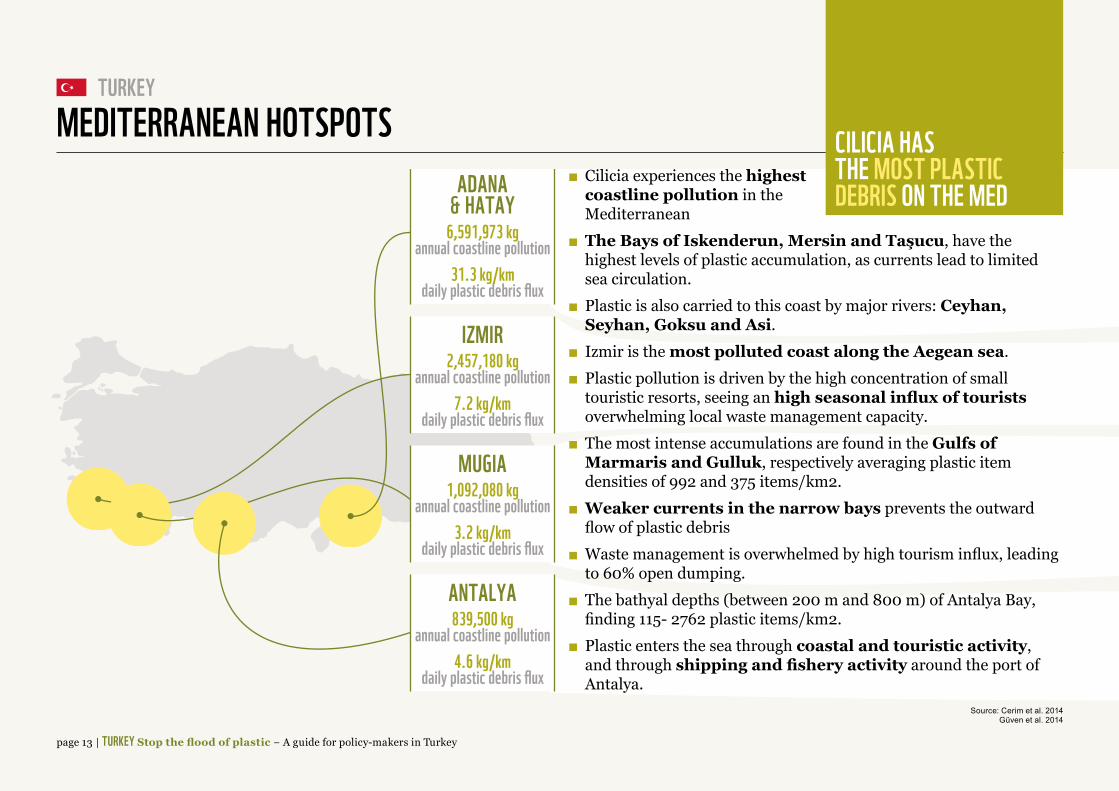
TURKEYMEDITERRANEAN HOTSPOTS CILICIA HAS
THE MOST PLASTIC DEBRIS ON THE MED
Cilicia experiences the highest coastline pollution in the Mediterranean
The Bays of Iskenderun, Mersin and Taşucu, have the highest levels of plastic accumulation, as currents lead to limited sea circulation.
Plastic is also carried to this coast by major rivers: Ceyhan, Seyhan, Goksu and Asi.
Izmir is the most polluted coast along the Aegean sea. Plastic pollution is driven by the high concentration of small
touristic resorts, seeing an high seasonal influx of tourists overwhelming local waste management capacity.
The most intense accumulations are found in the Gulfs of Marmaris and Gulluk, respectively averaging plastic item densities of 992 and 375 items/km2.
Weaker currents in the narrow bays prevents the outward flow of plastic debris
Waste management is overwhelmed by high tourism influx, leading to 60% open dumping.
The bathyal depths (between 200 m and 800 m) of Antalya Bay, finding 115- 2762 plastic items/km2.
Plastic enters the sea through coastal and touristic activity, and through shipping and fishery activity around the port of Antalya.
Sea based seasurface
Sea bedCoastalactivities
Rivers Coastline
18%
79%
3%
ADANA& HATAY
6,591,973 kgannual coastline pollution
31.3 kg/kmdaily plastic debris flux
IZMIR2,457,180 kg
annual coastline pollution7.2 kg/km
daily plastic debris flux
MUGIA1,092,080 kg
annual coastline pollution3.2 kg/km
daily plastic debris flux
ANTALYA839,500 kg
annual coastline pollution4.6 kg/km
daily plastic debris fluxSource: Cerim et al. 2014
Güven et al. 2014
page 14 | TURKEY Stop the flood of plastic − A guide for policy-makers in Turkey
TURKEY
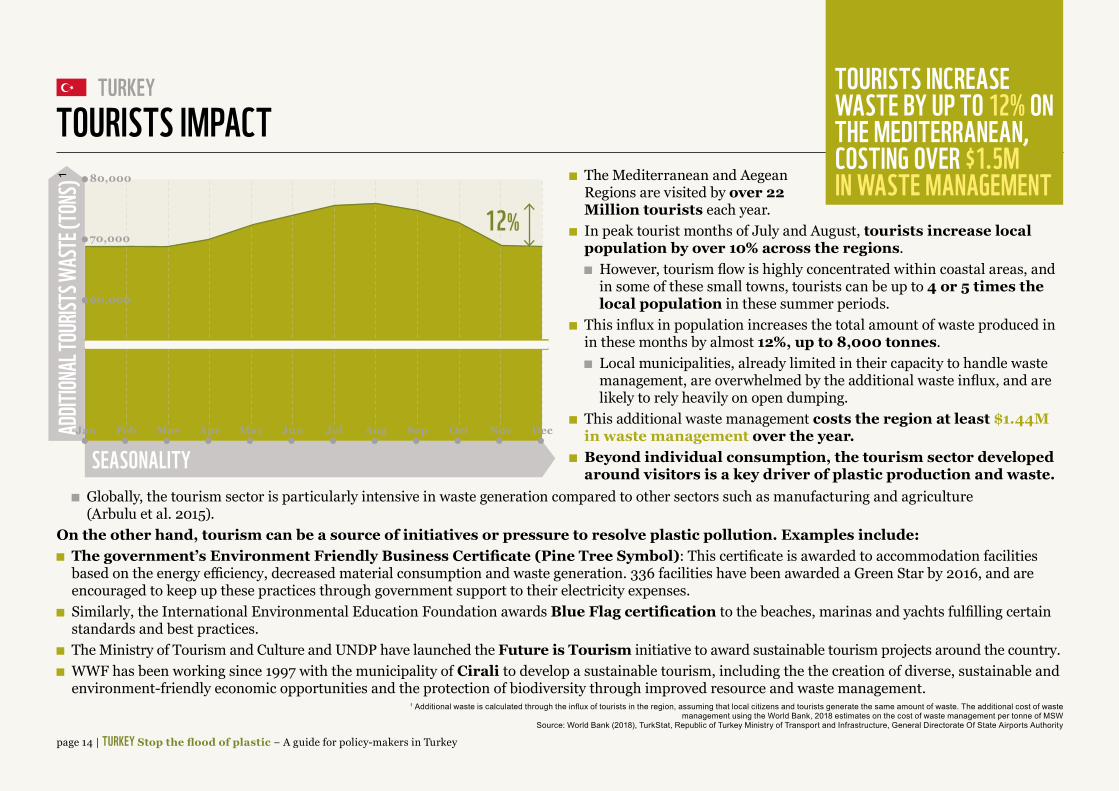
The Mediterranean and Aegean Regions are visited by over 22 Million tourists each year.
In peak tourist months of July and August, tourists increase local population by over 10% across the regions.
However, tourism flow is highly concentrated within coastal areas, and in some of these small towns, tourists can be up to 4 or 5 times the local population in these summer periods.
This influx in population increases the total amount of waste produced in in these months by almost 12%, up to 8,000 tonnes.
Local municipalities, already limited in their capacity to handle waste management, are overwhelmed by the additional waste influx, and are likely to rely heavily on open dumping.
This additional waste management costs the region at least $1.44M in waste management over the year.
Beyond individual consumption, the tourism sector developed around visitors is a key driver of plastic production and waste.
TOURISTS IMPACTTOURISTS INCREASE WASTE BY UP TO 12% ON THE MEDITERRANEAN, COSTING OVER $1.5M IN WASTE MANAGEMENT
Globally, the tourism sector is particularly intensive in waste generation compared to other sectors such as manufacturing and agriculture (Arbulu et al. 2015).
On the other hand, tourism can be a source of initiatives or pressure to resolve plastic pollution. Examples include: The government’s Environment Friendly Business Certificate (Pine Tree Symbol): This certificate is awarded to accommodation facilities
based on the energy efficiency, decreased material consumption and waste generation. 336 facilities have been awarded a Green Star by 2016, and are encouraged to keep up these practices through government support to their electricity expenses.
Similarly, the International Environmental Education Foundation awards Blue Flag certification to the beaches, marinas and yachts fulfilling certain standards and best practices.
The Ministry of Tourism and Culture and UNDP have launched the Future is Tourism initiative to award sustainable tourism projects around the country. WWF has been working since 1997 with the municipality of Cirali to develop a sustainable tourism, including the the creation of diverse, sustainable and
environment-friendly economic opportunities and the protection of biodiversity through improved resource and waste management.
ADDIT
IONAL
TOUR
ISTS W
ASTE
(TON
S)
SEASONALITY
70,000
60,000
80,000
12%
Jan Feb AprMar JunMay AugJul OctSep DecNov
1 Additional waste is calculated through the influx of tourists in the region, assuming that local citizens and tourists generate the same amount of waste. The additional cost of waste management using the World Bank, 2018 estimates on the cost of waste management per tonne of MSW
Source: World Bank (2018), TurkStat, Republic of Turkey Ministry of Transport and Infrastructure, General Directorate Of State Airports Authority
1
page 15 | TURKEY Stop the flood of plastic − A guide for policy-makers in Turkey
TURKEY
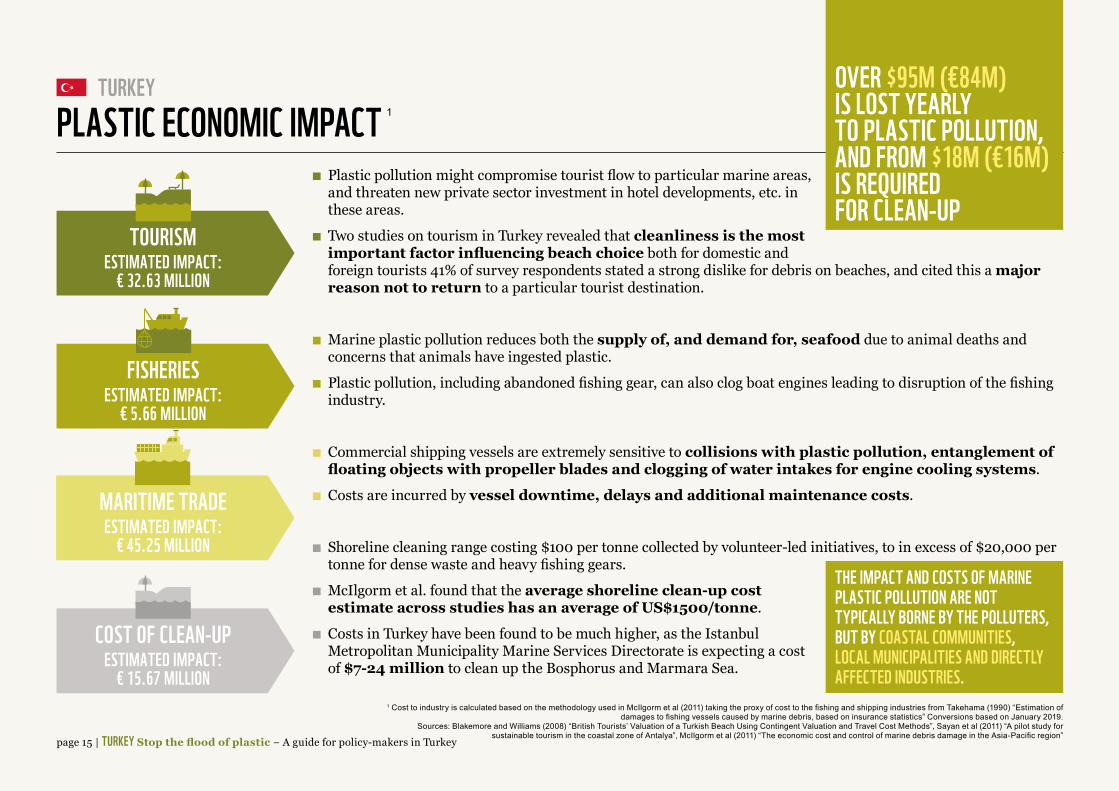
Plastic pollution might compromise tourist flow to particular marine areas, and threaten new private sector investment in hotel developments, etc. in these areas.
Two studies on tourism in Turkey revealed that cleanliness is the most important factor influencing beach choice both for domestic and foreign tourists 41% of survey respondents stated a strong dislike for debris on beaches, and cited this a major reason not to return to a particular tourist destination.
Marine plastic pollution reduces both the supply of, and demand for, seafood due to animal deaths and concerns that animals have ingested plastic.
Plastic pollution, including abandoned fishing gear, can also clog boat engines leading to disruption of the fishing industry.
Commercial shipping vessels are extremely sensitive to collisions with plastic pollution, entanglement of floating objects with propeller blades and clogging of water intakes for engine cooling systems.
Costs are incurred by vessel downtime, delays and additional maintenance costs.
Shoreline cleaning range costing $100 per tonne collected by volunteer-led initiatives, to in excess of $20,000 per tonne for dense waste and heavy fishing gears.
McIlgorm et al. found that the average shoreline clean-up cost estimate across studies has an average of US$1500/tonne.
Costs in Turkey have been found to be much higher, as the Istanbul Metropolitan Municipality Marine Services Directorate is expecting a cost of $7-24 million to clean up the Bosphorus and Marmara Sea.
PLASTIC ECONOMIC IMPACTOVER $95M (€84M) IS LOST YEARLY TO PLASTIC POLLUTION, AND FROM $18M (€16M) IS REQUIRED FOR CLEAN-UP
TOURISMESTIMATED IMPACT:
€ 32.63 MILLION
FISHERIESESTIMATED IMPACT:
€ 5.66 MILLION
MARITIME TRADEESTIMATED IMPACT:
€ 45.25 MILLION
COST OF CLEAN-UPESTIMATED IMPACT:
€ 15.67 MILLION
THE IMPACT AND COSTS OF MARINE PLASTIC POLLUTION ARE NOT TYPICALLY BORNE BY THE POLLUTERS, BUT BY COASTAL COMMUNITIES, LOCAL MUNICIPALITIES AND DIRECTLY AFFECTED INDUSTRIES.
1 Cost to industry is calculated based on the methodology used in McIlgorm et al (2011) taking the proxy of cost to the fishing and shipping industries from Takehama (1990) “Estimation of damages to fishing vessels caused by marine debris, based on insurance statistics” Conversions based on January 2019.
Sources: Blakemore and Williams (2008) “British Tourists’ Valuation of a Turkish Beach Using Contingent Valuation and Travel Cost Methods”, Sayan et al (2011) “A pilot study for sustainable tourism in the coastal zone of Antalya”, McIlgorm et al (2011) “The economic cost and control of marine debris damage in the Asia-Pacific region”
1
page 16 | TURKEY Stop the flood of plastic − A guide for policy-makers in Turkey
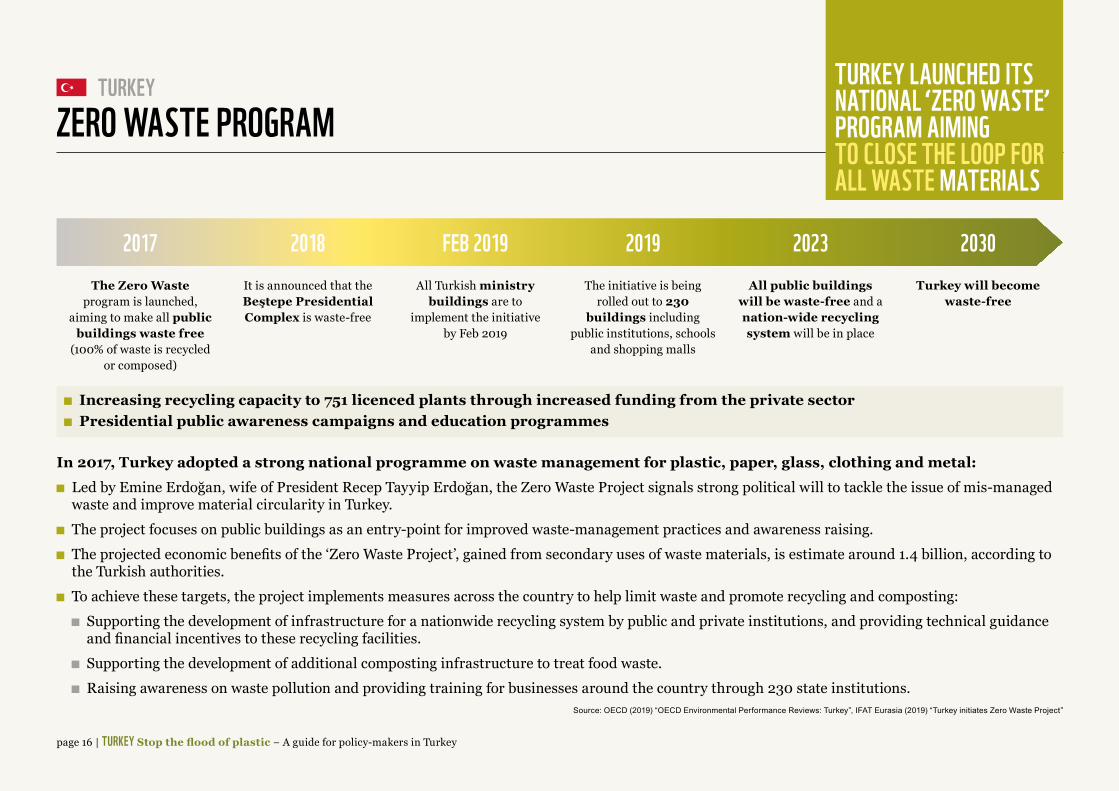
TURKEY TURKEY LAUNCHED ITS NATIONAL ‘ZERO WASTE’ PROGRAM AIMING TO CLOSE THE LOOP FOR ALL WASTE MATERIALS
ZERO WASTE PROGRAM
In 2017, Turkey adopted a strong national programme on waste management for plastic, paper, glass, clothing and metal: Led by Emine Erdoğan, wife of President Recep Tayyip Erdoğan, the Zero Waste Project signals strong political will to tackle the issue of mis-managed
waste and improve material circularity in Turkey. The project focuses on public buildings as an entry-point for improved waste-management practices and awareness raising. The projected economic benefits of the ‘Zero Waste Project’, gained from secondary uses of waste materials, is estimate around 1.4 billion, according to
the Turkish authorities. To achieve these targets, the project implements measures across the country to help limit waste and promote recycling and composting:
Supporting the development of infrastructure for a nationwide recycling system by public and private institutions, and providing technical guidance and financial incentives to these recycling facilities.
Supporting the development of additional composting infrastructure to treat food waste. Raising awareness on waste pollution and providing training for businesses around the country through 230 state institutions.
Source: OECD (2019) “OECD Environmental Performance Reviews: Turkey”, IFAT Eurasia (2019) “Turkey initiates Zero Waste Project”
2017 2018 FEB 2019 2019 2023 2030The Zero Waste
program is launched, aiming to make all public
buildings waste free (100% of waste is recycled
or composed)
It is announced that the Beştepe Presidential Complex is waste-free
All Turkish ministry buildings are to
implement the initiative by Feb 2019
The initiative is being rolled out to 230
buildings including public institutions, schools
and shopping malls
All public buildings will be waste-free and a nation-wide recycling system will be in place
Turkey will become waste-free
Increasing recycling capacity to 751 licenced plants through increased funding from the private sector Presidential public awareness campaigns and education programmes
page 17 | TURKEY Stop the flood of plastic − A guide for policy-makers in Turkey
TURKEY
PLASTICPRODUCTION
PLASTICUSAGE
WASTEMANAGEMENT
MISMANAGED WASTE
natio
nal le
vel
munic
ipal le
vel
EXIST
ING IN
ITIAT
IVES
industry policy-makers consumers to be implemented
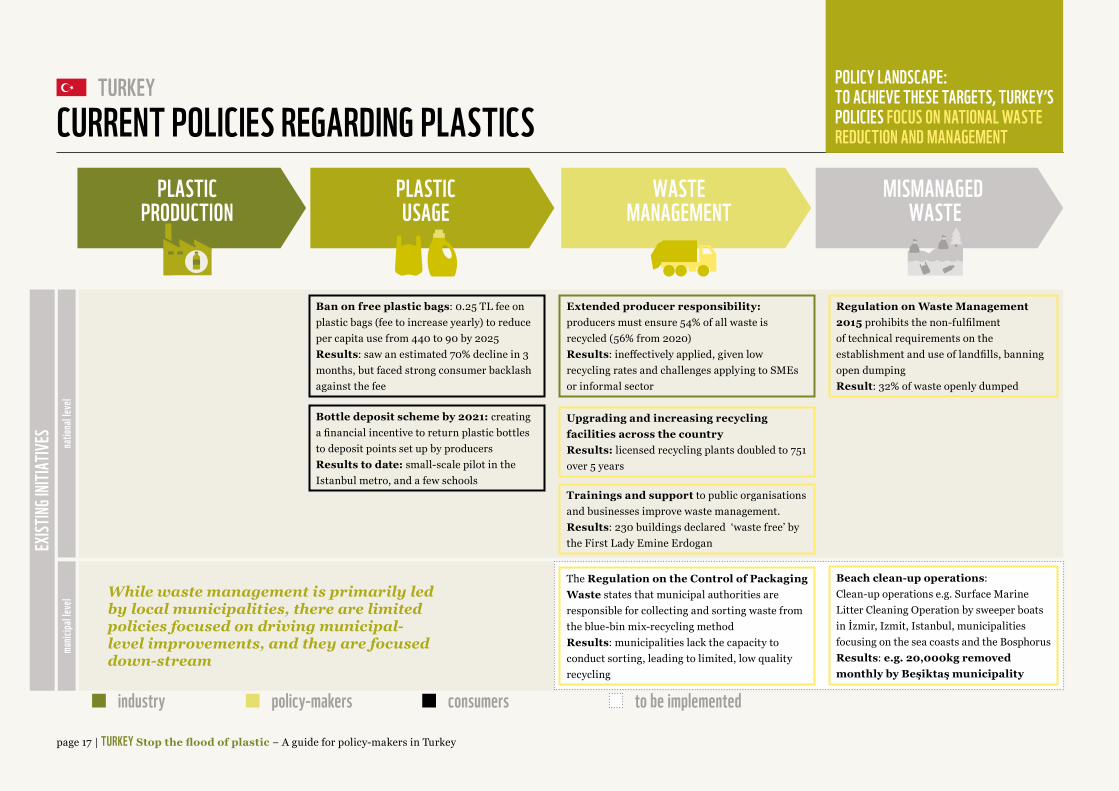
CURRENT POLICIES REGARDING PLASTICSPOLICY LANDSCAPE: TO ACHIEVE THESE TARGETS, TURKEY’S POLICIES FOCUS ON NATIONAL WASTE REDUCTION AND MANAGEMENT
Ban on free plastic bags: 0.25 TL fee on plastic bags (fee to increase yearly) to reduce per capita use from 440 to 90 by 2025 Results: saw an estimated 70% decline in 3 months, but faced strong consumer backlash against the fee
Bottle deposit scheme by 2021: creating a financial incentive to return plastic bottles to deposit points set up by producers Results to date: small-scale pilot in the Istanbul metro, and a few schools
Extended producer responsibility: producers must ensure 54% of all waste is recycled (56% from 2020) Results: ineffectively applied, given low recycling rates and challenges applying to SMEs or informal sector
Upgrading and increasing recycling facilities across the country Results: licensed recycling plants doubled to 751 over 5 years
Trainings and support to public organisations and businesses improve waste management. Results: 230 buildings declared ‘waste free’ by the First Lady Emine Erdogan
The Regulation on the Control of Packaging Waste states that municipal authorities are responsible for collecting and sorting waste from the blue-bin mix-recycling method Results: municipalities lack the capacity to conduct sorting, leading to limited, low quality recycling
Regulation on Waste Management 2015 prohibits the non-fulfilment of technical requirements on the establishment and use of landfills, banning open dumping Result: 32% of waste openly dumped
Beach clean-up operations: Clean-up operations e.g. Surface Marine Litter Cleaning Operation by sweeper boats in İzmir, Izmit, Istanbul, municipalities focusing on the sea coasts and the Bosphorus Results: e.g. 20,000kg removed monthly by Beşiktaş municipality
While waste management is primarily led by local municipalities, there are limited policies focused on driving municipal-level improvements, and they are focused down-stream
page 18 | TURKEY Stop the flood of plastic − A guide for policy-makers in Turkey
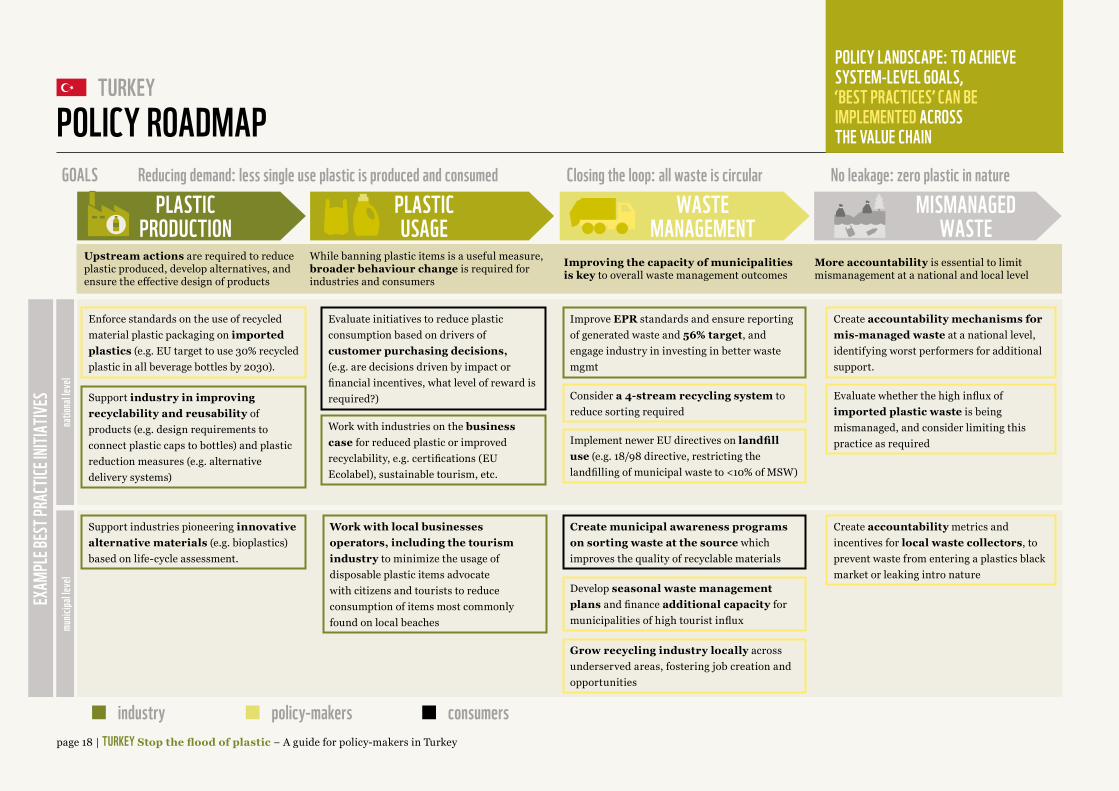
TURKEYPOLICY ROADMAPGOALS Reducing demand: less single use plastic is produced and consumed Closing the loop: all waste is circular No leakage: zero plastic in nature
PLASTICPRODUCTION
PLASTICUSAGE
WASTEMANAGEMENT
MISMANAGEDWASTE
natio
nal le
vel
munic
ipal le
vel
EXAM
PLE B
EST P
RACT
ICE IN
ITIAT
IVES
Upstream actions are required to reduce plastic produced, develop alternatives, and ensure the effective design of products
While banning plastic items is a useful measure, broader behaviour change is required for industries and consumers
Improving the capacity of municipalities is key to overall waste management outcomes
More accountability is essential to limit mismanagement at a national and local level
Enforce standards on the use of recycled material plastic packaging on imported plastics (e.g. EU target to use 30% recycled plastic in all beverage bottles by 2030).
Support industry in improving recyclability and reusability of products (e.g. design requirements to connect plastic caps to bottles) and plastic reduction measures (e.g. alternative delivery systems)
Support industries pioneering innovative alternative materials (e.g. bioplastics) based on life-cycle assessment.
Evaluate initiatives to reduce plastic consumption based on drivers of customer purchasing decisions, (e.g. are decisions driven by impact or financial incentives, what level of reward is required?)
Work with industries on the business case for reduced plastic or improved recyclability, e.g. certifications (EU Ecolabel), sustainable tourism, etc.
Improve EPR standards and ensure reporting of generated waste and 56% target, and engage industry in investing in better waste mgmt
Consider a 4-stream recycling system to reduce sorting required
Implement newer EU directives on landfill use (e.g. 18/98 directive, restricting the landfilling of municipal waste to <10% of MSW)
Create municipal awareness programs on sorting waste at the source which improves the quality of recyclable materials
Develop seasonal waste management plans and finance additional capacity for municipalities of high tourist influx
Grow recycling industry locally across underserved areas, fostering job creation and opportunities
Create accountability mechanisms for mis-managed waste at a national level, identifying worst performers for additional support.
Evaluate whether the high influx of imported plastic waste is being mismanaged, and consider limiting this practice as required
Create accountability metrics and incentives for local waste collectors, to prevent waste from entering a plastics black market or leaking intro nature
industry policy-makers consumers
Work with local businesses operators, including the tourism industry to minimize the usage of disposable plastic items advocate with citizens and tourists to reduce consumption of items most commonly found on local beaches
POLICY LANDSCAPE: TO ACHIEVE SYSTEM-LEVEL GOALS, ‘BEST PRACTICES’ CAN BE IMPLEMENTED ACROSS THE VALUE CHAIN
page 19 | TURKEY Stop the flood of plastic − A guide for policy-makers in Turkey
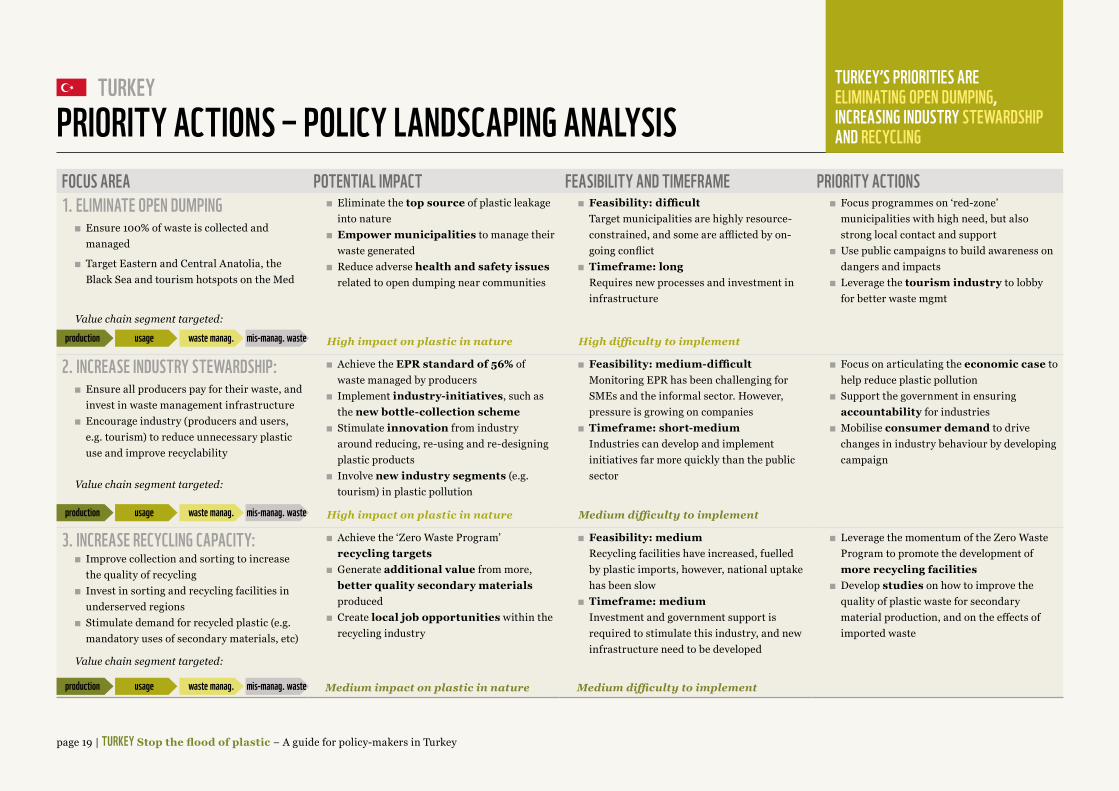
TURKEYPRIORITY ACTIONS ‒ POLICY LANDSCAPING ANALYSISFOCUS AREA POTENTIAL IMPACT FEASIBILITY AND TIMEFRAME PRIORITY ACTIONS1. ELIMINATE OPEN DUMPING
Ensure 100% of waste is collected and managed
Target Eastern and Central Anatolia, the Black Sea and tourism hotspots on the Med
Value chain segment targeted:
Eliminate the top source of plastic leakage into nature
Empower municipalities to manage their waste generated
Reduce adverse health and safety issues related to open dumping near communities
Feasibility: difficult Target municipalities are highly resource-constrained, and some are afflicted by on-going conflict
Timeframe: long Requires new processes and investment in infrastructure
Focus programmes on ‘red-zone’ municipalities with high need, but also strong local contact and support
Use public campaigns to build awareness on dangers and impacts
Leverage the tourism industry to lobby for better waste mgmt
High impact on plastic in nature High difficulty to implement
2. INCREASE INDUSTRY STEWARDSHIP: Ensure all producers pay for their waste, and
invest in waste management infrastructure Encourage industry (producers and users,
e.g. tourism) to reduce unnecessary plastic use and improve recyclability
Value chain segment targeted:
Achieve the EPR standard of 56% of waste managed by producers
Implement industry-initiatives, such as the new bottle-collection scheme
Stimulate innovation from industry around reducing, re-using and re-designing plastic products
Involve new industry segments (e.g. tourism) in plastic pollution
Feasibility: medium-difficult Monitoring EPR has been challenging for SMEs and the informal sector. However, pressure is growing on companies
Timeframe: short-medium Industries can develop and implement initiatives far more quickly than the public sector
Focus on articulating the economic case to help reduce plastic pollution
Support the government in ensuring accountability for industries
Mobilise consumer demand to drive changes in industry behaviour by developing campaign
High impact on plastic in nature Medium difficulty to implement
3. INCREASE RECYCLING CAPACITY: Improve collection and sorting to increase
the quality of recycling Invest in sorting and recycling facilities in
underserved regions Stimulate demand for recycled plastic (e.g.
mandatory uses of secondary materials, etc)
Value chain segment targeted:
Achieve the ‘Zero Waste Program’ recycling targets
Generate additional value from more, better quality secondary materials produced
Create local job opportunities within the recycling industry
Feasibility: medium Recycling facilities have increased, fuelled by plastic imports, however, national uptake has been slow
Timeframe: medium Investment and government support is required to stimulate this industry, and new infrastructure need to be developed
Leverage the momentum of the Zero Waste Program to promote the development of more recycling facilities
Develop studies on how to improve the quality of plastic waste for secondary material production, and on the effects of imported waste
Medium impact on plastic in nature Medium difficulty to implement
production usage waste manag. mis-manag. waste
production usage waste manag. mis-manag. waste
production usage waste manag. mis-manag. waste
TURKEY’S PRIORITIES ARE ELIMINATING OPEN DUMPING, INCREASING INDUSTRY STEWARDSHIP AND RECYCLING
page 20 | TURKEY Stop the flood of plastic − A guide for policy-makers in Turkey
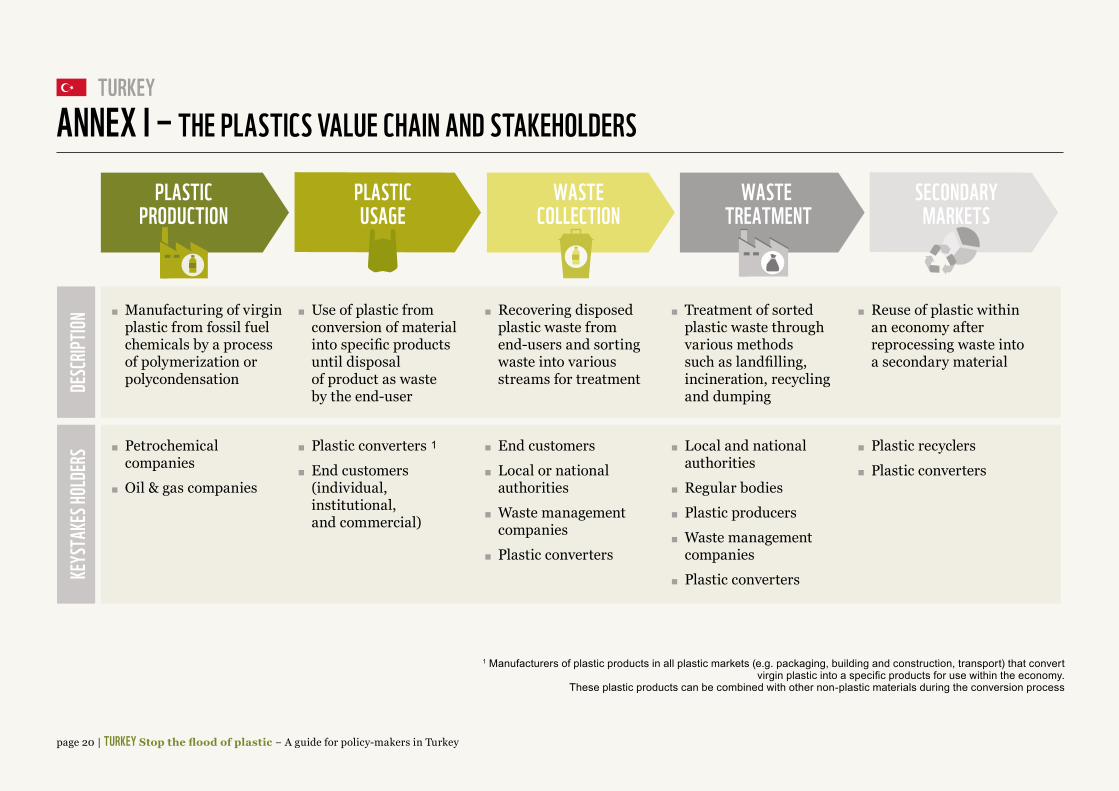
TURKEYANNEX I ‒ THE PLASTICS VALUE CHAIN AND STAKEHOLDERS
PLASTICPRODUCTION
PLASTICUSAGE
WASTECOLLECTION
WASTE TREATMENT
SECONDARYMARKETS
DESC
RIPTIO
NKE
YSTA
KES H
OLDE
RS
Manufacturing of virgin plastic from fossil fuel chemicals by a process of polymerization or polycondensation
Use of plastic from conversion of material into specific products until disposal of product as waste by the end-user
Recovering disposed plastic waste from end-users and sorting waste into various streams for treatment
Treatment of sorted plastic waste through various methods such as landfilling, incineration, recycling and dumping
Reuse of plastic within an economy after reprocessing waste into a secondary material
Petrochemical companies
Oil & gas companies
Plastic converters End customers
(individual, institutional, and commercial)
End customers Local or national
authorities Waste management
companies Plastic converters
Local and national authorities
Regular bodies Plastic producers Waste management
companies Plastic converters
Plastic recyclers Plastic converters
1
1 Manufacturers of plastic products in all plastic markets (e.g. packaging, building and construction, transport) that convert virgin plastic into a specific products for use within the economy.
These plastic products can be combined with other non-plastic materials during the conversion process
page 21 | TURKEY Stop the flood of plastic − A guide for policy-makers in Turkey
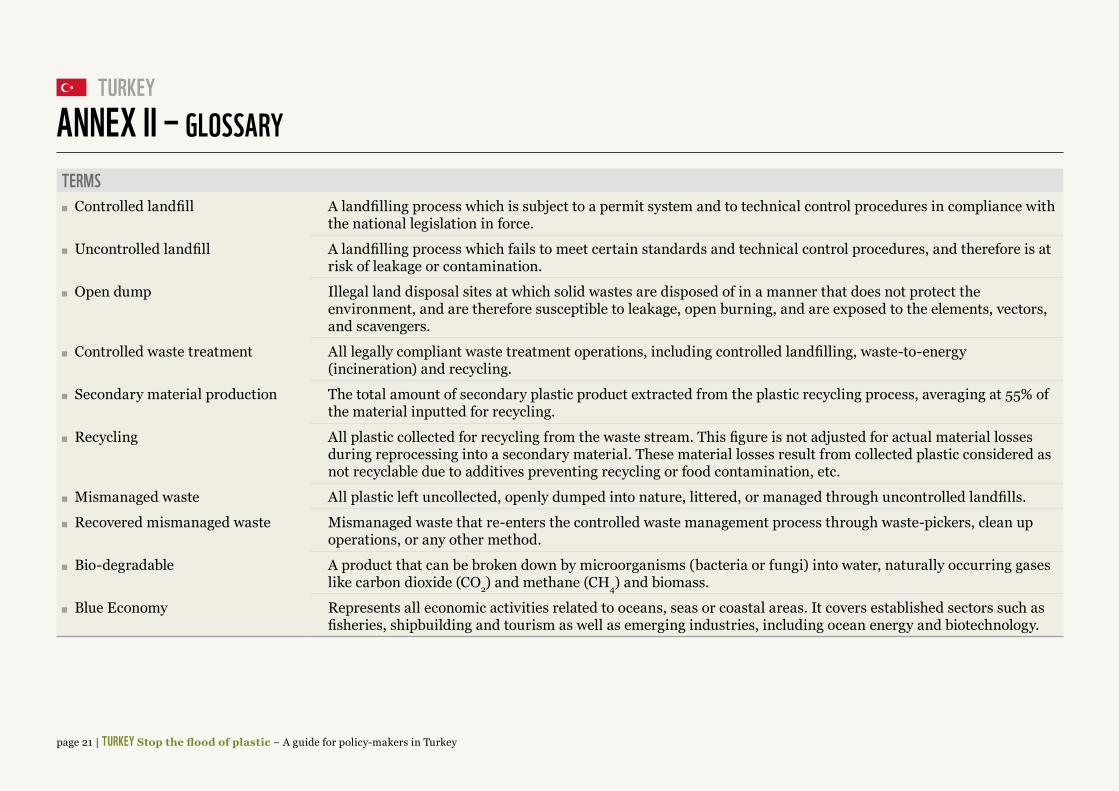
TURKEYANNEX II ‒ GLOSSARYTERMS Controlled landfill A landfilling process which is subject to a permit system and to technical control procedures in compliance with
the national legislation in force.
Uncontrolled landfill A landfilling process which fails to meet certain standards and technical control procedures, and therefore is at risk of leakage or contamination.
Open dump Illegal land disposal sites at which solid wastes are disposed of in a manner that does not protect the environment, and are therefore susceptible to leakage, open burning, and are exposed to the elements, vectors, and scavengers.
Controlled waste treatment All legally compliant waste treatment operations, including controlled landfilling, waste-to-energy (incineration) and recycling.
Secondary material production The total amount of secondary plastic product extracted from the plastic recycling process, averaging at 55% of the material inputted for recycling.
Recycling All plastic collected for recycling from the waste stream. This figure is not adjusted for actual material losses during reprocessing into a secondary material. These material losses result from collected plastic considered as not recyclable due to additives preventing recycling or food contamination, etc.
Mismanaged waste All plastic left uncollected, openly dumped into nature, littered, or managed through uncontrolled landfills.
Recovered mismanaged waste Mismanaged waste that re-enters the controlled waste management process through waste-pickers, clean up operations, or any other method.
Bio-degradable A product that can be broken down by microorganisms (bacteria or fungi) into water, naturally occurring gases like carbon dioxide (CO2) and methane (CH4) and biomass.
Blue Economy Represents all economic activities related to oceans, seas or coastal areas. It covers established sectors such as fisheries, shipbuilding and tourism as well as emerging industries, including ocean energy and biotechnology.
page 22 | TURKEY Stop the flood of plastic − A guide for policy-makers in Turkey
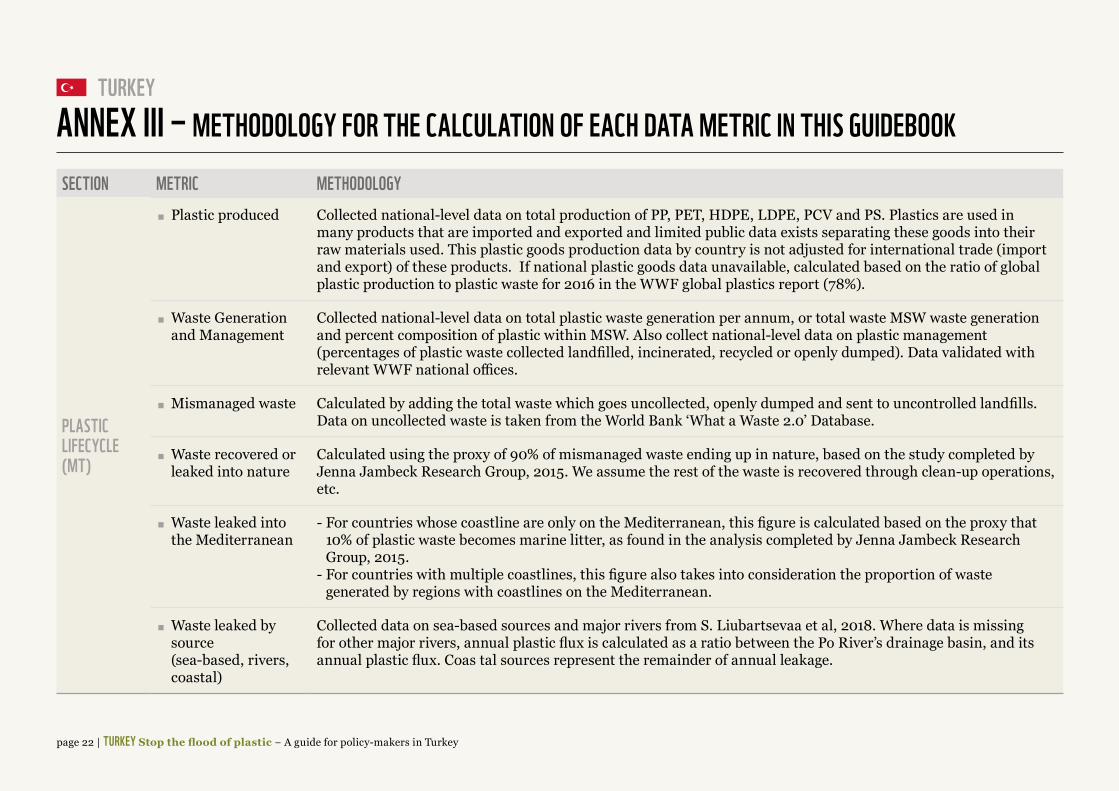
TURKEYANNEX III ‒ METHODOLOGY FOR THE CALCULATION OF EACH DATA METRIC IN THIS GUIDEBOOKSECTION METRIC METHODOLOGY
PLASTICLIFECYCLE(MT)
Plastic produced Collected national-level data on total production of PP, PET, HDPE, LDPE, PCV and PS. Plastics are used in many products that are imported and exported and limited public data exists separating these goods into their raw materials used. This plastic goods production data by country is not adjusted for international trade (import and export) of these products. If national plastic goods data unavailable, calculated based on the ratio of global plastic production to plastic waste for 2016 in the WWF global plastics report (78%).
Waste Generation and Management
Collected national-level data on total plastic waste generation per annum, or total waste MSW waste generation and percent composition of plastic within MSW. Also collect national-level data on plastic management (percentages of plastic waste collected landfilled, incinerated, recycled or openly dumped). Data validated with relevant WWF national offices.
Mismanaged waste Calculated by adding the total waste which goes uncollected, openly dumped and sent to uncontrolled landfills. Data on uncollected waste is taken from the World Bank ‘What a Waste 2.0’ Database.
Waste recovered or leaked into nature
Calculated using the proxy of 90% of mismanaged waste ending up in nature, based on the study completed by Jenna Jambeck Research Group, 2015. We assume the rest of the waste is recovered through clean-up operations, etc.
Waste leaked into the Mediterranean
- For countries whose coastline are only on the Mediterranean, this figure is calculated based on the proxy that 10% of plastic waste becomes marine litter, as found in the analysis completed by Jenna Jambeck Research Group, 2015.
- For countries with multiple coastlines, this figure also takes into consideration the proportion of waste generated by regions with coastlines on the Mediterranean.
Waste leaked by source (sea-based, rivers, coastal)
Collected data on sea-based sources and major rivers from S. Liubartsevaa et al, 2018. Where data is missing for other major rivers, annual plastic flux is calculated as a ratio between the Po River’s drainage basin, and its annual plastic flux. Coas tal sources represent the remainder of annual leakage.
page 23 | TURKEY Stop the flood of plastic − A guide for policy-makers in Turkey
TURKEY
SECTION METRIC METHODOLOGY
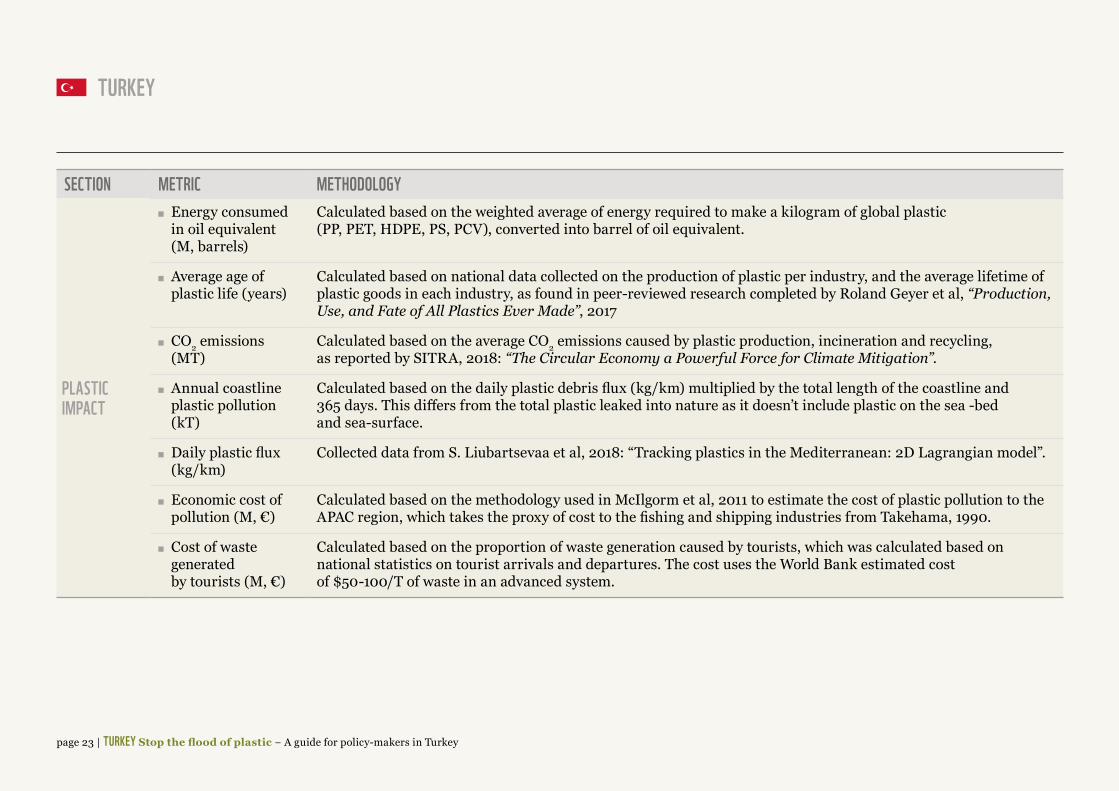
PLASTICIMPACT
Energy consumed in oil equivalent (M, barrels)
Calculated based on the weighted average of energy required to make a kilogram of global plastic (PP, PET, HDPE, PS, PCV), converted into barrel of oil equivalent.
Average age of plastic life (years)
Calculated based on national data collected on the production of plastic per industry, and the average lifetime of plastic goods in each industry, as found in peer-reviewed research completed by Roland Geyer et al, “Production, Use, and Fate of All Plastics Ever Made”, 2017
CO2 emissions (MT)
Calculated based on the average CO2 emissions caused by plastic production, incineration and recycling, as reported by SITRA, 2018: “The Circular Economy a Powerful Force for Climate Mitigation”.
Annual coastline plastic pollution (kT)
Calculated based on the daily plastic debris flux (kg/km) multiplied by the total length of the coastline and 365 days. This differs from the total plastic leaked into nature as it doesn’t include plastic on the sea -bed and sea-surface.
Daily plastic flux (kg/km)
Collected data from S. Liubartsevaa et al, 2018: “Tracking plastics in the Mediterranean: 2D Lagrangian model”.
Economic cost of pollution (M, €)
Calculated based on the methodology used in McIlgorm et al, 2011 to estimate the cost of plastic pollution to the APAC region, which takes the proxy of cost to the fishing and shipping industries from Takehama, 1990.
Cost of waste generated by tourists (M, €)
Calculated based on the proportion of waste generation caused by tourists, which was calculated based on national statistics on tourist arrivals and departures. The cost uses the World Bank estimated cost of $50-100/T of waste in an advanced system.
page 24 | TURKEY Stop the flood of plastic − A guide for policy-makers in Turkey
TURKEY
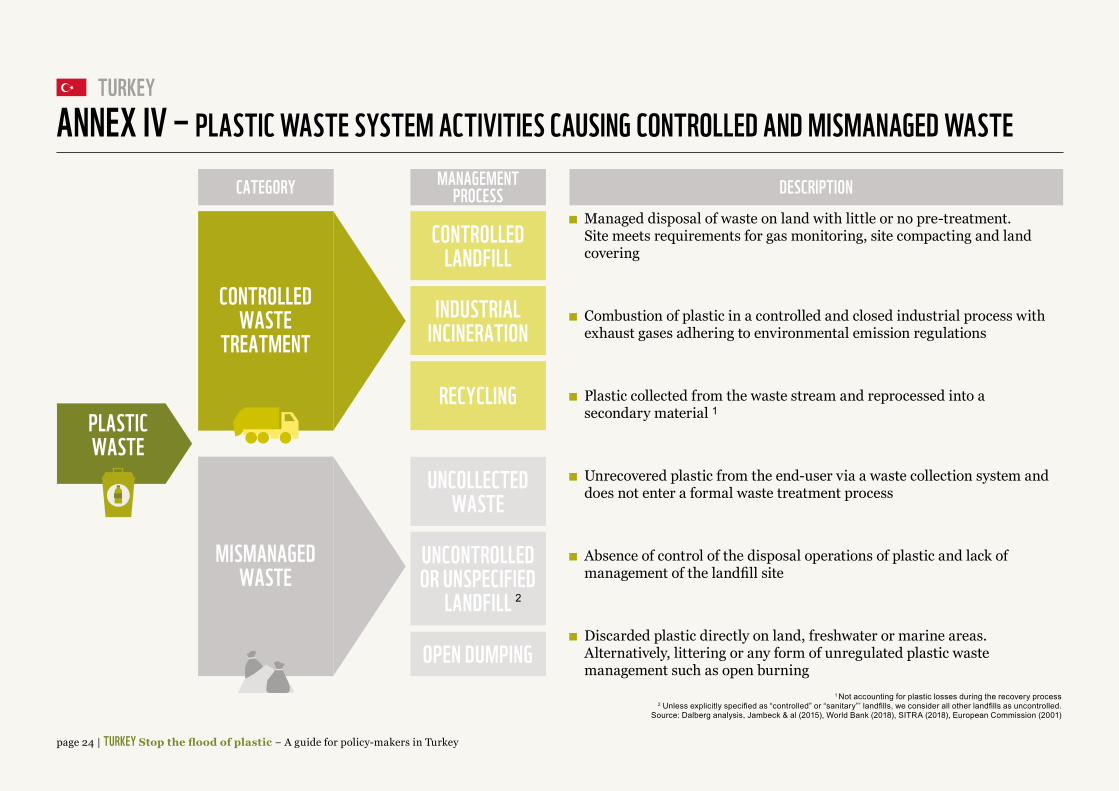
1 Not accounting for plastic losses during the recovery process 2 Unless explicitly specified as “controlled” or “sanitary”’ landfills, we consider all other landfills as uncontrolled.
Source: Dalberg analysis, Jambeck & al (2015), World Bank (2018), SITRA (2018), European Commission (2001)
CATEGORY MANAGEMENTPROCESS
CONTROLLEDWASTE
TREATMENT
MISMANAGEDWASTE
PLASTICWASTE
CONTROLLEDLANDFILL
INDUSTRIALINCINERATION
RECYCLING
UNCOLLECTEDWASTE
UNCONTROLLEDOR UNSPECIFIED
LANDFILL
OPEN DUMPING
DESCRIPTION Managed disposal of waste on land with little or no pre-treatment.
Site meets requirements for gas monitoring, site compacting and land covering
Combustion of plastic in a controlled and closed industrial process with exhaust gases adhering to environmental emission regulations
Plastic collected from the waste stream and reprocessed into a secondary material
Unrecovered plastic from the end-user via a waste collection system and does not enter a formal waste treatment process
Absence of control of the disposal operations of plastic and lack of management of the landfill site
Discarded plastic directly on land, freshwater or marine areas. Alternatively, littering or any form of unregulated plastic waste management such as open burning
1
2
ANNEX IV ‒ PLASTIC WASTE SYSTEM ACTIVITIES CAUSING CONTROLLED AND MISMANAGED WASTE
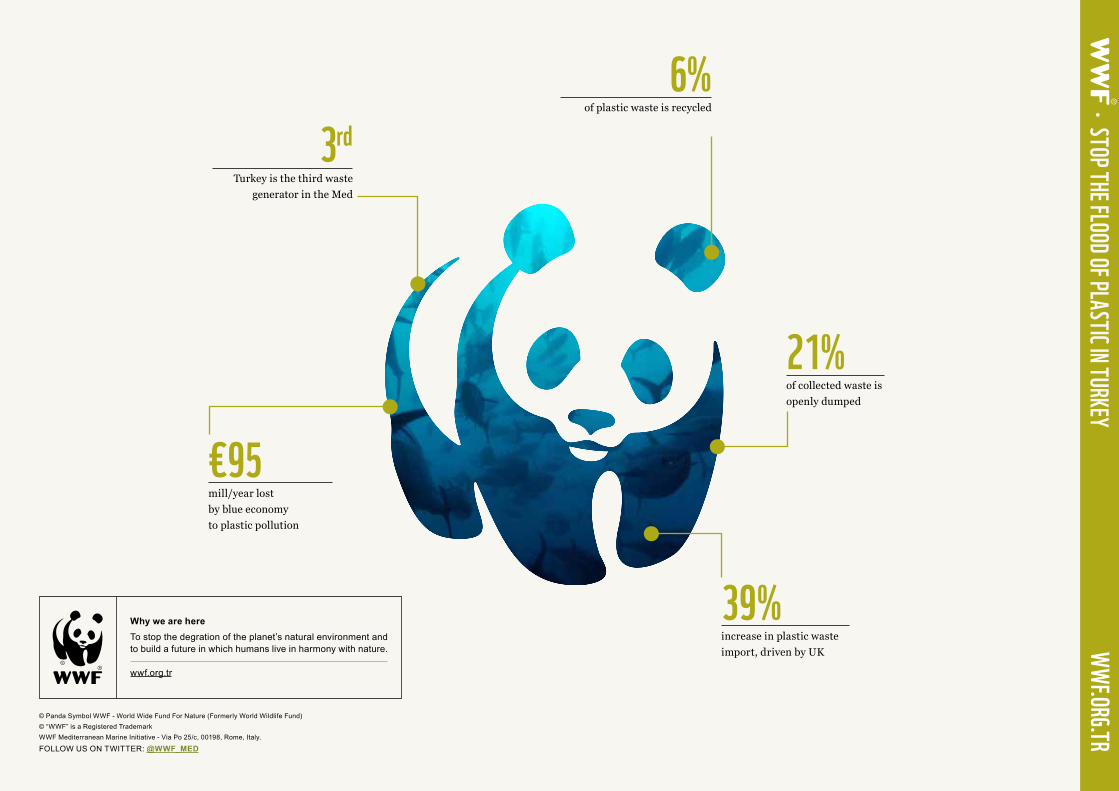
© Panda Symbol WWF - World Wide Fund For Nature (Formerly World Wildlife Fund) © “WWF” is a Registered TrademarkWWF Mediterranean Marine Initiative - Via Po 25/c, 00198, Rome, Italy.
FOLLOW US ON TWITTER: @WWF_MED
Why we are hereTo stop the degration of the planet’s natural environment and to build a future in which humans live in harmony with nature.
wwf.org.tr
• STOP THE FLOOD OF PLASTIC IN TURKEYWWF.ORG.TR
3rdTurkey is the third waste
generator in the Med
€95mill/year lost by blue economy to plastic pollution
39%increase in plastic waste import, driven by UK
21%of collected waste is openly dumped
6%of plastic waste is recycled