storage performance primer - netapp.com report storage performance primer ontap 9.2 michael peppers,...
TRANSCRIPT

Technical Report
Storage Performance Primer ONTAP 9.2
Michael Peppers, NetApp June 2017 | TR-4211
Abstract
This paper describes the basic performance concepts as they relate to NetApp® storage systems and the ONTAP® operating system. It also describes how operations are processed by the system, how different features in ONTAP can affect performance, and how to observe the performance of a cluster.
Information Classification
Public.

2 TR-4211: Storage Performance Primer © 2017 NetApp, Inc. All rights reserved. Public
Version History
Version Date Document Version History
Version 1.3 June 2017 ONTAP 9.2 revisions and updates by Michael Peppers
Version 1.2 July 2015 Clustered Data ONTAP® 8.3.1 revisions Bob Allegretti. Added Performance Manager 2.0. Minor revisions throughout.
Version 1.1 April 2015 Clustered Data ONTAP 8.3 revisions. Authors: Bob Allegretti and Roy Scaife.
Version 1.0 July 2013 Initial version for clustered Data ONTAP 8.2. Authors: Paul Updike, Roy Scaife, and Chris Wilson.

3 TR-4211: Storage Performance Primer © 2017 NetApp, Inc. All rights reserved. Public
TABLE OF CONTENTS
1 Overview ................................................................................................................. 5
2 Introduction to ONTAP Performance ................................................................... 5 2.1 Performance Fundamentals ........................................................................................ 5
3 Controlling Workloads: Introduction to Quality of Service (QoS) ................... 17 3.1 Consistent Performance ............................................................................................ 17 3.2 Storage QoS ............................................................................................................. 17 3.3 Monitor ...................................................................................................................... 22 3.4 OnCommand Unified Manager and OnCommand Performance Manager ................. 22 3.5 Observing and Monitoring Performance .................................................................... 28
4 Performance Headroom (Also Called Headroom or Performance Capacity) . 29 4.1 Monitoring Headroom................................................................................................ 29 4.2 Using Performance Headroom to Determine Workload Placement ........................... 30
5 Managing Workloads with Data Placement ....................................................... 31 5.1 DataMotion for Volumes ............................................................................................ 31 5.2 DataMotion for LUNs................................................................................................. 31
6 Performance Management with NetApp OnCommand Portfolio ..................... 31 6.1 OnCommand Unified Manager .................................................................................. 32
Appendix A QoS and Performance CLI Commands ................................................ 33 A.1 Controlling Workloads with QoS Creating a QoS Policy ............................................ 34 A.2 Monitoring Performance and Headroom Using the CLI ............................................. 35 A.3 Viewing Cluster-Level and Node-Level Periodic Statistics ......................................... 36 A.4 Field Descriptions ..................................................................................................... 40 A.5 Monitoring Headroom with the CLI ............................................................................ 41
Appendix B Determining Performance Capacity Using OnCommand Unified Manager 42
Additional Resources ................................................................................................. 49
Contact Us ................................................................................................................... 50
LIST OF TABLES
Table 1) QoS limits. ...................................................................................................................................................... 18
Table 2) SLA levels. ..................................................................................................................................................... 21
Table 3) Recommended performance-monitoring commands. ..................................................................................... 37
Table 4) QoS statistics workload show commands. ..................................................................................................... 39
Table 5) QoS statistics output field descriptions. .......................................................................................................... 40
Table 6) Host and switch configuration used in the OCUM planning example. ............................................................ 42
Table 7) NetApp storage array configuration used in the OCUM planning example. ................................................... 43

4 TR-4211: Storage Performance Primer © 2017 NetApp, Inc. All rights reserved. Public
LIST OF FIGURES
Figure 1) Response time exponential growth curve as utilization is saturated. ..............................................................6
Figure 2) High-level traditional HDD or hybrid cluster node system architecture. ...........................................................8
Figure 3) High-level flash/SSD node system architecture. .............................................................................................9
Figure 4) Performance improvements from software upgrades. ................................................................................... 10
Figure 5) Direct data access on local node. ................................................................................................................. 12
Figure 6) Indirect data access to remote node. ............................................................................................................ 13
Figure 7) Read from disk. ............................................................................................................................................. 14
Figure 8) Read from memory. ...................................................................................................................................... 14
Figure 9) Write (insert) to flash. .................................................................................................................................... 14
Figure 10) Read from flash. .......................................................................................................................................... 15
Figure 11) NVRAM segmenting: standalone and HA pair. ........................................................................................... 15
Figure 12) Accepting a write. ........................................................................................................................................ 16
Figure 13) Consistency point. ....................................................................................................................................... 16
Figure 14) Adding or modifying QoS in OnCommand System Manager. ..................................................................... 23
Figure 15) Assigning or modifying a QoS policy group. ................................................................................................ 24
Figure 16) Displaying all the current policy groups in a cluster. .................................................................................... 24
Figure 17) OnCommand Unified Manager volume latency statistics. ........................................................................... 25
Figure 18) QoS policy group performance statistics. .................................................................................................... 26
Figure 19) OnCommand System Manager volume performance statistics and QoS min/max. .................................... 26
Figure 20) QoS min/max. ............................................................................................................................................. 27
Figure 21) OnCommand Unified Manager Volume Performance Explorer. .................................................................. 27
Figure 22) OnCommand System Manager aggr utilization. .......................................................................................... 30
Figure 23) OnCommand Unified Manager 7.2 overview screen. .................................................................................. 30
Figure 24) OnCommand Unified Manager 7.2 overview screen. .................................................................................. 32
Figure 25) Performance Manager victim workload with annotations 1 and 2. .............................................................. 33
Figure 26) OnCommand Unified Manager cluster dashboard. ..................................................................................... 44
Figure 27) OnCommand Unified Manager node summary page. ................................................................................. 44
Figure 28) OnCommand Unified Manager single-node drill-down. ............................................................................... 45
Figure 29) OCUM performance summarization graphs showing both nodes in an HA pair. ........................................ 46
Figure 30) OnCommand Unified Manager Failover Planning tab. ................................................................................ 46
Figure 31) OnCommand Unified Manager failover planning graphs showing both nodes’ performance capacity and estimated takeover performance capacity. ................................................................................................................... 47
Figure 32) OnCommand Unified Manager failover planning graphs showing overprovisioned workloads with very high latencies in both steady state and increasing latency in takeover. ............................................................................... 48

5 TR-4211: Storage Performance Primer © 2017 NetApp, Inc. All rights reserved. Public
1 Overview
As demand for storage continues to increase and budgets decrease, IT departments need to get more
out of their storage infrastructures in both capacity and performance. This document covers the
performance principles and architecture of the ONTAP operating system and how it efficiently provides
data storage. Performance is known for its notoriously inherent complexity. NetApp provides simple and
capable tools for performance management.
2 Introduction to ONTAP Performance
This document contains a general overview of system architecture, the basic principles of operation, and
an introduction to performance management. Before reading this guide, you need a good understanding
of NetApp clustered Data ONTAP concepts. For an introduction to clustered Data ONTAP, see TR-3982:
NetApp Clustered Data ONTAP 8.3 and 8.2.x: An Introduction.
2.1 Performance Fundamentals
The fundamental unit of work performed by storage systems is a data operation (typically shortened to
simply “op”) that either reads or writes data to or from storage systems. There are other types of
operations, especially in NFS and CIFS/SMB environments, operations such as creation/deletion of files
and directories, lookups, and get and set attributes. Our discussion focuses primarily on read and write
ops. The complexities surrounding performance come from the many variables that affect performance. In
addition, there are many different types of derived measurements describing performance called metrics.
Among those metrics, two are considered most significant and believed to accurately characterize
performance at its highest level: throughput and latency. The first, throughput, describes the amount of
work the system is doing by expressing units of work over time: for example, megabytes per second
(MBps) or input/output operations per second (IOPS). The second, latency, describes the time it takes to
complete a unit of work: for example, a user read or write operation expressed in milliseconds per
operation (ms/op) units. On All Flash FAS arrays, latency is expressed in microseconds per operation,
due to flash’s very much higher performance. Note that the term latency in the context of this document is
functionally equivalent to round trip response time. This terminology, though technically questionable, is a
longstanding tradition in the storage industry and would be prohibitive to change. Tens of thousands or
hundreds of thousands of operations take place every second, so throughput and latency are typically
expressed as averages normalized over a given time range (for example, per second) and a unit of work
(for example, per operation).
The ONTAP operating system and the underlying cluster hardware work efficiently to make sure data is
secure, reliable, and always available. Collectively, the operations mix generated by applications is
uniquely referred to as an application set workload, often shortened to simply “workload." Workload
characteristics that can affect and be used to describe performance include:
• Throughput. The number of operations or amount of data payload over a given period.
• Concurrency. The number of operations in flight (or resident) at a given point in time.
• Operation size. The size of the operations requested. The data portion of the operation often referred to as block size or payload.
• Operation type. The type of operation requested of the storage system (for example, read, write).
• Randomness. The distribution of data access across a dataset in an unpredictable pattern.
• Sequentiality. The distribution of data access across a dataset in a repeatable pattern. Many patterns can be detected: forward, backward, skip counts, and others.
• Working set size. The amount of data considered to be active and frequently used to complete work.
• Dataset size. The amount of data that exists in a system that is both active and at rest.

6 TR-4211: Storage Performance Primer © 2017 NetApp, Inc. All rights reserved. Public
Varying any of these workload characteristics ultimately ends up affecting the performance of the system
and can be observed through measured changes in either latency or throughput. In many production
environments, application workload almost always increases over time, often without warning. Therefore,
the performance of the storage system must be known. With this knowledge, plans to allocate more
resources or rebalance workloads can be made to meet the demands placed upon the system.
Normal Performance Relationships
There are some guiding principles behind performance that can be useful in day-to-day operations. These
can be stated as relationships between the fundamental characteristics of a workload and their impact on
performance:
• Throughput is a function of latency.
• Latency is a function of throughput.
• Latency is a function of service times and wait times. Wait times make up most the time and are a function of utilization, which is a function of load.
• Throughput is a function of concurrency, operation size, and randomness of operations or access patterns.
• Host applications control the operation mix, operation size, randomness, and concurrency.
These relationships can be summarized by an exponential growth curve as depicted in Figure 1, where
response time (or latency) increases nonlinearly as utilization (or throughput) increases.
Figure 1) Response time exponential growth curve as utilization is saturated.
Throughput and Latency
Workloads can be defined as either closed-loop or open-loop systems. In closed-loop systems, a
feedback loop exists. Subsequent operation requests from applications are dependent upon the
completion of previous operations and, when bounded by the number of concurrent operation requests,
limit the offered load. In this scenario, the number of concurrent requests is fixed, and the rate that
operations are completed depends on how long it takes (latency) for previous operations to be completed.
Simply put, in closed-loop systems, throughput is a function of latency; if latency increases, throughput
decreases. Latency tends to be more fixed, and increasing concurrency increases throughput.
7 TR-4211: Storage Performance Primer © 2017 NetApp, Inc. All rights reserved. Public
In open-loop systems, operations are performed without relying on feedback from previous operations.
This configuration can be a single enterprise-class application generating multiple asynchronous requests
or hundreds of independently running servers issuing a single threaded request. This fact means that the
response time from those operations doesn’t affect when other operations are requested. The requests
occur when necessary from the application. As offered load to the system increases, the utilization of the
resources increases. As the resource utilization increases, so does operation latency. Because of this
utilization increase, we can say that latency is a function of throughput in open-loop systems, although
indirectly.
Concurrency
Storage systems are designed to handle many operations at the same time. In fact, peak efficiency of the
system can never be reached until it is processing a large enough number of operations such that there is
always one waiting to be processed behind another process. Concurrency, the number of outstanding
operations in flight at the same time, allows the storage system to handle the workload in the most
efficient manner. The effect can be dramatic in terms of throughput results.
Concurrency is the number of parallel operations that can be performed at the same time. It is another
way of describing parallelism. Most storage arrays are designed to process many operations in parallel
and are typically at their most efficient when processing multiple threads concurrently as opposed to a
single operation at a time. One way to understand concurrency is to consider how much more work can
be handled in each unit of time if multiple streams of work can be worked at the same time instead of
having a single stream with a rather long queue. Consider a line of 10 people waiting to pay for items at a
store. If a single cashier is open, then the cashier performs a total of 10 checkouts to clear the line and
performs those one after the other. If instead 5 cashiers are open, then the queue for each averages 2
transactions, and all 10 complete much more rapidly, even though each individual transaction takes the
same amount of time as in the single-cashier example.
Little’s Law: A Relationship of Throughput, Latency, and Concurrency
Little’s Law describes the observed relationship between throughput (arrival rate), latency (residence
time), and concurrency (residents):
L = A x W
This equation says that the concurrency of the system (L) is equal to the throughput (A) multiplied by the
latency (W). This implies that for higher throughput, either concurrency would have to increase and/or
latency would have to decrease. This explains why low-concurrency workloads (single-threaded
workloads), even with low latencies, can have lower than expected throughput. Thus, to increase
throughput with low latency requires more workloads to be added to the environment or more
concurrency added to the workload.
Operation Size
A similar effect on concurrency is observed with the size of operations on a system. More work, when
measured in megabytes per second (MBps), can be done with larger operations than can be done with
smaller operations. Each operation has fixed overhead associated with it. When the operation size (or
data payload) is increased, the ratio of overhead to data is decreased, which allows more throughput over
the same time. Similarly, when work depends on latency in low-concurrency workloads, a larger operation
size increases the data throughput efficiency of each individual operation.
Small operations might have a slightly better latency than large operations, so the operations per second
could be potentially higher, but the measured data throughput suffers with smaller operations.

8 TR-4211: Storage Performance Primer © 2017 NetApp, Inc. All rights reserved. Public
Data Access (Random or Sequential)
Data operations sent to a storage system access a logical location within a data file or LUN. This logical
location is ultimately translated into an actual physical location on the permanent storage media. The
order of operations and the access pattern of the data over time determine the randomness of a
workload. When the logical addresses are ordered (next to one another), access patterns are considered
sequential.
Sequentially read data exhibits better performance characteristics because fewer drive seeks and
operations are required from permanent storage media. Solid-state drives (SSDs) exhibit a much lower
impact from random access than spinning media. ONTAP is highly write-optimized. Due to the way writes
are written to storage, almost all writes behave as if they are sequential writes. Thus, we see less
improvement in random versus sequential writes. For more information, see section Basic Workload
Characterization.
Cluster-Node System Architecture Overview
Storage systems are designed to store and retrieve large amounts of data reliably, inexpensively, and
quickly. It is important to recognize that every workload interacts with the system differently, and there are
many different workloads. This fact creates a technical challenge around providing the best performance
for workload conditions that are largely unknown. NetApp meets this challenge through innovative
technologies combining the use of spinning disk, flash, and RAM.
A NetApp storage system may be logically divided into three main areas when discussing performance.
Those are connectivity, the system itself, and the storage subsystem. Connectivity refers to the network
interface card (NIC) and host bus adapter (HBA) that attach the storage system to the clients and hosts.
The system itself is the combination of CPU, memory, and NVRAM. Finally, the storage subsystem
consists of the disks and Flash Cache™ and Flash Pool™ intelligent caching. Figure 2 logically
represents a NetApp hard disk or hybrid system.
Figure 2) High-level traditional HDD or hybrid cluster node system architecture.
Compare the traditional HDD or hybrid system with a NetApp all-flash array (AFA) like the All Flash FAS,
which is depicted in Figure 3. Notice that no spinning media are present, and there is no need for Flash
Cache or Flash Pool because primary storage is very fast flash.

9 TR-4211: Storage Performance Primer © 2017 NetApp, Inc. All rights reserved. Public
Figure 3) High-level flash/SSD node system architecture.
A system running ONTAP consists of individual nodes joined together by the cluster interconnect. Every
node in the cluster can store data on disks attached to it, essentially adding “copies” of the preceding
architecture to the overall cluster. ONTAP has the capability to nondisruptively add additional nodes to
the system to scale both system performance and capacity. An ONTAP cluster can scale both vertically
and horizontally to meet the needs of the customer’s application environment.
Connectivity: NICs and HBAs
NICs and HBAs provide the connectivity to client, management, and cluster interconnect networks.
Adding more or increasing the speed of NICs or HBAs can scale client network bandwidth.
Controller Subsystem: Memory, CPU, and NVRAM
The number of CPU cores and the amount of memory vary based on controller model. As with any
computer, the CPU provides the processing power to complete operations for the system. In addition to
holding the ONTAP operating system, the memory in a NetApp controller also acts as a cache. Incoming
writes are staged in main memory prior to being written to disk. Memory is also used as a read cache to
provide extremely fast access time to recently read data.
NetApp systems also contain NVRAM. NVRAM is battery-backed memory used to protect inbound writes
as they arrive. This fact allows write operations to be safely acknowledged without having to wait for a
disk operation to complete, greatly reducing write latency. High-availability (HA) pairs are formed by
mirroring NVRAM across two controllers. By staging writes in memory and NVRAM and then committing
them to disk during a consistency point (CP), NetApp can both acknowledge writes very quickly and make
almost all writes appear to be sequential. This is because at a CP the storage controller optimizes all the
writes stored in memory and writes long stripes to disk.
Increasing the capacity and performance of these components requires either upgrading to a higher
performance controller model or upgrading the version of ONTAP software running on your controllers.
ONTAP software upgrades typically include performance boosts where continuous code optimizations
provide performance boosts that can be quite dramatic.

10 TR-4211: Storage Performance Primer © 2017 NetApp, Inc. All rights reserved. Public
For instance, Figure 4 shows that software upgrades from ONTAP 8.3 to 9 would have netted a
performance improvement of 41% on the OLTP benchmark workload tested on an AFF8080EX with a
latency threshold of less than 1ms and a 150% increase at 600us. If you want to run a software update on
existing controllers, the update occurs with no disruption to clients. If you want to replace a controller with
a better performing one, ONTAP allows nodes to be evacuated and upgraded with no disruption to
clients.
Figure 4) Performance improvements from software upgrades.
Storage Subsystem: Disks, Flash Cache, and Flash Pool
Spinning disk drives are the slowest persistent storage media available and have traditionally been the
bottleneck in storage performance. The typical response times for spinning disks range from 3ms to 5ms
for 10,000RPM and 7200RPM drives, respectively. Solid-state disks are generally an order of magnitude
faster and both significantly reduce the latency at the storage subsystem and change the nature of
performance tuning and sizing. Ultimately, the type of disk needed for a specific application depends on
capacity, performance requirements, and workload characteristics. For more information about disk
drives, see TR-3838: Storage Subsystem Configuration Guide.
Generally, when sizing or tuning a storage system design to optimize performance with spinning disks,
high-performance designs call for maximizing the number of drive spindles being used to spread I/O
across large numbers of disks. This allows the storage array being configured to parallelize I/O across
large numbers of disks. In addition to maximizing the number of disks in the array, the other principal
method of increasing performance is to add faster media, either RAM or SSDs, to act as an intermediate
cache holding hot data so that repeated access can be served from cache rather than requiring much
more latency-intensive disk operations.
NetApp introduced Flash Cache and Flash Pool technology to leverage the performance of solid-state
flash technology with the capacity of spinning media. Flash Cache typically operates as an additional
layer of read cache for the entire system. It caches recently read, or “hot,” data for future reads. Flash
Pool serves as a read cache in a fashion similar to that of Flash Cache at the aggregate level as opposed
to the system level. This fact allows improved cache provisioning for specific workloads. Flash Pool also
caches random overwrites, improving write latency as well.
For more information about Flash Cache, see TR-3832: Flash Cache Best Practices Guide. For more
information about Flash Pool, see TR-4070: Flash Pool Design and Implementation Guide.

11 TR-4211: Storage Performance Primer © 2017 NetApp, Inc. All rights reserved. Public
The wide availability and rapidly falling prices of SSDs have changed this paradigm. Now when
designing, sizing, or tuning high-performance arrays, you would choose an all-flash array such as All
Flash FAS. Performance requirements can now be satisfied by SSDs and therefore rarely rely on
additional RAM or caches to store hot data because the typical SSD is an order of magnitude more highly
performing than even the fastest 10k spinning disks. The other side effect of the huge speed increases
with SSDs is that it’s no longer required to spread high-performance workloads across a large number of
spindles to achieve very high performance required. We now frequently see 40 to 50 spindles collapsed
to a couple of SSDs that can support the IOPS requirements that might have taken 40 to 50 HDDs, even
when the space provided by all those drives wasn’t necessary. Of course, rapid increases in SSD
capacities are also leaving HDDs behind.
With the advent of all-flash arrays such as the NetApp All Flash FAS, all storage is flash, and therefore
main storage is an order of magnitude more highly performing. It doesn’t require similar caching
strategies and moves the performance bottleneck from the SSDs themselves to the controller and CPU.
Data Storage and Retrieval
The fundamental purpose of a storage system is to provide services to access data reliably (without
error), persistently (always available), securely, and quickly. A NetApp storage system does this through
presenting storage abstractions, such as volumes, LUNs, and file systems, that are physically hosted on
a pool of resources referred to as a cluster. Clusters are composed of individual nodes connected through
a back-end cluster interconnect network. Every node is an autonomous system managing its dedicated
resources running technologically advanced software that flawlessly orchestrates these services called
ONTAP.
Cluster Operations
In the ONTAP operating system, data does not need to reside on the node connected to the client. It can
reside anywhere within the cluster. This fact gives great flexibility in adding resources and rebalancing
load as business demands change, requiring no modifications to the application layer configuration. Thus,
data can be accessed directly when residing on local nodes or indirectly across the cluster network
through application requests, generally referred to as operations, often shortened to simply “ops."
Operations can take on many forms, such as the commonly known read and write operation, and lesser
known types, often categorized as “metadata operations” or “other ops."
ONTAP is composed of four major architectural components:
• Network. Transports the operation request and response to and from the application.
• Cluster interconnect (from a performance perspective, we are only interested in indirect access for this discussion). Transports the operation to the node that has responsibility to execute the operation. Indirect access indicates that the node receiving the request isn’t the node that hosts the volume, LUN, or file with which the host is communicating. Because the data is remote from the node receiving the requests, the node forwards those requests across the back-end cluster network to the node that hosts the volume, LUN, or file being requested.
• Data access and layout. Optimizes the execution of the operation requested in context with all other operations taking place (otherwise known as the WAFL® [Write Anywhere File Layout] system).
• Disk. Stores data to permanent media. The disks can be spinning media, flash, third-party LUNs, or a combination of some or all these media types.
Operations can traverse each of these components across a cluster. The average amount of time an
operation takes to traverse these components is the latency or response time metric.

12 TR-4211: Storage Performance Primer © 2017 NetApp, Inc. All rights reserved. Public
Direct Data Access
Direct data access occurs when a client connected to a logical interface (LIF) assigned to a node
accesses data stored on disks directly connected to that node. When data is accessed in this fashion,
there is no traversal of the cluster interconnect. Note in Figure 5 how data flows (purple highlighted line)
directly to the disk connected to local node bypassing the cluster interconnect (floating above).
Figure 5) Direct data access on local node.
Indirect Data Access
Indirect data access occurs when a client connected to a LIF assigned to a node accesses the data
stored physically on another node using the cluster interconnect (see Figure 6). Indirect data access
allows data to live physically on any node without the need to force clients to mount more than a single
location to access the data.

13 TR-4211: Storage Performance Primer © 2017 NetApp, Inc. All rights reserved. Public
Figure 6) Indirect data access to remote node.
Protocol Considerations
Accessing data directly on the node where it is stored is ultimately considered the “shortest path” to the
data. Some of the protocols supported by the ONTAP operating system can automatically discover the
optimal path to the data providing direct data access. Independent of protocols, the management features
of ONTAP can always be used to override the data access path.
In SAN environments, the Asymmetric Logical Unit Access (ALUA) protocol enables optimal pathing to a
LUN. Even if volumes are moved around in the cluster, the host always accesses the LUN through the
optimal path. To learn more about using SAN with ONTAP, read TR-4080: Best Practices for Scalable
SAN in Clustered Data ONTAP.
Node Operations
After an operation has been directed to the proper node, that node becomes responsible for completing
the read or write operation. The read and write paths in the ONTAP operating system are very different.
In this section, we examine how reads and writes are completed on a node and how the components
within the storage system are used.
Reads
Recall the storage system architecture presented in section 2.1.13, Cluster-Node System Architecture
Overview; read operations can be serviced from memory, flash-based cache, or disk (which may be either
spinning or flash-based drives). The workload characteristics and capabilities of the system determine
where reads are serviced and how quickly. Knowing where reads are serviced can help set expectations
as to the overall performance of the system. In the following diagrams, components and links in blue
highlight the activity described.
In the simple yet slowest case (Figure 7), read requests that are not cached anywhere must come from
disk. After being read from disk, the data is kept in main memory.

14 TR-4211: Storage Performance Primer © 2017 NetApp, Inc. All rights reserved. Public
Figure 7) Read from disk.
If this data is read again soon, it is possible for the data to still be cached in main memory, making
subsequent access extremely fast because no disk access would be required (Figure 8).
Figure 8) Read from memory.
When more room is needed in the main memory cache, as is common with working sets larger than the
memory cache, data is evicted. If Flash Cache or Flash Pool is in the system, that block could be inserted
into the flash-based cache. In general, only randomly read data and metadata are inserted into flash-
based caches (Figure 9).
Figure 9) Write (insert) to flash.
After data is inserted into Flash Cache, subsequent reads of this block unable to be serviced from the
memory cache would be served from the flash-based cache (Figure 10) until they are evicted from the
flash-based cache. Flash access times are significantly faster than those of disk, and adding cache in
random read–intensive workloads can reduce read latency dramatically. Of course, on all-flash arrays the
access times from the drives are greatly reduced. Flash arrays generally don’t use intermediate Flash
Cache because they don’t tend to accelerate access over the already very fast flash drives being used for
storage.
HBA
NIC
Memory
CPU
NVRAM
Drives
Flash
Cache /
Flash Pool
SSD
HBA
NIC
Memory
CPU
NVRAM
Drives
Flash
Cache /
Flash Pool
SSD
HBA
NIC
Memory
CPU
NVRAM
Drives
Flash
Cache /
Flash Pool
SSD

15 TR-4211: Storage Performance Primer © 2017 NetApp, Inc. All rights reserved. Public
Figure 10) Read from flash.
Incoming reads are continually being checked for access patterns. For some data access patterns, such
as sequential access, ONTAP predicts which blocks a client might want to access prior to the client ever
requesting. This “read-ahead” mechanism preemptively reads blocks off disk and caches them in main
memory. These read operations are serviced at faster RAM speeds instead of waiting for disk when the
read request is received. Even with vastly faster flash drives, data residing in a memory cache is still
faster than going to the disk for the same data.
Writes
Next, consider how data is written on the storage system. For most storage systems, writes must be
placed into a persistent and stable location prior to acknowledging to the client or host that the write was
successful. Waiting for the storage system to write an operation to disk for every write could introduce
significant latency. To solve this problem, NetApp storage systems use battery-backed RAM to create
nonvolatile RAM (NVRAM) to log incoming writes. NVRAM is divided in half, and only one half is used at
a time to log incoming writes. When controllers are in highly available pairs, half of the NVRAM is used to
mirror the remote partner node’s log, while the other half is used for logging local writes. The part that is
used for logging locally is still split in half, just like a single node (Figure 11).
Figure 11) NVRAM segmenting: standalone and HA pair.
When a write enters a NetApp system, the write is logged into NVRAM and is buffered in main memory.
After the data is logged in persistent NVRAM, the write is acknowledged to the client (Figure 12). NVRAM
is accessed only in the event of a failure.
HBA
NIC
Memory
CPU
NVRAM
Drives
Flash
Cache /
Flash Pool
SSD

16 TR-4211: Storage Performance Primer © 2017 NetApp, Inc. All rights reserved. Public
Figure 12) Accepting a write.
At a later point in time, called a consistency point (CP), the data buffered in main memory is efficiently
striped to disk (Figure 13). CPs can be triggered for several reasons, including time passage, NVRAM
utilization, or system-triggered events such as a Snapshot® copy. If you would like to learn more about
consistency points and the various types of CPs, review KB#000003714: What is a Consistency Point,
and why does NetApp use it?
Figure 13) Consistency point.
In general, writes take a minimal amount of time, on the order of low milliseconds to submilliseconds. If
the disk subsystem is unable to keep up with the client workload and becomes too busy, write latency can
begin to increase. When writes arrive too quickly for the provisioned back-end storage, both sides of the
NVRAM can fill up and lead to a scenario called a back-to-back CP. This fact means that both segments
of NVRAM log are full, a CP is currently occurring, and another CP immediately follows the current CP’s
completion. This scenario affects performance because the system can’t immediately acknowledge the
write because NVRAM is full, and the client must wait until the operation can be logged. Improving the
storage subsystem often alleviates the back-to-back CP scenario. Increasing the number of disks, moving
some of the workloads to other nodes, and considering flash-based caching or adding flash-based drives
can help solve write performance issues.
ONTAP 9 introduces per-aggregate consistency points (PACPs), which can also reduce the incidence of
back-to-back CPs because rather than having a single global CP that is ultimately only as fast as the
slowest (and/or busiest) disk subsystem, the new per-aggregate CPs occur on a per-aggregate basis and
therefore are performed on like disk types.
A single overloaded aggregate can slow all other aggregates on the node whenever the slow aggregate
needs to take a CP or takes a long time to complete a CP. Several potential reasons for this might
include:
• An overloaded aggregate can cause a slowdown, possibly because of incorrect sizing or data growth over time.
• The amount of I/O directed at a specific aggregate can affect the number of writes that need to be written to a given aggregate.

17 TR-4211: Storage Performance Primer © 2017 NetApp, Inc. All rights reserved. Public
• Aggregates created from slower types of disks typically take longer to complete a CP than aggregates composed of faster disks.
With per-aggregate CPs, each aggregate performs its own CPs and therefore doesn’t need to wait for the
CP to complete on other aggregates that might have slower classes of disks.
3 Controlling Workloads: Introduction to Quality of Service (QoS)
NetApp storage quality of service (QoS) gives the storage administrator the ability to monitor and control
storage workloads, delivering consistent performance that meets service objectives. QoS is a set of
concepts originally brought over from the data communications field, where it is frequently implemented to
shape traffic so that traffic can be prioritized by type, by policy, or using thresholds. In storage, QoS is a
relatively newer feature set that is used very similarly to shape, control, monitor, enforce service levels,
and prioritize traffic in increasingly shared storage environments. QoS tends to be used extensively by
service providers and large enterprises, and it is also gaining traction in smaller storage environments as
more and more workloads are merged into shared storage environments to gain greater efficiencies and
cost savings.
3.1 Consistent Performance
Storage QoS is an ONTAP feature designed to help address the need for consistent workload
performance. Storage resources are provisioned based on assumptions about workload IOPS or data
throughput. These assumptions can be based on estimates or on empirical data collected from existing
deployments. When these assumptions prove false, it is possible for some low-priority workloads to
negatively affect high-priority workload service levels. Storage QoS implements workload performance
metering to either throttle offered loads coming from less important workloads or prioritize loads coming
from high-priority workloads. This throttling limits low-priority workload resource consumption, assures
adequate resources are always available for important work, and/or protects high-priority workloads by
prioritizing a defined minimum throughput.
Workload isolation means workloads should be isolated from others in the cluster. Rogue workloads,
those that behave badly due to configuration errors or software defects, can consume a disproportionate
amount of shared resources, affecting all other workloads. The ability to monitor and then isolate rogue
workloads is valuable in environments where new applications are deployed with little to no control. Using
either the CLI or OnCommand® System Manager, storage QoS can be set up and applied immediately
when the need arises.
3.2 Storage QoS
The storage QoS capability in NetApp clustered Data ONTAP 8.2 or greater improves utilization of
storage resources by consolidating multiple workloads in a single shared storage infrastructure, while
minimizing the risk of workloads affecting each other’s performance. Administrators can prevent tenants
and applications from overconsuming provisioned resources in the storage infrastructure, improving the
end-user experience and application uptime. In addition, predefining service-level objectives allows IT to
provide different levels of service to different stakeholders and applications, making sure that the storage
infrastructure continues to meet business needs.
Storage QoS adds new capabilities for the storage administrator to monitor and control user workloads.
Following is a summary of the QoS functionality delivered starting in clustered Data ONTAP 8.2, with
continuing enhancements through ONTAP 9.2:
• Monitor and manage storage object workloads
• QoS mins adjusts priorities to meet the QoS mins set for given workloads.
• Control I/O and data throughput workloads on SVMs, volumes, LUNs, and files
• Provide multiprotocol support, including CIFS/SMB, NFS, iSCSI, FCoE, and FC

18 TR-4211: Storage Performance Primer © 2017 NetApp, Inc. All rights reserved. Public
• Provision policy groups in Workflow Automation (WFA) 2.1 and newer
• Provide QoS support for V-Series
However, there are a few limitations to keep in mind when considering QoS:
• QoS is not supported on Infinite Volumes. QoS max is supported with all protocols. QoS min is supported with SAN protocols.
Table 1) QoS limits.
QoS Feature Area Maximum
Per Node Per Cluster
QoS policy groups supported 12,000 12,000
Number of controllers supported by QoS N/A 24
Storage objects (workloads) assigned to a QoS policy group
12,000 12,000
Before showing examples and use cases for storage QoS, it is important to understand some basic QoS
concepts and terminology.
Workload
A workload is the set of I/O requests sent (or targeted) to one or more storage objects. In ONTAP, QoS
workloads include I/O operations and data throughput, measured in IOPS and MBps, respectively, that
are targeted to a storage object.
Storage Objects
A storage object is the target assigned to a QoS policy group for monitoring and control. QoS storage
objects can be any of the following:
• Storage virtual machines (SVMs)
• FlexVol® volumes
• LUNs
• Files
Policies
QoS policies are defined by a QoS policy group and applied to storage objects. A QoS policy limits
throughput or targets a minimum level of throughput to one or more storage objects in the QoS policy
group. The throughput max or min is applied collectively to the group across the entire cluster. QoS
policies may be configured to control IOPS or MBps throughput for QoS max or can target IOPS for QoS
min. The QoS policy limit may be configured to none to allow only instrumentation of performance metrics
to the storage objects in the QoS policy group without limiting throughput.
Note: Only one storage object (volume or LUN) can be assigned to a policy group that has a QoS min policy set.
QoS Max (Sometimes Called Ceilings or Limits)
The storage administrator can limit the workload throughput, specifying IOPS or MBps or IOPS and MBps
limits. When the workload throughput exceeds the QoS policy limit, the workload is throttled at the
protocol layer before entering the system. Actively throttling the workload increases I/O latency. It is

19 TR-4211: Storage Performance Primer © 2017 NetApp, Inc. All rights reserved. Public
possible to identify this additional latency as coming from the QoS policy limit in OnCommand Unified
Manager (OCUM) or using the CLI, as seen later in this document. When this timeout occurs, it appears
to applications that the system has run out of performance headroom. Throttling a workload in the
protocol stack limits consumption of cluster resource that have been provisioned for other workloads on
the cluster. This stops a workload on shared storage from negatively affecting other workloads sharing
the same shared storage.
When the QoS policy is configured to throttle IOPS or MBps, the specified policy value is a hard limit. I/O
operations queued because of hitting the QoS policy limit do not affect cluster resources. QoS policies
apply to all supported protocols, including NFS, CIFS/SMB, FCP, iSCSI, and FCoE. Starting in ONTAP
8.3, NFS 4.1 is supported.
Note: ONTAP allows for workloads to burst beyond the set QoS max limit. For data bursts, throughput may exceed the QoS policy limit by up to 50% depending on available IOPS credits automatically managed by ONTAP. This design feature allows bursty data traffic. For sustained data rates, the throughput might exceed the QoS policy limit by up to 10%. This result is expected as QoS calculates and throttles throughput. The lower the QoS policy limit is, the higher the deviation from the limit.
QoS Min
The storage administrator can set a QoS minimum to make sure that a given workload has a minimum
number of IOPS available to it. This makes sure that the workload has at least that many IOPS available
to it when the shared storage becomes busy regardless of what other workloads are doing. Minimums
work by allowing the targeted workload higher processing priorities. When two or more workloads are
contending for processing cycles and one of them has an unfulfilled QoS min, that workload receives
higher priorities. Essentially, the workload that has the unfilled QoS min receives scheduling that
prioritizes processing that workload over competing workloads. This continues until the minimum has
been met for the workload or the workload no longer pushes more IOPS to the controller. QoS mins are
essentially an antibullying device to allow workloads to coexist and allow processing cycles to be
prioritized based on QoS settings assigned to each workload. In the absence of offered load, a minimum
has no impact on competing workloads.
QoS mins are not effective if the aggregate of all the active workloads with minimums is higher than the
performance capacity of the controller hosting the workloads. Review section 2.6.3, Performance
Headroom, for more information about headroom and optimal points later for more information about
determining the total performance capacity or headroom of a given controller.
Note: QoS mins is currently supported in block environments: iSCSI, FCoE, and FCP on All Flash FAS platforms. If a workload has both a minimum and a limit, the minimum must be less than or equal to the limit.
Note: NAS workloads can exist on the same node or cluster that host SAN workloads that have QoS mins set.
Note: QoS min is applicable to one object (volume or LUN) per policy group. Nesting is not supported. For instance, a policy group can’t be assigned at the volume level with another assigned to a LUN within that volume.
Note: QoS mins can’t be used with files because QoS mins can’t be used with non-SAN workloads.
When to Use MBps
MBps can only be used for QoS max; they are not applicable to QoS mins. For large block I/O workloads,
NetApp recommends configuring the QoS policy using MBps.

20 TR-4211: Storage Performance Primer © 2017 NetApp, Inc. All rights reserved. Public
When to Use IOPS
For transactional workloads, NetApp recommends configuring the QoS policy using IOPS. For QoS mins,
IOPS are used to set the floor.
Policy Groups
QoS policy groups allow monitoring and controlling a set of storage objects (that is, SVMs, volumes,
LUNs, or files). A policy group can be empty (that is, there are no QoS mins or maximums assigned) or
can define a minimum, a maximum or both as a QoS policy. An empty QoS policy group would be used to
monitor storage objects. ONTAP 8.3 introduced autovolumes, which allow you to monitor volumes without
requiring an empty QoS policy group.
Note: Only one QoS policy may be applied to a QoS policy group. A QoS policy is defined as an empty policy group (used for monitoring) or a group containing a minimum, a maximum, or both a minimum and maximum. A QoS policy can be defined without setting either min or max thresholds if you want to monitor the object to which you are assigning it; we might call this type of policy a monitoring or possibly empty policy group.
Note: Storage objects assigned to QoS policy groups are SVM scoped. This scoping means that QoS policy groups can only be assigned to one or more FlexVol volumes, LUNs, and files within the same SVM. The I/O limits are applied collectively across one or more storage objects in a policy group using a fair-share methodology.
Note: The QoS policy throughput limit is applied to the combined throughput of all storage object workloads assigned to the policy group across the entire cluster.
Note: Nested QoS policy groups are not supported. This fact means when a QoS policy group is assigned to an SVM, the contained objects, volume, LUNs, and files cannot be assigned to policy groups.
Note: QoS (min) is applicable to one object per policy group.
QoS policy group membership remains unchanged as storage objects are moved within the cluster.
However, as previously discussed, storage objects cannot be nested. For example, if a VMDK file that is
part of a policy group is moved to a different datastore (volume) that is already part of a policy group, then
the VMDK file is no longer assigned to the policy group.
Examples of Using QoS
QoS has many applications for the storage administrator. The following are a few scenarios that illustrate
QoS capabilities. The first use case is an example in which the storage administrator throttles a “rogue”
workload that is affecting other workloads. The second scenario describes how a storage administrator
may prevent runaway (or rogue) workloads by proactively setting QoS policies. The final use case looks
at managing workloads so that service providers can meet their service-level agreements (SLAs).
Throttle Rogue Workloads
In this scenario, the storage administrator has not applied any storage objects to a QoS policy group. By
default, ONTAP treats all storage objects on a best-effort basis. However, one of the storage objects (that
is, a volume) has a rogue workload affecting the performance of other workloads in the system. Using
ONTAP qos statistics commands, OnCommand System Manager performance graphs, or
OnCommand Unified Manager/OnCommand Performance Manager summary data, the storage
administrator can identify the rogue workload. After the rogue workload is identified, the storage
administrator can use storage QoS to cap the workload by assigning it to a QoS policy group and
applying a throughput limit. This can be done either at the command line or in OnCommand System
Manager. The following are the high-level steps to throttle a rogue workload:
1. Identify the rogue workload you want to control.

21 TR-4211: Storage Performance Primer © 2017 NetApp, Inc. All rights reserved. Public
2. Create a QoS policy group with an appropriate QoS max that stops the rogue workload from interfering with other workloads on the shared storage.
3. Verify that the policy group was correctly configured and named.
4. Associate the volume, LUN, or file with the rogue control policy group.
5. Check OnCommand System Manager’s volume performance window (for volumes; for LUNs, use the LUN performance window) and select the minimum and maximum thresholds to show the workload and its relation to any QoS min or QoS max to verify the policy is shaping the rogue workload as desired. OnCommand System Manager has performance graphs for volumes and LUNs. Typically, virtualization administrators are most likely to be interested in setting file QoS, usually for VMDK or VHD files. Commonly they set these using the NetApp Manageability SDK (NetApp’s Zephyr application program interface).
Proactively Prevent Runaway Workloads
This scenario is one in which the storage administrator proactively sets a QoS policy group for the
storage objects to prevent the impact of new, and possibly runaway, workloads. This situation might arise
in a large virtualized environment in which the storage administrator needs to prevent a development or
test application from affecting other production applications. As with the previous example, the QoS
policies and settings can be configured through the OnCommand System Manager GUI or through the
command line, Here’s a high-level summary of the steps to be performed to apply limits and/or QoS min
before a problem occurs:
1. Create a QoS policy group and apply a throughput limit.
2. Assign the newly created policy group to the storage object you want to shape. Changes to the policy throughput limit can be completed quickly without affecting other workloads.
3. Monitor the new QoS policy group and whether it is shaping the workload as intended.
4. (Optional) You can edit the policy group if your shaping requirements change. This can be done using either OnCommand System Manager or the CLI.
Note: It is important to remember that the QoS limit is applied to the aggregate throughput of all storage objects in the QoS policy group.
Isolate Tenants with Per-SVM Throughput Limits
In our final use case, we look at a service provider who needs to isolate customer workloads to meet the
service-level agreements. A new SVM is created in the cluster for each customer, and the service
provider must enable workloads to be controlled based on the SLA level. This service provider has three
SLA levels—Bronze, Silver, and Gold—corresponding to the maximum data throughput allowed.
Note: SVM QoS settings must be applied, removed, or modified from the CLI.
Table 2) SLA levels.
SLA Level Data Throughput
Bronze 100MBps
Silver 200MBps
Gold 400MBps
After the service provider determines the SLA throughput limits, the storage administrator can create the
storage QoS policy group with the appropriate limit and assign the SVM storage object to the policy
group.
1. Create a policy group with the appropriate throughput limit (determined by service level) and assign the SVM for each customer to the policy group.

22 TR-4211: Storage Performance Primer © 2017 NetApp, Inc. All rights reserved. Public
2. Apply the SVM for each customer to the QoS policy group.
3. Verify that the changes defined in QoS to define SLAs are correctly configured and that customers are being correctly categorized.
The QoS statistics performance show command can be used to verify that QoS policies applied are in
effect.
aff::> qos statistics performance show
Policy Group IOPS Throughput Latency
-------------------- -------- --------------- ----------
-total- 1500 3.98KB/s 11.00us
_System-Work 1497 3.92KB/s 10.00us
QoS_Min 3 0.05KB/s 72.00us
_Performance_Monit.. 1 0.01KB/s 127.00us
-total- 1877 3.54KB/s 0ms
_System-Work 1873 3.47KB/s 0ms
QoS_Max 3 0.06KB/s 52.00us
_Performance_Monit.. 1 0.01KB/s 68.00us
Protect the Performance of a Critical Workload from Interference
ONTAP 9.2 introduces QoS mins, also known as throughput floors. A critical production workload can be
protected by assigning it a QoS min. For instance, an accounting workload could be protected from
interference from other workloads by assigning a QoS min of 15,000 IOPS. The effect of this would be
that the accounting workload would get prioritized deadline scheduling, so that would receive priority
processing up to the 15,000 IOPS threshold. Once past that threshold, it would revert to receiving the
same priorities as other nonprioritized workloads in the shared storage environment. If the accounting
workload only offered 5,000 IOPS, then the remainder of the QoS min assignment would have no impact
on other workloads in the environment.
3.3 Monitor
ONTAP 8.3 introduced the autovolumes enhancement that automatically monitors volume workloads
performance, making it unnecessary to create and bind policy groups to volumes simply to monitor their
performance. Naturally, you will still need to add a policy group with QoS min/max or both if yolu want to
add QoS to a volume. For additional information see the “autovolumes” section, later in this document. In
clustered Data ONTAP 8.2 and earlier or to monitor and control storage objects other than volumes in
ONTAP 8.3, storage objects must be assigned to policy groups as shown in this section.
Assigning storage objects to a QoS policy group without a QoS policy, or modifying an existing QoS
policy limit to none, provides the ability to monitor the workload targeted to the storage objects with no
throughput limit. In this configuration, the storage administrator can monitor workload latency, IOPS, and
data throughput. Storage QoS measures and provides a detailed breakdown of latency from the network
interface to and from the disk subsystem.
3.4 OnCommand Unified Manager and OnCommand Performance Manager
Note: OnCommand Performance Manager (OPM) and OnCommand Unified Manager (OCUM) are merged into a single install and management server with the release of OCUM 7.2. which can be installed as a guest VM or as either a Windows- or Linux-based application. With this you can manage your ONTAP systems more effectively and efficiently. The built-in scale monitor feature helps in horizontal and vertical scaling and tracks server utilization. It fundamentally reduces the complexity of deployments by allowing them to reduce the number of management servers they must deploy and maintain, particularly when considering the need for HA. This release also helps customers manage their ONTAP systems in a smarter fashion. To learn more, view the introductory video at https://www.youtube.com/watch?v=i5u9z1-saqQ.
Note: All the examples in this TR use either the OPM aspects of OCUM 7.2 or System Manager 9.2 (which is included on-box with ONTAP 9.2).

23 TR-4211: Storage Performance Primer © 2017 NetApp, Inc. All rights reserved. Public
The following set of figures illustrate how to:
• Create or modify an existing QoS policy (Figure 14)
• Assign or modify the policy assignment of a policy group to an object (Figure 15)
• Display all the current policy groups in a cluster (Figure 16)
• View the effects of the QoS policies by viewing QoS statistics (Figures 17 through 21)
The first three windows (Figures 14 through 16) include the QoS policy creation (or modification),
assignment (reassignment), and verifying that the appropriate policies are assigned to the appropriate
objects, collectively the control portion of the QoS procedures. The next five screens (Figures 17 through
21) are the management portion of QoS procedures, used to verify that the QoS policies created and
assigned are shaping workloads in the ways intended by the administrator and that those policies are still
optimal, given potential changes in shared workload mixes.
Figure 14) Adding or modifying QoS in OnCommand System Manager.

24 TR-4211: Storage Performance Primer © 2017 NetApp, Inc. All rights reserved. Public
Figure 15) Assigning or modifying a QoS policy group.
Assigning volumes to a QoS policy group:
Figure 16) Displaying all the current policy groups in a cluster.

25 TR-4211: Storage Performance Primer © 2017 NetApp, Inc. All rights reserved. Public
Figure 17) OnCommand Unified Manager volume latency statistics.

26 TR-4211: Storage Performance Primer © 2017 NetApp, Inc. All rights reserved. Public
Figure 18) QoS policy group performance statistics.
Figure 19) OnCommand System Manager volume performance statistics and QoS min/max.
Autovolumes
Starting in ONTAP 8.3, volume workloads are instantiated automatically. Thus, QoS volume workload
statistics can be viewed without configuring a QoS policy group. This functionality is called autovolumes.
For more information about using autovolumes for monitoring performance, see Monitoring Performance,
Configurations, and Headroom Using the CLI in appendix A.
For more information about the QoS policy group monitoring commands, see:
• ONTAP 9.x Commands: Manual Page Reference
• Performance Monitoring Express Guide

27 TR-4211: Storage Performance Primer © 2017 NetApp, Inc. All rights reserved. Public
Figure 20) QoS min/max.
Figure 21) OnCommand Unified Manager Volume Performance Explorer.
Performance Management with ONTAP
Assuring storage system performance is essential throughout its deployed lifecycle. Some applications
have more stringent performance requirements than others, but there is typically some level of
performance requirement. The ability to understand workloads, identify problems, and relate them back to
the system’s operation is essential to achieving performance goals.
This section introduces the capabilities of the ONTAP operating system and other NetApp software to
complete performance management functions, including looking at statistics and using features to alter
the performance of the system or workloads.
Basic Workload Characterization
As mentioned earlier, the workload characteristics and system architecture ultimately define the
performance of the system. Also, mentioned earlier were the storage QoS capabilities available in
ONTAP 8.3. You can use the statistics generated by the QoS CLI to monitor and gain a basic
understanding of workloads in the system. These insights can then be used to confirm initial sizing

28 TR-4211: Storage Performance Primer © 2017 NetApp, Inc. All rights reserved. Public
estimations, refine sizing forecasts, or simply set performance baselines and expectations. When
reviewing this data, keep in mind the relationships introduced in section 2.1.2, Normal Performance
Relationships.
These examples are basic. ONTAP offers far more statistics.
Overview of Application Workload Characteristics
Ultimately every production workload is unique due to the many variables that contribute to individual
behavior. However, to properly set expectations and for instructional purposes, some basic
generalizations about application workloads are presented here.
Write Work
As mentioned earlier, the ONTAP operating system is highly optimized to efficiently perform writes by
taking advantage of NVRAM, system memory, and consistency point logic to optimize the on-disk layout
of blocks written. This reduces the effects of writing to and later reading from slower disk storage media.
Thus, sequential and random writes are, for all practical purposes, instantly recorded in memory,
permanently logged in local and partner NVRAM, and the response immediately sent to the application.
Then, based on time thresholds or NVRAM usage thresholds, writes are flushed to slower persistent
media while ONTAP continues to service user operations. Exceptions can occur when unexpected
situations are encountered, such as CPU or disk utilization issues causing resource constraints,
excessive loads (along with concurrency) causing back-to-back CPs, or file system disk layout issues
resulting in unnecessary disk I/O. None of these exceptions should occur in a properly operating and
designed system.
Sequential Read Work
The ONTAP read-ahead engine detects common sequential workload read patterns to efficiently cache
data before it is requested from disk. This caching, in combination with the previously written layout
optimizations, contributes to greatly reducing delays associated with disks. Thus, workloads with highly
sequential read patterns, given adequate resources, should experience low service times by avoiding
costly disk accesses.
Random Read Work
Some workloads are inherently more difficult to handle than others. Repeated random access for data is
rarely a problem provided most of the working set fits in caches. Random read workloads should
experience a large percentage of cache hits and thus fewer disk reads, resulting in low response times.
However, caches are shared resources and can be oversubscribed when shared by too many
applications. In addition, random read workloads with large working sets and even larger datasets make it
very difficult or even impossible to predict what data will be needed. Thus, under some unusual
circumstances, this causes the storage system to frequently reach for data on a slow disk medium,
increasing response times.
Indirect I/O Work
When considering indirect workloads, it is tempting to conclude that the cluster interconnect is a potential
source of additional service delay (or latency). However, when observed under normal operating
conditions, the actual effects are minimal and contribute negligible delays in response time.
3.5 Observing and Monitoring Performance
Monitoring performance avoids potential problems and aids in determining whether to add more load to a
cluster. Latency is used as a key indicator to determine if there are performance issues. In other words, if
there is no latency issue, there is no performance issue. Corroborating secondary metrics for latency

29 TR-4211: Storage Performance Primer © 2017 NetApp, Inc. All rights reserved. Public
include throughput and resource utilizations, which means that if unacceptable latency is observed
alongside increased throughput, a workload might have grown and thus be saturating a resource in the
system (confirmed by observing resource utilization). Low throughput is not necessarily a problem,
because clients and applications might simply not be requesting that work be done.
The ONTAP operating system collects statistics that can be accessed by graphical tools as well as by the
cluster CLI and application programming interface (API). The following subsections introduce methods to
monitor performance metrics using NetApp tools and ONTAP features. In advanced or more complex
environments, these CLI commands and related APIs from the NetApp SDK can be used to create
custom monitoring tools.
4 Performance Headroom (Also Called Headroom or Performance
Capacity)
The ONTAP operating system provides metrics that measure the available performance headroom for
both the CPU and aggregate-based components of a cluster. This information provides valuable insight
into whether a resource is reaching its useful performance limit.
4.1 Monitoring Headroom
Headroom data, including performance capacity used and performance capacity remaining, can be
viewed in OnCommand Unit Manager, in OnCommand System Manager, and from the CLI. For quick
spot checks, the CLI can be used; however, OnCommand Unit Manager is the recommended tool for
monitoring and planning using headroom. This is because both the CLI and OnCommand System
Manager display current headroom data, whereas OnCommand Unit Manager provides historical
contexts and can therefore provide trending data.
The headroom metrics provide measurements based on utilization, ops, and latency. Historical averages
for the last hour, day, week, and month are provided. The following OCUM windows show the historical
headroom metrics for the CPU and aggregate resources. Figure 22 provides information about latency,
throughput, performance capacity used, and performance capacity remaining. Figure 23 displays SVM
FCP read, write, and total IOPS.

30 TR-4211: Storage Performance Primer © 2017 NetApp, Inc. All rights reserved. Public
Figure 22) OnCommand System Manager aggr utilization.
Figure 23) OnCommand Unified Manager 7.2 overview screen.
4.2 Using Performance Headroom to Determine Workload Placement
When considering the placement of new workloads (volumes, LUNs, or files), both physical storage
capacity and performance capacity need to be considered. The headroom metrics can help an
administrator to find the node/aggregate pair that have the most available headroom.
If there is no or little available headroom on the resources within a cluster, it might be time to expand the
cluster.

31 TR-4211: Storage Performance Primer © 2017 NetApp, Inc. All rights reserved. Public
Headroom is also useful in identifying unbalanced resources within a cluster. The historical averages
maintained by the headroom metrics are helpful in this case. It is best to look for imbalances between the
nodes within a given cluster and the aggregates. The logical migration capabilities within the ONTAP
operating system allow for nondisruptive movement of logical resources.
5 Managing Workloads with Data Placement
QoS is a very valuable tool to manage workloads within the cluster; however, the location and access
path of data in the cluster can also play a role in performance, as was mentioned earlier. ONTAP has
features that allow data to be moved, cached, and duplicated across nodes in the cluster to help manage
performance.
5.1 DataMotion for Volumes
Independent of protocol, volumes can be nondisruptively moved and nondisruptively copied in the storage
layer. Using volume move (vol move), volumes can be moved to the node handling the most client access
to increase direct access. Using the same method, volumes can be moved to different disk types or
nodes with different hardware to achieve different performance characteristics. Volume moves should be
used to proactively manage performance and not when encountering performance problems, because
volume move requires resources to perform the movement.
5.2 DataMotion for LUNs
Just like volumes, LUNs can be moved (lun move) nondisruptively to other controllers and volumes to
improve performance or rebalance load across the nodes in the cluster. Also like, like vol move, LUN
moves should be performed to proactively manage performance rather than in reaction to a performance
problem.
6 Performance Management with NetApp OnCommand Portfolio
When running a data center and operating storage systems, various questions come to mind:
• What is the performance status of my storage systems?
• What needs my attention now?
• How is my storage system performing in detail?
• Are there trends that might cause future issues?
• Am I meeting all critical service-level objectives and agreements?
• What is abnormal and why?
Storage performance management is a critical part of data center infrastructure management. The
technical challenges associated with this can be significant, often leading to additional and unwelcome
operational costs. Thus, employing automated tools to reduce or eliminate those costs is vital. NetApp
offers the purpose-built OnCommand Unified Manager (OCUM), which integrates OnCommand
Performance Manager (OPM) to provide performance monitoring and management. OCUM/OPM can be
installed as a virtual machine and can be installed and set up in very little time. Once installed, it
immediately starts reducing costs by continuously collecting, analyzing, and retaining performance data
from the entire storage environment and facilitating performance visualization.
OPM is more than a monitoring and plotting tool. It intimately understands the internal workings of
ONTAP and helps operating and answering fundamental performance questions about the entire storage
environment. This is accomplished through holistic illustrations depicting storage performance on the
dashboard and meticulous management of service levels from threshold policies that directly reflect the
priorities of the business.

32 TR-4211: Storage Performance Primer © 2017 NetApp, Inc. All rights reserved. Public
OnCommand Performance Manager is a valuable component of the NetApp OnCommand product
portfolio.
6.1 OnCommand Unified Manager
NetApp makes the OnCommand portfolio suite of management tools available to customers.
OnCommand Performance Manager, an integrated component of OnCommand Unified Manager and part
of the OnCommand portfolio, is designed for the ONTAP operating system. OnCommand Unified
Manager is designed to eliminate much of the complexity surrounding performance management and
automatically alerts when significant performance events occur. Figure 24 shows the OnCommand
Unified Manager Overview screen, which shows a combination of high-level statistics and alerts.
Figure 24) OnCommand Unified Manager 7.2 overview screen.
Best Practice
It is highly recommended that OnCommand Performance Manager monitor all ONTAP systems.
OnCommand Performance Manager is merged into OnCommand Unified Manager 7.2, and therefore OnCommand Unified Manager would be used to monitor ONTAP systems from that point forward.
Simplicity is achieved through minimizing performance configuration settings and automation of typically
complex tasks. Upon pointing OnCommand Unified Manager to one or more clusters, it automatically:
• Discovers storage objects of interest
• Establishes performance baselines and thresholds
• Retains 13 months of performance data: 30 days at five-minute granularity and 12 months at one-hour granularity
• Detects performance threshold breaches and alerts administrators through e-mail
• Identifies root causes of performance degradation by correlating sources of resource contention
• Suggests remediation tasks to resolve issue
• Exports retained data for external monitoring, reporting, and auditing
As a simple example, the screen shot in Figure 25 shows a previously encountered incident where the
volume under consideration was identified by Performance Manager as a victim.

33 TR-4211: Storage Performance Primer © 2017 NetApp, Inc. All rights reserved. Public
Figure 25) Performance Manager victim workload with annotations 1 and 2.
The sample screen shot in Figure 25 depicts a Performance Manager victim incident with:
• Increased workload latency (or response time). The latency graph plots the point in time (red dot) when the metrics exceeded the automatically established threshold (gray bands). The line color of the graph line also changes to red and remains for the duration of the incident.
• Lower workload throughput (or operations) correlates with incident detection.
More information about OnCommand Performance Manager integration with OnCommand Unified
Manager can be on the OnCommand Unified Manager site:
Appendix A QoS and Performance CLI Commands
This appendix illustrates a small subset of QoS and other performance-monitoring commands that
administrators can use from the command line.
To create and use QoS to shape traffic, use the following basic steps:
1. Create a policy group to impose a QoS min or maximum, both a minimum and a maximum, or an empty policy group (a policy group that doesn’t have any QoS workloads assigned). An empty policy group can be used to monitor the workload that is assigned to the policy.
2. Assign the workload (SVM, volume, LUN, or file) to the policy group. Note that a policy group with min throughput set supports SAN protocols and volume or LUN workloads only.
3. Verify that the policy group has the workload assigned to it.
Naturally, you need to monitor the workload to make sure that the QoS policy is having the desired effect
and whether it can be optimized further.
For more information about the QoS policy group monitoring commands, see ONTAP 9.x Commands:
Manual Page Reference.

34 TR-4211: Storage Performance Primer © 2017 NetApp, Inc. All rights reserved. Public
Performance Monitoring Express Guide
A.1 Controlling Workloads with QoS Creating a QoS Policy
A.1.1 Creating a Policy Group
Creating a QoS policy group to control workload IOPS:
aff::> qos policy-group create -policy-group Vol1_qosPG -min-throughput 5000iops -max-throughput
10000iops -vserver AFF_SAN_DEFAULT_SVM
Creating a QoS policy group to control workload data throughput:
aff::> qos policy-group create -policy-group file_pg -max-throughput 1000MBPS
-vserver AFF_SAN_DEFAULT_SVM
Creating a policy with both IOPS and MBps thresholds:
aff::> qos policy-group create –policy-group lun_pg2 -min-throughput 500iops -max-throughput
1000iops,30000kbps -vserver AFF_SAN_DEFAULT_SVM
Creating a QoS policy group to provide a QoS min workload data throughput:
aff::> qos policy-group create -policy-group vol2_qos_min_policy_group -min-throughput 1000iops -
vserver AFF_SAN_DEFAULT_SVM
A.1.2 Assigning a Workload to a Policy Group
Assigning volumes to a QoS policy group:
aff::> vol modify -vserver AFF_SAN_DEFAULT_SVM -volume vol1 -qos-policy-group Vol1_qosPG
(volume modify)
Volume modify successful on volume: vol1
Assigning LUNs to QoS policy groups:
aff::> lun modify -vserver AFF_SAN_DEFAULT_SVM -lun lun1 -vol vol2
-qos-policy-group lun_pg2
Assigning files to QoS policy groups:
aff::> volume file modify -vserver AFF_SAN_DEFAULT_SVM -vol vol2 –file VMDS3.vmdk
-qos-policy-group file_pg
Assigning an SVM to a QoS policy group:
aff::> vserver modify -vserver SVM2 -qos-policy-group vserver2_qos_policy_group
Note: Assigning a QoS policy group to an SVM (vserver) would be done to be able to monitor that SVM. You can also set limits on SVMs.
A.1.3 Verifying an Object’s Policy Group Assignment
Verifying the policy group assignment using the volume show command with the –qos-policy-
group argument:
aff::> volume show -vserver AFF_SAN_DEFAULT_SVM -volume vol1 -fields qos-policy-group
vserver volume qos-policy-group

35 TR-4211: Storage Performance Primer © 2017 NetApp, Inc. All rights reserved. Public
-------- ------ ---------------------
vserver1 vol1 vol1_rogue_qos_policy
Verifying the policy group assignment using the lun show command with the –qos-policy-group
argument:
aff::> lun show -vserver AFF_SAN_DEFAULT_SVM -path /vol/Work2_vol2/Work2 -fields qos-policy-group
vserver path qos-policy-group
------------------- --------------------- ----------------
AFF_SAN_DEFAULT_SVM /vol/Work2_vol2/Work2 QoS_Max
A.2 Monitoring Performance and Headroom Using the CLI
A.2.1 Viewing Policy Group Information
Use qos workload show to view workloads with policy group assignments.
aff::> qos workload show
Workload Wid Policy Group Vserver Volume LUN Qtree File Path
-------------- ----- ------------ -------- -------- ------ ------ -------------
Prod-wid28120 28120 QoS_Min AFF_SAN_SVM Prod - - -
Work2-wid11691 11691 QoS_Max AFF_SAN_SVM W2_vol2 Work2 - -
~~~~
19 entries were displayed.
To view the QoS policy group configuration, the storage administrator may use the qos policy-group
show command.
Displaying the QoS policy group configuration and the number of workloads assigned to the policy group:
aff::> qos policy-group show
Name Vserver Class Wklds Throughput
---------- ----------- ------------ ----- ------------
GEBS AFF_SAN_DEFAULT_SVM user-defined 0 0-1000IOPS
PG3 AFF_SAN_DEFAULT_SVM user-defined 1 5000IOPS-10000IOPS
QoS_Max AFF_SAN_DEFAULT_SVM user-defined 1 0-15000IOPS
QoS_Min AFF_SAN_DEFAULT_SVM user-defined 1 32000IOPS-120000IOPS
p2 AFF_SAN_DEFAULT_SVM user-defined 0 500IOPS-1000IOPS,29.30MB/s
Note: QoS policy groups that do not have a QoS min or QoS max are shown with 0-INF. This represents an infinite QoS policy limit with no QoS min set.
To get more detailed information about a specific policy group, use the policy-group argument to
specify the policy group of interest:
aff::> qos policy-group show -policy-group vol1_rogue_qos_policy
Policy Group Name: vol1_rogue_qos_policy
Vserver: AFF_SAN_DEFAULT_SVM
Uuid: 84dbeb5f-2c2d-11e7-ad93-00a0989edc4e
Policy Group Class: user-defined
Policy Group ID: 15167
Maximum Throughput: 1000IOPS
Minimum Throughput: 0
Number of Workloads: 0
Throughput Policy: 0-1000IOPS
A.2.2 Monitoring Workloads with QoS Show Commands
Viewing the QoS policy group latency statistics:
aff::> qos statistics latency show
Policy Group Latency Network Cluster Data Disk QoS NVRAM Cloud
----------- ---------- ---------- ---------- ---------- ---------- ---------- ---------- --------
-total- 85.00us 85.00us 0ms 0ms 0ms 0ms 0ms 0ms
QoS_Min 87.00us 87.00us 0ms 0ms 0ms 0ms 0ms 0ms

36 TR-4211: Storage Performance Primer © 2017 NetApp, Inc. All rights reserved. Public
QoS_Max 84.00us 84.00us 0ms 0ms 0ms 0ms 0ms 0ms
PG3 105.00us 105.00us 0ms 0ms 0ms 0ms 0ms 0ms
QoS_Max 86.00us 86.00us 0ms 0ms 0ms 0ms 0ms 0ms
Note: Check QoS Statistics Output Field Descriptions at the end of this section for a summary of each of the service centers.
Viewing the QoS policy group performance statistics:
aff::> qos statistics performance show
Policy Group IOPS Throughput Latency
-------------------- -------- --------------- ----------
-total- 3798 23.68KB/s 46.00us
_System-Work 3795 23.63KB/s 46.00us
QoS_Min 3 0.05KB/s 73.00us
QoS_Max 1 0.01KB/s 97.00us
PG3 1 0.02KB/s 56.00us
The qos statistics workload characteristics show command shows the workload characteristics of
the busiest workloads on the system:
aff::> qos statistics workload characteristics show
Workload ID IOPS Throughput Request size Read Concurrency
--------------- ------ -------- ---------------- --------------- ------- -----------
-total- - 5076 37.88MB/s 7825B 65% 2
volume_a 14368 4843 37.82MB/s 8189B 68% 2
Entire policy group characteristics can be viewed by omitting the “workload” argument:
aff::> qos statistics characteristics show
These examples are basic. ONTAP offers far more statistics.
A.3 Viewing Cluster-Level and Node-Level Periodic Statistics
The ONTAP operating system provides a large set of commands for monitoring performance. This section
describes how to use a small subset of these commands to gain insight into workload performance on an
ONTAP system. It is important to note that as a performance primer, the information presented here is for
monitoring and instructional purposes only. This should not be mistaken for troubleshooting workflows or
advanced diagnostics.
The recommended method for monitoring performance on an ONTAP system is to use volume workloads.
This can be done more easily on systems running ONTAP 8.3 and later because the autovolumes feature
(see the section on autovolumes for an introduction) introduced in 8.3 automatically monitors volumes
without the need to add an empty policy group.
At this point, it is worth noting a distinction between volume objects versus volume workloads. A volume
object is the target of a volume workload. A volume workload object contains performance metrics that
record the time (latency) and resource utilization (processing) of operations across the cluster. In ONTAP
systems, an operation enters the cluster on one node, can get transported across the cluster
interconnect, and can get serviced on a different node. The total time it takes to complete the operation is
otherwise known as operation residency time and is recorded in the volume workload as a latency metric.
The total amount of resource used to complete the operation is recorded as utilization metrics. The total
amount of work completed over a given time is recorded as throughput metrics. The metrics are
expressed in average units per second when depicting throughput and in average units of time per
operation when depicting latency. Volume objects are irrelevant in this monitoring scenario and are used
for alternative workflows beyond the scope of this document.
Thus, volume workloads are the primary mechanism for gaining visibility into the service times provided to
applications using a volume. The recommended commands to use for CLI performance monitoring are
summarized in Table 3.

37 TR-4211: Storage Performance Primer © 2017 NetApp, Inc. All rights reserved. Public
Table 3) Recommended performance-monitoring commands.
Command Description
qos statistics volume performance show View volume workload operations per second, data throughput, and clusterwide latency
qos statistics volume characteristics show View volume workload operation payload size and concurrency
qos statistics volume latency show View clusterwide latency contribution at the cluster component level
qos statistics volume resource cpu show View CPU resource consumption attributed to volume workload
qos statistics volume resource disk show View disk resource utilization attributed to volume workload
The following examples provide general guidance on interpreting command output for each of the
individual commands listed in Table 4.
To view throughput, latency, and number of IOPS, use the qos statistics volume performance show
command.
aff::> qos statistics volume performance show
Workload ID IOPS Throughput Latency
--------------- ------ -------- ---------------- ----------
-total- - 3 0.06KB/s 71.00us
Prod-wid28120 28120 3 0.05KB/s 65.00us
test1-wid14858 14858 1 0.01KB/s 96.00us
Work2_vol2-wi.. 8061 1 0.01KB/s 99.00us
-total- - 9 0.16KB/s 69.00us
Use the preceding command to view overall latency on volume workloads and get a sense of work performed on the cluster.
Note: Check QoS Statistics Output Field Descriptions at the end of this section for a summary of each of the service centers.
Use the qos statistics volume characteristics show command to get more insight into workload characterizations:
aff::> qos statistics volume characteristics show
Workload ID IOPS Throughput Request Size Read Concurrency
--------------- ------ -------- ---------------- ------------ ---- -----------
-total- - 2 0.04KB/s 18B 0% 0
test1-wid14858 14858 2 0.04KB/s 18B 0% 0
-total- - 4 0.07KB/s 18B 0% 0
test1-wid14858 14858 2 0.04KB/s 18B 0% 0
Prod-wid28120 28120 2 0.04KB/s 18B 0% 0
More can be learned about the offered load presented to the volume using the QoS volume
characteristics command shown earlier. The concurrency calculation shows the level of application
offered load in relation to cluster consumption of that load. Both these factors individually are highly
complex and do not provide enough information to draw any major conclusions. However, concurrency
does provide insight into application behavior such as the request arrival rate.
Note: Check QoS Statistics Output Field Descriptions at the end of this section for a summary of each of the service centers.

38 TR-4211: Storage Performance Primer © 2017 NetApp, Inc. All rights reserved. Public
In the following example, the output is too wide to fit in the document, so it is divided between two output
blocks.
Use the qos statistics volume latency show to get a more granular picture of where latency is in your
workloads:
aff::> qos statistics volume latency show
Workload ID Latency Network Cluster Data
--------------- ------ ---------- ---------- ---------- ----------
-total- - 74.00us 74.00us 0ms 0ms
Work2_vol2-wi.. 8061 119.00us 119.00us 0ms 0ms
Prod-wid28120 28120 69.00us 69.00us 0ms 0ms
test1-wid14858 14858 63.00us 63.00us 0ms 0ms
-total- - 77.00us 77.00us 0ms 0ms
...Continued
Disk QoS NVRAM Cloud
---------- ---------- ---------- ----------
0ms 0ms 0ms 0ms
0ms 0ms 0ms 0ms
0ms 0ms 0ms 0ms
0ms 0ms 0ms 0ms
0ms 0ms 0ms 0ms
The volume latency command breaks down the latency contribution of the individual ONTAP components
(see section Cluster Operations, earlier). Among the monitoring commands presented here, this one is
possibly the most useful in that it provides visibility into workload internals across the cluster. It is worth
repeating that latency is the equivalent of operation residency time and is the sum of operation wait time
and execution time for a given component. In the preceding example, workload bobvol5 is an indirect
workload averaging 2.17ms latency. The largest portion of that latency is attributed to the 1.83ms disk
contribution. The remaining component contributions, which account for very little of the total reported
latency, are CPU execution time, internal queuing delays, and network and cluster interconnect
transmission delay. This command does not show every detail. However, when considering a single
workload under normal operating conditions, execution time is almost always far less significant in
relation to wait time (in this example, disk wait time):
Note: Check QoS Statistics Output Field Descriptions at the end of this section for a summary of each of the service centers.
aff::> qos statistics volume resource cpu show -node aff-01
Workload ID CPU
--------------- ----- -----
-total- (100%) - 5%
test1-wid1485.. 13891 3%
Prod-wid28120 9864 1%
Some workloads are more expensive than others in terms of CPU utilization due to application-specific
behavior. Thus, it is useful to know how some workloads consume shared CPU resources in relation to
others. The preceding volume resource CPU command displays the specific CPU utilization for a given
volume workload. Note that this in no way represents the total physical node-level CPU utilization
discussed earlier. In addition, there are many internal ONTAP processes that can be running not
accounted for here. It should also be noted that indirect workloads are present here to account for the
transport protocol CPU overhead:
Note: Check QoS Statistics Output Field Descriptions at the end of this section for a summary of each of the service centers.
aff::> qos statistics volume resource disk show -node aff-01
Workload ID Disk Number of HDD Disks Disk Number of SSD Disks
--------------- ------ ------ ------------------- ------ -------------------
-total- - 0% 0 15% 62
bobvol5-wid9864 9864 0% 0 26% 7

39 TR-4211: Storage Performance Primer © 2017 NetApp, Inc. All rights reserved. Public
In a similar fashion to CPU, physical disks are a limited shared resource where some workloads consume
more than others. That is where the similarities end, though. In the preceding command context, disk
utilization represents the amount of time a disk is busy servicing requests on behalf of the volume
workload. This is indeed a major contributing factor to disk component latency, described in section
2.1.11, Cluster Operations. Disk utilization (and thus disk latency) can widely vary among workloads due
to many factors previously discussed such as data access patterns, working set size, disk free space, and
cache resources. Unlike the volume resource CPU command, the volume resource disk command only
includes workloads that are local to the node because it is fundamentally impossible for disk (or
aggregate) utilization to be split across multiple nodes.
Note: Check QoS Statistics Output Field Descriptions at the end of this section for a summary of each of the service centers.
Table 4) QoS statistics workload show commands.
Command Description
qos statistics workload resource cpu
show Percentage of CPU time each workload is using
qos statistics workload resource
disk show
Percentage of disk time each workload is using and number of disks present
qos statistics workload performance
show QoS statistics showing performance by workload
qos statistics workload latency show View of the latencies associated with each workload service center
To see what CPU resources a given workload is using, use the qos statistics workload resource cpu show command:
aff::> qos statistics workload resource cpu show -node Node-01
Workload ID CPU
--------------- ----- -----
-total- (100%) - 29%
volume_a 14368 12%
System-Default 1 10%
To see what CPU resources a given workload is using, use the qos statistics workload
resource disk show command:
aff::> qos statistics workload resource disk show -node Node-01
Workload ID Disk No. of Disks
--------------- ------ ----- ------------
-total- - 4% 29
volume_a 14368 5% 22
System-Default 1 1% 23
Use the qos statistics workload performance show to see workload throughput and latency
statistics:
aff::> qos statistics workload performance show
Workload ID IOPS Throughput Latency
--------------- ------ -------- ---------------- ----------
-total- - 5060 37.97MB/s 492.00us
volume_a 14368 4847 37.86MB/s 510.00us
More detailed latency information is also available by using the qos statistics workload latency show command:
aff::> qos statistics workload latency show
Workload ID Latency Network Cluster Data Disk QoS NVRAM Cloud

40 TR-4211: Storage Performance Primer © 2017 NetApp, Inc. All rights reserved. Public
----------- --- -------- ---------- ------- ------- -------- ------ ------ ------
-total- - 91.00us 91.00us 0ms 0ms 0ms 0ms 0ms 0ms
test1-wid14858 14858 114.00us 114.00us 0ms 0ms 0ms 0ms 0ms 0ms
Note: Check QoS Statistics Output Field Descriptions at the end of this section for a summary of each of the service centers.
A.4 Field Descriptions
The output describes the latency encountered at the various components in the system discussed in
previous sections. Using this output, it’s possible to observe from which resource center most of the
latency is coming for a specific workload:
Table 5) QoS statistics output field descriptions.
Field Summary
Workload Concatenation of volume name and internal workload identifier.
ID Internal workload identifier.
Latency Overall average operation residency time into and out of the cluster.
Network Average latency contribution of the server-facing (or client-facing) transport component, including the delay introduced by front-end SAN or NAS transport stacks and off-box systems such as FPolicy™ and antivirus.
Cluster Average latency contribution of the cluster interconnect transport component. This latency measurement is the delay introduced by the cluster interconnect transport protocols.
CPU Processor resource utilization attributed to the workload.
Data The amount of latency introduced by the system (primarily CPU time), except latency from the disk subsystem.
Disk The effective amount of latency introduced by the disk subsystem, including Flash Cache and Flash Pool. Note that any reads that were serviced by the WAFL cache do not have a disk latency component because those operations did not go to disk.
QoS Applicable only when QoS policy limits are in place. When actively limiting, this latency measurement is the average incurred to enforce the user-defined policy limit.
NVRAM Average latency incurred to replicate write operations in NVRAM to the high-availability (HA) and/or cluster partner.
Cloud The latency observed per I/O operation for Fabric Pool (cloud) operations.
IOPS Average number of operations processed every second.
Request size Calculation of throughput divided by IOPS. Given that all the metrics available are averages, this calculation is the best that can be done. For more detailed request size information, a histogram is required.
Read Percentage of workload that is read operations. The remaining percentage is write operations for SAN protocols and is the sum of writes and metaoperations (or other) for NAS protocols.
Concurrency Product of latency and IOPS; see "Little’s Law: A Relationship of Throughput, Latency, and Concurrency." This result is the number of operations resident in the cluster being serviced at a given point in time.

41 TR-4211: Storage Performance Primer © 2017 NetApp, Inc. All rights reserved. Public
Field Summary
Throughput Average amount of payload data moved into and out of the workload every second.
Latency Average operation residency time into and out of the workload.
-total- The average of average latencies on the cluster.
-total- (volume characteristics)
For throughput and concurrency metrics, the sum of averages of all workloads on the cluster. For remaining metrics, the average of averages on the cluster.
-total-. (volume performance
For throughput metrics, the sum of averages of all workloads on the cluster. For latency, the average of average latencies on the cluster.
A.5 Monitoring Headroom with the CLI
The following commands show the historical headroom metrics for the CPU and aggregate resources.
Note: The Statistics show commands are accessed from the advanced privilege level. Use caution with commands issued at this level; also, make sure to return to the admin level as soon as you have collected the data required. You can return to the admin privilege level by issuing the command “set admin.”
aff::> set adv
Warning: These advanced commands are potentially dangerous; use them only when
directed to do so by NetApp personnel.
Do you want to continue? {y|n}: y
Use the statistics show -object resource_headroom_cpu to see headroom metrics:
aff::*> statistics show -object resource_headroom_cpu -counter ewma_weekly -raw
Object: resource_headroom_cpu
Instance: CPU_node-1
Start-time: 2/26/2016 14:30:56
End-time: 2/26/2016 14:30:56
Scope: node-1
Counter Value
-------------------------------- --------------------------------
ewma_weekly -
ops 1855
optimal_point_ops 3028
latency 389
optimal_point_latency 783
utilization 42
optimal_point_utilization 78
optimal_point_confidence_factor 3
Object: resource_headroom_cpu
Instance: CPU_node-2
Start-time: 2/26/2016 14:30:56
End-time: 2/26/2016 14:30:56
Scope: node-2
Counter Value
-------------------------------- --------------------------------
ewma_weekly -
ops 1865
optimal_point_ops 2664
latency 566
optimal_point_latency 779
utilization 46
optimal_point_utilization 73
optimal_point_confidence_factor 2

42 TR-4211: Storage Performance Primer © 2017 NetApp, Inc. All rights reserved. Public
2 entries were displayed.
Show the storage aggregate headroom:
aff::*> statistics show -object resource_headroom_aggr -counter ewma_weekly -raw
Object: resource_headroom_aggr
Instance: DISK_HDD_aggr1_2acca201-3b24-4b9e-abcc-39e624461822
Start-time: 2/26/2016 14:33:46
End-time: 2/26/2016 14:33:46
Scope: node-1
Counter Value
-------------------------------- --------------------------------
ewma_weekly -
ops 303
optimal_point_ops 794
latency 16121
optimal_point_latency 19123
utilization 36
optimal_point_utilization 75
optimal_point_confidence_factor 3
Object: resource_headroom_aggr
Instance: DISK_HDD_aggr2_924ba14a-4118-4f99-9c65-13e54dfb7bb7
Start-time: 2/26/2016 14:33:46
End-time: 2/26/2016 14:33:46
Scope: node-2
Counter Value
-------------------------------- --------------------------------
ewma_weekly -
ops 385
optimal_point_ops 474
latency 16701
optimal_point_latency 23974
utilization 46
optimal_point_utilization 65
optimal_point_confidence_factor 3
2 entries were displayed.
Appendix B Determining Performance Capacity Using OnCommand
Unified Manager
Now that we have done a conceptual overview of performance capacity planning and how to use
headroom to methodologically plan workload placement, let’s proceed to an example of how to use
OnCommand Unified Manager (OCUM) and an I/O load generator to determine the performance capacity
of a NetApp controller pair. After looking at performance capacity to determine if a controller pair has
sufficient unused performance capacity to host a specific workload, we then look at OCUM’s Node
Failover planning page. For more details about OCUM and detailed documentation, review the
documents on the OnCommand Unified Manager page. In this example we used the host, switch, and
NetApp hardware detailed in Tables 6 and 7.
Table 6) Host and switch configuration used in the OCUM planning example.
Hardware and Software Components Details
Oracle database servers 2 x IBM X3850 X5 for Oracle RAC
1 IBM X3550 for SLOB
Server operating system RHEL 7.2
Oracle database version 12cR1 RAC
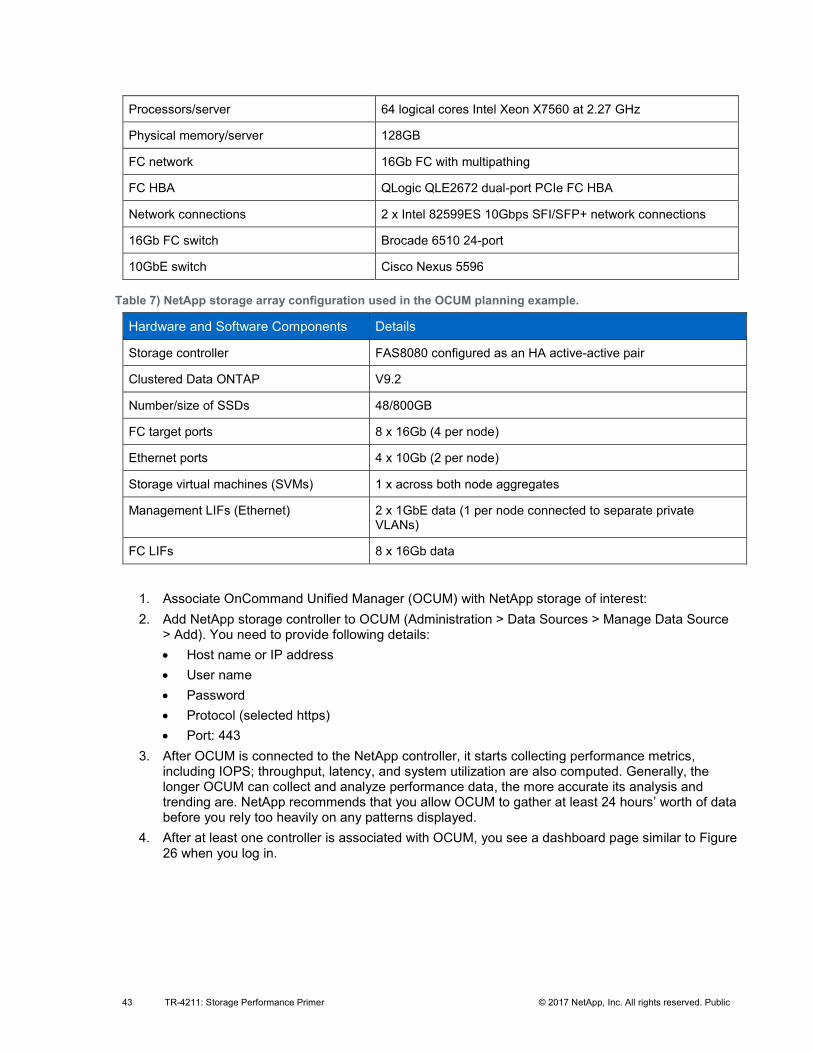
43 TR-4211: Storage Performance Primer © 2017 NetApp, Inc. All rights reserved. Public
Processors/server 64 logical cores Intel Xeon X7560 at 2.27 GHz
Physical memory/server 128GB
FC network 16Gb FC with multipathing
FC HBA QLogic QLE2672 dual-port PCIe FC HBA
Network connections 2 x Intel 82599ES 10Gbps SFI/SFP+ network connections
16Gb FC switch Brocade 6510 24-port
10GbE switch Cisco Nexus 5596
Table 7) NetApp storage array configuration used in the OCUM planning example.
Hardware and Software Components Details
Storage controller FAS8080 configured as an HA active-active pair
Clustered Data ONTAP V9.2
Number/size of SSDs 48/800GB
FC target ports 8 x 16Gb (4 per node)
Ethernet ports 4 x 10Gb (2 per node)
Storage virtual machines (SVMs) 1 x across both node aggregates
Management LIFs (Ethernet) 2 x 1GbE data (1 per node connected to separate private VLANs)
FC LIFs 8 x 16Gb data
1. Associate OnCommand Unified Manager (OCUM) with NetApp storage of interest:
2. Add NetApp storage controller to OCUM (Administration > Data Sources > Manage Data Source > Add). You need to provide following details:
• Host name or IP address
• User name
• Password
• Protocol (selected https)
• Port: 443
3. After OCUM is connected to the NetApp controller, it starts collecting performance metrics, including IOPS; throughput, latency, and system utilization are also computed. Generally, the longer OCUM can collect and analyze performance data, the more accurate its analysis and trending are. NetApp recommends that you allow OCUM to gather at least 24 hours’ worth of data before you rely too heavily on any patterns displayed.
4. After at least one controller is associated with OCUM, you see a dashboard page similar to Figure 26 when you log in.

44 TR-4211: Storage Performance Primer © 2017 NetApp, Inc. All rights reserved. Public
Figure 26) OnCommand Unified Manager cluster dashboard.
5. The dashboard view separates areas of interest into different views and then puts a summary icon with the familiar stoplight conception:
• Green = good
• Yellow = caution/warning
• Red = error/problem
Each of these icons can be drilled into for more information about the underlying objects with more performance and trending details available. In Figure 26, a caution is indicated by the yellow Nodes icon under Utilization.
6. If you click the Nodes icon in Figure 26, you see more granular detail about the nodes being
monitored. Figure 27 shows the two nodes in the cluster that are being monitored with summary
information about utilization, capacity, IOPS, throughput, and latency.
Figure 27) OnCommand Unified Manager node summary page.
7. At this point you could select an individual node to get more node-specific details about the node selected and click the checkbox corresponding to each node for which you want detailed information. In Figure 28 we have selected the first node, nst-fas8080-22.

45 TR-4211: Storage Performance Primer © 2017 NetApp, Inc. All rights reserved. Public
Figure 28) OnCommand Unified Manager single-node drill-down.
8. On the right side of the node detail window are time ranges by which you can filter any display, and you can select the charts displayed. In Figure 29 you can see that the utilization warning indicated by the yellow node summary icon on the dashboard appears to indicate that there were three latency warnings on the node being monitored in the last 72 hours. This is indicated both by the yellow warning “dots” on the events graph and by the latency spikes showing latency spiking Monday before noon and a couple of events bracketing 12 a.m. Monday. You can, of course, get much more granular times and specifics for these events by adjusting the time scale.
9. Among other calculations, OCUM uses the metrics mentioned in step 3 to calculate performance information, which it logs to preserve historical data, which can be used for reporting, analysis, and trending.
10. OCUM presents the log data collected in a series of easily consumable graphs. The most common and useful of these for our purposes display latency, IOPS, MBps, and performance capacity used. A sample of these is shown in Figure 30.
Handling workload from the host side:
1. In this example, we use SLOB2 (Silly Little Oracle Benchmark v2) to generate a synthetic Online Transaction Processing (OLTP) workload.
2. The IOPS generated by SLOB depends on the number of users selected. You can increase the number of IOPS by increasing the number of users selected.
3. The workload mix selected for this example is 80% read and 20% write.
4. To arrive at the ~50% performance capacity, we ratchet up the workload incrementally. We start the load point with 4 users and keep incrementing up 4 users at a time.
5. Using SLOB2, we watch the load for an hour to give SLOB2 adequate warm-up time before incrementing additional users. Of course, the amount of warm-up time necessary depends on the workload-generating tool.
6. Should the tool display higher warm-up time and higher degree of variation in the initial stages, a longer runtime is desirable.

46 TR-4211: Storage Performance Primer © 2017 NetApp, Inc. All rights reserved. Public
Figure 29) OCUM performance summarization graphs showing both nodes in an HA pair.
7. To start with the values are low. As the load is increased, the metrics vary accordingly.
8. At a certain point the performance capacity used reaches ~50%. This is the optimal point for the storage controller. Operating at the optimal point makes sure of consistent performance and faster takeovers/givebacks in the event of planned and unplanned takeovers.
9. Next, we want to select the Failover Planning tab in OCUM to model performance in failover. Figure 30 shows the Failover Planning tab you would select to be able to see performance on both controllers and modeling of how failover events would affect performance.
Figure 30) OnCommand Unified Manager Failover Planning tab.

47 TR-4211: Storage Performance Primer © 2017 NetApp, Inc. All rights reserved. Public
10. Figure 31 illustrates what the storage performance would look like in takeover where only one node is serving data instead of a pair. It does this by showing both nodes’ performance and then modeling estimated performance in takeover.
11. Figure 31 represents the performance utilization of the surviving node to be a little over 100% performance capacity at the optimal point.
Figure 31) OnCommand Unified Manager failover planning graphs showing both nodes’ performance capacity and estimated takeover performance capacity.
12. As the performance capacity increases in steady state (active-active mode), the performance capacity of the surviving node breaches the 100% usage mark and enters the red zone, where in order to generate the desired number of IOPS required for the combined load, the latency increases beyond acceptable limits. In Figure 31, you can see that performance in takeover is estimated to be ~103% of performance capacity. This is also visually represented by the breaches of the yellow (unsafe – caution) and the red (unsafe – performance capacity breaching 100%). In this scenario, you probably want to back your workloads down a little bit to reduce performance capacity used on each node to get estimated takeover performance down below 100%. Of course, it might be that the breaches are of a short enough duration and their concomitant latency spikes are within acceptable ranges for your organization.
13. Figure 32 looks at two workloads that are already beyond 100% performance capacity on each of the two nodes to show how that translates into an estimated takeover performance capacity used. As you can see, both controllers are already being pushed hard and are likely to have latencies that are high in steady state. In takeover those latencies get much higher.

48 TR-4211: Storage Performance Primer © 2017 NetApp, Inc. All rights reserved. Public
Figure 32) OnCommand Unified Manager failover planning graphs showing overprovisioned workloads with very high latencies in both steady state and increasing latency in takeover.

49 TR-4211: Storage Performance Primer © 2017 NetApp, Inc. All rights reserved. Public
Additional Resources
ONTAP and OnCommand Documentation:
• OnCommand Unified Manager Resources https://mysupport.netapp.com/info/web/ECMLP2688087.html
• OnCommand Unified Manager documentation http://mysupport.netapp.com/documentation/productlibrary/index.html?productID=61809
Technical Reports:
• Migrating Performance Data to NetApp OnCommand Unified Manager 7.2
http://www.netapp.com/us/media/tr-4589.pdf
• NetApp OnCommand Unified Manager Reporting for NetApp ONTAP http://www.netapp.com/us/media/tr-4565.pdf
• TR-4015: SnapMirror Configuration and Best Practices Guide for Clustered Data ONTAP http://www.netapp.com/us/media/tr-4015.pdf
• TR-4063: Parallel Network File System Configuration and Best Practices for Clustered Data ONTAP 8.2 and Later http://www.netapp.com/us/media/tr-4063.pdf
• TR-4067: Clustered Data ONTAP NFS Implementation Guide http://www.netapp.com/us/media/tr-4067.pdf
• TR-3982: NetApp Clustered Data ONTAP 8.3: An Introduction http://www.netapp.com/us/media/tr-3982.pdf
• TR-4080: Best Practices for Scalable SAN in Clustered Data ONTAP 8.3 http://www.netapp.com/us/media/tr-4080.pdf
• TR-4515: All-Flash Business Processing http://www.netapp.com/us/media/tr-4515.pdf
• TR-3832: Flash Cache Best Practices Guide http://www.netapp.com/us/media/tr-3832.pdf
• TR-4070: Flash Pool Design and Implementation Guide http://www.netapp.com/us/media/tr-4070.pdf
• TR-3838: Storage Subsystem Configuration Guide http://www.netapp.com/us/media/tr-3838.pdf
Videos:
• QoS in ONTAP 9.2: Quality of Service Demo: https://youtu.be/LHb078OZtZM
• Node Failover Planning Using Performance Manager https://www.youtube.com/watch?v=42o4BOiajg0
• Performance Capacity Management Using Performance Manager https://www.youtube.com/watch?v=l-kQLkGJI8I&t=48s
• Tech ONTAP Podcast Episode 83: OnCommand Unified Manager 7.2 https://newsroom.netapp.com/blogs/oncommand-unified-manager-7-2
• Tech ONTAP Podcast Episode 90: ONTAP Performance Enhancements
https://newsroom.netapp.com/blogs/tech-ontap-podcast-ontap-performance-enhancements/

50 TR-4211: Storage Performance Primer © 2017 NetApp, Inc. All rights reserved. Public
Contact Us
Let us know how we can improve this technical report.
Contact us at [email protected].
Include TECHNICAL REPORT 4122 in the subject line.

51 TR-4211: Storage Performance Primer © 2017 NetApp, Inc. All rights reserved. Public
Refer to the Interoperability Matrix Tool (IMT) on the NetApp Support site to validate that the exact product and feature versions described in this document are supported for your specific environment. The NetApp IMT defines the product components and versions that can be used to construct configurations that are supported by NetApp. Specific results depend on each customer’s installation in accordance with published specifications.
Copyright Information
Copyright © 2013–2017 NetApp, Inc. All rights reserved. Printed in the U.S. No part of this document covered by copyright may be reproduced in any form or by any means—graphic, electronic, or mechanical, including photocopying, recording, taping, or storage in an electronic retrieval system—without prior written permission of the copyright owner.
Software derived from copyrighted NetApp material is subject to the following license and disclaimer:
THIS SOFTWARE IS PROVIDED BY NETAPP “AS IS” AND WITHOUT ANY EXPRESS OR IMPLIED WARRANTIES, INCLUDING, BUT NOT LIMITED TO, THE IMPLIED WARRANTIES OF MERCHANTABILITY AND FITNESS FOR A PARTICULAR PURPOSE, WHICH ARE HEREBY DISCLAIMED. IN NO EVENT SHALL NETAPP BE LIABLE FOR ANY DIRECT, INDIRECT, INCIDENTAL, SPECIAL, EXEMPLARY, OR CONSEQUENTIAL DAMAGES (INCLUDING, BUT NOT LIMITED TO, PROCUREMENT OF SUBSTITUTE GOODS OR SERVICES; LOSS OF USE, DATA, OR PROFITS; OR BUSINESS INTERRUPTION) HOWEVER CAUSED AND ON ANY THEORY OF LIABILITY, WHETHER IN CONTRACT, STRICT LIABILITY, OR TORT (INCLUDING NEGLIGENCE OR OTHERWISE) ARISING IN ANY WAY OUT OF THE USE OF THIS SOFTWARE, EVEN IF ADVISED OF THE POSSIBILITY OF SUCH DAMAGE.
NetApp reserves the right to change any products described herein at any time, and without notice. NetApp assumes no responsibility or liability arising from the use of products described herein, except as expressly agreed to in writing by NetApp. The use or purchase of this product does not convey a license under any patent rights, trademark rights, or any other intellectual property rights of NetApp.
The product described in this manual may be protected by one or more U.S. patents, foreign patents, or pending applications.
RESTRICTED RIGHTS LEGEND: Use, duplication, or disclosure by the government is subject to restrictions as set forth in subparagraph (c)(1)(ii) of the Rights in Technical Data and Computer Software clause at DFARS 252.277-7103 (October 1988) and FAR 52-227-19 (June 1987).
Trademark Information
NETAPP, the NETAPP logo, and the marks listed at http://www.netapp.com/TM are trademarks of NetApp, Inc. Other company and product names may be trademarks of their respective owners.