stormtank hydraulic performance and sediment … report for stormtank hydraulic performance and...
TRANSCRIPT
Technical Report for StormTank Hydraulic Performance and Sediment Removal
Efficiency
11 November 2015
Page 1 of 21
Brentwood Industries, Inc.
610 Morgantown Road, Reading, PA 19611,
USA
brentwoodindustries.com
Phone: 610.374.5109
Fax: 610.376.6022
StormTank® Hydraulic Performance and Sediment Removal Efficiency
Karl Koch
Executive Summary Testing for the hydraulic performance and sediment removal efficiency of the Brentwood
Industries StormTank® Debris Row was conducted at the Brentwood Industries Research and
Development Facilities following ASTM Standard C1746/C1746M-12, Standard Test Method
for Measurement of Suspended Sediment Removal Efficiency of Hydrodynamic Stormwater
Separators and Underground Settling Devices. Trapping efficiencies for AGSCO Silica Sand
#110 was greater than 95% at all flow ranges tested. Hydraulic performance was limited only
by the design of the test rig, namely the flow into the 8” slotted effluent pipe, with flow ranges
tested up to nearly 27 GPM/ft2. The hydraulic data was used to determine detention times and
ultimately slurry feed and sampling rates.
The StormTank® Debris Row trapping efficiencies were determined using both a direct and
indirect method. The direct method physically weighed the sediment injected into the system,
the sediment trapped within the Debris Row, and the sediment trapped within the Effluent
Sump. Mass Balances for each test accounted for over 97% of all solids mixed into the feed
slurry. The indirect method followed Standard D3977-97, Standard Test Methods for
Determining Sediment Concentration in Water Samples. Five evenly spaced samples were
drawn from the both the Influent and Effluent flow streams, from which the average
concentrations were used to determine the StormTank® Debris Row trapping efficiencies.
Introduction The Brentwood StormTank system is a rugged yet lightweight subsurface stormwater storage
unit. The simple to assemble and install modules, designed to exceed the AASHTO HS-25 load
rating, are utilized under most surfaces for detention, infiltration, harvesting, and flood
mitigation of rain water. Integral to the system is a Debris Row; a series of StormTank modules
subsequential to the inlet pipe and isolated by a series of internally installed side panels with a
geotextile fabric liner on the bottom and extending 12” up the side panels. The dual purpose of
this Debris Row is: (1) the isolation of larger debris; (2) filtration of sediment.

Technical Report for StormTank Hydraulic Performance and Sediment Removal
Efficiency
11 November 2015
Page 2 of 21
Brentwood Industries, Inc.
610 Morgantown Road, Reading, PA 19611,
USA
brentwoodindustries.com
Phone: 610.374.5109
Fax: 610.376.6022
Purpose The purpose of this study is: (1) to quantify the hydraulic performance, in terms of stage and
detention time for testing purposes; (2) to quantify the sediment removal efficiency of a
StormTank® Debris Row system subjected to simulated stormwater runoff conditions.
Scope Construct a 12’ x 6’ x 4’ Test Basin capable of holding 12’ x 6’ x 1’ #2 Angular stone, a three
StormTank® module Debris Row, and a seven StormTank® module system surrounding the
Debris Row. Set up a system capable of controlled water flow ranges of 90 – 400 GPM (7.0 –
30.6 GPM/ft2), with a means of injecting a sediment slurry simulating stormwater runoff.
Construct a 10’ x 6’ x 2’ sump to capture the simulated stormwater runoff and filter the
effluent for recirculation. Have the means to directly weigh the sediment before and after
addition to the test apparatus to determine the removal efficiency. Have the means to indirectly
determine the influent and effluent sediment concentrations to determine the removal
efficiency.
Apparatus (Appendix A – System Overview) 4000 gallon Reservoir Tank
(4) - 4” Ball Valve
Grundfos E-Pump, Model# CRE90-1-1AN-G-A-E-HQQE
DCT-7088 Portable Digital Correlation Transit Time Ultrasonic Flowmeter
Masterflex B/T variable-speed wash-down modular pump, 12-321rpm, Model# K-77110-40
30 gallon Slurry Tank
Dayton Tank Mixer, Model# 2M168D
8” Ball Valve
12” Inlet Connection, Brentwood Industries
12’ x 6’ x 4’ Test Basin with 12’ x 6’ x 1’ of #2 Angular stone
10’ x 6’ x 2’ Sump
8” Slotted High – Density Polyethylene Pipe, 12’
50 micron filter sock
(2) ISCO 4700 Refrigerated Samplers
Considerations ASTM Standard C1746/C1746M-12 was followed with the following exceptions:

Technical Report for StormTank Hydraulic Performance and Sediment Removal
Efficiency
11 November 2015
Page 3 of 21
Brentwood Industries, Inc.
610 Morgantown Road, Reading, PA 19611,
USA
brentwoodindustries.com
Phone: 610.374.5109
Fax: 610.376.6022
6.1, 6.4 – The influent system consists of an 8” pipe 78” long, with a slurry injection port 60”
from the influent point, and a ball valve / mixing valve 40” from the influent point. This valve
remains 100% open.
8.1.1 – Specific gravity and particle-size distribution is not necessary as the sediment is a
specialty blend with included technical data sheets (Appendix B).
Conclusions Using the flow/volume relationship to determine the Detention (residence) Time it can be
concluded that the water load limiting factor is the test rig itself rather than any aspect of the
StormTank® system through the flow levels tested. (See Test Results and Discussion)
At all flow levels tested sediment removal efficiency is greater than 95% by direct
measurement and greater than 97% by indirect sampling. (See Test Results and Discussion)
Evaluation
Test Sample (10) – 18” StormTank Modules, ST-18
(14) – 18” Side Panels
Geotextile Fabric (Appendix C)
AGSCO Silica Sand #110, Item# SSS000110—B5MBNK (Appendix B)
Test Method
Set-up and Test Run
1. Fill out the initial section of the StormTank Water Quality Test Data Sheet (Appendix
D).
2. Record the tare weights of the Influent and Effluent sample containers in the
StormTank Water Quality Test Data Sheet and place the crucibles and filter papers in
the oven to dry. (See Sample Analysis Procedure, steps 40 – 43)
3. Ensure that the Reservoir Tank has ≥2000 gallons of water.
4. Cut approximately ½” behind the ring of a 50micron filter sock to remove the ring.
5. Weigh the filter sock and one Vacuum Filter as a unit and record in the StormTank
Water Quality Test Data Sheet.
6. Cut and weigh the following three pieces of Geotextile 601 Fabric and record in the
StormTank Water Quality Test Data Sheet:
a. 2 pieces Geotextile @ 150” x 24”
b. 1 piece Geotextile @ 150” x 80”
Technical Report for StormTank Hydraulic Performance and Sediment Removal
Efficiency
11 November 2015
Page 4 of 21
Brentwood Industries, Inc.
610 Morgantown Road, Reading, PA 19611,
USA
brentwoodindustries.com
Phone: 610.374.5109
Fax: 610.376.6022
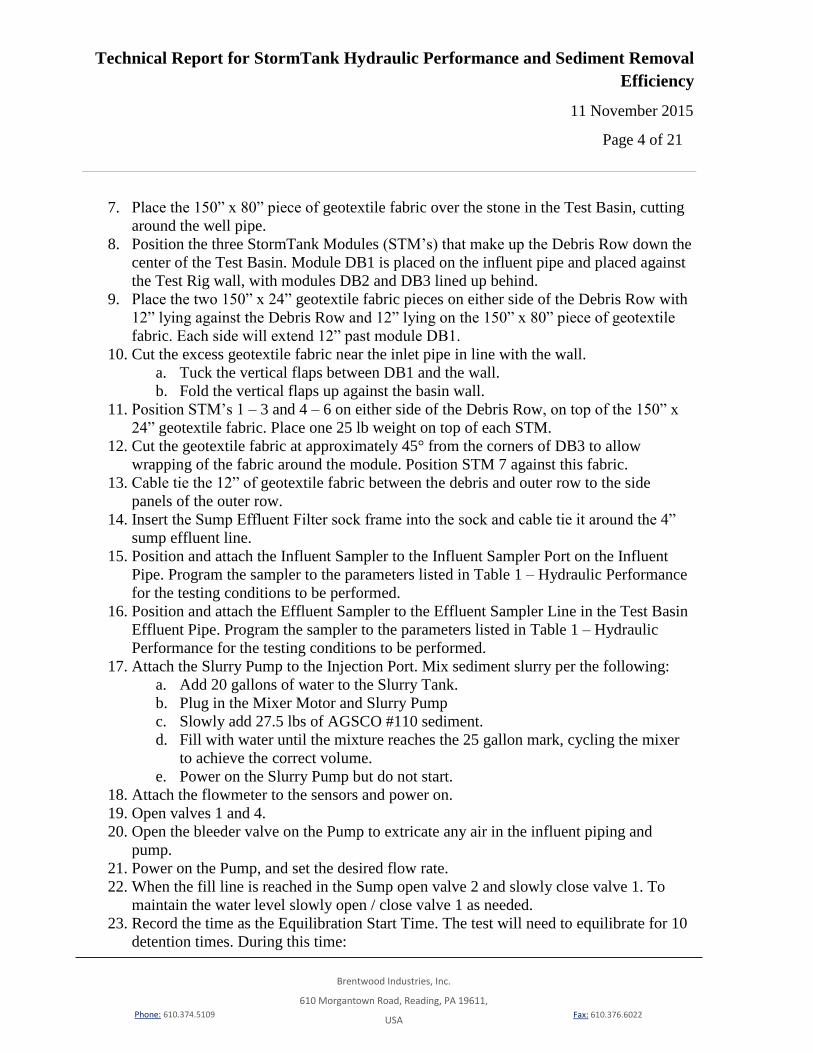
7. Place the 150” x 80” piece of geotextile fabric over the stone in the Test Basin, cutting
around the well pipe.
8. Position the three StormTank Modules (STM’s) that make up the Debris Row down the
center of the Test Basin. Module DB1 is placed on the influent pipe and placed against
the Test Rig wall, with modules DB2 and DB3 lined up behind.
9. Place the two 150” x 24” geotextile fabric pieces on either side of the Debris Row with
12” lying against the Debris Row and 12” lying on the 150” x 80” piece of geotextile
fabric. Each side will extend 12” past module DB1.
10. Cut the excess geotextile fabric near the inlet pipe in line with the wall.
a. Tuck the vertical flaps between DB1 and the wall.
b. Fold the vertical flaps up against the basin wall.
11. Position STM’s 1 – 3 and 4 – 6 on either side of the Debris Row, on top of the 150” x
24” geotextile fabric. Place one 25 lb weight on top of each STM.
12. Cut the geotextile fabric at approximately 45° from the corners of DB3 to allow
wrapping of the fabric around the module. Position STM 7 against this fabric.
13. Cable tie the 12” of geotextile fabric between the debris and outer row to the side
panels of the outer row.
14. Insert the Sump Effluent Filter sock frame into the sock and cable tie it around the 4”
sump effluent line.
15. Position and attach the Influent Sampler to the Influent Sampler Port on the Influent
Pipe. Program the sampler to the parameters listed in Table 1 – Hydraulic Performance
for the testing conditions to be performed.
16. Position and attach the Effluent Sampler to the Effluent Sampler Line in the Test Basin
Effluent Pipe. Program the sampler to the parameters listed in Table 1 – Hydraulic
Performance for the testing conditions to be performed.
17. Attach the Slurry Pump to the Injection Port. Mix sediment slurry per the following:
a. Add 20 gallons of water to the Slurry Tank.
b. Plug in the Mixer Motor and Slurry Pump
c. Slowly add 27.5 lbs of AGSCO #110 sediment.
d. Fill with water until the mixture reaches the 25 gallon mark, cycling the mixer
to achieve the correct volume.
e. Power on the Slurry Pump but do not start.
18. Attach the flowmeter to the sensors and power on.
19. Open valves 1 and 4.
20. Open the bleeder valve on the Pump to extricate any air in the influent piping and
pump.
21. Power on the Pump, and set the desired flow rate.
22. When the fill line is reached in the Sump open valve 2 and slowly close valve 1. To
maintain the water level slowly open / close valve 1 as needed.
23. Record the time as the Equilibration Start Time. The test will need to equilibrate for 10
detention times. During this time:

Technical Report for StormTank Hydraulic Performance and Sediment Removal
Efficiency
11 November 2015
Page 5 of 21
Brentwood Industries, Inc.
610 Morgantown Road, Reading, PA 19611,
USA
brentwoodindustries.com
Phone: 610.374.5109
Fax: 610.376.6022
a. Take the Sump water temperature
b. Program the Slurry Pump per Table 1
c. Remove crucibles and filters from drying oven and place in desiccator.
d. Record the actual flow rate on the StormTank Water Quality Test Data Sheet.
24. After 10 Detention Times record the time as the Equilibration End Time.
25. Start the Influent Sampler and record the time.
26. After 11 Detention Times start the Effluent Sampler and record the time.
27. Start the Slurry Pump.
28. Start the test timer.
29. Record the Sump water temperature and the time taken.
30. Halt the Influent and Effluent Sampler programs until the sampling interval has been
met on the test timer.
a. When the sampling interval has been met restart the Influent Sampler on bottle
2.
b. After one detention time restart the Effluent Sampler on bottle 2.
31. Measure the maximum stage at the well and record in the StormTank Water Quality
Test Data Sheet.
32. At this time the water in the reservoir Tank can begin to be replaced by a garden hose.
33. A few minutes before the end of the test, measure the water level in the StormTank
chamber and record in the StormTank Water Quality Test Data Sheet.
34. When the Test Length has been met and the Influent Sampler has recovered the seventh
sample, shut down the Influent Sampler and the Slurry Pump. Record the time.
35. When one more detention time has elapsed and the final Effluent grab sample has been
recovered, shut down the Effluent Sampler. Record the time.
36. Record the Sump water temperature and the time taken.
37. Reduce the pump to the minimum flow rate and shut down the pump.
38. Close all the valves.
39. Check the water level in the Reservoir Tank and shut down the water if ≥2000 gallons.
Shutdown and Cleanout Procedure
40. Cut the cable ties holding the geotextile fabric to the STM side panels and carefully
rinse each STM onto the Geotextile as it is removed from the Test Basin.
a. Carefully fold the Geotextile lengthwise and remove from the Test Basin.
b. Allow the geotextile to dry thoroughly before weighing and recording in the
StormTank Water Quality Test Data Sheet.
41. Remove the slurry pump Influent Line and wash out the contents into the Slurry Tank.
42. Empty the contents of the Slurry Tank onto a tarp and allow to dry.
43. Carefully remove the filter sock from the Test Basin Sump effluent pipe and allow to
dry thoroughly.

Technical Report for StormTank Hydraulic Performance and Sediment Removal
Efficiency
11 November 2015
Page 6 of 21
Brentwood Industries, Inc.
610 Morgantown Road, Reading, PA 19611,
USA
brentwoodindustries.com
Phone: 610.374.5109
Fax: 610.376.6022
44. Using a sump pump placed in the Sump, begin a flow through the garden hose and then
disconnect the garden hose from the sump pump, ensuring that it remains submerged at
all times, and set on the floor of the Sump. Allow it to siphon to the sanitary sewer.
45. Disconnect the Flow Meter.
46. Disconnect the Influent Sampler from the influent pipe.
47. Disconnect the Effluent Sampler from the effluent pipe.
48. When the Sump has been drained, vacuum the remaining water and sediment with a
vacuum containing the clean tared filter, disposing of the water in the sanitary sewer.
49. Place the Vacuum Filter with the Filter Sock and allow to dry thoroughly.
a. Weight the Vacuum Filter and Filter Sock as a unit and record in the StormTank
Water Quality Test Data Sheet.
Sample Analysis Procedure
50. Weigh and record tare weights for the 7 Influent and 7 Effluent Sample bottles making
sure to include the lids. Weights are to be recorded on the data sheet in the Bottle Chart
under the column Tare (g).
51. Wash the glass-fiber filter disc with water to remove soluble compounds. Record pore
size and diameter on the data sheet.
52. Place the filter inside a crucible.
53. Dry the filter and its crucible in the drying oven for 1H at 105°C.
54. Weigh each of the 7 Influent and 7 Effluent Sample bottles with their samples inside
and record on the data sheet in the Bottle chart under the column Gross (g).
55. Transfer the crucible and filter paper to the desiccator, then, after the parts have cooled
to room temperature, weigh them to the nearest 0.0001 g and record the reading on the
data sheet.
56. Place the crucible inside a crucible holder.
57. Place the crucible holder into the vacuum flask that is attached to the vacuum pump.
58. While a vacuum is being applied to the bottom of the crucible, filter sample into the
crucible. Flush the inner surfaces of the sample bottle with water several times to
complete the transfer.
59. As filtering proceeds, inspect the filtrate. If it is turbid, pour the filtrate back through
the filter a second and possibly a third time. If the filtrate is still turbid, the filter may
be leaking. In this case, substitute a new filter and repeat from step 51. If the filtrate is
transparent but discolored, a natural dye is present; re-filtration is not necessary.
60. When filtration is complete, place the crucible and its contents in the drying oven for
1H at 105°C.
61. Remove crucible and filter from oven and place in desiccator. After the crucible has
cooled, weigh to the nearest 0.0001 g and record on the data sheet.
62. Place crucible and filter back in oven for 1H at 105°C.
63. Remove crucible and filter from oven and place in desiccator. After the crucible has
Technical Report for StormTank Hydraulic Performance and Sediment Removal
Efficiency
11 November 2015
Page 7 of 21
Brentwood Industries, Inc.
610 Morgantown Road, Reading, PA 19611,
USA
brentwoodindustries.com
Phone: 610.374.5109
Fax: 610.376.6022
cooled, weigh to the nearest 0.0001 g and record on the data sheet.
64. If values from steps 61 and 63 are less than 4% or 0.5 mg (whichever is smaller)
different, then drying complete.
65. If values from steps 61 and 63 are more than 4% or 0.5 mg different, then repeat steps
52 – 53.
66. Enter all values in the Excel Spreadsheet “StormTank Water Quality Test Data Sheet”.
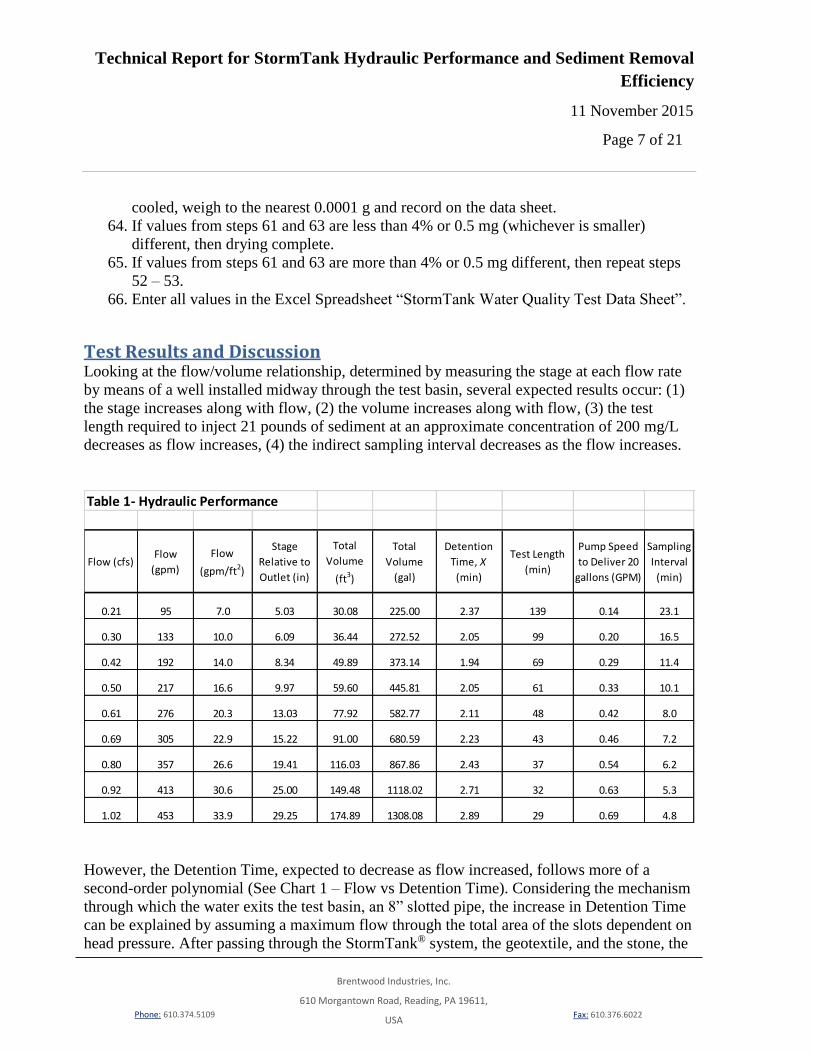
Test Results and Discussion Looking at the flow/volume relationship, determined by measuring the stage at each flow rate
by means of a well installed midway through the test basin, several expected results occur: (1)
the stage increases along with flow, (2) the volume increases along with flow, (3) the test
length required to inject 21 pounds of sediment at an approximate concentration of 200 mg/L
decreases as flow increases, (4) the indirect sampling interval decreases as the flow increases.
However, the Detention Time, expected to decrease as flow increased, follows more of a
second-order polynomial (See Chart 1 – Flow vs Detention Time). Considering the mechanism
through which the water exits the test basin, an 8” slotted pipe, the increase in Detention Time
can be explained by assuming a maximum flow through the total area of the slots dependent on
head pressure. After passing through the StormTank® system, the geotextile, and the stone, the
Table 1- Hydraulic Performance
Flow (cfs)Flow
(gpm)
Flow
(gpm/ft2)
Stage
Relative to
Outlet (in)
Total
Volume
(ft3)
Total
Volume
(gal)
Detention
Time, X
(min)
Test Length
(min)
Pump Speed
to Deliver 20
gallons (GPM)
Sampling
Interval
(min)
0.21 95 7.0 5.03 30.08 225.00 2.37 139 0.14 23.1
0.30 133 10.0 6.09 36.44 272.52 2.05 99 0.20 16.5
0.42 192 14.0 8.34 49.89 373.14 1.94 69 0.29 11.4
0.50 217 16.6 9.97 59.60 445.81 2.05 61 0.33 10.1
0.61 276 20.3 13.03 77.92 582.77 2.11 48 0.42 8.0
0.69 305 22.9 15.22 91.00 680.59 2.23 43 0.46 7.2
0.80 357 26.6 19.41 116.03 867.86 2.43 37 0.54 6.2
0.92 413 30.6 25.00 149.48 1118.02 2.71 32 0.63 5.3
1.02 453 33.9 29.25 174.89 1308.08 2.89 29 0.69 4.8

Technical Report for StormTank Hydraulic Performance and Sediment Removal
Efficiency
11 November 2015
Page 8 of 21
Brentwood Industries, Inc.
610 Morgantown Road, Reading, PA 19611,
USA
brentwoodindustries.com
Phone: 610.374.5109
Fax: 610.376.6022
water must infiltrate the culvert pipe through the slots. For the first three data points, to 14.0
GPM/ft2, the maximum flow through the pipe wall is not achieved, therefore, the results are as
expected, a linear increase in the stage with decreasing Detention Times (See Chart 2 – Flow
vs Stage). For the flows greater than 16.6 GPM/ft2 the maximum flow through the pipe wall is
achieved at equilibrium with head pressure, therefore, we see the stage increasing as a second-
order polynomial with Detention Times increasing (See Chart 2 – Flow vs Stage).
Chart 1 - Flow vs Detention Time
y = 0.0028x2 - 0.0869x + 2.727
1.00
1.50
2.00
2.50
3.00
3.50
0.0 5.0 10.0 15.0 20.0 25.0 30.0 35.0 40.0
Det
enti
on
Tim
e (m
in)
Flow (gpm/sq ft)
Flow vs Detention Time

Technical Report for StormTank Hydraulic Performance and Sediment Removal
Efficiency
11 November 2015
Page 9 of 21
Brentwood Industries, Inc.
610 Morgantown Road, Reading, PA 19611,
USA
brentwoodindustries.com
Phone: 610.374.5109
Fax: 610.376.6022
At all water flow rates tested, both the direct and indirect measurement methods indicated
sediment trapping efficiencies greater than 95%. The direct method is the standard method and
shows a 2% decline in sediment trapping efficiency, 97% to 95%, as the flow increases 400%,
from 7.0 GPM/ft2 to 26.9 GPM/ft2 .The direct method also allows a mass balance to be
performed between the sediment weighed from the packaging and the sediment collected at the
completion of each test run. This mass balance shows that we can account for greater than 97%
of the solids used.
Chart 2 - Flow vs Stage
y = 0.4794x + 1.5498R² = 0.9852
y = 0.0232x2 - 0.043x + 4.2546
R² = 0.999
0.00
5.00
10.00
15.00
20.00
25.00
30.00
35.00
0.0 5.0 10.0 15.0 20.0 25.0 30.0 35.0 40.0
Sta
ge (
in)
Flow (gpm/sq ft)
Flow vs Stage
Technical Report for StormTank Hydraulic Performance and Sediment Removal
Efficiency
11 November 2015
Page 10 of 21
Brentwood Industries, Inc.
610 Morgantown Road, Reading, PA 19611,
USA
brentwoodindustries.com
Phone: 610.374.5109
Fax: 610.376.6022
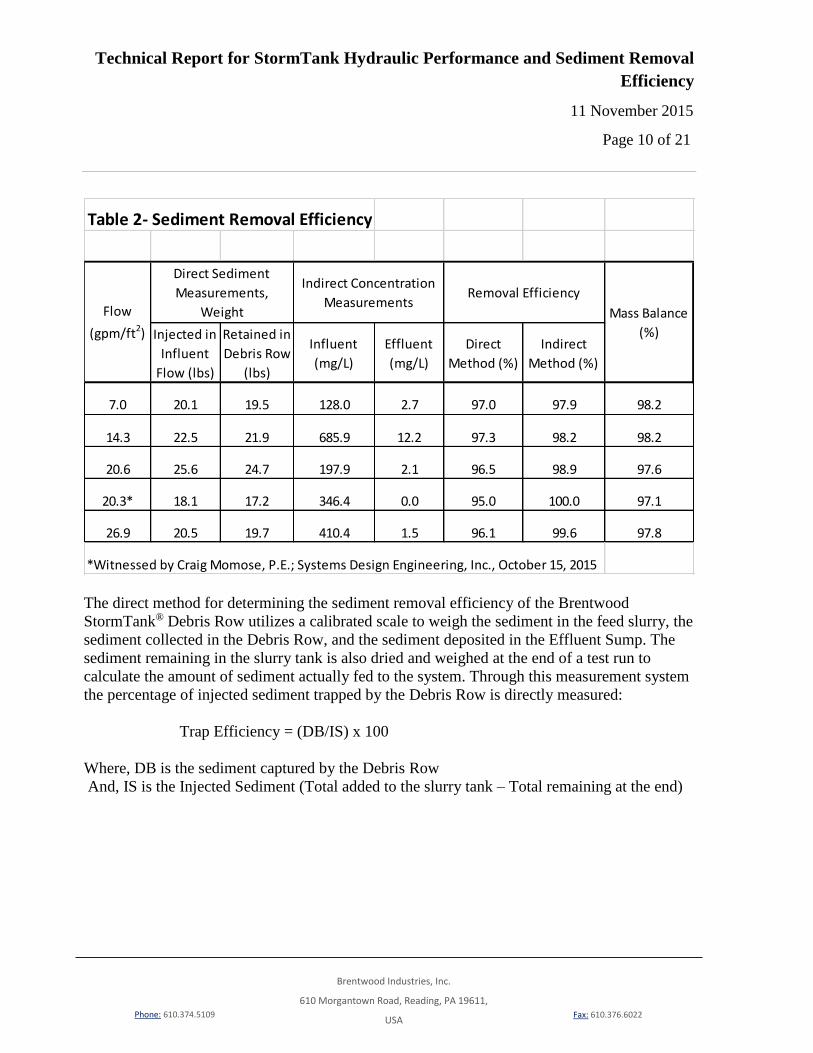
The direct method for determining the sediment removal efficiency of the Brentwood
StormTank® Debris Row utilizes a calibrated scale to weigh the sediment in the feed slurry, the
sediment collected in the Debris Row, and the sediment deposited in the Effluent Sump. The
sediment remaining in the slurry tank is also dried and weighed at the end of a test run to
calculate the amount of sediment actually fed to the system. Through this measurement system
the percentage of injected sediment trapped by the Debris Row is directly measured:
Trap Efficiency = (DB/IS) x 100
Where, DB is the sediment captured by the Debris Row
And, IS is the Injected Sediment (Total added to the slurry tank – Total remaining at the end)
Table 2- Sediment Removal Efficiency
Injected in
Influent
Flow (lbs)
Retained in
Debris Row
(lbs)
Influent
(mg/L)
Effluent
(mg/L)
Direct
Method (%)
Indirect
Method (%)
7.0 20.1 19.5 128.0 2.7 97.0 97.9 98.2
14.3 22.5 21.9 685.9 12.2 97.3 98.2 98.2
20.6 25.6 24.7 197.9 2.1 96.5 98.9 97.6
20.3* 18.1 17.2 346.4 0.0 95.0 100.0 97.1
26.9 20.5 19.7 410.4 1.5 96.1 99.6 97.8
*Witnessed by Craig Momose, P.E.; Systems Design Engineering, Inc., October 15, 2015
Direct Sediment
Measurements,
WeightFlow
(gpm/ft2)
Indirect Concentration
MeasurementsRemoval Efficiency
Mass Balance
(%)

Technical Report for StormTank Hydraulic Performance and Sediment Removal
Efficiency
11 November 2015
Page 11 of 21
Brentwood Industries, Inc.
610 Morgantown Road, Reading, PA 19611,
USA
brentwoodindustries.com
Phone: 610.374.5109
Fax: 610.376.6022
For the purposes of the evaluations in Chart 3 and Chart 4 the duplicate run (20.3 GPM/ft2) for
Systems Design Engineering, Inc. was omitted. Only 18.1 pounds of sediment were added,
outside of the standard method. Additionally, there was no detectable sediment in the effluent
samples, leading to a 100% trapping efficiency, which may lead one to question the validity of
the results. However, the purpose of that test run was to allow the outside firm to verify our
methods, not our results, and that was accomplished with the run.
Brentwood utilized dormant resources to employ an indirect method to verify the results of the
direct measurements. This was meant to be a broad verification, as the numerous steps
involved and small concentrations of sediment, coupled with the difficulty of obtaining discrete
well - mixed samples representative of the average concentrations, introduce compounding
errors. Surprisingly, most of the results were within 3% of the direct method with the exception
of the duplicate test, showing sediment trapping efficiencies greater than 97%. The results
show a trend toward increasing sediment trapping efficiency as the flow increases. This could
be due to numerous error factors: balance errors to the .00001g, humidity fluctuations, a
decreasing sample cross-section as the water level in the effluent pipe increased (the sample
line was set in the effluent pipe at the bottom counter to the flow).
Chart 3 - Sediment Removal Efficiency, Direct Method
y = -0.0045x2 + 0.0975x + 96.619
90.0
92.0
94.0
96.0
98.0
100.0
5.0 10.0 15.0 20.0 25.0 30.0
Tra
p E
ffic
ien
cy (%
)
Hydraulic Loading Rate (gpm/sq ft)
Direct Method Results

Technical Report for StormTank Hydraulic Performance and Sediment Removal
Efficiency
11 November 2015
Page 12 of 21
Brentwood Industries, Inc.
610 Morgantown Road, Reading, PA 19611,
USA
brentwoodindustries.com
Phone: 610.374.5109
Fax: 610.376.6022
Chart 4 - Sediment Removal Efficiency, Indirect Method
y = 0.0026x2 + 0.0012x + 97.735
90.0
92.0
94.0
96.0
98.0
100.0
5.0 10.0 15.0 20.0 25.0 30.0
Tra
p E
ffic
ien
cy (%
)
Hydraulic Loading Rate (gpm/sq ft)
Indirect Method Results

Technical Report for StormTank Hydraulic Performance and Sediment Removal
Efficiency
11 November 2015
Page 13 of 21
Brentwood Industries, Inc.
610 Morgantown Road, Reading, PA 19611,
USA
brentwoodindustries.com
Phone: 610.374.5109
Fax: 610.376.6022
Appendices
Appendix A – System Overview
Pump
Well SumpReservoir Tank Test Basin
Inf luent Pipe
Sump Eff luent Filter
Slurry Pump
Slurry Tank
Flow M eter
DB1 DB2 DB3
1 2 3
4 5 6
7
1
2 3
4 5
Side View
Stone
slots
8" Effluent Pipe

Technical Report for StormTank Hydraulic Performance and Sediment Removal
Efficiency
11 November 2015
Page 14 of 21
Brentwood Industries, Inc.
610 Morgantown Road, Reading, PA 19611,
USA
brentwoodindustries.com
Phone: 610.374.5109
Fax: 610.376.6022
Appendix B – AGSCO #110 Screen Analysis

Technical Report for StormTank Hydraulic Performance and Sediment Removal
Efficiency
11 November 2015
Page 15 of 21
Brentwood Industries, Inc.
610 Morgantown Road, Reading, PA 19611,
USA
brentwoodindustries.com
Phone: 610.374.5109
Fax: 610.376.6022
Appendix C: GEOTEX 601 Product Data

Technical Report for StormTank Hydraulic Performance and Sediment Removal
Efficiency
11 November 2015
Page 16 of 21
Brentwood Industries, Inc.
610 Morgantown Road, Reading, PA 19611,
USA
brentwoodindustries.com
Phone: 610.374.5109
Fax: 610.376.6022
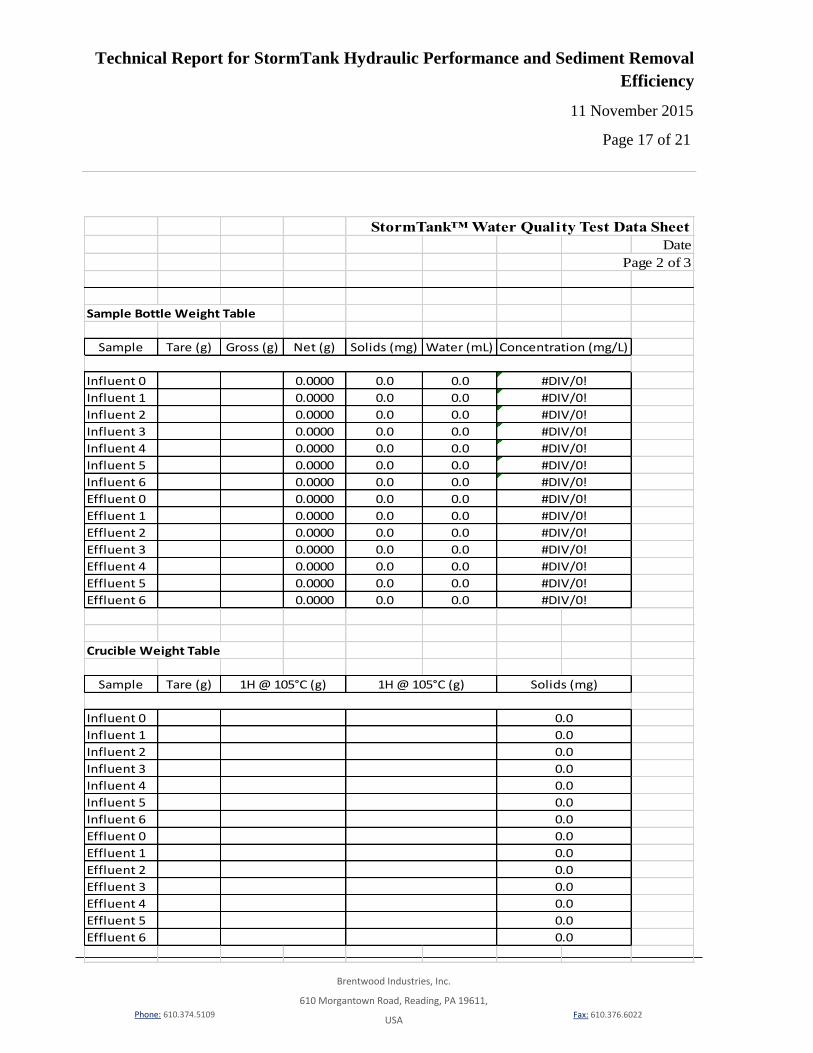
Appendix D – StormTank Water Quality Test Data Sheet
StormTank™ Water Quality Test Data Sheet
Date
Page 1 of 3
Test Name:
Test Length: min
Detention Time: min
Target Influent Concentration: mg/L
Slurry Concentration: lbs/gal
Slurry Pump Speed: gpm
Sampling Interval: min
Glass-fiber Filter Diameter: mm
Glass-fiber Filter Pore Size: μm
Geotex Weight Initial: lbs
Geotex Weight Final: lbs
Filter Sock and Vacuum Filter Weight Initial: lbs
Filter Sock and Vacuum Filter Weight Final: lbs
Tarp Weight Initial: lbs
Tarp Weight Final: lbs
Flow water: cfs
Water Load: 0 gpm/ft2
Maximum Stage Rig: in
Depth in Chamber: in
Total Volume: 0.00 gal
Equilibration Start Time:
Equilibration End Time:
Sump Water Temperature / Time: °F /
Sampler Influent Start Time:
Sampler Effluent Start Time:
Test / Slurry Pump Start Time:
Sump Water Temperature / Time: °F /
Sampler Influent End Time:
Sampler Effluent End Time:
Test / Slurry Pump End Time:
Sump Water Temperature / Time: °F /
Technical Report for StormTank Hydraulic Performance and Sediment Removal
Efficiency
11 November 2015
Page 17 of 21
Brentwood Industries, Inc.
610 Morgantown Road, Reading, PA 19611,
USA
brentwoodindustries.com
Phone: 610.374.5109
Fax: 610.376.6022
StormTank™ Water Quality Test Data Sheet
Date
Page 2 of 3
Sample Bottle Weight Table
Sample Tare (g) Gross (g) Net (g) Solids (mg) Water (mL)
Influent 0 0.0000 0.0 0.0
Influent 1 0.0000 0.0 0.0
Influent 2 0.0000 0.0 0.0
Influent 3 0.0000 0.0 0.0
Influent 4 0.0000 0.0 0.0
Influent 5 0.0000 0.0 0.0
Influent 6 0.0000 0.0 0.0
Effluent 0 0.0000 0.0 0.0
Effluent 1 0.0000 0.0 0.0
Effluent 2 0.0000 0.0 0.0
Effluent 3 0.0000 0.0 0.0
Effluent 4 0.0000 0.0 0.0
Effluent 5 0.0000 0.0 0.0
Effluent 6 0.0000 0.0 0.0
Crucible Weight Table
Sample Tare (g)
Influent 0
Influent 1
Influent 2
Influent 3
Influent 4
Influent 5
Influent 6
Effluent 0
Effluent 1
Effluent 2
Effluent 3
Effluent 4
Effluent 5
Effluent 6
0.0
0.0
1H @ 105°C (g)
0.0
0.0
0.0
0.0
0.0
0.0
0.0
1H @ 105°C (g)
0.0
0.0
#DIV/0!
#DIV/0!
#DIV/0!
0.0
0.0
0.0
Solids (mg)
#DIV/0!
#DIV/0!
#DIV/0!
#DIV/0!
Concentration (mg/L)
#DIV/0!
#DIV/0!
#DIV/0!
#DIV/0!
#DIV/0!
#DIV/0!
#DIV/0!

Technical Report for StormTank Hydraulic Performance and Sediment Removal
Efficiency
11 November 2015
Page 18 of 21
Brentwood Industries, Inc.
610 Morgantown Road, Reading, PA 19611,
USA
brentwoodindustries.com
Phone: 610.374.5109
Fax: 610.376.6022
StormTank™ Water Quality Test Data Sheet
Date
Page 3 of 3
0
Accounted Unaccounted Slurry
0.0 0.0
Direct Removal Efficiency: %
Indirect Removal Efficiency: %
0 0 0.0
#DIV/0!
0
Mass Balance (lbs)
0 0 0.0
Vacuum Filter and Filter Sock
Tare weight (lbs)
Dry Vacuum Filter and Filter Sock
Weight (lbs) Solids (lbs)
Solids Remaining in Slurry Tank (lbs)
Geotex Tare weight (lbs) Dry Geotex Weight (lbs) Solids (lbs)

Technical Report for StormTank Hydraulic Performance and Sediment Removal
Efficiency
11 November 2015
Page 19 of 21
Brentwood Industries, Inc.
610 Morgantown Road, Reading, PA 19611,
USA
brentwoodindustries.com
Phone: 610.374.5109
Fax: 610.376.6022
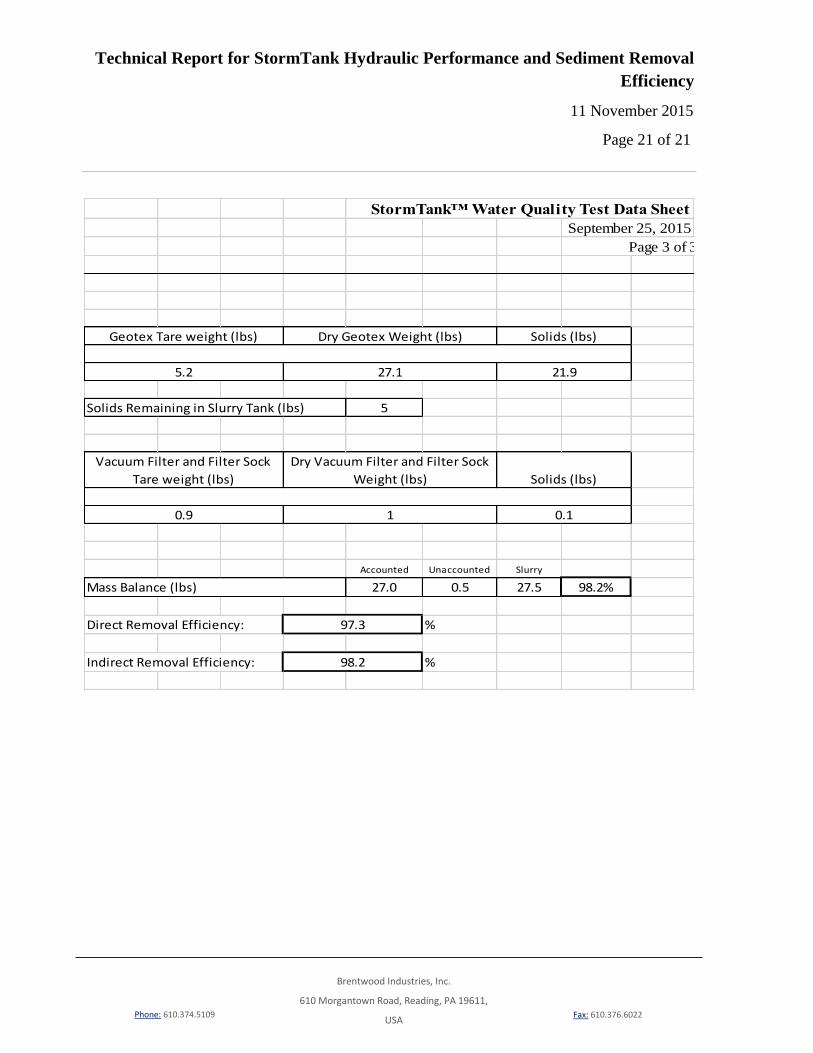
Appendix E – Sample Completed StormTank Water Quality Test Data Sheet
StormTank™ Water Quality Test Data Sheet
Page 1 of 3
Test Name: WQ 0.4 cfs 2015 09 25
Test Length: 69 min
Detention Time: 1.94 min
Target Influent Concentration: 200 mg/L
Slurry Concentration: 1.1 lbs/gal
Slurry Pump Speed: 0.29 gpm
Sampling Interval: 11.0 min
Glass-fiber Filter Diameter: 34 mm
Glass-fiber Filter Pore Size: 1.5 μm
Geotex Weight Initial: 5.2 lbs
Geotex Weight Final: 27.1 lbs
Filter Sock and Vacuum Filter Weight Initial: 0.9 lbs
Filter Sock and Vacuum Filter Weight Final: 1.0 lbs
Tarp Weight Initial: 6.8 lbs
Tarp Weight Final: 11.8 lbs
Flow water: 0.43 cfs
Water Load: 14.3 gpm/ft2
Maximum Stage Rig: 9.88 in
Depth in Chamber: 5.75 in
Total Volume: 490.0 gal
Equilibration Start Time: 9:55
Equilibration End Time: 10:14
Sump Water Temperature / Time: 71.8 °F / 9:56
Sampler Influent Start Time: 10:14
Sampler Effluent Start Time: 10:16
Test / Slurry Pump Start Time: 10:16
Sump Water Temperature / Time: 72 °F / 10:17
Pause - Influent feed line not working; re-start at 10:31
Sampler Influent End Time: 11:37
Sampler Effluent End Time: 11:39
Test / Slurry Pump End Time: 11:40
Sump Water Temperature / Time: 72.3 °F / 11:39
September 25, 2015

Technical Report for StormTank Hydraulic Performance and Sediment Removal
Efficiency
11 November 2015
Page 20 of 21
Brentwood Industries, Inc.
610 Morgantown Road, Reading, PA 19611,
USA
brentwoodindustries.com
Phone: 610.374.5109
Fax: 610.376.6022
StormTank™ Water Quality Test Data Sheet
Page 2 of 3
Sample Bottle Weight Table
Sample Tare (g) Gross (g) Net (g) Solids (mg)* Water (mL)
Influent 0 117.1047 211.1727 94.0680 1.0 94.1
Influent 1 113.7627 199.6820 85.9193 59.5 85.9
Influent 2 120.2428 205.2000 84.9572 77.9 84.9
Influent 3 119.0744 210.0568 90.9824 72.5 90.9
Influent 4 116.4428 212.7409 96.2981 69.1 96.2
Influent 5 116.5622 203.3854 86.8232 51.1 86.8
Influent 6 115.9707 206.8581 90.8874 36.3 90.9
Effluent 0 115.6987 203.4775 87.7788 1.2 87.8
Effluent 1 116.0757 205.6834 89.6077 1.1 89.6
Effluent 2 120.8946 215.6025 94.7079 1.5 94.7
Effluent 3 119.1743 214.1430 94.9687 1.6 95.0
Effluent 4 119.0589 231.6127 112.5538 0.7 112.6
Effluent 5 119.7286 214.6678 94.9392 1.0 94.9
Effluent 6 118.2419 211.6760 93.4341 1.1 93.4
*Negative values are recorded as zero
Crucible Weight Table
Sample Tare (g)
Influent 0 44.5359
Influent 1 44.0679
Influent 2 44.9158
Influent 3 44.5755
Influent 4 43.5355
Influent 5 44.3170
Influent 6 44.4361
Effluent 0 44.3461
Effluent 1 44.4199
Effluent 2 44.5589
Effluent 3 44.4879
Effluent 4 44.2916
Effluent 5 44.3202
Effluent 6 44.2992
September 25, 2015
44.4216
44.5613
44.4901
44.2929
44.3217
44.300844.2998
44.4204
44.5595
44.4889
44.2916
44.3207 1.0
44.4731
44.347644.3469
44.5376
44.1285
44.9944
44.6486
1.1
1H @ 105°C (g)
44.5362
44.1264
44.9929
44.6473
43.6040
44.3674
44.4718 36.3
1.2
1.1
1.5
1.6
0.7
1.0
1H @ 105°C (g)
69.1
51.1
5.8
10.5
11.8
43.6052
44.3689
59.5
77.9
72.5
Solids (mg)
13.1
12.3
15.8
16.8
Concentration (mg/L)
10.6
693.6
917.2
796.9
718.1
589.5
400.1
Technical Report for StormTank Hydraulic Performance and Sediment Removal
Efficiency
11 November 2015
Page 21 of 21
Brentwood Industries, Inc.
610 Morgantown Road, Reading, PA 19611,
USA
brentwoodindustries.com
Phone: 610.374.5109
Fax: 610.376.6022
StormTank™ Water Quality Test Data Sheet
Page 3 of 3
5
Accounted Unaccounted Slurry
27.0 0.5 27.5 98.2%
Direct Removal Efficiency: %
Indirect Removal Efficiency: %
September 25, 2015
0.9 1 0.1
Geotex Tare weight (lbs) Dry Geotex Weight (lbs) Solids (lbs)
98.2
97.3
Mass Balance (lbs)
5.2 27.1 21.9
Vacuum Filter and Filter Sock
Tare weight (lbs)
Dry Vacuum Filter and Filter Sock
Weight (lbs) Solids (lbs)
Solids Remaining in Slurry Tank (lbs)
