stormwater management: minimizing excess sediment
TRANSCRIPT

Page 1/18
Restoring Geomorphic Integrity in Urban Streams via Mechanistically BasedStormwater Management: Minimizing Excess Sediment Transport CapacityRobert J Hawley ( [email protected] )
Sustainable Streams, LLC https://orcid.org/0000-0002-6900-4398Kathryn Russell
University of MelbourneKristine Taniguchi-Quan
Southern California Coastal Water Research Project
Research Article
Keywords: Urbanization, detention basin retro�ts, stormwater management, transport capacity, stream recovery, stream restoration
Posted Date: November 10th, 2021
DOI: https://doi.org/10.21203/rs.3.rs-185084/v1
License: This work is licensed under a Creative Commons Attribution 4.0 International License. Read Full License
Page 2/18
AbstractStream channel erosion, enlargement, and habitat degradation are ubiquitous in urban watersheds with conventional stormwater management. Hydrologic-based restoration aims to discharge a more natural �ow regime via stormwater management interventions. Whether such interventions facilitate geomorphicrecovery depends, in part, on the degree to which they restrict discharges that would otherwise contribute to channel erosion. Erosion potential (E), the ratio ofpost-developed to predeveloped sediment transport capacity, provides a simpli�ed, mechanistic framework to quantify the relative in�uence of stormwaterinterventions on the geomorphic effectiveness of the �ow regime. This paper compiles ca. �ve years of data following stormwater-based interventions in threedistinct settings in the United States and Australia to demonstrate how the E framework can be used to elucidate the role of hydrologic restorationinterventions in helping to facilitate trajectories of geomorphic recovery (or lack thereof). In a previously developed watershed with unstable streams,substantial reductions in E coincided with a trajectory of geomorphic recovery, whereas our case study that did not reduce E between the study periodsexhibited continued instability. Furthermore, a green�eld study site that used the E framework to optimize their SCMs to match the sediment transport capacityof the predeveloped regime (E = 1) was able to maintain a recovery trajectory in a legacy-impacted setting that is otherwise highly susceptible tohydromodi�cation. Although available space and funding will limit the ability to fully reduce E in previously developed watersheds, these case studiesunderscore the mechanistic value of using stormwater controls to maximize reductions in E if geomorphic stability is a goal of stormwater interventions.Streambed material size and channel evolution stage also likely affect the level of E reduction necessary to promote geomorphic recovery, with coarser-grained and/or over-widened streams potentially needing less reduction than �ner-grained and/or more entrenched channels.
IntroductionStreams draining urban landscapes with conventional stormwater management tend to be systematically degraded (Booth et al., 2016, Paul and Meyer, 2001,Walsh et al., 2005). Increased runoff and more e�cient drainage networks in urban settings amplify the erosive power of the �ow regime leading to channelincision (Booth, 1990, Harvey et al., 1983), enlargement (Bevan et al., 2018, Chin et al., 2017, Galster et al., 2008, Hammer, 1972, Hollis and Luckett, 1976,Sullivan et al., 2020) and cycles of geomorphic instability (Booth and Fischenich, 2015) that can result in less stable substrate (Booth and Henshaw, 2001,Pizzuto et al., 2000) and simpli�ed/impaired habitat (Vietz et al., 2014, White and Walsh, 2020) with gravels/cobbles embedded by �ne sediment (Zeiger andHubbart, 2019) that is often attributable in part to intensi�ed rates of bed and bank erosion (Chin, 2006, Simon and Klimetz, 2008, Trimble, 1997, Wilson et al.,2007). Trajectories of channel instability such as the “classic” Channel Evolution Model (CEM) of Schumm et al. (1984, Figure 1) can lead to entrenchmentthat can further amplify the erosive power of the �ow regime resulting in additional channel erosion and streambed disturbance (Anim et al., 2019, Watson etal., 2002). Even in the absence of chemical pollution and habitat degradation, increased frequencies of streambed disturbance can drive signi�cant decreasesin macroinvertebrate richness and biotic integrity, underscoring the biological relevance of the natural bed disturbance regime (Hawley et al., 2016, Holomuzkiand Biggs, 2000, Poff, 1992), Jordt and Taylor, 2021).
One aim of hydrological restoration projects in urban watersheds is to mitigate chronic channel erosion by facilitating geomorphic recovery in the receivingstream network (e.g. Stein et al., 2012). We de�ne geomorphic recovery as a return to geomorphic equilibrium (i.e. Stage 5 in Figure 1 for single-threadchannels) including relatively stable channel banks, a sediment transport regime that maintains sediment continuity (neither excess scour nor aggradation),and a channel form that maintains its overall size and shape over time (no notable enlargement or contraction) (Biedenharn et al., 1997). By this de�nition,geomorphic equilibrium can exist across a variety of channel forms including braided channels and novel stream systems that are far removed from naturalconditions. Geomorphic equilibrium underpins and interacts with a range of ecological and societal values of streams (Polvi et al., 2020, Somerville and Pruitt,2004), including water quality (e.g. suspended sediment caused by channel erosion), elements of in-stream ecology (e.g. substrate quality and disturbanceregime, habitat complexity), vegetation (e.g. loss of trees due to bank erosion, burial or scour of aquatic and riparian vegetation), infrastructure failure andpublic safety (e.g. damage to bridges, roads, or buildings due to bank erosion), recreation (e.g. swimming, �shing) and aesthetic concerns.
The portion of the �ow regime that in�uences channel form includes any discharge that has the capacity to mobilize the bed or bank material (Wolman andMiller, 1960). For example, when streambed particles are transported downstream during an event but not replaced by particles delivered from upstreamreaches, the stream becomes incrementally deeper, and banks become steeper and more prone to failure (Simon, 1989, Simon and Rinaldi, 2000, 2006). Thepotential geomorphic in�uence of any given hydrologic event can be quanti�ed by its sediment transport capacity (Biedenharn et al., 2001). All else beingequal, an event with the capacity to transport 100 t of bed sediment has more potential to enlarge channels and disturb substrates than an event with acapacity of 10 t. Given the potentially complex consequences of geomorphic channel degradation, restoring predeveloped sediment transport capacity couldbe considered a keystone objective in hydrologic restoration projects aimed at facilitating geomorphic stability.
Urban streams typically have much higher sediment transport capacity than their predeveloped condition (Booth and Jackson, 1997, MacRae, 1991, 1993,Papangelakis et al., 2019). They also tend to have altered sediment supplies relative to their predeveloped conditions (Wolman 1967, Russell et al. 2017). Both unmanaged and conventionally managed (e.g. �ood control basins) stormwater runoff typically create more events that exceed the critical discharge(Qcritical) for incipient motion of the bed material (Bledsoe, 2002, Booth and Jackson, 1997), as well as longer durations of bed-mobilizing �ows (Hawley andBledsoe, 2011, Rosburg et al., 2017). Sediment tracer studies in urban streams have veri�ed that the increased power to transport streambed sedimentcoincides with increased rates of coarse sediment transport (Cain et al., 2020, Papangelakis et al., 2019).
The ratio of the sediment transport capacity between the urban �ow regime and the predeveloped �ow regime is referred to as the erosion potential (E,Equation 1) (Bledsoe, 2002, MacRae, 1993), or load ratio (Hawley and Bledsoe, 2013),

Page 3/18
where E = erosion potential (dimensionless), Ldeveloped = sediment transport capacity of a management scenario (t or m3), and Lpredeveloped = sediment
transport capacity of the predeveloped regime (t or m3) using the same sediment transport equation. An erosion potential greater than one indicates anexcess of sediment transport capacity over pre-developed conditions, often the primary driver for the cycles of channel incision, widening, and enlargementthat is typical in many urban stream settings (Papangelakis et al., 2019, Russell et al., 2020). Hawley and Bledsoe (2013) found that erosion potential hadmore predictive power for stream stability than empirical models that relied on other surrogates for urban stream power such as impervious area. If a channelformerly in equilibrium undergoes an increase in sediment transport capacity it can use that extra power to remove larger amounts of bed and bank materialthan would have occurred under the predeveloped regime. The greater the relative departure from the predeveloped regime, the more potential for channelinstability and enlargement. Managing stormwater to minimize departure from the predeveloped sediment transport capacity is therefore a mechanisticallyrelevant approach to protect or restore geomorphic stability and related societal values of streams.
Erosion Potential (E) As A Management FrameworkWe suggest that E can be used as a mechanistically-based management framework for SCM design and watershed-scale hydrologic restoration aimed atrestoring geomorphic stability in previously developed watersheds, as well as protecting geomorphic integrity in previously undeveloped watersheds. In thispaper we present a framework for the application of E as a management tool for guiding appropriate stormwater interventions (Figure 2), and apply the Eframework to three watersheds in North America and Australia to underscore the following insights:
1. A watershed that experienced new development where SCMs were used to minimize increases in E experienced a notably improved geomorphic responserelative to conventionally developed watersheds in the same setting.
2. Previously developed watersheds where retro�tted stormwater interventions can substantially reduce E were more likely to induce trajectories ofgeomorphic recovery than in watersheds where interventions did not appreciably reduce E.
3. Less entrenched, over-widened streams with coarser bed sediment may be more likely to recover than more entrenched, narrow streams with �ner bedsediment in the absence of fully restoring the sediment transport capacity to predeveloped conditions.
Step 1: Establish baseline conditions
Baseline geomorphic conditions and trajectory of a target stream are required to understand its potential to respond to E-based interventions. What impactshas increased erosion potential caused or alternatively, what aspects of the stream can be protected from future increases in E? Could the stream recover inresponse to a reduction in E, or could the current condition of the stream be preserved by preventing E from increasing? What are the other constraints on itsgeomorphic condition apart from increased sediment transport? At this stage, the objective or success criteria of the intervention should be de�ned. Whatsuccess looks like for a particular intervention will be heavily dependent on geomorphic and social context, taking into account the stream’s potential forrecovery along with the ecological and social values that could be supported by a geomorphically stable stream. Once such objectives are de�ned, amonitoring protocol can be developed to assess progress and success after the intervention. Such a protocol should consider which sites are most sensitive tochanges in sediment transport or most critical to stabilize, the downstream zone of in�uence from the SCM by which the monitoring should cover, how manysites are needed to adequately detect channel evolution or lack thereof, and over what time period changes are likely to be detectable. Monitoring reference orcontrol sites (e.g. upstream of intervention or in nearby catchments) may be appropriate to distinguish the effects of the intervention from background effects(e.g. due to climate variability). Finally, an adaptive management plan can be developed to guide iteration of future management actions in light of �ndingsfrom the monitoring program.
Step 2: Estimate erosion potential (E)
To calculate E, estimates of sediment transport capacity are required for each relevant scenario (i.e. pre-developed, current, post-developed, post-intervention).Such estimates require both a sediment transport relation, to relate �ow to instantaneous sediment transport, and a method to estimate and accumulate �owover the period or �ow series of interest.
Over a century of river mechanics research has resulted in numerous sediment transport methods (Gomez, 1991), but they all tend to converge on the idea thathigher stream power, shear stress or velocity produces greater geomorphic responses in streams. Even relatively simple thresholds of unit stream power havebeen correlated to risks of sizable channel widening during large �oods (Yochum et al., 2017). In the absence of highly calibrated models, calculations oftransport capacity ratios may provide greater utility, especially where absolute accuracy is less important (Russell et al., 2020). For example, a ratio approachusing the Meyer-Peter and Müller (1948) equation with adapted parameters from Wong and Parker (2006) has been commonly used in peer-reviewed studiesin southern California (Hawley and Bledsoe, 2013) and Northern Kentucky (Hawley et al., 2017), whereas a ratio approach using the two-fraction model ofWilcock and Kenworthy (2002) has been used in previous studies of Victorian streams (Russell et al., 2020).
One of the factors underpinning the success of the E framework is that the sediment transport computations used to calculate E (Equation 1) for differentscenarios in a given stream must be based on the same sediment transport method. Although users can tailor their application of E to the sediment transportequation most appropriate for their setting, it is imperative that the sediment transport capacity (L) for the developed and undeveloped scenarios use the samesediment transport equation.
Along the same logic, one should tailor the hydrologic inputs into their sediment transport computations to align with the goals of their study/design. Forexample, if using the E framework to optimize SCM designs, one might use a range of standard design storms that are commonly used in the managementcommunity (e.g. 2-yr, 10-yr, 100-yr). Alternatively, one could use continuous simulation to model a representative precipitation record that is commensurate

Page 4/18
with the expected frequency of bed entrainment for the given stream (e.g. a few decades for a gravel/cobble stream, a century or longer for boulder streams(Hawley and Vietz, 2016)). Whether using design storms or continuous simulations, one should use the same precipitation record/design storms to model allof their evaluation scenarios (e.g. predeveloped, management scenario 1, scenario 2, etc.). Hydrologic comparability between scenarios is critical for a ratioapproach like E that is aimed at evaluating the potential bene�ts of stormwater interventions because it emphasizes the relative differences betweenmanagement scenarios as standardized by the predeveloped sediment transport capacity.
In instances where gage records of the pre-intervention and post-intervention periods are available, E can be calculated directly from the observed �ows. Inthis application of the E framework, it is less about evaluating the merits of competing stormwater interventions at the design/planning phase and more aboutilluminating why the implemented stormwater management interventions facilitated (or failed to produce) the expected geomorphic response. For example, Ecan help untangle the role of climate by synthesizing multiple years of hydrologic records into a single number. In this way, the E framework builds on thelong history of using river mechanics computations to reduce complex phenomena to a representative value (e.g., effective discharge, Qeff (Biedenharn et al.,2001, Wolman and Miller, 1960) or the discharge associated with 50% of the cumulative sediment transport over the �ow record, Qs50 (Bledsoe et al., 2016,Stroth et al., 2017)).
Step 3: Select appropriate intervention
We propose using E alongside other objectives for sustainable urban stream management to design hydromodi�cation interventions. Urban waterwaymanagement requires balancing a set of complex and sometimes competing priorities, e.g. ecological integrity, stability, �ood protection, water quality andaesthetics. When addressing hydromodi�cation, it is usually impractical to perfectly mimic the pre-development hydrograph to address all parts of the �owregime. E provides a mechanistically-based but simple metric to assess an important component of the �ow regime (sediment-transporting �ows) thatunderpins a range of urban stream functions and values, including stability, geomorphic integrity, habitat complexity, sediment load and benthic disturbanceregime. Evaluating retro�t alternatives through the lens of sediment transport capacity can help managers quantify which intervention achieves the greatestgeomorphic value—similar to quanti�cation steps that are often done for water quality improvements, �ood reduction, and other stakeholder values.
Individual SCMs or combinations of different types of SCMs (e.g. detention basin retro�ts, bioin�ltration basins, etc.) could be evaluated for their cumulativeeffect on E along with other metrics. For example, Alternative A (E = 1.36) in Figure 3 better matches the shape of the predeveloped hydrograph, butAlternative B (E = 1.12) comes closer to matching the sediment transport capacity. Depending on other stakeholder values (e.g. base�ow restoration, �oodstage reduction, etc.), along with how each design performs across a synthesis of design storms (or continuous simulations), a manager can make aninformed decision on which intervention (or combination thereof) to invest in.
Step 4: monitor and evaluate success
Monitoring and evaluation are critical to understanding whether an intervention is successful and if additional or alternative interventions are needed toachieve geomorphic objectives. Monitoring can include the success of the intervention in reducing transport capacity (e.g. �ow gaging or monitoringfunction/operation of intervention structures), as well as its success in fostering geomorphic stabilization or recovery (e.g. repeat geomorphic surveys andassessments). Where geomorphic objectives are not met, geomorphic trajectory can be assessed to predict whether they might be met over time, or if furtherintervention is required. In this way, adaptive management processes can be implemented to iterate design, implementation, monitoring and evaluation underthe E framework.
Case StudiesWe explored the utility of the erosion potential framework in three watersheds (Table 1) with stormwater interventions in hydro-geomorphically distinct regionsthat have shown relevant insights for stream and stormwater management on previous analyses: Northern Kentucky USA, southern California USA, andVictoria Australia (Hawley and Vietz, 2016). Each watershed has had stormwater control measures (SCMs) applied with the aim of protecting or restoringgeomorphic or ecological condition. Such measures are still uncommon worldwide, despite widespread understanding of the degrading effects of urban �owregimes. This study provides the opportunity to synthesize the effects of stormwater control on transport capacity and geomorphic recovery in three distinctcontexts.
It is important to underscore that these case study sites are a part of much larger studies/datasets that help to discern signal from noise. For example, theKentucky dataset includes repeat surveys at 61 sites over ~10 years that include control/reference sites where CEM stage is not only assessed by the samepersonnel using �eld indicators but also a�rmed by repeated time-series cross sections, pro�les, and pebble counts (Hawley et al., 2020). Geometric surveysincluded repeat surveys at monumented cross sections according to industry standard methods (Harrelson et al., 1994) and bed material pebble counts afterBunte and Abt (2001). The Victoria dataset includes numerous cross-sections which together indicated geomorphic trajectory, and also includes multiplecontrol and reference sites which indicate background conditions in the absence of urbanization and mitigation. The California study capitalized on a largeinventory of consultant-collected data, including repeat geomorphic surveys at four monumented cross sections (two upstream and two downstream of thedevelopment), but was limited by access restrictions that precluded the ability of the authors to conduct an independent �eld assessment.
Step 1: Establish baseline conditions
The California case study is from a green�eld development where stormwater controls were designed to match the predeveloped sediment transport capacity(E = 1). Since ~2010, many regions in California have implemented “Hydromodi�cation Management Plans” (HMP), which require new developments toinstall SCMs that are optimized to match the pre-development sediment transport capacity across a gradient of discharges (e.g. typically 0.1xQ2 through Q10)with the goal of preventing excess channel instability. On most new development projects in primarily undeveloped watersheds, this results in a value of E

Page 5/18
equal to 1.0 (Table 1). However, more commonly new development sites in this region are in watersheds that are already highly developed and the pre-developed transport capacity are likely far from “undeveloped” conditions. The case study included herein is from a development in southern Orange County,California draining to a stream in a historically ranched but primarily open-space watershed with a drainage area of 14.4 km2 and 5% Total Impervious Area(TIA) post-development. Because the development drains to streams in open-space/habitat reserves, a variety of monitoring and management plans havebeen developed in addition to the HMP and runoff management plans, including habitat, stream, and water quality monitoring and adaptive management. This case study leverages repeat channel cross sectional survey data and photos collected by private consultants as a part of the development’s permits(PACE, 2019). Stream channel cross sectional surveys of the study tributary, Chiquita Creek, occurred pre- and post-development at four monitoring locations– two downstream and two upstream of the development. The sites downstream of the development were located at two geomorphically distinct locations: aless de�ned, wide channel in the immediate receiving stream (“CA 1”) and a more de�ned split channel separated by a wide central bar located 450 mdownstream (“CA 2”). Both upstream sites were located at v-shaped entrenched channels that were upstream of “CA 1” by 1.8 km and 3 km.
The Kentucky case study is from a previously developed basin where the original stormwater control (a conventional detention basin) was retro�t to release aless erosive �ow regime. The data are from a pilot installation of a detention basin retro�t technology funded in part by USEPA O�ce of Research andDevelopment (USEPA/ORD) and described in detail by Hawley et al. (2017). On December 21, 2013, the USEPA/ORD and project collaborators installed apassive retro�t device on a conventional �ood control detention basin that drains ~0.09 km2 with 50% TIA. The retro�t device was designed to restrictstormwater discharges during most precipitation events, including the 3-month, 6-month, and 1-year design storms, to less than the Qcritical for the receivingstream and reduce E to the fullest extent possible while still containing the 100-yr storm within the detention basin. The 3-month, 6-month, and 1-year eventswere all events that exceeded Qcritical under the pre-retro�t conditions. Three in-stream monitoring sites were established in the receiving stream network ca.
one year ahead of the retro�t installation: the immediate receiving stream (“Spur”, DA = 0.17 km2, 45% TIA), a control site (“US Site”, DA = 1.1km2, 7.8% TIA),and a downstream site (“DS Site”, DA = 1.31 km2, 12.4% TIA). See Hawley (2021) for a detailed inventory of the observations at each site.
The Victoria case study is from a previously developed watershed where distributed SCMs were retroactively installed with a goal of discharging a morenatural �ow regime. The peri-urban watershed drains 4.3 km2 with 14% TIA, including 9% Effective Impervious Area (EIA) prior to retro�tting. The site is part ofa watershed-scale before-after control-reference-intervention (BACRI) experiment (Walsh et al., 2015) with three reference sites and two control (suburban,without intervention) sites. The primary purpose of the intervention was to restore in-stream ecological conditions by mimicking the �ow regime (runofffrequency, base�ows, contaminant concentrations and total runoff volume) of nearby forested catchments. No erosion potential objective was de�ned but theintervention is expected to reduce E as a byproduct of reducing runoff magnitude and frequency. While geomorphic monitoring was not originally part of thestudy design, pre-intervention geomorphic assessment for a related project in 2011 provided an opportunity to repeat the assessment post-intervention. Wecan thus assess the geomorphic effect of an intervention that was not speci�cally designed using the erosion potential framework.
Step 2: Estimate erosion potential (E)
Acknowledging that the precision of E increases with more robust modeling approaches (e.g. calibrated rainfall runoff models using multiple decades ofobserved precipitation and �ow), the case study sites employ a gradient of E applications that coincide with how practitioners, managers, and researchers areactively applying the E framework in various regions (e.g. design storm analyses vs. continuous or pseudo-continuous simulations vs. gaged �ows). Theapproaches used for transport capacity computations, integration over the �ow regime and scenario comparisons for the case study sites, are summarized inTable 2. It is anticipated that the scale of differences in E values in this comparative study (see Table 3) overwhelms any slight variations in E that could beattributable to differences from the regionally preferred methods described below.
For southern California, sediment transport capacity was modeled for a range of design events (2-year, 5-year, 10-year, 25-year, 50-year, and 100-year stormevents) under pre-development and post-development (mitigated) scenarios using the US Army Corp of Engineer’s SAM.AID subroutine and reach-speci�ccross-sectional geometry and sediment data (Phillips et al., 2013). To evaluate the long-term sediment transport capacity across a range of �ow conditions, afrequency curve for sediment transport capacity was estimated from the transport capacity for each design event of known probability of occurrencefollowing the procedures outlined in Design Manual for Engineering Analysis of Fluvial Systems (Arizona Department of Water Resources, 1985). The areaunder the frequency curve represented the estimated long-term mean annual sediment transport capacity (Lm) and was calculated using the followingequation:
where Ls is the sediment transport capacity for a given �ood event that is multiplied by the probability of occurrence of that �ood in one year.
The pre-development scenario represents conditions prior to the development and does not re�ect pre-ranching “reference” conditions. The post-development(mitigated) scenario includes changes to land cover and slope from the development and mitigated �ow from the constructed �ow duration basin. E wascalculated as the average annual sediment transport capacity in the receiving stream of the post-development (mitigated) watershed divided by that of thepre-development watershed.
In the Kentucky case study, sediment transport capacity was modeled using the top 22 events over a 40-year record of rainfall after previously published workby Hawley et al. (2017). “Pre-intervention” and “post-intervention” scenarios model the same real events to compare pre-retro�t and post-retro�t sedimenttransport capacity as standardized by the undeveloped sediment transport capacity for the same events, facilitating a comparison of E between the pre-retro�t

Page 6/18
and post-retro�t conditions. Similar to the California case study, the “undeveloped” scenario models runoff in a watershed with natural ground cover(forest/grasses) without impervious area or other stormwater conveyance interventions, however, it does not attempt to project a pre-European settlementcondition (e.g. no inline beaver dams, wetland meadows, etc.). E was estimated to be 18.2 for developed (12% TIA) conditions and 10.7 for mitigatedconditions. The retro�t device installed on the conventional detention basin reduced the erosion potential of the immediate receiving stream by 42% comparedto pre-retro�t conditions (Table 3).
For the Victoria case study, gage data were used to model sediment transport capacity at the retro�t site, as well as one control site and one reference site,following the method of Russell et al. (2020) with an extended �ow record. Gage records were divided into “during retro�t” (2010-2014) and “post-retro�t”(2015-2019) periods. The “during retro�t” period captures the intensive installation phase whereas the “post-retro�t” period (2015-2019) includes only nominaladditional retro�t installations. E was calculated as the cumulative sediment transport of the retro�t watershed divided by that of the reference watershed,standardized on a t/km2 basis. E for the control watershed was also calculated to indicate the effect of climate variation between the two periods.
Contrary to expectations, E was not reduced after construction of the distributed SCMs in the previously developed (14% TIA) watershed. The “post-retro�t”period showed a 13% increase in E relative to the “during retro�t” period (Table 3). This counter-intuitive result re�ects differences in rainfall between periods.The average annual rainfall during the retro�t was ~1100 mm which decreased to ~900 mm in the period after the retro�t. Rare hourly rainfall intensities,which are more important for driving sediment transport than annual rainfall, were similarly reduced (e.g. the 99.9th percentile hourly rainfall decreased from9.3 to 7.3 mm). Therefore, in the post-intervention period, transport capacity was lower in urban and non-urban catchments, but it was relatively higher inurban catchments due to their �ashier �ow regime, producing increased E when standardized by the reference watershed during the same period. Comparisonwith the control (suburban with no retro�t) site suggests that there was an intervention effect, transport capacity decreased more in the intervention thancontrol catchment, and E increased less (13% compared to 68% increase in the control watershed). The complex interactions of climate variability andintervention effects highlight the di�culty of using before-after �ow monitoring to estimate E after intervention, and the importance of comparing effectsagainst reference and control sites or models.
Step 3: Select appropriate intervention
For the California case study, intervention modelling and design was undertaken by a consultant under the development’s hydromodi�cation plan (HMP),guided by the South Orange County Hydromodi�cation Management plan (SOC HMP) requirements and standards (County of Orange, 2011). The SOC HMPrequires new development projects to match the pre-development sediment transport capacity across a range of discharges (e.g. 10% of the Q2 through Q10)to minimize E and prevent excess channel erosion downstream. For the California case study, a combined water quality in�ltration and hydromodi�cationbasin was constructed. The selected design of the hydromodi�cation detention basin was able to achieve the objective of post-intervention E = 1.0.
For the Kentucky case study, a passive retro�t device was designed for a conventional �ood control basin to restrict stormwater discharges during mostprecipitation events, including the 3-month, 6-month, and 1-year design storms, to less than the Qcritical for the receiving stream. These were all events thatexceeded Qcritical under the pre-retro�t conditions. The selected design reduced the freeboard to the engineered spillway for the 100-yr design event by 21 cmbut maintained the same level of service as the pre-retro�t condition by keeping the 100-yr event from overtopping the spillway.
The Victoria case study was not explicitly designed with geomorphic or sediment transport objectives, but the interventions were assessed after design andinstallation for their potential to reduce E. Retro�tted stormwater control measures (e.g. leaky rainwater tanks, rain gardens) were installed on a range ofproperties and streetscapes, mainly between 2010 and 2014 (Walsh et al., 2015). The measures treated around half of the pre-developed effective imperviousarea and resulted in a reduction of EIA from 9% pre-retro�t to 6% post-retro�t. The post-retro�t EIA was estimated using the Environmental Bene�t metric(Walsh et al., 2015) which accounts for imperfect SCM performance in disconnecting impervious surfaces.
Step 4: Monitor and evaluate success
Changes in geomorphic trajectories (or lack thereof) were assessed using a weight of evidence approach, including pre/post-intervention cross sectionsurveys, photos, and �eld observations at control and experimental reaches. Assessment of CEM Stage is commonly included in geomorphic �eldassessments (Simon and Downs 1995, Bledsoe et al. 2012) and can be reinforced with time-series cross section data (e.g. Hawley et al. 2020). Observationsalso included biological data (presence/absence of bank/bar vegetation, �sh, etc.), wood retention, habitat assessments, etc. (e.g. Hawley, 2021). Based onthe weight of evidence, has the post-intervention stream substantially changed its geomorphic trajectory relative to the pre-intervention condition?
In California, the application of the E framework to the SCM designs at the green�eld development site (5% TIA)—matching the predeveloped sedimenttransport capacity (E = 1) has appeared to maintain a trajectory of geomorphic recovery in the receiving stream at both downstream monitoring locations. The monitoring cross section, “CA 1”, was established in an aggradational sub-reach with a wide, unde�ned channel that was downstream of an orchard. Theirrigation runoff from the orchard had resulted in a highly vegetated channel prior to the suburban development. Following the construction of thedevelopment and basin, the aggradational trajectory, CEM Stage 4, continued at both monitoring sites “CA 1” (Figure 4A) and the more de�ned downstreamsite “CA 2”, with no perceptible changes in the vegetated channels. In contrast, cross section data showed the entrenched upstream control site following atrajectory of incision, CEM Stage 2, and erosion of the left toe during the post-development period which may be attributed to historic cattle grazing and ranchoperations over the last 60 years. Although the irrigation runoff and legacy impacts from historic grazing confound our ability to draw de�nitive conclusionsat this case study location, the lack of visibly apparent downcutting, bank erosion, and channel widening at the downstream monitoring locations, despitehaving 7 events that exceeded the 3-month, 1-hr storm in the post-development period (compared to 6 events in the pre-developed period over equal timeperiods of ca. 3 years), in contrast to the continued signs of instability at the upstream site underscores the importance of the SCM on minimizing E. Moreover, these observations are a sharp contrast from the types and extents of channel enlargement that used to be commonplace downstream of

Page 7/18
green�eld developments in this region prior to the implementation of hydromodi�cation management SCMs (e.g. see Hawley and Bledsoe (2013) or Taniguchiand Biggs (2015)) where incision has even been observed in previously aggradational reaches (Hawley et al., 2012).
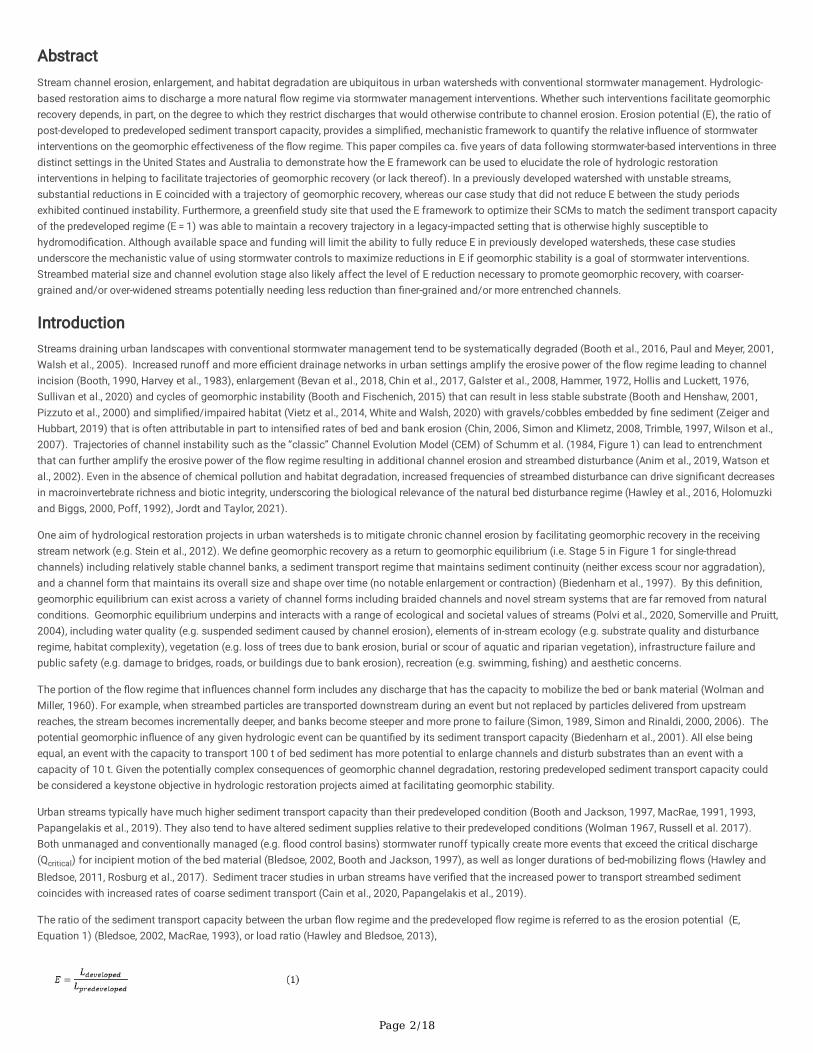
For Kentucky, the stormwater retro�t that used the E framework to discharge a less erosive �ow regime appears to have induced a trajectory of geomorphicrecovery in the formerly unstable receiving streams. The immediate receiving stream and DS Site (Figure 4B, Figure 5) have experienced notable improvementsin geomorphic stability, habitat, and �ow, whereas the control site has continued on a degradational trajectory over the same time period (Hawley, 2021). Thesite in the immediate receiving stream also supports �sh in several pools in a reach that used to go dry ~10% of the time prior to the retro�t installation(Hawley, 2018). Cross section data at the downstream site show a shift from CEM Stage 3 to Stage 4 in the �rst ~3.5 years following the retro�t (Figure 4B)that coincided with additional failure of both banks and bar building along the toe of the right bank (Hawley, 2021, Hawley et al., 2020). The colonization ofthe bars by vegetation ~2 years later (~5.5 years following retro�t installation) is indicative of a potential transition to CEM Stage 5 (Figure 5). Theestablishment of permanent (woody) vegetation along with additional years of cross-section monitoring documenting an equilibrium channel would addcon�dence to the CEM Stage 5 (recovered) classi�cation. A potentially competing hypothesis that the observed geomorphic trajectory was perhaps moreattributable to precipitation changes was not the case. The post-retro�t period of 5 years and 8 months had 16 events that exceeded the 3-month, 1-hr stormcompared to just 10 events over the comparable pre-retro�t period. Recall that prior to the retro�t, the 3-month event exceeded Qcritical, suggesting that withoutthe retro�t the slumped material from bank erosion would have likely been washed away and not colonized by vegetation.
In the Victoria case study E was not reduced by the distributed SCMs in the previously developed (14% TIA) watershed, although comparison with a controlcatchment suggests that the stormwater control interventions did have an attenuating effect on some �ows that would have otherwise contributed to erosion.Furthermore, transport capacity was decreased in the post-intervention period due to lower rainfall intensity (e.g. the 3-month storm frequency changed from4.1 events per year during intervention to 3.6 events per year post-intervention). However, the intervention and rainfall effects together did not induce atrajectory of geomorphic recovery in the receiving stream network within the ~5-year post-intervention monitoring period. Although it is feasible that thestormwater interventions could help to facilitate a trajectory of geomorphic recovery in the future, survey data (Figure 4C), photographs (Figure 6), andsubsequent �eld assessments suggest that the channel is still experiencing a degradational trajectory including downcutting, bank failure, and channelwidening (CEM Stage 3).
DiscussionThe case studies presented here indicate that SCMs that focus on managing sediment transport capacity and reducing E can be effective atmaintaining/inducing trajectories of geomorphic recovery. These examples contrast with the geomorphic instability that is abundantly documented inchannels downstream of conventional stormwater management approaches that do not explicitly attempt to maintain/restore predeveloped sedimenttransport capacity (e.g. Booth and Jackson, 1997, MacRae, 1997, Vietz et al., 2014). The E-based design at the green�eld development in southern Californiaappears to have maintained the aggradational trajectory at the monitoring location that was occurring prior to development. A monitoring location fartherdownstream (~450 m) also lacks signs of chronic erosion (PACE, 2019). The upstream control site, in contrast, showed signs of bed incision during the samemonitoring time period, underscoring the importance of the SCM on minimizing E and promoting channel stability in the downstream reaches. Although theirrigation runoff and vegetated channel confound our ability to be geomorphically conclusive about the overall SCM design, these observations are an extremecontrast to the typical responses downstream of conventional developments that lack sediment transport matching designs (Figure 7). More data is neededacross an array of green�eld sites and hydrogeomorphic settings, but the E framework appears to be coinciding with encouraging results in green�eldapplications.
Similarly, the Kentucky retro�t of the conventional detention basin to decrease the freeboard to the spillway by 21 cm for the 100-yr design storm in order torestrict the erosive discharges of more frequent storms (e.g. 3-month, 6-month, and 1-year events) coincided with a shift from a degradational trajectory priorto the retro�t to an aggradational/recovering trajectory post-retro�t. Although the detention basin did not have enough volume to restrict discharges to matchthe sediment transport capacity of the undeveloped condition, the retro�t did reduce E by 42% between the post-retro�t and pre-retro�t scenarios.
By contrast, the distributed SCMs that were retroactively installed in a previously developed watershed that lacked transport-capacity-based controls did notappear to coincide with a shift in the degradational geomorphic trajectory in the �ne-grained Australian stream. Shifts in the weather confound the case study,however, the existing CEM Stage (still relatively narrow and deep, just beginning to shift from stage 2 to stage 3) likely needs to become much wider prior topotentially shifting to a recovery trajectory. The inherent sensitivity of �ne-grained channels to increases in erosive power is another potential reason why theVictorian stream did not recover, while the cobble-bed Kentucky stream appeared to shift toward a recovery trajectory, with similar E values.
The geomorphic effects of the stormwater management case studies presented herein align with what would be qualitatively predicted by the long-establishedprinciples of river mechanics (e.g. Biedenharn et al., 2001, Wolman and Miller, 1960). Infrastructure that ampli�es and prolongs the geomorphically-effectiveportion of the �ow regime are likely to increase bed sediment transport and induce and prolong cycles of channel instability and enlargement (Booth andJackson, 1997, MacRae, 1991, 1993). Stormwater management regimes that attenuate erosive discharges are likely to reduce sediment transport rates andhave the potential to mitigate channel instability. These mechanistically-based relationships have been empirically validated in sediment tracer studies(Papangelakis et al., 2019) and are further underscored by this study.
This hydrologic-geomorphic connection is critically important when planning and designing stormwater interventions aimed at improving channel stability. Given that opportunities for intercepting and attenuating stormwater in previously developed watersheds can be both rare and expensive, this paper highlightsthe value in optimizing retro�ts to minimize E and match the predeveloped sediment transport regime to the extent feasible.
The extent of E reduction necessary to facilitate geomorphic recovery likely depends on the hydrogeomorphic context of the setting. For example, all elsebeing equal, coarse grained channels may be more resilient than �ne-grained channels, and less entrenched channels may be more resilient than more

Page 8/18
entrenched channels. Using a dataset of 84 sites in southern California, Hawley and Bledsoe (2013) used logistic regression analysis to show that the risk ofchannel enlargement decreases with bed material size (Figure 8). Just as coarse bed material can provide a degree of resistance to channel instability insome urban streams (e.g. Bledsoe et al., 2016, Booth, 1990, Booth and Henshaw, 2001, Hawley and Bledsoe, 2013, Taniguchi and Biggs, 2015, Utz et al., 2016),coarser-bedded streams may be able to facilitate a return to equilibrium at E values greater than 1, as was observed in the Kentucky case study.
The Kentucky recovery for a stream bed with a 74-mm d50 occurred at higher E values than expected from previous work (10.7 as opposed to ~2, Figure 8). More data across more levels of E and sediment size are clearly needed, but bed coarsening (Hawley et al., 2013, Robinson, 1976, Russell et al., 2018),channel widening (Bevan et al., 2018, Hammer, 1972, Hawley et al., 2020, Pizzuto et al., 2000) and channel headcutting and the associated decreases inslope (Hawley et al., 2012, Schumm et al., 1984, Sullivan et al., 2020, Taniguchi et al., 2018) are all channel adjustment mechanisms that systematically workto dissipate the excess erosive energy of the �ow regime and/or increase the resistance of the setting (Hawley, 2018, Lane, 1955). The extent of channeladjustment prior to the stormwater intervention will likely affect the extent and timeframe of the geomorphic recovery. Coarse, entrenched channels that arealready fairly wide (e.g. CEM stage 3 or 4) may be more primed for a recovery in response to geomorphically-meaningful stormwater interventions. Other moresusceptible settings such as entrenched (CEM stage 2), �ne beds (e.g. Bledsoe et al., 2012), and/or streams with disconnected/variable sedimentsupplies (e.g. Russell et al., 2017, Wolman, 1967) may not immediately transition to a recovery trajectory even with a 100% reduction in excess sedimenttransport capacity, underscoring the importance of channel hydraulics (Anim et al., 2019), Woockman et al., Forthcoming) among other factors.
Here the selection of reference conditions also plays a role. Where the reference condition is a pre-developed �ow regime in a channel that has already partiallyadjusted (e.g. Kentucky), the erosion potential may be overestimated, compared to an approach which compares to a pre-developed �ow in a pre-developedchannel (e.g. Victoria). However, the Victoria approach of using a nearby undeveloped channel as a surrogate pre-developed channel presents its ownchallenges in understanding and minimizing the effect of context (e.g. slope, geology, climate) when selecting a suitable reference site. Additionally, it isimportant to note how the pre-developed transport capacity is de�ned in different regulatory settings. In California, the predevelopment transport capacity,which SMCs from new development are required to match, is the transport capacity prior to the new development, which in many cases are far from thereference transport capacity. The California green�eld case study, herein, illustrates a less common example of new development in a predominantly open-space watershed where predevelopment conditions are closer to reference. It is possible that California hydromodi�cation requirements in more urbanizedwatersheds with channels that are actively eroding, CEM stage 2 or early stage 3, may need to be more stringent to further minimize E and induce a recoveringtrajectory if that is the desired stakeholder outcome.
The case studies herein are consistent with hypotheses posed by previous studies suggestive of coarse bed resistance (e.g. Bledsoe et al., 2016, Utz et al.,2016) in that the �ne-grained channel in Victoria did not experience a geomorphic recovery whereas the coarse-grained stream in Northern Kentucky did,despite having comparable levels of E following the retro�ts. The relative change in E also likely played a role in facilitating the recovery: E of 10.7 in NorthernKentucky represented a 42% improvement relative to the pre-retro�t condition (E = 18.2), whereas E in Victoria was similar pre and post-retro�t (with effects ofmitigation and rainfall variability largely cancelling each other out). Importantly, although the Northern Kentucky case study appears to be on a trajectory ofgeomorphic recovery, it is unlikely to return to the size and shape of its predevelopment form. It can be safely inferred based on a 10-year study at 61sites (Hawley et al., 2020) that the channel had already undergone considerable widening such that the resulting equilibrium form induced by the retro�t willlikely be a larger channel than the predeveloped stream. In retro�t situations, where reducing E to one is often not practical, a substantial but non-completereduction in E is still likely to improve physical form and functioning. Effects of such interventions are expected to be most visible in streams that are alreadynear recovery thresholds (e.g. late CEM Stage 3 or Stage 4, Kentucky), as opposed to more actively eroding streams (e.g. CEM Stage 2 or early Stage 3,Victoria) that may take much longer to facilitate a transition to recovery stages.
The extent of impervious area (Bledsoe and Watson, 2000, Booth and Jackson, 1997), timing (Chin et al., 2017, Leopold et al., 2005), and existing SCMtreatment (Hopkins et al., 2020) , along with the hydrogeomorphic setting (Booth et al., 2016) and other natural and anthropogenic factors (Utz et al., 2016) arealso likely to play a role. Although the E framework offers an attempt to account for the in�uence of impervious area, existing SCMs, and other factors in itshydrologic and sediment transport modeling steps, these case studies all had relatively low levels of watershed imperviousness (<15% TIA). Additional data isneeded to evaluate the e�cacy of the E framework in watersheds with larger amounts of TIA, old vs. young development, and different levels of and types ofSCM treatments.
Finally, the frequency of disturbance events was substantially reduced with the Northern Kentucky retro�t: Qcritical was exceeded by the 3-month design stormunder pre-retro�t conditions, whereas it requires a 2-year storm to exceed Qcritical under post-retro�t conditions (Hawley et al., 2017). The ~8-fold improvementin lag between disturbance events was likely an important mechanism at facilitating vegetation colonization that transformed the formerly unstable bars intostable benches, which is one of the key indicators in the transition from CEM Stage 4 to 5 in the Schumm et al. (1984) model. The mechanistically basedapproach in this comparative study could therefore be extended beyond just total transport capacity by considering feedback between seasonality andfrequency of disturbance events and vegetation growth. Incorporating disturbance frequency into the E framework may be particularly important formacroinvertebrate communities (Hawley et al., 2016, Holomuzki and Biggs, 2000, Poff, 1992), Jordt and Taylor, 2021) in the context of climate change withmore intense precipitation events and more prolonged droughts expected in many regions (Hidalgo et al., 2009, Kundzewicz et al., 2018, Stocker, 2014, Swainet al., 2018). Both �eld (Masteller et al., 2019) and �ume (Masteller and Finnegan, 2017) research suggests that the entrainment threshold for a given streamcan change based on the frequency of disturbance, with more time between disturbance events coinciding with riverbed armoring and higher thresholds forbed mobility.
A �nal point to underscore is the roles of space and time in bearing out potential geomorphic recoveries. As indicated by Figure 1, an entrenched channellikely needs to become over-widened (CEM Stage 4) prior to being able to transition to a recovered state (CEM Stage 5). Stormwater interventions thatfacilitate transitions from degradational (CEM Stages 2 and 3) to aggradational (CEM Stage 4) channels will in most cases coincide with at least a temporaryincrease in channel widening. This is not only underscored by the Kentucky case study presented herein (e.g. note the widening in Figure 4B), but is also

Page 9/18
consistent with longer term studies which document the highest rates of widening during CEM Stage 4 when large sediment bars de�ect �ow into alreadyunstable banks that are prone to additional failure. In a 10-year study at 61 sites, Hawley et al. (2020) documented average rates of widening of 17 cm/yr forCEM Stage 4, compared to 9 cm/yr for Stage 3 and just 0.3 cm/yr for Stage 2. Furthermore, settings with fast-growing vegetation may facilitate quickerrecoveries than in semiarid or arid channels. El Nino cycles, drought, �res, and changes in irrigation runoff, among other factors, can also affect the speed andstyles of geomorphic recovery (or lack thereof). All of this reinforces the challenges associated with assessing and monitoring complex channel responsesand the value of having long-term datasets when evaluating the geomorphic effects of hydrologic restoration interventions such as those designed with the Eframework.
Although post-intervention data for geomorphically-effective stormwater interventions are rare, the case studies herein are consistent with well-establishedprinciples of river mechanics (e.g. Biedenharn et al., 2001, Wolman and Miller, 1960) suggesting that the excess sediment transport capacity of the post-developed regime is a degradational mechanism that must be su�ciently managed if equilibrium channels are a goal. Using the E framework to guide andoptimize SCM design and watershed-scale hydrologic restoration may facilitate more meaningful improvements in geomorphic integrity relative tomanagement approaches that do not explicitly account for sediment transport capacity.
Recommendations
The framework and case studies presented here underscore the need for more geomorphic data downstream and upstream of retro�ts and/or green�elddevelopments that are intended to restore/maintain geomorphic equilibrium. Longer-term datasets and more standardized data collection across a gradientof channel and watershed conditions, perhaps collected by regional entities as opposed to representatives of individual projects, could facilitate moreobjective assessments of the e�cacy of SCM designs that minimize E and synthesize regional hydromodi�cation management beyond the project scale. TheE framework could also bene�t from consistency regarding what “predevelopment” implies (e.g. conditions immediately prior to the latest development vs. noimperviousness vs. pre European settlement). The approach should also be assessed via other hydrologic, water quality, and ecological metrics to documentimprovement or lack thereof in other facets of stream condition. For example, if interventions can facilitate a more natural streambed disturbance regime, arethere corresponding signs of recovery in the macroinvertebrate community? Base�ow restoration in humid settings with a history of anthropogenic drainageefforts could be another sign of ecological recovery, whereas arti�cially prolonged �ows in dryland channels could close off channels via vegetationencroachment (e.g. CEM Phase 1Veg in the Hawley et al. (2012) model that was also apparent in the California case study included herein downstream of anorchard). Perennialization is also a potential issue in Melbourne streams (Duncan et al. 2014), which could facilitate invasion by species suited to perennialstreams, displacing ephemeral specialists. A functional �ows approach (e.g. Yarnell et al., 2020) allows managers to target multiple aspects of the annualhydrograph that are tied to ecological, geomorphic, and biogeochemical functions/processes. As with all elements of stream management, we recommendthat managers use the E framework as one aspect of stream management, placed in proper context alongside other stakeholder and ecological managementgoals for urban streams (e.g. Bixler et al., In review, Herrington and Horndeski, In review, Kaushal et al., Forthcoming).
DeclarationsEthics approval: N/A (this research had no human subjects).
Consent for publication: N/A (this research had no human subjects).
Availability of data and materials: comparative study data provided in the tables and �gures within the manuscript. More detailed data and analysis providedin previously published materials cited within this manuscript.
Competing interests: none.
Funding: The data used for the California case study were collected for the development in southern Orange County under the hydromodi�cation managementplan and runoff requirements by the County of Orange. Funding to conduct this comparative study was provided by Southern California Coastal WaterResearch Project. The Kentucky data was funded in part by the USEPA (contract number EP-C-14-012 to C, B, & I Federal Services). SD1 of Northern Kentuckyand the Boone County Conservation District also contributed staff and resources to the data collection. The comparative study of the Kentucky data did nothave any direct support for this manuscript, but indirect support for a related analysis was provided by SD1 (see Hawley (2021)). The Victoria case study wassupported by the Australian Research Council (ARC) Linkage Program (LP0883610 and LP130100295), the Cooperative Research Centre for Water SensitiveCities, Melbourne Waterway Research Practice Partnership (funded by Melbourne Water), Victorian Water Trust, Victorian Urban Stormwater and RecyclingFund, Caring for Our Country Investment Fund, O�ce of Living Victoria, Yarra Ranges Council, and Yarra Valley Water. The funding sources had no directinvolvement in this manuscript.
Author’s contributions: The case studies were compiled by individual authors: Taniguchi-Quan (California), Hawley (Kentucky), and Russell (Victoria). All threeauthors collaborated on the comparative study vision, outline, and overall manuscript, with their relative contributions aligning with author order.
Acknowledgements:
The California case study was conceived by Kris Taniguchi-Quan and Eric Stein. Eric Stein also provided input and reviews during the development of themanuscript. The Kentucky case study was conceived by Bob Hawley, Jim Goodrich, Mark Jacobs, Liz Fet, and Matt Wooten, among other collaborators. TheVictoria case study was conceived and designed by Chris Walsh, Tim Fletcher, Darren Bos and Sam Imberger. Chris Walsh also provided input during thedevelopment of the manuscript.
Author’s information:

Page 10/18
Hawley is a Principal Scientist at Sustainable Streams, LLC, Louisville, KY, USA, [email protected]
Russell is a Research Fellow in the Waterway Ecosystem Research Group in the School of Ecosystem and Forest Sciences at the University of Melbourne,Burnley, VIC, Australia, [email protected]
Taniguchi-Quan is a Scientist at the Southern California Coastal Water Research Project, Costa Mesa, CA, USA, [email protected]
References1. Anim, D. O., Fletcher, T. D., Pasternack, G. B., Vietz, G. J., Duncan, H. P., and Burns, M. J., 2019, Can catchment-scale urban stormwater management
measures bene�t the stream hydraulic environment?: Journal of Environmental Management, v. 233, no. 1 March 2019, p. 1-11.
2. Arizona Department of Water Resources, 1985, Design Manual for Engineering Analysis of Fluvial Systems. Arizona Department of Water Resources.
3. Bevan, V., MacVicar, B., Chapuis, M., Ghunowa, K., Papangelakis, E., Parish, J., and Snodgrass, W. J., 2018, Enlargement and evolution of a semi-alluvialcreek in response to urbanization: Earth Surface Processes and Landforms, v. 43, no. 11, p. 2295-2312.
4. Biedenharn, D. S., Elliott, C. M., and Watson, C. C., 1997, The WES Stream Investigation and Streambank Stabilization Handbook: U.S. Army EngineerWaterways Experiment Station.
5. Biedenharn, D. S., Thorne, C. R., Soar, P. J., Hey, R. D., and Watson, C. C., 2001, Effective discharge calculation guide: International Journal of SedimentResearch, v. 16, no. 4, p. 445-459.
�. Bixler P, Belaire A, Faust K, Scoggins, Gonzales A (In review) 'Exploring the connection between transdisciplinary co-production and urban streamsustainability solutions: A case study at an urban stream management symposium'. Urban Ecosyst.
7. Bledsoe, B. P., 2002, Stream erosion potential associated with stormwater management strategies: Journal of Water Resources Planning andManagement, v. 128, p. 451-455.
�. Bledsoe, B. P., Baker, D. W., Nelson, P. A., Rosburg, T., Sholtes, J., and Stroth, T. R., 2016, Design hydrology for stream restoration and channel stability atstream crossings: Transportation Research Board of the National Academies of Sciences, Engineering, and Medicine, National Cooperative HighwayResearch Program (NCHRP) Project 24-40.
9. Bledsoe, B. P., Stein, E. D., Hawley, R. J., and Booth, D. B., 2012, Framework and tool for rapid assessment of stream susceptibility to hydromodi�cation:Journal of the American Water Resources Association, v. 48, no. 4, p. 788-808.
10. Bledsoe, B. P., and Watson, C. C., 2000, Observed thresholds of stream ecosystem degradation in urbanizing areas: a process-based geomorphicexplanation, in Flug, M. a. F., D., ed., Watershed management 2000: Science and Technology for the New Millennium, American Society of Civl Engineers.
11. Booth, D. B., 1990, Stream-channel incision following drainage-basin urbanization: Water Resources Bulletin, v. 26, no. 3, p. 407-417.
12. Booth, D. B., and Fischenich, C. J., 2015, A channel evolution model to guide sustainable urban stream restoration: Area, v. 47, no. 4, p. 408-421.
13. Booth, D. B., and Henshaw, P. C., 2001, Rates of channel erosion in small urban streams, in Wigmosta, M. S., ed., Land Use and Watersheds: HumanIn�uence on Hydrology and Geomorphology in Urban and Forest Areas, Volume AGU Monograph Series, Water Science and Application 2, p. 17-38.
14. Booth, D. B., and Jackson, C. R., 1997, Urbanization of aquatic systems: Degradation thresholds, stormwater detection, and the limits of mitigation:Journal of the American Water Resources Association, v. 33, no. 5, p. 1077-1090.
15. Booth, D. B., Roy, A. H., Smith, B., and Capps, K. A., 2016, Global perspectives on the urban stream syndrome: Freshwater Science, v. 35, no. 1, p. 412-420.
1�. Bunte, K., and Abt, S. R., 2001, Sampling frame for improving pebble count accuracy in coarse gravel-bed streams: Journal of the American WaterResources Association, v. 37, no. 4, p. 1001-1014.
17. Cain, A., Iannetta, M., Muirhead, C., Papangelakis, E., Raso, T., MacVicar, B., and Ashmore, P., 2020, Tracking the mean annual velocity and vertical mixingof bedload tracers, in Uijttewaal, W., Franca, M. J., Valero, D., Chavarrias, V., Arbós, C. Y., Schielen, R., and Crosato, A., eds., River Flow 2020: Proceedings ofthe 10th Conference on Fluvial Hydraulics (Delft, Netherlands, 7-10 July 2020): Delft, Netherlands, Taylor & Francis Group, p. 371-380.
1�. Chin, A., 2006, Urban transformation of river landscapes in a global context: Geomorphology, v. 79, no. 3-4, p. 460-487.
19. Chin, A., Gidley, R., Tyner, L., and Gregory, K. J., 2017, Adjustment of dryland stream channels over four decades of urbanization: Anthropocene, v. 20, p. 24-36.
20. Galster, J. C., Pazzaglia, F. J., and Germanoski, D., 2008, Measuring the impact of urbanization on channel widths using historic aerial photographs andmodern surveys: Journal of the American Water Resources Association, v. 44, no. 4, p. 948-960.
21. Gomez, B., 1991, Bedload transport: Earth-Science Reviews, v. 31, no. 2, p. 89-132.
22. Hammer, T. R., 1972, Stream channel enlargement due to urbanization: Water Resources Research, v. 8, p. 139-167.
23. Harrelson, C. C., Rawlins, C. L., and Potyondy, J. P., 1994, Stream channel reference sites: an illustrated guide to �eld technique, in U. S. Department ofAgriculture, F. S., Rocky Mountain Forest and Range Experiment Station, ed., Volume Gen. Tech. Rep. RM-245: Fort Collins, CO, p. 61.
24. Harvey, M. D., Watson, C. C., and Schumm, S. A., Channelized streams: An analog for the effects of urbanization, in Proceedings 1983 InternationalSymposium on Urban Hydrology, Hydraulics and Sediment Control, University of Kentucky, Lexington, Kentucky, 1983, p. 401-410.
25. Hawley, R. J., 2018, Making stream restoration more sustainable: A geomorphically, ecologically, and socioeconomically principled approach to bridge thepractice with the science: BioScience, v. 68, no. 7, p. 517-528.
2�. Hawley, R. J., 2021, Expanding catchment-scale hydrologic restoration in suburban watersheds via stream mitigation crediting—A Northern Kentucky(USA) case study: Urban Ecosystems.
27. Hawley, R. J., and Bledsoe, B. P., 2011, How do �ow peaks and durations change in suburbanizing semi-arid watersheds? A southern California casestudy: Journal of Hydrology, v. 405, no. 1-2, p. 69-82.

Page 11/18
2�. Hawley, R.J., and Bledsoe, B.P., 2013, Channel enlargement in semi-arid suburbanizing watersheds: a southern California case study: Journal ofHydrology, v. 496, p. 17-30.
29. Hawley, R. J., Bledsoe, B. P., Stein, E. D., and Haines, B. E., 2012, Channel evolution model of semiarid stream response to urban-inducedhydromodi�cation: Journal of the American Water Resources Association, v. 48, no. 4, p. 722-744.
30. Hawley, R. J., Goodrich, J. A., Korth, N. L., Rust, C. J., Fet, E. V., Frye, C., MacMannis, K. R., Wooten, M. S., and Sinha, R., 2017, Detention outlet retro�t deviceimproves the functionality of existing detention basins by reducing erosive �ows in receiving channels: Journal of the American Water Resources Association, v. 53, no. 5, p. 1032-1047.
31. Hawley, R. J., MacMannis, K. R., and Wooten, M. S., 2013, Bed coarsening, ri�e shortening, and channel enlargement in urbanizing watersheds, northernKentucky, U.S.A.: Geomorphology, v. 201, p. 111-126.
32. Hawley, R. J., MacMannis, K. R., Wooten, M. S., Fet, E. V., and Korth, N. L., 2020, Suburban stream erosion rates in northern Kentucky exceed referencechannels by an order of magnitude and follow predictable trajectories of channel evolution: Geomorphology, v. 352, p. 106998.
33. Hawley, R. J., and Vietz, G. J., 2016, Addressing the urban stream disturbance regime: Freshwater Science, v. 35, no. 1, p. 278-292.
34. Hawley, R. J., Wooten, M. S., MacMannis, K. R., and Fet, E. V., 2016, When do macroinvertebrate communities of reference streams resemble urbanstreams? The biological relevance of Qcritical: Freshwater Science, v. 35, no. 3, p. 778-794.
35. Herrington C, Horndeski K (In review) 'Is urban stream restoration really a wicked problem?', Urban Ecosyst.
3�. Hidalgo, H. G., Das, T., Dettinger, M., Cayan, D., Pierce, D., Barnett, T., Bala, G., Mirin, A., Wood, A., and Bon�ls, C., 2009, Detection and attribution ofstream�ow timing changes to climate change in the western United States: Journal of Climate, v. 22, no. 13, p. 3838-3855.
37. Hollis, G. E., and Luckett, J. K., 1976, The response of natural river channels to urbanization: Two case studies from southeast England: Journal ofHydrology, v. 30, no. 4, p. 351-363.
3�. Holomuzki, J. R., and Biggs, B. J. F., 2000, Taxon-speci�c responses to high-�ow disturbance in streams: implications for population persistence: Journalof the North American Benthologic Society, v. 19, no. 4, p. 670-679.
39. Hopkins, K. G., Bhaskar, A. S., Woznicki, S. A., and Fanelli, R. M., 2020, Changes in event-based stream�ow magnitude and timing after suburbandevelopment with in�ltration-based stormwater management: Hydrological Processes, v. 34, no. 2, p. 387-403.
40. Jordt S., and Taylor, B. W., 2021, A rolling stone gathers no eggs: the importance of stream insect egg laying natural history for stream restoration.Ecology 102(7):e03331.
41. Kaushal S, Fork M, Hawley R, Hopkins K, Rios-Touma B, Roy A (Forthcoming) 'Milestones to evaluating stream restoration successes and failures:Synthesizing the state of the science across time and space', Urban Ecosyst
42. Kundzewicz, Z., Krysanova, V., Benestad, R., Hov, Ø., Piniewski, M., and Otto, I., 2018, Uncertainty in climate change impacts on water resources:Environmental Science & Policy, v. 79, p. 1-8.
43. Lane, E. W., 1955, The importance of �uvial morphology in hydraulic engineering: Proceedings, ASCE, v. 81, no. 745, p. 1-17.
44. Leopold, L. B., Huppman, R., and Miller, A., 2005, Geomorphic effects of urbanization in forty-one years of observation: Proceedings of the AmericanPhilosophical Society, v. 149, no. 3, p. 349-371.
45. MacRae, C. R., 1991, A procedure for design of storage facilities for instream erosion control in urban streams.Doctoral]: University of Ottawa.
4�. MacRae, C.R., 1993, An alternate design approach for the control of instream erosion potential in urban watersheds, in Proceedings Urban StormDrainage: Proceedings of the Sixth International Conference, Niagra Falls, Ontario, Canada, September 12-17, 1993 1993, Volume 2, IAHR/IAWQ JointCommittee on Urban Storm Drainage, p. 1086-1091.
47. MacRae, C. R., 1997, Experience from morphological research on Canadian streams: Is the control of the two-year frequency runoff event the best basisfor stream channel protection?, in Roesner, L. A., ed., Effects of Watershed Development and Management of Aquatic Ecosystems: New York, ASCE, p.144-162.
4�. Masteller, C. C., and Finnegan, N. J., 2017, Interplay between grain protrusion and sediment entrainment in an experimental �ume: Journal of GeophysicalResearch: Earth Surface, v. 122, no. 1, p. 274-289.
49. Masteller, C. C., Finnegan, N. J., Turowski, J. M., Yager, E. M., and Rickenmann, D., 2019, History-Dependent Threshold for Motion Revealed by ContinuousBedload Transport Measurements in a Steep Mountain Stream: Geophysical Research Letters, v. 46, no. 5, p. 2583-2591.
50. Meyer-Peter, E., and Müller, R., Formulas for bed-load transport, in Proceedings Proc. 2nd Meeting International Association for Hydraulic Research,Stockholm, 1948, p. 39-64.
51. Papangelakis, E., MacVicar, B., and Ashmore, P., 2019, Bedload sediment transport regimes of semi‐alluvial rivers conditioned by urbanization andstormwater management: Water Resources Research.
52. Paul, M. J., and Meyer, J. L., 2001, Streams in the urban landscape: Annual Review of Ecology and Systematics, v. 32, p. 333-365.
53. Peel, M. C., Finlayson, B. L., and McMahon, T. A., 2007, Updated world map of the Köppen-Geiger climate classi�cation: Hydrology and earth systemsciences discussions, v. 4, no. 2, p. 439-473.
54. Pizzuto, J. E., Hession, W. C., and McBride, M., 2000, Comparing gravel-bed rivers in paired urban and rural catchments of southeastern Pennsylvania:Geology, v. 28, no. 1, p. 79-82.
55. Poff, N. L., 1992, Why disturbances can be predictable: A perspective on the de�nition of disturbance in streams: Journal of the North AmericanBenthological Society, v. 11, p. 86-92.

Page 12/18
5�. Polvi, L. E., Lind, L., Persson, H., Miranda-Melo, A., Pilotto, F., Su, X., and Nilsson, C., 2020, Facets and scales in river restoration: Nestedness andinterdependence of hydrological, geomorphic, ecological, and biogeochemical processes: Journal of Environmental Management, v. 265, p. 110288.
57. Robinson, A. M., 1976, The effects of urbanization on stream channel morphology, Proceedings of the National Symposium on Urban Hydrology,Hydraulics, and Sediment Control: Lexington, Kentucky, University of Kentucky.
5�. Rosburg, T. T., Nelson, P. A., and Bledsoe, B. P., 2017, Effects of Urbanization on Flow Duration and Stream Flashiness: A Case Study of Puget SoundStreams, Western Washington, USA: JAWRA Journal of the American Water Resources Association, v. 53, no. 2, p. 493-507.
59. Russell, K. L., Vietz, G. J., and Fletcher, T. D., 2017, Global sediment yields from urban and urbanizing watersheds: Earth-Science Reviews, v. 168, p. 73-80.
�0. Russell, K.L., Vietz, G.J., and Fletcher, T.D., 2018, Urban catchment runoff increases bedload sediment yield and particle size in stream channels:Anthropocene, v. 23, p. 53-66.
�1. Russell, K. L., Vietz, G. J., and Fletcher, T. D., 2020, How urban stormwater regimes drive geomorphic degradation of receiving streams: Progress inPhysical Geography: Earth and Environment, v. 44, no. 5, p. 746-778.
�2. Schumm, S. A., Harvey, M. D., and Watson, C. C., 1984, Incised channels: Morphology, Dynamics, and Control, Littleton, Colorado, Water ResourcesPublications.
�3. Simon, A., 1989, A model of channel response in disturbed alluvial channels: Earth Surface Processes Landforms, v. 14, no. 1, p. 11-26.
�4. Simon, A., and Klimetz, L., 2008, Relative magnitudes and sources of sediment in benchmark watersheds of the Conservation Effects Assessment Project:Journal of Soil and Water Conservation, v. 63, no. 6, p. 504-522.
�5. Simon, A., and Rinaldi, M., 2000, Channel instability in the loess area of the midwestern United States: Journal of the American Water Resources Association, v. 36, no. 1, p. 133-150.
��. Simon, A., and Rinaldi, M., 2006, Disturbance, stream incision, and channel evolution: the roles of excess transport capacity and boundary materials incontrolling channel response: Geomorphology, v. 79, p. 361-383.
�7. Somerville, D., and Pruitt, B., 2004, Physical stream assessment: A review of selected protocols for use in the Clean Water Act Section 404 Program:Prepared for the US Environmental Protection Agency, O�ce of Wetlands, Oceans, and Watersheds, Wetlands Division (Order No. 3W-0503-NATX),Washington, DC.
��. Stein, E. D., Federico, F., Booth, D. B., Bledsoe, B. P., Bowles, C., Rubin, Z., Kondolf, G. M., and Sengupta, A., 2012, Hydromodi�cation Assessment andManagement in California: Southern California Coastal Water Research Project.
�9. Stocker, T., 2014, Climate change 2013: the physical science basis: Working Group I contribution to the Fifth assessment report of the IntergovernmentalPanel on Climate Change, Cambridge University Press.
70. Stroth, T. R., Bledsoe, B. P., and Nelson, P. A., 2017, Full spectrum analytical channel design with the capacity/supply ratio (CSR): Water, v. 9, no. 4.
71. Sullivan, J., Grubb, J., Willis, R., Boozer, D., Flickinger, B., and Dixon, C. E., 2020, Cohesive Channel Response to Watershed Urbanization: Insights from theSand River, Aiken SC: Water, v. 12, no. 12, p. 3441.
72. Swain, D. L., Langenbrunner, B., Neelin, J. D., and Hall, A., 2018, Increasing precipitation volatility in twenty-�rst-century California: Nature Climate Change,v. 8, no. 5, p. 427-433.
73. Taniguchi, K. T., and Biggs, T. W., 2015, Regional impacts of urbanization on stream channel geometry: A case study in semiarid southern California:Geomorphology, v. 248, p. 228-236.
74. Taniguchi, K. T., Biggs, T. W., Langendoen, E. J., Castillo, C., Gudino-Elizondo, N., Yuan, Y., and Liden, D., 2018, Stream channel erosion in a rapidlyurbanizing region of the US–Mexico border: documenting the importance of channel hardpoints with Structure-from-Motion photogrammetry: EarthSurface Processes and Landforms, v. 43, no. 7, p. 1465-1477.
75. Trimble, S. W., 1997, Contribution of stream channel erosion to sediment yield from an urbanizing watershed: Science, v. 278, p. 1442-1444.
7�. Utz, R. M., Hopkins, K., Beesley, L., Booth, D. B., Hawley, R. J., Baker, M., Freeman, M. C., and Jones, K., 2016, Ecological resistance in urban streams: therole of natural and legacy attributes: Freshwater Science, v. 35, no. 1, p. 380-397.
77. Vietz, G. J., Sammonds, M. J., Walsh, C. J., Fletcher, T. D., Rutherfurd, I. D., and Stewardson, M. J., 2014, Ecologically relevant geomorphic attributes ofstreams are impaired by even low levels of watershed effective imperviousness: Geomorphology, v. 206, p. 67-78.
7�. Walsh, C. J., Fletcher, T. D., Bos, D. G., and Imberger, S. J., 2015, Restoring a stream through retention of urban stormwater runoff: a catchment-scaleexperiment in a social–ecological system: Freshwater Science, v. 34, no. 3, p. 1161-1168.
79. Walsh, C. J., Roy, A. H., Feminella, J. W., Cottingham, P. D., Groffman, P. M., and Morgan II, R., P., 2005, The urban stream syndrome: current knowledge andthe search for a cure: Journal of the North American Benthological Society, v. 24, no. 3, p. 706-723.
�0. Watson, C. C., Biedenharn, D. S., and Bledsoe, B. P., 2002, Use of incised channel evolution models in understanding rehabilitation alternatives: Journal ofthe American Water Resources Association, v. 38, no. 1, p. 151-160.
�1. White, J. Y., and Walsh, C. J., 2020, Catchment-scale urbanization diminishes effects of habitat complexity on instream macroinvertebrate assemblages:Ecol Appl, v. n/a, no. n/a, p. e2199.
�2. Wilcock, P. R., and Kenworthy, S. T., 2002, A two-fraction model for the transport of sand/gravel mixtures: Water Resources Research, v. 38, no. 10.
�3. Wilson, G. V., Periketi, R. K., Fox, G. A., Dabney, S. M., Shields Jr., F. D., and Cullum, R. F., 2007, Soil properties controlling seepage erosion contributions tostreambank failure: Earth Surface Processes and Landforms, v. 32, p. 447-459.
�4. Wolman, M. G., 1967, A cycle of sedimentation and erosion in urban river channels: Geogra�ska Annaler, v. 49A, no. 385-395.
�5. Wolman, M. G., and Miller, J. P., 1960, Magnitude and frequency of forces in geomorphic processes: Journal of Geology, v. 68, p. 54-74.

Page 13/18
��. Wong, M., and Parker, G., 2006, Reanalysis and Correction of Bed-Load Relation of Meyer-Peter and Müller Using Their Own Database: Journal ofHydraulic Engineering, v. 132, no. 11, p. 1159-1168.
�7. Woockman, R., Schwartz, J., Langedoun, E., Forthcoming. Channel protection best practices – coupling hydrology, hydraulics, and channel evolution. Acase study. Urban Ecosyst.
��. Yarnell, S. M., Stein, E. D., Webb, J. A., Grantham, T., Lusardi, R. A., Zimmerman, J., Peek, R. A., Lane, B. A., Howard, J., and Sandoval‐Solis, S., 2020, Afunctional �ows approach to selecting ecologically relevant �ow metrics for environmental �ow applications: River Research and Applications, v. 36, no.2, p. 318-324.
�9. Yochum, S. E., Sholtes, J. S., Scott, J. A., and Bledsoe, B. P., 2017, Stream power framework for predicting geomorphic change: The 2013 Colorado FrontRange �ood: Geomorphology, v. 292, p. 178-192.
90. Zeiger, S. J., and Hubbart, J. A., 2019, Characterizing Land Use Impacts on Channel Geomorphology and Streambed Sedimentological Characteristics:Water, v. 11, no. 5, p. 1088.
TablesTable 1 - Locations and characteristics of case study sites. TIA = total impervious area.
Casestudy
Stream Lat/Long Drainagearea(km2)
Climatetype (1)
Meanannualrainfall(mm)
Catchmentrelief (m)
Geology Bedsedimentclass
Catchmentland cover
TIA(%)
Nature ofintervention
California CañadaChiquitaCreek
33.5421,
-117.6114
14.4 BSk
(cold semi-arid)
407 286 Sandstoneandmudstone
Sand Historicallyranched,undeveloped:mixed shrub,grassland,orchard,urban, andopen spacedevelopment
5 Hydromodidetention bfor green�edevelopme
Kentucky Unnamedtributary toWoolperCreek
39.0496,
-84.7130
1.3 Cfa(humidtemperate)
1,080 25 Limestoneand shale
Cobble Historicallypasture/forest,with recentindustrialdevelopment
12 Retro�tteddetention boutlet
Victoria LittleStringybarkCreek
-37.7734,145.4111
4.3 Cfb(temperateoceanic)
997 131 Rhyoliteandrhyodacite
Sand Peri-urban:mixedsuburban,ruralresidential,forest andagricultural
14 Retro�tteddistributedmeasures (rainwater tarain garden
(1) (Peel et al., 2007)
Table 2 – Method summary for case studies
Casestudy
Transport capacity equation Flow integration method Comparison method Reference
California van Rijn (1984a, 1984b)
with modi�cations by Spasojevic & Holly(1994)
Range of design events integratedover a �ow-frequency curve
Modelled �ow scenarios (Phillips etal., 2013)
Kentucky Meyer-Peter and Müller (1948) with Wongand Parker (2006) corrections
Largest 22 events over 40-year period Modelled �ow scenarios (Hawley etal., 2017)
Victoria Wilcock and Kenworthy (2002) Continuous stream gage data (10-year record)
Before-after control-reference-intervention (BACRI) gaged �ows
(Russell etal., 2020)
Table 3 – Case study sediment sizes, sediment transport ratios, and qualitative assessment of geomorphic recovery

Page 14/18
BedSediment Class
d50(mm)
Erosion Potential (E) Induced/Maintained Trajectory of GeomorphicRecovery?
Pre-intervention
Post-intervention
%Change
Southern CA NewDevelopment(1)
Sand < 2 1.0 1.0 - Yes
Kentucky Retro�t(2) Cobble 74 18.2 10.7 -42% Yes
Victoria Retro�t(3) Sand < 2 8.6 9.7 13% No
(1) Based on SCM design and sediment transport modeling at a vegetated channel as selected by an outside consultant. “Pre-intervention” and “post-intervention” use the same standard design storms for pre-development and post-development conditions (with SCMs). See Phillips et al. (2013) for moredetail.
(2) “Pre-intervention” and “post-intervention” use the same real events (the top 22 events over a 40-year record) to compare pre-retro�t and post-retro�t sedimenttransport capacity as standardized by the undeveloped sediment transport capacity for the same storms. See Hawley et al. (2017) for more detail.
(3) The “pre-intervention” period in the Victoria case study captures the 5-year retro�t installation phase (2010-2014) whereas the “post-intervention” period(2015-2019) includes nominal changes in retro�t installations. E was calculated as the cumulative sediment transport of the retro�t watershed divided by thatof the reference watershed, standardized on a tons/km2 basis. See Russell et al. (2020) for more detail.
Figures
Figure 1
Channel Evolution Model (CEM) adapted from Schumm et al. (1984) and Hawley et al. (2012). The goal of hydrologic-based geomorphic restoration is tofacilitate a return to equilibrium (Stage 5 in this CEM).

Page 15/18
Figure 2
Erosion potential (E) framework.

Page 16/18
Figure 3
Alternatives analysis from a northern Kentucky watershed comparing the in�uence of retro�t alternatives on the hydrographs and sediment transport capacityfor the 2-year discharge. Alternatives that minimize the departure from predeveloped (reference) conditions for all disturbance-inducing events have a betterchance at facilitating geomorphic recovery than alternatives that do not appreciably reduce E.
Figure 4
Time series surveys at case study cross sections in California (A), Kentucky (B), and Victoria (C).
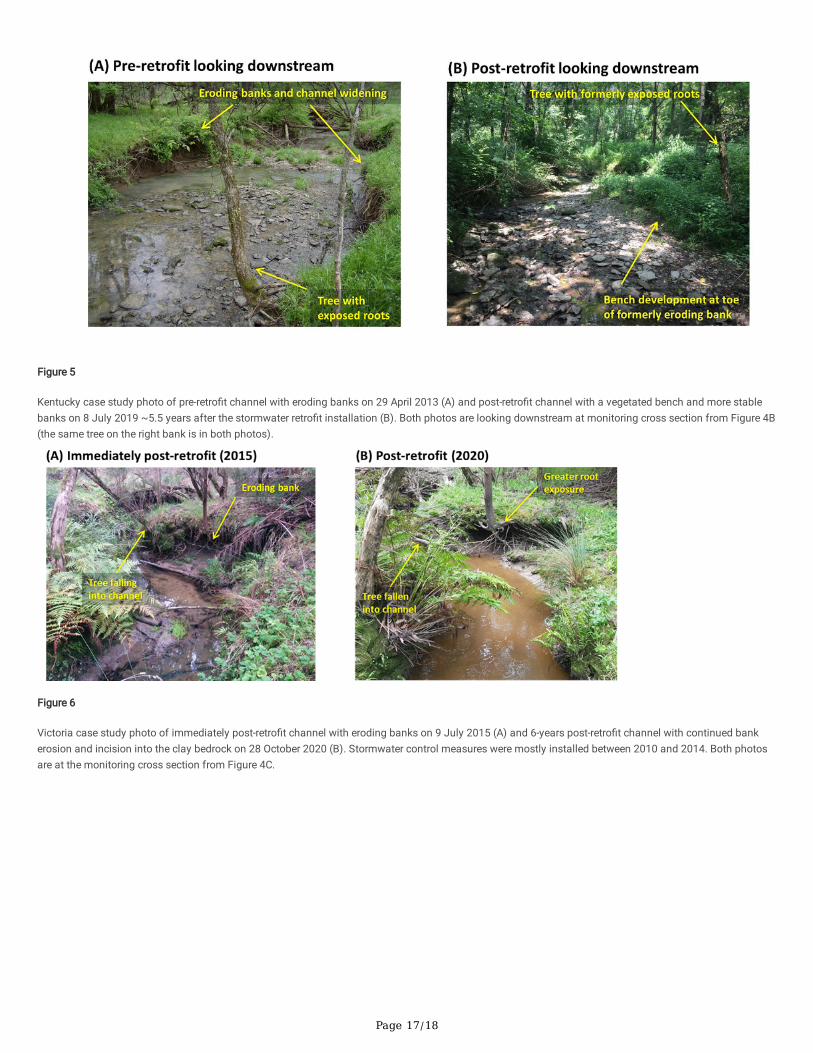
Page 17/18
Figure 5
Kentucky case study photo of pre-retro�t channel with eroding banks on 29 April 2013 (A) and post-retro�t channel with a vegetated bench and more stablebanks on 8 July 2019 ~5.5 years after the stormwater retro�t installation (B). Both photos are looking downstream at monitoring cross section from Figure 4B(the same tree on the right bank is in both photos).
Figure 6
Victoria case study photo of immediately post-retro�t channel with eroding banks on 9 July 2015 (A) and 6-years post-retro�t channel with continued bankerosion and incision into the clay bedrock on 28 October 2020 (B). Stormwater control measures were mostly installed between 2010 and 2014. Both photosare at the monitoring cross section from Figure 4C.

Page 18/18
Figure 7
Typical southern California example of incision and bank failure observed in �ne-grained channels downstream of conventional development (27% TIA,developed in the 1980’s) that lack stormwater intervention tailored at reducing sediment transport capacity.
Figure 8
The risk of channel enlargement increases with the sediment transport capacity ratio (E) and decreases with the median particle size (d50), adapted fromHawley and Bledsoe (2013).