stormwater utility feasibility study
TRANSCRIPT
STORMWATER UTILITY FEASIBILITY STUDY A D D E N D U M 2 . S E A L E V E L R I S E
PREPARED BY RUTGERS UNIVERSITY
APRIL 2007 CONFIDENTIAL
FIRST DRAFT

A GIS-BASED APPROACH FOR MODELING IMPACTS OF SEA LEVEL RISE IN THE HACKENSACK
MEADOWLANDS
Introduction Global warming is believed to be increasing sea levels, while at the same time changing the patterns and intensity of storm events. The flooding problems currently facing the New Jersey Meadowlands District (hereafter the “District”) will be exacerbated by both these factors. To determine the extent that flooding events in the District might be affected by sea level rise, we have utilized current short-term predictions of New York/New Jersey (NY/NJ) area sea level rise, existing New Jersey Meadowlands Commission (NJMC) parcel data, GIS information, and computerized simulation to describe the potential issues facing the District as a result of global warming trends. Sea levels in the NY/NJ metropolitan region have risen 0.23-0.38 cm per year, or a total of approximately 25 cm (10 inches) over the last 100 years (CIG 2001). This rise, which appears to be escalating, is due to both ongoing geologic subsidence since the end of the last glacial period and the global warming trend observed since the 20th century. In the NY/NJ metropolitan region it is predicted that sea level rise will continue to escalate by as much as 29.7 cm (over 10”) by the 2020’s, 60.2 cm (over 2 ft.) by the 2050’s, and 108 cm (over 3 ft.) by the 2080’s (CIG 2001). The threat of sea level rise is especially significant in the District, which contains an extremely high degree of urbanization that was built within the low-lying flood plain that abuts the Hackensack River tidal marshes and wetlands. Within the District, stormwater sewers, levees, pump stations, and tide gates are used to control the tidal effects of the Hackensack River that bisects the District, the stormwater generated by impervious surfaces in and surrounding the District, and the water stored in the approximately 8,400 acres of District wetlands. During precipitation events, flooding on both roadways and on private commercial and residential properties is currently a problem in many sections of the District, and a further rise in sea levels would exacerbate the number of District flooding events. Future infrastructure planning and engineering designs must take into account the effects of sea level rise over the projected lifetime of new and existing water control projects. With these concerns in mind, an analysis was performed to visualize the general effects throughout the District of sea level rise. Using existing information, including mean high water levels and 25-year storm surge elevations, a digital elevation model (DEM) was developed in ArcGIS to delineate District flood zones. Land cover and New Jersey Meadowlands Commission (NJMC) parcel data were used to describe present flooding in the District and to characterize potential flooding associated with the sea level rise of 25 cm that is projected to occur within the next two decades.
2

Methods Determination of Event Sea Surface Elevations Fifty years of hourly water level records were obtained from the National Oceanographic and Atmospheric Administration (NOAA) for the tide station at the Battery in New York (NOAA Tide Gauge #8518750). This record was then used to predict the tidal elevations in the Hackensack River at Carlstadt, New Jersey (NOAA Tide Gauge #8530528). The first step in this process was to remove the effects of sea level rise by running a five month high pass filter on the data. The remaining record was then partitioned into tidal and non tidal portions using a 30-hour low pass filter. The tidal portion was multiplied by a factor of 1.26 because according to NOAA, high tide at Carlstadt is 59 minutes after high tide at the Battery and is 1.26 times higher. The non-tidal portion was then added to the adjusted tidal portion. The resulting record was then analyzed to obtain the probability distribution of high water at the tide gauge in Carlstadt. The resulting distribution represents approximately fifty years of high tide sea surface observations independent of sea level rise. The distribution was then related to mean sea level for the 1960-1978 epoch and the 1982-2001 epoch as measured by NOAA, and a predicted sea level rise of 25 cm (present through 2020). In order to assess the effects of sea level rise, the sea surface elevation was determined for storm events with a frequency of one year, two years, ten years and twenty five years. The results are summarized in Table 1. It should be emphasized that these water level predictions are based upon measurements collected at the Battery in New York and adjusted to a point on the Hackensack River in Carlstadt, New Jersey. These water level predictions do not take into account any surface runoff.
Benchmark Epochs and High Tide Sea Surface Elevation (feet)
Events 1960-1978 1983-2001 25 cm rise
1 Year 6.1 6.3 7.1 2 Year 6.7 6.9 7.7 10 Year 7.6 7.8 8.6 25 Year 7.8 8.0 8.8
Table 1: Adjusted sea level elevations at Carlstadt, New Jersey
From the table above, it can be seen that the twenty five year high tide event that occurred from 1960 through 1978 is currently a ten year high tide event, and will likely become a two year high tide event under the conditions of the 25 cm projected sea level rise.
3
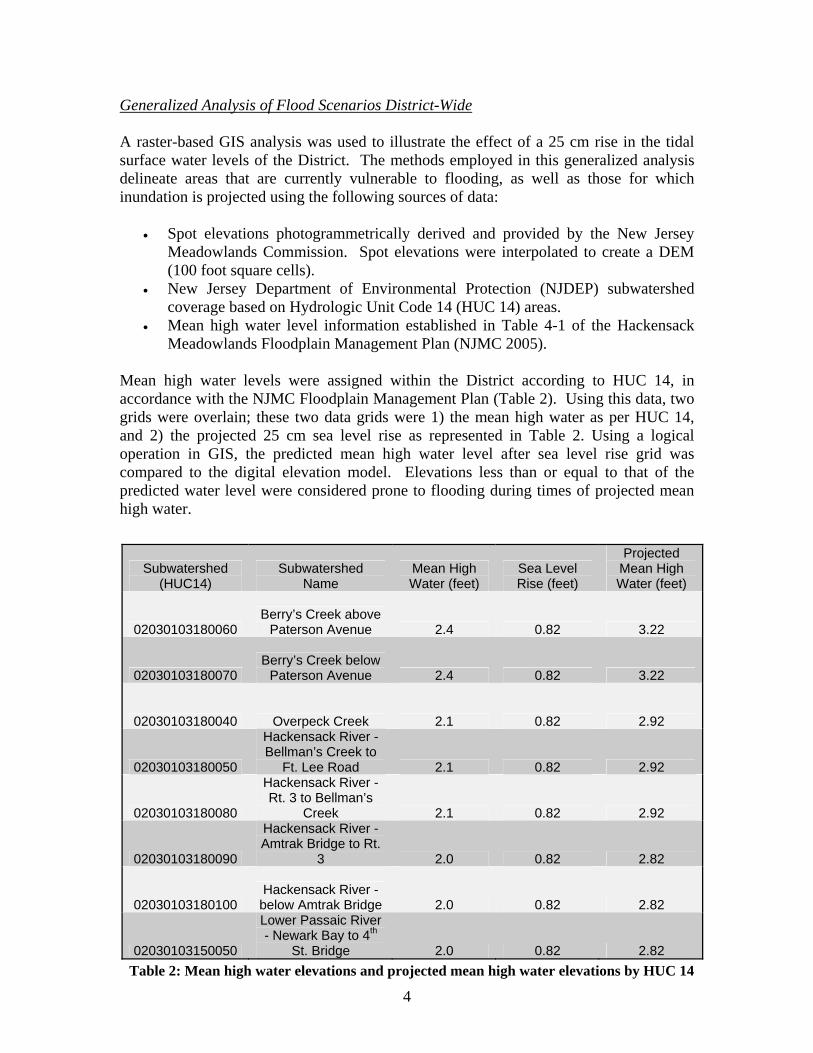
Generalized Analysis of Flood Scenarios District-Wide A raster-based GIS analysis was used to illustrate the effect of a 25 cm rise in the tidal surface water levels of the District. The methods employed in this generalized analysis delineate areas that are currently vulnerable to flooding, as well as those for which inundation is projected using the following sources of data:
• Spot elevations photogrammetrically derived and provided by the New Jersey Meadowlands Commission. Spot elevations were interpolated to create a DEM (100 foot square cells).
• New Jersey Department of Environmental Protection (NJDEP) subwatershed coverage based on Hydrologic Unit Code 14 (HUC 14) areas.
• Mean high water level information established in Table 4-1 of the Hackensack Meadowlands Floodplain Management Plan (NJMC 2005).
Mean high water levels were assigned within the District according to HUC 14, in accordance with the NJMC Floodplain Management Plan (Table 2). Using this data, two grids were overlain; these two data grids were 1) the mean high water as per HUC 14, and 2) the projected 25 cm sea level rise as represented in Table 2. Using a logical operation in GIS, the predicted mean high water level after sea level rise grid was compared to the digital elevation model. Elevations less than or equal to that of the predicted water level were considered prone to flooding during times of projected mean high water.
Subwatershed (HUC14)
Subwatershed Name
Mean High Water (feet)
Sea Level Rise (feet)
Projected Mean High Water (feet)
02030103180060 Berry’s Creek above
Paterson Avenue 2.4 0.82
3.22
02030103180070 Berry’s Creek below
Paterson Avenue 2.4 0.82
3.22
02030103180040 Overpeck Creek 2.1 0.82
2.92
02030103180050
Hackensack River - Bellman’s Creek to
Ft. Lee Road 2.1 0.82
2.92
02030103180080
Hackensack River - Rt. 3 to Bellman’s
Creek 2.1 0.82
2.92
02030103180090
Hackensack River - Amtrak Bridge to Rt.
3 2.0 0.82
2.82
02030103180100 Hackensack River -
below Amtrak Bridge 2.0 0.82
2.82
02030103150050
Lower Passaic River - Newark Bay to 4th
St. Bridge 2.0 0.82 2.82 Table 2: Mean high water elevations and projected mean high water elevations by HUC 14
4

This analysis provided a baseline for understanding flood zones within the District based purely on elevation and without the presence of any water control infrastructure (Fig. 1). This initial analysis based solely on elevation obviously does not describe current conditions because the District stormwater runoff and tidal effects are highly managed by the use of sewers, levees, pump stations, and tide gates. Yet even with these controls in place, there are confirmed flooding problems (NJMC 2006) within the District (Figs. 2, 3). Please note that the parcels identified as flooding in Figure 2 are only those properties where the owners have complained of flooding. It is highly likely that other parcel also flood in the district, but that no formal complaints have been made.
Fig. 1. Extent of District mean high tide flood zones minus the presence of existing flood control structures.
5

Fig. 2. Currently documented areas of District flooding (NJMC 2006).
6

Should the projected sea level rise of 25 cm occur, these existing structures will cease to be effective in preventing widespread District flooding during mean high tide (see tide gate discussion below).
Fig. 3. Moonachie flooding event March 2007 Stress of Sea Level Rise on Existing Infrastructure Currently, the District has an elaborate system of aging infrastructure that includes catch basins, storm sewer pipes, tidal gates and drainage ditches. This system was designed to minimize flooding throughout the District. The system was constructed in a piecemeal fashion over a period of many years, and it is probable that these structures affect each other during times of storm events or tidal surges. For the most part, tidal gates are the system that keeps the flood waters from inundating the commercial, industrial and residential properties within the District on a daily basis. If these gates were not in place, the District would experience the flooding shown in Fig. 1 during every high tide because the water would simple back up into the storm sewer system, thereby flooding low lying areas of the District. To understand the vulnerability of the District to see level rise, it is necessary to understand how the tide gates currently function (Fig. 4). Typically, a tidal gate is a metal flap attached to the end of a pipe or piping network. As the river rises, the gate prevents water from flushing back into the piping system. When it rains, the stormwater runoff builds up in the piping system until the water’s elevation reaches a level high enough to force the tidal gate to open and allow the water to discharge to the river. This difference in water elevation between the piping systems and the river is typically referred to as the “hydraulic head” needed to open the gate. The hydraulic head needed to open a tidal gate can range from several inches to one foot. Using the example
7

illustrated in Fig. 4 the depth in the catch basin needs to be as much as one foot higher than the depth in the river to open the tidal gate and allow stormwater to discharge from the catch basin and the piping network that is connected to the catch basin.
8

Figure 5 illustrates how the existing tidal gates would be expected to function if sea level were to rise 25 cm. The same amount of hydraulic head would be required to open the tidal gate as shown in Fig. 4, but since the river water level is now 25 cm higher, the water surface in the catch basin would have to also rise an equal 25 cm before the gate would open. In this example (Fig. 5), the stormwater would have to overflow into the parking lot before the tidal gate could open because the catch basin is too shallow to accommodate an increase of 25 cm in the water depth. These conditions would be exacerbated during storm surges and large rain fall events when the river is even higher than the 25 cm rise attributable to sea level increase. The stormwater runoff simply will have no way of getting out of the District into the surrounding wetlands. If this happens consistently throughout the District and these tidal gates are rendered less effective by sea level rise, ultimately flooding throughout the district would likely resemble the flooding shown in Fig. 1, with additional areas inundated due to the 25 cm rise in sea level (Fig. 6). The example illustrated in Figs. 4, 5 and 6 is meant to demonstrate some basic hydrologic concepts and to show a possible approach that could be used to analyze the flooding effects associated with sea level rise in the District. In actuality, the District contains a complex drainage network and water control infrastructure, which would need to studied and evaluated in a dynamic fashion. This requires looking not only at how each area would be affected by a sea level rise, but also at how these areas interact with each other; and finally, superimposing storm surges and large storm events on top of the effects associated with a sea level rise.
9

10

Fig. 6. Possible extent of mean high tide District flood zones after a 25 cm sea level rise with existing tidal gates rendered ineffective due to sea level rise.
11

Conclusions Using the methods described above, it is apparent from this analysis that sea level rise will exacerbate existing flooding issues and increase the areas in the District where inundation cannot be controlled by the existing infrastructure. In the case of extreme flood events, the reoccurrence interval between extreme river discharge storm events (i.e. the return period) will become smaller, indicating that the District will have more extreme events more frequently. This more frequent flooding leads to further stress on engineering controls, as well as producing the negatives associated with flooding that are endured by business-owners and residents in the District. We point out that this analysis does not consider water quality problems associated with increased flooding events, and does not include the impact of surface runoff – we have only considered the effects of sea level rise on water levels in the Hackensack River in combination with high mean tidal events. This preliminary analysis demonstrates the potentially large negative effects a sea level rise of 25 cm will have on current flooding problems within the District. Our GIS-based model demonstrates the importance of a full District evaluation to determine where sea level rise will exacerbate current flooding problems throughout the District. The District’s hydrology is far more complex and is heavily impacted by stormwater runoff and natural and manmade topography. The high tide elevations predicted in this analysis last for only a short time (hours) as compared to flood events, which may last for days. In order to make this a more robust analysis, it is recommended that these tidal predictions be used as boundary conditions within a watershed model.
Recommendations
A dynamic model needs to be constructed to examine the effect of sea level rise on the existing infrastructure. The effect of sea level rise on existing infrastructure (Fig. 5) could occur in various areas of the District, and needs to be fully evaluated to determine if measures can be put into place to limit the potential for flooding. Existing models of the current infrastructure in the District may be available and could be modified to incorporate these concepts to provide a long-term forecast of problem areas. This effort will be crucially important should the District move forward with the development of a Stormwater Utility that would be charged with managing flooding throughout the District.
12

References CIG. 2001. Climate Impacts Group. Climate Change and a Global City - The Potential
Consequences of Climate Variability and Change. A Report for the Columbia Earth Institute, Columbia University. New York, NY.
Cooper, M. J.P., Beevers, M.D., Oppenheimer, M. 2005. Future Sea Level Rise and the New
Jersey Coast – Assessing Potential Impacts and Opportunities. A Report for the Woodrow Wilson School of Public and International Affairs, Princeton University. Princeton, NJ.
New Jersey Meadowlands Commission (NJMC). 2005. Hackensack Meadowlands
Floodplain Management Plan. Prepared for the National Flood Insurance Program Community Rating System Activity 510 Guidelines. Lyndhurst, NJ.
13