str-975: effect of shear span to depth ratio on seismic
TRANSCRIPT
RESILIENT INFRASTRUCTURE June 1–4, 2016
STR-975-1
EFFECT OF SHEAR SPAN TO DEPTH RATIO ON SEISMIC
PERFORMANCE OF REINFORCED MASONRY SHEAR WALLS
Hany M. Seif ElDin
PhD Candidate, Concordia University, Canada
Khaled Galal
Professor, Concordia University, Canada
ABSTRACT
Over the past few decades there has been a substantial increase in the number of multi-story buildings constructed
with reinforced masonry (RM). Similar to reinforced concrete (RC) buildings, shear walls are a popular lateral load
resisting system in regions of high seismic activity due to its capability to provide lateral stiffness, strength and
energy dissipation. One of the parameters that affects the inelastic behaviour and ductility of RM shear walls is the
shear span to depth ratio, M/Vdv. This paper experimentally investigates the effect of M/Vdv on the seismic
performance of RM shear walls that are dominated by diagonal shear failure. The experimental work involves two
identical full-scale fully grouted rectangular RM shear walls, W-M/Vdv1.2 and W-M/Vdv1.8, tested under in-plane
axial compressive stress and cyclic lateral excitations. Wall W-M/Vdv1.8 was subjected to a top moment so that
M/Vdv was equal to 1.875, as compared to a value of 1.25 for wall W-M/Vdv1.2 that was tested without a top
moment. Most of the existing design equations for nominal in-plane shear strength, Vn, for RM shear walls,
including the current provisions of the Canadian Standards CSA S304-14, the Masonry Standards Joint Committee
MSJC (2013), and the New Zealand code (2004) for masonry structures, limit the effect of the M/Vdv to an upper
value of 1.0. The test results show a significant reduction of 25% in the shear strength when M/Vdv is increased,
which means that limiting the effect of M/Vdv to an upper value of 1.0 is overestimating the Vn of RM shear walls at
high values of M/Vdv. However, W-M/Vdv1.8 was able to achieve higher levels of displacement ductility. More
results were analyzed and are presented in this paper according to force-based, displacement-based, and
performance-based seismic design considerations.
Keywords: Reinforced masonry; Shear walls; Seismic performance; Shear span to depth ratio.
1. INTRODUCTION
Masonry structural walls are key structural elements commonly used to resist lateral loads in masonry buildings.
Post-earthquake reconnaissance and experimental research work (Sveinsson et al., 1985; Matsumura, 1986; Shing et
al., 1990) have shown that there are several failure modes for masonry shear walls such as:
1. Flexural failure (including flexural cracks, yielding of longitudinal reinforcement, and crushing of masonry);
2. Shear failure (diagonal tension cracking, yielding of transversal reinforcement, and sliding); and
3. Flexural/shear failure.
The shear span to depth ratio, M/Vdv, is one of the parameters that have a considerable effect on the inelastic
behaviour of RM shear walls and the demand level of ductility. Furthermore, it is a good numerical indicator for the
interaction between flexural behaviour and shear behaviour. Anderson and Priestley (1992) proposed the first
effective equation that considered Vn as the sum of three independent terms provided by: masonry, Vm, axial
compression load, Vp, and horizontal reinforcement, Vs. However, the equation proposed by Anderson and Priestley
(1992) did not consider the effect of the shear span to depth ratio, M/Vdv, or the wall aspect ratio, hw/lw, on Vn. They
explained that all the walls in their data sets for calibrating their proposed equation had a height to width ratio, hw/lw,
greater than 1.0 with most of them ranging between 1.0 and 1.6. The walls tested by Shing et al. (1990) had single
STR-975-2
curvature bending with hw/lw equal to 1.0, while tests by Sveinssion et al. (1985) and Matsumura (1986) had double
curvature bending with equal top and bottom moments, where M/Vdv was less than one for most of their tested
walls. Since their proposed equation did not appear to fit one set of data better than the other, they concluded that the
in-plane shear behaviour of RM shear walls with hw/lw greater than unity is not affected by the wall aspect ratio.
On the other hand, most of the existing design equations for the nominal in-plane shear strength, Vn, for RM shear
walls, including the current provisions of the Canadian Standards CSA S304-14, the Masonry Standards Joint
Committee MSJC (2013), and the New Zealand code (2004) for masonry structures, consider a reduction in the
masonry contribution, Vm, by increasing M/Vdv. However, M/Vdv is limited to an upper value of 1.0. This upper limit
could be explained by all of the proposed equations having been developed based on the results of experimental
work. The majority of the tested RM walls from this experimental data had a shear span to depth ratio, M/Vdv, less
than 1.5 due to the limitations in the height of the testing machine. To investigate the behaviour of shear walls with
higher values of M/Vdv, recent research was conducted on half scale concrete blocks (Banting and El-Dakhakhni,
2012) or by applying a top moment on RC shear walls (El-Sokkary and Galal, 2013) as used in this paper. More
discussion about the different equations for Vn, including the design equations given in CSA S304-14 and MSJC-
2013, is presented in Seif ElDin and Galal (2015).
2. EXPERIMENTAL PROGRAM
To study the effect of the shear span to depth ratio, M/Vdv, on the seismic performance of RM shear walls, two
identical RM walls W-M/Vdv1.2 and W-M/Vdv1.8 were tested without and with a top moment respectively. Both
walls had the same dimensions of 1.8 m x 1.6 m x 0.19 m and were subjected to a cyclic lateral load at a height of
1.8 m from the base RC footing to have a minimum height-to-length ratio, hw/lw, equal to 1.0. Most of the masonry
design codes classify shear walls based on hw/lw. The Canadian Standards CSA S304-14 provide special provisions
for seismic design of low-aspect-ratio (squat) shear walls with hw/lw less than 1.0. Wall W-M/Vdv1.8 was subjected
to a top moment of 0.9V kN.m, where V is the lateral load from the horizontal actuator, which makes the shear span
to depth ratio, M/Vdv, and the overall height-to-length ratio, hw/lw, equal to 1.875, 1.5 as compared to values of 1.25,
1.0 for wall W-M/Vdv1.2, respectively. The two walls were vertically reinforced with 20M bar in each cell with a
vertical reinforcement ratio, ρv, of 0.79%, in addition to uniformly vertical distributed horizontal reinforcement of
10M@400 mm c/c, ρh = 0.13%. The horizontal reinforcement bars were hooked using a standard 180° bend around
the outermost wall flexural reinforcing bars. A constant axial compressive stress of 1.0 MPa was applied to the
studied walls before subjecting them to in-plane cyclic lateral displacements and it remained constant during the
whole test. Table 1 summarizes the design details of the tested walls. The tested walls and the required auxiliary
specimens were constructed in the structures laboratory at Concordia University with the help of certified masons
following all the requirements of the Canadian Standards CSA S304-14 and CSA A179-14.
Table 1: Full-scale masonry walls design details
Wall ID Wall dimensions Reinforcement Axial
stress
σn
Applied
top
Moment
M/Vdv**
Height
hw
Length
lw
Width
bw
Vertical Horizontal
mm mm mm --- --- MPa kN.m ---
W-M/Vdv1.2 1600 1800 190 20M@200 10M@400 1.0 0.0 1.25
W-M/Vdv1.8 1600 1800 190 20M@200 10M@400 1.0 0.9V* 1.875 * V = the lateral load from the horizontal actuator ** dv = 0.8lw (as defined in CSA S304-14)
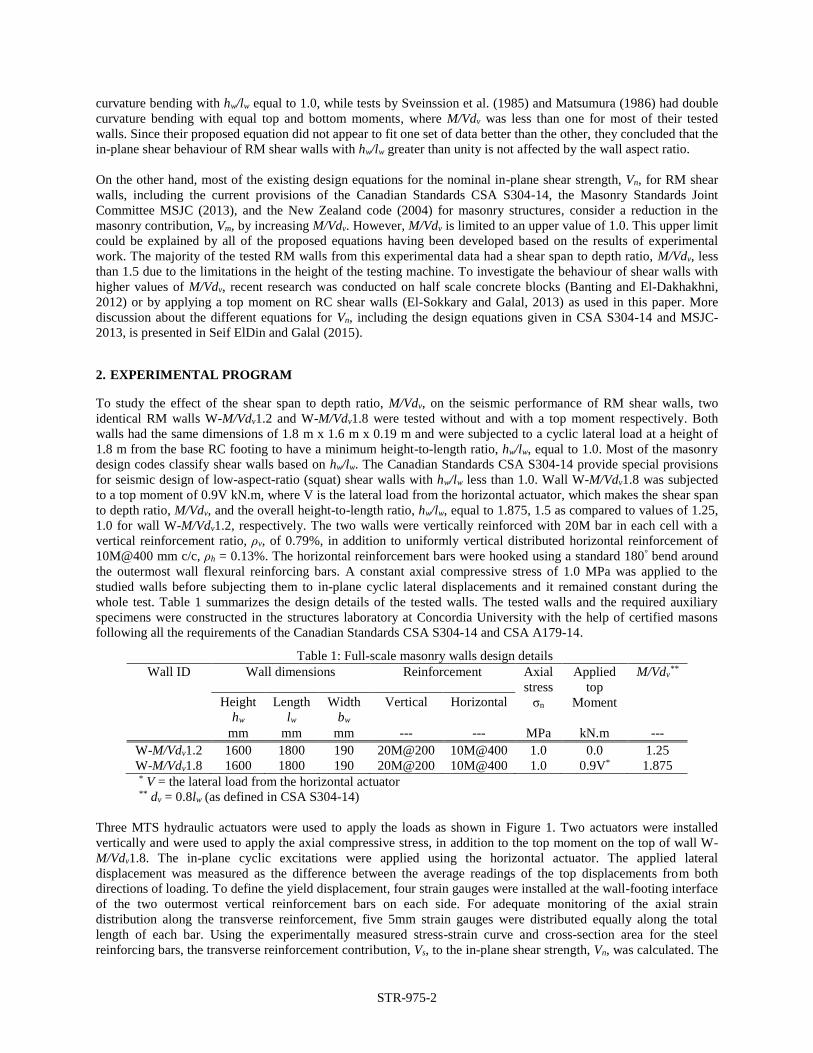
Three MTS hydraulic actuators were used to apply the loads as shown in Figure 1. Two actuators were installed
vertically and were used to apply the axial compressive stress, in addition to the top moment on the top of wall W-
M/Vdv1.8. The in-plane cyclic excitations were applied using the horizontal actuator. The applied lateral
displacement was measured as the difference between the average readings of the top displacements from both
directions of loading. To define the yield displacement, four strain gauges were installed at the wall-footing interface
of the two outermost vertical reinforcement bars on each side. For adequate monitoring of the axial strain
distribution along the transverse reinforcement, five 5mm strain gauges were distributed equally along the total
length of each bar. Using the experimentally measured stress-strain curve and cross-section area for the steel
reinforcing bars, the transverse reinforcement contribution, Vs, to the in-plane shear strength, Vn, was calculated. The
STR-975-3
loads were applied in two phases. In the first phase, the total vertical compression load was applied using load-
control protocol. The test protocol was switched to displacement-control in the second phase, by introducing in-
plane lateral displacements at the middle height of the loading steel beam, following the loading histories proposed
by FEMA 461 (2007). In each stage of lateral loading, two displacement cycles were completed for each target
displacement increment. More details about the material properties, test setup, instrumentations, and test protocol
can be found in Seif ElDin and Galal (2015).
Reaction steel frame
Vertical actuators
Horizontal actuator
Wall specimen
Steel loading beam
Out of plane
lateral supports
Strong RC floor
Rigid RC footing
Figure 1: Test setup
3. EXPERIMENTAL RESULTS
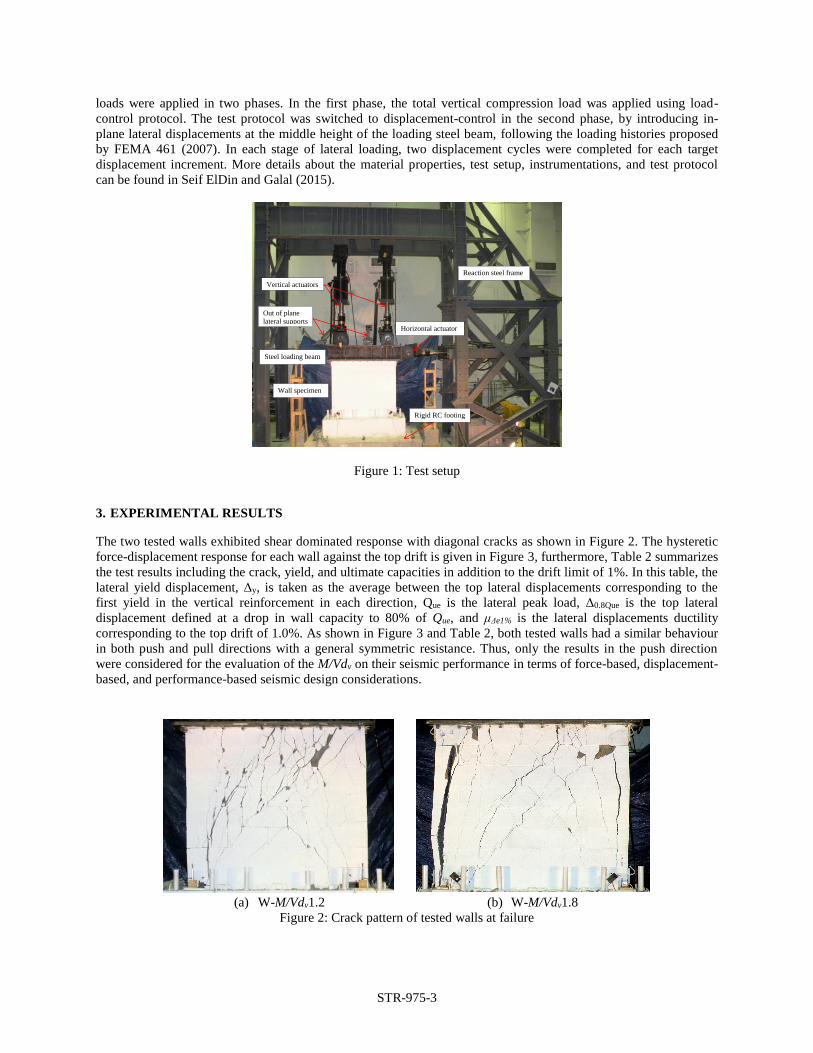
The two tested walls exhibited shear dominated response with diagonal cracks as shown in Figure 2. The hysteretic
force-displacement response for each wall against the top drift is given in Figure 3, furthermore, Table 2 summarizes
the test results including the crack, yield, and ultimate capacities in addition to the drift limit of 1%. In this table, the
lateral yield displacement, Δy, is taken as the average between the top lateral displacements corresponding to the
first yield in the vertical reinforcement in each direction, Que is the lateral peak load, Δ0.8Que is the top lateral
displacement defined at a drop in wall capacity to 80% of Que, and μΔe1% is the lateral displacements ductility
corresponding to the top drift of 1.0%. As shown in Figure 3 and Table 2, both tested walls had a similar behaviour
in both push and pull directions with a general symmetric resistance. Thus, only the results in the push direction
were considered for the evaluation of the M/Vdv on their seismic performance in terms of force-based, displacement-
based, and performance-based seismic design considerations.
W-Ref
W-ρh0
W-σn0
W-σn1.5
W-M/Vdv1.8
W-Ref
W-ρh0
W-σn0
W-σn1.5
W-M/Vdv1.8
W-90°
W-Str
W-Sv800
W-Sh800
(a) W-M/Vdv1.2 (b) W-M/Vdv1.8
Figure 2: Crack pattern of tested walls at failure

STR-975-4
-1.5 -1 -0.5 0 0.5 1 1.5
-500
-400
-300
-200
-100
0
100
200
300
400
500
-24 -20 -16 -12 -8 -4 0 4 8 12 16 20 24
Top drift (%)L
ater
al F
orc
e, Q
e(k
N)
Lateral Displacement, ∆e (mm)
First major diagonal shear crack
Yield point
W-M/Vdv1.2 Push
Pull
Qu = +418 kN
Qu = -409 kN
0.8Qu
0.8Qu
-1.5 -1 -0.5 0 0.5 1 1.5
-500
-400
-300
-200
-100
0
100
200
300
400
500
-24 -20 -16 -12 -8 -4 0 4 8 12 16 20 24
Top drift (%)
Lat
eral
Fo
rce,
Qe
(kN
)
Lateral Displacement, ∆e (mm)
First major diagonal shear crack
Yield point
W-M/Vdv1.8 Push
Pull
Qu = +315 kN
Qu = -290 kN
0.8Qu
0.8Qu
(a) W-M/Vdv1.2 (b) W-M/Vdv1.8
Figure 3: Lateral load-displacement hysteretic relationships and the backbone envelopes of tested RM shear walls
Table 2: Summary of test results
Wall ID
Test Results
Yield Peak Failure Displacement ductility First crack*
Qye ye Que Que 0.8Que µQue µ0.8Que µe1% FCe QFCe
(kN) (mm) (kN) (mm) (mm) (mm) (kN)
W-M/Vdv1.2 328 4.7 418 14.0 19.7 3.0 4.2 3.4 3.2 272
-339 -4.7 -409 -14.0 -19.4 3.0 4.1 3.4 -2.9 -274
W-M/Vdv1.8 230 3.8 315 10.0 19.8 2.6 5.2 4.2 3.2 216
-225 -3.7 -290 -10.0 -19.2 2.7 5.3 4.4 -3.0 -210
* First major diagonal crack
3.1 Force-Based Design
Force-Based Design (FBD) is one of the current approaches for seismic design, which is widely used in many
modern seismic codes including the National Building Code of Canada (NBCC 2010). In this approach, the
behaviour of structures is simulated by a single-degree-of-freedom (SDOF) system. As such, the design seismic base
shear is obtained from the estimated equivalent fundamental mode period and the mass of structure participating in
the first mode. The design force from this approach is mostly limited by a certain level of deformation in terms of
ductility or inter-story drifts. Most of the existing equations for the nominal in-plane shear strength of RM shear
walls, Vn, consider it as the sum of three independent terms provided by: masonry, Vm, axial compressive stress, Vp,
and horizontal reinforcement, Vs. The measured strain readings along the horizontal reinforcement were used to
calculate Vs. Next, the sum of the contributions from the masonry and axial compressive stress Vm+p was calculated
as the difference between Vn and Vs.
The test results presented in Figure 4 show a reduction in the achieved ultimate force, Que, of 25% due to increasing
M/Vdv from 1.25 to 1.875. This loss in the shear resistance is accompanied by enhancement in the displacement
ductility, 0.8Qu, from 4.2 to 5.2. However, the crack strength of wall W-M/Vdv1.8 was 30% less than wall W-
M/Vdv1.2. Also, it can be noticed that Wall W-M/Vdv1.8 achieved its yield capacity at a lateral load, Qye, of 230 kN
compared to 328 kN when the same wall was tested without a top moment.

STR-975-5
0
100
200
300
400
500
0 1 2 3 4 5 6
Lat
eral
Fo
rce,
Qe
(kN
)
Lateral Displacement Ductility (µ)
W-Ref-Vn (M/Vdv=1.2)
W-M/Vdv1.8-Vn
First major diagonal crack
First yield of vertical bars
Ultimate, 80% Que
Figure 4: Effect of shear span to depth ratio, M/Vdv, on in-plane shear strength of RM shear walls
Figure 5 illustrates the effect of M/Vdv on shear resistance shares provided by horizontal reinforcement, Vs, and
masonry and axial compressive stress, Vm+p. The shear span to depth ratio did not show a significant effect on Vs
since the horizontal reinforcement in both walls reached its yield capacity at the same of 3.0. At an early stage of
ductility, the shear resistance provided by Vs in wall W-M/Vdv1.8 was higher than W-M/Vdv1.2 because wall W-
M/Vdv1.8 reached its inelastic deformations earlier. On the other hand, the aforementioned reduction in Que due to
increasing M/Vdv from 1.25 to 1.875, could be due to losses in (Vm+p)max as shown in Figure 5b. In wall W-M/Vdv1.2,
the masonry and axial compressive stress contributed with an ultimate resistance of 275 kN at of 1.27 followed
by rapid strength degradation. This behaviour became more ductile in wall W-M/Vdv1.8 with less capacity,
(Vm+p)max, equal to 155 kN.
0
100
200
300
400
500
0 1 2 3 4 5 6
Lat
eral
Res
ista
nce
, V
s(k
N)
Lateral Displacement Ductility (µ)
W-Ref-Vs (M /Vdv=1.2)
W-M/Vdv1.8-Vs
100% fy
0
100
200
300
400
500
0 1 2 3 4 5 6
Lat
eral
Res
ista
nce
, V
m+
p(k
N)
Lateral Displacement Ductility (µ)
W-Ref-Vm+p (M / Vdv=1.2)
W-M/Vdv1.8-Vm+p
(a) (b)
Figure 5: Effect of shear span to depth ratio, M/Vdv, on shear resistance shares provided by: (a) horizontal
reinforcement, Vs; (b) masonry and axial compressive stress, Vm+p
The test results presented here show that limiting the effect of shear span to depth ratio, M/Vdv, to an upper value of
1.0, as provided in most of the masonry design codes including the Canadian Standards Association CSA S304-14,
the US Masonry Standards Joint Committee MSJC-2013, and the Standards Association of New Zealand NZS
4230:2004, is overestimating Vn at high values of M/Vdv, which might lead to an unsafe design. This experimentally
measured reduction in the shear capacity could be explained by considering the interaction between the flexural and
shear performances, as shown in Figure 6. Both walls are identical in dimensions and reinforcement such that they
have the same shear strength envelope and moment capacity. Increasing M/Vdv results in a reduction in the lateral
force that corresponds to the flexural capacity of the wall. Consequently, this lower lateral force intersects with the
shear strength envelope at a lower capacity along with higher displacement ductility.

STR-975-6
Figure 6: Interaction between flexural and shear performance of tested walls
3.2 Displacement-Based Design
Unlike the force-based design that intends to keep the inter-story drifts to less than a certain limit when the structure
is subjected to the design seismic force, the displacement-based design approach aims to achieve a target level of
building performance under a specified level of seismic intensity in terms of demand top drift or lateral
displacement, d. Stiffness degradation, energy dissipation, and equivalent viscous damping are important aspects
that need to be considered when evaluating the seismic performance of RM shear walls, as well as when modeling
their cyclic response. In this paper, these three parameters are calculated for each tested wall at different levels of
top drift and are taken into account when evaluating the effect of shear span to depth ratio, M/Vdv.
3.2.1 Stiffness Degradation
The acting lateral force on structures could be distributed among the shear walls based on their lateral stiffness.
Thus, it is important to predict the degradation in the stiffness at the ultimate limit stage. In addition, stiffness
degradation could be a good index for the level of damage in RM shear walls. The secant stiffness at any loading
cycle, Ks,i, was defined as the ratio between the lateral resistance, Qi, and the corresponding top lateral displacement,
∆i. The initial gross stiffness, Kg, was calculated at the first cycle of ± 0.5 mm. Therefore, the secant stiffness
degradation can be calculated as follows:
[1] 100(%), xg
is
K
KnDegradatioStifness
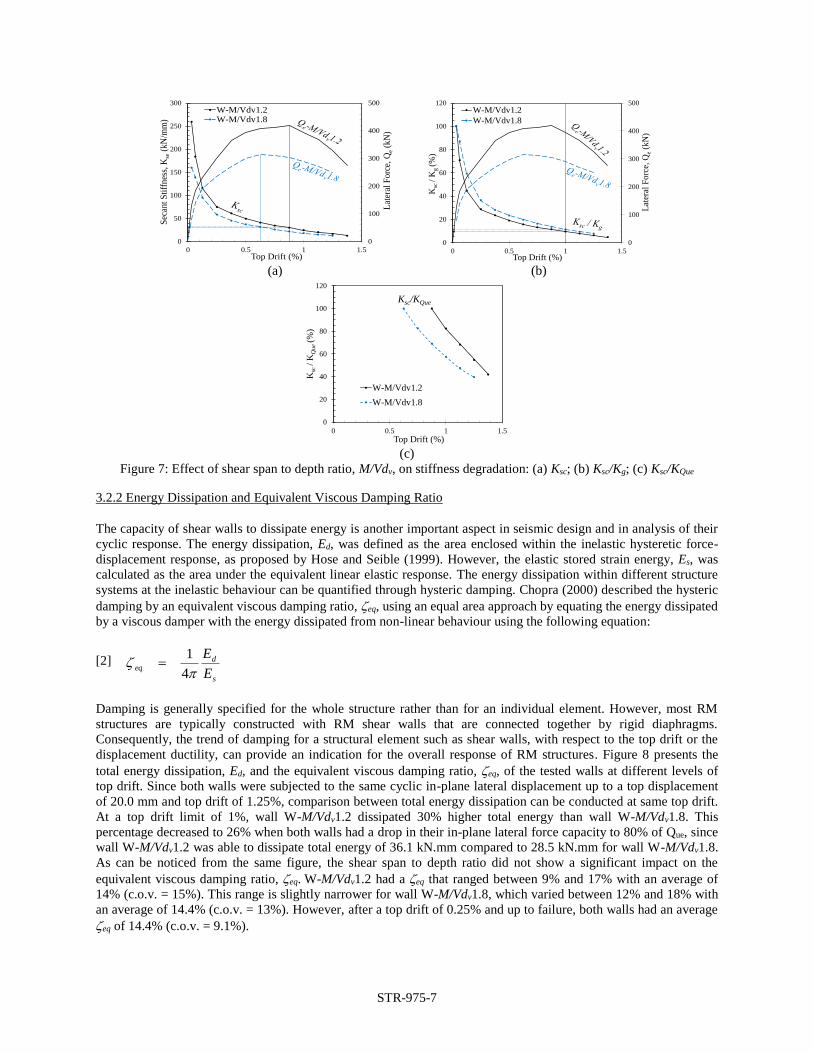
The influence of M/Vdv on the secant stiffness and the stiffness degradation is presented in Figure 7. Increasing
M/Vdv reduces the initial gross stiffness, Kg, since wall W-M/Vdv1.8 had Kg equal to 160 kN/mm compared to 259
kN/mm for wall W-M/Vdv1.2. However, the difference in the secant stiffness at the same level of top drift became
smaller as the tested walls reached higher levels of deformation (see Figure 7a). Both walls reached their peak lateral
load at the same secant stiffness of 30 kN/;mm. Nevertheless, wall W-M/Vdv1.2 achieved its maximum resistance at
a higher top drift of 0.875% compared to 0.625% for wall M/Vdv1.8. On the other hand, increasing M/Vdv enhanced
the stiffness degradation as shown in Figure 7b. Wall W-M/Vdv1.8 had about 50% reduction in its initial stiffness at
a top drift of 0.18%, while wall W-M/Vdv1.2 had the same stiffness degradation at earlier levels of deformation with
a top drift of 0.11%. At a drift limit of 1%, the values of Ksc were 9.5% and 11.3% of the corresponding Kg when
M/Vdv was equal to 1.25 and 1.875, respectively. Moreover, as shown in Figure 7c, wall W-M/Vdv1.8 had a gradual
degradation in its secant stiffness related to the secant stiffness at the peak load, Ksc/KQue, during the post-peak
behaviour compared to wall W-M/Vdv1.2.
STR-975-7
0
100
200
300
400
500
0
50
100
150
200
250
300
0 0.5 1 1.5
Lat
eral
Forc
e, Q
e(k
N)
Sec
ant
Sti
ffn
ess,
Kse
(kN
/mm
)
Top Drift (%)
W-M/Vdv1.2W-M/Vdv1.8
0
100
200
300
400
500
0
20
40
60
80
100
120
0 0.5 1 1.5
Lat
eral
Fo
rce,
Qe
(kN
)
Ksc
/ K
g (
%)
Top Drift (%)
W-M/Vdv1.2
W-M/Vdv1.8
(a) (b)
0
20
40
60
80
100
120
0 0.5 1 1.5
Ksc
/ K
Que(%
)
Top Drift (%)
W-M/Vdv1.2
W-M/Vdv1.8
Ksc/KQue
(c)
Figure 7: Effect of shear span to depth ratio, M/Vdv, on stiffness degradation: (a) Ksc; (b) Ksc/Kg; (c) Ksc/KQue
3.2.2 Energy Dissipation and Equivalent Viscous Damping Ratio
The capacity of shear walls to dissipate energy is another important aspect in seismic design and in analysis of their
cyclic response. The energy dissipation, Ed, was defined as the area enclosed within the inelastic hysteretic force-
displacement response, as proposed by Hose and Seible (1999). However, the elastic stored strain energy, Es, was
calculated as the area under the equivalent linear elastic response. The energy dissipation within different structure
systems at the inelastic behaviour can be quantified through hysteric damping. Chopra (2000) described the hysteric
damping by an equivalent viscous damping ratio, eq, using an equal area approach by equating the energy dissipated
by a viscous damper with the energy dissipated from non-linear behaviour using the following equation:
[2]
s
deq
E
E
4
1
Damping is generally specified for the whole structure rather than for an individual element. However, most RM
structures are typically constructed with RM shear walls that are connected together by rigid diaphragms.
Consequently, the trend of damping for a structural element such as shear walls, with respect to the top drift or the
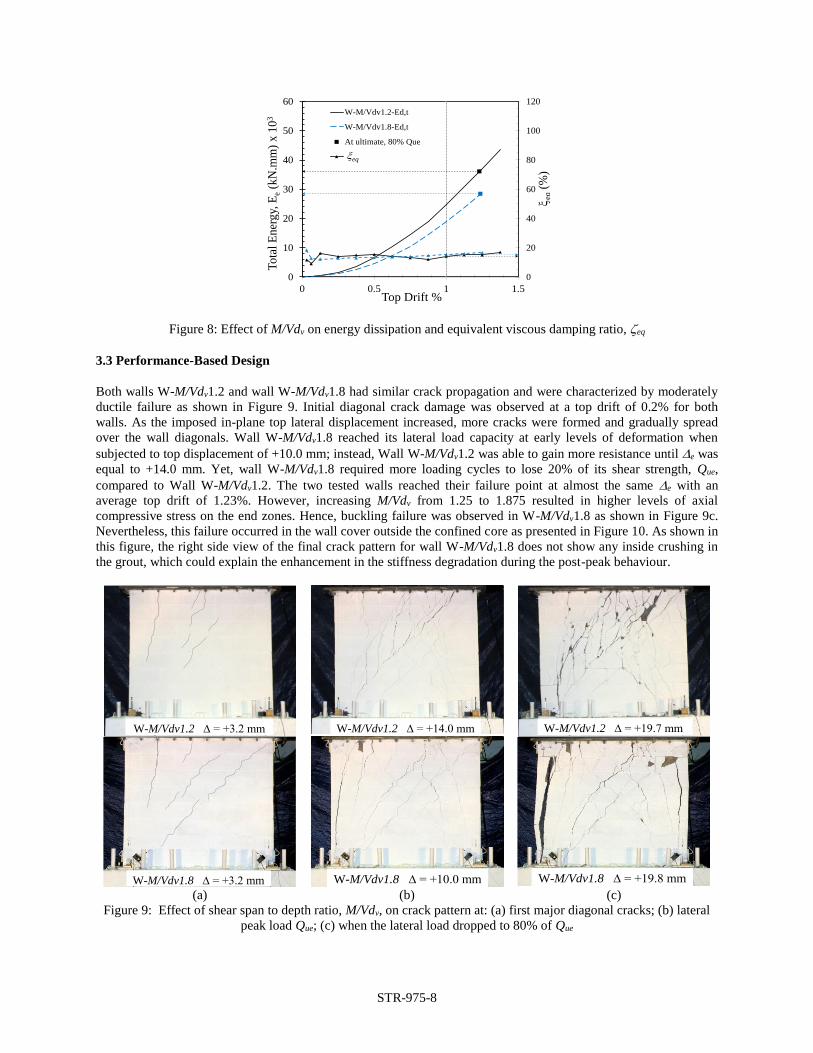
displacement ductility, can provide an indication for the overall response of RM structures. Figure 8 presents the
total energy dissipation, Ed, and the equivalent viscous damping ratio, eq, of the tested walls at different levels of
top drift. Since both walls were subjected to the same cyclic in-plane lateral displacement up to a top displacement
of 20.0 mm and top drift of 1.25%, comparison between total energy dissipation can be conducted at same top drift.
At a top drift limit of 1%, wall W-M/Vdv1.2 dissipated 30% higher total energy than wall W-M/Vdv1.8. This
percentage decreased to 26% when both walls had a drop in their in-plane lateral force capacity to 80% of Que, since
wall W-M/Vdv1.2 was able to dissipate total energy of 36.1 kN.mm compared to 28.5 kN.mm for wall W-M/Vdv1.8.
As can be noticed from the same figure, the shear span to depth ratio did not show a significant impact on the
equivalent viscous damping ratio, eq. W-M/Vdv1.2 had a eq that ranged between 9% and 17% with an average of
14% (c.o.v. = 15%). This range is slightly narrower for wall W-M/Vdv1.8, which varied between 12% and 18% with
an average of 14.4% (c.o.v. = 13%). However, after a top drift of 0.25% and up to failure, both walls had an average
eq of 14.4% (c.o.v. = 9.1%).
STR-975-8
0
20
40
60
80
100
120
0
10
20
30
40
50
60
0 0.5 1 1.5
eq
(%)
To
tal
En
erg
y, E
e(k
N.m
m)
x 1
03
Top Drift %
W-M/Vdv1.2-Ed,t
W-M/Vdv1.8-Ed,t
At ultimate, 80% Que
eq
Figure 8: Effect of M/Vdv on energy dissipation and equivalent viscous damping ratio, eq
3.3 Performance-Based Design
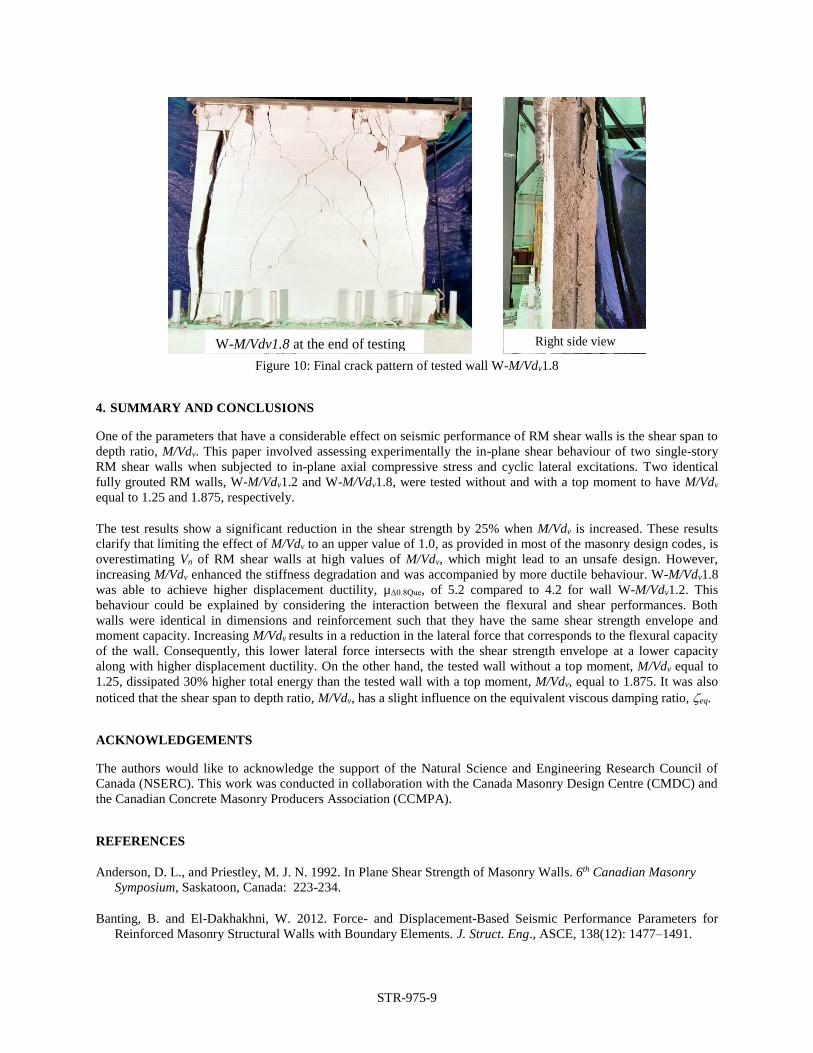
Both walls W-M/Vdv1.2 and wall W-M/Vdv1.8 had similar crack propagation and were characterized by moderately
ductile failure as shown in Figure 9. Initial diagonal crack damage was observed at a top drift of 0.2% for both
walls. As the imposed in-plane top lateral displacement increased, more cracks were formed and gradually spread
over the wall diagonals. Wall W-M/Vdv1.8 reached its lateral load capacity at early levels of deformation when
subjected to top displacement of +10.0 mm; instead, Wall W-M/Vdv1.2 was able to gain more resistance until e was
equal to +14.0 mm. Yet, wall W-M/Vdv1.8 required more loading cycles to lose 20% of its shear strength, Que,
compared to Wall W-M/Vdv1.2. The two tested walls reached their failure point at almost the same e with an
average top drift of 1.23%. However, increasing M/Vdv from 1.25 to 1.875 resulted in higher levels of axial
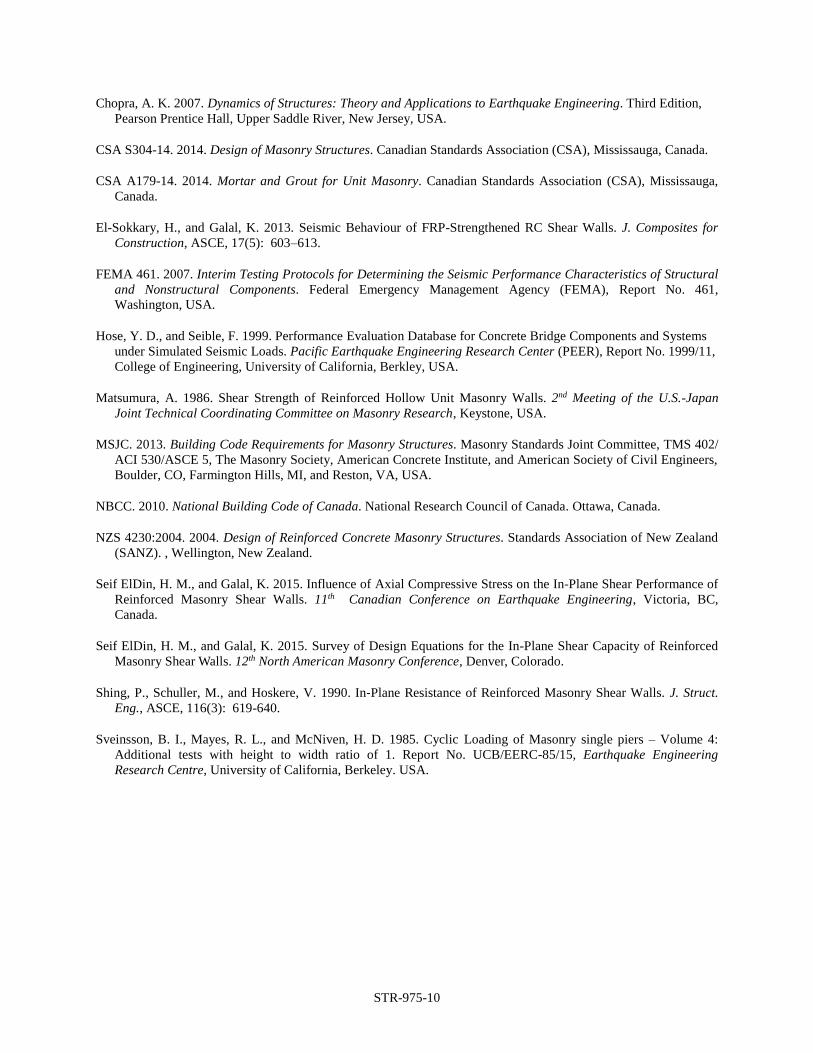
compressive stress on the end zones. Hence, buckling failure was observed in W-M/Vdv1.8 as shown in Figure 9c.
Nevertheless, this failure occurred in the wall cover outside the confined core as presented in Figure 10. As shown in
this figure, the right side view of the final crack pattern for wall W-M/Vdv1.8 does not show any inside crushing in
the grout, which could explain the enhancement in the stiffness degradation during the post-peak behaviour.
W-M/Vdv1.2 ∆ = +3.2 mm
W-M/Vdv1.2 ∆ = +14.0 mm
W-M/Vdv1.2 ∆ = +19.7 mm
W-M/Vdv1.8 ∆ = +3.2 mm
W-M/Vdv1.8 ∆ = +10.0 mm
W-M/Vdv1.8 ∆ = +19.8 mm
(a) (b) (c)
Figure 9: Effect of shear span to depth ratio, M/Vdv, on crack pattern at: (a) first major diagonal cracks; (b) lateral
peak load Que; (c) when the lateral load dropped to 80% of Que
STR-975-9
W-M/Vdv1.8 at the end of testing Right side view
Figure 10: Final crack pattern of tested wall W-M/Vdv1.8
4. SUMMARY AND CONCLUSIONS
One of the parameters that have a considerable effect on seismic performance of RM shear walls is the shear span to
depth ratio, M/Vdv. This paper involved assessing experimentally the in-plane shear behaviour of two single-story
RM shear walls when subjected to in-plane axial compressive stress and cyclic lateral excitations. Two identical
fully grouted RM walls, W-M/Vdv1.2 and W-M/Vdv1.8, were tested without and with a top moment to have M/Vdv
equal to 1.25 and 1.875, respectively.
The test results show a significant reduction in the shear strength by 25% when M/Vdv is increased. These results
clarify that limiting the effect of M/Vdv to an upper value of 1.0, as provided in most of the masonry design codes, is
overestimating Vn of RM shear walls at high values of M/Vdv, which might lead to an unsafe design. However,
increasing M/Vdv enhanced the stiffness degradation and was accompanied by more ductile behaviour. W-M/Vdv1.8
was able to achieve higher displacement ductility, µ∆0.8Que, of 5.2 compared to 4.2 for wall W-M/Vdv1.2. This
behaviour could be explained by considering the interaction between the flexural and shear performances. Both
walls were identical in dimensions and reinforcement such that they have the same shear strength envelope and
moment capacity. Increasing M/Vdv results in a reduction in the lateral force that corresponds to the flexural capacity
of the wall. Consequently, this lower lateral force intersects with the shear strength envelope at a lower capacity
along with higher displacement ductility. On the other hand, the tested wall without a top moment, M/Vdv equal to
1.25, dissipated 30% higher total energy than the tested wall with a top moment, M/Vdv, equal to 1.875. It was also
noticed that the shear span to depth ratio, M/Vdv, has a slight influence on the equivalent viscous damping ratio, eq.
ACKNOWLEDGEMENTS
The authors would like to acknowledge the support of the Natural Science and Engineering Research Council of
Canada (NSERC). This work was conducted in collaboration with the Canada Masonry Design Centre (CMDC) and
the Canadian Concrete Masonry Producers Association (CCMPA).
REFERENCES
Anderson, D. L., and Priestley, M. J. N. 1992. In Plane Shear Strength of Masonry Walls. 6th Canadian Masonry
Symposium, Saskatoon, Canada: 223-234.
Banting, B. and El-Dakhakhni, W. 2012. Force- and Displacement-Based Seismic Performance Parameters for
Reinforced Masonry Structural Walls with Boundary Elements. J. Struct. Eng., ASCE, 138(12): 1477–1491.
STR-975-10
Chopra, A. K. 2007. Dynamics of Structures: Theory and Applications to Earthquake Engineering. Third Edition,
Pearson Prentice Hall, Upper Saddle River, New Jersey, USA.
CSA S304-14. 2014. Design of Masonry Structures. Canadian Standards Association (CSA), Mississauga, Canada.
CSA A179-14. 2014. Mortar and Grout for Unit Masonry. Canadian Standards Association (CSA), Mississauga,
Canada.
El-Sokkary, H., and Galal, K. 2013. Seismic Behaviour of FRP-Strengthened RC Shear Walls. J. Composites for
Construction, ASCE, 17(5): 603–613.
FEMA 461. 2007. Interim Testing Protocols for Determining the Seismic Performance Characteristics of Structural
and Nonstructural Components. Federal Emergency Management Agency (FEMA), Report No. 461,
Washington, USA.
Hose, Y. D., and Seible, F. 1999. Performance Evaluation Database for Concrete Bridge Components and Systems
under Simulated Seismic Loads. Pacific Earthquake Engineering Research Center (PEER), Report No. 1999/11,
College of Engineering, University of California, Berkley, USA.
Matsumura, A. 1986. Shear Strength of Reinforced Hollow Unit Masonry Walls. 2nd Meeting of the U.S.-Japan
Joint Technical Coordinating Committee on Masonry Research, Keystone, USA.
MSJC. 2013. Building Code Requirements for Masonry Structures. Masonry Standards Joint Committee, TMS 402/
ACI 530/ASCE 5, The Masonry Society, American Concrete Institute, and American Society of Civil Engineers,
Boulder, CO, Farmington Hills, MI, and Reston, VA, USA.
NBCC. 2010. National Building Code of Canada. National Research Council of Canada. Ottawa, Canada.
NZS 4230:2004. 2004. Design of Reinforced Concrete Masonry Structures. Standards Association of New Zealand
(SANZ). , Wellington, New Zealand.
Seif ElDin, H. M., and Galal, K. 2015. Influence of Axial Compressive Stress on the In-Plane Shear Performance of
Reinforced Masonry Shear Walls. 11th Canadian Conference on Earthquake Engineering, Victoria, BC,
Canada.
Seif ElDin, H. M., and Galal, K. 2015. Survey of Design Equations for the In-Plane Shear Capacity of Reinforced
Masonry Shear Walls. 12th North American Masonry Conference, Denver, Colorado.
Shing, P., Schuller, M., and Hoskere, V. 1990. In‐Plane Resistance of Reinforced Masonry Shear Walls. J. Struct.
Eng., ASCE, 116(3): 619-640.
Sveinsson, B. I., Mayes, R. L., and McNiven, H. D. 1985. Cyclic Loading of Masonry single piers – Volume 4:
Additional tests with height to width ratio of 1. Report No. UCB/EERC-85/15, Earthquake Engineering
Research Centre, University of California, Berkeley. USA.