strain induced by dual acoustic radiation force and its
TRANSCRIPT

Chapter 3
ABSTRACT
There are many studies on measurement of tissue mechanical properties by applying an acoustic radiation force induced by ultrasound to an object. However, one acoustic radia-tion force along a direction (e.g., vertical direction) does not generate the strain of an object effectively because it also causes change in the object position, which has zero spatial gradient in displacement (= no strain). Especially, when the elastic modulus of the object is much larger than that of the surrounding tissue (such like a tumor in the breast tissue), one acoustic radiation force might generate only the change in position of the object and the strain of the object is hardly generated. In such cases, mechanical properties of the object cannot be evaluated. In this study, two cyclic acoustic radiation forces are simultaneously applied to an object along two different directions (e.g., two opposite horizontal directions) to effectively generate the strain inside the object even when the object is much harder than the surrounding tissue.
3.1 INTRODUCTION
In recent years, some remote actuation methods based on acoustic radiation force have been reported. Fatemi and coworkers proposed an imaging method called ultrasound stimulated acoustic emission (USAE) [1, 2]. Their system consists of two confocal ultrasonic trans-ducers, and two ultrasound beams with two slightly different frequencies of f and ( f + D f ) are transmitted. Acoustic radiation pressure, PR(t), exerted on the interface between two different media is a function of the energy density, e(t), and the specific acoustic imped-ances, Z1 and Z2, of the media [3]. The energy density, e(t), is proportional to the square of the sum of the sound pressures, p1(t) and p2(t), generated by the two transducers. In the in-tersectional area of these two beams, therefore, an oscillatory radiation pressure PR(t) at the frequency difference, Δ D f, is applied to the interface. The radiation force produces acoustic emission that is closely related to the mechanical frequency response of the medium. By
STRAIN INDUCED BY DUAL ACOUSTIC RADIATION FORCE AND ITS ULTRASONIC MEASUREMENTHideyuki Hasegawa and Hiroshi KanaiGraduate School of Biomedical Engineering, Tohoku University, Sendai 980-8579, Japan
41
MTCASME_Fatemi_chap03.indd 41 3/15/2008 5:14:14 AM
42 Biomedical Applications of Vibration and Acoustics for Imaging and Characterisations
MTC
measuring the acoustic emission with a hydrophone, hard inclusions in soft material were experimentally detected. The spatial resolution in the depth direction corresponds to the size of the intersectional area.
Nightingale et al [4] proposed an alternative imaging method in which the pulsed ul-trasound is employed for applying the radiation force to a soft tissue during short durations (less than 1 millisecond). The viscoelastic properties of the tissue are measured from the magnitude and the transient response of the displacement, d(t), of the tissue [4-6]. In order to generate measurable displacement by several ultrasonic pulses, high-intensity pulsed ultrasound of 1000 W/cm2 is employed. According to the safety guideline shown by the Japan Society of Ultrasonics in Medicine (JSUM), however, the intensity of ultrasound is recommended to be less than 240 mW/cm2 and 1 W/cm2 for the pulsed and continu-ous waves, respectively [7]. Therefore, the intensity of the pulsed ultrasound employed by Nightingale et al [4] is far greater than that indicated in the safety guideline.
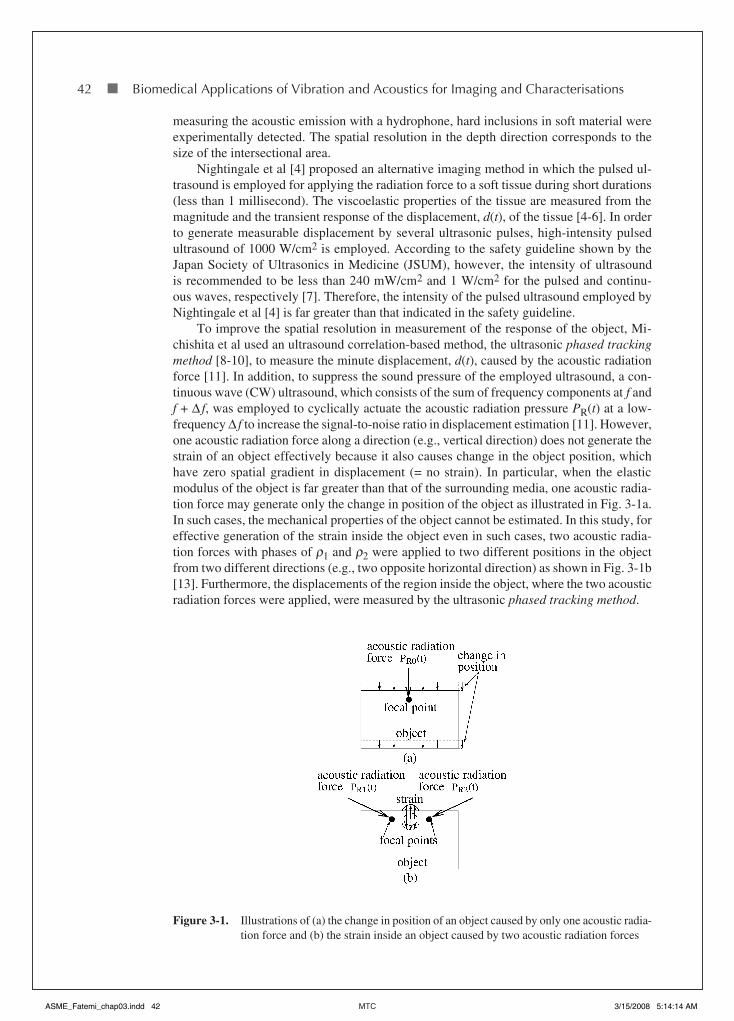
To improve the spatial resolution in measurement of the response of the object, Mi-chishita et al used an ultrasound correlation-based method, the ultrasonic phased tracking method [8-10], to measure the minute displacement, d(t), caused by the acoustic radiation force [11]. In addition, to suppress the sound pressure of the employed ultrasound, a con-tinuous wave (CW) ultrasound, which consists of the sum of frequency components at f and f + D f, was employed to cyclically actuate the acoustic radiation pressure PR(t) at a low- frequency D f to increase the signal-to-noise ratio in displacement estimation [11]. However, one acoustic radiation force along a direction (e.g., vertical direction) does not generate the strain of an object effectively because it also causes change in the object position, which have zero spatial gradient in displacement (= no strain). In particular, when the elastic modulus of the object is far greater than that of the surrounding media, one acoustic radia-tion force may generate only the change in position of the object as illustrated in Fig. 3-1a. In such cases, the mechanical properties of the object cannot be estimated. In this study, for effective generation of the strain inside the object even in such cases, two acoustic radia-tion forces with phases of r1 and r2 were applied to two different positions in the object from two different directions (e.g., two opposite horizontal direction) as shown in Fig. 3-1b [13]. Furthermore, the displacements of the region inside the object, where the two acoustic radiation forces were applied, were measured by the ultrasonic phased tracking method.
Figure 3-1. Illustrations of (a) the change in position of an object caused by only one acoustic radia-tion force and (b) the strain inside an object caused by two acoustic radiation forces
ASME_Fatemi_chap03.indd 42 3/15/2008 5:14:14 AM

MTC
3.2 GENERATION OF FLUCTUATING ACOUSTIC RADIATION FORCE
When a continuous plane-wave ultrasound is incident on an interface between two differ-ent media, a constant force, which is called an acoustic radiation force, is exerted on the interface. Acoustic radiation pressure, PR(t), is defined as the acoustic radiation force per unit area of the interface as follows [1, 2]:
PR (t) = (1+ R2) e(t) (3 – 1)
where R and e(t) are the pressure reflection coefficient and the energy density at the inter-face, respectively. In Eq. (3-1), the transmitted wave is assumed to be perfectly absorbed in the object. Using the densities, r1 and r2, and sound speeds, c1 and c2, of the media and object, the reflection coefficient, R, and the energy density, e(t), are defined by
Z2 − Z1
Z2 + Z1R = =
ρ 2 c2 − ρ 1 c1
ρ 2 c2 + ρ 1 c1 (3 – 2)
e(t) =
1r
1c2
1{ }p(t)
2 (3 – 3)
where p(t) is the sound pressure at the interface. JSUM shows the safety guideline in which the intensity of the CW ultrasound should be less than 1 W/cm2. By assuming that the den-sity r1 and sound speed c1 of water are 103 kg/m3 and 1500 m/s, respectively, the acoustic radiation pressure, PR(t), exerted on the interface is calculated to be 6.67 Pa when the ultra-sound intensity is 1 W/cm2. In this calculation, the reflection coefficient, R, is assumed to be zero. For example, sound speeds of muscle and fat are 1568 m/s and 1465 m/s, respectively [13]. By assuming densities of these tissues to be 103 kg/m3, the reflection coefficient R is determined to be 0.034. Thus, the reflection coefficient can be assumed to be zero.
As shown in Eq. (3-3), the energy density e(t) of the incident wave is proportional to the square of the sound pressure p(t) of the ultrasound beam. When two ultrasonic beams with slightly different frequencies, f and f + D f, are crossed each other, the sound pressure, psum(t), at the intersectional area is expressed by the sum of sound pressures of two ultra-sonic beams as follows:
psum (t) = p0 cos(ωt + ϕ ) + p0 cos(ω + ∆ω)t (3 – 4)
where p0, w, and Dw, are the amplitude of the sound pressure of each ultrasound beam, angular frequency of the incident wave (w = 2p f ), and difference in angular frequency (Dw = 2p Df ), respectively, and r is the initial phase of the CW at frequency f. In this case, the energy density e(t) is given by
+ cos 2( t + ) + cos 2( + D )t ]
e(t) = 1r
1c2
1
{ psum (t)}
2
= 1r
1c2
1
{ p0 cos( t + ) + p
0 cos( + D )t}2
=p2
0
r1c2
11 + cos(D t - ) + cos {(2 + D )t + }
12
12
w j w w
w j w w j
jw w w
]
(3 – 5)
Strain Induced by Dual Acoustic Radiation Force 43
ASME_Fatemi_chap03.indd 43 3/15/2008 5:14:19 AM

44 Biomedical Applications of Vibration and Acoustics for Imaging and Characterisations
MTC
From the second term of the right-hand side of Eq. (3-5), it is found that the energy density e(t) of the incident field has a component at the frequency difference D f. Therefore, the cyclically oscillating radiation pressure PR(t) at the frequency difference D f is given by
PR (t) = (1 + R2)
p20
r1c2
1
1 + cos(D t - )}{ w j (3 – 6)
Thus, using an ultrasound beam generated by the sum of signals at slightly different fre-quencies f and f + D f, the oscillatory radiation force can be applied to the focal area of the beam.In this study, in order to generate the regional strain inside the object, we use two phase-controlled acoustic radiation pressures, PR1(t) and PR2(t), given by
P
R1(t) = (1 + R2) 1 + cos(D t +
1)}
p201
r1c2
1
{ w j (3 – 7)
P
R2(t) = (1 + R2) 1 + cos(D t +
2)}
p202
r1c2
2
{ w j (3 – 8)
where r1 and r2 are the initial phases of CWs at frequency f for generating PR1(t) and PR2(t). These two acoustic radiation forces at D f, whose phase difference is r2 - r1, are ap-plied by setting the focal points of two transducers at two different sites inside the object, and the insonification angles are assigned to q1 and q2 for the respective transducers.
3.3 DISPLACEMENT OF OBJECT INDUCED BY FLUCTUATING ACOUSTIC RADIATION FORCE
3.3.1 Experimental Setup
An experimental setup is illustrated in Fig. 3-2. An object made of gel was placed in a wa-ter tank. For the application of radiation pressures PR(t), a concave ultrasonic transducer was employed. To generate a fluctuating acoustic radiation force, the concave ultrasonic transducer (Tokimec 1Z20I-PF50-C; center frequency: 1 MHz) was driven by a sum of two continuous waves at two slightly different frequencies of 1 MHz and 1 MHz + D f Hz. The resultant ultrasound beam was focused at 50 mm away from the surface of the transducer, and the focal point was set at a point on the top surface of the object with beam angle q = 60 deg. In this experiment, the displacement at the focal point was measured by a laser velocimeter (ONO SOKKI, LV-1300).
In the following ultrasonic measurement, the CW ultrasound for actuation will inter-fere in the pulsed ultrasound for the measurement of displacements. In order to avoid this interference, it is necessary to stop actuation during transmission and reception of the ultra-sonic pulse for the measurement. The application of ultrasound for actuation is controlled using a custom-made electrical switch [11]. As shown in Fig. 3-2, the electrical switch is controlled by the trigger signal from a function generator that synchronizes with the trigger signal from ultrasonic diagnostic equipment (Toshiba, SSH-160A). The time chart for controlling the application of ultrasound for actuation is shown in Fig. 3-3.
3.3.2 Experimental Results
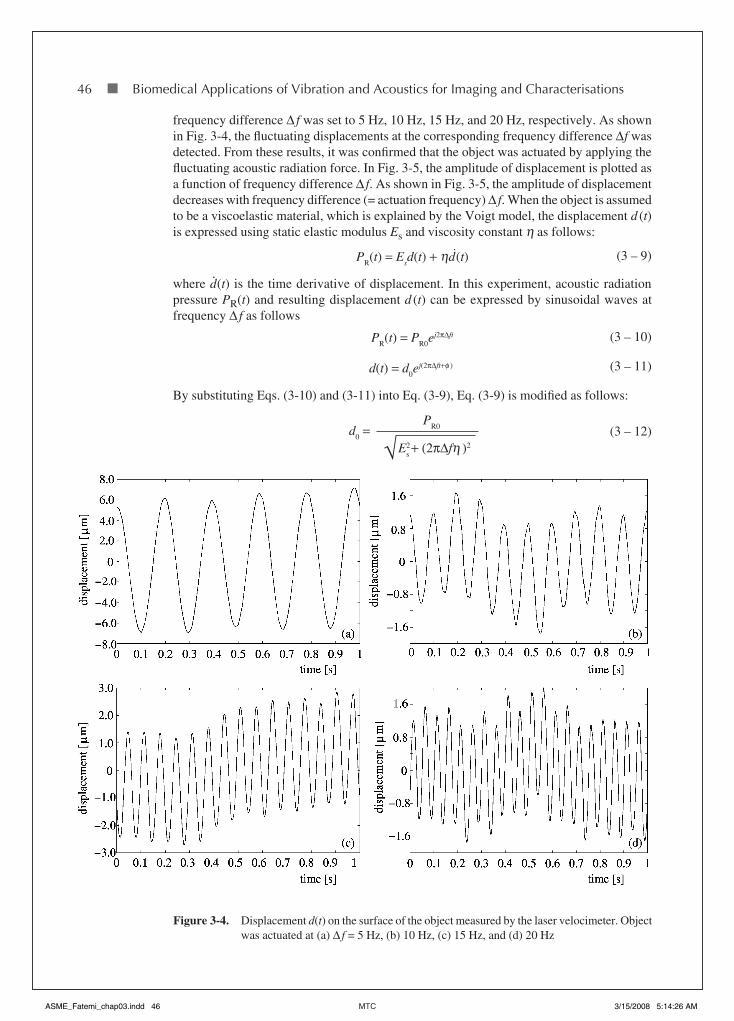
Figure 3-4 shows the displacements d (t) on the top surface of the object, which are obtained by integrating the velocities measured by the laser velocimeter. In Figs. 3-4a, b, c, and d,
ASME_Fatemi_chap03.indd 44 3/15/2008 5:14:21 AM

Strain Induced by Dual Acoustic Radiation Force 45
MTC
Figure 3-2. Experimental setup for measurement of the displacement on the surface of the object cyclically actuated using a concave ultrasonic transducer
Figure 3-3. Time chart for controlling the application of ultrasound for actuation. (a) Clock signal from ultrasonic diagnostic equipment. (b) Signal for controlling the application of ultrasound for actuation. Ultrasound is applied when this signal is high. (c) Sound pressure psum(t) consisting of the sum of two CWs at slightly different frequencies f and f + D f applied intermittently only during actuation period (A). (d) Acoustic radiation pressure PR(t) generated by the sound pressure shown in (c). (e) Sampling gate for acquiring ultrasonic pulses for measurement, which determines the period for measurement (M)
ASME_Fatemi_chap03.indd 45 3/15/2008 5:14:22 AM
46 Biomedical Applications of Vibration and Acoustics for Imaging and Characterisations
MTC
frequency difference D f was set to 5 Hz, 10 Hz, 15 Hz, and 20 Hz, respectively. As shown in Fig. 3-4, the fluctuating displacements at the corresponding frequency difference D f was detected. From these results, it was confirmed that the object was actuated by applying the fluctuating acoustic radiation force. In Fig. 3-5, the amplitude of displacement is plotted as a function of frequency difference D f. As shown in Fig. 3-5, the amplitude of displacement decreases with frequency difference (= actuation frequency) D f. When the object is assumed to be a viscoelastic material, which is explained by the Voigt model, the displacement d (t) is expressed using static elastic modulus Es and viscosity constant h as follows:
P
R(t) = E
sd(t) + d (t)h (3 – 9)
where d. (t) is the time derivative of displacement. In this experiment, acoustic radiation
pressure PR(t) and resulting displacement d (t) can be expressed by sinusoidal waves at frequency D f as follows
PR(t) = PR0ej2π∆ft (3 – 10)
d(t) = d0ej(2π∆ft+φ ) (3 – 11)
By substituting Eqs. (3-10) and (3-11) into Eq. (3-9), Eq. (3-9) is modified as follows:
d0 =
√E2s + (2π∆fη )2
PR0 (3 – 12)
Figure 3-4. Displacement d(t) on the surface of the object measured by the laser velocimeter. Object was actuated at (a) D f = 5 Hz, (b) 10 Hz, (c) 15 Hz, and (d) 20 Hz
ASME_Fatemi_chap03.indd 46 3/15/2008 5:14:26 AM

Strain Induced by Dual Acoustic Radiation Force 47
MTC
In this experiment, the amplitude of radiation force PR0 was set to be constant. The amplitude of displacement d0 decreased with actuation frequency D f, as shown by Eq. (3-12).
3.4 DEFORMATION INDUCED BY DUAL ACOUSTIC RADIATION FORCE CAPTURED BY VIDEO CAMERA
3.4.1 Experimental Setup
An experimental setup is illustrated in Fig. 3-6. As in the experiments described in Section 3.3, the object made of gel (45 mm × 45 mm × 17 mm) was placed in a water tank. For effective generation of the object deformation, two concave ultrasonic transducers were employed to apply two acoustic radiation pressures PR1(t) and PR2(t). A concave ultrasonic transducer (Tokimec 1Z20I-PF50-C; center frequency: 1 MHz) was driven by a sum of two CWs at two slightly different frequencies of 1 MHz and 1 MHz + 10 Hz. The resul-tant ultrasound beam was focused at 50 mm away from the surface of the transducer, and the focal point was set at a point, a, on the top of the object with beam angle q1. Another concave transducer (Tokimec 1Z20I-PF50-C; center frequency: 1 MHz) was driven by a sum of CWs at 1 MHz and 1 MHz + 10 Hz. The focal point, which is 50 mm away from the surface of the transducer, was set at a point, b, on the top of the object with beam angle q2. The phase difference, j 2 – j1, between PR1(t) and PR2(t) was set to be zero.In this experiment, the application of acoustic radiation forces was not stopped because the amplitude of displacement is reduced when acoustic radiation forces are applied intermittently. The resolution of the video camera in detection of the displacement is poorer in comparison with the laser velocimeter, and the amplitude of displacement is desired to be as large as possible. As indicated in Fig. 3-6, four different sites (a, b, c, and d) were separately measured. Therefore, the image acquisition was triggered by a rectangular signal that synchronizes with the signal applied to transducers for actuation.
3.4.2 Experimental Results
As illustrated in Fig. 3-6, four different sites (a, b, c, and d) at the surface on the side of the object were measured with a high-speed video camera at a frame rate of 100 Hz. In this
Figure 3-5. Amplitude of displacement plotted as a function of actuation frequency D f
ASME_Fatemi_chap03.indd 47 3/15/2008 5:14:26 AM

48 Biomedical Applications of Vibration and Acoustics for Imaging and Characterisations
MTC
experiment, beam angles q1 and q2 were set to be 22 deg. and 35 deg., respectively, and the distance between points a and b was set to be 6 mm. Focal areas of two transducers were set at the edge of the top surface of the object. The four sites, a, b, c, and d, were measured for one cycle (100 milliseconds) of acoustic radiation forces. The period for acquiring pic-tures in relation to acoustic radiation forces is shown in Fig. 3-7. In Figs. 3-7a to d, bright spots in measured pictures correspond to the light reflected from carbon powder, which is contained in the object, due to the irradiation of the white light using halogen lamp. At points a and c (two focal points), displacements along directions of respective ultrasonic beams were found as shown in Figs. 3-7a and c. As shown in Fig. 3-7b, point b was found to move upward when acoustic radiation forces increased. This result shows that the region between two focal points was vertically thickened (deformed) due to horizontal compres-sion by application of dual acoustic radiation force.
3.5 ULTRASONIC MEASUREMENT OF DISPLACEMENT DISTRIBUTION INSIDE AN OBJECT INDUCED BY DUAL ACOUSTIC RADIATION FORCE
3.5.1 Experimental Setup
An experimental setup is illustrated in Fig. 3-8. In order to measure the strain using ultrasound, we employed ultrasonic diagnostic equipment (Toshiba SSH-160A) with a sec-tor-type probe (center frequency: 5 MHz). The equipment was modified to detect the minute displacement of the object by the ultrasonic phased tracking method. As in Section 3.4, an object made of gel (45 mm × 45 mm × 17 mm, containing carbon powder to obtain suf-ficient scattering) was placed in a water tank as shown in Fig. 3-8. For the application of radiation pressures PR1(t) and PR2(t), two concave ultrasonic transducers were employed. The settings for the application of acoustic radiation forces were the same as described in Section 3.4.1.
Figure 3-6. Experimental setup for measurement of deformation of the object using a video camera
ASME_Fatemi_chap03.indd 48 3/15/2008 5:14:26 AM

MTC
Figure 3-7. Results obtained at point a (a), b (b), c (c), and d (d) as indicated in Fig. 3-6 (e) and (f). Acoustic radiation forces radiated by two ultrasonic transducers
Figure 3-8. Experimental setup for measurement of the strain inside the object cyclically actuated using two concave ultrasonic transducers
Strain Induced by Dual Acoustic Radiation Force 49
ASME_Fatemi_chap03.indd 49 3/15/2008 5:14:27 AM

As described in Section 3.3.1, in the ultrasonic measurement, when the CW ultrasounds are used for actuation, they will interfere in the pulsed ultrasound for the measurement of displacements. In order to avoid this interference, it is necessary to stop actuation during transmission and reception of the ultrasonic pulse for the measurement. Therefore, we used an electrical switch to control the cessation of the CW ultrasound for actuation [11].
3.5.2 Experimental Results
The spatial distribution of displacements inside the object was measured with ultrasound. In this experiment, angles q1 and q2 of both beams were set to be 25 deg., and the distance between a and b was set to be 15 mm. The measured positions were illustrated in Fig. 3-9. Figure 3.10a shows an M-mode image of the object obtained at measured position d. Acoustic radiation pressures PR1(t) and PR2(t), shown in Figs. 3-10b and c, were calculated based on Eq. (3-6) as follows: The density, r2, and the sound speed, c2, of the object were measured as 1.1 × 10³ kg/m3 and 1.47 × 10³ m/s, respectively. By assuming the density, r1, and the sound speed, c1, of water to be 1.0 × 10³ kg/m3 and 1.5 × 10³ m/s, respectively, the pressure reflection coefficient, R, and the energy reflection coefficient, R2, were respec-tively calculated as 0.038 and 0.0014 using Eq. (3-2). Therefore, in this study, by assuming the object to be totally absorbing material (R = 0), the acoustic radiation pressures PR1(t) and PR2(t) exerted on two points, a and b, in the object were calculated based on Eq. (3-6). In this calculation, we obtained the amplitude of the focused sound pressures of p01 and p02 beforehand by measuring the acoustic fields of each ultrasound for actuation with a hydrophone (Force Institute, MH-28-10). In Fig. 3-10d, the displacement d(t) at the surface (point A) of the object actuated by the acoustic radiation forces were measured by the ultra-
Figure 3-9. Illustration of positions measured with ultrasound
50 Biomedical Applications of Vibration and Acoustics for Imaging and Characterisations
MTCASME_Fatemi_chap03.indd 50 3/15/2008 5:14:27 AM

sonic phased tracking method. The tracking lines were superimposed by the red lines on the M-mode image in Fig. 3-10a. In Fig. 3-10d, it is found that the object was cyclically actuated with the amplitude of a few micrometers [11], which was similar to that measured with the high-speed video camera. Two acoustic radiation forces were applied by setting focal points at the upper surface of the object, and angles q1 and q2 of both ultrasonic beams for actuation were set to be 25 deg. Therefore, directions of horizontal components of these two acoustic radiation forces were opposite each other by setting r2 - r1 = 0. Therefore, the region between two focal points was cyclically compressed along the horizontal axis by these acoustic radiation forces, and the thickness of the region between two focal points becomes thick along the vertical axis.
Figures 3-10d, e, and f show displacements at multiple points along an ultrasonic beam. When acoustic radiation forces shown in Figs. 3-10b and c increase, the surface of the object and a point that was 1.5 mm deeper than the surface moved upward (see Figs. 3-10d and e). On the other hand, a point that was 3.0 mm deeper than the surface moved downward, as shown in Fig. 3-10f. This result shows the thickness of the region between two focal points increased along the vertical axis, which shows that the strain was generated inside the object.
Strain Induced by Dual Acoustic Radiation Force 51
MTC
Figure 3-10. Example of ultrasonic measurement of displacement inside the object. (a) M-mode im-age of the object. (b) Acoustic radiation pressure, PR1(t). (c) Acoustic radiation pressure, PR2(t). (d) Displacement at point A (surface) indicated in (a). (e) Displacement at point B (1.5 mm from the surface). (f ) Displacement at point C (3.0 mm from the surface)
ASME_Fatemi_chap03.indd 51 3/15/2008 5:14:28 AM

Then, the two-dimensional displacement distribution was measured by moving the ultrasonic probe for the measurement in the horizontal direction as illustrated in Fig. 3-9. The displacement d(t) at every sampled point along each ultrasonic beam was obtained, and the amplitude of the displacement d(t) at the frequency difference f = 10 Hz was estimated, as shown in Fig. 3-11a, by applying the Fourier transform to the displacement d(t) and the acoustic radiation pressure PR1(t) with a Hanning window of 0.68 second (1024 points). In addition, the phase delay of the displacement d(t) from the acoustic radiation pressure PR1(t) was also estimated as shown in Fig. 3-11b. In Fig. 3-11, amplitudes and phase de-lays of displacements d(t) were shown in gray scale. The phase difference of zero shows that that point moves upward when the acoustic radiation force increases. In Fig. 3-11, the region that is 2 mm to 3 mm from the top surface tends to move upward when the radia-tion force increases. On the other hand, the region that is over 3.0 mm deeper than the top surface tends to move downward. From these results, it was found that the strain inside the object was successfully generated using two phase-controlled acoustic radiation forces.
3.6 DISCUSSION
In this study, the spatial distribution of displacements caused by two acoustic radiation forces was measured with ultrasonic phased tracking method. The applied acoustic radia-tion forces and resulting displacement distribution are discussed below. Figure 3-12a shows the sound pressure distribution generated by the ultrasonic transducer used for actuation. From Fig. 3-12a, it was supposed that the width at half maximum of the acoustic radiation force is about 5 mm in the x-axis, and the acoustic radiation force was almost constant along the z-axis in the object. Therefore, the region in which the acoustic radiation force was over the half maximum is roughly considered as shown by the region with shadow in Fig. 3-12b. In Fig. 3-12b, the measured region is surrounded by the dashed line. Two ultrasound beams crossed each other at a depth of about 4 mm from the top surface. At each point in the region closer than 4 mm from the top surface in the measured region, the sum of horizontal com-ponents caused by two acoustic radiation pressures PR1(t) and PR2(t) are not zero. (Magni-tudes of these components are different.) Therefore, the region nearer than 4 mm from the top surface was compressed in the horizontal axis, and, as shown in Fig. 3-11, the resulting upward displacement during the increase of acoustic radiation forces was found.
Figure 3-11. Spatial distribution of displacements inside the object. (a) Amplitudes and (b) phases of displacements
52 Biomedical Applications of Vibration and Acoustics for Imaging and Characterisations
MTCASME_Fatemi_chap03.indd 52 3/15/2008 5:14:28 AM

Around 4 mm from the top surface, horizontal components of two acoustic radiation forces were almost compensated, and only vertical components remain. Therefore, the re-gion around 4 mm from the top surface moves downward during the increase of acoustic radiation force because of the downward displacement caused by vertical components of acoustic radiation forces and that caused by the horizontal compression in the region nearer than 4 mm from the top surface.
As shown in Fig. 3-11, the measured displacement distribution showed that the strain inside the object was successfully generated. However, at this moment, it is difficult to esti-mate the elastic modulus distribution precisely due to the problems described below.
Strain Induced by Dual Acoustic Radiation Force 53
MTC
Figure 3-12. (a) Sound field generated by the ultrasonic transducer used for actuation. (b) Consid-eration of displacement distribution generated by two acoustic radiation forces
ASME_Fatemi_chap03.indd 53 3/15/2008 5:14:29 AM

(1) Measurement of Strain Distribution The stress applied by the acoustic radiation force is not the plane stress. Therefore,
the region, where the acoustic radiation force is applied, is displaced along not only one direction. However, in this study, only the beam-axis component of displace-ment was measured. To obtain the precise strain and elastic modulus distributions, a method for measuring three dimensional components of displacement is needed.
(2) Estimation of Magnitude of Applied Stress Equation (3-6), which used for estimation of the magnitude of the acoustic radia-
tion force, was derived by assuming the object to be a perfectly absorbing material. However, the attenuation coefficient of soft tissue has a finite value. For example, the mixture of muscle and fat (abdominal wall), is typically 3 dB/cm/MHz [13]. To estimate the magnitude of the applied acoustic radiation force, the attenuation coef-ficient of tissue should be considered.
(3) Estimation of Stress Distribution Figure 3-12a shows the sound pressure distribution, which is directly related to the
acoustic radiation force as shown by Eq. (3-6), generated by the ultrasonic trans-ducer used for application of the acoustic radiation force. As shown in Fig. 3-12a, the acoustic radiation force is a function of the geometry, and the stress distribution must be considered in addition to the strain distribution.
In addition, the distance between two focal points, beam angles, and depth of the re-gion of interest will be restricted by the factors described below.
When focal areas of two ultrasonic transducers overlap, the horizontal components of two acoustic radiation forces are compensated each other in the intersectional area. There-fore, for effective generation of the strain, two focal points are desired to be assigned so that sound fields generated by two transducers do not overlap within the object (= region of interest). On the other hand, when the distance between two focal points is very large in comparison with the size of the focal area, the displacement distribution is not so different from that caused by one acoustic radiation force. Therefore, the size of the region of interest (between two focal areas) should be comparable to the width of the ultrasonic beam.
Furthermore, to keep beam angles q1 and q2 similar at every depth, the distance be-tween two focal points should be changed in relation to the depth of the region of interest. This will be done using a phased array probe.
As described above, at this moment, it will be difficult to estimate the “absolute” elastic modulus precisely using the proposed method. Therefore, the elasticity of different individ-uals measured by the proposed method are difficult to be compared each other. However, for example, the temporal change or frequency dependence of the strain distribution within an individual is directly related to the change in the elastic property. The proposed method can detect such a relative change in the elastic property of an object.
3.7 CONCLUSIONS
In this study, in order to generate the regional strain inside the object, we constructed an experimental setup for application of cyclic remote actuation in the object using two fo-cused ultrasonic transducers. The phase difference between two acoustic radiation forces, which were respectively applied at two different positions in the object, was controlled to be 0 deg. The resultant displacements inside the object were successfully measured by the ultrasonic phased tracking method. These results show potential of the proposed method for generation of the regional strain inside the object.
54 Biomedical Applications of Vibration and Acoustics for Imaging and Characterisations
MTCASME_Fatemi_chap03.indd 54 3/15/2008 5:14:29 AM

Acknowledgments
The authors thank Mr. Michishita, Mr. Nishio, Mr. Takahashi, and Mr. Odagiri for their efforts in the experiments.
REFERENCES [1] Fatemi, M., and Greenleaf, J. F., 2002, “Vibro-Acoustic Mammography,” IEEE Transactions on Medi-
cal Imaging, 21, pp. 1– 8. [2] Fatemi, M., and Greenleaf, J. F., 1999, “Vibro-Acoustography: An Imaging Modality Based on Ultrasound-
Stimulated Acoustic Emission,” Proceedings of the National Academy of Sciences of the United States of America, 96, pp. 6603– 6608.
[3] Torr, G. R., 1984, “The Acoustic Radiation Force,” American Journal of Physics, 52, pp. 402– 408. [4] Nightingale, K., Soo, M. S., Nightingale, R., and Trahey, G., 2002, “Acoustic Radiation Force Impulse
Imaging: In Vivo Demonstration of Clinical Feasibility,” Ultrasound in Medicine and Biology, 28, pp. 227–235.
[5] Trahey, G. E., Palmeri, M. L., Bentley, R. C., and Nightingale, K. R., 2004, “Acoustic Radiation Force Impulse Imaging of the Mechanical Properties of Arteries: In Vivo and Ex Vivo Results,” Ultrasound in Medicine and Biology, 30, pp. 1163–1171.
[6] Fahey, B. J., Nightingale, K. R., Nelson, R. C., Palmeri, M. L., and Trahey, G. E., 2005, “Acoustic Ra-diation Force Impulse Imaging of the Abdomen: Demonstration of Feasibility and Utility,” Ultrasound in Medicine and Biology, 31, pp. 1185–1198.
[7] The Japan Society of Ultrasonics in Medicine, 1984, Japanese Journal of Medical Ultrasonics, 22, pp. 41– 46 [in Japanese].
[8] Kanai, H., Sato, M., Koiwa, Y., and Chubachi, N., 1996, “Transcutaneous Measurement and Spectrum Analysis of Heart Wall Vibrations,” IEEE Transactions on Ultrasonics, Ferroelectrics, and Frequency Control, 43, pp. 791–810.
[9] Kanai, H., Hasegawa, H., Chubachi, N., Koiwa, Y., and Tanaka, M., 1997, “Noninvasive Evaluation of Local Myocardial Thickening and Its Color-Coded Imaging,” IEEE Transactions on Ultrasonics, Ferroelectrics, and Frequency Control, 44, pp. 752–768.
[10] Kanai, H., Sugimura, K., Koiwa, Y., and Tsukahara, Y., 1999, “Accuracy Evaluation in Ultrasonic-Based Measurement of Microscopic Change in Thickness,” Electronics Letters, 35, pp. 949–950.
[11] Michishita, K., Hasegawa, H., and Kanai, H., 2003, “Ultrasonic Measurement of Minute Displacement of Object Cyclically Actuated by Acoustic Radiation Force,” Japanese Journal of Applied Physics, 42, pp. 4608– 4612.
[12] Hasegawa, H., Takahashi, M., Nishio, Y., and Kanai, H., 2006, “Generation of Strain Inside Objects Using Dual Acoustic Radiation Force,” Japanese Journal of Applied Physics, 45, pp. 4706– 4711.
[13] Odagiri, Y., Hasegawa, H., and Kanai, H., 2008, “Ultrasonic Measurement of Strain Distribution In-side Object Cyclically Compressed by Dual Acoustic Radiation Force,” Japanese Journal of Applied Physics, 47 (in press).
[14] Goss, S. A., Johnston, R. L., and Dunn, F., 1978, “Comprehensive Compilation of Empirical Ultra-sonic Properties of Mammalian tissues,” Journal of Acoustical Society of America, 64, pp. 423– 457.
Strain Induced by Dual Acoustic Radiation Force 55
MTCASME_Fatemi_chap03.indd 55 3/15/2008 5:14:29 AM

MTCASME_Fatemi_chap03.indd 56 3/15/2008 5:14:29 AM