strategic allocation of marketing resources: … allocation of marketing resources: methods and...
TRANSCRIPT
Electronic copy available at: http://ssrn.com/abstract=1270804
Marketing Science Institute Special Report 08-207
Strategic Allocation of Marketing Resources: Methods and Managerial Insights
Venkatesh Shankar
Copyright 2008 Venkatesh Shankar
MSI special reports are in draft form and are distributed online only for the benefit of MSI corporate and academic members. Reports are not to be reproduced or published, in any form or by any means, electronic or mechanical, without written permission.

Electronic copy available at: http://ssrn.com/abstract=1270804
STRATEGIC ALLOCATION OF MARKETING RESOURCES:
METHODS AND MANAGERIAL INSIGHTS
Venkatesh Shankar
Professor of Marketing and Coleman Chair in Marketing
Mays Business School
Texas A&M University
College Station 77845
979-845-3246
Email: [email protected]
MSI Report
September 2008
Acknowledgement: I thank Jeff Meyer for data collection assistance and Roger Kerin, Tarun Kushwaha, the AMA
review team, and the MSI review team for helpful comments.

STRATEGIC ALLOCATION OF RESOURCES:
METHODS AND INSIGHTS
(Venkatesh Shankar)
This article discusses how firms strategically allocate their resources between marketing and non-
marketing variables, across products, markets, channels, customers and over the product life cycle. It
presents resource allocation processes, models, and insights with examples drawn from different
companies and industries. It highlights emerging methods and research directions in strategic resource
allocation and planning for both executives and researchers.

1. Introduction and Overview of Resource Allocation
Marketing resource allocation is a strategic priority for organizations worldwide. From the largest
enterprise to the smallest start-up, marketing resource allocation continues to dominate the decision-
making realm of the chief marketing officer (CMO) and other marketing executives. Many marketers live
and die by the marketing allocation strategies they help formulate and execute. According to a recent
CMO Council (2007) report, the number-one challenge for most CMOs is to quantify, measure, and
improve the value of marketing investments and resource allocation. Therefore, a deep understanding of
marketing resource allocation is critical for practitioners and academics alike.
Marketing executives are interested in marketing resource allocation methods and the associated
substantive insights they can apply in practice. The key marketing resource allocation decisions include
those between marketing and product-related variables such as research and development (R&D); across
different products and brands, marketing mix elements, markets, countries, customers, and channels; and
over the product life cycle. An overview of these types of decisions appears in Figure 1. To assist these
decisions, marketing researchers have developed several resource allocation models. The applications of
these models have led to several useful empirical findings and insights.
< Figure 1 about here >
Consider the marketing resource allocation problem at Samsung Electronics, one of the world’s
leading electronics companies. In 1999, Eric Kim, at the time Samsung’s new executive vice president
and CMO, was challenged to reallocate a corporate budget of $1 billion across 14 products over 200
countries and to improve the return on marketing spending.1 Before the reallocation exercise, the
company had allocated resources to products and countries roughly in proportion to the sizes of the
products and markets. Faced with the reallocation task, Samsung collected data on variables such as
country population, population of target buyers, spending power per capita, per capita spending on
product category, category penetration rate, category growth, category profitability, share of the
company’s brand, media costs, previous marketing expenditures, and competitor actions. Samsung
1This example is drawn from Corstjens and Merrihue’s (2003) work.

2
developed a resource allocation model based on these factors and simulated forecasts of future profits
based on the revised model.
How did the new model change resource allocation at Samsung? It informed Samsung that the
company had invested more in North America and Russia than the profit potentials in those regions
justified. Following this analysis, Samsung reduced the total shares of the budget to these regions from
45% to 35%. Furthermore, the model pointed out that the firm had underinvested in Europe and China, so
Samsung increased the combined shares of the budget for those regions from 31% to 42%.
With regard to products, the model suggested that three categories—mobile phones, vacuum
cleaners, and air-conditioning units—were getting more than half the marketing budget, but other
potentially profitable categories (i.e., camcorders, DVD players and recorders, televisions, PC monitors,
refrigerators, and VCRs) were being starved of support. This finding convinced Samsung to reduce its
spending on mobile phones, vacuum cleaners, and air-conditioning units by 22%.
What were the results of the resource reallocation in Samsung? In 2002, the company achieved
significant market share gains in four categories in which it increased marketing spend: camcorders, flat-
panel computer monitors, DVD players and recorders, and digital televisions. It catapulted from tenth to
third in the digital music player market, from eighth to second in the LCD monitor market, and from an
insignificant rank to eighth in the portable DVD player market. Furthermore, Samsung’s brand value
increased by 30% to $8.3 billion, while the brand value of its closest rival, Sony, decreased by 7% to
$13.9 billion during the same period. Samsung’s annual sales rose 25% from $27.7 billion in 2001 to
$34.7 billion in 2002, while its net income grew from $5.1 billion in 2001 to $5.9 billion in 2002. These
improved results could be attributed at least in part to marketing resource reallocation. As Samsung’s
resource reallocation experience suggests, effective allocation of resources can help spiral a company’s
performance and brand value upward.
1.1. Types and Principles of Resource Allocation Models
Regardless of the allocation context, normative models of resource allocation can be classified
into four broad types: (1) a set of optimization rules applied to an econometrically estimated model, (2)

3
empirical models that offer norms for strategic decision making, (3) analytical models with or without
empirical estimation of market-specific parameters, and (4) decision calculus models in which the
parameters are assessed by managerial input (Gatignon 1993). The first two types of models are quite
similar in approach. Herein, we primarily review the first three types of models.2
In all the types of models, optimal resource allocation is based on the fundamental
microeconomic and mathematical principle that an optimal level of spending on an element of resource
allocation is that at which the marginal return from an investment in that element equals the marginal
costs of that investment. Many resource allocation decisions are based on elasticities or responsiveness
and costs or margins associated with the variables involved in the allocation problem. Elasticity of a
variable is the percentage change in the outcome variable (sales or profits) in response to a percentage
change in that variable. A key decision rule is to allocate most resources to the variable with the highest
elasticity.
2. Strategic Allocation of Marketing and Product-Related Resources
Whether at the corporate, business unit, or product line level, executives frequently make
decisions on allocating resources to both marketing activities and nonmarketing activities, such as R&D.
Although firms base such decisions on factors such as past decisions, the type of industry, whether the
product is new or existing, market responsiveness, and the interrelation among the different variables, not
much is known about the effectiveness of such decisions. Furthermore, there is a dearth of tools for such
resource allocation decisions.
2.1. Allocation Between R&D and Marketing
Allocation between R&D and marketing is a strategic decision. Consider, for example, the
pharmaceutical industry. In 2006, pharmaceutical companies in North America spent roughly $55.2
billion on R&D, or 19.4% of sales (PhRMA 2007), and $27.3 billion on marketing expenditures, or
approximately 10% of sales, for a total outlay of $83 billion, or approximately 30% of revenues, against
2 We do not address decision calculus models (e.g., Little 1970; Lodish 1971) and the issue of overall optimal
budget determination although the allocation and overall budget decisions may be related (Lodish, Curtis, Ness, and
Simpson 1988; Mantrala, Sinha, and Zoltners 1992).

4
industry sales of $274.9 billion. With such a large outlay on R&D and marketing, allocating resources
between them has critical implications for the returns to the firm.
The development of models for allocating resources between R&D and marketing has been a
subject of discussion and debate among academics and practitioners. Any effective model for allocation
between these two (or more) strategic variables involves a deep understanding of the industry, the
competitive context, the unique effects of each variable on firm profits, and the effects of interactions
among the variables.
Two issues make the formulation of an allocation model for R&D and marketing challenging.
First, although marketing expenditures have both short-term and long-term effects on firm sales and
profits (Dekimpe and Hanssens 1999), R&D investments primarily have a long-term effect on firm profits
(Erickson and Jacobson 1992). Second, the interactions between R&D and marketing investments and
their impact on firm profits are complex. On the one hand, higher marketing expenditures can enhance the
effectiveness of R&D spending, leading to increased R&D levels. On the other hand, greater marketing
spending can lead to lower R&D spending, given that most firms have fixed resources.
Most models do not deal directly with this high level of strategic allocation. There are, however,
descriptive models that study the effects of R&D and marketing variables on returns and profits (e.g.,
Bayus, Erickson, and Jacobson 2003; Erikson and Jacobson 1992) and offer implications for resource
allocation between these variables. Erickson and Jacobson (1992) estimate an econometric model of the
effects of R&D and advertising expenditures on stock market returns and return on investment and
conclude that after controlling for unobservable firm-specific factors and the feedback between
discretionary expenditures and profitability, the accounting and stock market returns to R&D and
advertising expenditures are substantially lower than previously believed. These findings imply that
companies should not allocate more expenditures to either R&D or marketing than required. Bayus,
Erickson, and Jacobson (2003) analyze financial returns from new product introductions in the computer
industry. They find that greater R&D spending and new product introduction is accompanied by a
reduction in marketing spending and that these changes lead to higher profit rates.

5
In practice, however, many firms set their R&D and marketing budgets according to one of the
following methods: objectives and task, percentage of sales revenues, percentage change from the
previous period, or competitive parity. These methods do not address the optimality of allocation between
R&D and marketing, so there is a strong need for optimal models of and insights into resource allocation
between R&D and marketing expenditures.
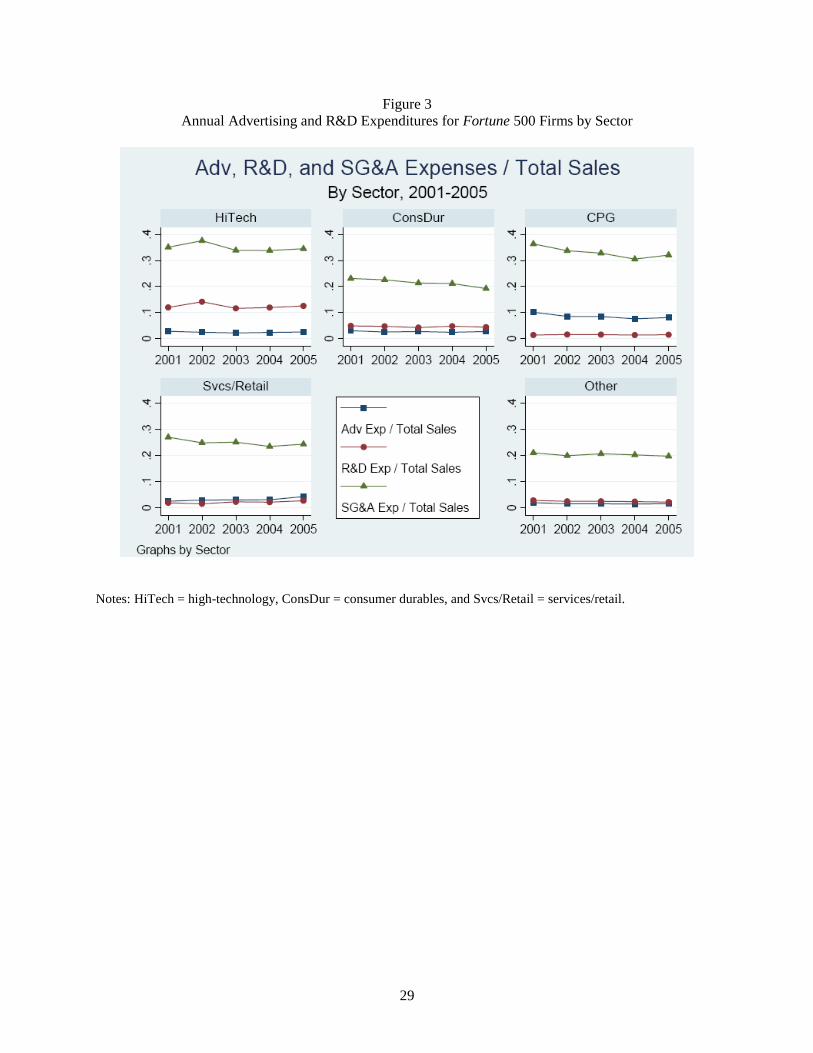
Figures 2 and 3 capture the resource allocation trends among R&D; selling, general, and
administrative (SG&A) expenses; and advertising during 2001–2005 for Fortune 500 companies. The
firms are divided into the following categories of industries: consumer packaged goods (CPGs), consumer
durables, services/retail, high-tech, and other.
< Figures 2 and 3 about here >
During 2001–2005, SG&A, advertising, and R&D expenses as a percentage of sales remained
fairly stable. Across industries, R&D expenses as a percentage of sales were consistently higher (2%–3%)
than advertising expenses as a percentage of sales. The high-tech and CPG sectors had the highest SG&A
expenses as a percentage of sales. The high-tech sector had the highest R&D expenses as a percentage of
sales, while the CPG sector had the highest advertising expenses as a percentage of sales.
During 2001–2005, in the consumer durables and CPG sectors, SG&A expenses as a percentage
of sales fell by approximately 4%, while advertising and R&D expenses as a percentage of sales remained
fairly stable. In the services/retail sector, SG&A expenses as a percentage of sales fell by approximately
3%, while advertising and R&D expenses as a percentage of sales rose by approximately 2% and 1%,
respectively. The high-tech sector consistently had the highest R&D expenditures as a percentage of
SG&A expenses, while the services/retail and CPG sectors had the lowest R&D expenditures. In the
services/retail sector, both advertising and R&D expenses as a percentage of SG&A expenses rose by
approximately 6% and 4%, respectively. Other than the consumer durables sector, which saw a jump of
approximately 4% in 2005, all other sectors’ advertising and R&D expenses as a percentage of SG&A
expenses remained fairly stable.
6
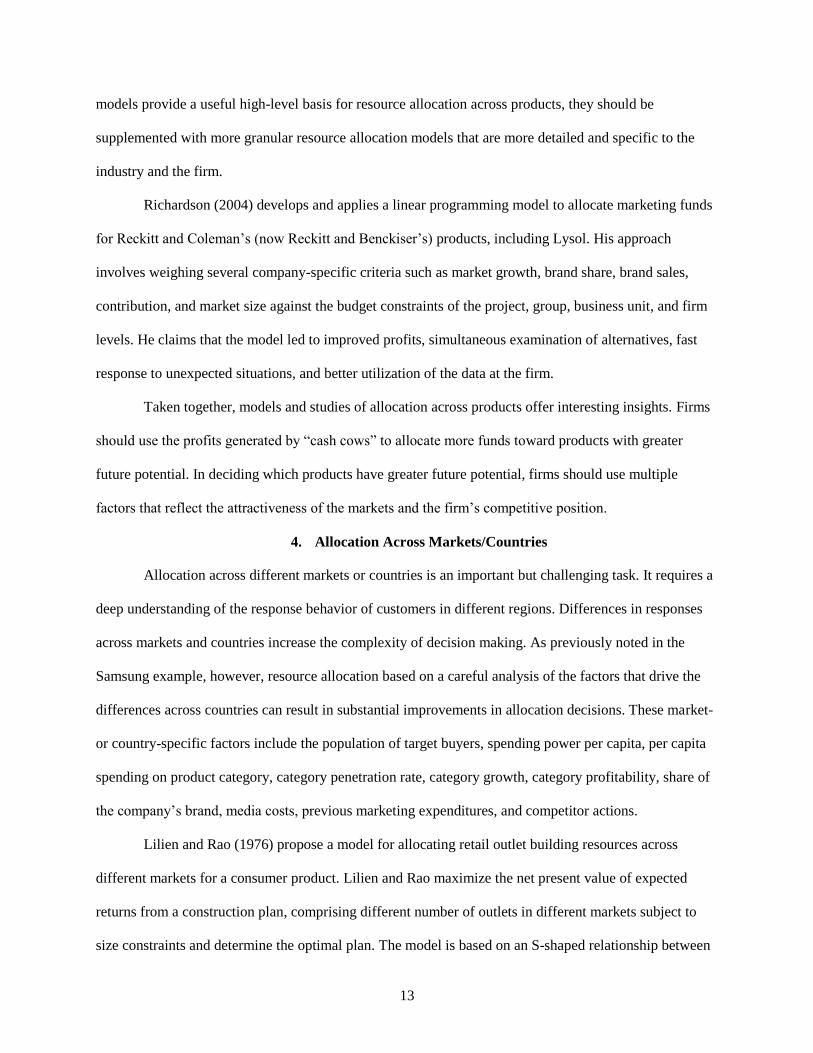
In summary, allocation to R&D is higher for high-tech firms, while allocation to marketing is
higher for consumer goods firms. During 2001–2005, expenditures on R&D and marketing remained
stable for most industries except for service firms, which increased both R&D and marketing
expenditures over this period. Firms should be careful not to overspend on R&D or marketing, and often,
if they increase R&D expenditures, they also reduce marketing spending.
When firms decide how much of the budget to allocate to marketing, the next decision is how to
spread those dollars across different marketing elements, such as advertising, sales force support, and
sales promotion. Marketing mix allocation is widely practiced by many firms, though the marketing mix
variables vary considerably across industries. In the pharmaceutical industry, for example, of the total
industry marketing spending of $27 billion in 2006, $15.9 billion was spent on detailing and samples,
$7.2 billion was expended on other professional physician marketing efforts (e.g., journal advertising),
and $4.2 billion was spent on direct-to-consumer advertising (IMS Health 2006). Thus, a majority of
allocation is toward sales force efforts.
In contrast, in the CPG industry, the bulk of the allocation is divided between advertising and
sales promotion. For example, Procter & Gamble used a marketing mix model to move approximately
$400 million of its 2005 marketing budget of $4.3 billion to advertising in new media, and Clorox used a
marketing mix model to shift its allocation from advertising to sales promotion (Neff 2004).
2.2. Allocation Between Advertising and the Sales Force
Advertising and sales force expenditures form a big chunk of firms’ marketing spending in many
markets, including those for industrial, high-tech, and pharmaceutical products. Lilien (1979) analyzed
marketing expenditure allocation data obtained during the 1970s on 131 diversified industrial products
from 22 companies through the ADVISOR, a joint project of Massachusetts Institute of Technology and
the Association of National Advertisers. The findings from Lilien’s analysis show that firms’ allocation
toward the sales force relative to advertising depends on its size, the size of an average order, the stage in
the product’s life cycle, the complexity of the product, the fraction of the product’s sales made-to-order,
and the purchase frequency of the product.

7
Often, marketing mix variables, such as advertising and sales force, are correlated. Rangaswamy
and Krishnamurthi (1991) propose an equity estimator for estimating regression models of sales response
in which the marketing mix variables are typically multicollinear. Their application to pharmaceutical
data shows that firms should spend more on the sales force than on advertising because sales force
elasticities are much higher than those for advertising for ethical drugs.
Gatignon and Hanssens (1987) develop an econometric model of the effects of local advertising
and sales force in the context of Navy recruitment. They estimate their model and show that sales force
effectiveness in the hiring of Naval personnel increased with local advertising support, suggesting a
synergy between advertising and personal selling efforts.
Gopalakrishna and Chatterjee (1992) develop and estimate a customer account level sales
response model to capture the separate and joint effects of advertising and personal selling (sales force)
on the sales of a mature industrial product in the presence of passive competitors. They conclude that the
optimal marketing budget increases with the number of accounts and the business potential of the
accounts. Although they do not directly address the allocation between advertising and personal selling,
they suggest that if customer accounts are equally responsive to communication effort, then greater
personal selling effort should be directed to the segment with the greater average business potential.
Shankar (1997) develops optimal allocation rules based on a decoupled multiplicative sales
response model of allocation between advertising and the sales force. The model allows for the interaction
between advertising and the sales force and is specified as follows:
(1) , with
it i i i i i ia b c d f g h i
it it jt it jt it jt it i
it
S e A A D D P P aT
,
where Sit is units sales, Ait is the advertising spending, Dit is the sales force spending, Pit is the unit price,
and Tit is the ―time in market‖ of brand i in period t. The terms a–h, , and are parameters to be
estimated, and j is the main competitor brand. Maximizing the profit function, , with respect to
advertising, sales force spending, and price provides the following:

8
(2) , ,
it it it it it itA D PMax m S A D F ,
where mit denotes the contribution margin and F is other fixed costs. Shankar derives the following
equilibrium levels of spending for advertising and the sales force, respectively:
(3) Ait* = bimitSit, and Dit* = dimitSit.
This result is an extension of the Dorfman and Steiner (1954) theorem on price and advertising
elasticities. This result holds (1) if both the competitors play a Nash game or make their marketing mix
decisions simultaneously or (2) if the competitor is a Stackelberg follower or makes the decision after the
focal brand in one or all of the marketing instruments. His results show that, in general, a follower
(leader) role in a marketing mix variable, a static (growing) market, a decrease (increase) in own
elasticity, and margin all lead to a reduction of spending in that variable. Shankar’s model and results
offer compelling insights into the allocation between advertising and the sales force. The allocation
strategies proposed by his model are both theoretically and empirically driven, so they have important
normative implications for managers. His empirical analysis, however, is based on one product category.
Collectively, these models offer some generalizable insights into allocation between advertising
and the sales force. The spending level on a marketing variable, such as advertising or sales force, is
typically directly proportional to the elasticity of the variable and contribution margin. Managers should
allocate spending between advertising and the sales force according to their competitively relative
elasticities. These elasticities may differ across industries, markets, and firms.
2.3. Allocation Between Advertising and Sales Promotion
In many markets, marketers need to decide the levels of expenditures for advertising and sales
promotion. This decision is particularly important for consumer products and services. For CPGs, during
the past two decades, the spending on advertising relative to sales promotion has steadily declined. For
some of these products, sales promotion now constitutes two-thirds or more of marketing spending.
Many practitioners follow several rules of thumb, including spending 75% of the budget on
proven media, message, and channels and at least 5% on well-designed marketing allocation experiments.

9
Several factors have contributed to the continuing dominance of sales promotion over advertising for
CPGs. First, most consumers make purchase decisions at the point of purchase, compelling marketers to
spend more on in-store features, display, and other merchandising activities. Second, retailers have
become more powerful over the years, so trade promotions have increased considerably. Third, mass
media advertising has become fragmented and less effective with the advent and growth of the Internet,
digital video recorders, and more targeted communication vehicles.
A few studies have examined the allocation between advertising and trade promotions.
Sethuraman and Tellis (1991) incorporate two facets of trade promotions (price cuts) into the Dorfman
and Steiner (1954) model of allocation: the opportunity loss from buyers who would have bought at the
regular price and the loss from retailers’ fractional pass-through of promotions to consumers. They find
that when both promotion and advertising are profitable, the allocation between them is determined by
their relative elasticities. Specifically, they find that for consumer nondurable goods, price cut elasticity is
approximately 20 times that of advertising elasticity, while for durable goods, the corresponding ratio is
only five.
Neslin, Powell, and Stone (1995) analytically extend the substitutability of advertising and trade
promotion in optimal allocation to a dynamic context that includes a retailer’s forward-buying behavior
and carryover effects of advertising. Such a lopsided ratio of promotion to advertising elasticities may
explain the migration of marketing dollars toward sales promotion for CPGs during recent years.
However, because advertising has long-term effects (Dekimpe and Hanssens 1999), companies may be
myopic in overallocating to sales promotion on the basis of short-term effects.
Although there are rules of thumb and marketing mix models that guide the allocation of
marketing spending between advertising and sales promotion, many of these are not based on
optimization principles. A major challenge in developing optimal allocation models between advertising
and sales promotion is that often these two variables have synergistic effects on sales and profits, making
it difficult to disentangle their unique effects.

10
Naik and Raman (2003) develop a dynamic advertising model (with advertising carryover effects)
that captures synergy between communications in multiple media, using the Kalman filtering
methodology. They estimate their model on data from Dockers brand and show a synergistic effect
between television and print advertisements. They conclude that as the synergistic effect increases, a firm
should raise its advertising budget and also increase its allocation to the less effective medium. They
generalize the model to include differential advertising carryover and asymmetric synergy among media
elements.
Naik, Raman, and Winer (2005) propose a model for allocation between advertising and sales
promotion when the two have interaction effects and when managers can incorporate strategic foresight
about competitor behavior. They use an extended Lancaster model and develop a continuous-discrete
estimation method to calibrate dynamic models of oligopoly using market data. In the Naik and
colleagues (2005) optimization model, brand i decides its advertising (u) and promotional expenditures
(υ) to maximize it performance index given by:
(4) dttuctmttpeu iiii
T
t
t
ii ))](()())()([(),0
where ρ is the discount rate, p is the brand price, m is the market share, c is the cost of advertising, and t is
time. Solving this dynamic optimization model using data on five detergent brands, Naik and colleagues
(2005) find that large brands underadvertise and overpromote, while small brands underadvertise and
underpromote and that competitor responses to advertising and promotion are asymmetric.
In summary, consumer goods companies increasingly allocate more toward sales promotion and
nontraditional media relative to advertising in the mass media, mainly because short-term mass media
advertising elasticities are much smaller than elasticities of promotion or targeted media advertising.
When interactions between advertising and sales promotions are included, large brands tend to
underadvertise and overpromote, while small brands appear to advertise less and promote more.
2.4. Other Marketing Mix Allocations
11
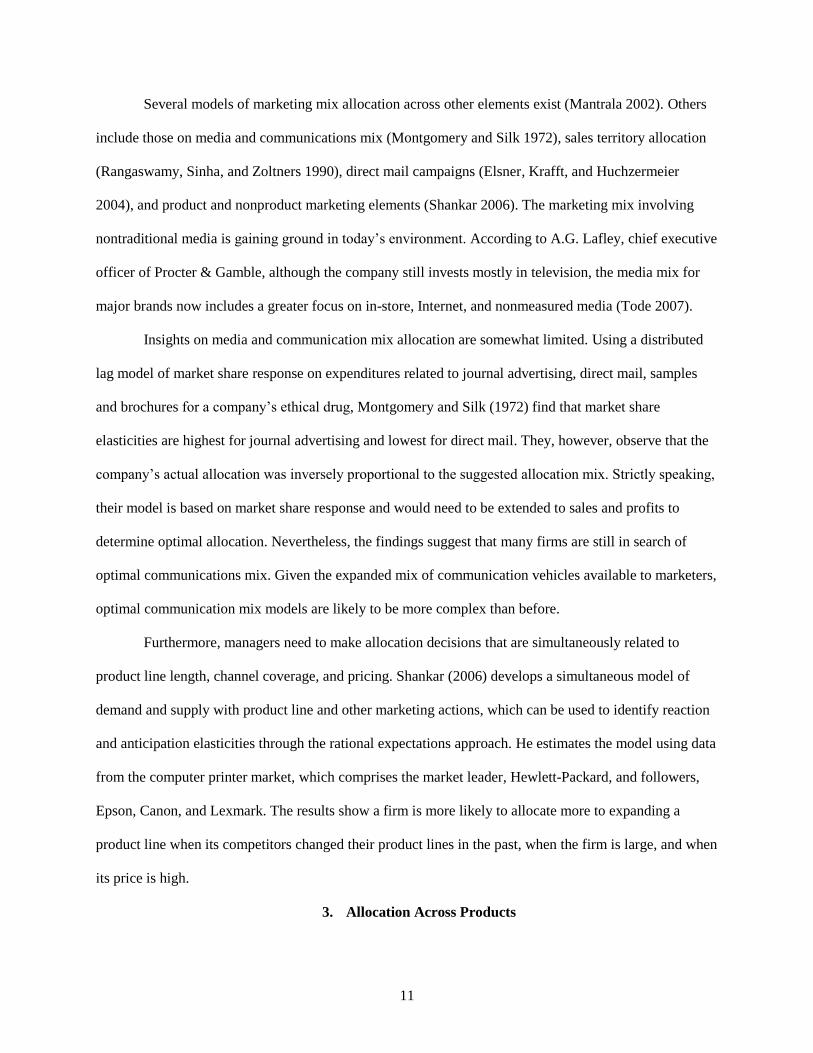
Several models of marketing mix allocation across other elements exist (Mantrala 2002). Others
include those on media and communications mix (Montgomery and Silk 1972), sales territory allocation
(Rangaswamy, Sinha, and Zoltners 1990), direct mail campaigns (Elsner, Krafft, and Huchzermeier
2004), and product and nonproduct marketing elements (Shankar 2006). The marketing mix involving
nontraditional media is gaining ground in today’s environment. According to A.G. Lafley, chief executive
officer of Procter & Gamble, although the company still invests mostly in television, the media mix for
major brands now includes a greater focus on in-store, Internet, and nonmeasured media (Tode 2007).
Insights on media and communication mix allocation are somewhat limited. Using a distributed
lag model of market share response on expenditures related to journal advertising, direct mail, samples
and brochures for a company’s ethical drug, Montgomery and Silk (1972) find that market share
elasticities are highest for journal advertising and lowest for direct mail. They, however, observe that the
company’s actual allocation was inversely proportional to the suggested allocation mix. Strictly speaking,
their model is based on market share response and would need to be extended to sales and profits to
determine optimal allocation. Nevertheless, the findings suggest that many firms are still in search of
optimal communications mix. Given the expanded mix of communication vehicles available to marketers,
optimal communication mix models are likely to be more complex than before.
Furthermore, managers need to make allocation decisions that are simultaneously related to
product line length, channel coverage, and pricing. Shankar (2006) develops a simultaneous model of
demand and supply with product line and other marketing actions, which can be used to identify reaction
and anticipation elasticities through the rational expectations approach. He estimates the model using data
from the computer printer market, which comprises the market leader, Hewlett-Packard, and followers,
Epson, Canon, and Lexmark. The results show a firm is more likely to allocate more to expanding a
product line when its competitors changed their product lines in the past, when the firm is large, and when
its price is high.
3. Allocation Across Products

12
Marketers make decisions on the allocation of funds toward different products and brands in their
product portfolio. Models on allocation across products range from product portfolio models to models
for a specific industry context (e.g., Mantrala, Sinha, and Zoltners 1992). Among product portfolio
models, the Boston Consulting Group (BCG) matrix (Henderson 1998) is the best-known tool. This
matrix begins with identifying the positions of a firm’s or a business unit’s products along two
dimensions: relative market share and market growth rate. Products can fall under four possible
quadrants. (1) ―Cash cows‖ are products that are characterized by high relative market share but low
market growth rate, (2) ―stars‖ are those that have both high growth rate and relative market share, (3)
―question marks‖ or ―problem children‖ refer to products that have low relative market share in high-
growth markets, and (4) ―dogs‖ are products that have low relative market share in low-growth markets.
The main resource allocation guidelines are to use the surplus cash from ―cash cows‖ and ―stars‖ (if any)
to fund ―question marks‖ so as to help them become ―stars‖ for the future and to divest ―dogs‖ unless they
are strategic complements to other products or have substantial exit barriers.
Many firms practice variants of this tool (Kerin, Mahajan, and Varadarajan 1990). The
enhancements to the BCG model are based on the recognition that relative market share is a proxy for
competitive strength, and market growth is a measure of market attractiveness. For example, General
Electric uses a model that has these two broad dimensions, which are determined by multiple indicators
that include relative market share and market growth.
Despite their widespread use, product portfolio models suffer from several limitations. First, they
do not explicitly incorporate profits or margins as a major criterion. They implicitly assume that profits
are correlated with relative market share. Second, the allocation rules from these models are based on a
static view of the business universe. In reality, fast movement in markets and competitive dynamics may
alter some product positions in the matrix, calling for changes in allocation rules that are difficult to make
after investments are made on analysis of the original matrix. Third, the definitions of high- and low-
growth rates or relative market shares are subjective, driving the categorization of products as ―stars,‖
―question marks,‖ ―cash cows,‖ or ―dogs‖ and the allocation rules. Therefore, although the portfolio
13
models provide a useful high-level basis for resource allocation across products, they should be
supplemented with more granular resource allocation models that are more detailed and specific to the
industry and the firm.
Richardson (2004) develops and applies a linear programming model to allocate marketing funds
for Reckitt and Coleman’s (now Reckitt and Benckiser’s) products, including Lysol. His approach
involves weighing several company-specific criteria such as market growth, brand share, brand sales,
contribution, and market size against the budget constraints of the project, group, business unit, and firm
levels. He claims that the model led to improved profits, simultaneous examination of alternatives, fast
response to unexpected situations, and better utilization of the data at the firm.
Taken together, models and studies of allocation across products offer interesting insights. Firms
should use the profits generated by ―cash cows‖ to allocate more funds toward products with greater
future potential. In deciding which products have greater future potential, firms should use multiple
factors that reflect the attractiveness of the markets and the firm’s competitive position.
4. Allocation Across Markets/Countries
Allocation across different markets or countries is an important but challenging task. It requires a
deep understanding of the response behavior of customers in different regions. Differences in responses
across markets and countries increase the complexity of decision making. As previously noted in the
Samsung example, however, resource allocation based on a careful analysis of the factors that drive the
differences across countries can result in substantial improvements in allocation decisions. These market-
or country-specific factors include the population of target buyers, spending power per capita, per capita
spending on product category, category penetration rate, category growth, category profitability, share of
the company’s brand, media costs, previous marketing expenditures, and competitor actions.
Lilien and Rao (1976) propose a model for allocating retail outlet building resources across
different markets for a consumer product. Lilien and Rao maximize the net present value of expected
returns from a construction plan, comprising different number of outlets in different markets subject to
size constraints and determine the optimal plan. The model is based on an S-shaped relationship between

14
outlet share and market share. Lilien and Rao implemented their model in a consumer goods firm in
which, it went on to become an integral part of the planning process.
In addition to market-specific factors, some cross-market factors such as diffusion, market
learning, and multimarket competition may drive allocation rules. Chintagunta and Desiraju (2005)
develop a structural model that incorporates both cross-market contact effects, in addition to interaction
effects, across marketing instruments and within-market competitive interaction effects, consistent with
the theory of multimarket contact competition. They estimate their model using data from multiple
European countries for a blockbuster category of ethical drugs. They find that detailing elasticities are
comparable across the United States, Germany, and Italy but are higher in the United Kingdom and
France, suggesting a greater allocation of the detailing budget to the latter regions.
Fischer et al. (2005) propose a market response model for entry timing across countries. Although
they do not explicitly address allocation of marketing expenditures across countries, their results on
marketing expenditures have implications for such allocation decisions. They find that a waterfall
international entry strategy (entering markets sequentially) enhances marketing spending effectiveness.
The normative implication for a brand that sequentially enters multiple markets or countries is that it
should allocate greater spending to the later countries of entry than what would be appropriate based on
market response in those countries if there were no prior entries in other countries.
Thus, although allocation across market or countries is a critical task, little practical guidance is
available. The allocation criteria should go beyond country-specific factors, such as target market
population, category growth, and profitability, to include cross-country effects that may be due to
diffusion, market learning, and multimarket competition.
5. Allocation Across Customers and Channels
As organizations become more customer-centric, the allocation of resources by customers and
customer segments is gaining greater importance than ever before. As companies increasingly offer their
products through multiple channels, such as retail stores, the Web, and catalog or direct mail, and as more

15
consumers buy them through different channels, the allocation of marketing efforts targeted at customers
across channels is also becoming a critical issue for many marketers.
Models of marketing resource allocation across customers are primarily based on customer
lifetime value (CLV). Venkatesan and Kumar (2004) identify low- and high-value customer segments on
the basis of CLV and determine the optimal allocation of marketing resources to these segments.
Venkatesan and Kumar maximize the following expression for CLV to determine ximl, the optimal
number of communication contacts to customer i in channel m in year l.
(5)
i
i
T
y
n
ll
m imliml
fy
iy
ir
xc
r
CMCLV
1 11/ )1()1(
where CM is predicted contribution margin, y is purchase occasion, r is discount rate, c is unit marketing
cost, f is predicted purchase frequency, n is number of years to forecast, and T is predicted number of
purchases until the end of the planning period. Applying this model to data from a large multinational
computer hardware and software company, Venkatesan and Kumar find that the effect of marketing
communication on CLV is nonlinear across channels and that marketers can improve profits by
maximizing CLV.
Prior research has also examined the allocation between customer acquisition and retention
(Reinartz, Thomas, and Kumar 2005) and between retention and reacquisition of lost customers (Thomas,
Blattberg, and Fox 2004).
As the practice of allocation by customer segment has evolved, allocation across customer-
channel segments has become the next key development in resource allocation practice (Kushwaha and
Shankar 2007, 2008). A study by McKinsey & Company calls for developing resource allocation metrics
across channels (Myers, Pickersgill, and Van Metre 2004). Neslin and colleagues (2006) emphasize the
need to develop models for the allocation of marketing resources across channels.
Anderson, Lodish, and Weitz (1987) study the impact of variables associated with a financial
portfolio model and the channel relationship on the selling time allocated by 71 independent sales
agencies to the principals they represent. They find that the time (and resource) allocated to principals is

16
consistent with an optimal microeconomic model, but channel relationship elements such as
communication, participation, and feedback also influence resource allocation.
Kushwaha and Shankar (2008) propose an approach and model for optimal allocation of
marketing efforts to each customer-channel segment. Their approach comprises marketing response
models for each component of firm profit, purchase frequency, purchase quantity, product return
propensity, and contribution margin. Their purchase frequency model is an extended beta
geometric/negative binomial distribution model, purchase quantity and product return propensity is a
conditional negative binomial distribution model, and contribution margin is a gamma–gamma model.
The optimal marketing effort allocation to each customer-channel segment is a function of the model
parameters for that segment. They estimate the models using customer-level purchase, cost, and
promotional data from a large marketer of shoes and apparel accessories across the catalog, the store, and
the Web and solve the optimization model in Excel using simulation. Their results show that consumer
response to the company’s marketing efforts varies significantly across the customer-channel segments
for the different profit components, purchase frequency, purchase quantity, and contribution margin.
Figure 4 shows the differential responsiveness across segments. Using a holdout sample analysis, they
show that firm profits can be substantially improved by optimally reallocating marketing efforts across
the different customer-channel segments. In their revised allocation, the multichannel segment exhibits
the highest percentage growth in budget and profit, highlighting the high profit potential of the
multichannel segment.
< Figure 4 about here >
Overall, there are some useful insights into allocation by customers and channels. Firms should
allocate more to customers and customer segments that have higher CLVs than others. Multichannel
customer segments are most profitable, so an optimal allocation model based on the responsiveness of
customer-channel segment by profit components, such as purchase frequency, quantity, contribution, and
return propensity, can help marketers improve the returns to marketing efforts.
6. Allocation over the Product Life Cycle

17
As a product goes through different stages in the product life cycle, marketers’ strategic
allocation decisions heavily influence its growth. Prior empirical analyses offer conflicting evidence or
guidelines on changes in advertising spending over the product life cycle. Lilien and Weinstein (1984)
and Parsons (1975) suggest that firms should decrease advertising expenditures over the life cycle, while
Winer (1979) suggests that companies should increase advertising spending over the life cycle. However,
Farris and Buzzell (1979) find no evidence for the main effect of the product life cycle on advertising
expenditures. These studies do not consider any interaction or moderating effects of the product life cycle,
nor do they study the allocation between advertising and other marketing mix variables, such as sales
force.
Shankar (2008) develops a model to examine the effects of the product life cycle stages on a
brand’s strategic marketing allocation between advertising and the sales force. He allows the parameters
to be moderated by the stage in the product life cycle. He estimates his model on data obtained from 29
brands in eight leading pharmaceutical categories over their life cycles. The results show that a brand’s
strategic marketing (pull vs. push, or emphasis on advertising vs. sales force expenditures) is moderated
by its market position and the stage it is in the product life cycle. The results also show that dominant
brands significantly shift their resource allocation toward a push strategy or sales force while moving
from the growth to the mature stages of the product life cycle; in contrast, weak brands shift their
allocations toward a pull strategy or advertising from the growth to the mature stages. Shankar’s (2008)
data cover the largest therapeutic categories over long periods, making the analysis empirically
generalizable to the pharmaceutical industry. Nevertheless, the data do not include R&D expenditures and
do not cover other industries.
Taken together, the models offer some useful insights for effective resource allocation decisions
over the product life cycle. A dominant (weak) brand shifts its strategic resource allocation toward a push
(pull) strategy as it moves from the growth to the mature stages of the life cycle. Therefore, allocation to

18
advertising relative to the sales force may decrease (increase) for dominant (weak) brands over their life
in markets that are more elastic to sales force than advertising.
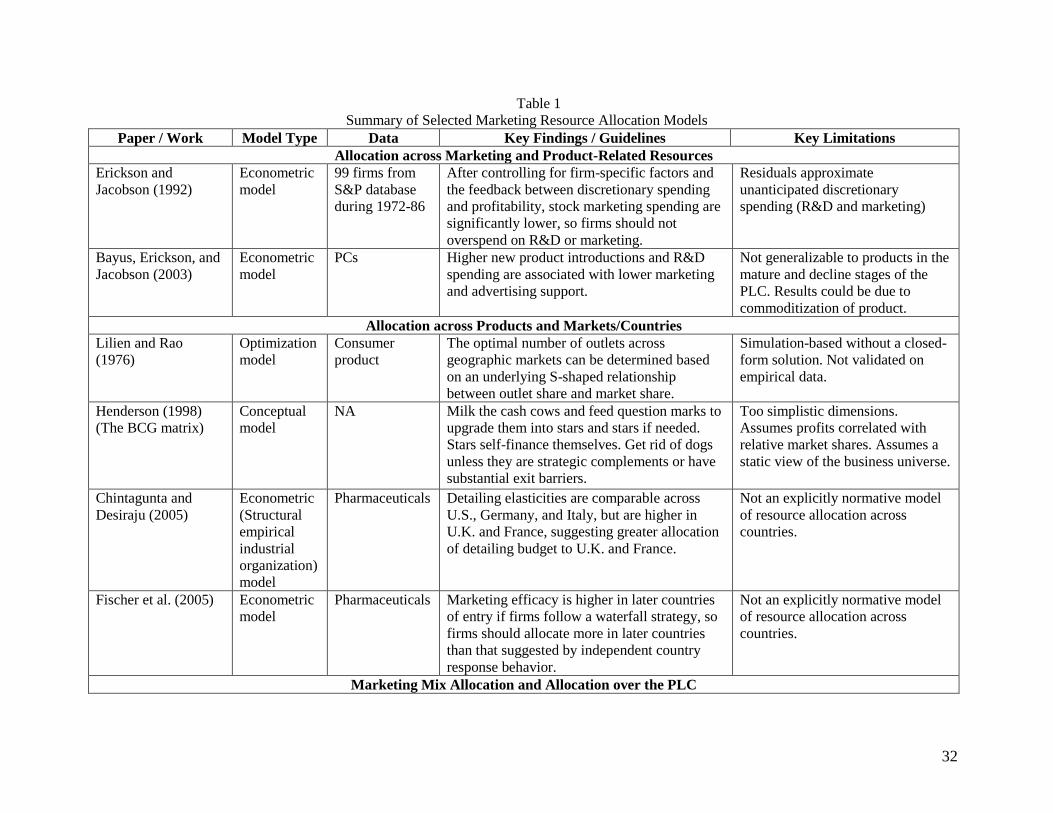
A summary of selected resource allocation models, the associated data, key findings, and
limitations appears in Table 1. The models range from econometric models to optimization models to
game-theoretic or other analytic models. The data cover a broad spectrum of industries, including CPGs,
durables, pharmaceutical drugs, and industrial products. The key insights include optimal allocation based
on competitively relative elasticities and several factors such as target population, category profitability,
and growth potential. A key limitation of most models is that competitor responses—particularly,
anticipated competitor actions—are not captured well. Furthermore, interaction effects among allocation
variables are not often explicitly incorporated into the optimization approach.
< Table 1 about here >
7. Allocation to New Media
With the emergence and rapid growth of unmeasured and new media, the allocation of marketing
resources to these avenues is becoming a challenging task for marketers of all products (Shankar and
Hollinger 2007). Spending on unmeasured media includes expenditures on search engine marketing,
Internet search ads, mobile media, social networking media, events, contests, in-store ads, and product
placement. Although the proportion of the marketing budget allocated to such media is still low for many
products, it is rising. For example, Nike’s allocation of its U.S. advertising budget to unmeasured media
increased from 45% in 1996 to 67% in 2006 (Story 2007). Furthermore, although most CPG
manufacturers still spend the vast majority of their marketing budgets on traditional media, their
allocation to new media is steadily increasing. For example, Procter & Gamble, the leading consumer
goods marketing spender, hiked its spending on unmeasured media in 2006 by roughly 15% over 2005
compared to an increase of only 3.9% in measured media in the same period (Advertising Age 2007).
A report based on a survey of 382 marketers reveals interesting patterns in marketing mix
spending and allocation to the new media (DMA 2008). A summary of the use of the media types appears
in Figure 5. According to the report, email is used by most marketers (79.1%), followed by direct mail

19
(75.4%); 75.8% of respondents use more email, 61.1% use more online video, and 62.9% use more search
engine marketing, than they were using three years earlier. The survey found that for business-to-
consumer (B2C) marketers, direct mail continues to be the most popular marketing avenue (32.2%),
followed by email (11.3%) and that marketers attribute 29% of the revenue generated from a campaign to
direct mail, followed by email with 21.6% . The return on investment (ROI), however, is greater for email
than it is for other forms of communication (nearly twice the revenue share relative to its budget share),
according to the report.
The study also reports interesting differences between B2C and business-to-business (B2B)
companies and between small and big firms. It reports that B2B integrated campaigns use telephone
(42.7% vs. 29.3%) and events (34.9% vs. 18%) more often than do B2C campaigns, which in turn use DR
Newspaper/Magazine ads (29.4% vs. 18.2%) and DR TV/Radio (29.4% vs. 4.2%) ads more frequently
than do B-2B campaigns. Furthermore, according to the study, B2C (B2B) marketers derive 8.2% (1.1%)
of their responses from their direct marketing campaigns. Finally, the study found that more small
companies (fewer than 100 employees) use new media than do large companies---17.9% vs. 11.4% use
RSS feeds, 32.1% vs. 24.6% blog, and 28.4% vs. 23.2% have social networking sites.
Retailers are using different forms of the new media. Many retailers use email to alert shoppers
about new products, promotions, and store openings. Some retailers like Kroger
(http://shortcuts.com/?promo=kroger) even offer coupons for downloading at their websites onto her/his
loyalty card, saving the need to identify and clip coupons. Consumers can automatically redeem these
coupons at the store checkout when they present their loyalty card. Retailers like American Eagle has
Facebook applications, while retailers like Wal-Mart and Target have Facebook sponsored groups, Urban
outfitters has MySpace pages, 1-800-Flowers has second life e-stores, Buy.com, Radioshack, and
Overstock.com have Youtube/Video podcasts, and Officemax, Burger King and Taco Bell have viral
micro sites (Bustos 2008).
There is a dearth of formal models of allocation to new media. Effective allocation models in the
context of the new media require a deep understanding of the effectiveness of these media. Although

20
improved data availability in the new media enables firms to measure their effectiveness more accurately
than before, existing metrics are still in their infancy. For example, in the initial years of the Internet,
marketing allocation to the Web was based primarily on ―eyeballs‖ or site traffic. With the advent and
growth of targeted search advertising pioneered by Google, click-through has become the key metric for
allocating advertising dollars on the Web. Marketers, however, are still searching for a more appropriate
measure because click-through still suffers from limitations, such as the inability to control for click-
fraud.
The core principle of allocating resources in proportion to their competitively relative elasticities
is no different in this context than it is in the context of traditional media, the only exception being that
the key metrics used for measuring customer responsiveness to marketing in these media are different
from those in traditional media. As these metrics evolve, the resource allocation models will become
more specific to the media.
8. Future Research Issues
As we move forward, resource allocation contexts and elements will likely become more
complex. Although the basic principles of resource allocation and fundamental underpinnings will likely
stay the same, the actual allocation rules will be based more on simulation than before. In many cases,
closed-form analytical expressions for optimal resource allocation decisions may not be available, so
managers will need to rely more on simulations for deriving the optimal decisions. Such simulations will
not be as onerous a task as in the past, given the availability of richer data and greater computing power
than before. In the future, managers will be more likely to use simulators and decision support systems for
resource allocation than they did in the past.
What should the future research priorities with regard to marketing resource allocation be? First,
we need to develop resource allocation models that are based on the relationship between marketing
spending and company or shareholder value rather than on the link between marketing expenditures and
profits alone.

21
Second, future resource allocation models should incorporate different scenarios of anticipated
competitor responses in deriving optimal allocation rules. This exercise calls for data from different
contexts that involve different types of competitor responses.
Third, there should be greater research on allocation of resources to the new media. Both
manufacturers and retailers need better models of relative allocation of marketing budget toward
traditional and new media. Models should incorporate interaction effects between the two types of media
and the different media vehicles that make up these media.
Fourth, additional research is needed on the linkages between different types and levels of
allocation decisions. Existing research allocation models focus on a single allocation type or level or
context (e.g., marketing vs. sales force allocation, allocation across products) in isolation. Because many
resource allocation decisions are interdependent, we need models that simultaneously optimize across
different types of decisions. For example, a model that simultaneously optimizes allocation between R&D
and marketing and within the marketing mix could offer more effective and precise allocation rules. Such
models would likely be complex and simulation based.
Finally, research on the convergence of insights from the different types of allocation models is
desirable. The allocation rules resulting from a triangulation of insights from different models would offer
greater confidence to the decision-makers.
9. Conclusion
As the allocation of marketing resources continues to be a critical strategic priority for CMOs and
other marketing executives worldwide, the application of existing models of strategic allocation and the
emergence of new models are gaining importance. Strategic allocation of resources includes those
between marketing and nonmarketing (e.g., R&D) variables; across marketing mix, products, markets,
countries, customers, and channels; and over the product life cycle. Different models are available for
these decisions. The core principle of allocation in these models is based on the relative responsiveness or
elasticity of the outcome variable (e.g., sales, profits) to change in the allocation elements (e.g., marketing

22
vs. R&D, products, and channels). The relative elasticity is driven by factors such as the industry,
company size, strengths and weaknesses, and stage in the product life cycle.
Although these models offer important guidance to managers, considerable potential exists for
improved models of resource allocation that can incorporate greater complexity, interactions among
variables, and anticipated competitor responses. To offer improved managerial guidance, future models of
resource allocation should address issues such as the relationship of spending with shareholder value,
incorporation of future competitor responses, spending on new media, and linkages between different
types and levels of allocation.
23
References
Advertising Age (2007), ―100 Leading National Advertisers,‖ June 25.
Anderson, Erin, Leonard M. Lodish, and Barton A. Weitz (1987), ―Resource Allocation Behavior in
Conventional Channels,‖ Journal of Marketing Research, 25 (February), 85–97.
Bayus, Barry L., Gary Erickson, and Robert Jacobson (2003), ―The Financial Rewards of New Product
Introduction in the Personal Computers Industry,‖ Management Science, 49 (2), 197–211.
Bustos, Linda (2008), ―110 Ways Retailers are Using Social Media,‖ http://www.getelastic.com/social-
media-examples, last accessed, July 20, 2008.
Chintagunta, Pradeep K. and Ramarao Desiraju (2005), ―Strategic Pricing and Detailing Behavior in
International Markets,‖ Marketing Science, 24 (1), 67–80.
CMO Council (2007), CMO Council 07 Outlook Report, (accessed December 10, 2007), [available at
http://www.cmocouncil.org].
Corstjens, Marcel and Jeffrey Merrihue (2003), ―Optimal Marketing,‖ Harvard Business Review,
(October), 114–21.
Dekimpe, Marnik G. and Dominique M. Hanssens (1999), ―Sustained Spending and Persistent Response:
A New Look at Long-Term Marketing Profitability,‖ Journal of Marketing Research, 36
(November), 397–412.
Direct Marketing Association (2008), The Integrated Marketing Media Mix, New York, NY.
Dorfman, Robert and Peter O. Steiner (1954), ―Optimal Advertising and Optimal Quality,‖ American
Economic Review, 44 (5), 826–36.
Elsner, Ralf, Manfred Krafft, and Arnd Huchzermeier (2004), ―Optimizing Rhenania's Direct Marketing
Business Through Dynamic Multilevel Modeling (DMLM) in a Multicatalog-Brand
Environment,‖ Marketing Science, 23 (2), 192–206.
Erickson, Gary and Robert Jacobson (1992), ―Gaining Comparative Advantage through Discretionary
Expenditures: Returns to R&D and Advertising,‖ Management Science, 38 (9), 1264–79.
Farris, Paul and Robert Buzzell (1979), ―Why Advertising and Promotional Costs Vary: Some Cross-
Sectional Analyses,‖ Journal of Marketing, 43 (Autumn), 112–22.
Fischer, Marc, Venkatesh Shankar, and Michel Clement (2005), ―Can a Late Mover Use International
Market Entry Strategy to Challenge the Pioneer?‖ MSI Report No. 05-004, Marketing Science
Institute.
Gatignon, Hubert (1993), ―Marketing Mix Models,‖ in Handbook in Operations Research and
Management Science: Marketing, J. Eliashberg and Gary L. Lilien, eds. Amsterdam: Elsevier
Science, 697–728.
_______ and Dominique M. Hanssens (1987), ―Modeling Marketing Interactions with Application to
Salesforce Effectiveness,‖ Journal of Marketing Research, 24 (August), 247-257.
24
Gopalakrishna, Srinath, and Rabikar Chatterjee (1992), ―A Communications Response Model for a
Mature Industrial Product: Application and Implications,‖ Journal of Marketing Research, 29
(May), 189-200.
Henderson, Bruce (1998), ―The Product Portfolio,‖ in Perspectives on Strategy from the Boston
Consulting Group, Carl W. Stern and George Stalk Jr., eds. Boston: BCG Publications.
IMS Health (2006), IMS Retail Drug Monitor, (December).
Kerin, Roger A., Vijay Mahajan, and P. Rajan Varadarajan (1990), Contemporary Perspectives on
Strategic Market Planning. Boston: Allyn & Bacon.
Kushwaha, Tarun and Venkatesh Shankar (2007), ―Single Channel vs. Multichannel Customers:
Determinants and Value to Retailers,‖ working paper, Mays Business School, Texas A&M
University.
——— and ——— (2008), ―Optimal Allocation of Marketing Efforts by Customer-Channel Segment,‖
working paper, Mays Business School, Texas A&M University.
Lilien, Gary L. (1979), ―Advisor 2: Modeling the Marketing Mix Decision for Industrial Products,‖
Management Science, 25 (2), 191–204.
______ and Ambar G. Rao (1976), ―A Model for Allocating Retail Outlet Building Resources Across
Market Areas,‖ Operations Research, 24 (1), 1-14.
——— and David Weinstein (1984), ―An International Comparison of the Determinants of Industrial
Marketing Expenditures,‖ Journal of Marketing, 48 (Winter), 46–53.
Little, John D.C. (1970), ―Models and Managers: The Concept of Decision Calculus,‖ Management
Science, 16 (8), B466–B484.
Lodish, Leonard M. (1971), ―CALLPLAN: An Interactive Salesman’s Call Planning System,‖
Management Science, 18 (12), 25–40.
______, E. Curtis, M. Ness, and M.K. Simpson (1988), ―Sales Force Sizing and Deployment Using a
Decision Calculus Model at Syntex Laboratories,‖ Interfaces, 18 (January-February), 5-20.
Mantrala, Murali, K. (2002), ―Allocating Marketing Resources,‖ in Handbook of Marketing, Barton A.
Weitz and Robin Wensely, eds. Thousand Oaks, CA: Sage Publications, 409–435.
———, Prabhakant Sinha, and Andris A. Zoltners (1992), ―Impact of Resource Allocation Rules on
Marketing Investment-Level Decisions and Profitability,‖ Journal of Marketing Research, 29
(May), 162–75.
Montgomery, David B. and Alvin J. Silk (1972), ―Estimating Dynamic Effects of Marketing
Communication Expenditures,‖ Management Science, 18 (June), B485-501.
Myers, Joseph B., Andrew D. Pickersgill, and Evan S. Van Metre (2004), ―Steering Customers to the
Right Channels,‖ McKinsey Quarterly, 4 (December 7), 36–48.

25
Naik, Prasad A. and Kalyan Raman (2003), ―Understanding the Impact of Synergy in Multimedia
Communications,‖ Journal of Marketing Research, 15 (November), 375-388.
-------, ---------, and Russell S. Winer (2005), ―Planning Marketing-Mix Strategies in the Presence of
Interaction Effects,‖ Marketing Science, 24 (1), 25–34.
Neff, Jack (2004), ―P&G, Clorox Discover Modeling: Marketing Mix Analytics Gain New Proponents,‖
Advertising Age, (March 29), 10.
Neslin, Scott A., D. Grewal, R. Leghorn, V. Shankar, M.L. Teerling, J.S. Thomas, and P.C. Verhoef
(2006), ―Challenges and Opportunities in Multichannel Management,‖ Journal of Service
Research, 9 (2), 95–113.
———, Stephen G. Powell, and Linda Schneider Stone (1995), ―The Effects of Retailer and Consumer
Response on Optimal Manufacturer and Trade Promotion Strategies,‖ Management Science, 41
(5), 749–66.
Parsons, Leonard J. (1975), ―The Product Life Cycle and Time Varying Advertising Elasticities,‖ Journal
of Marketing Research, 12 (November), 476–80.
PhRMA (2007), Pharmaceutical Industry Profile 2007, (March), (accessed February 21, 2008), [available
at http://www.phrma.org/files/Profile%202007.pdf].
Rangaswamy, Arvind and Lakshman Krishnamurthi (1991), ―Response Function Estimation Using the
Equity Estimator,‖ Journal of Marketing Research, 28 (February), 72–83.
———, Prabhakant Sinha, and Andris Zoltners (1990), ―An Integrated Model-Based Approach for Sales
Force Structuring,‖ Marketing Science, 9 (4), 279–98.
Reinartz, Werner, Jacquelyn S. Thomas, and V. Kumar (2005), ―Balancing Acquisition and Retention
Resources to Maximize Customer Profitability,‖ Journal of Marketing, 69 (January), 63–79.
Richardson, Robert J. (2004), ―A Marketing Resource Allocation Model,‖ Journal of Business &
Economic Studies, 10 (1), 43–53.
Sethuraman, Raj and Gerard J. Tellis (1991), ―An Analysis of the Tradeoff between Advertising and Price
Discounting,‖ Journal of Marketing Research, 27 (May), 160–74.
Shankar, Venkatesh (1997), ―Pioneers’ Marketing Mix Reactions to Entry in Different Competitive
Games Structures: Theoretical Analysis and Empirical Illustration,‖ Marketing Science, 16 (4),
271–93.
——— (2006), ―Proactive and Reactive Product Line Strategies: Asymmetries between Market Leaders
and Followers,‖ Management Science, 52 (2), 276–92.
——— (2008), ―The Role of the Product Life Cycle and Market Dominance in Marketing Expenditures
of Products,‖ working paper, Mays Business School, Texas A&M University.
——— and Marie Hollinger (2007), ―Online and Mobile Advertising: Current Scenario, Emerging
Trends, and Future Directions,‖ MSI Report No. 07-206, Marketing Science Institute.

26
Story, Louise (2007), ―The New Advertising Outlet: Your Life,‖ The New York Times, (October 14).
Thomas, Jacquelyn, Robert C. Blattberg, and Edward Fox (2004), ―Recapturing Lost Customers,‖
Journal of Marketing Research, 41 (February), 31–45.
Tode, Chantal (2007), ―Procter & Gamble Marketing Looks to Internet,‖ DMNews, (May 3).
Venkatesan, Rajkumar and V. Kumar (2004), ―A Customer Lifetime Value Framework for Customer
Selection and Resource Allocation Strategy,‖ Journal of Marketing, 68 (October), 106–126.
Winer, Russell S. (1979), ―An Analysis of the Time-Varying Effects of Advertising: The Case of Lydia
Pynkam,‖ Journal of Business, 52 (4), 563–76.

27
Figure 1
An Overview of the Types of Resource Allocation Decisions
Resources
Marketing Nonmarketing (R&D) Nonmarketing (other)
Marketing Mix Products Markets/Countries
Advertising
Sales force
Sales promotion
Other
Product 1
Product 2
Product 3
Product 4
Product 5
Market 1
Market 2
Market 3
Market 4

28
Figure 2
Annual Advertising and R&D Expenditures for Fortune 500 Firms
29
Figure 3
Annual Advertising and R&D Expenditures for Fortune 500 Firms by Sector
Notes: HiTech = high-technology, ConsDur = consumer durables, and Svcs/Retail = services/retail.

Figure 4 Shapes of Returns to Marketing Mailers by Customer-Channel Segment
(A)
16.00
16.50
17.00
17.50
18.00
18.50
0 2 4 6 8 10 12 14
Pro
fit ($
)
Mailers
Catalog
(B)
12.00
12.50
13.00
13.50
14.00
14.50
15.00
15.50
16.00
16.50
0 2 4 6 8 10 12 14
Pro
fit ($
)
Mailers
Store
(C)
24.50
25.00
25.50
26.00
26.50
27.00
27.50
28.00
28.50
0 2 4 6 8 10 12 14
Pro
fit ($
)
Mailers
Web
(D)
30.00
35.00
40.00
45.00
50.00
55.00
60.00
0 2 4 6 8 10 12 14
Pro
fit ($
)
Mailers
Multichannel
Source: Kushwaha and Shankar (2008).

31
Figure 5 Summary of Budget Allocation to Different Media, Including New Media
Source: DMA (2008).
32
Table 1
Summary of Selected Marketing Resource Allocation Models
Paper / Work Model Type Data Key Findings / Guidelines Key Limitations
Allocation across Marketing and Product-Related Resources
Erickson and
Jacobson (1992)
Econometric
model
99 firms from
S&P database
during 1972-86
After controlling for firm-specific factors and
the feedback between discretionary spending
and profitability, stock marketing spending are
significantly lower, so firms should not
overspend on R&D or marketing.
Residuals approximate
unanticipated discretionary
spending (R&D and marketing)
Bayus, Erickson, and
Jacobson (2003)
Econometric
model
PCs Higher new product introductions and R&D
spending are associated with lower marketing
and advertising support.
Not generalizable to products in the
mature and decline stages of the
PLC. Results could be due to
commoditization of product.
Allocation across Products and Markets/Countries
Lilien and Rao
(1976)
Optimization
model
Consumer
product
The optimal number of outlets across
geographic markets can be determined based
on an underlying S-shaped relationship
between outlet share and market share.
Simulation-based without a closed-
form solution. Not validated on
empirical data.
Henderson (1998)
(The BCG matrix)
Conceptual
model
NA Milk the cash cows and feed question marks to
upgrade them into stars and stars if needed.
Stars self-finance themselves. Get rid of dogs
unless they are strategic complements or have
substantial exit barriers.
Too simplistic dimensions.
Assumes profits correlated with
relative market shares. Assumes a
static view of the business universe.
Chintagunta and
Desiraju (2005)
Econometric
(Structural
empirical
industrial
organization)
model
Pharmaceuticals Detailing elasticities are comparable across
U.S., Germany, and Italy, but are higher in
U.K. and France, suggesting greater allocation
of detailing budget to U.K. and France.
Not an explicitly normative model
of resource allocation across
countries.
Fischer et al. (2005) Econometric
model
Pharmaceuticals Marketing efficacy is higher in later countries
of entry if firms follow a waterfall strategy, so
firms should allocate more in later countries
than that suggested by independent country
response behavior.
Not an explicitly normative model
of resource allocation across
countries.
Marketing Mix Allocation and Allocation over the PLC

33
Lilien (1979) Econometric (Logit
and linear
regression) models
ADVISOR2 survey
data from 22
companies for 131
products
Allocation to sales force
determined by firm size, order
size, stage in the product life
cycle, product complexity, and
purchase frequency.
Inappropriate for new products,
narrow sample composition, US-
centric data.
Montgomery and Silk
(1972)
Econometric
(Distributed lag)
model
Time series data for an
ethical product
Journal advertising has the
highest and direct mail
advertising has the lowest
elasticities. The company’s
allocation is inversely related to
these elasticities.
Market share model. Needs to be
extended to sales and profits to
make conclusions on resource
allocation.
Gatignon and
Hanssens (1987)
Econometric model Time series data from
US Navy
Sales force effectiveness in
hiring of Naval personnel
increased with local advertising
support, suggesting a synergy
between advertising and personal
selling efforts.
Specialized context (Navy hiring).
Potential multicollinearity between
advertising and sales force may
hinder estimation of true synergy.
Gopalakrishna and
Chatterjee (1992)
Econometric model Mature industrial
product
Optimal marketing budget
increases with number of
accounts and the business
potential of the accounts. Greater
personal selling effort should be
directed to the segment with the
greater average potential.
Competitors assumed to be passive.
Do not directly address relative
allocation between advertising and
personal selling.
Shankar (1997) Analytical and
Econometric (Game
theoretic and
empirical industrial
organization) model
A large drug product
category
Brands should allocate resources
between advertising and sales
force in the ration of the
competitive relative elasticities.
Decoupled response function.
Sethuraman and
Tellis (1991)
Analytical and
econometric model
Nondurable and
durable goods
Promotions (price discounts) are
more profitable than advertising
for mature products, so allocate
more to promotions.
Other marketing variables not
considered. Interaction effect
ignored.
Neslin, Powell, and
Stone (1995)
Analytical model NA Advertising and trade promotion
expenditures are substitutes and
balance each other.
No empirical evidence.

34
Naik and Raman
(2003)
Optimization model Apparel Synergy between media elements
can be estimated using a dynamic
advertising model. As synergy
increases, a firm should raise its
advertising budget and allocate
more funds to the less effective
media element.
Results relevant for a monopoly;
the role of temporal aggregation of
data on optimal levels is unknown;
potential multicollinearity between
the media elements may hinder
estimation of true synergy.
Naik, Raman, and
Winer (2005)
Optimization
(Differential game)
model with
continuous-discrete
estimation method
Detergents Advertising and promotion have
significant interaction effects.
Large brands under advertise and
over promote. Small brands
under advertise and over
promote.
Model ignores category sales
changes; ignores carryover effects;
other mix variables omitted; role of
retailer absent.
Shankar (2008) Econometric
(Market response)
model
Pharmaceuticals Marketing expenditures and
moderated by the stage in the
PLC. Dominant brands shift
allocation of sales force over the
PLC.
R&D decision not considered.
Allocation across Customers and Channels
Venkatesan and
Kumar (2004)
Optimization model
at customer-cohort
level
B2B customer data
from a multinational
computer hardware
and software firm
Optimization based on CLV
yields improved profits relative
to other optimization approaches.
Competitor responses not included
in the model; indirectly relate costs
and margins to CRM efforts.
Anderson, Lodish,
and Weitz (1987)
Econometric (S-
shaped effort
allocation) model,
Factor analysis of
survey responses
Survey data from 95
firms belonging to
Electronic
Representatives
Association (ERA)
Allocation of time by sales
agencies to principal consistent
with microeconomic model, but
is also affected by
communication, participation and
feedback.
Self-reporting bias; common
method variance; key informant
bias; one industry view.
Kushwaha and
Shankar (2008)
Optimization model
decomposed into
purchases frequency,
quantity, and margin
models
Shoes and accessories The model produces a 32%
increase in total profits in a
holdout sample. Multichannel
customers are most responsive to
marketing mailers.
Models applied in only one
industry.