strategic asset management plan for infrastructure assets
TRANSCRIPT
Strategic Asset Management
Plan for Infrastructure Assets
2019-2023
Glenorchy City Council
September 2019
- ii -
Glenorchy City Council– STRATEGIC ASSET MANAGEMENT PLAN 2019-2023
Document Control
Document ID: 161020 nams.plus3 strategic amp template v3.15
Rev No Date Revision Details Author Reviewer Approver
1.0 September
2019 Draft Strategic Asset Management Plan 2019-2023 to Council NH, FC TR Council
© Copyright 2016 – All rights reserved.
The Institute of Public Works Engineering Australia.
www.ipwea.org/namsplus
- iii -
Glenorchy City Council– STRATEGIC ASSET MANAGEMENT PLAN 2019-2023
TABLE OF CONTENTS
1. EXECUTIVE SUMMARY ............................................................................................................................................... 1 Context ........................................................................................................................................................................... 1 Current situation ............................................................................................................................................................ 1 What does it Cost? ......................................................................................................................................................... 1 What we will do .............................................................................................................................................................. 1 What we have deferred ................................................................................................................................................. 1 Managing the Risks ........................................................................................................................................................ 1 Confidence Levels ........................................................................................................................................................... 2 The Next Steps................................................................................................................................................................ 2
2. ASSET MANAGEMENT STRATEGY .............................................................................................................................. 3 2.1 Asset Management System ............................................................................................................................... 3
2.1.1 Asset Management Policy ........................................................................................................................ 4 2.1.2 Asset Management Objectives ................................................................................................................. 4 2.1.3 Strategic Asset Management Plan ............................................................................................................ 4 2.1.4 Asset Management Plans ......................................................................................................................... 5
2.2 What Assets do we have? ................................................................................................................................. 5 2.3 Our Assets and their management ................................................................................................................... 8
2.3.1 Asset Values .............................................................................................................................................. 8 2.3.2 Asset Condition, Function and Capacity ................................................................................................... 9 2.3.3 Life Cycle Cost and Asset Sustainability Ratio ........................................................................................ 13 2.3.4 Asset Management Indicators ................................................................................................................ 14 2.3.5 Opportunities and Risks .......................................................................................................................... 15 2.3.6 Asset and Financial Management Maturity ........................................................................................... 15
2.4 Where do we want to be? ............................................................................................................................... 18 2.4.1 Community Expectations ........................................................................................................................ 18 2.4.2 Organisational Objectives ....................................................................................................................... 18
2.5 Asset Management Vision ............................................................................................................................... 19 2.6. How will we get there? ................................................................................................................................... 20
2.6.1 Guiding Principles ........................................................................................................................................... 20 2.6.2 Strategy ........................................................................................................................................................... 20
2.7 Asset Management Improvement Plan........................................................................................................... 22 2.8. Consequences if actions are not completed ................................................................................................... 22
3. LEVELS OF SERVICE................................................................................................................................................... 23 3.1 Consumer Research and Expectations ............................................................................................................ 23 3.2 Organisational Objectives ............................................................................................................................... 24 3.3 Legislative Requirements ................................................................................................................................ 24 3.4 Level of Service ................................................................................................................................................ 27
4. FUTURE DEMAND .................................................................................................................................................... 28 4.1 Asset Programs to meet Demand ................................................................................................................... 29
5. LIFECYCLE MANAGEMENT PLAN .............................................................................................................................. 30 5.1 Background Data ............................................................................................................................................. 30
5.1.1 Physical parameters ............................................................................................................................... 30 5.1.2 Asset capacity and performance ............................................................................................................ 30
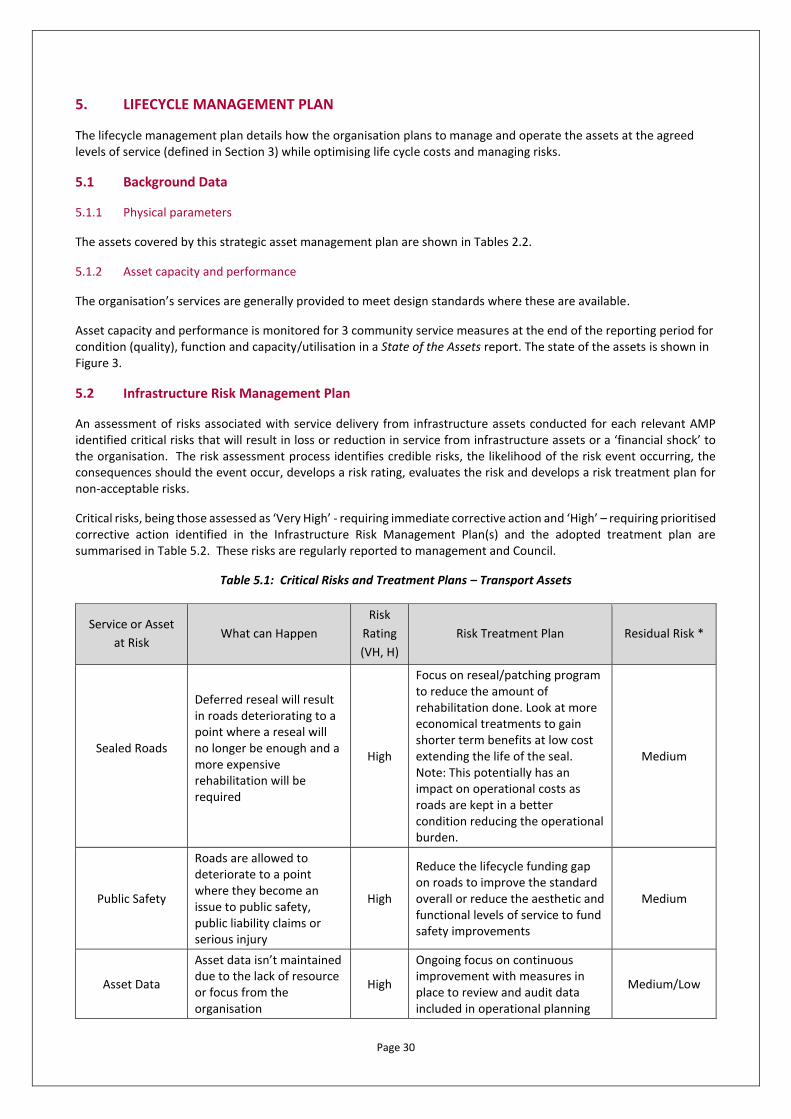
5.2 Infrastructure Risk Management Plan ............................................................................................................ 30 5.3 Routine Operations and Maintenance Plan .................................................................................................... 33
5.3.1 Operations and Maintenance Plan ......................................................................................................... 33 5.3.2 Operations and Maintenance Strategies ................................................................................................ 33 5.3.3 Summary of future operations and maintenance expenditures ............................................................ 34
5.4 Renewal/Replacement Plan ............................................................................................................................ 35 5.4.1 Renewal and Replacement Strategies .................................................................................................... 35 5.4.2 Renewal ranking criteria ............................................................................................................................ 35 5.4.2 Summary of future renewal and replacement expenditure ................................................................... 35
- iv -
Glenorchy City Council– STRATEGIC ASSET MANAGEMENT PLAN 2019-2023
5.5 Creation/Acquisition/Upgrade Plan ................................................................................................................ 36 5.5.1 Selection criteria ..................................................................................................................................... 36 5.5.2 Capital Investment Strategies ................................................................................................................. 36 5.5.3 Summary of future upgrade/new assets expenditure ........................................................................... 37
5.6 Disposal Plan ................................................................................................................................................... 37 5.7 Service Consequences and Risks ..................................................................................................................... 38
5.7.1 Deferred initiatives and projects ............................................................................................................ 38
6. FINANCIAL SUMMARY.............................................................................................................................................. 39 6.1 Financial Indicators and Projections ............................................................................................................... 39
6.1.1 Asset Renewal Funding Ratio .................................................................................................................... 39
6.2 Funding Strategy ............................................................................................................................................. 39 6.3 Valuation Forecasts ......................................................................................................................................... 39 6.4 Key Assumptions made in Financial Forecasts ................................................................................................ 39 6.5 Forecast Reliability and Confidence ................................................................................................................ 40
7. PLAN IMPROVEMENT AND MONITORING ............................................................................................................... 42 7.1 Improvement Plan ........................................................................................................................................... 42 7.2 Performance Measures ................................................................................................................................... 47
8. REFERENCES ............................................................................................................................................................. 48 9. APPENDICES ............................................................................................................................................................. 49
Appendix A Summary Levels of Service for Services .................................................................................................. 50 Appendix B Projected 10-year Operations and Maintenance Expenditure ............................................................... 58 Appendix C Projected 10-year Capital Expenditure and 4-year detailed Program .................................................... 59 Appendix D Asset Revaluation and Annual reviews ................................................................................................... 61
Glenorchy City Council– STRATEGIC ASSET MANAGEMENT PLAN 2019-2023
1. EXECUTIVE SUMMARY
Context
Glenorchy City Council is responsible for the acquisition, operation, maintenance, renewal and disposal of an extensive range of physical assets with a replacement value of $823 Million as of 30 June 2018.
These assets include transport, drainage, buildings and parks and recreation assets that provide service essential to our community’s quality of life.
This Strategic Asset Management Plan (SAMP) takes the organisational objectives in our Strategic Plan, develops the asset management objectives, principles, framework and strategies required to achieve our organisational objectives. The plan summarises activities and expenditure projections for the four major asset portfolios (Transport, Drainage, Building, Parks and Recreation) to achieve the asset management objectives.
Current situation
Our aim is to achieve a ‘core’ maturity for asset management activities and continue maturity improvement where the benefits exceed the costs.
Improvement tasks with target dates have been identified and documented in Table 7.1.
What does it Cost?
Operating Outlays (excluding depreciation) The projected operating outlays necessary to provide the services covered by this SAMP includes operations and maintenance of existing assets over the 10-year planning period (from financial year 2020 to financial year 2029) is $10 million on average per year.
Capital Outlays The projected required capital outlays including renewal/replacement and upgrade of existing assets and acquisition of new assets over the 10-year planning period (from financial year 2020 to financial year 2029) is 14 million on average per year.
What we will do
Our aim is to provide the services needed by the community in a financial sustainable manner. Achieving financial sustainability requires balancing service levels and performance with cost and risk.
It may not be possible to meet all expectations for services within current financial resources. We will continue to engage with our community to ensure
that needed services are provided at appropriate levels of service at an affordable cost while managing risks.
What we have deferred
We may not have the funding to provide all the services at the level that are desired by the community. However, it is an important message to the community that Council can only provide a level of service which the community is able to afford and willing to pay for, rather than the level of service that creates financial burden to the Council and its community despite they are good to have and more desirable. Council is of the view that there is not deferred initiatives and projects should be listed in the capital works program. Any ‘backlog’ are works below the level of service that cannot be accommodated within the current capital works program and therefore should not be funded in the following years unless either the financial position or the level of service is changed. Managing the Risks
There are risks associated with providing the service and not being able to complete all identified initiatives and projects. We have identified major risks as:
• increasing expense to provide the same level of renewal, upgrade and maintenance service
• Insufficient funding allocated to renewal, upgrade and maintenance of the assets
• reduced asset data quality due to lack of resource or focus from the organisation
• Flooding/inundation occurs in moderate rainfall event due to inadequate capacity of drains or impractical level of service committed by Council
We will endeavour to manage these risks within available funding by:
• Set up routine inspection programs, planned maintenances and conduct regularly condition assessments
• Reduce the lifecycle funding gap on assets to improve the standard overall or reduce the aesthetic and functional levels of service to fund safety improvements
• Make sure enough resource to be allocated to continuously reviewing and improving the quality of asset data.
More importantly, by adopting the asset management guiding principles and strategies below, the risks
Glenorchy City Council– STRATEGIC ASSET MANAGEMENT PLAN 2019-2023
associated with providing the infrastructure and services can be managed in an effective and sustainable manner. The guiding principles include:
• invest in high use areas
develop a differentiated approach to service delivery by recognising that greater investment is required in high use areas (e.g. wider footpaths in CBD areas).
• engage with the community
continue to understand the needs of the community through engagement e.g. Local Government Association Tasmania (LGAT) community satisfaction survey, customer service requests and project consultation.
• provide services to an affordable standard
focus on asset renewals and alternative methods of providing affordable levels of service to meet the needs of the community e.g. relining of stormwater pipes, use of recycled asphalt, increase spending on bituminous resurfacing.
• cater for future demand
assess the requirement of new services to cater for future demand of our city. In assessing new service, Council will consider the whole of life cycle costs and the ability to fund. e.g. access external funding to build new destination playgrounds, upgrade of toilets, business case development for the upgrade of sports grounds and facilities and building new footpath that focus on high traffic areas.
• best practice asset management
continue to invest in asset management to achieve a ‘core level’ of maturity e.g. ensure alignment of asset management plans with the Long-Term Management Financial plan, training and investment in our people and benchmark our performance.
• dispose of surplus assets
dispose of surplus assets to achieve long term sustainability e.g. repurposing of underutilised land, closure of Derwent Park Reuse Scheme and consolidation of playgrounds.
• shared facilities and services
explore the opportunities to work together with other service providers for non-asset methods of providing sustainable service delivery. e.g. delivery of road
works on the border with adjoining Councils, working with the Education Department to access sports grounds, developing shared facilities for sport and community users.
Confidence Levels
This SAMP is based on medium level of confidence information.
The Next Steps
An improvement plan has been developed and presented in this SAMP to ensure that Council will be moving towards the core asset management maturity while mitigating the risks mentioned in the previous chapter.
Page 3
2. ASSET MANAGEMENT STRATEGY
2.1 Asset Management System
Asset management enables an organisation to realise value from assets in the achievement of organisational objectives, while balancing financial, environmental and social costs, risk, quality of service and performance related to assets.1
An asset management system is a set of interrelated and interacting elements of an organisation to establish the asset management policy and asset management objectives, and the processes, needed to achieve those objectives. An asset management system is more than ‘management information system’ software. The asset management system provides a means for:
• coordinating contributions from and interactions between functional units within an organisation,2 and
• consistent application of the asset management processes to achieve uniform outcomes and objectives.
The asset management system includes:
• The asset management policy (re-adopted by Council in May 2019)
• The asset management objectives (presented in the asset management strategy adopted by Council in June 2019)
• The strategic asset management plan (this document)
• The asset management plans (in progress), which are implemented in o operational planning and control o supporting activities o control activities o other relevant processes.3
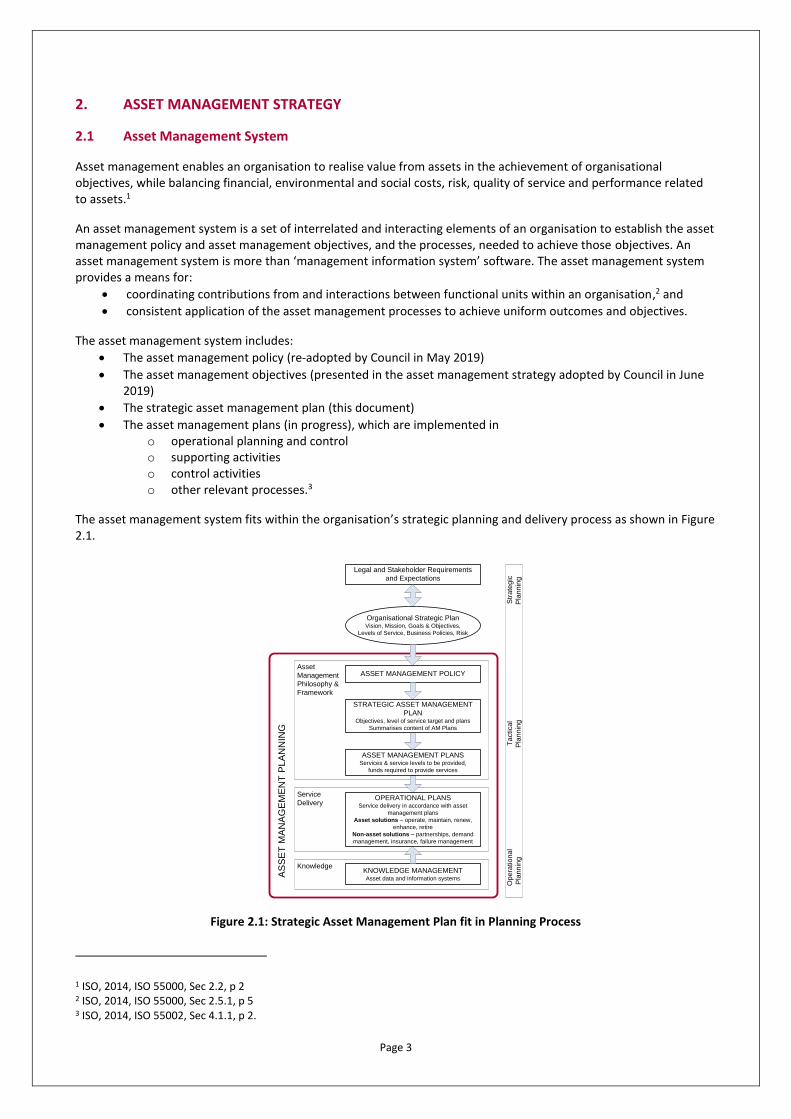
The asset management system fits within the organisation’s strategic planning and delivery process as shown in Figure 2.1.
Figure 2.1: Strategic Asset Management Plan fit in Planning Process
1 ISO, 2014, ISO 55000, Sec 2.2, p 2 2 ISO, 2014, ISO 55000, Sec 2.5.1, p 5 3 ISO, 2014, ISO 55002, Sec 4.1.1, p 2.
Legal and Stakeholder Requirements
and Expectations
Organisational Strategic PlanVision, Mission, Goals & Objectives,
Levels of Service, Business Policies, Risk
ASSET MANAGEMENT POLICY
STRATEGIC ASSET MANAGEMENT
PLAN Objectives, level of service target and plans
Summarises content of AM Plans
Asset
Management
Philosophy &
Framework
Service
DeliveryOPERATIONAL PLANS
Service delivery in accordance with asset
management plans
Asset solutions – operate, maintain, renew,
enhance, retire
Non-asset solutions – partnerships, demand
management, insurance, failure management
KNOWLEDGE MANAGEMENTAsset data and information systems
Knowledge
AS
SE
T M
AN
AG
EM
EN
T P
LA
NN
ING
Op
era
tio
na
l T
actica
l S
tra
teg
ic
Pla
nn
ing
P
lan
nin
g
Pla
nn
ing
ASSET MANAGEMENT PLANS Services & service levels to be provided,
funds required to provide services
Page 4
2.1.1 Asset Management Policy
Council’s Asset Management Policy defines the council’s vision and service delivery objectives for asset management in accordance with legislative requirements, community needs and affordability, the Strategic Plan and applicable legislation.
The asset management policy sets out the principles by which the organisation intends applying asset management to achieve its organisational objectives.4 Organisational objectives are the results the organisation plans to achieve, as documented in its Strategic Plan.
Our adopted Asset Management Policy is available from GCC web site https://www.gcc.tas.gov.au/your-council/council-policies.aspx
2.1.2 Asset Management Objectives
The AM objectives developed in this SAMP provide the essential link between the organisational objectives and the AMP(s) that describe how those objectives are going to be achieved. The AM objectives transform the required outcomes (product or service) to be provided by the assets, into activities typically described in the AMPs. AM objectives should be specific, measurable, achievable, realistic and time bound (i.e. SMART objectives).5
2.1.3 Strategic Asset Management Plan
This strategic asset management plan is to document the relationship between the organisational objectives set out in the City of Glenorchy Community Plan 2015-2040 and the asset management (or service) objectives and define the strategic framework required to achieve the asset management objectives.6
This Strategic Asset Management Plan is developed to support the Asset Management Policy and is to enable Council to:
• ensure its asset portfolio will meet the affordable service delivery needs of the community into the future,
• enable Council’s asset management policies to be achieved, and
• ensure the integration of Council’s asset management with its long-term strategic plans.
The asset management objectives must be aligned with the organisation’s strategic objectives set out in its strategic plan.
This strategic asset management plan encompasses the following services:
• Transport
• Drainage
• Buildings
• Parks & Recreation The strategic asset management framework incorporates strategies to achieve the asset management objectives. The strategies are developed in 4 steps:
• What assets do we have?
• Our assets and their management
• Where do we want to be?
• How will we get there?7
4 ISO, 2014, ISO 55002, Sec 5.2, p 7. 5 ISO, 2014, ISO 55002, Sec 6.2.1, p 9. 6 ISO, 2014, ISO 55002, Sec 4.1.1, p 2. 7 LGPMC, 2009, Framework 2, Sec 4.2, p 4.
Page 5
2.1.4 Asset Management Plans
Supporting the strategic asset management plan are asset management plans for major service/asset categories. The asset management plans document the activities to be implemented and resources to be applied to meet the asset management objectives.
The strategic asset management plan summarises the key issues from the following asset management plans:
• Glenorchy City Council Transport Asset Management Plan (in progress)
• Glenorchy City Council Drainage Asset Management Plan (in progress)
• Glenorchy City Council Buildings Asset Management Plan (in progress)
• Glenorchy City Council Park & Recreation Asset Management Plan (in progress)
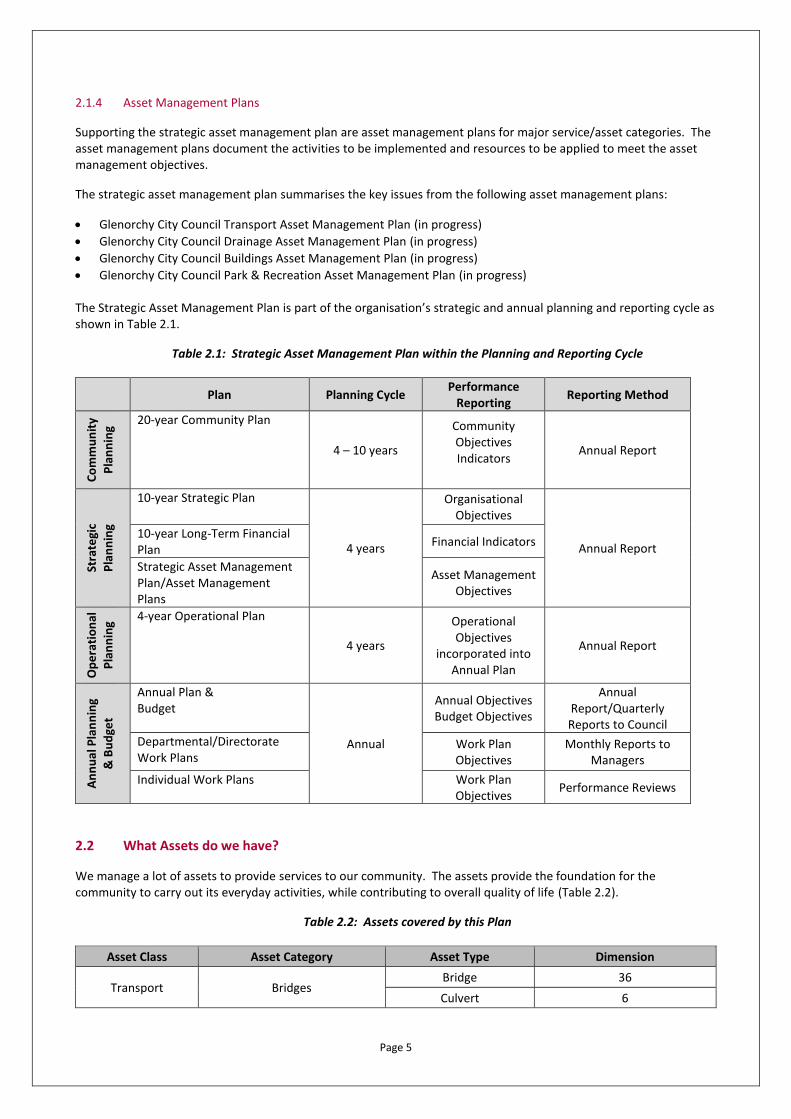
The Strategic Asset Management Plan is part of the organisation’s strategic and annual planning and reporting cycle as shown in Table 2.1.
Table 2.1: Strategic Asset Management Plan within the Planning and Reporting Cycle
Plan Planning Cycle
Performance Reporting
Reporting Method
Co
mm
un
ity
Pla
nn
ing
20-year Community Plan
4 – 10 years
Community Objectives Indicators
Annual Report
Stra
tegi
c
Pla
nn
ing
10-year Strategic Plan
4 years
Organisational Objectives
Annual Report 10-year Long-Term Financial Plan
Financial Indicators
Strategic Asset Management Plan/Asset Management Plans
Asset Management Objectives
Op
era
tio
nal
Pla
nn
ing
4-year Operational Plan
4 years
Operational Objectives
incorporated into Annual Plan
Annual Report
An
nu
al P
lan
nin
g
& B
ud
get
Annual Plan & Budget
Annual
Annual Objectives Budget Objectives
Annual Report/Quarterly Reports to Council
Departmental/Directorate Work Plans
Work Plan Objectives
Monthly Reports to Managers
Individual Work Plans Work Plan Objectives
Performance Reviews
2.2 What Assets do we have?
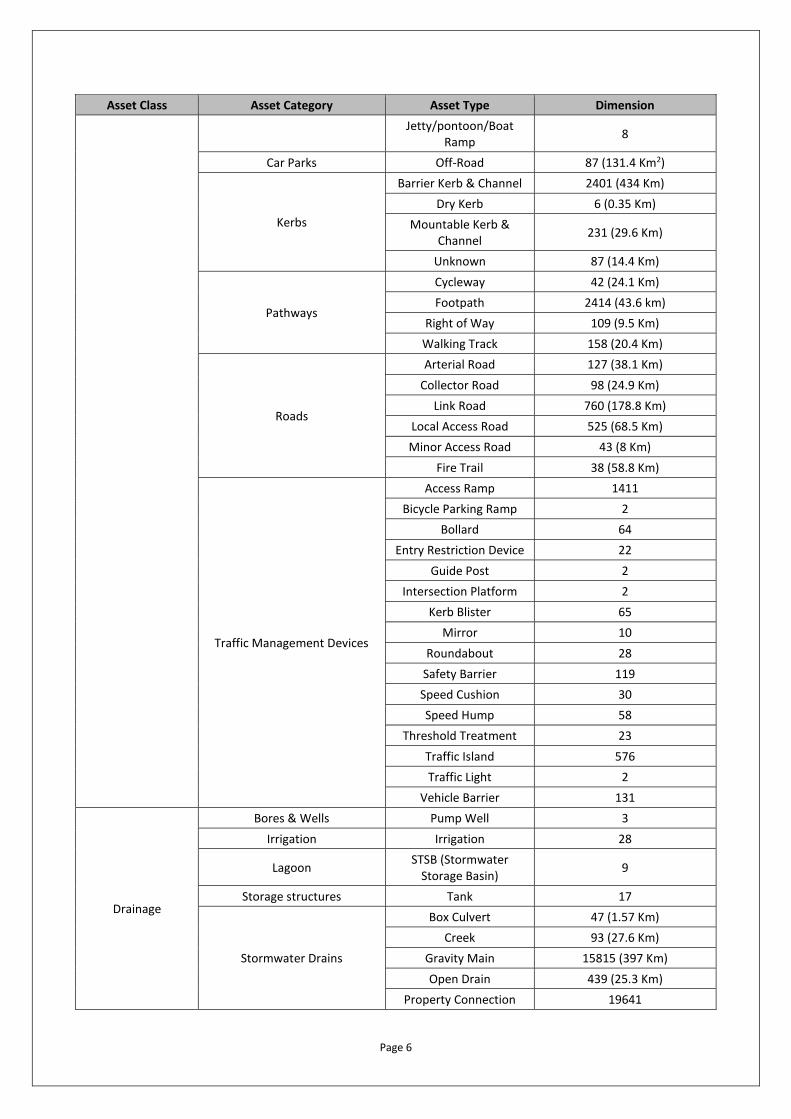
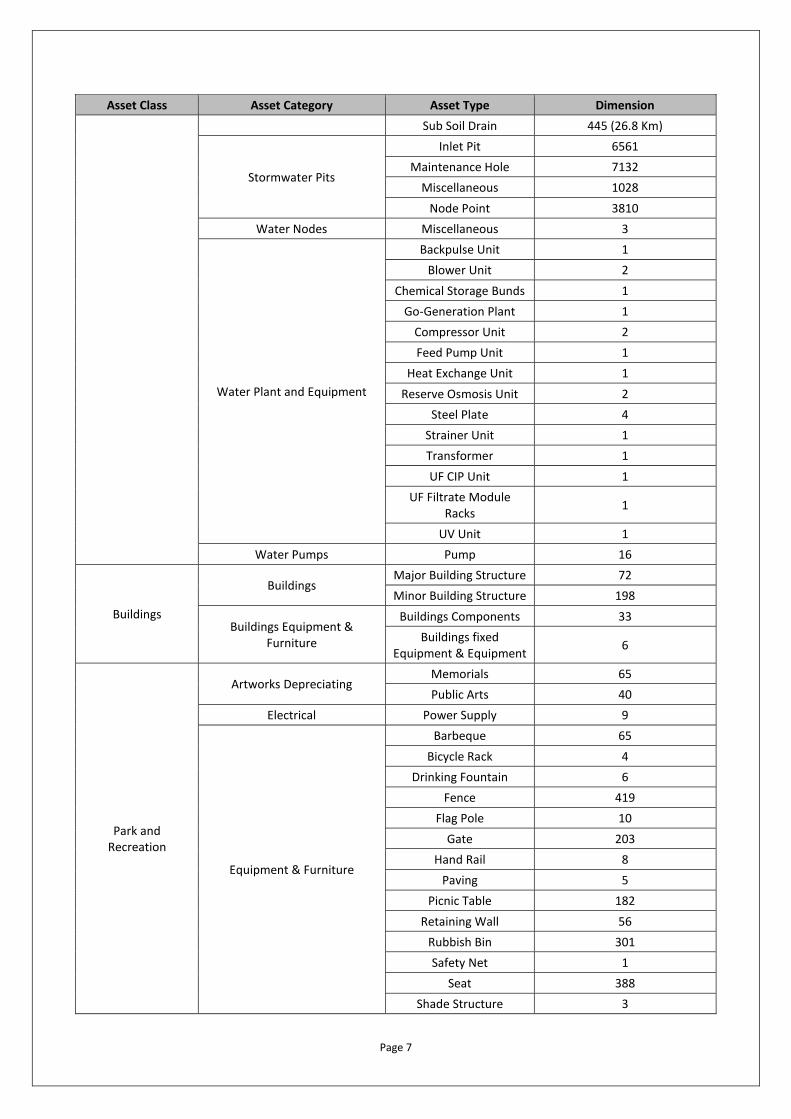
We manage a lot of assets to provide services to our community. The assets provide the foundation for the community to carry out its everyday activities, while contributing to overall quality of life (Table 2.2).
Table 2.2: Assets covered by this Plan
Asset Class Asset Category Asset Type Dimension
Transport Bridges Bridge 36
Culvert 6
Page 6
Asset Class Asset Category Asset Type Dimension
Jetty/pontoon/Boat Ramp
8
Car Parks Off-Road 87 (131.4 Km2)
Kerbs
Barrier Kerb & Channel 2401 (434 Km)
Dry Kerb 6 (0.35 Km)
Mountable Kerb & Channel
231 (29.6 Km)
Unknown 87 (14.4 Km)
Pathways
Cycleway 42 (24.1 Km)
Footpath 2414 (43.6 km)
Right of Way 109 (9.5 Km)
Walking Track 158 (20.4 Km)
Roads
Arterial Road 127 (38.1 Km)
Collector Road 98 (24.9 Km)
Link Road 760 (178.8 Km)
Local Access Road 525 (68.5 Km)
Minor Access Road 43 (8 Km)
Fire Trail 38 (58.8 Km)
Traffic Management Devices
Access Ramp 1411
Bicycle Parking Ramp 2
Bollard 64
Entry Restriction Device 22
Guide Post 2
Intersection Platform 2
Kerb Blister 65
Mirror 10
Roundabout 28
Safety Barrier 119
Speed Cushion 30
Speed Hump 58
Threshold Treatment 23
Traffic Island 576
Traffic Light 2
Vehicle Barrier 131
Drainage
Bores & Wells Pump Well 3
Irrigation Irrigation 28
Lagoon STSB (Stormwater
Storage Basin) 9
Storage structures Tank 17
Stormwater Drains
Box Culvert 47 (1.57 Km)
Creek 93 (27.6 Km)
Gravity Main 15815 (397 Km)
Open Drain 439 (25.3 Km)
Property Connection 19641
Page 7
Asset Class Asset Category Asset Type Dimension
Sub Soil Drain 445 (26.8 Km)
Stormwater Pits
Inlet Pit 6561
Maintenance Hole 7132
Miscellaneous 1028
Node Point 3810
Water Nodes Miscellaneous 3
Water Plant and Equipment
Backpulse Unit 1
Blower Unit 2
Chemical Storage Bunds 1
Go-Generation Plant 1
Compressor Unit 2
Feed Pump Unit 1
Heat Exchange Unit 1
Reserve Osmosis Unit 2
Steel Plate 4
Strainer Unit 1
Transformer 1
UF CIP Unit 1
UF Filtrate Module Racks
1
UV Unit 1
Water Pumps Pump 16
Buildings
Buildings Major Building Structure 72
Minor Building Structure 198
Buildings Equipment & Furniture
Buildings Components 33
Buildings fixed Equipment & Equipment
6
Park and Recreation
Artworks Depreciating Memorials 65
Public Arts 40
Electrical Power Supply 9
Equipment & Furniture
Barbeque 65
Bicycle Rack 4
Drinking Fountain 6
Fence 419
Flag Pole 10
Gate 203
Hand Rail 8
Paving 5
Picnic Table 182
Retaining Wall 56
Rubbish Bin 301
Safety Net 1
Seat 388
Shade Structure 3
Page 8
Asset Class Asset Category Asset Type Dimension
Storage Equipment 12
Tree Guard 24
Water Tank 1
Instrumentation Instrumentation and
Controls 4
Lighting
Park Light Pole 196
Street Light Pole 668
Light fittings & brackets 2818
Marine Structures Seal Wall 4
Play and Sports Equipment
Play Equipment 188
Sports Equipment 91
Under surfacing 56
Playground & Sporting Playground 64
Sports Ground 38
Signs Street Sign 1547
Park Sign 977
Council Property Facility Complex 56
Park & Reserve 272
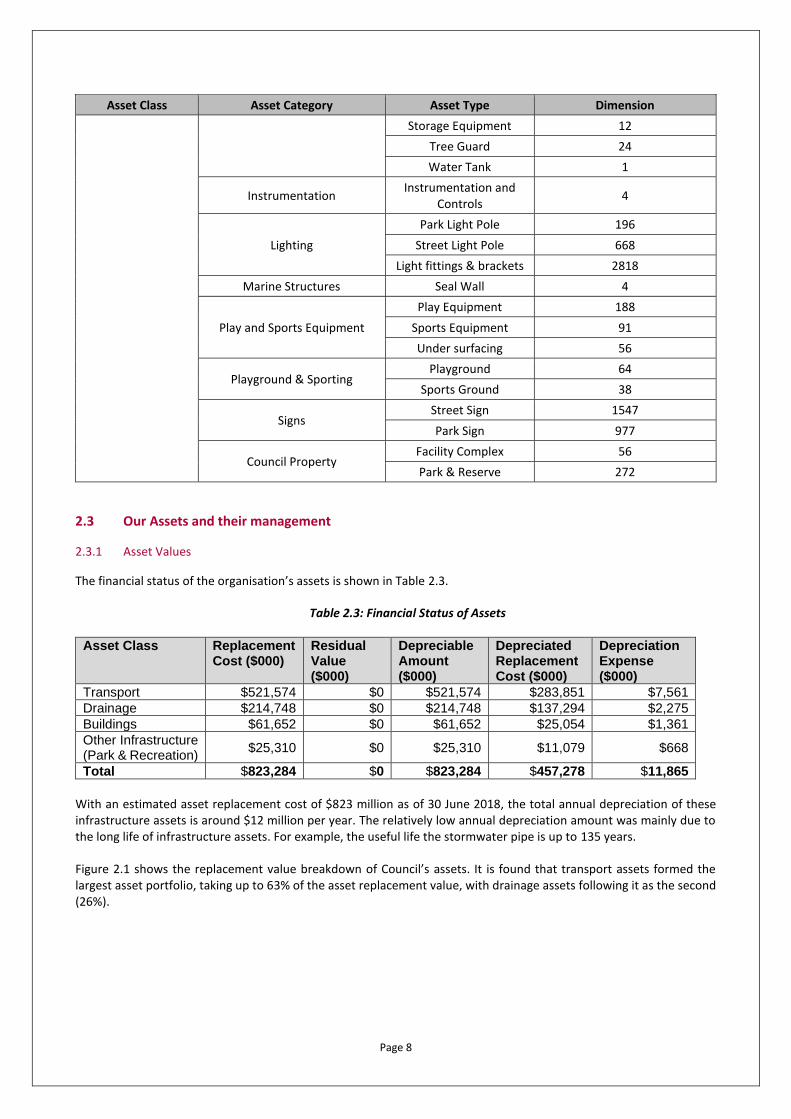
2.3 Our Assets and their management
2.3.1 Asset Values
The financial status of the organisation’s assets is shown in Table 2.3.
Table 2.3: Financial Status of Assets
Asset Class Replacement Cost ($000)
Residual Value ($000)
Depreciable Amount ($000)
Depreciated Replacement Cost ($000)
Depreciation Expense ($000)
Transport $521,574 $0 $521,574 $283,851 $7,561
Drainage $214,748 $0 $214,748 $137,294 $2,275
Buildings $61,652 $0 $61,652 $25,054 $1,361
Other Infrastructure (Park & Recreation)
$25,310 $0 $25,310 $11,079 $668
Total $823,284 $0 $823,284 $457,278 $11,865
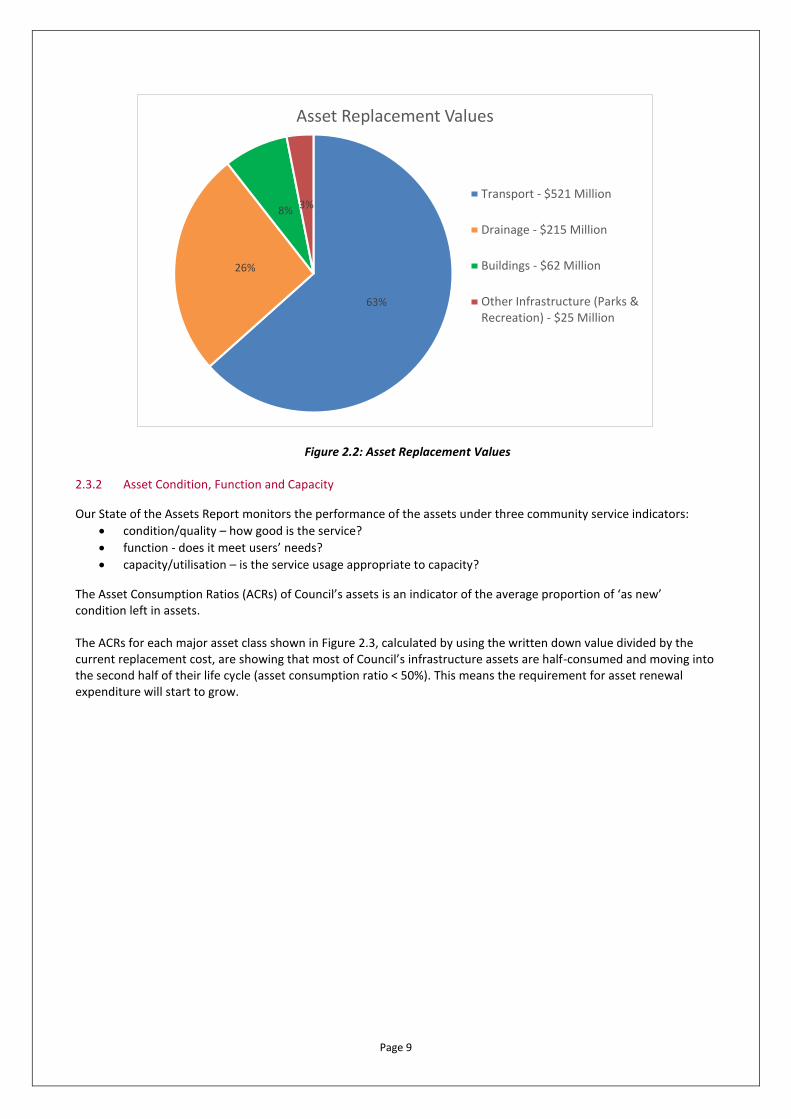
With an estimated asset replacement cost of $823 million as of 30 June 2018, the total annual depreciation of these infrastructure assets is around $12 million per year. The relatively low annual depreciation amount was mainly due to the long life of infrastructure assets. For example, the useful life the stormwater pipe is up to 135 years. Figure 2.1 shows the replacement value breakdown of Council’s assets. It is found that transport assets formed the largest asset portfolio, taking up to 63% of the asset replacement value, with drainage assets following it as the second (26%).
Page 9
Figure 2.2: Asset Replacement Values
2.3.2 Asset Condition, Function and Capacity
Our State of the Assets Report monitors the performance of the assets under three community service indicators:
• condition/quality – how good is the service?
• function - does it meet users’ needs?
• capacity/utilisation – is the service usage appropriate to capacity?
The Asset Consumption Ratios (ACRs) of Council’s assets is an indicator of the average proportion of ‘as new’ condition left in assets. The ACRs for each major asset class shown in Figure 2.3, calculated by using the written down value divided by the current replacement cost, are showing that most of Council’s infrastructure assets are half-consumed and moving into the second half of their life cycle (asset consumption ratio < 50%). This means the requirement for asset renewal expenditure will start to grow.
63%
26%
8% 3%
Asset Replacement Values
Transport - $521 Million
Drainage - $215 Million
Buildings - $62 Million
Other Infrastructure (Parks &Recreation) - $25 Million
Page 10
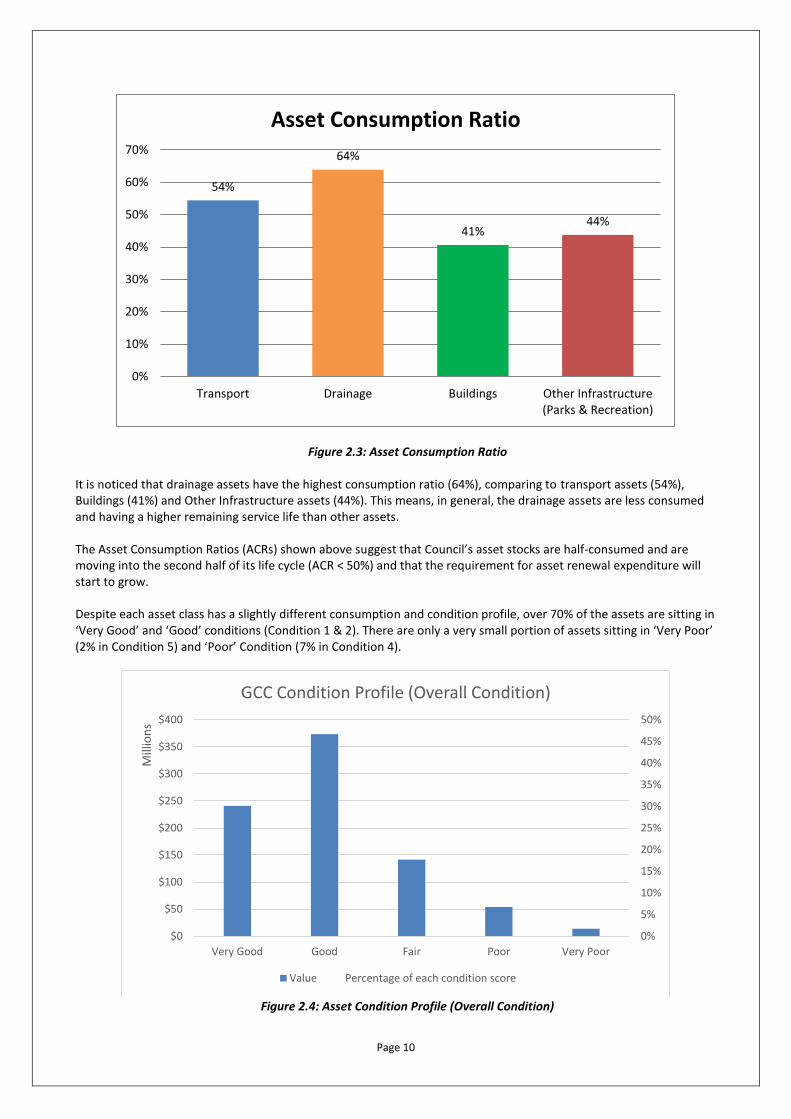
Figure 2.3: Asset Consumption Ratio
It is noticed that drainage assets have the highest consumption ratio (64%), comparing to transport assets (54%), Buildings (41%) and Other Infrastructure assets (44%). This means, in general, the drainage assets are less consumed and having a higher remaining service life than other assets. The Asset Consumption Ratios (ACRs) shown above suggest that Council’s asset stocks are half-consumed and are moving into the second half of its life cycle (ACR < 50%) and that the requirement for asset renewal expenditure will start to grow. Despite each asset class has a slightly different consumption and condition profile, over 70% of the assets are sitting in ‘Very Good’ and ‘Good’ conditions (Condition 1 & 2). There are only a very small portion of assets sitting in ‘Very Poor’ (2% in Condition 5) and ‘Poor’ Condition (7% in Condition 4).
Figure 2.4: Asset Condition Profile (Overall Condition)
54%
64%
41%44%
0%
10%
20%
30%
40%
50%
60%
70%
Transport Drainage Buildings Other Infrastructure(Parks & Recreation)
Asset Consumption Ratio
0%
5%
10%
15%
20%
25%
30%
35%
40%
45%
50%
$0
$50
$100
$150
$200
$250
$300
$350
$400
Very Good Good Fair Poor Very Poor
Mill
ion
s
GCC Condition Profile (Overall Condition)
Value Percentage of each condition score
Page 11
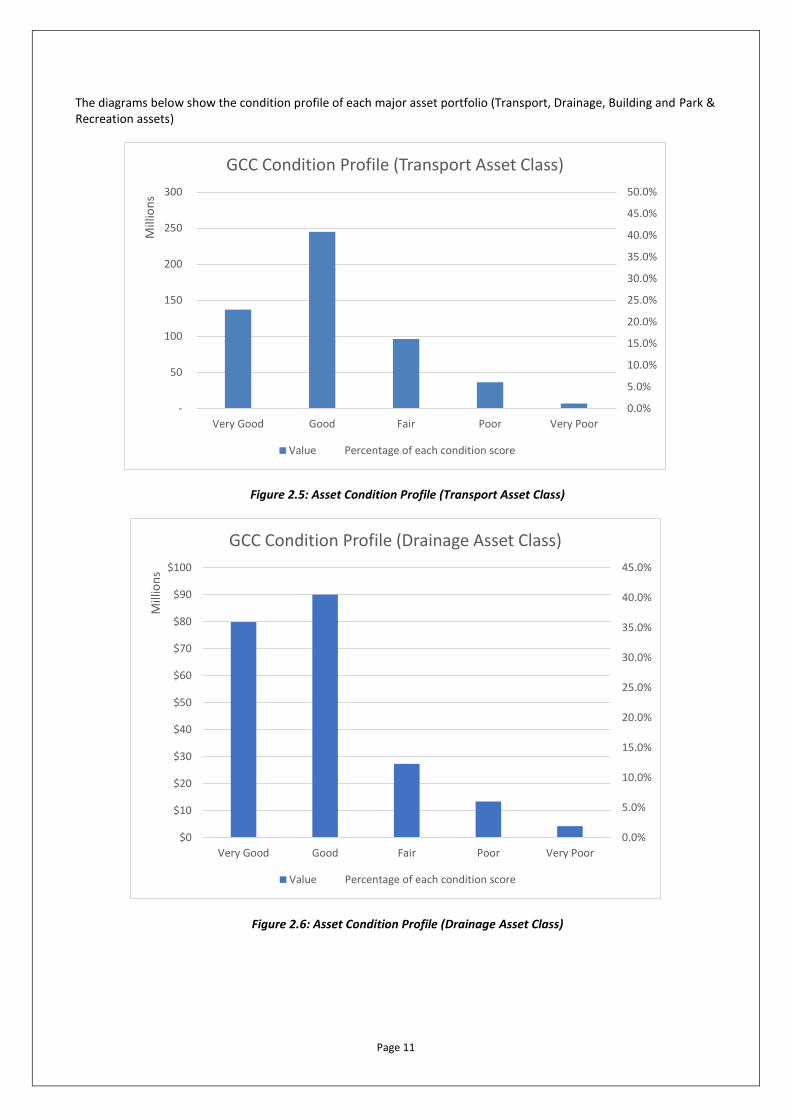
The diagrams below show the condition profile of each major asset portfolio (Transport, Drainage, Building and Park & Recreation assets)
Figure 2.5: Asset Condition Profile (Transport Asset Class)
Figure 2.6: Asset Condition Profile (Drainage Asset Class)
0.0%
5.0%
10.0%
15.0%
20.0%
25.0%
30.0%
35.0%
40.0%
45.0%
50.0%
-
50
100
150
200
250
300
Very Good Good Fair Poor Very Poor
Mill
ion
s
GCC Condition Profile (Transport Asset Class)
Value Percentage of each condition score
0.0%
5.0%
10.0%
15.0%
20.0%
25.0%
30.0%
35.0%
40.0%
45.0%
$0
$10
$20
$30
$40
$50
$60
$70
$80
$90
$100
Very Good Good Fair Poor Very Poor
Mill
ion
s
GCC Condition Profile (Drainage Asset Class)
Value Percentage of each condition score
Page 12
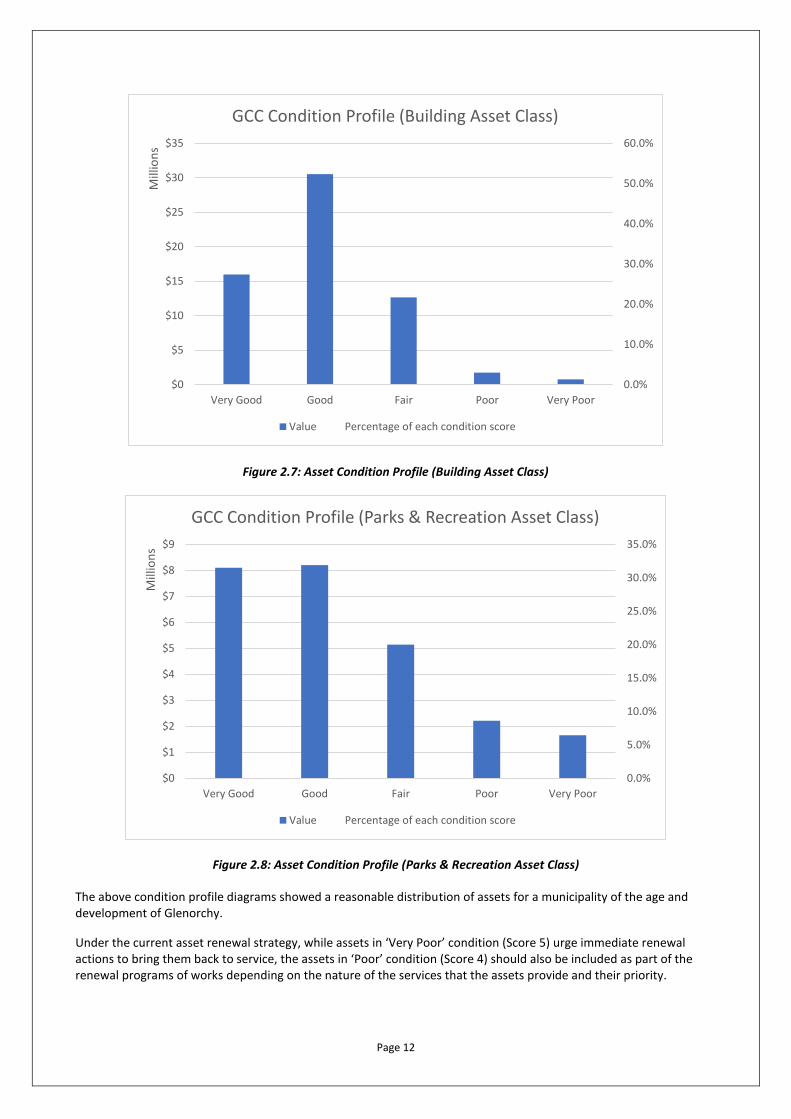
Figure 2.7: Asset Condition Profile (Building Asset Class)
Figure 2.8: Asset Condition Profile (Parks & Recreation Asset Class)
The above condition profile diagrams showed a reasonable distribution of assets for a municipality of the age and development of Glenorchy.
Under the current asset renewal strategy, while assets in ‘Very Poor’ condition (Score 5) urge immediate renewal actions to bring them back to service, the assets in ‘Poor’ condition (Score 4) should also be included as part of the renewal programs of works depending on the nature of the services that the assets provide and their priority.
0.0%
10.0%
20.0%
30.0%
40.0%
50.0%
60.0%
$0
$5
$10
$15
$20
$25
$30
$35
Very Good Good Fair Poor Very Poor
Mill
ion
s
GCC Condition Profile (Building Asset Class)
Value Percentage of each condition score
0.0%
5.0%
10.0%
15.0%
20.0%
25.0%
30.0%
35.0%
$0
$1
$2
$3
$4
$5
$6
$7
$8
$9
Very Good Good Fair Poor Very Poor
Mill
ion
s
GCC Condition Profile (Parks & Recreation Asset Class)
Value Percentage of each condition score
Page 13
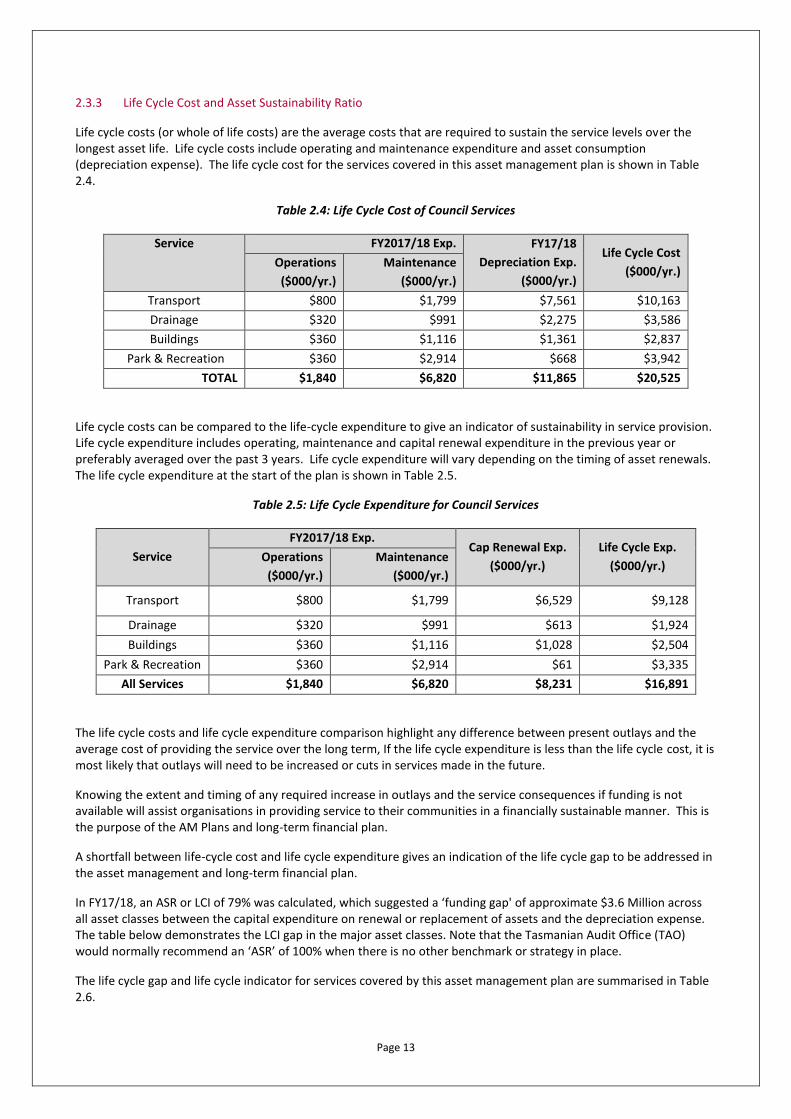
2.3.3 Life Cycle Cost and Asset Sustainability Ratio
Life cycle costs (or whole of life costs) are the average costs that are required to sustain the service levels over the longest asset life. Life cycle costs include operating and maintenance expenditure and asset consumption (depreciation expense). The life cycle cost for the services covered in this asset management plan is shown in Table 2.4.
Table 2.4: Life Cycle Cost of Council Services
Service FY2017/18 Exp. FY17/18
Depreciation Exp.
($000/yr.)
Life Cycle Cost
($000/yr.) Operations
($000/yr.)
Maintenance
($000/yr.)
Transport $800 $1,799 $7,561 $10,163
Drainage $320 $991 $2,275 $3,586
Buildings $360 $1,116 $1,361 $2,837
Park & Recreation $360 $2,914 $668 $3,942
TOTAL $1,840 $6,820 $11,865 $20,525
Life cycle costs can be compared to the life-cycle expenditure to give an indicator of sustainability in service provision. Life cycle expenditure includes operating, maintenance and capital renewal expenditure in the previous year or preferably averaged over the past 3 years. Life cycle expenditure will vary depending on the timing of asset renewals. The life cycle expenditure at the start of the plan is shown in Table 2.5.
Table 2.5: Life Cycle Expenditure for Council Services
Service
FY2017/18 Exp. Cap Renewal Exp.
($000/yr.)
Life Cycle Exp.
($000/yr.) Operations
($000/yr.)
Maintenance
($000/yr.)
Transport $800 $1,799 $6,529 $9,128
Drainage $320 $991 $613 $1,924
Buildings $360 $1,116 $1,028 $2,504
Park & Recreation $360 $2,914 $61 $3,335
All Services $1,840 $6,820 $8,231 $16,891
The life cycle costs and life cycle expenditure comparison highlight any difference between present outlays and the average cost of providing the service over the long term, If the life cycle expenditure is less than the life cycle cost, it is most likely that outlays will need to be increased or cuts in services made in the future.
Knowing the extent and timing of any required increase in outlays and the service consequences if funding is not available will assist organisations in providing service to their communities in a financially sustainable manner. This is the purpose of the AM Plans and long-term financial plan.
A shortfall between life-cycle cost and life cycle expenditure gives an indication of the life cycle gap to be addressed in the asset management and long-term financial plan.
In FY17/18, an ASR or LCI of 79% was calculated, which suggested a ‘funding gap' of approximate $3.6 Million across all asset classes between the capital expenditure on renewal or replacement of assets and the depreciation expense. The table below demonstrates the LCI gap in the major asset classes. Note that the Tasmanian Audit Office (TAO) would normally recommend an ‘ASR’ of 100% when there is no other benchmark or strategy in place.
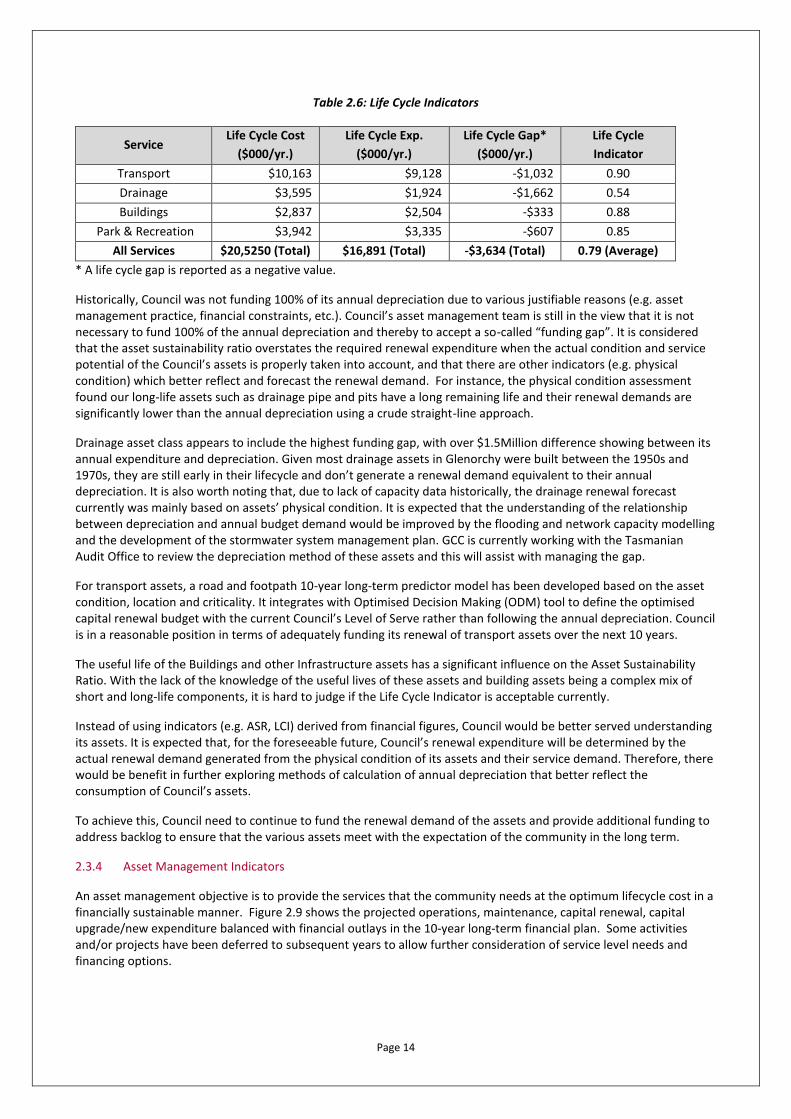
The life cycle gap and life cycle indicator for services covered by this asset management plan are summarised in Table 2.6.
Page 14
Table 2.6: Life Cycle Indicators
Service Life Cycle Cost
($000/yr.)
Life Cycle Exp.
($000/yr.)
Life Cycle Gap*
($000/yr.)
Life Cycle
Indicator
Transport $10,163 $9,128 -$1,032 0.90
Drainage $3,595 $1,924 -$1,662 0.54
Buildings $2,837 $2,504 -$333 0.88
Park & Recreation $3,942 $3,335 -$607 0.85
All Services $20,5250 (Total) $16,891 (Total) -$3,634 (Total) 0.79 (Average)
* A life cycle gap is reported as a negative value.
Historically, Council was not funding 100% of its annual depreciation due to various justifiable reasons (e.g. asset management practice, financial constraints, etc.). Council’s asset management team is still in the view that it is not necessary to fund 100% of the annual depreciation and thereby to accept a so-called “funding gap”. It is considered that the asset sustainability ratio overstates the required renewal expenditure when the actual condition and service potential of the Council’s assets is properly taken into account, and that there are other indicators (e.g. physical condition) which better reflect and forecast the renewal demand. For instance, the physical condition assessment found our long-life assets such as drainage pipe and pits have a long remaining life and their renewal demands are significantly lower than the annual depreciation using a crude straight-line approach.
Drainage asset class appears to include the highest funding gap, with over $1.5Million difference showing between its annual expenditure and depreciation. Given most drainage assets in Glenorchy were built between the 1950s and 1970s, they are still early in their lifecycle and don’t generate a renewal demand equivalent to their annual depreciation. It is also worth noting that, due to lack of capacity data historically, the drainage renewal forecast currently was mainly based on assets’ physical condition. It is expected that the understanding of the relationship between depreciation and annual budget demand would be improved by the flooding and network capacity modelling and the development of the stormwater system management plan. GCC is currently working with the Tasmanian Audit Office to review the depreciation method of these assets and this will assist with managing the gap.
For transport assets, a road and footpath 10-year long-term predictor model has been developed based on the asset condition, location and criticality. It integrates with Optimised Decision Making (ODM) tool to define the optimised capital renewal budget with the current Council’s Level of Serve rather than following the annual depreciation. Council is in a reasonable position in terms of adequately funding its renewal of transport assets over the next 10 years.
The useful life of the Buildings and other Infrastructure assets has a significant influence on the Asset Sustainability Ratio. With the lack of the knowledge of the useful lives of these assets and building assets being a complex mix of short and long-life components, it is hard to judge if the Life Cycle Indicator is acceptable currently.
Instead of using indicators (e.g. ASR, LCI) derived from financial figures, Council would be better served understanding its assets. It is expected that, for the foreseeable future, Council’s renewal expenditure will be determined by the actual renewal demand generated from the physical condition of its assets and their service demand. Therefore, there would be benefit in further exploring methods of calculation of annual depreciation that better reflect the consumption of Council’s assets.
To achieve this, Council need to continue to fund the renewal demand of the assets and provide additional funding to address backlog to ensure that the various assets meet with the expectation of the community in the long term.
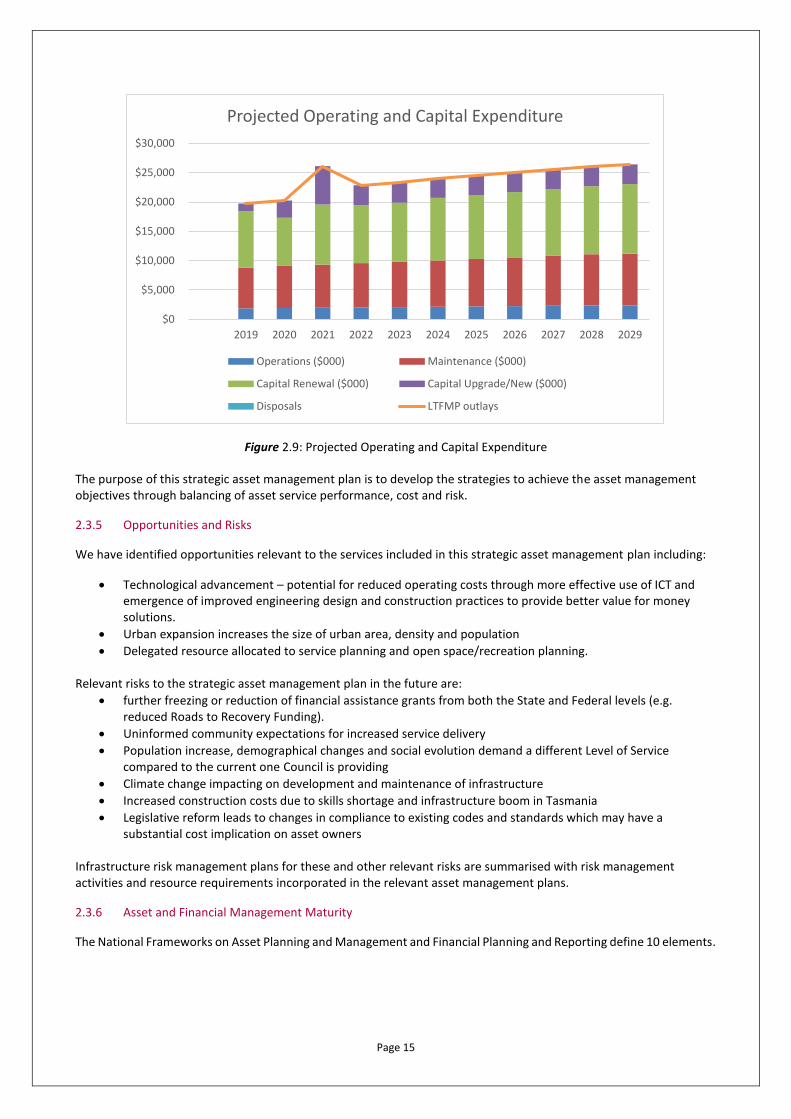
2.3.4 Asset Management Indicators
An asset management objective is to provide the services that the community needs at the optimum lifecycle cost in a financially sustainable manner. Figure 2.9 shows the projected operations, maintenance, capital renewal, capital upgrade/new expenditure balanced with financial outlays in the 10-year long-term financial plan. Some activities and/or projects have been deferred to subsequent years to allow further consideration of service level needs and financing options.
Page 15
Figure 2.9: Projected Operating and Capital Expenditure
The purpose of this strategic asset management plan is to develop the strategies to achieve the asset management objectives through balancing of asset service performance, cost and risk.
2.3.5 Opportunities and Risks
We have identified opportunities relevant to the services included in this strategic asset management plan including:
• Technological advancement – potential for reduced operating costs through more effective use of ICT and emergence of improved engineering design and construction practices to provide better value for money solutions.
• Urban expansion increases the size of urban area, density and population
• Delegated resource allocated to service planning and open space/recreation planning.
Relevant risks to the strategic asset management plan in the future are:
• further freezing or reduction of financial assistance grants from both the State and Federal levels (e.g. reduced Roads to Recovery Funding).
• Uninformed community expectations for increased service delivery
• Population increase, demographical changes and social evolution demand a different Level of Service compared to the current one Council is providing
• Climate change impacting on development and maintenance of infrastructure
• Increased construction costs due to skills shortage and infrastructure boom in Tasmania
• Legislative reform leads to changes in compliance to existing codes and standards which may have a substantial cost implication on asset owners
Infrastructure risk management plans for these and other relevant risks are summarised with risk management activities and resource requirements incorporated in the relevant asset management plans.
2.3.6 Asset and Financial Management Maturity
The National Frameworks on Asset Planning and Management and Financial Planning and Reporting define 10 elements.
$0
$5,000
$10,000
$15,000
$20,000
$25,000
$30,000
2019 2020 2021 2022 2023 2024 2025 2026 2027 2028 2029
Projected Operating and Capital Expenditure
Operations ($000) Maintenance ($000)
Capital Renewal ($000) Capital Upgrade/New ($000)
Disposals LTFMP outlays
Page 16
11 core competencies have been developed from these elements8 to assess ‘core’ competency under the National Frameworks. These core competencies are:
Financial Planning and Reporting
✓ Strategic Longer-Term Plan
✓ Annual Budget
✓ Annual report
Asset Planning and Management
✓ Asset Management Policy
✓ Asset Management Strategy
✓ Asset Management Plan
✓ Governance & Management
✓ Levels of Service
✓ Data & Systems
✓ Skills & processes
✓ Evaluation
In terms of undertaking asset management and implement it within the organisation, Asset Management Maturity (AMM) is the indicator in determining how good the asset management practice is within an organisation.
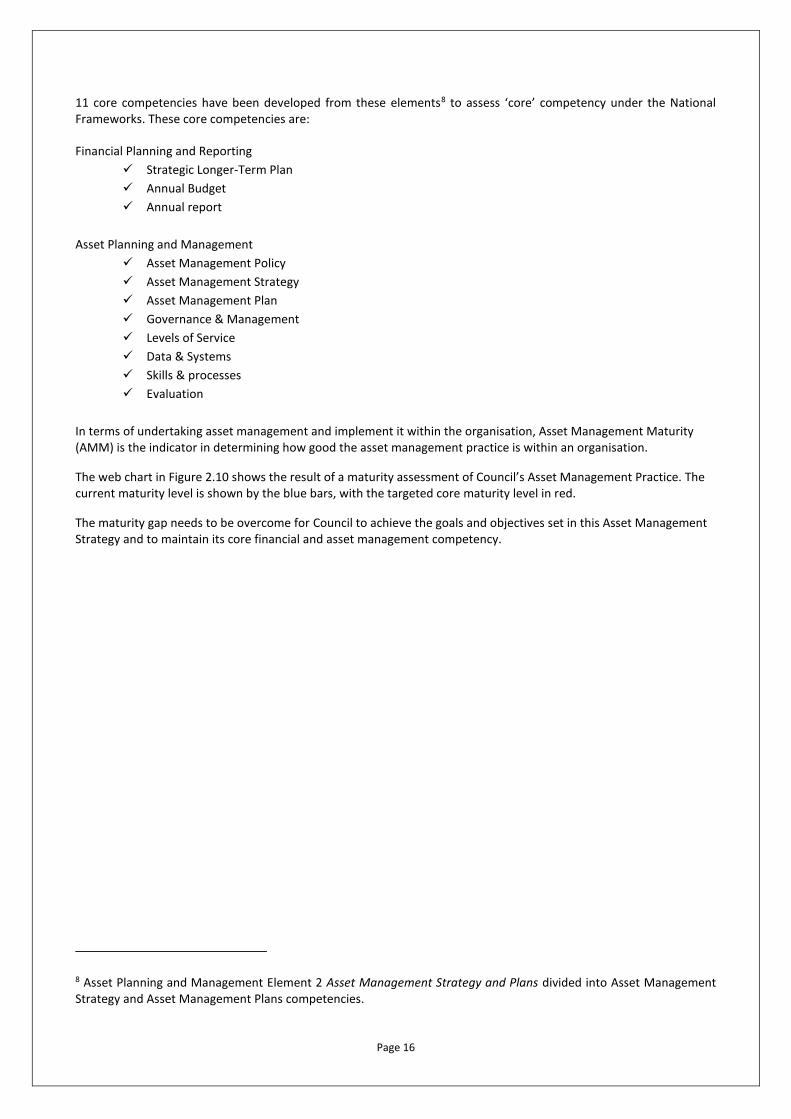
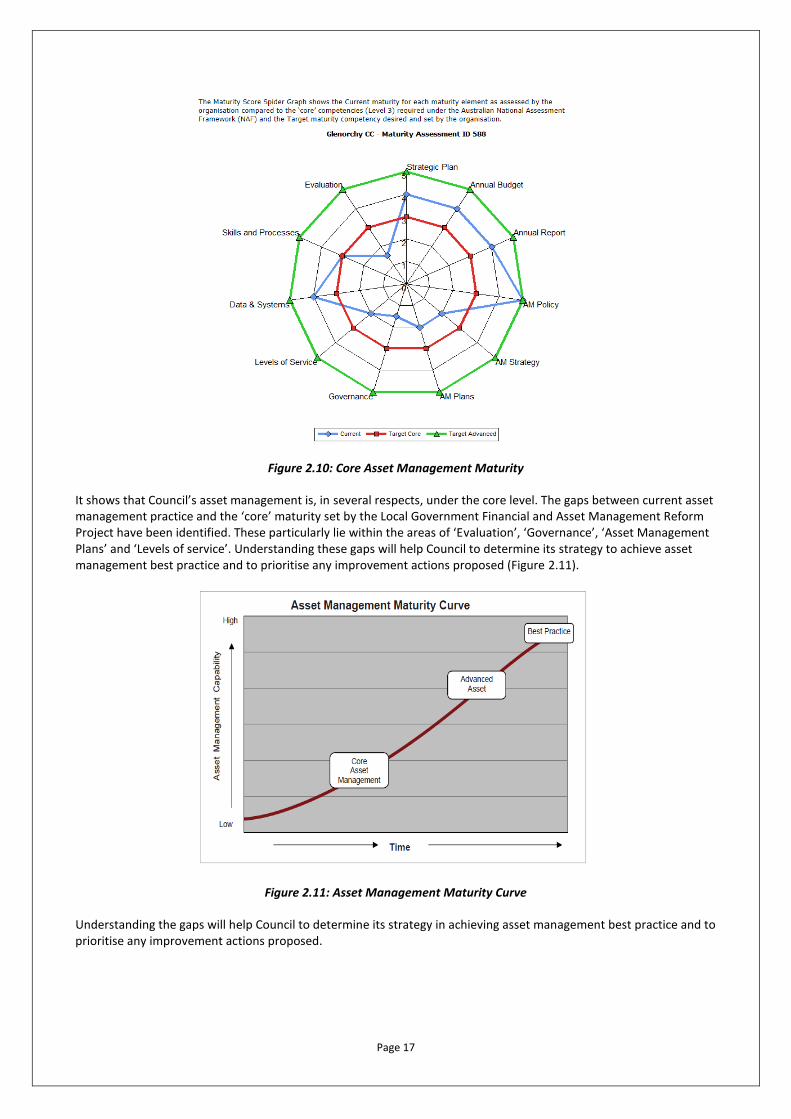
The web chart in Figure 2.10 shows the result of a maturity assessment of Council’s Asset Management Practice. The current maturity level is shown by the blue bars, with the targeted core maturity level in red.
The maturity gap needs to be overcome for Council to achieve the goals and objectives set in this Asset Management Strategy and to maintain its core financial and asset management competency.
8 Asset Planning and Management Element 2 Asset Management Strategy and Plans divided into Asset Management Strategy and Asset Management Plans competencies.
Page 17
Figure 2.10: Core Asset Management Maturity
It shows that Council’s asset management is, in several respects, under the core level. The gaps between current asset management practice and the ‘core’ maturity set by the Local Government Financial and Asset Management Reform Project have been identified. These particularly lie within the areas of ‘Evaluation’, ‘Governance’, ‘Asset Management Plans’ and ‘Levels of service’. Understanding these gaps will help Council to determine its strategy to achieve asset management best practice and to prioritise any improvement actions proposed (Figure 2.11).
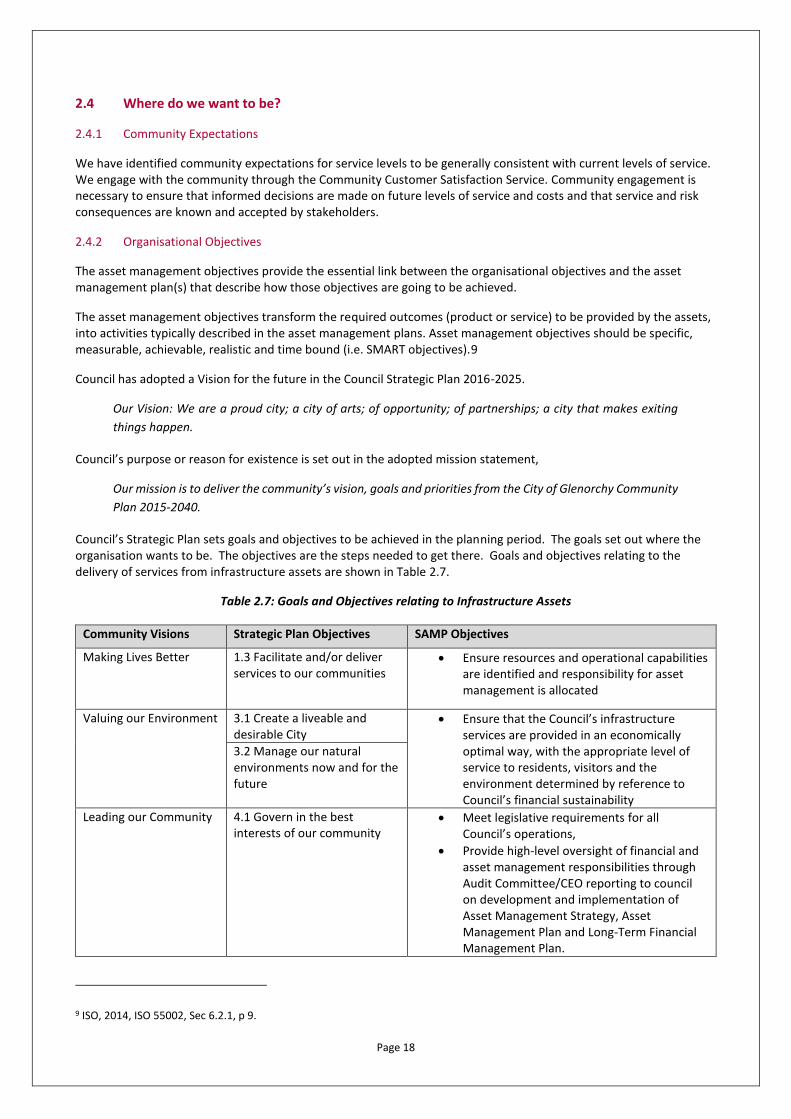
Figure 2.11: Asset Management Maturity Curve
Understanding the gaps will help Council to determine its strategy in achieving asset management best practice and to prioritise any improvement actions proposed.
Page 18
2.4 Where do we want to be?
2.4.1 Community Expectations
We have identified community expectations for service levels to be generally consistent with current levels of service. We engage with the community through the Community Customer Satisfaction Service. Community engagement is necessary to ensure that informed decisions are made on future levels of service and costs and that service and risk consequences are known and accepted by stakeholders.
2.4.2 Organisational Objectives
The asset management objectives provide the essential link between the organisational objectives and the asset management plan(s) that describe how those objectives are going to be achieved.
The asset management objectives transform the required outcomes (product or service) to be provided by the assets, into activities typically described in the asset management plans. Asset management objectives should be specific, measurable, achievable, realistic and time bound (i.e. SMART objectives).9
Council has adopted a Vision for the future in the Council Strategic Plan 2016-2025.
Our Vision: We are a proud city; a city of arts; of opportunity; of partnerships; a city that makes exiting
things happen.
Council’s purpose or reason for existence is set out in the adopted mission statement,
Our mission is to deliver the community’s vision, goals and priorities from the City of Glenorchy Community
Plan 2015-2040.
Council’s Strategic Plan sets goals and objectives to be achieved in the planning period. The goals set out where the organisation wants to be. The objectives are the steps needed to get there. Goals and objectives relating to the delivery of services from infrastructure assets are shown in Table 2.7.
Table 2.7: Goals and Objectives relating to Infrastructure Assets
Community Visions Strategic Plan Objectives SAMP Objectives
Making Lives Better 1.3 Facilitate and/or deliver services to our communities
• Ensure resources and operational capabilities are identified and responsibility for asset management is allocated
Valuing our Environment
3.1 Create a liveable and desirable City
• Ensure that the Council’s infrastructure services are provided in an economically optimal way, with the appropriate level of service to residents, visitors and the environment determined by reference to Council’s financial sustainability
3.2 Manage our natural environments now and for the future
Leading our Community 4.1 Govern in the best interests of our community
• Meet legislative requirements for all Council’s operations,
• Provide high-level oversight of financial and asset management responsibilities through Audit Committee/CEO reporting to council on development and implementation of Asset Management Strategy, Asset Management Plan and Long-Term Financial Management Plan.
9 ISO, 2014, ISO 55002, Sec 6.2.1, p 9.
Page 19
Community Visions Strategic Plan Objectives SAMP Objectives
• Adopt the Long-Term Financial Management Plan as the basis for all service and budget funding decisions
2.5 Asset Management Vision
To ensure the long-term financial sustainability of Council, it is essential to balance the community’s expectations for services with their ability to pay for the infrastructure assets used to provide the services. Maintenance of service levels for infrastructure services requires appropriate investment over the whole of the asset life cycle. To assist in achieving this balance, Council aspires to:
• Develop and maintain asset management governance, skills, process, systems and data to provide the level of service the community need at present and in the futures, in the most cost-effective and fit for purpose manner.
• In line with the vision, the objectives of the asset management strategy are to:
• ensure that the Council’s infrastructure services are provided in an economically optimal way, with the appropriate level of service to residents, visitors and the environment determined by reference to Council’s financial sustainability,
• safeguard Council’s assets including physical assets and employees by implementing appropriate asset management strategies and appropriate financial resources for those assets,
• adopt the Long-Term Financial Management Plan as the basis for all service and budget funding decisions,
• meet legislative requirements for all Council’s operations,
• ensure resources and operational capabilities are identified and responsibility for asset management is allocated,
• provide high-level oversight of financial and asset management responsibilities through Audit Committee/CEO reporting to council on development and implementation of Asset Management Strategy, Asset Management Plan and Long-Term Financial Management Plan.
Strategies to achieve this position are outlined in Section 7.
Page 20
2.6. How will we get there?
2.6.1 Guiding Principles
The following guiding principles were developed to provide clear objectives for Council’s asset management, focus of the asset management strategy and establish priorities to guide future practice.
Council will:
• invest in high use areas
develop a differentiated approach to service delivery by recognising that greater investment is required in high
use areas (e.g. wider footpaths in CBD areas).
• engage with the community
continue to understand the needs of the community through engagement e.g. Local Government Association
Tasmania (LGAT) community satisfaction survey, customer service requests and project consultation.
• provide services to an affordable standard
focus on asset renewals and alternative methods of providing affordable levels of service to meet the needs of
the community e.g. relining of stormwater pipes, use of recycled asphalt, increase spending on bituminous
resurfacing.
• cater for future demand
assess the requirement of new services to cater for future demand of our city. In assessing new service, Council
will consider the whole of life cycle costs and the ability to fund. e.g. access external funding to build new
destination playgrounds, upgrade of toilets, business case development for the upgrade of sports grounds and
facilities and building new footpath that focus on high traffic areas.
• best practice asset management
continue to invest in asset management to achieve a ‘core level’ of maturity e.g. ensure alignment of asset
management plans with the long-term financial plan, training and investment in our people and benchmark
our performance.
• dispose of surplus assets
dispose of surplus assets to achieve long term sustainability e.g. repurposing of underutilised land, closure of
Derwent Park Reuse Scheme and consolidation of playgrounds.
• shared facilities and services
explore the opportunities to work together with other service providers for non-asset methods of providing
sustainable service delivery. e.g. delivery of road works on the border with adjoining Councils, working with
the Education Department to access sports grounds, developing shared facilities for sport and community
users.
2.6.2 Strategy
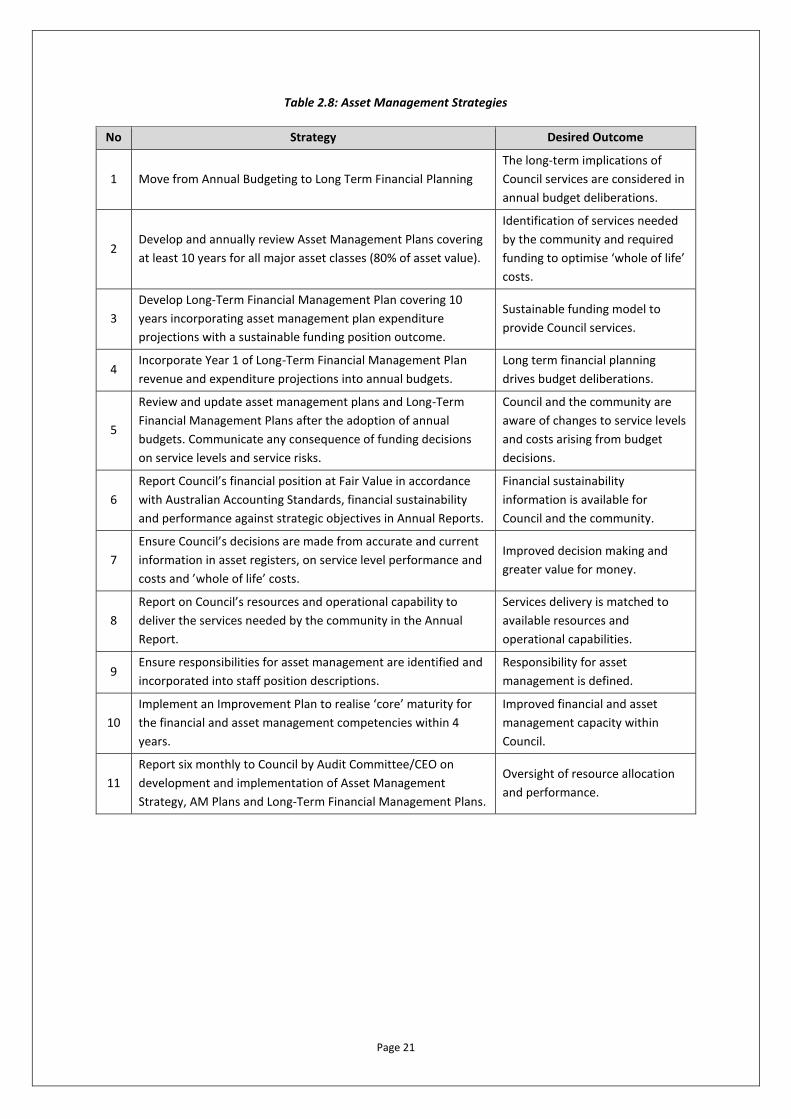
Following the guideline principles above, eleven (11) asset management strategies (Figure 2.8) are proposed below to enable the objectives of Council’s Strategic Plan, Asset Management Policy and Asset Management Vision to be achieved. The strategies are derived from NAMS.PLUS – the most widely used asset management template in Australia aligned with the International Infrastructure Management Manual (IIMM) 2015 and International Asset Management Standard ISO 550011.
Page 21
Table 2.8: Asset Management Strategies
No Strategy Desired Outcome
1 Move from Annual Budgeting to Long Term Financial Planning
The long-term implications of
Council services are considered in
annual budget deliberations.
2 Develop and annually review Asset Management Plans covering
at least 10 years for all major asset classes (80% of asset value).
Identification of services needed
by the community and required
funding to optimise ‘whole of life’
costs.
3
Develop Long-Term Financial Management Plan covering 10
years incorporating asset management plan expenditure
projections with a sustainable funding position outcome.
Sustainable funding model to
provide Council services.
4 Incorporate Year 1 of Long-Term Financial Management Plan
revenue and expenditure projections into annual budgets.
Long term financial planning
drives budget deliberations.
5
Review and update asset management plans and Long-Term
Financial Management Plans after the adoption of annual
budgets. Communicate any consequence of funding decisions
on service levels and service risks.
Council and the community are
aware of changes to service levels
and costs arising from budget
decisions.
6
Report Council’s financial position at Fair Value in accordance
with Australian Accounting Standards, financial sustainability
and performance against strategic objectives in Annual Reports.
Financial sustainability
information is available for
Council and the community.
7
Ensure Council’s decisions are made from accurate and current
information in asset registers, on service level performance and
costs and ’whole of life’ costs.
Improved decision making and
greater value for money.
8
Report on Council’s resources and operational capability to
deliver the services needed by the community in the Annual
Report.
Services delivery is matched to
available resources and
operational capabilities.
9 Ensure responsibilities for asset management are identified and
incorporated into staff position descriptions.
Responsibility for asset
management is defined.
10
Implement an Improvement Plan to realise ‘core’ maturity for
the financial and asset management competencies within 4
years.
Improved financial and asset
management capacity within
Council.
11
Report six monthly to Council by Audit Committee/CEO on
development and implementation of Asset Management
Strategy, AM Plans and Long-Term Financial Management Plans.
Oversight of resource allocation
and performance.
Page 22
2.7 Asset Management Improvement Plan
The tasks required achieving a ‘core’ financial and asset management maturity are shown in priority order in the asset management improvement plan in Section 7.1
2.8. Consequences if actions are not completed
There are consequences for the Council/Board if the improvement actions are not completed. These include:
• Inability to achieve strategic and organisational objectives
• Inability to achieve financial sustainability for the organisation’s operations
• Current risks to infrastructure service delivery are likely to eventuate and response actions may not be appropriately managed
• We may not be able to accommodate and/or manage changes in demand for infrastructure services.
Page 23
3. LEVELS OF SERVICE
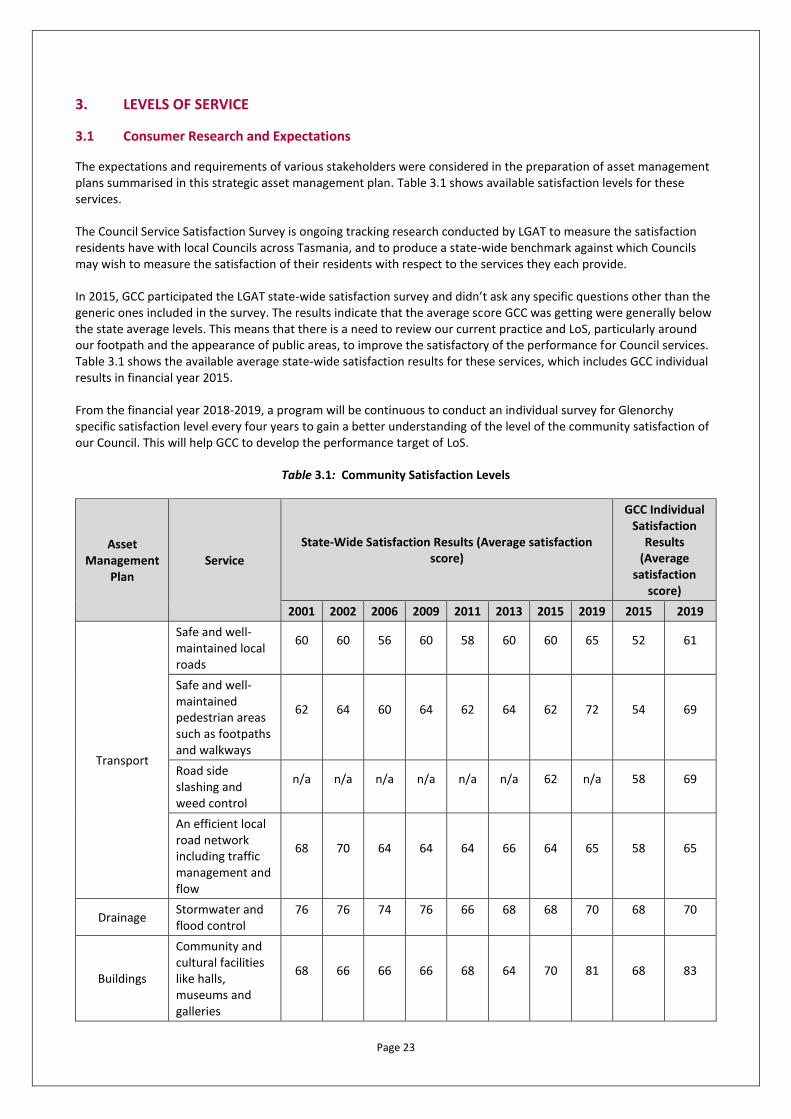
3.1 Consumer Research and Expectations
The expectations and requirements of various stakeholders were considered in the preparation of asset management plans summarised in this strategic asset management plan. Table 3.1 shows available satisfaction levels for these services. The Council Service Satisfaction Survey is ongoing tracking research conducted by LGAT to measure the satisfaction residents have with local Councils across Tasmania, and to produce a state-wide benchmark against which Councils may wish to measure the satisfaction of their residents with respect to the services they each provide. In 2015, GCC participated the LGAT state-wide satisfaction survey and didn’t ask any specific questions other than the generic ones included in the survey. The results indicate that the average score GCC was getting were generally below the state average levels. This means that there is a need to review our current practice and LoS, particularly around our footpath and the appearance of public areas, to improve the satisfactory of the performance for Council services. Table 3.1 shows the available average state-wide satisfaction results for these services, which includes GCC individual results in financial year 2015. From the financial year 2018-2019, a program will be continuous to conduct an individual survey for Glenorchy specific satisfaction level every four years to gain a better understanding of the level of the community satisfaction of our Council. This will help GCC to develop the performance target of LoS.
Table 3.1: Community Satisfaction Levels
Asset Management
Plan Service
State-Wide Satisfaction Results (Average satisfaction score)
GCC Individual Satisfaction
Results (Average
satisfaction score)
2001 2002 2006 2009 2011 2013 2015 2019 2015 2019
Transport
Safe and well-maintained local roads
60 60 56 60 58 60 60 65 52 61
Safe and well-maintained pedestrian areas such as footpaths and walkways
62 64 60 64 62 64 62 72 54 69
Road side slashing and weed control
n/a n/a n/a n/a n/a n/a 62 n/a 58 69
An efficient local road network including traffic management and flow
68 70 64 64 64 66 64 65 58 65
Drainage Stormwater and flood control
76 76 74 76 66 68 68 70 68 70
Buildings
Community and cultural facilities like halls, museums and galleries
68 66 66 66 68 64 70 81 68 83
Page 24
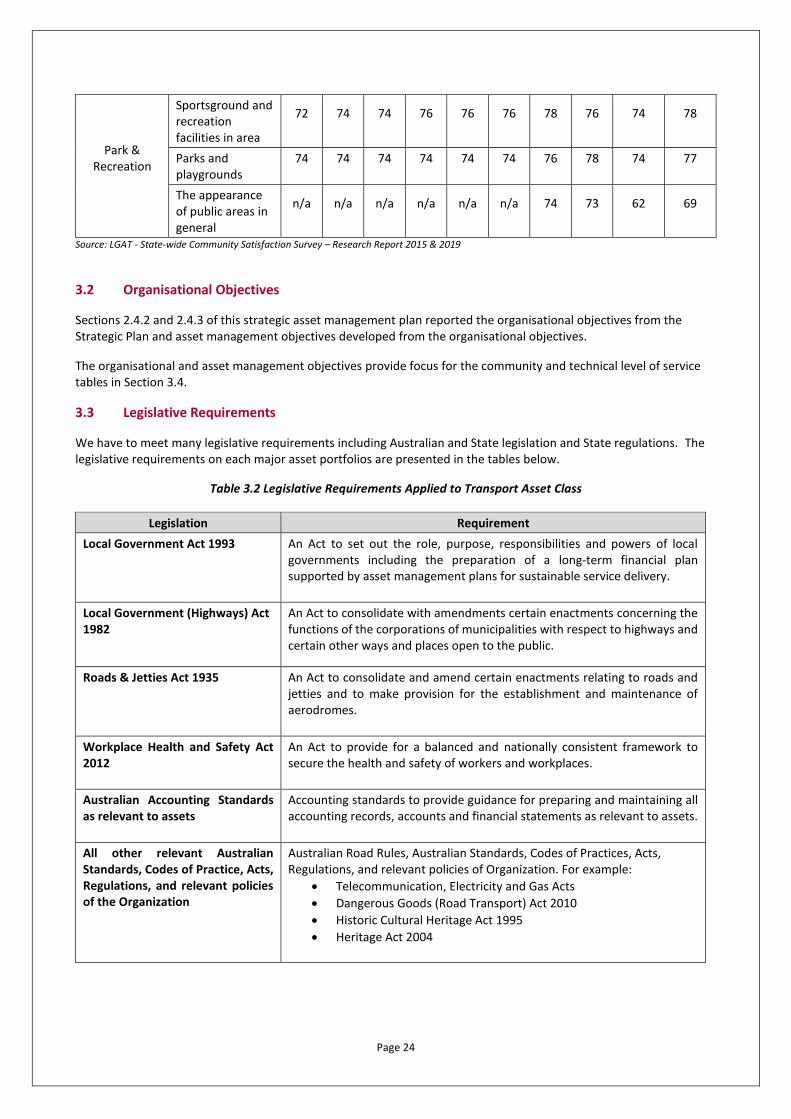
Park & Recreation
Sportsground and recreation facilities in area
72 74 74 76 76 76 78 76 74 78
Parks and playgrounds
74 74 74 74 74 74 76 78 74 77
The appearance of public areas in general
n/a n/a n/a n/a n/a n/a 74 73 62 69
Source: LGAT - State-wide Community Satisfaction Survey – Research Report 2015 & 2019
3.2 Organisational Objectives
Sections 2.4.2 and 2.4.3 of this strategic asset management plan reported the organisational objectives from the Strategic Plan and asset management objectives developed from the organisational objectives.
The organisational and asset management objectives provide focus for the community and technical level of service tables in Section 3.4.
3.3 Legislative Requirements
We have to meet many legislative requirements including Australian and State legislation and State regulations. The legislative requirements on each major asset portfolios are presented in the tables below.
Table 3.2 Legislative Requirements Applied to Transport Asset Class
Legislation Requirement
Local Government Act 1993 An Act to set out the role, purpose, responsibilities and powers of local governments including the preparation of a long-term financial plan supported by asset management plans for sustainable service delivery.
Local Government (Highways) Act 1982
An Act to consolidate with amendments certain enactments concerning the functions of the corporations of municipalities with respect to highways and certain other ways and places open to the public.
Roads & Jetties Act 1935 An Act to consolidate and amend certain enactments relating to roads and jetties and to make provision for the establishment and maintenance of aerodromes.
Workplace Health and Safety Act 2012
An Act to provide for a balanced and nationally consistent framework to secure the health and safety of workers and workplaces.
Australian Accounting Standards as relevant to assets
Accounting standards to provide guidance for preparing and maintaining all accounting records, accounts and financial statements as relevant to assets.
All other relevant Australian Standards, Codes of Practice, Acts, Regulations, and relevant policies of the Organization
Australian Road Rules, Australian Standards, Codes of Practices, Acts, Regulations, and relevant policies of Organization. For example:
• Telecommunication, Electricity and Gas Acts
• Dangerous Goods (Road Transport) Act 2010
• Historic Cultural Heritage Act 1995
• Heritage Act 2004
Page 25
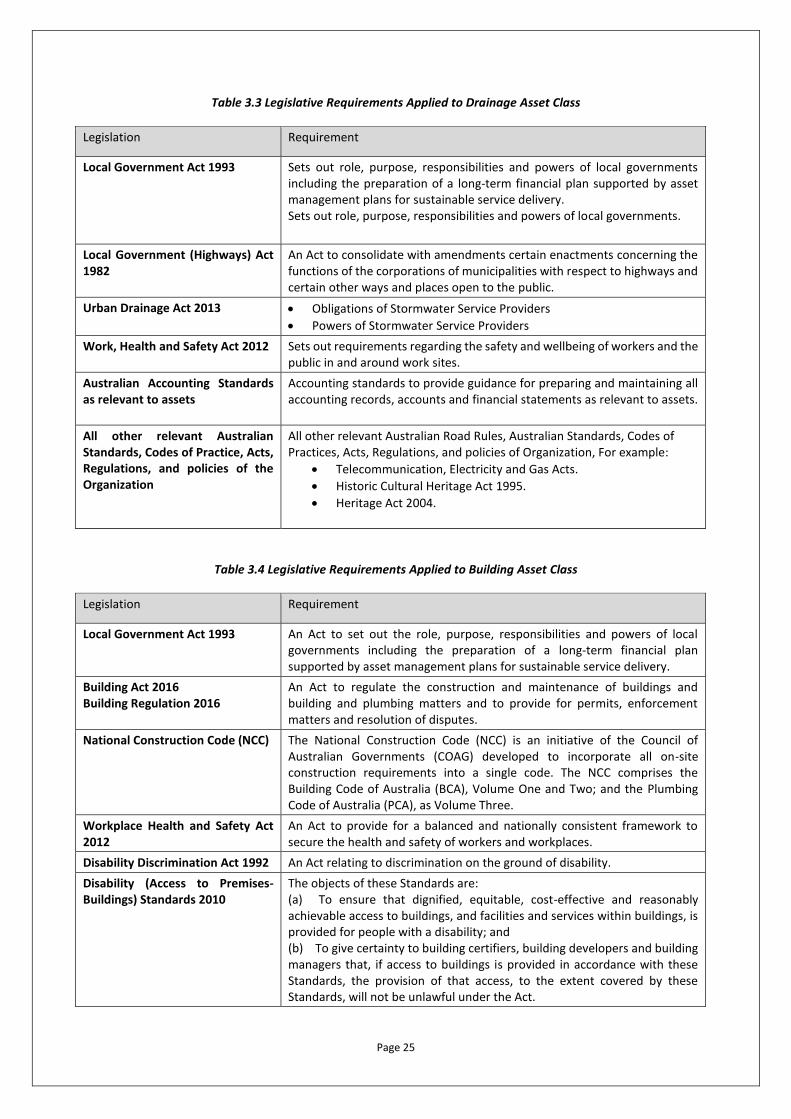
Table 3.3 Legislative Requirements Applied to Drainage Asset Class
Legislation Requirement
Local Government Act 1993 Sets out role, purpose, responsibilities and powers of local governments including the preparation of a long-term financial plan supported by asset management plans for sustainable service delivery. Sets out role, purpose, responsibilities and powers of local governments.
Local Government (Highways) Act 1982
An Act to consolidate with amendments certain enactments concerning the functions of the corporations of municipalities with respect to highways and certain other ways and places open to the public.
Urban Drainage Act 2013 • Obligations of Stormwater Service Providers
• Powers of Stormwater Service Providers
Work, Health and Safety Act 2012 Sets out requirements regarding the safety and wellbeing of workers and the public in and around work sites.
Australian Accounting Standards as relevant to assets
Accounting standards to provide guidance for preparing and maintaining all accounting records, accounts and financial statements as relevant to assets.
All other relevant Australian Standards, Codes of Practice, Acts, Regulations, and policies of the Organization
All other relevant Australian Road Rules, Australian Standards, Codes of Practices, Acts, Regulations, and policies of Organization, For example:
• Telecommunication, Electricity and Gas Acts.
• Historic Cultural Heritage Act 1995.
• Heritage Act 2004.
Table 3.4 Legislative Requirements Applied to Building Asset Class
Legislation Requirement
Local Government Act 1993 An Act to set out the role, purpose, responsibilities and powers of local governments including the preparation of a long-term financial plan supported by asset management plans for sustainable service delivery.
Building Act 2016 Building Regulation 2016
An Act to regulate the construction and maintenance of buildings and building and plumbing matters and to provide for permits, enforcement matters and resolution of disputes.
National Construction Code (NCC) The National Construction Code (NCC) is an initiative of the Council of Australian Governments (COAG) developed to incorporate all on-site construction requirements into a single code. The NCC comprises the Building Code of Australia (BCA), Volume One and Two; and the Plumbing Code of Australia (PCA), as Volume Three.
Workplace Health and Safety Act 2012
An Act to provide for a balanced and nationally consistent framework to secure the health and safety of workers and workplaces.
Disability Discrimination Act 1992 An Act relating to discrimination on the ground of disability.
Disability (Access to Premises-Buildings) Standards 2010
The objects of these Standards are: (a) To ensure that dignified, equitable, cost-effective and reasonably achievable access to buildings, and facilities and services within buildings, is provided for people with a disability; and (b) To give certainty to building certifiers, building developers and building managers that, if access to buildings is provided in accordance with these Standards, the provision of that access, to the extent covered by these Standards, will not be unlawful under the Act.
Page 26
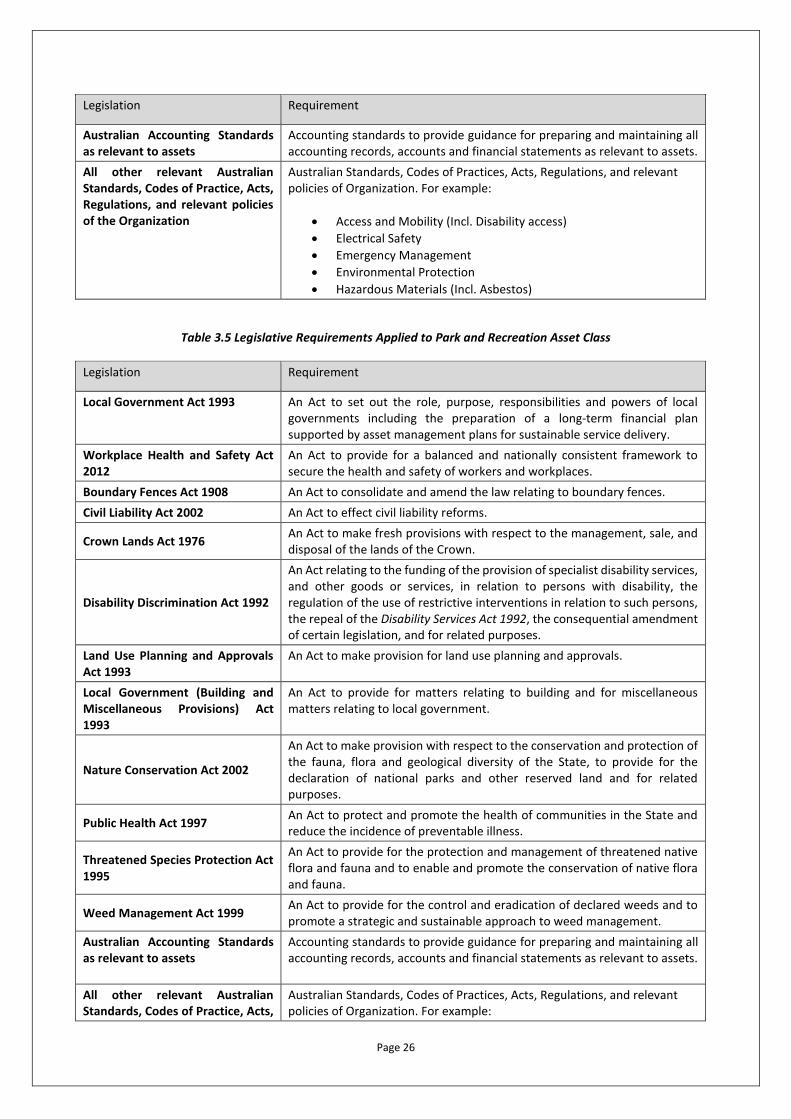
Legislation Requirement
Australian Accounting Standards as relevant to assets
Accounting standards to provide guidance for preparing and maintaining all accounting records, accounts and financial statements as relevant to assets.
All other relevant Australian Standards, Codes of Practice, Acts, Regulations, and relevant policies of the Organization
Australian Standards, Codes of Practices, Acts, Regulations, and relevant policies of Organization. For example:
• Access and Mobility (Incl. Disability access)
• Electrical Safety
• Emergency Management
• Environmental Protection
• Hazardous Materials (Incl. Asbestos)
Table 3.5 Legislative Requirements Applied to Park and Recreation Asset Class
Legislation Requirement
Local Government Act 1993 An Act to set out the role, purpose, responsibilities and powers of local governments including the preparation of a long-term financial plan supported by asset management plans for sustainable service delivery.
Workplace Health and Safety Act 2012
An Act to provide for a balanced and nationally consistent framework to secure the health and safety of workers and workplaces.
Boundary Fences Act 1908 An Act to consolidate and amend the law relating to boundary fences.
Civil Liability Act 2002 An Act to effect civil liability reforms.
Crown Lands Act 1976 An Act to make fresh provisions with respect to the management, sale, and disposal of the lands of the Crown.
Disability Discrimination Act 1992
An Act relating to the funding of the provision of specialist disability services, and other goods or services, in relation to persons with disability, the regulation of the use of restrictive interventions in relation to such persons, the repeal of the Disability Services Act 1992, the consequential amendment of certain legislation, and for related purposes.
Land Use Planning and Approvals Act 1993
An Act to make provision for land use planning and approvals.
Local Government (Building and Miscellaneous Provisions) Act 1993
An Act to provide for matters relating to building and for miscellaneous matters relating to local government.
Nature Conservation Act 2002
An Act to make provision with respect to the conservation and protection of the fauna, flora and geological diversity of the State, to provide for the declaration of national parks and other reserved land and for related purposes.
Public Health Act 1997 An Act to protect and promote the health of communities in the State and reduce the incidence of preventable illness.
Threatened Species Protection Act 1995
An Act to provide for the protection and management of threatened native flora and fauna and to enable and promote the conservation of native flora and fauna.
Weed Management Act 1999 An Act to provide for the control and eradication of declared weeds and to promote a strategic and sustainable approach to weed management.
Australian Accounting Standards as relevant to assets
Accounting standards to provide guidance for preparing and maintaining all accounting records, accounts and financial statements as relevant to assets.
All other relevant Australian Standards, Codes of Practice, Acts,
Australian Standards, Codes of Practices, Acts, Regulations, and relevant policies of Organization. For example:

Page 27
Legislation Requirement
Regulations, and relevant policies of the Organization
• Access and Mobility (Incl. Disability access)
• Electrical Safety
• Emergency Management
• Environmental Protection
• Hazardous Materials (Incl. Asbestos)
3.4 Level of Service
Council have defined Level of Service (LoS) in two terms: Community Levels of Service and Technical Levels of Service
Community Levels of Service measure how the community receives the service and whether the organisation is providing community value.
Community levels of service measures used in the AMS and individual AMPs are:
• Quality How good is the service?
• Function Does it meet users’ needs?
• Capacity/Utilisation Is the service usage appropriate to capacity?
Our current and projected community levels of service will be documented in the AMPs developed for major asset class (e.g. Transport, Drainage, Building, etc.).
Technical Levels of Service – Supporting the community service levels are operational or technical measures of performance. These technical measures relate to the allocation of resources to service activities that the organisation undertakes to best achieve the desired community outcomes and demonstrate effective organisational performance.
Technical service measures are linked to annual budgets covering:
• Operations – the regular activities to provide services such as availability, cleansing, mowing, etc.;
• Maintenance – the activities necessary to retain an asset as near as practicable to an appropriate service condition (e.g. road patching, unsealed road grading, building and structure repairs);
• Renewal – the activities that return the service capability of an asset up to that which it had originally (e.g. road resurfacing and pavement reconstruction, pipeline replacement and building component replacement); and
• Upgrade – the activities to provide a higher level of service (e.g. widening a road, sealing an unsealed road replacing a pipeline with a larger size) or a new service that did not exist previously (e.g. a new library).
Service managers plan, implement and control technical service levels to influence the customer service levels.10
10 IPWEA, 2011, IIMM, p 2.22
Page 28
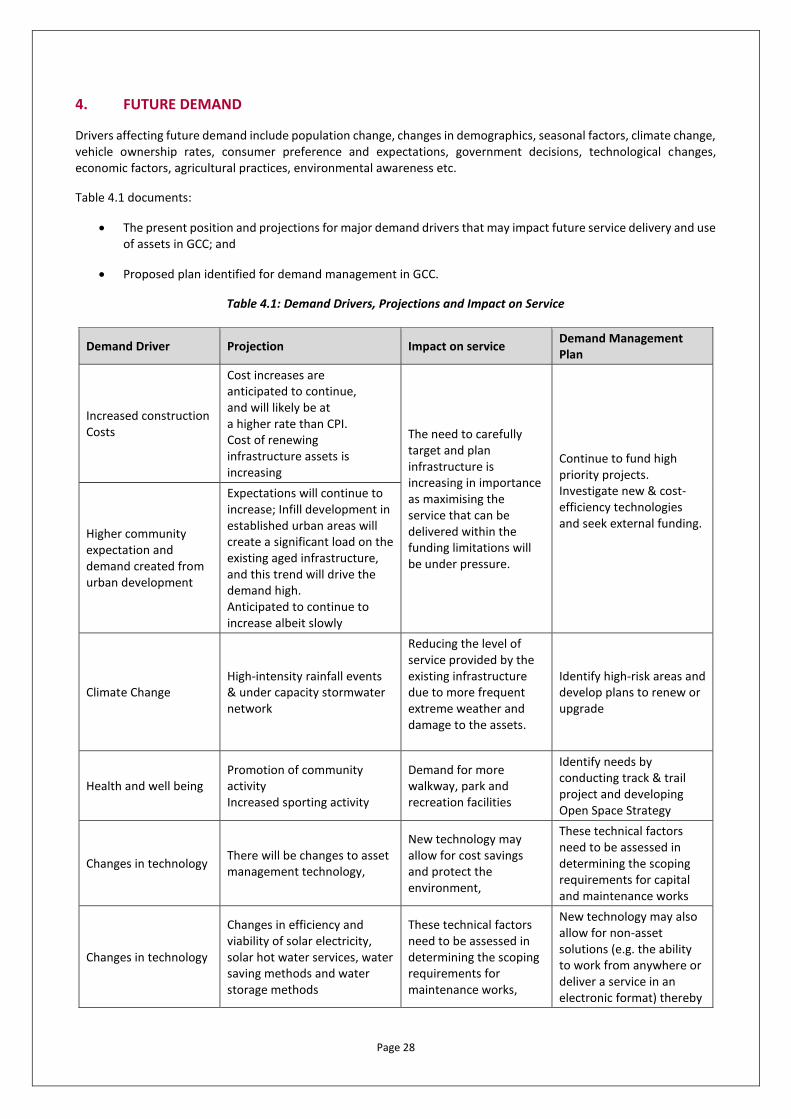
4. FUTURE DEMAND
Drivers affecting future demand include population change, changes in demographics, seasonal factors, climate change, vehicle ownership rates, consumer preference and expectations, government decisions, technological changes, economic factors, agricultural practices, environmental awareness etc.
Table 4.1 documents:
• The present position and projections for major demand drivers that may impact future service delivery and use of assets in GCC; and
• Proposed plan identified for demand management in GCC.
Table 4.1: Demand Drivers, Projections and Impact on Service
Demand Driver Projection Impact on service Demand Management Plan
Increased construction Costs
Cost increases are anticipated to continue, and will likely be at a higher rate than CPI. Cost of renewing infrastructure assets is increasing
The need to carefully target and plan infrastructure is increasing in importance as maximising the service that can be delivered within the funding limitations will be under pressure.
Continue to fund high priority projects. Investigate new & cost-efficiency technologies and seek external funding. Higher community
expectation and demand created from urban development
Expectations will continue to increase; Infill development in established urban areas will create a significant load on the existing aged infrastructure, and this trend will drive the demand high. Anticipated to continue to increase albeit slowly
Climate Change High-intensity rainfall events & under capacity stormwater network
Reducing the level of service provided by the existing infrastructure due to more frequent extreme weather and damage to the assets.
Identify high-risk areas and develop plans to renew or upgrade
Health and well being Promotion of community activity Increased sporting activity
Demand for more walkway, park and recreation facilities
Identify needs by conducting track & trail project and developing Open Space Strategy
Changes in technology There will be changes to asset management technology,
New technology may allow for cost savings and protect the environment,
These technical factors need to be assessed in determining the scoping requirements for capital and maintenance works
Changes in technology
Changes in efficiency and viability of solar electricity, solar hot water services, water saving methods and water storage methods
These technical factors need to be assessed in determining the scoping requirements for maintenance works,
New technology may also allow for non-asset solutions (e.g. the ability to work from anywhere or deliver a service in an electronic format) thereby
Page 29
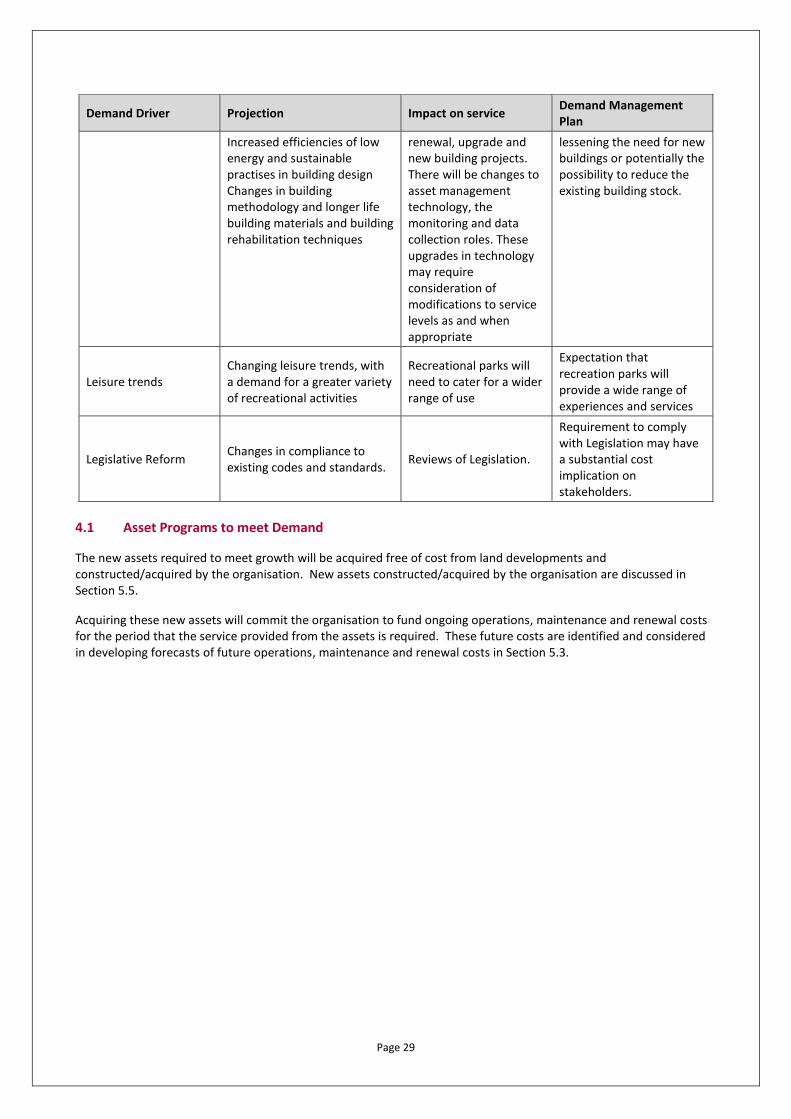
Demand Driver Projection Impact on service Demand Management Plan
Increased efficiencies of low energy and sustainable practises in building design Changes in building methodology and longer life building materials and building rehabilitation techniques
renewal, upgrade and new building projects. There will be changes to asset management technology, the monitoring and data collection roles. These upgrades in technology may require consideration of modifications to service levels as and when appropriate
lessening the need for new buildings or potentially the possibility to reduce the existing building stock.
Leisure trends Changing leisure trends, with a demand for a greater variety of recreational activities
Recreational parks will need to cater for a wider range of use
Expectation that recreation parks will provide a wide range of experiences and services
Legislative Reform Changes in compliance to existing codes and standards.
Reviews of Legislation.
Requirement to comply with Legislation may have a substantial cost implication on stakeholders.
4.1 Asset Programs to meet Demand
The new assets required to meet growth will be acquired free of cost from land developments and constructed/acquired by the organisation. New assets constructed/acquired by the organisation are discussed in Section 5.5.
Acquiring these new assets will commit the organisation to fund ongoing operations, maintenance and renewal costs for the period that the service provided from the assets is required. These future costs are identified and considered in developing forecasts of future operations, maintenance and renewal costs in Section 5.3.
Page 30
5. LIFECYCLE MANAGEMENT PLAN
The lifecycle management plan details how the organisation plans to manage and operate the assets at the agreed levels of service (defined in Section 3) while optimising life cycle costs and managing risks.
5.1 Background Data
5.1.1 Physical parameters
The assets covered by this strategic asset management plan are shown in Tables 2.2.
5.1.2 Asset capacity and performance
The organisation’s services are generally provided to meet design standards where these are available.
Asset capacity and performance is monitored for 3 community service measures at the end of the reporting period for condition (quality), function and capacity/utilisation in a State of the Assets report. The state of the assets is shown in Figure 3.
5.2 Infrastructure Risk Management Plan
An assessment of risks associated with service delivery from infrastructure assets conducted for each relevant AMP identified critical risks that will result in loss or reduction in service from infrastructure assets or a ‘financial shock’ to the organisation. The risk assessment process identifies credible risks, the likelihood of the risk event occurring, the consequences should the event occur, develops a risk rating, evaluates the risk and develops a risk treatment plan for non-acceptable risks.
Critical risks, being those assessed as ‘Very High’ - requiring immediate corrective action and ‘High’ – requiring prioritised corrective action identified in the Infrastructure Risk Management Plan(s) and the adopted treatment plan are summarised in Table 5.2. These risks are regularly reported to management and Council.
Table 5.1: Critical Risks and Treatment Plans – Transport Assets
Service or Asset
at Risk What can Happen
Risk
Rating
(VH, H)
Risk Treatment Plan Residual Risk *
Sealed Roads
Deferred reseal will result in roads deteriorating to a point where a reseal will no longer be enough and a more expensive rehabilitation will be required
High
Focus on reseal/patching program to reduce the amount of rehabilitation done. Look at more economical treatments to gain shorter term benefits at low cost extending the life of the seal. Note: This potentially has an impact on operational costs as roads are kept in a better condition reducing the operational burden.
Medium
Public Safety
Roads are allowed to deteriorate to a point where they become an issue to public safety, public liability claims or serious injury
High
Reduce the lifecycle funding gap on roads to improve the standard overall or reduce the aesthetic and functional levels of service to fund safety improvements
Medium
Asset Data
Asset data isn’t maintained due to the lack of resource or focus from the organisation
High
Ongoing focus on continuous improvement with measures in place to review and audit data included in operational planning
Medium/Low
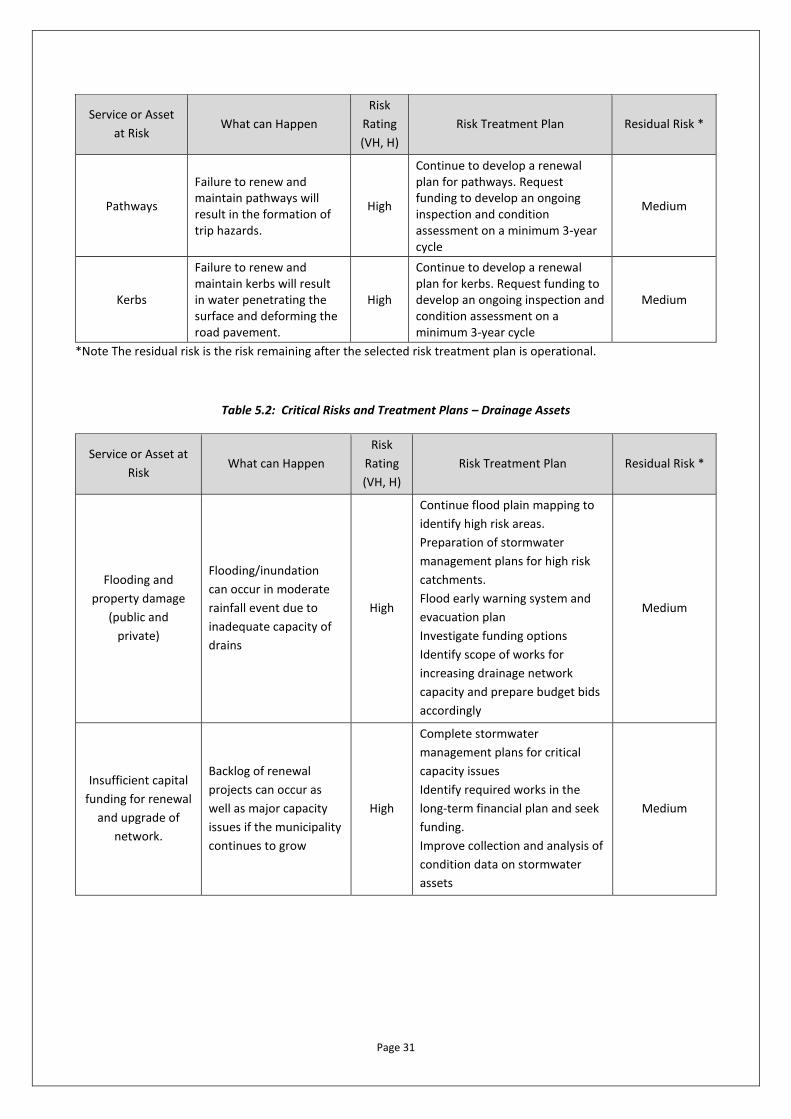
Page 31
Service or Asset
at Risk What can Happen
Risk
Rating
(VH, H)
Risk Treatment Plan Residual Risk *
Pathways
Failure to renew and maintain pathways will result in the formation of trip hazards.
High
Continue to develop a renewal plan for pathways. Request funding to develop an ongoing inspection and condition assessment on a minimum 3-year cycle
Medium
Kerbs
Failure to renew and maintain kerbs will result in water penetrating the surface and deforming the road pavement.
High
Continue to develop a renewal plan for kerbs. Request funding to develop an ongoing inspection and condition assessment on a minimum 3-year cycle
Medium
*Note The residual risk is the risk remaining after the selected risk treatment plan is operational.
Table 5.2: Critical Risks and Treatment Plans – Drainage Assets
Service or Asset at
Risk What can Happen
Risk
Rating
(VH, H)
Risk Treatment Plan Residual Risk *
Flooding and
property damage
(public and
private)
Flooding/inundation
can occur in moderate
rainfall event due to
inadequate capacity of
drains
High
Continue flood plain mapping to
identify high risk areas.
Preparation of stormwater
management plans for high risk
catchments.
Flood early warning system and
evacuation plan
Investigate funding options
Identify scope of works for
increasing drainage network
capacity and prepare budget bids
accordingly
Medium
Insufficient capital
funding for renewal
and upgrade of
network.
Backlog of renewal
projects can occur as
well as major capacity
issues if the municipality
continues to grow
High
Complete stormwater
management plans for critical
capacity issues
Identify required works in the
long-term financial plan and seek
funding.
Improve collection and analysis of
condition data on stormwater
assets
Medium
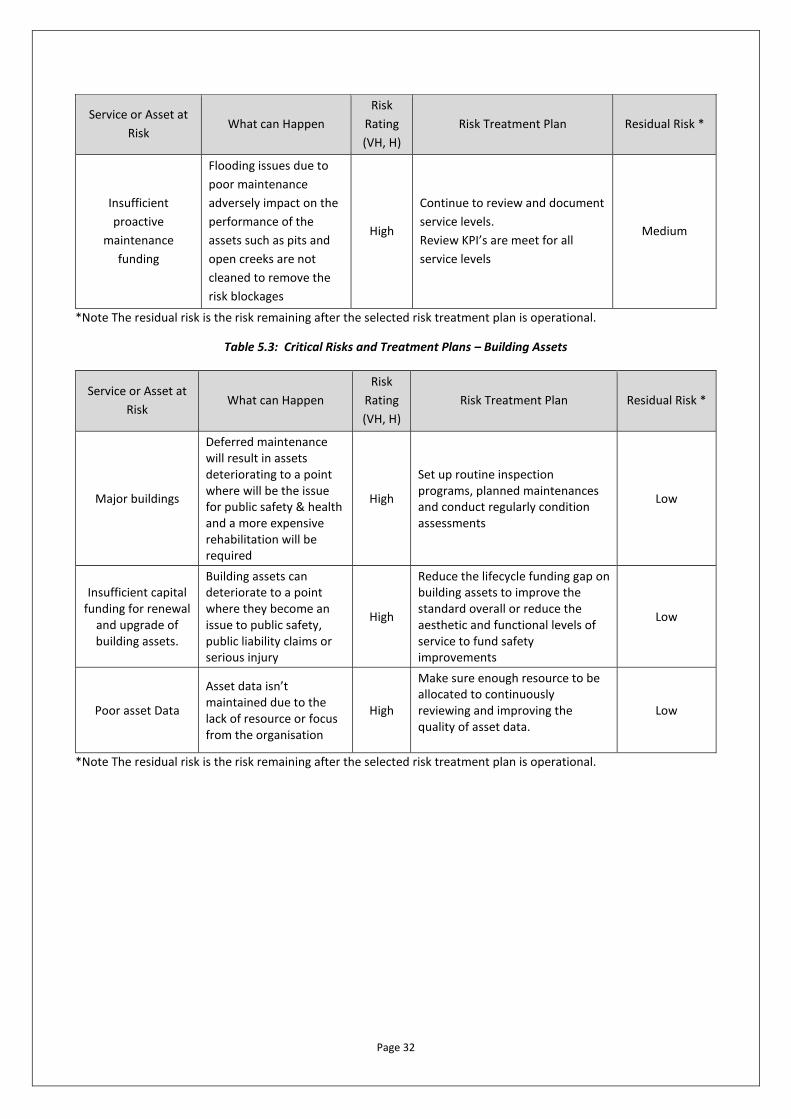
Page 32
Service or Asset at
Risk What can Happen
Risk
Rating
(VH, H)
Risk Treatment Plan Residual Risk *
Insufficient
proactive
maintenance
funding
Flooding issues due to
poor maintenance
adversely impact on the
performance of the
assets such as pits and
open creeks are not
cleaned to remove the
risk blockages
High
Continue to review and document
service levels.
Review KPI’s are meet for all
service levels
Medium
*Note The residual risk is the risk remaining after the selected risk treatment plan is operational.
Table 5.3: Critical Risks and Treatment Plans – Building Assets
Service or Asset at
Risk What can Happen
Risk
Rating
(VH, H)
Risk Treatment Plan Residual Risk *
Major buildings
Deferred maintenance will result in assets deteriorating to a point where will be the issue for public safety & health and a more expensive rehabilitation will be required
High
Set up routine inspection programs, planned maintenances and conduct regularly condition assessments
Low
Insufficient capital funding for renewal
and upgrade of building assets.
Building assets can deteriorate to a point where they become an issue to public safety, public liability claims or serious injury
High
Reduce the lifecycle funding gap on building assets to improve the standard overall or reduce the aesthetic and functional levels of service to fund safety improvements
Low
Poor asset Data
Asset data isn’t maintained due to the lack of resource or focus from the organisation
High
Make sure enough resource to be allocated to continuously reviewing and improving the quality of asset data.
Low
*Note The residual risk is the risk remaining after the selected risk treatment plan is operational.
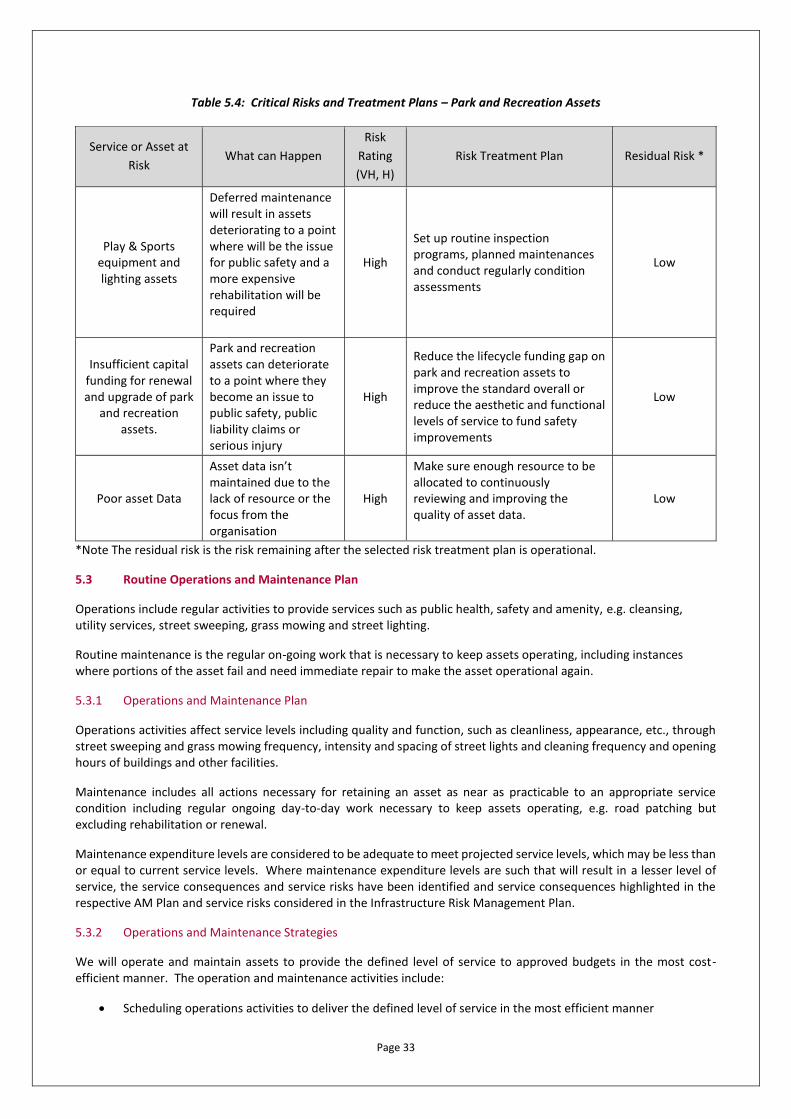
Page 33
Table 5.4: Critical Risks and Treatment Plans – Park and Recreation Assets
Service or Asset at
Risk What can Happen
Risk
Rating
(VH, H)
Risk Treatment Plan Residual Risk *
Play & Sports equipment and lighting assets
Deferred maintenance will result in assets deteriorating to a point where will be the issue for public safety and a more expensive rehabilitation will be required
High
Set up routine inspection programs, planned maintenances and conduct regularly condition assessments
Low
Insufficient capital funding for renewal and upgrade of park
and recreation assets.
Park and recreation assets can deteriorate to a point where they become an issue to public safety, public liability claims or serious injury
High
Reduce the lifecycle funding gap on park and recreation assets to improve the standard overall or reduce the aesthetic and functional levels of service to fund safety improvements
Low
Poor asset Data
Asset data isn’t maintained due to the lack of resource or the focus from the organisation
High
Make sure enough resource to be allocated to continuously reviewing and improving the quality of asset data.
Low
*Note The residual risk is the risk remaining after the selected risk treatment plan is operational.
5.3 Routine Operations and Maintenance Plan
Operations include regular activities to provide services such as public health, safety and amenity, e.g. cleansing, utility services, street sweeping, grass mowing and street lighting.
Routine maintenance is the regular on-going work that is necessary to keep assets operating, including instances where portions of the asset fail and need immediate repair to make the asset operational again.
5.3.1 Operations and Maintenance Plan
Operations activities affect service levels including quality and function, such as cleanliness, appearance, etc., through street sweeping and grass mowing frequency, intensity and spacing of street lights and cleaning frequency and opening hours of buildings and other facilities.
Maintenance includes all actions necessary for retaining an asset as near as practicable to an appropriate service condition including regular ongoing day-to-day work necessary to keep assets operating, e.g. road patching but excluding rehabilitation or renewal.
Maintenance expenditure levels are considered to be adequate to meet projected service levels, which may be less than or equal to current service levels. Where maintenance expenditure levels are such that will result in a lesser level of service, the service consequences and service risks have been identified and service consequences highlighted in the respective AM Plan and service risks considered in the Infrastructure Risk Management Plan.
5.3.2 Operations and Maintenance Strategies
We will operate and maintain assets to provide the defined level of service to approved budgets in the most cost-efficient manner. The operation and maintenance activities include:
• Scheduling operations activities to deliver the defined level of service in the most efficient manner
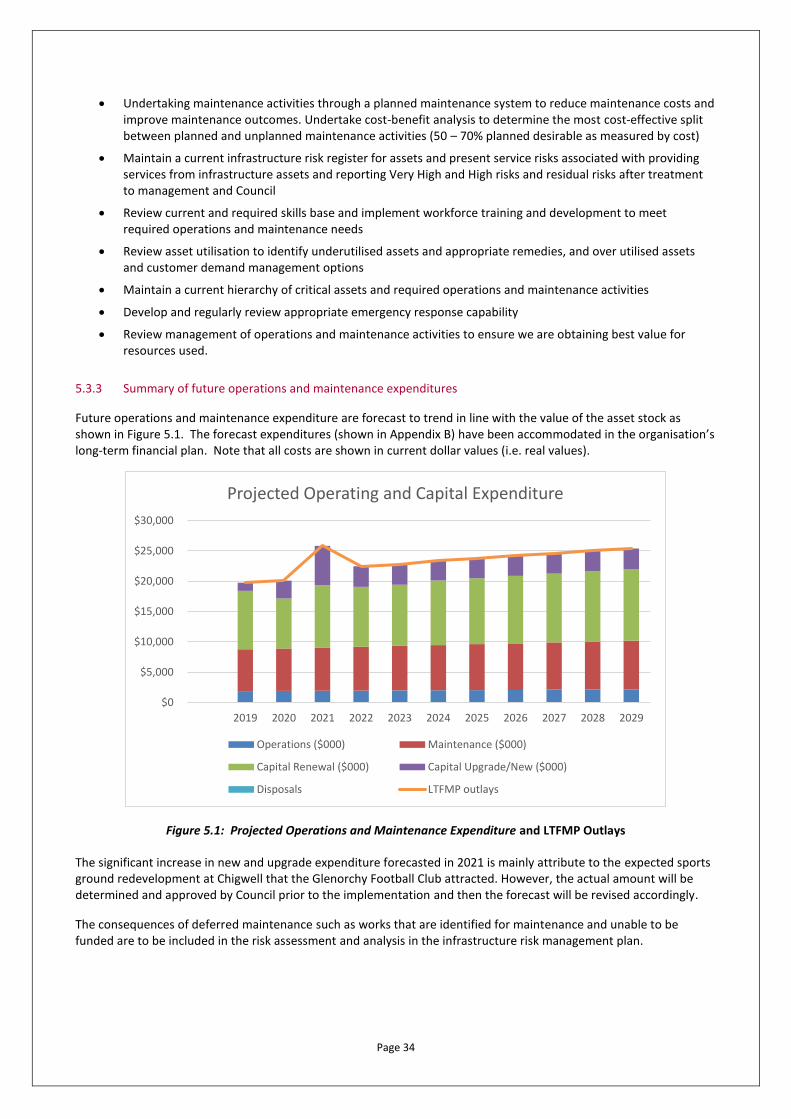
Page 34
• Undertaking maintenance activities through a planned maintenance system to reduce maintenance costs and improve maintenance outcomes. Undertake cost-benefit analysis to determine the most cost-effective split between planned and unplanned maintenance activities (50 – 70% planned desirable as measured by cost)
• Maintain a current infrastructure risk register for assets and present service risks associated with providing services from infrastructure assets and reporting Very High and High risks and residual risks after treatment to management and Council
• Review current and required skills base and implement workforce training and development to meet required operations and maintenance needs
• Review asset utilisation to identify underutilised assets and appropriate remedies, and over utilised assets and customer demand management options
• Maintain a current hierarchy of critical assets and required operations and maintenance activities
• Develop and regularly review appropriate emergency response capability
• Review management of operations and maintenance activities to ensure we are obtaining best value for resources used.
5.3.3 Summary of future operations and maintenance expenditures
Future operations and maintenance expenditure are forecast to trend in line with the value of the asset stock as shown in Figure 5.1. The forecast expenditures (shown in Appendix B) have been accommodated in the organisation’s long-term financial plan. Note that all costs are shown in current dollar values (i.e. real values).
Figure 5.1: Projected Operations and Maintenance Expenditure and LTFMP Outlays
The significant increase in new and upgrade expenditure forecasted in 2021 is mainly attribute to the expected sports ground redevelopment at Chigwell that the Glenorchy Football Club attracted. However, the actual amount will be determined and approved by Council prior to the implementation and then the forecast will be revised accordingly.
The consequences of deferred maintenance such as works that are identified for maintenance and unable to be funded are to be included in the risk assessment and analysis in the infrastructure risk management plan.
$0
$5,000
$10,000
$15,000
$20,000
$25,000
$30,000
2019 2020 2021 2022 2023 2024 2025 2026 2027 2028 2029
Projected Operating and Capital Expenditure
Operations ($000) Maintenance ($000)
Capital Renewal ($000) Capital Upgrade/New ($000)
Disposals LTFMP outlays
Page 35
5.4 Renewal/Replacement Plan
Renewal and replacement expenditure are major work which does not increase the asset’s design capacity but restores, rehabilitates, replaces or renews an existing asset to its original or lesser required service potential. Work over and above restoring an asset to original service potential is upgrade/expansion or new works expenditure.
5.4.1 Renewal and Replacement Strategies
We will plan capital renewal and replacement projects to meet level of service objectives and minimise infrastructure service risks by:
• Planning and scheduling renewal projects to deliver the defined level of service in the most efficient manner
• Undertaking project scoping for all capital renewal and replacement projects to identify o the service delivery ‘deficiency’, present risk and optimum time for renewal/replacement o the project objectives to rectify the deficiency o the range of options, estimated capital and life cycle costs for each option that could address the
service deficiency o and evaluate the options against evaluation criteria adopted by Council/Board, and o select the best option to be included in capital renewal programs,
• Using optimal renewal methods (cost of renewal is less than replacement) wherever possible
• Maintain a current infrastructure risk register for assets and service risks associated with providing services from infrastructure assets and report Very High and High risks and Residual risks after treatment to management, Audit Committee and Council/Board
• Review current and required skills base and implement workforce training and development to meet required construction and renewal needs
• Maintain a current hierarchy of critical assets and capital renewal treatments and timings required
• Review management of capital renewal and replacement activities to ensure we are obtaining best value for resources used.
5.4.2 Renewal ranking criteria
Asset renewal and replacement is typically undertaken to either:
• Ensure the reliability of the existing infrastructure to deliver the service it was constructed to facilitate (e.g. replace a bridge that has a 5t load limit), or
• To ensure the infrastructure is of sufficient quality to meet the service requirements (e.g. roughness of a road). Capital renewal and replacement priorities are indicated by identifying assets or asset groups that:
• Have a high consequence of failure
• Have a high utilisation and loss of service would have a significant impact on users
• Have the highest average age relative to their expected lives
• Are identified in the AM Plan as key cost factors
• Have high operational or maintenance costs, and
• Where replacement with modern equivalent assets would yield material savings. The ranking criteria used to determine priority of identified renewal and replacement proposals is detailed in the respective asset management plans.
5.4.2 Summary of future renewal and replacement expenditure
Projected future renewal and replacement expenditures are forecast to increase over time as the asset stock ages. The forecast expenditures have been accommodated in the organisation’s long-term financial plan as shown in Figure 5.2. Note that all amounts are shown in real values.
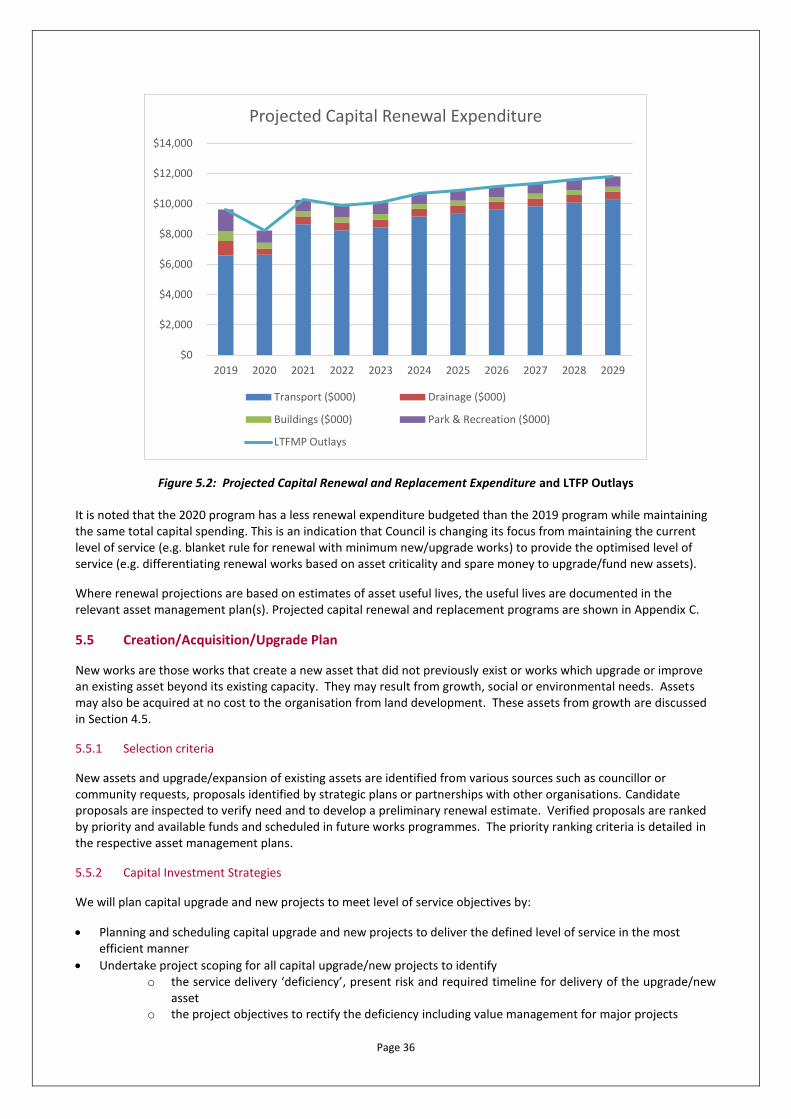
Page 36
Figure 5.2: Projected Capital Renewal and Replacement Expenditure and LTFP Outlays
It is noted that the 2020 program has a less renewal expenditure budgeted than the 2019 program while maintaining the same total capital spending. This is an indication that Council is changing its focus from maintaining the current level of service (e.g. blanket rule for renewal with minimum new/upgrade works) to provide the optimised level of service (e.g. differentiating renewal works based on asset criticality and spare money to upgrade/fund new assets).
Where renewal projections are based on estimates of asset useful lives, the useful lives are documented in the relevant asset management plan(s). Projected capital renewal and replacement programs are shown in Appendix C.
5.5 Creation/Acquisition/Upgrade Plan
New works are those works that create a new asset that did not previously exist or works which upgrade or improve an existing asset beyond its existing capacity. They may result from growth, social or environmental needs. Assets may also be acquired at no cost to the organisation from land development. These assets from growth are discussed in Section 4.5.
5.5.1 Selection criteria
New assets and upgrade/expansion of existing assets are identified from various sources such as councillor or community requests, proposals identified by strategic plans or partnerships with other organisations. Candidate proposals are inspected to verify need and to develop a preliminary renewal estimate. Verified proposals are ranked by priority and available funds and scheduled in future works programmes. The priority ranking criteria is detailed in the respective asset management plans.
5.5.2 Capital Investment Strategies
We will plan capital upgrade and new projects to meet level of service objectives by:
• Planning and scheduling capital upgrade and new projects to deliver the defined level of service in the most efficient manner
• Undertake project scoping for all capital upgrade/new projects to identify o the service delivery ‘deficiency’, present risk and required timeline for delivery of the upgrade/new
asset o the project objectives to rectify the deficiency including value management for major projects
$0
$2,000
$4,000
$6,000
$8,000
$10,000
$12,000
$14,000
2019 2020 2021 2022 2023 2024 2025 2026 2027 2028 2029
Projected Capital Renewal Expenditure
Transport ($000) Drainage ($000)
Buildings ($000) Park & Recreation ($000)
LTFMP Outlays
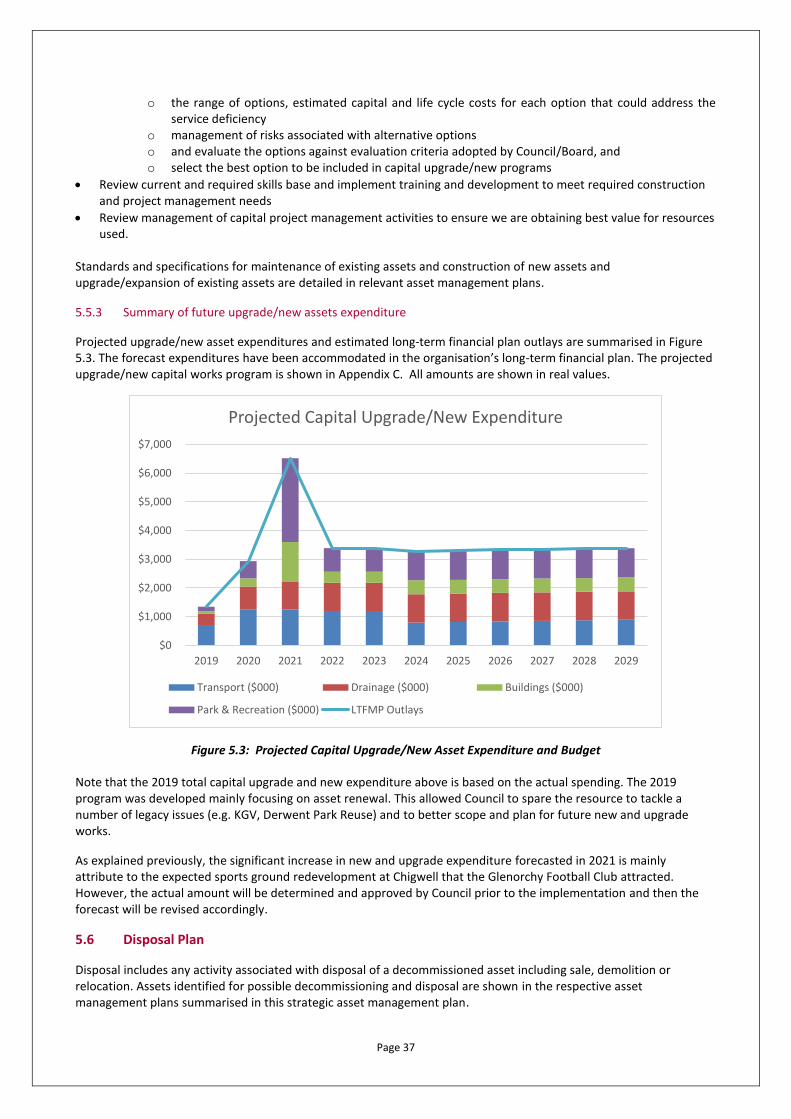
Page 37
o the range of options, estimated capital and life cycle costs for each option that could address the service deficiency
o management of risks associated with alternative options o and evaluate the options against evaluation criteria adopted by Council/Board, and o select the best option to be included in capital upgrade/new programs
• Review current and required skills base and implement training and development to meet required construction and project management needs
• Review management of capital project management activities to ensure we are obtaining best value for resources used.
Standards and specifications for maintenance of existing assets and construction of new assets and upgrade/expansion of existing assets are detailed in relevant asset management plans.
5.5.3 Summary of future upgrade/new assets expenditure
Projected upgrade/new asset expenditures and estimated long-term financial plan outlays are summarised in Figure 5.3. The forecast expenditures have been accommodated in the organisation’s long-term financial plan. The projected upgrade/new capital works program is shown in Appendix C. All amounts are shown in real values.
Figure 5.3: Projected Capital Upgrade/New Asset Expenditure and Budget
Note that the 2019 total capital upgrade and new expenditure above is based on the actual spending. The 2019 program was developed mainly focusing on asset renewal. This allowed Council to spare the resource to tackle a number of legacy issues (e.g. KGV, Derwent Park Reuse) and to better scope and plan for future new and upgrade works.
As explained previously, the significant increase in new and upgrade expenditure forecasted in 2021 is mainly attribute to the expected sports ground redevelopment at Chigwell that the Glenorchy Football Club attracted. However, the actual amount will be determined and approved by Council prior to the implementation and then the forecast will be revised accordingly.
5.6 Disposal Plan
Disposal includes any activity associated with disposal of a decommissioned asset including sale, demolition or relocation. Assets identified for possible decommissioning and disposal are shown in the respective asset management plans summarised in this strategic asset management plan.
$0
$1,000
$2,000
$3,000
$4,000
$5,000
$6,000
$7,000
2019 2020 2021 2022 2023 2024 2025 2026 2027 2028 2029
Projected Capital Upgrade/New Expenditure
Transport ($000) Drainage ($000) Buildings ($000)
Park & Recreation ($000) LTFMP Outlays
Page 38
5.7 Service Consequences and Risks
The organisation has prioritised decisions made in adopting the asset management plans summarised in this strategic asset management plan to obtain the optimum benefits from its available resources.
The asset management plans are based on balancing service performance, cost and risk to provide an agreed level of service from available resources in our long-term financial plan.
5.7.1 Deferred initiatives and projects
There is not deferred initiatives and projects current listed in the capital works program. It is in Council’s view that the capital and maintenance program shall be adjusted in accordance with its financial capacity and associated level of service. Any ‘backlog’ are works below the level of service that cannot be accommodated and should not be funded in the following years unless either the financial position or the level of service is changed.
Page 39
6. FINANCIAL SUMMARY
This section contains the financial requirements resulting from all the information presented in the previous sections of this strategic asset management plan. The financial projections will be improved as further information becomes available on desired levels of service and current and projected future asset performance.
6.1 Financial Indicators and Projections
6.1.1 Asset Renewal Funding Ratio
The Asset Renewal Funding Ratio indicates whether projected capital renewal and replacement expenditure are able to be financed in the long-term financial plan. It is calculated by dividing the projected capital renewal expenditure shown in the AM Plans by the estimated capital renewal budget provided in the long-term financial plan. Over the next 10 years, we are forecasting that we will have 100% of the funds required for the optimal renewal and replacement of assets.
6.2 Funding Strategy
The funding strategy to provide the services covered by this strategic asset management plan and supporting asset management plans is contained within the organisation’s 10-year long term financial plan.
6.3 Valuation Forecasts
Asset values are forecast to increase as additional assets are added to the asset stock from construction and acquisition by the organisation and from assets constructed by land developers and others and donated to the organisation.
Additional assets will generally add to the operations and maintenance needs in the longer term, as well as the need for future renewal. Additional assets will also add to future depreciation forecasts.
Council proposed the adoption of the parabolic depreciation approach to replace the existing straight-line approach for drainage assets after reviewing critical assumptions such as: asset consumption rate, deterioration, and useful life etc.
These assumptions were based on our understanding of how the Drainage assets’ service potential is consumed. Due to the relatively long-life span of Drainage assets, it was found that the adopted straight-line depreciation method is not adequately representing the physical consumption of these assets and its application may adversely impact on the accuracy of Council’s financial result.
The parabolic depreciation approach recognises that there is not a direct linear relationship between the age of drainage assets and their remaining service potential. For assets with long-life spans, such as pipes and pits, the reduction in their service potentials (the amount of water they can convey) is actually disproportionate to their age.
A very old drainage pipe with minor fractures, for example, is capable of carrying the same amount of stormwater as a brand new one, assuming there two pipes have the same dimensions and are made of the same material.
Under parabolic depreciation, a drainage asset’s service potential is reduced at different deterioration rates at various stages of its lifespan. Ultimately, this will result in a more accurate depreciation figure in Council’s annual financial statements by more closely matching the depreciation to the actual decline in the service potential of the asset.
The adoption of parabolic depreciation for drainage assets was considered and noted by Council’s Audit Panel at its meeting on 10 May 2019.
An increase in the depreciated replacement cost (carrying value) of infrastructure assets is expected and suggest that the organisation needs to maintain/increase its infrastructure capital in aggregate.
6.4 Key Assumptions made in Financial Forecasts
This section details the key assumptions made in presenting the information contained in this strategic asset management plan and in preparing forecasts of required operating and capital expenditure and asset values,
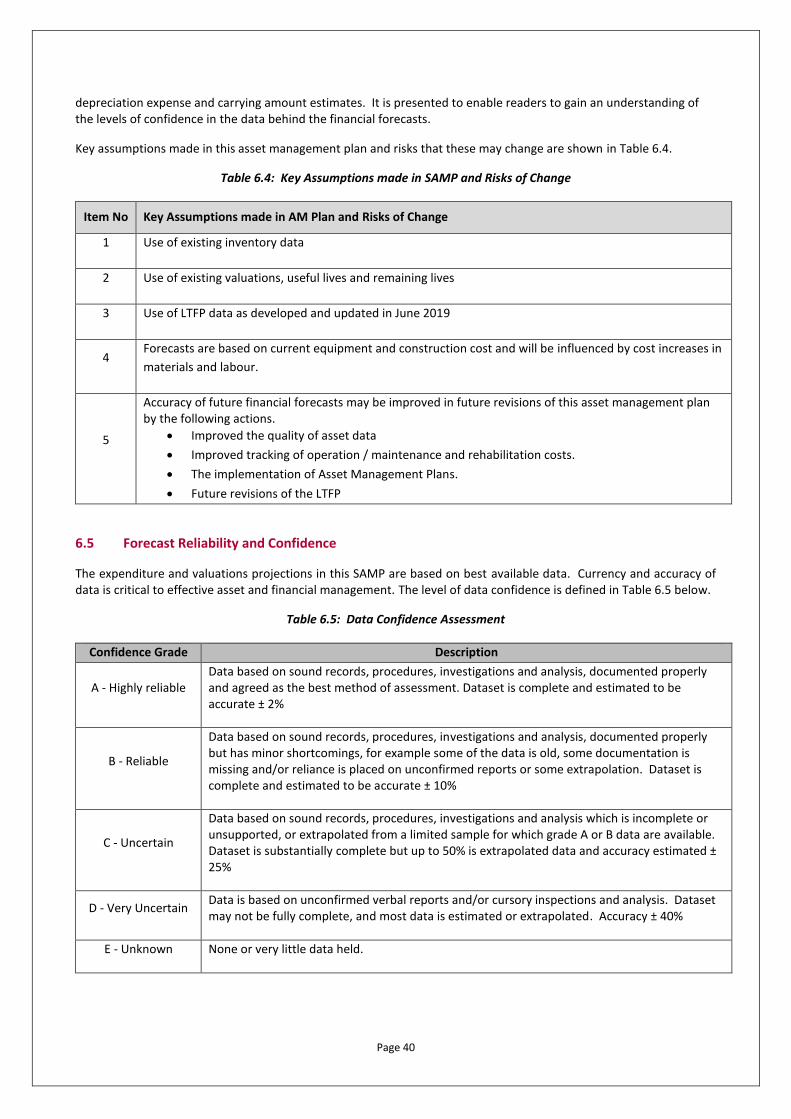
Page 40
depreciation expense and carrying amount estimates. It is presented to enable readers to gain an understanding of the levels of confidence in the data behind the financial forecasts.
Key assumptions made in this asset management plan and risks that these may change are shown in Table 6.4.
Table 6.4: Key Assumptions made in SAMP and Risks of Change
Item No Key Assumptions made in AM Plan and Risks of Change
1 Use of existing inventory data
2 Use of existing valuations, useful lives and remaining lives
3 Use of LTFP data as developed and updated in June 2019
4 Forecasts are based on current equipment and construction cost and will be influenced by cost increases in
materials and labour.
5
Accuracy of future financial forecasts may be improved in future revisions of this asset management plan by the following actions.
• Improved the quality of asset data
• Improved tracking of operation / maintenance and rehabilitation costs.
• The implementation of Asset Management Plans.
• Future revisions of the LTFP
6.5 Forecast Reliability and Confidence
The expenditure and valuations projections in this SAMP are based on best available data. Currency and accuracy of data is critical to effective asset and financial management. The level of data confidence is defined in Table 6.5 below.
Table 6.5: Data Confidence Assessment
Confidence Grade Description
A - Highly reliable Data based on sound records, procedures, investigations and analysis, documented properly and agreed as the best method of assessment. Dataset is complete and estimated to be accurate ± 2%
B - Reliable
Data based on sound records, procedures, investigations and analysis, documented properly but has minor shortcomings, for example some of the data is old, some documentation is missing and/or reliance is placed on unconfirmed reports or some extrapolation. Dataset is complete and estimated to be accurate ± 10%
C - Uncertain
Data based on sound records, procedures, investigations and analysis which is incomplete or unsupported, or extrapolated from a limited sample for which grade A or B data are available. Dataset is substantially complete but up to 50% is extrapolated data and accuracy estimated ± 25%
D - Very Uncertain Data is based on unconfirmed verbal reports and/or cursory inspections and analysis. Dataset may not be fully complete, and most data is estimated or extrapolated. Accuracy ± 40%
E - Unknown None or very little data held.
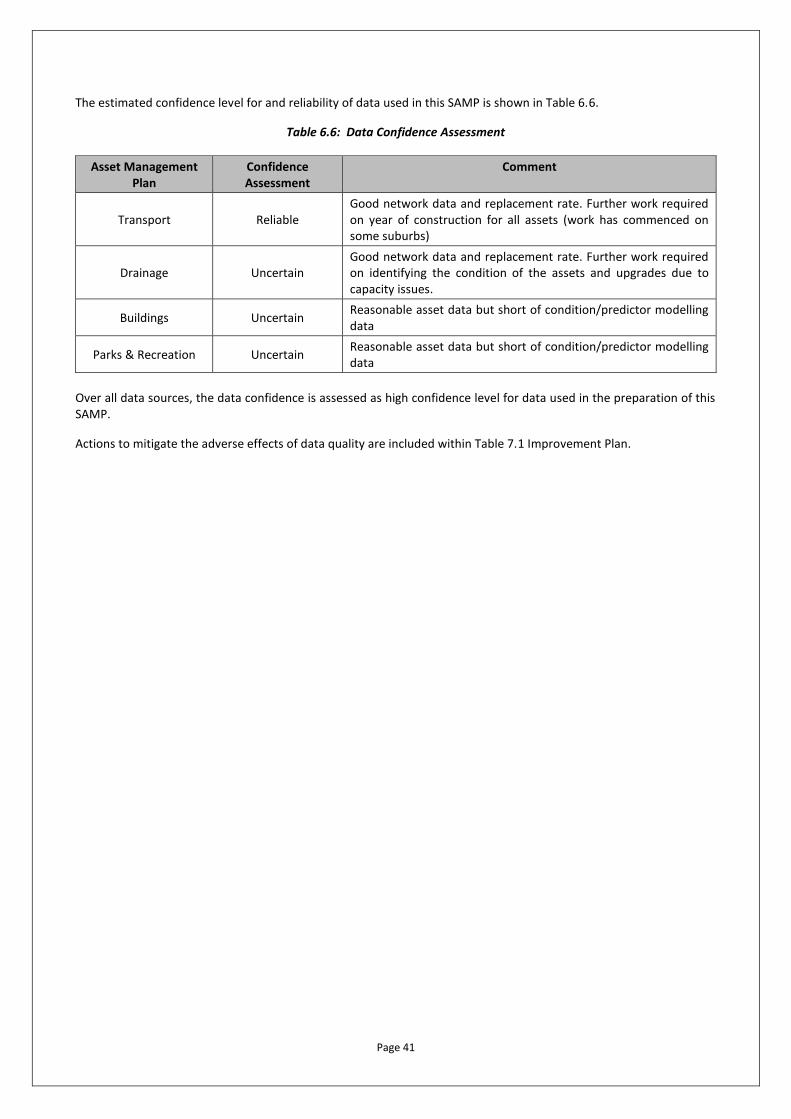
Page 41
The estimated confidence level for and reliability of data used in this SAMP is shown in Table 6.6.
Table 6.6: Data Confidence Assessment
Asset Management Plan
Confidence Assessment
Comment
Transport Reliable Good network data and replacement rate. Further work required on year of construction for all assets (work has commenced on some suburbs)
Drainage Uncertain Good network data and replacement rate. Further work required on identifying the condition of the assets and upgrades due to capacity issues.
Buildings Uncertain Reasonable asset data but short of condition/predictor modelling data
Parks & Recreation Uncertain Reasonable asset data but short of condition/predictor modelling data
Over all data sources, the data confidence is assessed as high confidence level for data used in the preparation of this SAMP.
Actions to mitigate the adverse effects of data quality are included within Table 7.1 Improvement Plan.
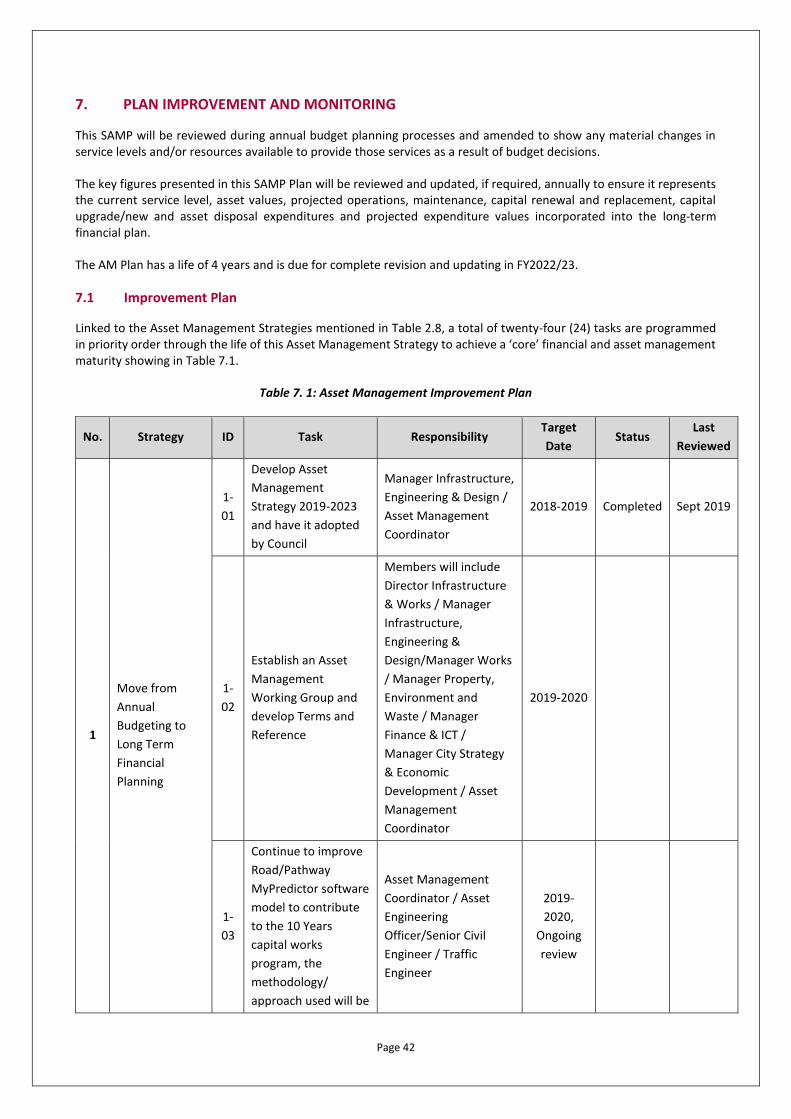
Page 42
7. PLAN IMPROVEMENT AND MONITORING
This SAMP will be reviewed during annual budget planning processes and amended to show any material changes in service levels and/or resources available to provide those services as a result of budget decisions.
The key figures presented in this SAMP Plan will be reviewed and updated, if required, annually to ensure it represents the current service level, asset values, projected operations, maintenance, capital renewal and replacement, capital upgrade/new and asset disposal expenditures and projected expenditure values incorporated into the long-term financial plan.
The AM Plan has a life of 4 years and is due for complete revision and updating in FY2022/23.
7.1 Improvement Plan
Linked to the Asset Management Strategies mentioned in Table 2.8, a total of twenty-four (24) tasks are programmed in priority order through the life of this Asset Management Strategy to achieve a ‘core’ financial and asset management maturity showing in Table 7.1.
Table 7. 1: Asset Management Improvement Plan
No. Strategy ID Task Responsibility Target
Date Status
Last
Reviewed
1
Move from
Annual
Budgeting to
Long Term
Financial
Planning
1-
01
Develop Asset
Management
Strategy 2019-2023
and have it adopted
by Council
Manager Infrastructure,
Engineering & Design /
Asset Management
Coordinator
2018-2019 Completed Sept 2019
1-
02
Establish an Asset
Management
Working Group and
develop Terms and
Reference
Members will include
Director Infrastructure
& Works / Manager
Infrastructure,
Engineering &
Design/Manager Works
/ Manager Property,
Environment and
Waste / Manager
Finance & ICT /
Manager City Strategy
& Economic
Development / Asset
Management
Coordinator
2019-2020
1-
03
Continue to improve
Road/Pathway
MyPredictor software
model to contribute
to the 10 Years
capital works
program, the
methodology/
approach used will be
Asset Management
Coordinator / Asset
Engineering
Officer/Senior Civil
Engineer / Traffic
Engineer
2019-
2020,
Ongoing
review
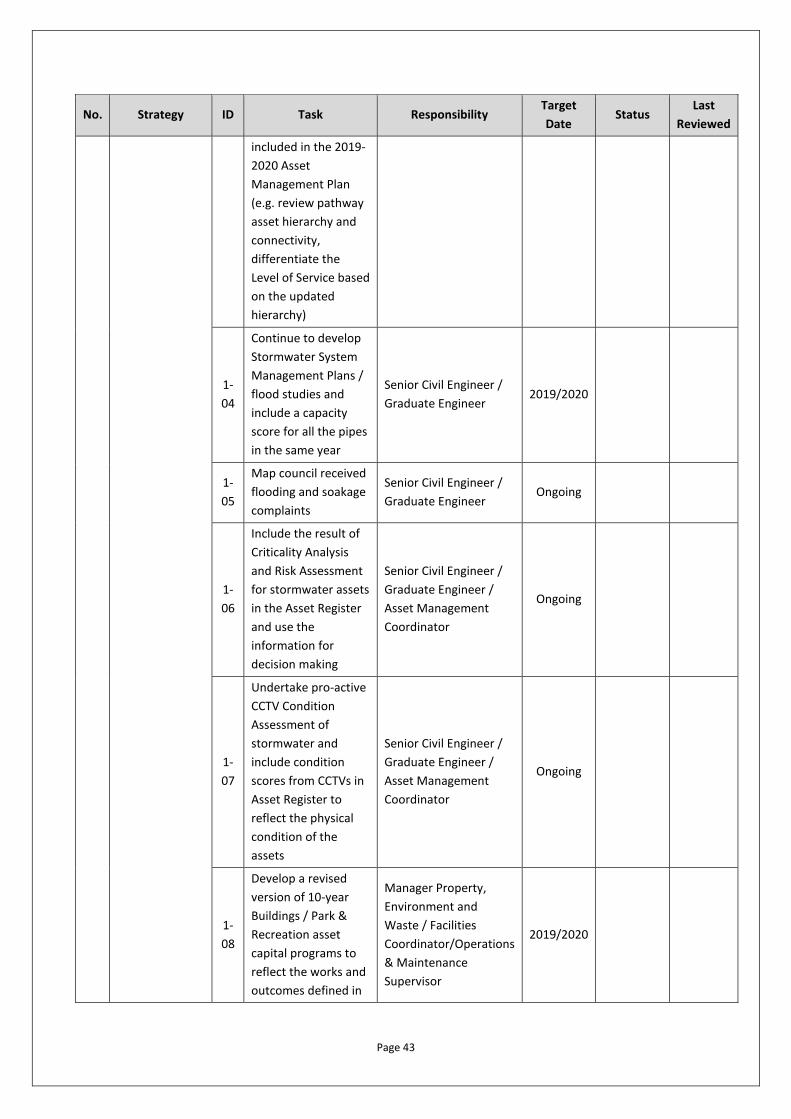
Page 43
No. Strategy ID Task Responsibility Target
Date Status
Last
Reviewed
included in the 2019-
2020 Asset
Management Plan
(e.g. review pathway
asset hierarchy and
connectivity,
differentiate the
Level of Service based
on the updated
hierarchy)
1-
04
Continue to develop
Stormwater System
Management Plans /
flood studies and
include a capacity
score for all the pipes
in the same year
Senior Civil Engineer /
Graduate Engineer 2019/2020
1-
05
Map council received
flooding and soakage
complaints
Senior Civil Engineer /
Graduate Engineer Ongoing
1-
06
Include the result of
Criticality Analysis
and Risk Assessment
for stormwater assets
in the Asset Register
and use the
information for
decision making
Senior Civil Engineer /
Graduate Engineer /
Asset Management
Coordinator
Ongoing
1-
07
Undertake pro-active
CCTV Condition
Assessment of
stormwater and
include condition
scores from CCTVs in
Asset Register to
reflect the physical
condition of the
assets
Senior Civil Engineer /
Graduate Engineer /
Asset Management
Coordinator
Ongoing
1-
08
Develop a revised
version of 10-year
Buildings / Park &
Recreation asset
capital programs to
reflect the works and
outcomes defined in
Manager Property,
Environment and
Waste / Facilities
Coordinator/Operations
& Maintenance
Supervisor
2019/2020
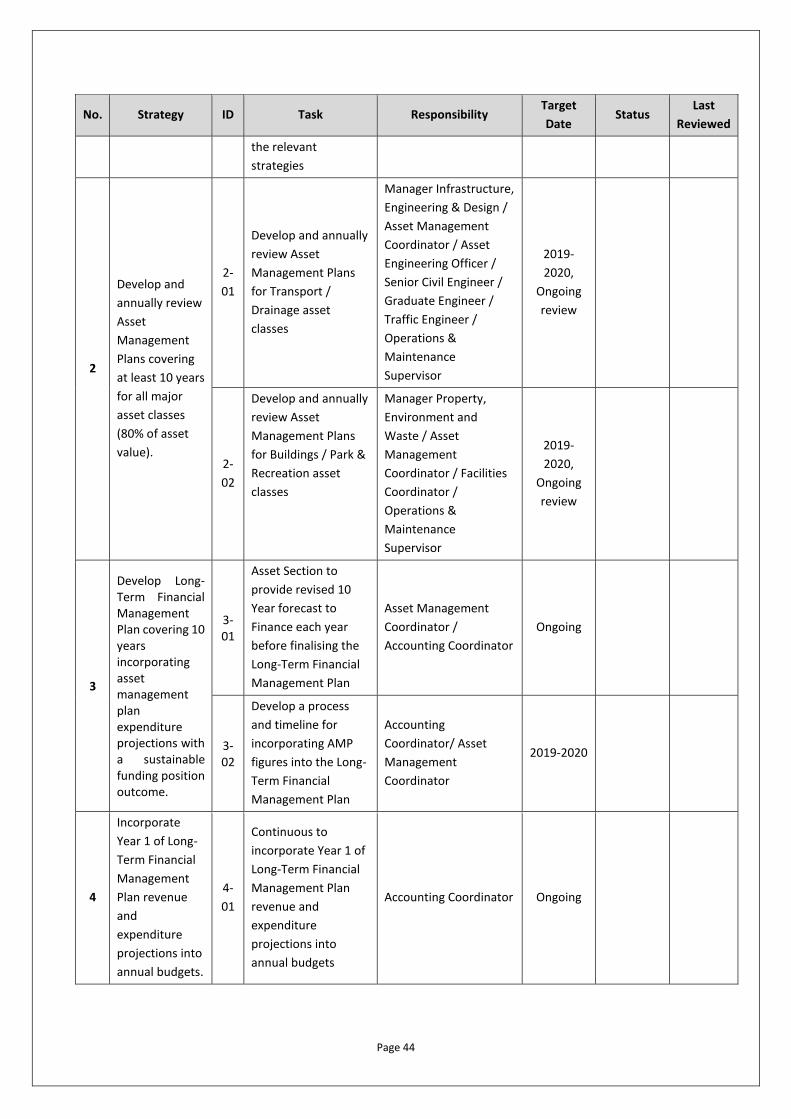
Page 44
No. Strategy ID Task Responsibility Target
Date Status
Last
Reviewed
the relevant
strategies
2
Develop and
annually review
Asset
Management
Plans covering
at least 10 years
for all major
asset classes
(80% of asset
value).
2-
01
Develop and annually
review Asset
Management Plans
for Transport /
Drainage asset
classes
Manager Infrastructure,
Engineering & Design /
Asset Management
Coordinator / Asset
Engineering Officer /
Senior Civil Engineer /
Graduate Engineer /
Traffic Engineer /
Operations &
Maintenance
Supervisor
2019-
2020,
Ongoing
review
2-
02
Develop and annually
review Asset
Management Plans
for Buildings / Park &
Recreation asset
classes
Manager Property,
Environment and
Waste / Asset
Management
Coordinator / Facilities
Coordinator /
Operations &
Maintenance
Supervisor
2019-
2020,
Ongoing
review
3
Develop Long-Term Financial Management Plan covering 10 years incorporating asset management plan expenditure projections with a sustainable funding position outcome.
3-01
Asset Section to
provide revised 10
Year forecast to
Finance each year
before finalising the
Long-Term Financial
Management Plan
Asset Management
Coordinator /
Accounting Coordinator
Ongoing
3-02
Develop a process
and timeline for
incorporating AMP
figures into the Long-
Term Financial
Management Plan
Accounting
Coordinator/ Asset
Management
Coordinator
2019-2020
4
Incorporate
Year 1 of Long-
Term Financial
Management
Plan revenue
and
expenditure
projections into
annual budgets.
4-
01
Continuous to
incorporate Year 1 of
Long-Term Financial
Management Plan
revenue and
expenditure
projections into
annual budgets
Accounting Coordinator Ongoing
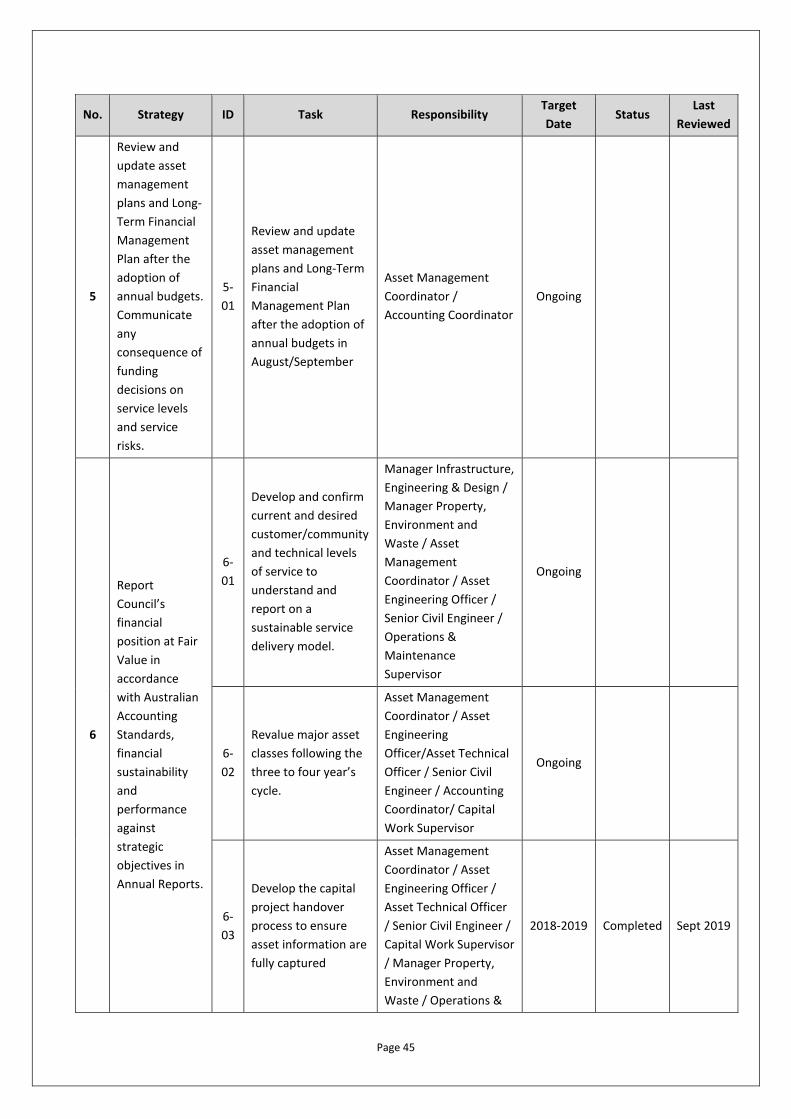
Page 45
No. Strategy ID Task Responsibility Target
Date Status
Last
Reviewed
5
Review and
update asset
management
plans and Long-
Term Financial
Management
Plan after the
adoption of
annual budgets.
Communicate
any
consequence of
funding
decisions on
service levels
and service
risks.
5-
01
Review and update
asset management
plans and Long-Term
Financial
Management Plan
after the adoption of
annual budgets in
August/September
Asset Management
Coordinator /
Accounting Coordinator
Ongoing
6
Report
Council’s
financial
position at Fair
Value in
accordance
with Australian
Accounting
Standards,
financial
sustainability
and
performance
against
strategic
objectives in
Annual Reports.
6-
01
Develop and confirm
current and desired
customer/community
and technical levels
of service to
understand and
report on a
sustainable service
delivery model.
Manager Infrastructure,
Engineering & Design /
Manager Property,
Environment and
Waste / Asset
Management
Coordinator / Asset
Engineering Officer /
Senior Civil Engineer /
Operations &
Maintenance
Supervisor
Ongoing
6-
02
Revalue major asset
classes following the
three to four year’s
cycle.
Asset Management
Coordinator / Asset
Engineering
Officer/Asset Technical
Officer / Senior Civil
Engineer / Accounting
Coordinator/ Capital
Work Supervisor
Ongoing
6-
03
Develop the capital
project handover
process to ensure
asset information are
fully captured
Asset Management
Coordinator / Asset
Engineering Officer /
Asset Technical Officer
/ Senior Civil Engineer /
Capital Work Supervisor
/ Manager Property,
Environment and
Waste / Operations &
2018-2019 Completed Sept 2019
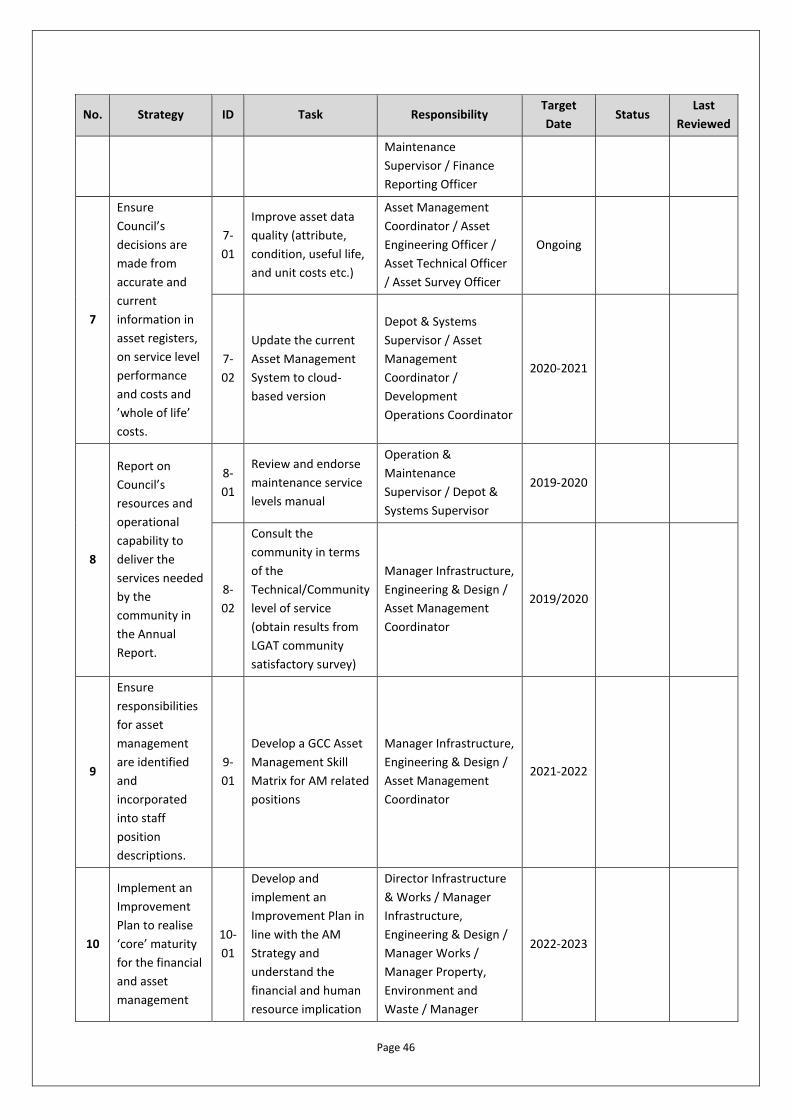
Page 46
No. Strategy ID Task Responsibility Target
Date Status
Last
Reviewed
Maintenance
Supervisor / Finance
Reporting Officer
7
Ensure
Council’s
decisions are
made from
accurate and
current
information in
asset registers,
on service level
performance
and costs and
’whole of life’
costs.
7-
01
Improve asset data
quality (attribute,
condition, useful life,
and unit costs etc.)
Asset Management
Coordinator / Asset
Engineering Officer /
Asset Technical Officer
/ Asset Survey Officer
Ongoing
7-
02
Update the current
Asset Management
System to cloud-
based version
Depot & Systems
Supervisor / Asset
Management
Coordinator /
Development
Operations Coordinator
2020-2021
8
Report on
Council’s
resources and
operational
capability to
deliver the
services needed
by the
community in
the Annual
Report.
8-
01
Review and endorse
maintenance service
levels manual
Operation &
Maintenance
Supervisor / Depot &
Systems Supervisor
2019-2020
8-
02
Consult the
community in terms
of the
Technical/Community
level of service
(obtain results from
LGAT community
satisfactory survey)
Manager Infrastructure,
Engineering & Design /
Asset Management
Coordinator
2019/2020
9
Ensure
responsibilities
for asset
management
are identified
and
incorporated
into staff
position
descriptions.
9-
01
Develop a GCC Asset
Management Skill
Matrix for AM related
positions
Manager Infrastructure,
Engineering & Design /
Asset Management
Coordinator
2021-2022
10
Implement an
Improvement
Plan to realise
‘core’ maturity
for the financial
and asset
management
10-
01
Develop and
implement an
Improvement Plan in
line with the AM
Strategy and
understand the
financial and human
resource implication
Director Infrastructure
& Works / Manager
Infrastructure,
Engineering & Design /
Manager Works /
Manager Property,
Environment and
Waste / Manager
2022-2023
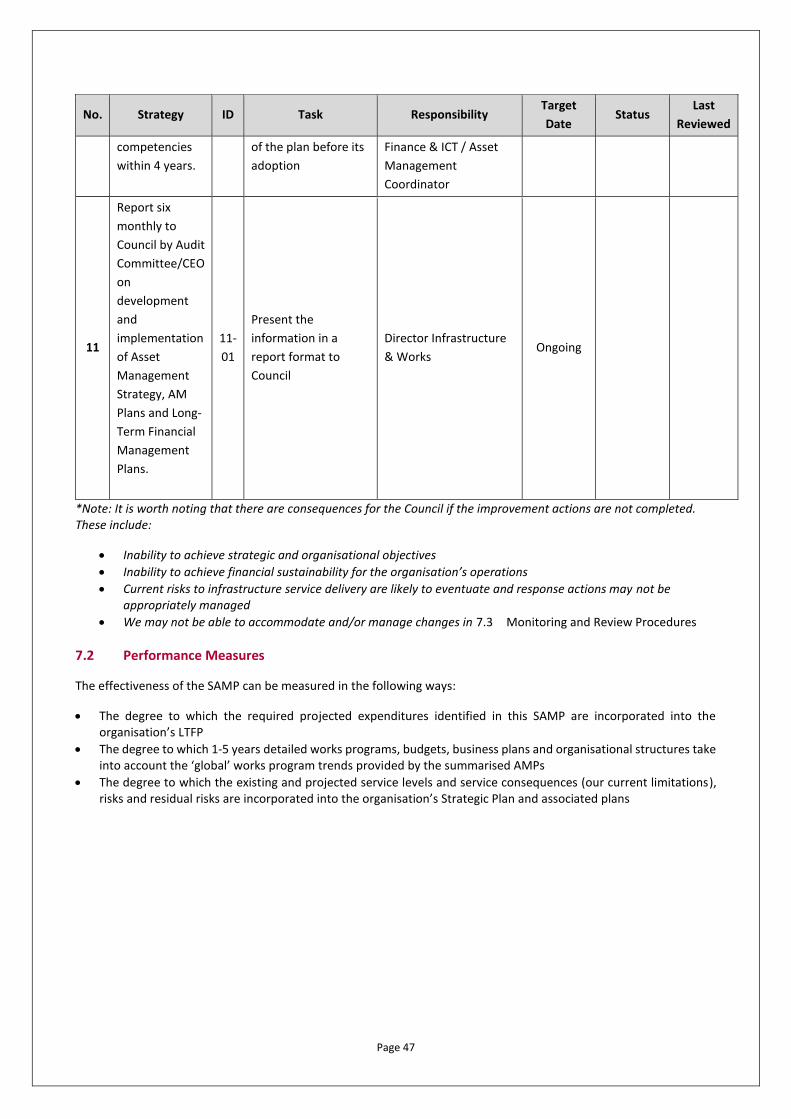
Page 47
No. Strategy ID Task Responsibility Target
Date Status
Last
Reviewed
competencies
within 4 years.
of the plan before its
adoption
Finance & ICT / Asset
Management
Coordinator
11
Report six
monthly to
Council by Audit
Committee/CEO
on
development
and
implementation
of Asset
Management
Strategy, AM
Plans and Long-
Term Financial
Management
Plans.
11-
01
Present the
information in a
report format to
Council
Director Infrastructure
& Works Ongoing
*Note: It is worth noting that there are consequences for the Council if the improvement actions are not completed. These include:
• Inability to achieve strategic and organisational objectives
• Inability to achieve financial sustainability for the organisation’s operations
• Current risks to infrastructure service delivery are likely to eventuate and response actions may not be appropriately managed
• We may not be able to accommodate and/or manage changes in 7.3 Monitoring and Review Procedures
7.2 Performance Measures
The effectiveness of the SAMP can be measured in the following ways:
• The degree to which the required projected expenditures identified in this SAMP are incorporated into the organisation’s LTFP
• The degree to which 1-5 years detailed works programs, budgets, business plans and organisational structures take into account the ‘global’ works program trends provided by the summarised AMPs
• The degree to which the existing and projected service levels and service consequences (our current limitations), risks and residual risks are incorporated into the organisation’s Strategic Plan and associated plans
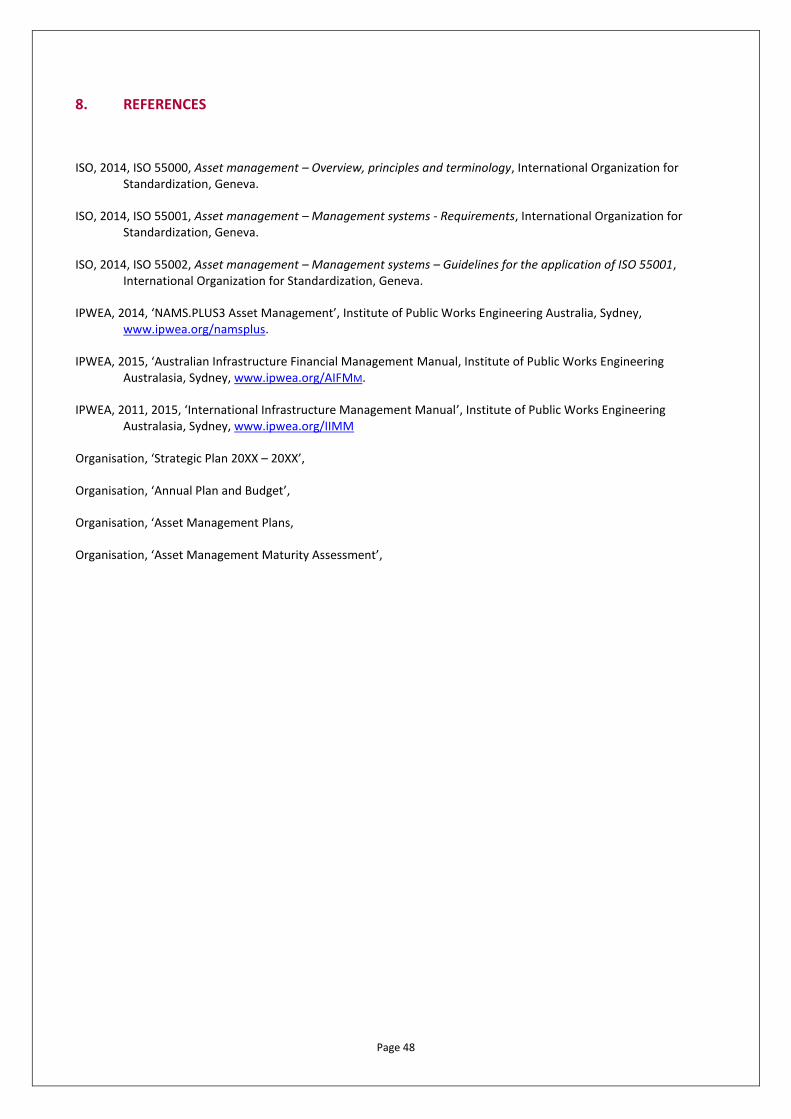
Page 48
8. REFERENCES
ISO, 2014, ISO 55000, Asset management – Overview, principles and terminology, International Organization for Standardization, Geneva.
ISO, 2014, ISO 55001, Asset management – Management systems - Requirements, International Organization for Standardization, Geneva.
ISO, 2014, ISO 55002, Asset management – Management systems – Guidelines for the application of ISO 55001, International Organization for Standardization, Geneva.
IPWEA, 2014, ‘NAMS.PLUS3 Asset Management’, Institute of Public Works Engineering Australia, Sydney, www.ipwea.org/namsplus.
IPWEA, 2015, ‘Australian Infrastructure Financial Management Manual, Institute of Public Works Engineering Australasia, Sydney, www.ipwea.org/AIFMM.
IPWEA, 2011, 2015, ‘International Infrastructure Management Manual’, Institute of Public Works Engineering Australasia, Sydney, www.ipwea.org/IIMM
Organisation, ‘Strategic Plan 20XX – 20XX’,
Organisation, ‘Annual Plan and Budget’,
Organisation, ‘Asset Management Plans,
Organisation, ‘Asset Management Maturity Assessment’,
Page 49
9. APPENDICES
Appendix A Levels of Service Summaries for Services
Appendix B Projected 10 Years Operations and Maintenance Expenditures
Appendix C Projected 10 Years Capital Works Program
Appendix D Asset Revaluation and Annual reviews
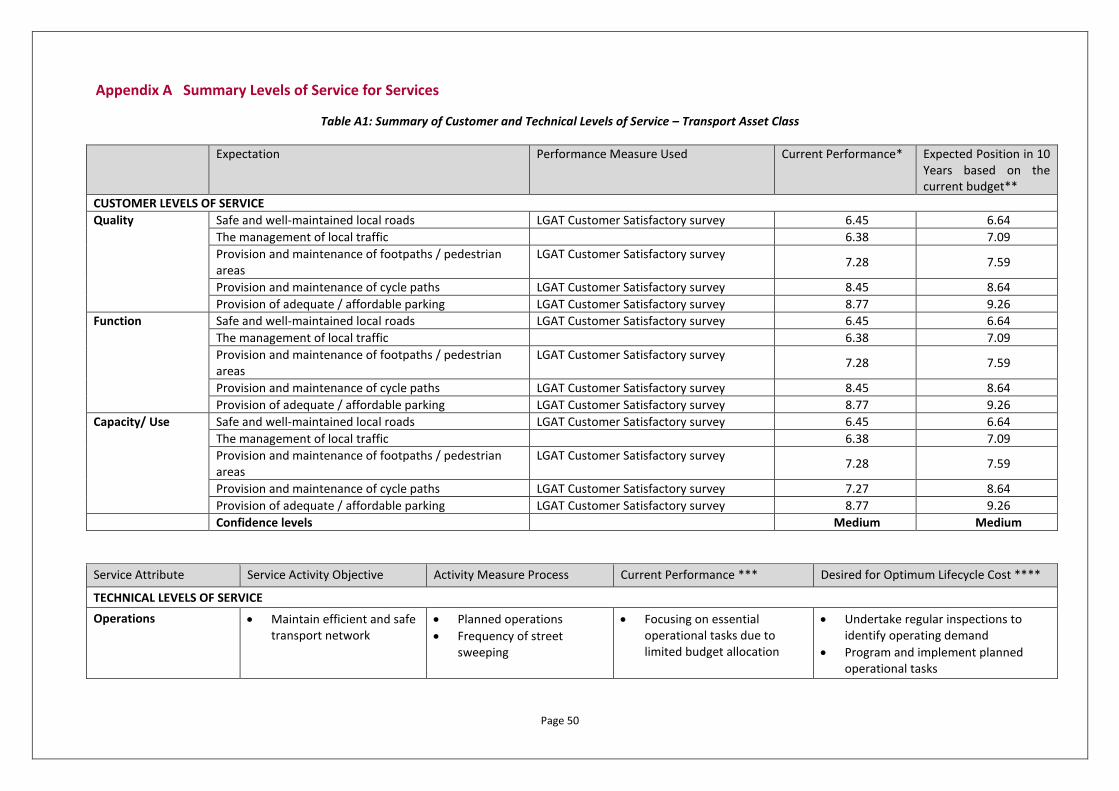
Page 50
Appendix A Summary Levels of Service for Services
Table A1: Summary of Customer and Technical Levels of Service – Transport Asset Class
Expectation Performance Measure Used Current Performance* Expected Position in 10 Years based on the current budget**
CUSTOMER LEVELS OF SERVICE
Quality Safe and well-maintained local roads LGAT Customer Satisfactory survey 6.45 6.64
The management of local traffic 6.38 7.09
Provision and maintenance of footpaths / pedestrian areas
LGAT Customer Satisfactory survey
7.28 7.59
Provision and maintenance of cycle paths LGAT Customer Satisfactory survey 8.45 8.64
Provision of adequate / affordable parking LGAT Customer Satisfactory survey 8.77 9.26
Function Safe and well-maintained local roads LGAT Customer Satisfactory survey 6.45 6.64
The management of local traffic 6.38 7.09
Provision and maintenance of footpaths / pedestrian areas
LGAT Customer Satisfactory survey
7.28 7.59
Provision and maintenance of cycle paths LGAT Customer Satisfactory survey 8.45 8.64
Provision of adequate / affordable parking LGAT Customer Satisfactory survey 8.77 9.26
Capacity/ Use
Safe and well-maintained local roads LGAT Customer Satisfactory survey 6.45 6.64
The management of local traffic 6.38 7.09
Provision and maintenance of footpaths / pedestrian areas
LGAT Customer Satisfactory survey
7.28 7.59
Provision and maintenance of cycle paths LGAT Customer Satisfactory survey 7.27 8.64
Provision of adequate / affordable parking LGAT Customer Satisfactory survey 8.77 9.26
Confidence levels Medium Medium
Service Attribute Service Activity Objective Activity Measure Process Current Performance *** Desired for Optimum Lifecycle Cost ****
TECHNICAL LEVELS OF SERVICE
Operations • Maintain efficient and safe transport network
• Planned operations
• Frequency of street sweeping
• Focusing on essential operational tasks due to limited budget allocation
• Undertake regular inspections to identify operating demand
• Program and implement planned operational tasks
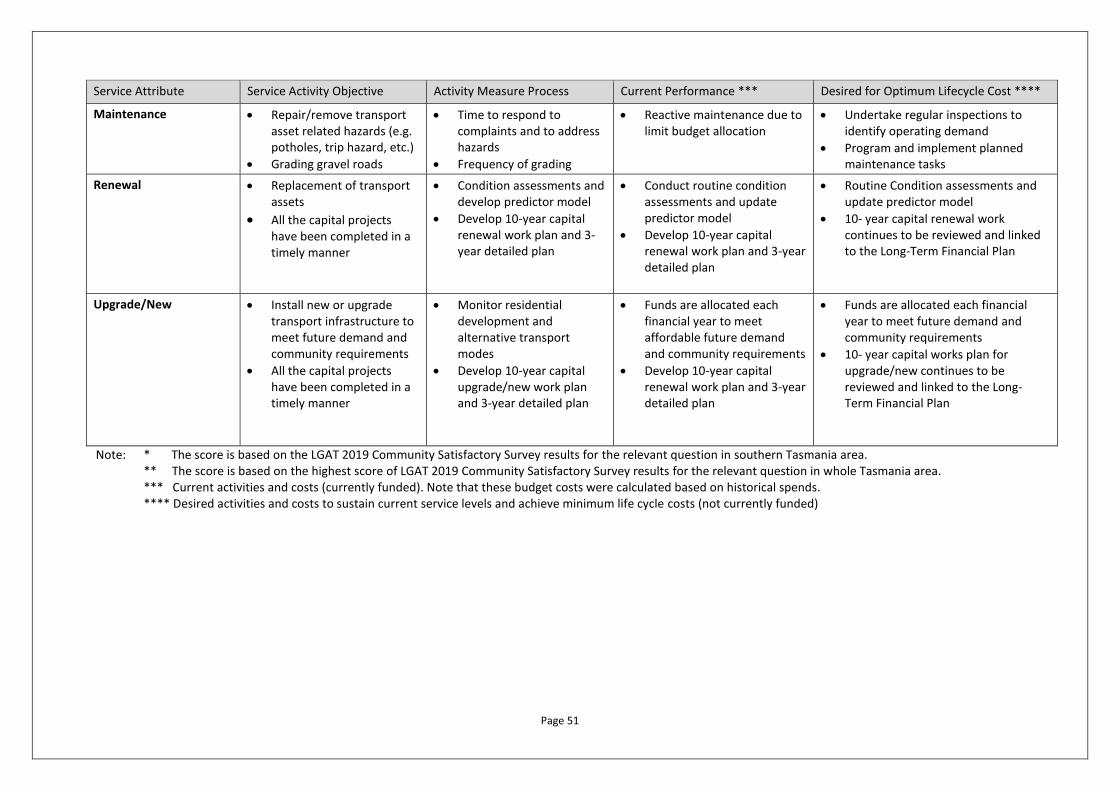
Page 51
Service Attribute Service Activity Objective Activity Measure Process Current Performance *** Desired for Optimum Lifecycle Cost ****
Maintenance • Repair/remove transport asset related hazards (e.g. potholes, trip hazard, etc.)
• Grading gravel roads
• Time to respond to complaints and to address hazards
• Frequency of grading
• Reactive maintenance due to limit budget allocation
• Undertake regular inspections to identify operating demand
• Program and implement planned maintenance tasks
Renewal • Replacement of transport assets
• All the capital projects have been completed in a timely manner
• Condition assessments and develop predictor model
• Develop 10-year capital renewal work plan and 3-year detailed plan
• Conduct routine condition assessments and update predictor model
• Develop 10-year capital renewal work plan and 3-year detailed plan
• Routine Condition assessments and update predictor model
• 10- year capital renewal work continues to be reviewed and linked to the Long-Term Financial Plan
Upgrade/New • Install new or upgrade transport infrastructure to meet future demand and community requirements
• All the capital projects have been completed in a timely manner
• Monitor residential development and alternative transport modes
• Develop 10-year capital upgrade/new work plan and 3-year detailed plan
• Funds are allocated each financial year to meet affordable future demand and community requirements
• Develop 10-year capital renewal work plan and 3-year detailed plan
• Funds are allocated each financial year to meet future demand and community requirements
• 10- year capital works plan for upgrade/new continues to be reviewed and linked to the Long-Term Financial Plan
Note: * The score is based on the LGAT 2019 Community Satisfactory Survey results for the relevant question in southern Tasmania area. ** The score is based on the highest score of LGAT 2019 Community Satisfactory Survey results for the relevant question in whole Tasmania area.
*** Current activities and costs (currently funded). Note that these budget costs were calculated based on historical spends. **** Desired activities and costs to sustain current service levels and achieve minimum life cycle costs (not currently funded)
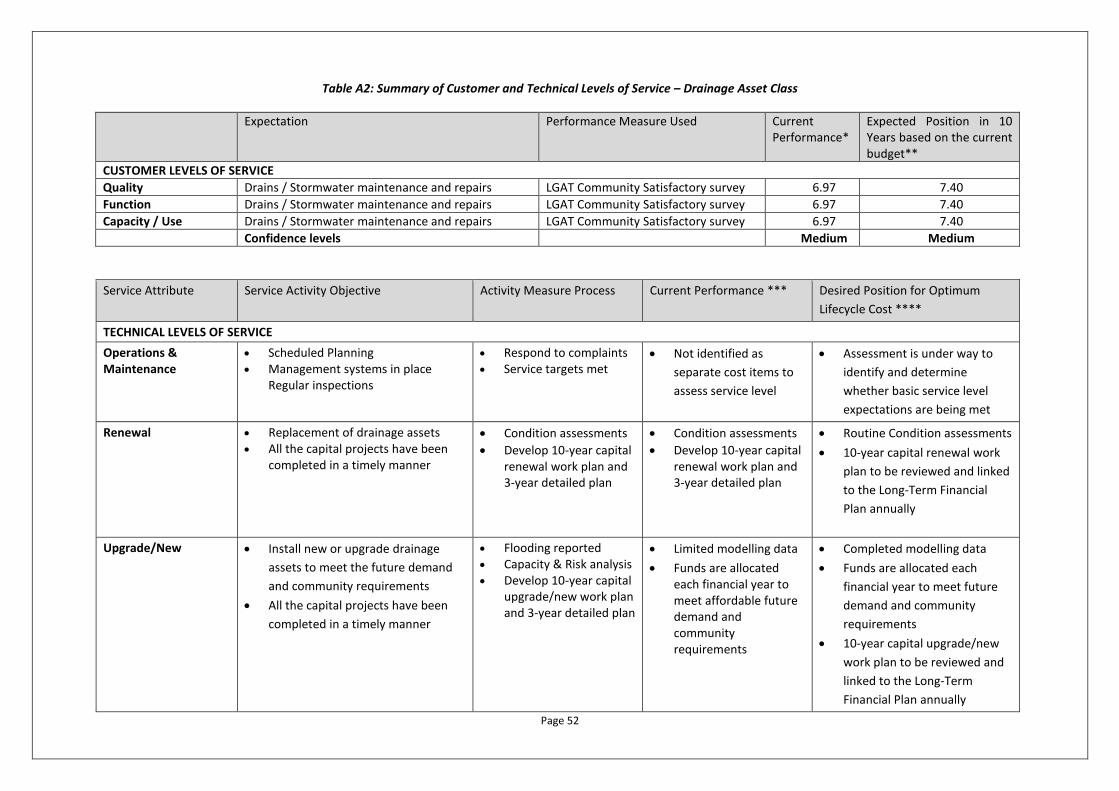
Page 52
Table A2: Summary of Customer and Technical Levels of Service – Drainage Asset Class
Expectation Performance Measure Used Current Performance*
Expected Position in 10 Years based on the current budget**
CUSTOMER LEVELS OF SERVICE
Quality Drains / Stormwater maintenance and repairs LGAT Community Satisfactory survey 6.97 7.40
Function Drains / Stormwater maintenance and repairs LGAT Community Satisfactory survey 6.97 7.40
Capacity / Use Drains / Stormwater maintenance and repairs LGAT Community Satisfactory survey 6.97 7.40
Confidence levels Medium Medium
Service Attribute Service Activity Objective Activity Measure Process Current Performance *** Desired Position for Optimum
Lifecycle Cost ****
TECHNICAL LEVELS OF SERVICE
Operations & Maintenance
• Scheduled Planning • Management systems in place
Regular inspections
• Respond to complaints • Service targets met
• Not identified as
separate cost items to
assess service level
• Assessment is under way to
identify and determine
whether basic service level
expectations are being met
Renewal • Replacement of drainage assets • All the capital projects have been
completed in a timely manner
• Condition assessments
• Develop 10-year capital renewal work plan and 3-year detailed plan
• Condition assessments
• Develop 10-year capital renewal work plan and 3-year detailed plan
• Routine Condition assessments
• 10-year capital renewal work
plan to be reviewed and linked
to the Long-Term Financial
Plan annually
Upgrade/New • Install new or upgrade drainage
assets to meet the future demand
and community requirements
• All the capital projects have been
completed in a timely manner
• Flooding reported • Capacity & Risk analysis • Develop 10-year capital
upgrade/new work plan and 3-year detailed plan
• Limited modelling data
• Funds are allocated each financial year to meet affordable future demand and community requirements
• Completed modelling data
• Funds are allocated each
financial year to meet future
demand and community
requirements
• 10-year capital upgrade/new
work plan to be reviewed and
linked to the Long-Term
Financial Plan annually
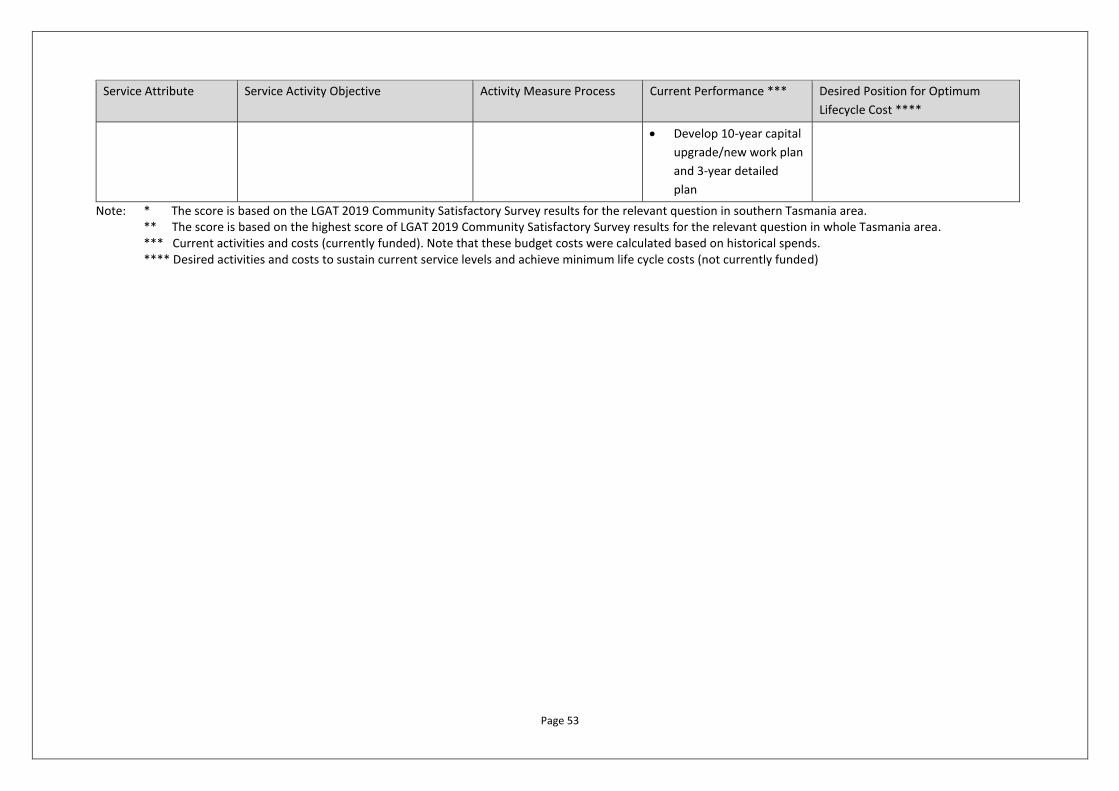
Page 53
Service Attribute Service Activity Objective Activity Measure Process Current Performance *** Desired Position for Optimum
Lifecycle Cost ****
• Develop 10-year capital
upgrade/new work plan
and 3-year detailed
plan
Note: * The score is based on the LGAT 2019 Community Satisfactory Survey results for the relevant question in southern Tasmania area. ** The score is based on the highest score of LGAT 2019 Community Satisfactory Survey results for the relevant question in whole Tasmania area.
*** Current activities and costs (currently funded). Note that these budget costs were calculated based on historical spends. **** Desired activities and costs to sustain current service levels and achieve minimum life cycle costs (not currently funded)
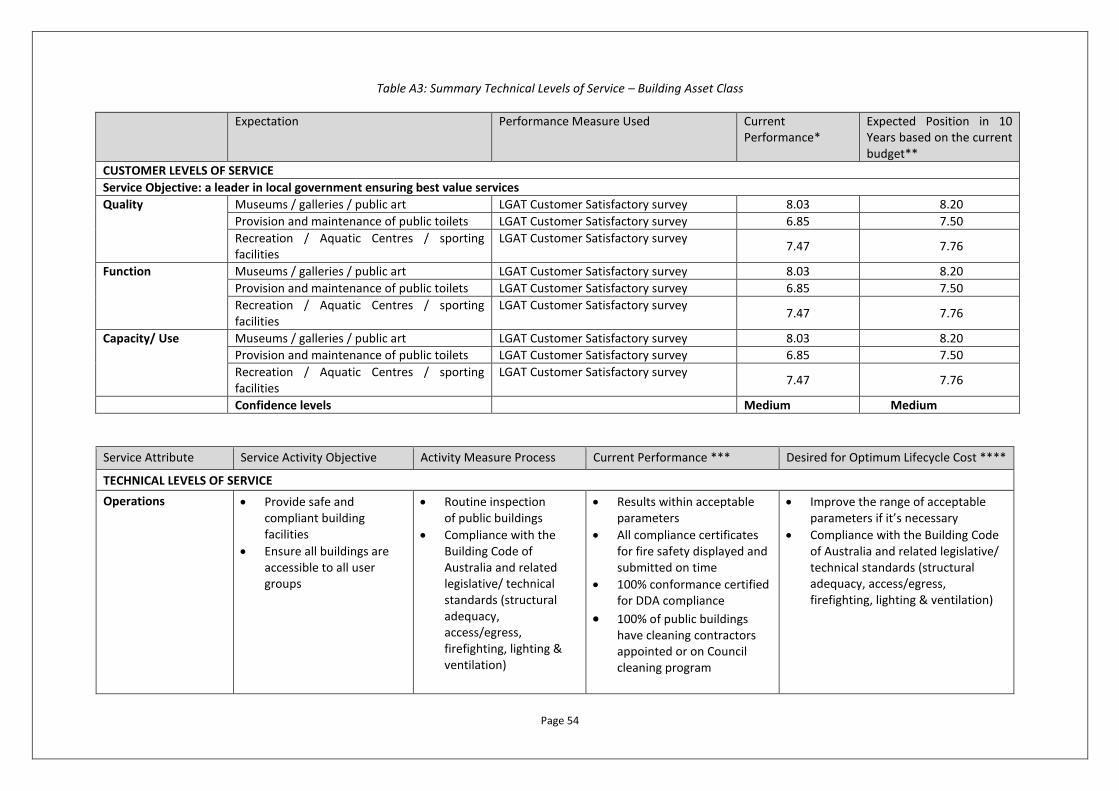
Page 54
Table A3: Summary Technical Levels of Service – Building Asset Class
Expectation Performance Measure Used Current Performance*
Expected Position in 10 Years based on the current budget**
CUSTOMER LEVELS OF SERVICE
Service Objective: a leader in local government ensuring best value services
Quality Museums / galleries / public art LGAT Customer Satisfactory survey 8.03 8.20
Provision and maintenance of public toilets LGAT Customer Satisfactory survey 6.85 7.50
Recreation / Aquatic Centres / sporting facilities
LGAT Customer Satisfactory survey 7.47 7.76
Function Museums / galleries / public art LGAT Customer Satisfactory survey 8.03 8.20
Provision and maintenance of public toilets LGAT Customer Satisfactory survey 6.85 7.50
Recreation / Aquatic Centres / sporting facilities
LGAT Customer Satisfactory survey 7.47 7.76
Capacity/ Use
Museums / galleries / public art LGAT Customer Satisfactory survey 8.03 8.20
Provision and maintenance of public toilets LGAT Customer Satisfactory survey 6.85 7.50
Recreation / Aquatic Centres / sporting facilities
LGAT Customer Satisfactory survey 7.47 7.76
Confidence levels Medium Medium
Service Attribute Service Activity Objective Activity Measure Process Current Performance *** Desired for Optimum Lifecycle Cost ****
TECHNICAL LEVELS OF SERVICE
Operations • Provide safe and compliant building facilities
• Ensure all buildings are accessible to all user groups
• Routine inspection of public buildings
• Compliance with the Building Code of Australia and related legislative/ technical standards (structural adequacy, access/egress, firefighting, lighting & ventilation)
• Results within acceptable parameters
• All compliance certificates for fire safety displayed and submitted on time
• 100% conformance certified for DDA compliance
• 100% of public buildings have cleaning contractors appointed or on Council cleaning program
• Improve the range of acceptable parameters if it’s necessary
• Compliance with the Building Code of Australia and related legislative/ technical standards (structural adequacy, access/egress, firefighting, lighting & ventilation)
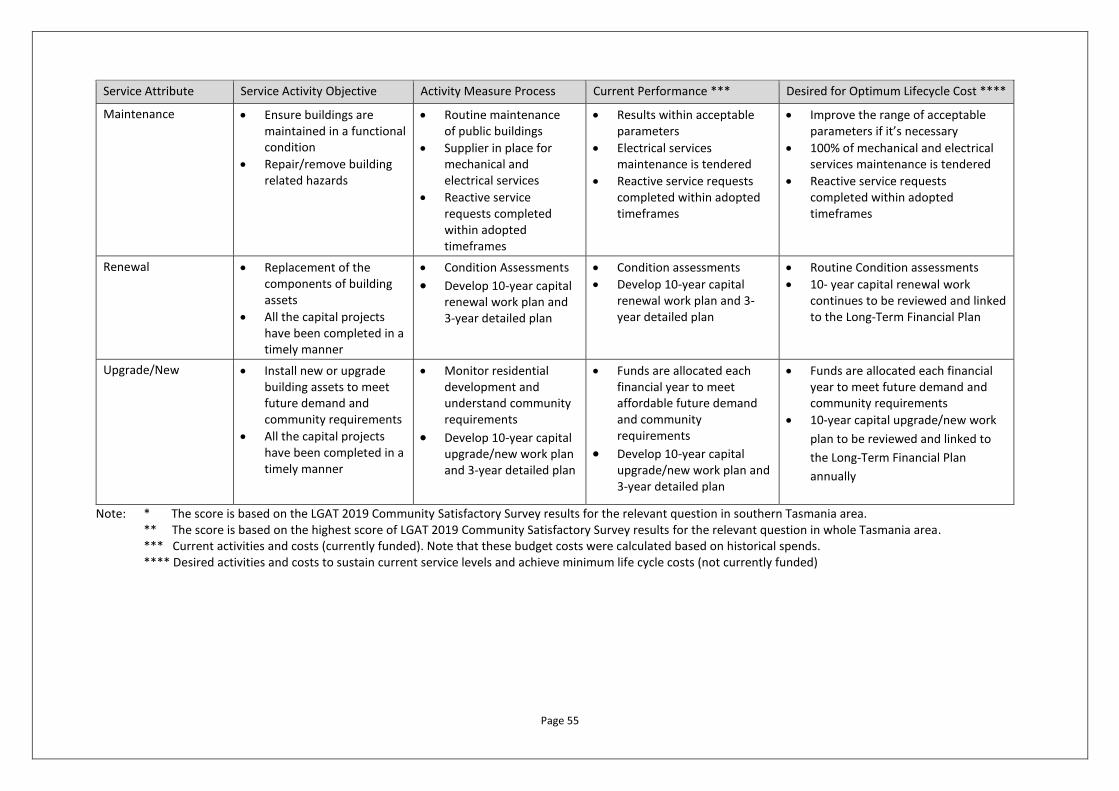
Page 55
Service Attribute Service Activity Objective Activity Measure Process Current Performance *** Desired for Optimum Lifecycle Cost ****
Maintenance • Ensure buildings are maintained in a functional condition
• Repair/remove building related hazards
• Routine maintenance of public buildings
• Supplier in place for mechanical and electrical services
• Reactive service requests completed within adopted timeframes
• Results within acceptable parameters
• Electrical services maintenance is tendered
• Reactive service requests completed within adopted timeframes
• Improve the range of acceptable parameters if it’s necessary
• 100% of mechanical and electrical services maintenance is tendered
• Reactive service requests completed within adopted timeframes
Renewal • Replacement of the components of building assets
• All the capital projects have been completed in a timely manner
• Condition Assessments
• Develop 10-year capital renewal work plan and 3-year detailed plan
• Condition assessments
• Develop 10-year capital renewal work plan and 3-year detailed plan
• Routine Condition assessments
• 10- year capital renewal work continues to be reviewed and linked to the Long-Term Financial Plan
Upgrade/New • Install new or upgrade building assets to meet future demand and community requirements
• All the capital projects have been completed in a timely manner
• Monitor residential development and understand community requirements
• Develop 10-year capital upgrade/new work plan and 3-year detailed plan
• Funds are allocated each financial year to meet affordable future demand and community requirements
• Develop 10-year capital upgrade/new work plan and 3-year detailed plan
• Funds are allocated each financial year to meet future demand and community requirements
• 10-year capital upgrade/new work
plan to be reviewed and linked to
the Long-Term Financial Plan
annually
Note: * The score is based on the LGAT 2019 Community Satisfactory Survey results for the relevant question in southern Tasmania area. ** The score is based on the highest score of LGAT 2019 Community Satisfactory Survey results for the relevant question in whole Tasmania area.
*** Current activities and costs (currently funded). Note that these budget costs were calculated based on historical spends. **** Desired activities and costs to sustain current service levels and achieve minimum life cycle costs (not currently funded)

Page 56
Table A4: Summary of Customer and Technical Levels of Service – Park & Recreation Asset Class
Expectation Performance Measure Used Current Performance*
Expected Position in 10 Years based on the current budget**
CUSTOMER LEVELS OF SERVICE
Quality Recreation / Aquatic Centres / sporting facilities LGAT Community Satisfactory Survey 7.47 7.76
The maintenance and cleaning of public areas LGAT Community Satisfactory Survey 7.25 7.40
Provision and maintenance of parks, gardens and
playgrounds
LGAT Community Satisfactory Survey 7.83 8.06
Street Lighting LGAT Community Satisfactory Survey 7.79 9.17
Information and directional signage of public areas
and pedestrian pathways
GCC LGAT Community Satisfactory survey n/a n/a
Function Recreation / Aquatic Centres / sporting facilities LGAT Community Satisfactory Survey 7.47 7.76
The maintenance and cleaning of public areas LGAT Community Satisfactory Survey 7.25 7.40
Provision and maintenance of parks, gardens and playgrounds
LGAT Community Satisfactory Survey 7.83 8.06
Street Lighting LGAT Community Satisfactory Survey 7.79 9.17
Information and directional signage of public areas and pedestrian pathways
GCC LGAT Community Satisfactory survey n/a n/a
Capacity/Use Recreation / Aquatic Centres / sporting facilities LGAT Community Satisfactory Survey 7.47 7.76
The maintenance and cleaning of public areas LGAT Community Satisfactory Survey 7.25 7.40
Provision and maintenance of parks, gardens and playgrounds
LGAT Community Satisfactory Survey 7.83 8.06
Street Lighting LGAT Community Satisfactory Survey 7.79 9.17
Information and directional signage of public areas and pedestrian pathways
GCC LGAT Community Satisfactory survey n/a n/a
Confidence levels Medium Medium
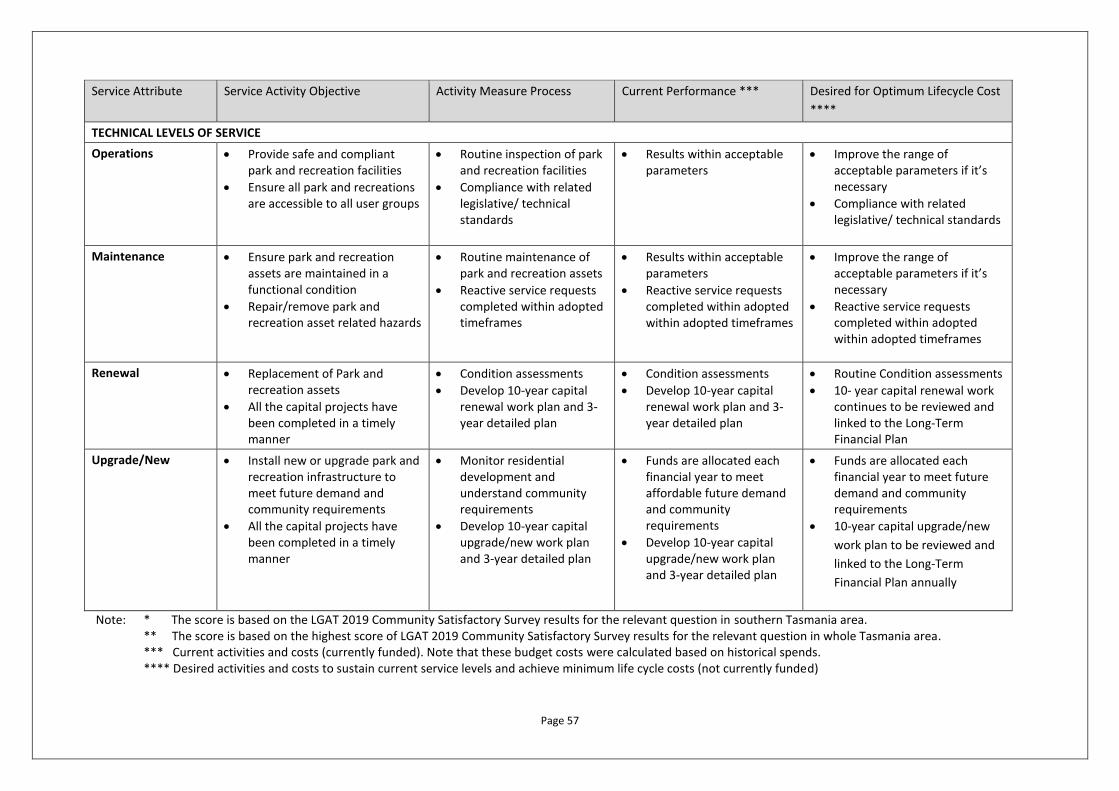
Page 57
Service Attribute Service Activity Objective Activity Measure Process Current Performance *** Desired for Optimum Lifecycle Cost
****
TECHNICAL LEVELS OF SERVICE
Operations • Provide safe and compliant park and recreation facilities
• Ensure all park and recreations are accessible to all user groups
• Routine inspection of park and recreation facilities
• Compliance with related legislative/ technical standards
• Results within acceptable parameters
• Improve the range of acceptable parameters if it’s necessary
• Compliance with related legislative/ technical standards
Maintenance • Ensure park and recreation assets are maintained in a functional condition
• Repair/remove park and recreation asset related hazards
• Routine maintenance of park and recreation assets
• Reactive service requests completed within adopted timeframes
• Results within acceptable parameters
• Reactive service requests completed within adopted within adopted timeframes
• Improve the range of acceptable parameters if it’s necessary
• Reactive service requests completed within adopted within adopted timeframes
Renewal • Replacement of Park and recreation assets
• All the capital projects have been completed in a timely manner
• Condition assessments
• Develop 10-year capital renewal work plan and 3-year detailed plan
• Condition assessments
• Develop 10-year capital renewal work plan and 3-year detailed plan
• Routine Condition assessments
• 10- year capital renewal work continues to be reviewed and linked to the Long-Term Financial Plan
Upgrade/New • Install new or upgrade park and recreation infrastructure to meet future demand and community requirements
• All the capital projects have been completed in a timely manner
• Monitor residential development and understand community requirements
• Develop 10-year capital upgrade/new work plan and 3-year detailed plan
• Funds are allocated each financial year to meet affordable future demand and community requirements
• Develop 10-year capital upgrade/new work plan and 3-year detailed plan
• Funds are allocated each financial year to meet future demand and community requirements
• 10-year capital upgrade/new
work plan to be reviewed and
linked to the Long-Term
Financial Plan annually
Note: * The score is based on the LGAT 2019 Community Satisfactory Survey results for the relevant question in southern Tasmania area. ** The score is based on the highest score of LGAT 2019 Community Satisfactory Survey results for the relevant question in whole Tasmania area.
*** Current activities and costs (currently funded). Note that these budget costs were calculated based on historical spends. **** Desired activities and costs to sustain current service levels and achieve minimum life cycle costs (not currently funded)
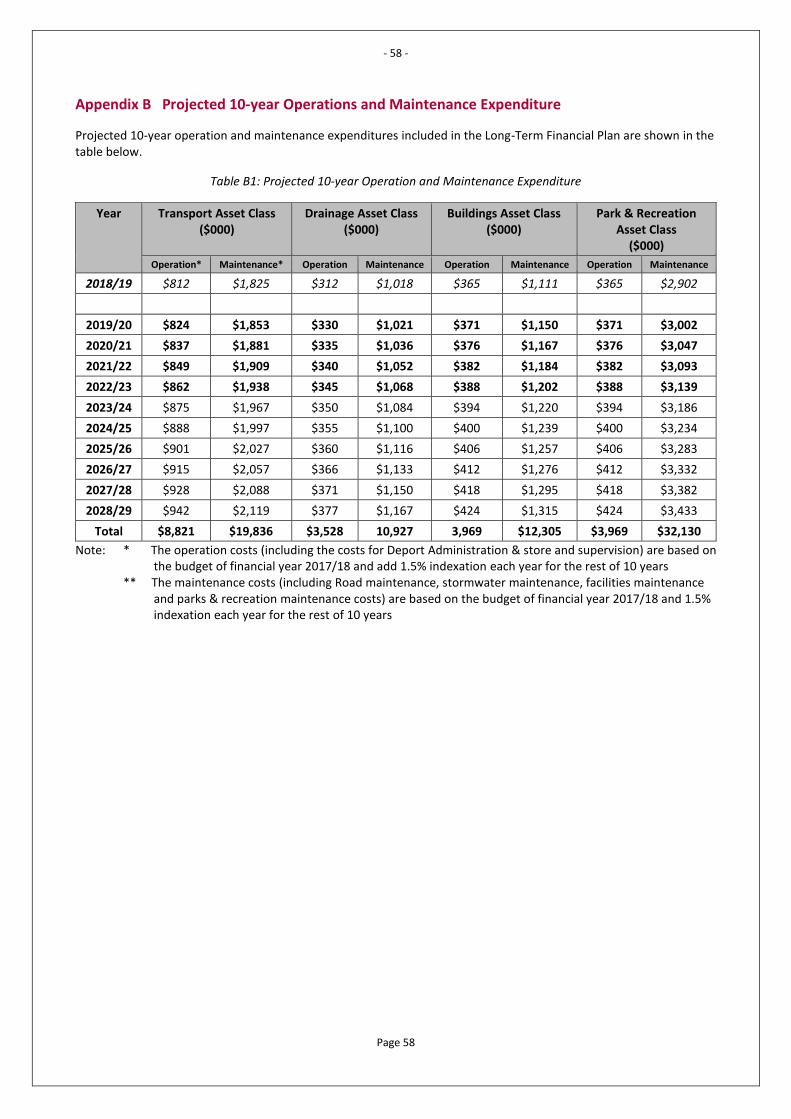
- 58 -
Page 58
Appendix B Projected 10-year Operations and Maintenance Expenditure
Projected 10-year operation and maintenance expenditures included in the Long-Term Financial Plan are shown in the table below.
Table B1: Projected 10-year Operation and Maintenance Expenditure
Year Transport Asset Class ($000)
Drainage Asset Class ($000)
Buildings Asset Class ($000)
Park & Recreation Asset Class
($000)
Operation* Maintenance* Operation Maintenance Operation Maintenance Operation Maintenance
2018/19 $812 $1,825 $312 $1,018 $365 $1,111 $365 $2,902
2019/20 $824 $1,853 $330 $1,021 $371 $1,150 $371 $3,002
2020/21 $837 $1,881 $335 $1,036 $376 $1,167 $376 $3,047
2021/22 $849 $1,909 $340 $1,052 $382 $1,184 $382 $3,093
2022/23 $862 $1,938 $345 $1,068 $388 $1,202 $388 $3,139
2023/24 $875 $1,967 $350 $1,084 $394 $1,220 $394 $3,186
2024/25 $888 $1,997 $355 $1,100 $400 $1,239 $400 $3,234
2025/26 $901 $2,027 $360 $1,116 $406 $1,257 $406 $3,283
2026/27 $915 $2,057 $366 $1,133 $412 $1,276 $412 $3,332
2027/28 $928 $2,088 $371 $1,150 $418 $1,295 $418 $3,382
2028/29 $942 $2,119 $377 $1,167 $424 $1,315 $424 $3,433
Total $8,821 $19,836 $3,528 10,927 3,969 $12,305 $3,969 $32,130
Note: * The operation costs (including the costs for Deport Administration & store and supervision) are based on the budget of financial year 2017/18 and add 1.5% indexation each year for the rest of 10 years ** The maintenance costs (including Road maintenance, stormwater maintenance, facilities maintenance and parks & recreation maintenance costs) are based on the budget of financial year 2017/18 and 1.5% indexation each year for the rest of 10 years
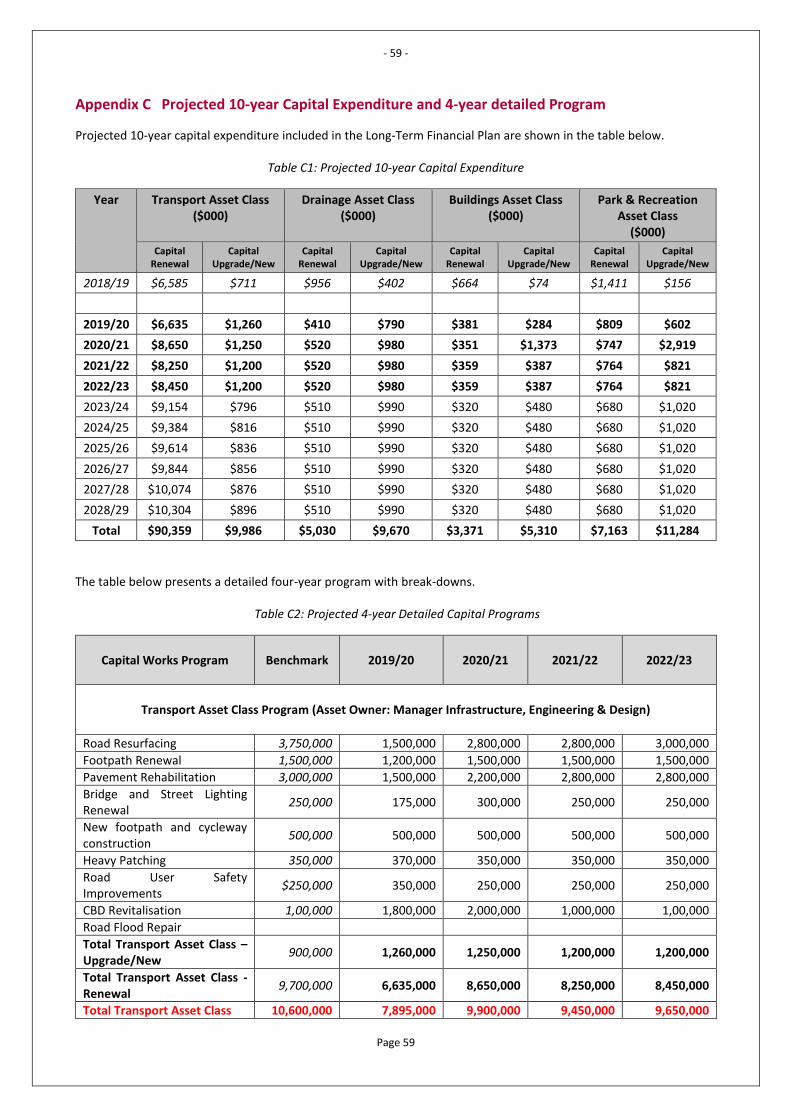
- 59 -
Page 59
Appendix C Projected 10-year Capital Expenditure and 4-year detailed Program
Projected 10-year capital expenditure included in the Long-Term Financial Plan are shown in the table below.
Table C1: Projected 10-year Capital Expenditure
Year Transport Asset Class ($000)
Drainage Asset Class ($000)
Buildings Asset Class ($000)
Park & Recreation Asset Class
($000)
Capital Renewal
Capital Upgrade/New
Capital Renewal
Capital Upgrade/New
Capital Renewal
Capital Upgrade/New
Capital Renewal
Capital Upgrade/New
2018/19 $6,585 $711 $956 $402 $664 $74 $1,411 $156
2019/20 $6,635 $1,260 $410 $790 $381 $284 $809 $602
2020/21 $8,650 $1,250 $520 $980 $351 $1,373 $747 $2,919
2021/22 $8,250 $1,200 $520 $980 $359 $387 $764 $821
2022/23 $8,450 $1,200 $520 $980 $359 $387 $764 $821
2023/24 $9,154 $796 $510 $990 $320 $480 $680 $1,020
2024/25 $9,384 $816 $510 $990 $320 $480 $680 $1,020
2025/26 $9,614 $836 $510 $990 $320 $480 $680 $1,020
2026/27 $9,844 $856 $510 $990 $320 $480 $680 $1,020
2027/28 $10,074 $876 $510 $990 $320 $480 $680 $1,020
2028/29 $10,304 $896 $510 $990 $320 $480 $680 $1,020
Total $90,359 $9,986 $5,030 $9,670 $3,371 $5,310 $7,163 $11,284
The table below presents a detailed four-year program with break-downs.
Table C2: Projected 4-year Detailed Capital Programs
Capital Works Program
Benchmark 2019/20 2020/21 2021/22 2022/23
Transport Asset Class Program (Asset Owner: Manager Infrastructure, Engineering & Design)
Road Resurfacing 3,750,000 1,500,000 2,800,000 2,800,000 3,000,000
Footpath Renewal 1,500,000 1,200,000 1,500,000 1,500,000 1,500,000
Pavement Rehabilitation 3,000,000 1,500,000 2,200,000 2,800,000 2,800,000
Bridge and Street Lighting Renewal
250,000 175,000 300,000 250,000 250,000
New footpath and cycleway construction
500,000 500,000 500,000 500,000 500,000
Heavy Patching 350,000 370,000 350,000 350,000 350,000
Road User Safety Improvements
$250,000 350,000 250,000 250,000 250,000
CBD Revitalisation 1,00,000 1,800,000 2,000,000 1,000,000 1,00,000
Road Flood Repair
Total Transport Asset Class – Upgrade/New
900,000 1,260,000 1,250,000 1,200,000 1,200,000
Total Transport Asset Class -Renewal
9,700,000 6,635,000 8,650,000 8,250,000 8,450,000
Total Transport Asset Class 10,600,000 7,895,000 9,900,000 9,450,000 9,650,000
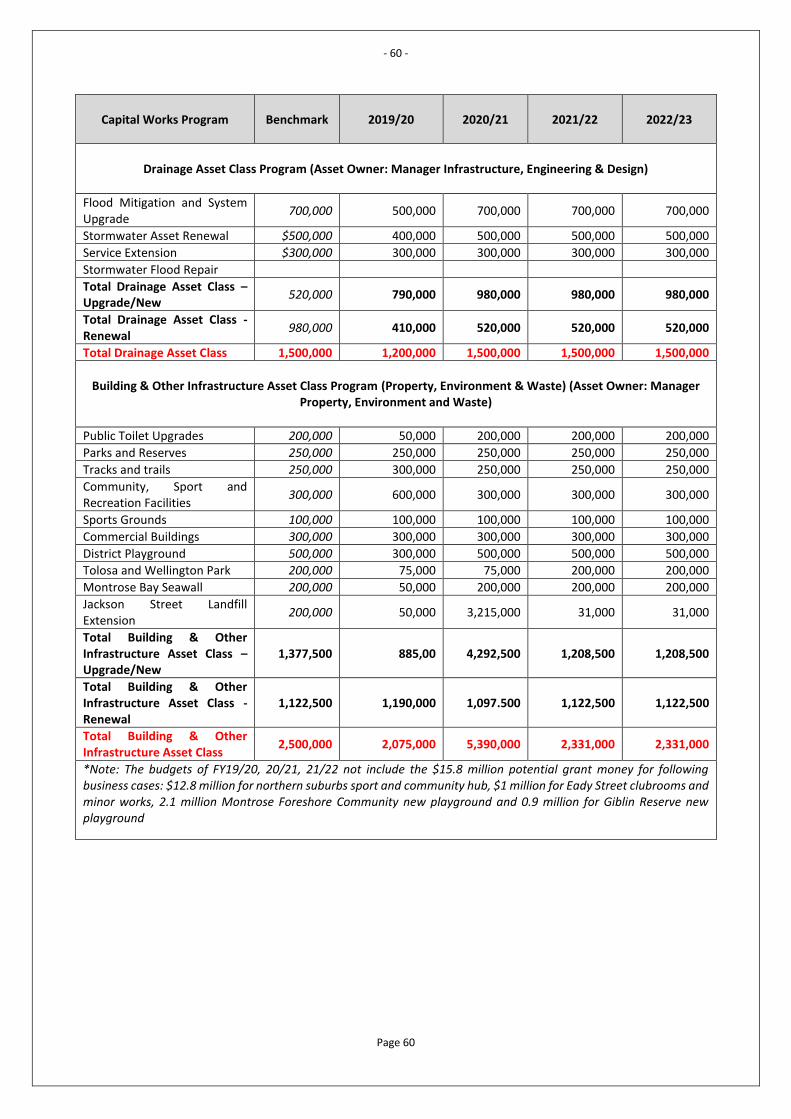
- 60 -
Page 60
Capital Works Program
Benchmark 2019/20 2020/21 2021/22 2022/23
Drainage Asset Class Program (Asset Owner: Manager Infrastructure, Engineering & Design)
Flood Mitigation and System Upgrade
700,000 500,000 700,000 700,000 700,000
Stormwater Asset Renewal $500,000 400,000 500,000 500,000 500,000
Service Extension $300,000 300,000 300,000 300,000 300,000
Stormwater Flood Repair
Total Drainage Asset Class – Upgrade/New
520,000 790,000 980,000 980,000 980,000
Total Drainage Asset Class -Renewal
980,000 410,000 520,000 520,000 520,000
Total Drainage Asset Class 1,500,000 1,200,000 1,500,000 1,500,000 1,500,000
Building & Other Infrastructure Asset Class Program (Property, Environment & Waste) (Asset Owner: Manager
Property, Environment and Waste)
Public Toilet Upgrades 200,000 50,000 200,000 200,000 200,000
Parks and Reserves 250,000 250,000 250,000 250,000 250,000
Tracks and trails 250,000 300,000 250,000 250,000 250,000
Community, Sport and Recreation Facilities
300,000 600,000 300,000 300,000 300,000
Sports Grounds 100,000 100,000 100,000 100,000 100,000
Commercial Buildings 300,000 300,000 300,000 300,000 300,000
District Playground 500,000 300,000 500,000 500,000 500,000
Tolosa and Wellington Park 200,000 75,000 75,000 200,000 200,000
Montrose Bay Seawall 200,000 50,000 200,000 200,000 200,000
Jackson Street Landfill Extension
200,000 50,000 3,215,000 31,000 31,000
Total Building & Other Infrastructure Asset Class – Upgrade/New
1,377,500 885,00 4,292,500 1,208,500 1,208,500
Total Building & Other Infrastructure Asset Class -Renewal
1,122,500 1,190,000 1,097.500 1,122,500 1,122,500
Total Building & Other Infrastructure Asset Class
2,500,000 2,075,000 5,390,000 2,331,000 2,331,000
*Note: The budgets of FY19/20, 20/21, 21/22 not include the $15.8 million potential grant money for following business cases: $12.8 million for northern suburbs sport and community hub, $1 million for Eady Street clubrooms and minor works, 2.1 million Montrose Foreshore Community new playground and 0.9 million for Giblin Reserve new playground
- 61 -
Page 61
Appendix D Asset Revaluation and Annual reviews
The following detail outlines Glenorchy City Council’s approach to asset revaluations.
Fair Value - subsequent to the initial recognition of assets, non-current physical assets, other than Land Improvements,
Plant and Equipment, Heritage and Intangibles, are measured at their fair value in accordance with AASB 116 Property,
Plant & Equipment and AASB 13 Fair Value Measurement.
Council reviews the carrying value of the individual classes of assets measured at fair value to ensure that each asset
materially approximates its fair value. Where the carrying value materially differs from the fair value at balance date, this
would lead to a revaluation of this asset class.
In addition, Council undertakes a formal revaluation of asset classes, measured on the fair value basis on a four-year rolling
cycle. The valuation is performed either by experienced Council officers or independent experts. The cost of acquisitions
and capital works during the year is considered to represent their fair value.
Council annually reviews indicators that lead to the asset carrying value to materially differs from the fair value.
The following indicators may require a revaluation out of the ordinary cycle:
• Material changes in costs
• Material change to an index (ABS, CCI)
• Unexpected and significant natural disaster
Asset Classes revalued on a four cycle as detailed below (notwithstanding the effect of indicators):
• 2019-2020
o No Revaluation
• 2020-2021
o Transport Asset Class
• 2021-2022
o Building Asset Class
o Park & Recreation Asset Class
• 2022-2023
o Drainage Asset Class
Detail annual review process is guided by Glenorchy City Council Asset Annual Review Guideline that was developed by
the following the recommendations from LGAT Financial Sustainability Practice Summary 14.