strategic country environmental assessment...
TRANSCRIPT
August 21, 2006
Document of the World Bank
Report No. 36946-PK
PakistanStrategic Country Environmental Assessment(In Two Volumes) Volume I: Main Report
South Asia Environment and Social Development UnitSouth Asia Region
Report N
o. 36946-PKPakistan Strategic C
ountry Environmental A
ssessment Volum
e I

Table of Contents
PAGE
MAIN REPORT
EXECUTIVE SUMMARY ..................................................................................................... i-vi 1 . Environmental Challenges o f Accelerated Growth ........................................................ i 2 . Scope and Process o f the SCEA ..................................................................................... i 3 . A Framework for Assessing Environmental Outcomes ............................................... 11 4 . Rising to the Challenge: A Proposed Way Forward .................................................... 11
5 . Developing Priority Interventions for Capacity Building ........................................... v i
..
..
CHAPTER 1 . Context and Objectives: Environmental Challenges to Growth and the Response ........................................................ 1
1 . Environmental Challenges to Growth ........................................................................... 1 2 . The Response o f the Government o f Pakistan and Development Partners ................... 1 3 . Objectives o f the SCEA ................................................................................................ 2 4 . A Framework for Assessing Policy Effectiveness ........................................................ 2 5 Preparation o f the SCEA: Scope and Process ............................................................... 3 6 . Structure o f the Report .................................................................................................. 4
CHAPTER I1 . Environmental Issues and Impacts ................................................................. 5 1 . A Snap-Shot for Setting Policy Priorities ..................................................................... 6 2 . The Costs o f Environmental Health R isks .................................................................... 8 3 . The Costs o f Natural Resource Degradation ............................................................... 14 4 . Global Comparisons o f Environmental Sustainability ................................................ 20 5 Conclusions: Environmental Degradation as a Constraint to Growth ........................ 21
CHAPTER I11 . Institutions for Environmental Management: Closing the Links in Institutional Design and Strengthening Capacity ............................... 23
1 . Legal and Policy Framework: the Basis o f Institutional Design and Direction .......... 23 2 . Institutional Design: the Vertical Division o f Responsibilities ................................... 24 3 . The Horizontal Division o f Responsibilities: Mainstreaming and Upstreaming ........ 26 4 . Environment and the Judiciary: Strengthening a Vital Link ....................................... 27 5 . Are Resources for Environmental Management Adequate? ....................................... 29 6 . Moving Forward: Strengthening Institutions through NEP Implementation .............. 31
CHAPTER I V . Reinforcing the Environmental Impact Assessment System .................... 34 1 . The EL4 Framework: Establishing Oversight and Ensuring Coverage ...................... 34 2 . Strengthening the EIA Process: Meaningful Public Consultation and Disclosure ...... 35 3 . Promoting Quality o f EIA Content and Implementation ............................................ 36 4 . EIA and Public Sector Investments: Mainstreaming and Upstreaming ...................... 38 5 . Strengthening the E M System .................................................................................... 39
CHAPTER V . Urban Air Quality: Addressing a Growing Threat to Health .................... 40 1 . Urban Air Quality in Pakistan: Unhealthy Concentrations o f Particulate Matter ....... 40 2 . Pakistan Clean Air Program: the Challenge o f Institutional Design ........................... 42 3 . Air Quality Monitoring: Supplementing Capacity through Outsourcing .................... 43
4 . Strengthening the Regulatory Framework for Urban Air Quality Management ......... 44 5 . Moving Beyond Inspections and Enforcement: a Range o f Incentives for Clean Air 45 6 . Support for Air Quality Management: the Role o f Development Partners ................. 48
CHAPTER V I . Water Supply and Sanitation: Protecting Sources and Safeguarding Supplies ...................................................................... 49
1 . Water Supply and Sanitation in the context o f Water Resource Management ........... 49 2 . Drinking Water Sources: Declining Availability. Deteriorating Quality .................... 50 3 . Extent and Sources o f Water Contamination .............................................................. 50 4 . Institutional Design for Water Quality Protection ...................................................... 52 5 . Setting a Regulatory Foundation: Use-Based Standards for Water Sources ............... 54 6 . Building Local Capacity to Provide Water and Sanitation Services ........................... 55 7 . Creating Tiered Capacity to Regulate Drinking Water Quality .................................. 56 8 . Opportunities for Development Partner Support ......................................................... 57
CHAPTER VI1 . Recommendations and a Proposed Way Forward ................................... 58 1 . Strengthening Linkages in Institutional Design .......................................................... 58 2 . Updating the Regulatory Framework ........................................................................... 59 3 . Building Institutional Capacity for Environmental Management ............................... 61 4 . 5 .
Reinforcing Incentives and Accountability ................................................................. 63 Rising to the Challenge: a Proposed Way Forward .................................................... 64
TABLES
Table 2.1 Table 2.2 Table 2.3 Table 2.4 Table 2.5 Table 2.6
Table 2.7 Table 2.8 Table 2.9 Table 3.1 Table 5.1
FIGURES
Figure 1 Figure 1.1 Figure 2.1 Figure 2.2 Figure 2.3 Figure 2.4 Figure 2.5 Figure 2.6 Figure 4.1
Annual Cost o f Urban Air Pollution Health Impacts ............................................... 12 Annual Attributed Incidence o f Lead Exposure ....................................................... 13 Annual Health Cost due to Lead Exposure (Billion Rs.) ......................................... 13 Indoor Air Pollution ................................................................................................. 14 Wheat Yields (Kg/Hectare) ...................................................................................... 15
Costs o f Annual Deforestation (Million Rs) ............................................................ 19 Desert Countries (2 50% land classified as desert) .................................................. 21
EPA Staffing Levels ................................................................................................. 29
Estimated Annual Cost o f Agricultural Losses from Soil Salinity, Erosion & Rangeland ................................................................................................................. 19
2 Densely Populated Countries (2 100 persons per km ) ............................................ 21
New Vehicle Emission Standards & Corresponding Fuel Quality for Metro Cities45
.. T h e Environmental “Production Function” ........................................................... 11 The Environmental “Production Function” ............................................................ 3 Share o f Costs o f Environmental and Natural Resource Damages ......................... 6 Income and Infant Mortality ................................................................................... 8 Estimated Costs from Water related Mortality and Morbidity ............................. 11 Annual DALYs lost from Urban Air Pollution ..................................................... 12 Agricultural Productivity Declines with Canal Releases in Sindh ........................ 16 Eroded Lands in Pakistan in 1993-2003 ............................................................... 17 EPA Performance Statistics .................................................................................. 35
Figure 5.1 Figure 6.1
BOXES
Box 2.1 B o x 2.2 B o x 3.1 B o x 3.2 B o x 3.3 B o x 3.4 B o x 3.5 B o x 4.1 B o x 5.1 B o x 5.2 B o x 6.1
Particulate Matter less than 10 microns (PM 10; 48-hour averages) ..................... 4 1 COD Levels in Surface Water .............................................................................. 51
The Coastal Zone .................................................................................................... 7 Measuring the Economic Impacts o f Illness and Premature Death ...................... 10 Environmental Federalism . Oversight Mechanisms in the Uni ted States .......... 126 Empowering Citizens to Promote Environmental Compliance ............................ 28 Environment Funds: Experience f rom Bulgaria ................................................... 3 0
Instituting Performance Based Grants in Pakistan ................................................ 32 EL4 Capacity Building - a Successful M o d e l in NWFP ...................................... 37 FederaVState Partnerships for Clean Air in the U S A ............................................ 43 Air Quality Index .................................................................................................. 47 Beneficial Use Water Standards in the State o f Minnesota .................................. 55
Incentive-Based Partnerships: the U S Experience ................................................ 31
APPENDICES
Appendix 1 . Measures Proposed in the Pakistan Clean Air Program ................................ 66
VOLUME 11: TECHNICAL ANNEX

ACKNQWLEDGEMENTS
W e would l ike to thank the staff o f the Ministry o f Environment for their guidance and support in the preparation o f this report.
This report i s the product o f a team managed by Paul Mar t in and including Jane Nishida, Javaid Afzal, Sameer Akbar, Richard Damania and David Hanrahan. Significant analytical inputs were provided by a team o f consultants f rom AAB Pvt. Ltd., led by Ele Jan Saaf, and a team from Resources for the Future, led by A lan Krupnik. Helpful advice and contributions were received from a number o f colleagues across the Wor ld Bank including Kseniya Lvovsky and Suphachol Suphachalasai. Valuable guidance was provided by the peer reviewers, Kirk Hamilton, Tariq Banuri and.Kulsum Ahmed. Assistance with document preparation was provided by Vinod Ghosh, and administrative support was provided by Afzal Mahmood.
The report was prepared under the overall guidance o f Jeffrey Raclu, Acting Director, South Asia Environment and Social Development Department, and John Wall, Country Director for Pakistan.


EXECUTIVE SUMMARY
1. Environmental Challenges of Accelerated Growth
I. Economic reforms have paid their dividend and the country has achieved record growth rates, buoyant levels o f investment and sustainable fiscal balances. Long term growth rates too have been reasonable, averaging 2.6 percent since 1960, exceeding most other countries in South Asia. Despite this remarkable record, however, the natural resource base i s stressed and the burden of disease remains high, threatening to undermine growth prospects.
Palustan i s the most urbanized country in South Asia, with a booming economy.
2. The urgency o f addressing Palustan’s environmental problems has probably never been greater. Conservative estimates presented in this report suggest that environmental degradation costs the country at least 6 percent o f GDP, or about Rs. 365 bi l l ion per year, and these costs fa l l disproportionately upon the poor. The most significant causes o f environmental damage identified and estimated in this report are (i) illness and premature mortality caused by air pollution (indoor and outdoor), (almost 50 percent o f the total damage cost); (ii) diarrhoeal diseases and typhoid due to inadequate water supply, sanitation and hygiene (about 30 percent o f the total), and (iii) reduced agricultural productivity due to soil degradation (about 20 percent of the total).
3 . development concern. Furthermore, accelerated growth and urbanization present additional environmental challenges, such as toxic air and water pollution, and hazardous solid waste. Capturing the development dividend o f growth calls for complementary policies that address environmental issues while facilitating development. Palustan has a commendable record o f efforts to promote conservation and longer term sustainability, f rom the National Conservation Strategy o f 1992 through to the adoption o f a National Environment Policy (NEP) in 2005. Implementation o f these initiatives remains a challenge, however. Whether judged in terms o f regional performance or environmental stress factors, there i s significant scope to better ensure the sustainability o f Pakistan’s economic growth.
The magnitude o f these costs indicates that environmental decay has become a serious
2. ScoDe and Process of the SCEA
4. the Government that the SCEA should focus o n a select set o f issues o f particular concern in the context o f growth and urbanization. These were selected in consultation with Federal and provincial environmental authorities based on a consideration o f the scope to achieve improvements in the near term, whi le influencing trends over a longer period. T h i s process led to a focus on the Environmental Impact Assessment (EM) system, the principal instrument to manage the environmental r i sks o f new investments, and the management o f air and water quality. Whi le recognizing the importance o f action in many other areas for the sustainability o f growth in Pakistan, the selective focus o f this report echoes government priorities to confront the environmental challenges o f rapid industrial and urban growth.
In approaching the wide range o f Pakistan’s environmental challenges, i t was agreed with
5 . consultative process that sought guidance f rom provincial and local representatives o f government and c i v i l society. An in i t ia l analysis was discussed at a National Stakeholder Conference, and the resulting recommendations are incorporated into this report.
Fol lowing the init ial scoping consultation, development o f the SCEA continued through a

I
In 5
4“
degradation and industrial pollution become more significant relative to other environmental damage factors. Fol lowing the analytical framework described above, the report analyzes the main binding constraints to improving environmental performance as falling into four categories, (i) gaps in institutional design, (ii) gaps in the regulatory framework, (iii) capacity limitations, and (iv) gaps in incentives and accountability. Of these weak incentives and l o w levels o f public accountability remain the critical constraints on performance. Public scrutiny o f performance i s ultimately a source o f strength that leads to stronger institutions with greater public trust and support. The principal features o f these constraints are summarized below, together with recommendations for moving forward to more sustainable economic growth.
Strengthening Linkages in Institutional Design
8. authority for environmental pollution and ecology. Within this environmental federalist structure, appropriate roles for national authorities include pol icy formulation, provision o f resources and oversight to provinces, and public reporting, whi le provincial authorities play the primary role in implementation and monitoring. Bringing greater clarity t o this structure would reduce the institutional design constraints to environmental performance, particularly through actions in the areas highlighted below:
Constitutionally, Federal and provincial governments share the concurrent legislative
Establishing Guidelines for Oversight of Delegated Authorities: guidelines are required for effective Federal oversight o f environmental authorities delegated to the provincial level, establishing (i) the adequacy o f provincial regulations and resources, (ii) provincial commitment to share information for performance monitoring, (iii) arrangements for funding assistance, and (iv) mechanisms for conflict resolution and the suspension o f delegated authorities when necessary.
Oversight of Environmental Clearances: guidelines would facilitate Federal oversight of provincial EIA clearances. Pakistan EPA reserves the right to review any environment report and to suspend clearance authority if it believes this power has been misused. This right has never been exercised, however, limiting the effectiveness o f the Federal mandate, and ultimately of the EIA system itself.
Creating Partnerships for Clean Air: the Pakistan Clean Air Programme (PCAP) will require partnerships between multiple tiers and sectors o f government, with (i) Pakistan EPA responsible for setting air quality and emissions standards, (ii) implementation o f these standards delegated to provincial environmental authorities, (iii) integration o f air quality management with urban planning by municipal authorities, and (iv) policies for clean air in the industry, energy, fuel and transportation sectors.
Defining Roles for Water Quality Protection: i t i s useful t o distinguish roles for water quality protection as being (i) protection of surface and groundwater sources, primarily involving environmental authorities and irrigation departments, (ii) the provision o f water and sanitation services by local governments, and (iii) regulation o f dnnlung water quality through a tiered approach, with local governments conducting routine monitoring, provincial authorities carrying out regular oversight, and Federal agencies providing quality assurance.
... 111

Updating the Regulatory Framework
9. Pakistan currently lacks standards for the quality o f ambient air and water. Such standards are the foundation upon which emission control strategies are based, and usually specify schedules for attainment as wel l as monitoring methods. The regulatory fkamework needs to be updated to incorporate standards in the following priority areas:
0 Developing Health-Based Air Quality Standards: Ambient air quality standards are required as a basis for emission control strategies, specifying limits for key pollutants and monitoring methods. Whi le safeguarding public health should be the main consideration, the costs and likelihood o f attainment should also inform the standard-setting process.
0 Vehicle Emission and Fuel Quality Standards: updated Vehicle Emission Standards for new registration and in-service vehicles are required, l inked to standards for fuel quality. In particular, the cost o f moving to lower sulphur diesel and alternate fue ls needs to be evaluated against the potential economic benefits in terms o f lower emissions and better health.
0 Establishing Use-Based Water Quality Standards: The lack o f ambient water quality standards i s a significant gap in the regulatory system. The NEP identifies the need to establish a use-based system for classification o f water bodies, to provide a clear basis for regulation o f pollution discharges.
0 Drinking Water Quality Standards: There are currently n o formal drinking water quality standards in Pakistan. M o E should take a lead in establishing these as part o f a broader framework for the protection o f drinhng water quality.
Building Capacity for Environmental Management
10. Term Development Framework, funding may be less o f a constraint than the abil ity to effectively utilize available resources. T h i s presents an important opportunity to develop capacity in environmental authorities at Federal, provincial and local levels, t o mainstream the development o f environmental management capacity in key sectoral agencies, and to upstream such capacity in planning departments, focusing in particular on:
With significant new resources proposed for environmental purposes in the Medium-
0 Strengthening Capacity for Effective Environmental Impact Assessments: Capacity building for more effective EIAs needs to address four weaknesses, (i) a lack o f expert input for technical reviews, (ii) a widespread unawareness o f requirements and procedures, both in government and the private sector, (iii) the lack o f a system to identify projects, both public and private, required to submit an EM, and (iv) weak enforcement o f EIA clearance conditions. Technical assistance would assist EPAs in many o f these areas, and adoption o f EIA training programs similar t o that o f NWFP would help broaden awareness o f EIA requirements.
0 Improving Technical Capacity for Air Quality Management: There i s a need to engage trained technical staff for air quality monitoring, inspection and analysis o f information. International experience indicates that it i s often more cost effective to use the sk i l l s and resources o f private or academic institutions than to build in-house capacity. Where such opportunities exist in air quality management or other areas (for example, strengthening
iv

the EIA system), outsourcing should be considered as a way o f expanding technical capacity.
Building Capacity to Protect Water Quality: Federal and provincial environmental authorities will require substantial technical assistance for water quality monitoring and stakeholder consultation to establish use-based standards for priority waterbodies, and their subsequent clean-up. The need for physical investments i s greatest at the local level, to upgrade and expand water supply and sanitation services, combined with technical assistance to help T M A s develop partnerships with the private sector for service provision. T o regulate drinking water quality, local capacity i s required for routine monitoring, supported by provincial resources for regular oversight, and by quality assurance at the national level, requiring a significant level o f expert input, equipment and training.
Mainstreaming and Upstreaming: Environmental cells have been created in a few key agencies, but require additional resources to prepare adequate EIAs, and effectively implement associated Environmental Management Plans. The establishment o f environment sections in planning departments i s significant, and their l imited permanent capacity should be supplemented with expert assistance to conduct environmental reviews and advise on environmental management plans. The effective promotion o f sustainable development in national planning wil l require more rigorous analysis o f environmental constraints to growth and poverty reduction, for which M o E will require additional resources to contract the necessary analytical expertise.
Reinforcing Incentives and Accountability
1 1. will only be achieved by ensuring stakeholders are informed and empowered. Opportunities to strengthen environmental accountability in Palustan include the following:
Accountability to stakeholders i s essential for sound environmental management, and
Public Consultation and Disclosure of EIAs: Measures to strengthen accountability in the EIA process include (i) requiring project proponents to develop a public consultation plan, (ii) creation o f EIA information centers at Federal and provincial levels, (iii) public disclosure o f a l l EIA filings o n a website for easy access by the public and private sector, and (iv) public provision o f a non-technical summary o f EIA decisions.
Public Information to Support Clean Air and Safe Water: The public provision o f air quality information, including the daily publication o f an Air Quality Index in major cities, will build support for air quality improvement initiatives and enable the issuance o f health alarms when necessary. Similarly, public information regarding drinlung water quality not only protects public health, but builds support for water supply investments, and most importantly, for the recovery o f operation and maintenance costs.
Empowering Civil Society: Public support for environmental compliance can be reinforced both by involv ing concerned c iv i l society stakeholders in environmental decision-malung and oversight, and by supporting public interest advocacy through legal associations and the establishment o f environmental l aw clinics at universities.
V

5.
12. problems as a high development priority. Rising to the challenge will require not only a strategic program o f capacity building, but also the establishment o f incentives to encourage improved performance in environmental management at a l l levels o f government.
Developing Prioritv Interventions for Capacity Building
This report finds compelling evidence for the need to address urban environmental
Incentive Based Partnerships: One approach to building capacity and encouraging improved environmental performance at different levels o f government i s t o develop incentive-based partnerships between the Federal and provincial EPAs, as wel l as between provincial authorities and local governments. These would link the transfer o f financial support with performance against indicators in agreed action plans, based o n local priorities set within NEP goals. T w o important pre-requisites for such an approach to function effectively are (i) the translation o f the NEP’s broad directions into specific targets, and (ii) the establishment o f an efficient system o f performance-based transfers, combining transparent decision-malung with the minimum number o f administrative hurdles.
Pakistan Clean Air Program: T h i s Program i s being developed by M o E as a vehicle to support a range o f initiatives for urban air quality management, involv ing a variety o f sectors, levels o f government and development partners. The complexity o f the issues to be addressed suggests that the PCAP might best be supported as a stand-alone program for capacity building particularly at the provincial and local level, complementing broader incentive-based partnerships for NEP implementation.
Managing Natural Resources: Over 60 percent o f Palustan’s population i s rural and depend on natural resources (agricultural soils, water, rangelands and forests) that are strained and degrading. Despite the economic significance o f these assets there i s a paucity o f accurate information that i s needed to guide effective policy interventions. A further priority i s to update and refine assessments o f the status and use patterns o f key natural resources in order to enhance their productivity and contribution to growth and development.
Possible Areas for World Bank Assistance
13. Based o n i t s current dialogue, the Wor ld Bank i s strategically placed to support these initiatives. Support for the NEP could focus o n providing technical assistance to M o E for the development o f provincial action plans. As action plans are defined, the Bank would consider investment support for their implementation. For implementation o f the PCAP, the Bank can provide technical assistance based on air quality management experience in other South Asian cities, with the possibility o f subsequent investment support as plans become more concrete. In addition to providing assistance for implementation o f the NEP and PCAP, the Bank also plans to support further analysis o f selected priority concerns in managing natural resources. Potential issues to be addressed include sustainable management o f land and water resources, with the focus o n long-term environmental sustainability dimensions, including newly emerging challenges o f global climate change, rangeland management, coastal zone development, as wel l as selective studies analyzing in more detail environmental priorities, institutions and future strategies at the sub-regional or local level.
vi

I. CONTEXT AND OBJECTIVES - ENVIRONMENTAL CHALLENGES TO GROWTH AND THE RESPONSE
1. Environmental Challenges to Growth
1. ambitious reforms resulting in an acceleration o f growth from 3.3 percent in 1997-2002 to over 6.5 percent during 2002-2005. Despite these achievements, social and natural resource indicators continue to demonstrate the daunting development challenges facing the country, and in particular the importance o f strengthening environmental management to reduce r isks to health and natural resource productivity, and to sustain economic growth.
Pakistan has achieved impressive macroeconomic results over the last five years, with
2. Pakistan’s infant and child mortality rates are the highest in the South Asia Region, with the prevalence o f childhood diarrhea and acute respiratory infections, both associated with poor environmental quality, the second highest. With more than one-third o f the population l iving in towns and cities, Pakistan i s the most urbanized country in South Asia, and exposure to urban and industrial pollution i s a rapidly growing concern. Overall, environmental health r isks are estimated to contribute more than 20 percent o f the total burden o f disease. At about 25% o f GDP, the contribution o f amculture to Palustan’s GDP i s close to the regional average, but the sustainability o f this production i s subject to greater environmental threats than in other South Asian countries. The irrigated share o f crop land (80 percent) i s almost twice the regional average, but nearly 40% o f this area i s water-logged, and 14 percent i s saline. Forest and rangeland production i s also at risk, with rates o f deforestation about ten times the regional average, and rangeland productivity estimated to be only one-third o f i t s potential, with up to 80 percent o f rangeland degraded.
3. Palustan’s environmental challenges, and the difficulty o f integrating sustainability criteria in the policy and planning processes, threaten the country’s poverty reduction efforts and long-term economic growth. The limits o f resource-intensive development are indicated by World Bank estimates which suggest that when the costs o f natural resource depletion, pollution and consumption o f fixed capital are factored in, gross national savings are cut by half. The linkages between environment and poverty through the impact o f environmental degradation on livelihoods, health and vulnerability are explicitly recognized in Pakistan’s Poverty Reduction Strategy Paper (PRSP), which was presented in December, 2003, and emphasizes sustained rapid growth as the basis for poverty reduction. While the legislative framework for environmental management i s largely in place, and many aspects o f the Government’s reform agenda can be expected to have positive environmental outcomes, the PRSP recognizes the urgent need to strengthen the capacity o f the institutions charged with i t s implementation.
2. The Response of the Government of Pakistan and Development Partners
4. Pakistan has made considerable progress in raising public awareness o f environmental issues, and establishing a regulatory and institutional framework for environmental management. Implementation o f the NCS over the period 1992-1 999 was supported by the World Bank through the Environmental Protection and Resource Conservation Project (EPRCP). Although the Project contributed to the development o f new institutions, the enactment o f environmental legislation, and the promotion o f environmental awareness and environmental education, the effectiveness o f the institutions and legal framework i s yet to be fully realized.
Since adopting the National Conservation Strategy (NCS) in 1992, the Government o f
1

5. mi l l ion a year. The midterm evaluation o f the N C S indicated that the average total investment in conservation for the period 1993-98 was about US$180 mi l l ion a year, or less than 20 percent o f the estimated need. In a further initiative to strengthen implementation o f the NCS, the National Environmental Action Plan (NEAP) was approved in early 2001. The NEAP was designed to provide direction for the Ministry of Environment by focusing on four core program areas: clean air, clean water, solid waste management, and ecosystem management. Whi le some additional capacity has been established at the federal level with the assistance o f UNDP, the NEAP project approval process was not integrated with the Government’s budgeting system, and as a result has not succeeded in mobil izing additional financial resources for environmental programs, and has not provided a strategic impetus for improved environmental management. Reflecting these shortcomings, the Palustan National Human Development Report published by UNDP in 2003 reiterated the need to strengthen systems and capacities in environmental management at a l l levels, in particular the professional capabilities o f the Federal and provincial Environmental Protection Agencies.
The NCS sought to double conservation-related investments to an average o f US$500
6. Medium Term Development Framework 2005-20 10 (MTDF), which was adopted in mid-2005. Finalization o f the MTDF coincided with approval o f a new and far-reaching National Environmental Policy (NEP), with the goal t o “. . .protect, conserve and restore Palustan’s environment in order to improve the quality of l i f e o f the citizens through sustainable development”, and establishing directions for water supply and management, air quality, waste management, forestry, biodiversity, energy efficiency, and agnculture. Most importantly, the MTDF incorporates a significant increase in the budget allocated for environmental management to support implementation o f the NEP.
The Government’s program for implementing the PRSP agenda i s embodied in the
7. management for sustainable growth that the Government o f Palustan and the Wor ld Bank have developed this Strategic Country Environmental Assessment (SCEA). As the Bank prepares a new Country Assistance Strategy, proposing a lending program o f up to US$1.5 b i l l ion per year in which fast-disbursing development pol icy lending may form up to ha l f o f the total, the SCEA i s intended to help ensure that efforts to support poverty-reducing growth and environmental management are mutually reinforcing,
It i s against this background o f important new commitments to strengthen environmental
3. Objectives of the SCEA
8. environmental concerns; (ii) assess the capacity o f the environmental institutions charged with addressing these concerns; and (iii) to propose initiatives and possible Bank support to help strengthen this capacity. The main audience for the SCEA i s governmental, in particular environmental and planning authorities at Federal and provincial levels, as wel l as Wor ld Bank teams seelung to strengthen environmental management capacity through development policy, sectoral and dedicated environmental operations.
The principal objectives o f the SCEA are to: (i) review the status o f selected high-priority
4. A Framework for Assessing Policy Effectiveness
9. What determines environmental outcomes? This report conceptualizes the problem as an environmental “production function” or process, where a multitude o f inputs interact to create an output - environmental quality. The f i rst and most obvious factor that determines environmental outcomes i s the level o f environmental pressure, which i s shaped by the scale, composition and efficiency o f economic activity. These impacts are mediated and influenced by government
2

ure I .l provides ;t sc
I
the environmental impact assessment system, (ii) urban air quality, and (iii) water supply and sanitation. In addition to their significant poverty and development implications, these issues were identified as areas with potential for high impact interventions, based on a consideration o f the mandates o f the federal and provincial environmental authorities.
12. The EIA system i s the most visible tool used to address environmental concerns in sectoral investments, and air quality and water pollution are prominent issues, particularly affecting the quarter o f Palustan’s population living in cities. The selective focus o f this report does not necessarily reflect the economic significance o f these environmental problems, but instead responds to the priorities identified at the launch workshop, and the prominence o f urban issues and the EIA process in public discourse.
1 13. Fol lowing the launch workshop, a team o f consultants was selected to lead the consultation process, data collection and analysis, and to prepare a draft report which was discussed at a National Stakeholder Conference held in May, 2005, in Islamabad. Prior to this Conference, provincial consultation were held in Lahore, Karachi, Peshawar, and Quetta, each involving a variety o f representatives f rom the private sector, c i v i l society and government. Following the National Stakeholder Conference, the consultants’ report was made publicly available on the website o f Pakistan Environmental Protection Agency. Drawing on the comments subsequently received, this final version o f the report has been prepared by the Wor ld Bank in close consultation with the Ministry o f Environment.
2
6 Structure of the Report
14. This report i s arranged in seven chapters. The following two chapters provide overviews. The f i r s t presents estimates o f the costs o f environmental degradation, and the second examines the institutions established to address these. The fol lowing three chapters examine in more detail the three focus areas selected during the consultative scoping process: the environmental impact assessment system, urban air quality, and water supply and sanitation. The final chapter o f the report draws together a set o f key recommendations, and proposes a way forward to apply these recommendations and strengthen environmental management in support o f sustainable economic growth.
I
AAB (Pvt.) Ltd. (httu://www.environnien t. aov.pk/
2
4

11. ENVIRONMENTAL ISSUES AND IMPACTS
15. ranging from coastal ecosystems, through deserts and flood plains to the mountains of the Himalayas and Hindu Kush ranges. Each o f these ecosystems has played a crucial ro le in providing the platform for economic development and growth. The rangelands which cover the bulk o f the landmass, sustain a growing livestock industry. The coastal zones o f Sindh are highly productive ecosystems, with over 200 species o f fish and a thriving shrimp industry. The forests are a valuable source o f timber and private vital ecological services that protect watersheds and maintain soil productivity. The waters o f the Indus have converted deserts and arid plains into productive farmland. As a result, agriculture remains the country’s principal occupation, accounting for over 60 percent o f exports and 25 percent o f GDP.
With i ts immense altitudinal variation Palustan spans a number o f ecological regions -
16. Accompanying this r i ch natural heritage i s a booming economy. Economic reforms have paid their dividend and the country has achieved record growth rates, buoyant levels o f investment and sustainable fiscal balances. Long term growth rates too have been reasonable and have averaged 2.6 percent since 1960, exceeding most other countries in South Asia. But this remarkable record i s blighted by other pressures. Poverty stubbornly persists, diseases are widespread and the natural resource base o n which the economy depends, i s stressed, threatening to undermine growth prospects. M a n y o f the environmental and developmental challenges facing Pakistan are common across the region and much o f the developing world. The decline in forest cover, degrading soils and rising levels o f air and water pollution are some o f the problems that Pakistan shares with i ts South Asian neighbors.
17. uniquely disadvantaged by i ts dependence o n a single river - the Indus - for i ts surface water. The country i s therefore more vulnerable to the consequences o f basin degradation and water pollution than any o f i t s neighbors. Agncultural growth i s further threatened by depleting soil fertility, degrading rangelands and encroaching deserts, whi le the coastal wetlands o f Sindh, deprived o f water, are losing their productive potential. An estimated 70 percent o f the population i s rural and relies heavily on natural resources for their livelihoods. Consequently, a degrading resource base directly affects poverty outcomes. In short, many o f the economic challenges facing Pakistan have their genesis in environmental problems.
But at the same time there are important differences. Palustan i s largely ar id and
18. poverty. A fragile and damaged resource base i s a major cause o f poverty: agricultural yields are lower on degraded land; as forests are depleted access to v i ta l l ivelihood resources declines. T o subsist the poor are compelled to mine and overuse the l imited resources available to them. This has created a vicious downward spiral o f impoverishment and environmental degradation.
In Pakistan, as elsewhere, environmental decay i s both a cause and consequence o f
19. The a im o f this chapter i s to chart the country’s environmental record, focusing o n the l inks between the environment and the economy. The fundamental message i s that neglect o f the country’s natural assets has come at a significant economic cost and addressing these problems would pay economic dividends - strengthening the growth potential o f the economy, reducing poverty and the incidence o f disease. The chapter provides estimates o f the economic costs o f environmental degradation, developed at the request o f the Government o f Pakistan at a workshop held in Islamabad. A comprehensive description o f the data, methodology and analysis i s provided in the Technical Annex to facilitate regular updating o f the economic dimension o f environmental degradation and promote greater research.
5

1. A Snap-Shot for Setting Policy Priorities
The Economic Consequences of Environmental Degradation
20. Pakistan’s environmental problems are a concern, not just because o f the intrinsic virtues o f promoting responsible environmental stewardship, but also because o f the economic consequences o f environmental degradation. Using conservative estimates this Chapter finds that the mean annual cost o f environmental degradation i s approximately 6 percent o f GDP. The costs are of a similar magnitude to the recent growth performance recorded in the National Accounts. The implication o f this continuing degradation i s that despite record GDP growth rates many development indicators continue to show limited improvement.
3
21. 365 b i l l ion Rs. per year or 6 percent o f GDP. This figure i s an approximation and i s based o n those parameters for which reasonable estimates are available. The contribution o f each source of degradation to this total i s indicated in Figure 2.1. The highest cost i s f rom inadequate water supply, sanitation and hygiene (Rs. 112 billion) followed by agricultural soil degradation (Rs. 70 billion) and indoor air pollution (Rs. 67 billion). Urban air pollution (particulate matter) adds another Rs. 65 billion. The estimated cost o f lead exposure i s about Rs. 45 bil l ion. Rangeland degradation and deforestation cost are the lowest at about 7 bi l l ion Rs. in total. These l o w estimates are somewhat misleading and reflect the lack of data that has led to partial estimation o f values and the already l o w productivity o f these resources. T o guard against overstatement, the estimates are based on conservative assumptions and therefore represent the lower bounds o f damage. They also omit several important categories o f loss - most notably fisheries and coastal zone degradation - for which there i s n o adequate data (Box 2.1). As a consequence calculations o f the relative share o f damage must be interpreted with the utmost caution since the magnitude o f total damages in unknown since the impacts o f natural resource degradation have been underestimated.
The mean estimated annual cost o f environmental and natural resource damage i s about
Figure 2.1: Share of Costs o f Environmental and Natural Resource Damages (Rs. Billion per Annum)
4.2,
70
E Water supply, sanitation
I3 Indoor air pollution
E Urban air pollution
0 4riculture (soil salinity and erosion)
0 Lead exposure
E Rangeland degradation
0 Deforestation
and hygiene
3 These estimates are based on a study commissioned to support preparation o f the SCEA, in response to a request from
MoE. The detailed study is attached as a Technical Annex.
6

22. Since water supply, sanitation and hygiene issues dominate the costs i t i s tempting to argue that policy efforts should focus on this sector. But this would be premature and does not necessarily fo l low f rom these findings. T o determine the optimum sequence o f interventions, expected pol icy benefits need to be compared with the anticipated costs. The aggregate estimates provided in this Report are the f i rst step in addressing this issue. The next task i s to identify and rank the returns f rom various pol icy investments. In practice policy priorities are guided by the need to accommodate diverse and often conflicting objectives. The information provided in this chapter i s a useful complement to the process and provides a rational and transparent basis for decision making.
Box 2.1: The Coastal Zone
The estimates in this study are partial and ignore a number o f significant environmental issues because o f limited data. Perhaps the most significant omission i s that o f the mangroves o f the Indus Delta. The interaction o f riverine and deltaic ecosystems created a r i c h resource base that has sustained coastal communities. But reduced r iver f lows have l e d to the intrusion o f sea water into the Indus Delta, rendering agricultural land barren, contaminating ground water and causing degradation o f the coastal eco-system. Satellite imagery shows a steady decline in the mangrove forests. In 1990 mangrove cover was estimated at 160,000 ha and by 2003 coverage had s h r u n k to 106,000 ha. Habitat degradation has resulted in a range o f economic losses, including the depletion o f fisheries, loss o f agricultural land and forests. Surveys conducted by IUCN in two districts o f Sindh (Badin and Thata) suggest that the human to l l has been substantial4 Sea water intrusion may have affected over 135,000 people and led to losses in excess o f $125 mil l ion. Despite the presumed scale o f the problem, there i s l i t t le accurate data o n the environmental and economic costs which can b e used to guide pol icy decisions. With growing water scarcity the country wil l face ever more dif f icult trade-offs between competing demands for water that need to be managed in ways that maximize benefits to the entire nation. Sound economic management calls for policies that factor in the full range o f externalities - social, economic and environmental.
Economic Growth and the Environment
23. a sustainable way, so it could be argued that environmental degradation i s the inevitable price to pay for economic success. This i s typically justif ied in terms o f an empirical regularity termed the Environmental K u n e t s Curve which shows that as countries develop, pollution intensity increases at f irst and then declines. I t would be misleading to assume that this empirical finding implies that environmental neglect i s an economically prudent development strategy. In many cases prevention or mitigation o f damage may be more cost effective than neglect. In the short run environmental interventions may lower profits or utilize scarce public funds, but these costs need to be compared to the associated benefits.
Economic growth i s the main vehicle for promoting development and reducing poverty in
24. interventions that mitigate environmental damage also help to convert growth into broader development benefits. T o illustrate the importance o f these issues, Figure 2.2 compares the relationship between income and infant mortality in Palustan to that o f other countries in the same income group. In i t ia l ly infant mortality rates in Pakistan were lower than the average for i t s income group, but thereafter Pakistan grew much faster than the other countries, but disappointingly i t lagged behind o n infant mortality. A similar pattern holds for other measures
Environmental degradation disproportionately affects the poor and vulnerable, hence
5
4
5 IUCN, 2003 Indus Delta, Pakistan: Economic Costs of Reduction in Freshwater Flows Paper # 5
All countries are ranked in order o f their level o f income in 1960, and the third lowest income group which has the similar level o f income to Pakistan i s taken as the “low income” countries.
7

o f environmental performance and development. For instance Pakistan’s rate o f deforestation between 1990 and 2000 has been greater than that o f other countries in i ts income group. What these examples illustrate is that development outcomes are a consequences ofpol icy choices and there i s n o assurance that a country can simply “grow-out” o f environmental problems. Put simply, any given amount o f growth can deliver higher development benefits if there are policies in place to address the negative externalities that impede progress, such as impacts on health and degradation o f the productive resource base.
Figure 2.2: Income and Infant Mortality
Trend o f Income and Infant Mortal i ty , Benchmark Countries and Pakistan, 1960- 2 0 0 3
I60
40 0 10 0 200 300 400 500 60
Per capita G D P ($US)
\ +Pakistan + Benchmark Countries
1
2. The Costs of Environmental Health R i s k s
25. growth. The most direct economic effect o f improved health i s in terms o f greater productivity and educational outcomes. A healthy population also frees up resources consumed by health care for other productive purposes. Economic growth i s the essential first step in poverty reduction, but it brings with i t environmental challenges that can impede and constrain the growth process. Air and water pollution, unsafe waste disposal, land degradation and the exposure to agro- industrial chemicals are among the leading causes o f illness and chi ld mortality in developing countries. All o f these hazards are preventable, often through simple and cost effective interventions.
Good health i s not only a crucial part o f well-being, but contributes directly to economic
26. over 20 percent o f the overall burden o f disease worldwide. This i s comparable to malnutrition and i s larger than al l other preventable risk factors. The vast majority o f environmental heath impacts are in developing countries where there i s a strong correlation between the level o f poverty and the environmental burden o f disease. The poor are exposed to greater environmental
The Wor ld Health Organization estimates that environmental health hazards account for
8

health risks because o f the surroundings in which they live, the lack o f basic services and their greater vulnerability due to malnutrition and inadequate health care. So poverty and illness reinforce each other, contributing to exclusion and economic deprivation.
27. contaminated water, urban air pollution and indoor air quality. Due to lack o f data the costs associated with hazardous waste and exposure to industrial and agncultural chemicals are not included. The health effects are presented in three forms: in terms o f the affected population, Disability Adjusted L i f e Years (DALYsf and economic costs. T o translate health effects into a monetary metric the Cost of Illness Approach i s used to measure the effects o f illness. The cost o f illness includes: medical costs, income lost and the “avoidance costs” associated with actions taken to prevent or mitigate the risks o f illness (e.g. boi l ing contaminated drinking water). Mortality impacts are monetized in two ways. Child mortality i s valued using the Human Capital Approach, which measures the discounted value o f income lost due to premature death. Adult mortality i s measured in terms o f the Value of Statistical Life using estimates f rom global studies, adjusted for income and exchange rates. B o x 2.2 provides a br ie f overview o f the methodological issues. T o guard against overstating damages, modest assumptions are used to parameterize impact and cost coefficients. The Technical Annex provides comprehensive details o f the damage estimates, assumptions and sources of data.
This chapter examines the health impacts f rom three major sources o f pollution,
The Health Effects of Water Quality, Sanitation and Hygiene
28. Classified as water stressed, the country uses almost al l o f i t s available water supplies in most years. Population growth coupled with the demands o f industrialization and urbanization are expected to create conditions o f absolute water scarcity in a few decades. Water shortages are compounded by water quality problems. Untreated pollutants f rom industrial, agncultural and urban sources are released directly into water bodies intended for human consumption, with litt le regard for assimilative capacity o f eco-systems. The result i s heavily polluted water around towns and cities and a high incidence o f disease, especially among the urban poor.
Palustan i s an arid country with low, unreliable rainfall averaging 250 mm a year.
29. quantity and quality o f potable water and poor sanitation facilities and practices are associated with a host o f illnesses such as diarrhoea, typhoid, intestinal worms and hepatitis. L imi ted by data problems this study focuses o n the two most common water related illnesses, diarrhoea and typhoid, and estimates that more than 1.6 mi l l ion D A L Y s are lost annually as a result o f death and disease due to diarrhoea, and almost 900,000 as a result o f typhoid. Diarrhoeal and typhoid
, mortality in children accounts for the bulk o f the losses, reflecting the vulnerability o f children to these diseases. F rom a pol icy perspective the more informative estimate i s presented in Figure 2.3 which summarizes the costs o f water related mortality and morbidity. The total health costs are estimated at Rs 1 14 billion, or approximately 1.8 1 percent o f GDP. Str ihng are the high proportion o f costs due to premature ch i ld deaths, followed by the mortality impacts o f typhoid in the older population.
The links between water quality and health risks are wel l established. Inadequate
6 DALYs are a standard measure that combine disparate health effects using a consistent common denominator.
DALYs adjust the years o f healthy l i fe lost to illness and premature mortality, with a weighting function that corrects for the impacts o f death and illness at different ages. Though DALYs provide a useful summary measure o f the physical effects o f illness and death, they provide l itt le information about the economic consequences o f ill-health.
9

Box 2.2: Measuring the Economic Impacts of Illness and Premature Death
The consequences o f morbidity and premature mortality are complex and varied. To make meaningful comparisons across diseases and r isk factors it i s necessary to aggregate these impacts using a common unit o f measure. DALYs (Disabil ity Adjusted L i f e Years) are the standard measure used t o bring disparate health effects to a common denominator. DALYs measure the years o f healthy l i f e lost t o illness and premature mortality, with a weighting function that adjusts for the impacts o f death and illness at different ages.
Whi le D A L Y s provide a useful indicator o f the effects o f illness and premature death o n physical well- being, they provide l i t t le information o n the economic impact o f diseases. Mor ta l i ty and morbidity impose costs o n individuals, households and society at large. These include the direct costs o f illness such as expenses related to clinical visits, hospitalization, treatment and care giving. In addition there are indirect costs f r o m loss o f earnings and impaired productivity. These are termed the costs o f illness and are relatively simple to compute. Medica l costs are calculated by determining the type o f treatment provided and the associated costs. Earning losses can be determined using the H u m a n Capital Approach wh ich calculates the discounted value o f income lost through either sickness or premature death. Further adjustments can be made for the unemployment rate to reflect the probabil i ty o f obtaining paid work.
However, illness and premature death also impose more subtle and less visible forms o f economic loss. Fo r instance workers generally demand higher wages for riskier jobs, o r they may purchase safety equipment to reduce the risk o f death and injury. Alternatively individuals often take costly averting actions (e.g. install ing water filters in homes) to minimize health r isks. These examples demonstrate that individuals routinely trade income for outcomes that lower the r i s k s o f mortal i ty and avoid the pain suffering associated with illness. A number of approaches have been developed to measure these losses. One method termed the hedonic wage approach infers r isk premiums f r o m observed differentials in wage rates. Another approach, that i s more relevant t o environmental health studies, i s termed the contingent valuation method and uses surveys to elicit preferences for avoiding illness, death and pain. The cost o f illness approach ignores these values and therefore underestimates the economic consequences o f premature mortal i ty and morbidity. I t should therefore b e treated as the lower bound o f the true costs o f premature mortal i ty and morbidity.
Unfortunately, most hedonic and contingent valuation studies have been conducted in developed countries where data i s more widely accessible. There are n o estimates available for Pakistan. Under these circumstances it i s common to transfer the estimate f r o m one country to another, after making appropriate adjustments for differences in income, exchange rates and other relevant factors. The key concern in transferring values across countries relates to income differences. Economists treat health as a normal good which implies that the willingness to pay for good health rises with income and wealth. Hence estimates transferred f r o m high to l o w income countries need to b e adjusted for differences in income. Income elasticity i s the measure used to capture variations in the demand for health across income levels. A number o f studies fmd that an income elasticity o f 0.4 should b e used to transfer estimates f r o m one country to another. This implies that a 1 percent reduction in income induces a 0.4 percent decline in the demand for health outcomes. To guard against exaggeration, th is report uses a more conservative income elasticity o f 1, which implies that the decline in the demand for health is proportional t o income changes.
Further complications arise in transferring the societal losses from the death o f children f rom one country to another. There i s l i t t le consensus o n the appropriate adjustment factor. Taking a conservative approach this report values the economic losses f r o m premature ch i ld mortality simply in terms o f the loss o f future income. This clearly underestimates the true economic losses, but has the advantage o f precluding overstatement o f damages.
10

Figure 2.3: Estimated Costs from Water-Related Mortality and Morbidity (Rs. Billion per Annum)
L1 Time loss (morbidity) from diarrhea and typhoid
I Mortalityfor children under 5 from diarrhea and typhoid
Mortalityfor population over 5 years of age from typhoid
Cost of bottled water to awid diarrhea
0 Cost of boiling water to avoid diarrhea
Cost of Hospitalization and medication due to diarrhea and typhoid
Urban Air Pollution
30. With an estimated 35 percent of its population living in cities, Pakistan i s the most urbanized country in South Asia. I ts cities continue to grow, offering employment opportunities, amenities and facilities not found elsewhere in the country. But rapid urbanization has been accompanied by environmental problems such as pollution, waste management, congestion and the destruction o f fragile ecosystems. Urban air pollution remains one of the most significant environmental problems facing the cities. A substantial body o f research demonstrates that high concentrations o f suspended particulates adversely affect human health, provolung a wide range o f respiratory diseases and heart ailments. The most hazardous are fine particulates o f 10 microns in diameter (PM10) or smaller. Worldwide, fine particulates are implicated in 500,000 premature deaths and 415 mi l l ion new cases o f chronic bronchitis.
7
3 1. In urban Palustan, as elsewhere, the major sources o f fine particulate pollution are vehicles, combustion o f fossil fuels in factories, and power plants. The problem i s aggravated by an aging fleet o f vehicles in poor mechanical condition and l o w levels o f fuel efficiency. Over the past decade the number o f diesel trucks in major cities has increased dramatically, creating an additional source o f pollution. Though many cities are adversely affected, air quality monitoring i s restricted to the six major cities: Karachi, Lahore, Islamabad, Peshawar, Quetta and Rawalpindi. Ambient concentrations o f particulates in these cities l i e consistently above Wor ld Health Organization guidelines, and are on average two to four times the recommended levels (the detailed data are presented in Figure 5.1).
32. Most o f Palustan’s urban population lives in cities where air quality i s unmonitored. Excluding these cities f i o m the analysis o f health impacts would clearly represent a serious omission. T o address this problem PMlO concentrations are estimated using a Wor ld Bank model o f particulate emissions. T w o sets o f estimates are presented, t o capture the potential imprecision o f the forecast values.
7 WHO

33. An exposure-response relationship exists between concentrations o f particulates and health outcomes. The health impacts identified in this report are based on epidemiological assessments recommended by the Wor ld Health Organization and include chronic bronchitis, mortality caused by a higher incidence o f lung cancer, cardiopulmonary and respiratory problems. The annual health effects o f ambient particulate air pollution are presented in Table 2.1. Urban air particulate pollution i s estimated to cause around 22,000 premature deaths among adults and 700 deaths among young children. The total health costs are between Rs 62-65 bil l ion, or approximately 1 percent o f GDP.
Table 2.1: Annual Cost of Urban Air Pollution Health Impacts (Billion Rs.)
I I I
34. estimated 60 percent, followed by respiratory symptoms. premature mortality, which i s consistent with evidence f rom other assessments that find adults to be more vulnerable to respiratory symptoms and in greater danger o f lung cancer.
Figure 2.4: Annual DALYs Lost due to Urban Air Pollution
In terms o f annual DALYs lost, as indicated in Figure 2.4, mortality accounts for an The bulk o f losses are due to adult
I 7,178
163,432
~
22,385
rn Premature mortalityadults
Mortalitychildren under 5
rn Chronic bronchitis
0 Hospital admissions
Restricted actiwtydays
Lower respiratory illness in
Respiratorysynptoms
children
12

Airborne Lead Pollution
Mortality: Cardiac, ischaemic, hypertensive, cerebrovascular Morbidity: Gastrointestinal effects
35. Airborne lead i s one o f the most harmful particulate pollutants. Young children are especially vulnerable since lead poisoning causes learning disabilities, hearing loss and behavioural abnormalities. In adults lead absorption i s responsible for hypertension, blood pressure problems and heart disease. Lead exposure can come through breathing and ingesting lead particles. The original sources o f lead can include leaded gasoline, industrial lead emissions to air, water, and land (e.g., f rom smelters), leached lead f rom lead pipes carrying drinking water, contaminated food, lead paint, and pottery. Once in the environment, lead accumulates in soil and water. Significant amounts o f lead were added to gasoline (0.42 g/1 in regular gasoline and 0.84 g/1 in high octane gasoline), until, recognizing the gravity o f the problem, the government intervened to ban lead f rom gasoline. In 200 1-2002 a l l major refineries announced that they would move to production o f lead free gasoline (Paul et al, 2003). However the health impacts will persist for several decades as lead deposits accumulated in soils and water tend to dissipate slowly over time. As a result numerous studies in Pakistan report elevated levels o f lead in blood samples.
8
9
Loss 1114 21095
660000 121,896
36. Table 2.2 presents the mortality and morbidity impacts attributable to lead exposure. The incidence o f gastrointestinal disease i s highest, followed by anaemia, but it i s the impact on IQ that i s most troubling. Since IQ loss i s irreversible, it deprives thousands o f children each year o f opportunities, lowers productivity and earning capacity and imposes high human and economic costs o n the country.
Anaemia - children Anaemia - adults
Table 2.2: Annual Attributed Incidence of Lead Exposure
1 Cases I DALYs 11
4,225 I 500000 655000
Cardiovascular disease - adults Mild Menta l Retardation - children
21095 170000 177940
Table 2.3: Annual Health Cost due to Lead Exposure (Billion Rs)
Total cost Mild mental retardation IQ loss children 28-42
GI effects children 260.12
8 International experience suggests a 39 percent decrease o f lead in blood over 5-year period, or 7.8 percent annually. Hence 0.078 i s the correction factor that i s applied in this study to reflect annual reduction o f lead concentration in blood starting in 2002. (White et al, 2001, Rahman et a1 2002)
9
13

37. between Rs 38-52 bil l ion a year, or about 0.7 percent o f GDP. I t should be emphasized that these are highly conservative estimate based on modest assumptions and restricted to the populations o f the major cities (36.2 mil l ion inhabitants). If the exercise were extended to the entire affected population o f the country, the health losses would likely double.
Table 2.3 translates these impacts into monetary costs. The total economic burden i s
Acute Respiratory Illness: Children (under the age o f 5 years) - increased mortality Children (under the age o f 5 years) - increased morbidity Females (30 years and older) - increased
Indoor Air Pollution
Estimated Number of Estimated Annual Cost Cases (Million Rs)
Low High Low High
21,933 3 1,060 27.83 39.40
29,508,800 41,788,200 4.26 6.03
10,754,600 15,229,800 2.04 2.89
38. Indoor air pollution i s a serious problem in Palustan. The use o f traditional biomass fuels such as wood, dung and crop residues i s widespread across the country. According to the 1998 Palustan Census 86 percent o f rural households and 32 percent o f urban households rely on these as their primary coolung fuel. Biomass burnt in poorly ventilated homes has severe health consequences, particularly for women, young children and the elderly who are most likely to be exposed to indoor pollutants. Several studies have shown strong associations between biomass combustion and an increased incidence o f chronic bronchitis and acute respiratory infections. Evidence i s also emerging o f linkages with tuberculosis, asthma, cataracts and low birth weights, though further research i s needed to quantify the magnitude o f these impacts.
morbidity Chronic obstructive pulmonary disease: Adult females - increased mortal i ty Adult females - increased morb id i ty Total
39. concentration o f each pollutant, the mix o f pollutants and the levels o f exposure. this uncertainty a range o f damage estimates are presented. Table 2.4 presents the estimated annual health impacts. Indoor air pollution accounts for over 28,000 deaths a year and 40 mill ion cases o f acute respiratory illness. Total annual cost o f indoor air pollution i s estimated at Rs 55- 70 billion, with a mean estimate o f Rs 62 bil l ion or approximately 1 percent o f GDP. Indoor air pollution clearly represents a significant economic burden and remains an issue that warrants considerably greater policy and analytical attention than i s currently given to it.
Research suggests that the health effects o f indoor air pollution vary and depend on the To capture
10
7,408 1 1,433 25.84 25.84 21,850 33,721 0.12 0.18
60.08 14.34
3. The Costs of Natural Resource Degradation
40. the natural resource issues confronting the nation. The country has a total area o f 79.61 mil l ion
Pakistan’s location at the cross roads o f the tropics, deserts and mountains shape many o f
10 (Desai et a1 2004)
14

11 hectares, 70 percent o f which i s classified as arid and therefore vulnerable to desertification. Despite l o w and unreliable rainfall, 27 percent o f the land i s under cultivation and 60 percent i s classified as rangelands.
Pakistan Turkey Iran
41. Agricultural expansion has been fueled by the country’s vast irrigation network. There have been two major epochs o f productivity growth. The f i rs t phase was marked by the Green Revolution where growth was propelled by the introduction of high yielding varieties and new technology. T h i s was followed by an era o f intensification, where productivity increases were driven by higher fertilizer, pesticide and water use. Despite the dramatic increases in productivity, by global standards Palustan’s performance has not been exceptional. Whi le acknowledging that yields are the product o f a host o f factors - including geography and pol icy - the international comparisons in Table 2.5 are instructive in revealing Pakistan’s relative ranlung. For instance, Egypt, with broadly similar ago-climatic conditions has yields that are three times higher.
2325 2262 2033 2075 1703 1984
Table 2.5: Wheat Yields (Kwectare)
Egypt 6006 Mexico 4766 5100 China 3806 3777 India 2708 2770
42. and fertility loss) coupled with the pressures o f industrialization have placed physical limits on the ability t o expand cropped area and there i s l i tt le prospect o f increasing cultivable land. Estimates suggest that about 40 percent o f irrigated land has been affected by either salinity or water logging. Paradoxically in a country where water scarcity i s a problem, there i s strong evidence that agncultural yields decline with water availability. This i s illustrated in Figure 2.5 which shows that, excluding the drought years o f 2000 - 2002, agricultural productivity in Sindh i s inversely related to the amount o f the canal water released. This i s a direct consequence o f over-watering. The supply driven irrigation system encourages farmers to irrigate when water i s made available, rather than when it is needed. Since irrigation fees are l o w and unrelated to consumption, there i s a tendency to use al l available supplies. The consequence i s an increase in waterlogging, damage to soil structure and a reduction in productivity.
The nation confronts a receding land frontier. Land degradation (salinity, water logging
43. f rom 1984-85 (a normal year) and 2000-01 (a drought year) shows that the y ie ld o f some crops (notably wheat) in Punjab increased during the drought year. Production function analysis o f wheat output across Sindh in 1997-98 reveals a similar trend.” The analysis finds that the productivity o f irrigation varies substantially across farms in Sindh with “partial elasticities” o f water ranging f rom a l o w o f -0.2 to a high o f 0.59. T h i s implies that on some farms additional watering would lower output by about 20 percent, while on other water-constrained farms
Evidence f rom other sources corroborates this general pattern. Satellite images acquired
11
12 IUCN (2002). Husain, I, F Marikar and W Jehangir, 2001, Productivty and Per$ormance ofIrrigated Wheat Farms across Canal
Commands in the Lower Indus Basin.
15

increased irrigation would raise output by about 59 percent. The conclusion to be drawn from the evidence i s clear. Reallocating water f rom the profligate to the productive users would confer multiple benefits - reducing the incidence o f waterlogging and increasing agncultural productivity. L imited by data availability this study does not provide estimates o f the losses due to sub-optimal water allocations, or the consequent impacts o n the coastal zone. Instead the focus i s on agricultural losses from salinization, soil erosion and rangeland degradation.
50 -
k 4 0 -
30 -
U
- m 5 20- 0
Figure 2.5: Agricultural Productivity Declines with Canal Releases in Sindh
0 0.5 1 1.5
Productivity Effect
Canal Releases and Productivity i 601
@‘ 2000-0 ought years
Source: World Bank calculations f rom Pakistan Agricultural Statistics
Salinity Impacts
44. Palustan has naturally saline soils, but the problem has been compounded by consistent mismanagement o f irrigation and human induced soil erosion. Official statistics indicate that over 25 percent o f irrigated land suffers f rom various levels o f salinity, with over 1.4 mi l l ion hectares being rendered uncultivable due to excessive salinity levels. Salinity imposes direct economic losses, through reduced yields and less visible indirect losses through changes in farming practices or the cropping mix. These impacts are approximated by the value o f “lost” output related to salinity. T w o sets o f estimates are presented to account for plausible (though no t optimal) adjustments to cropping patterns in response to salinity. The total annual cost o f y ie ld reductions f rom salinity i s estimated at Rs 15-55 bil l ion. Including lost opportunities f rom cropping on the 1.4 mi l l ion hectares o f land with high salinity level adds a further Rs 10-18 thousand per hectare. mean cost o f Rs 55 billion, or 0.9 percent o f GDP in 2004.
Salinity i s one o f Pakistan’s most serious problems. Common to other arid regions,
13 This brings the total estimated cost o f salinity to Rs 30-80 billion, with a
Groundwater Changes
45. major surface irrigation areas, groundwater levels init ially rose, contributing to salinity and water- logging problems. Increased efforts in abstraction o f groundwater to manage this concern also led to the widespread use o f the better quality groundwater to complement surface irrigation. This informal conjunctive use has been a major contributor to agricultural output but i s n o w also
Issues related to groundwater are becoming increasingly urgent and complex. In the
13 Dost (2002).
16

2
47. 'S'he cstin1
17

Rangeland Degradation
48. Rangelands cover the bulk o f the arid and semi-arid zones which are characterized by l o w precipitation and extremes o f temperature. The natural productivity of these pastures i s generally l o w and they remain vulnerable to desertification. Livestock are an integral part o f the rangeland economy. In the Northern provinces pastoralism i s the only l ivelihood option, and i s the principal source of income accounting for over 90 percent o f household income. In regions where agro- pastoralism i s the main farming activity, the contribution o f livestock varies f rom 30-70 percent.
49. abating. However there i s clear evidence that the carrying capacity has been exceeded in most ranges. Overstoclung and overgrazing leads to soil compaction, and the removal o f vegetation, rendering the soil vulnerable to subsequent wind and water erosion. An FA0 survey based o n satellite imagery classified 85 percent o f the total rangelands as degraded. In addition there has been a substantial reduction in rangeland as areas have been transformed f rom grazing commons to unproductive deserts. The most substantial reduction o f rangelands occurred in the Northern Areas and Balochistan in 1992-1997. In absolute terms rangelands in Balochistan suffered the greatest decline o f 3.6 mi l l ion hectares as result of desertification and denudation o f vegetation f rom drought and continuous overgrazing.
The livestock population has doubled since 1975 and this trend shows litt le s ign o f
50. approximate Rs 3.6 to 5.4 b i l l ion per year. This amount may seem modest when compared to other environmental damages, but there are three important issues which suggest that this estimate grossly understates the development and strategic significance o f the rangelands. First the rangelands are home to among the poorest o f the country’s population, so that the impact o f pasture loss i s highly regressive, fall ing disproportionately upon the rural poor. The rangeland population i s also highly exposed to natural disasters such as droughts and floods that can lead to absolute destitution. As a corollary, policy interventions that improve rangeland productivity, and so provide a buffer against natural disasters, y ie ld a high poverty dividend. Second, much o f the degradation o f the rangeland i s irreversible. T h i s implies that production losses are suffered in perpetuity and therefore considerably higher than the figures recorded here.
Losses o n the rangeland are valued in terms o f the reduction o f fodder y ie ld and
5 1. rangelands. In the past, traditional rules and practices assured sustainable use o f pastures, but these practices have now largely disappeared as a result o f population pressures and other changes. Public interventions o n the rangelands have been sporadic and solutions to the problem have remained elusive. This i s not surprising since the most degraded lands are in hostile and inaccessible territory. Research finds that poverty and environmental degradation are seldom the direct causes o f conflict, however, poverty makes conflict relatively more attractive than seelung negotiated peaceful solutions. Consequently, economic factors aggravate existing (social and political) tensions, tipping the balance towards conflict. The dilemma for policy makers i s that rangeland degradation creates poverty and thus fuels hostility. This in turn renders interventions ineffectual, suggesting the need for placing a higher pr ior i ty o n the causes and consequences o f rangeland degradation, particularly in regions prone to conflict.
Third, even this adjustment does not fully account for the economic significance o f the
52. Table 2.6 summarizes the estimated losses as a result o f salinity, soil erosion and rangeland degradation considered above. The mean estimate o f the combined losses exceeds Rs. 74 b i l l ion annually, equivalent to more than 1 percent o f GDP.
18

Table 2.6: Estimated Annual Cost of Agricultural Losses from Soil Salinity, Erosion and Rangeland Degradation
Salinity Costs Soil Erosion Rangeland Degradation Total Loss
Total Loss (billion Rs) Low Mean H igh 30 55 80 15 15 15 3.6 4.2 5.4 48.6 74.2 100.4
Forests
53. Forests occupy a relatively small proportion o f the land area in Pakistan (some 3 - 5 percent), but nevertheless play a v i ta l ro le in the country’s economy. Forests remain an important source o f fuelwood, grazing land, l ivelihood and government revenue. Forests also provide multiple ecological-services such as watershed protection, soil conservation, biodiversity habitat and play a vital role in assuring eco-system resilience (i.e. stability). However, there i s insufficient information to estimate the full economic value o f the country’s forests, and the estimates provided here are based o n assessments drawn f rom studies in other countries.
54. statistics indicate that forest cover has accelerated rapidly since 1999, with regeneration rates in excess o f 5 percent. However, commentators observe that these figures seem high and exceed the regeneration rate o f most indigenous forest species. This Report does not contribute to this debate and instead uses the data provided by the Natural Forest Resource Assessment (NFRA). Whi le this seems closest to globally accepted definitions and classifications, the data o n forest cover used in this Report are not the same as those published by the Government.
55. The NFRA classification shows that forest cover i s declining in Pakistan. estimated deforestation rate over the 1990-2005 period i s 2.1 percent or 47 thousand hectares annually. Forest types included in this definition o f forests are coniferous forest, riverain and mangrove forest. It i s estimated that the most valuable coniferous forest i s declining at the rate o f 40,000 hectares annually. Northern Areas and NWFP have the highest annual rates o f deforestation (about 34,000 hectares in Northern Areas and 8000 hectares in NWFP). Riverain and mangrove forests are also decreasing at the rate o f 2,300 and 4,900 hectares annually. This i s an alarming rate given the quite high ecological value o f these types o f forest.
Data on forest status in Pakistan vary significantly and are highly controversial. Some
15 The
56. to 334 mi l l ion per annum, as summarized in Table 2.7. The direct use values, reflecting local private forest losses, include the losses f rom sustainable logging, non-timber products, tourism and recreation. The relatively l o w figure for deforestation losses i s due to the omission o f a wide range o f forest services related to non-use values for which plausible data are unavailable. Small aggregate losses also reflect the l o w level o f forest cover. This o f course does not imply that interventions are unwarranted and uneconomic. The effectiveness o f policies needs to be determined by comparing the cost o f investment to the marginal benefits.
Using this classification, the estimated costs o f deforestation in Palustan are between 206
15 NFRAS (2004).
19

Table 2.7: Costs of Annual Deforestation (Million Rs)
F O R E S T SERVICES
4. Global Comparisons of Environmental Sustainability
57. Having assessed the costs o f degradation in Pakistan it i s instructive to compare the overall environmental performance with other countries. A number o f environmental sustainability indices have been developed to facilitate this process. The most comprehensive and widely quoted measure i s the Environmental Sustainability Index (ESI), a collaborative venture o f the Yale Center o f Environmental L a w and Policy and CIESIN at Columbia University. ES I i s a composite index o f 21 indicators that cover five broad categories o f environmental pressure. As with any other aggregate index, the E S I i s not without i ts shortcomings. Given the lack o f information in many countries, the ranlungs are an approximation o f sustainability, based on an aggregation o f a wide array o f indicators.
16
58. for a country with a l o w level o f industrialization and sparse population, consequently facing l imi ted ecological stress. In contrast, as a result o f high population density, a pollution intensive industrial structure, a vulnerable natural resource base, and l imi ted capacity to mitigate environmental stress, Palustan scores the lowest ES I in South Asia. I t should be emphasized, however, that the E S I lacks precision in ranlung closely clustered countries. Nevertheless, the large disparity between Bhutan and Sri Lanka’s score o n the one hand, and that o f Palustan, India and Bangladesh on the other, i s sufficient to indicate that Bhutan and Sri-Lanka are o n a more sustainable growth trajectory than most o f their South Asian peers.
Among the countries o f South Asia, Bhutan scores the highest ESI, which i s unsurprising
59. and so assumes that environmental stresses are uniform in their impact across countries. The problem with this approach i s that countries vary in their vulnerability to different environmental pressures. In some countries water scarcity may be a more pressing constraint, while in others ecosystem loss may be a more significant problem. Consequently, the E S I scores are more revealing if used to benchmark the performance o f countries facing similar environmental problems and constraints. Tables 2.8 and 2.9 divide countries into two possible categories that include Palustan - vulnerability to desertification and high population density.
A further weakness o f the E S I i s that i t gives an equal weight t o a l l i ts sub-components
60. Table 2.8 shows that Pakistan remains relatively more susceptible to land degradation than most nations in the arid-zone category. This vulnerability reflects not only the country’s water scarcity, but i t s ability t o cope with the problem. For instance, Israel and Oman l ike
16 The subcomponents measure performance in the following areas: (1) Environmental Systems, (2) Reducing
Environmental Stresses, (3) Reducing Human Vulnerability to Environmental Stresses, (4) Societal and Institutional Capacity to Respond to Environmental (5) Challenges, Global Stewardship.
20

Pakistan are water stressed, but their higher E S I scores indicate: (i) that they face fewer additional environmental pressures, such as salinity, water logging, or uncontrolled pollution; and (ii) a greater capacity to address environmental stresses.
61. Table 2.9 compares the E S I scores o f countries with a high population density. Pakistan lies in the lower ha l f o f the distribution. Somewhat surprisingly the E S I scores o f India, Sri Lanka and Nepal appear in the upper quartile. Whether judged in terms o f regional performance or environmental stress factors, the aggregate sustainability indicators suggest that Pakistan faces a number o f environmental challenges that could undermine the sustainability o f its remarkable economic performance.
Table 2.8: Desert Countries (2 50% land classified as desert)
Table 2.9: Densely Populated Countries (2 100 persons per km2)
5. Conclusions: Environmental Degradation as a Constraint to Growth
62. eventually translates into socio-economic problems which retard development and growth. There i s a need to address environmental issues through policies and institutional reforms that create the right incentives for administrators to effectively enforce policies, and for polluters to comply with regulations. In the short term this may increase costs and utilize public funds that could be spent o n other development concerns. Fo r instance, controlling emissions will raise production costs, and protecting rangelands will uti l ize scarce public funds. These costs need to be balanced against the benefits o f reducing environmental risks - lower pollution brings health benefits and protecting the rangelands increases the resilience and earning capacity o f pastures. This calls for regulations and incentive structures that balance benefits and costs, and maximize the sustainability and growth potential o f the economy.
A clear conclusion that emerges f rom this review i s that environmental degradation
63. decision making at the macroeconomic, provincial and sectoral levels. In addition, informed and strategic policy malung i s not possible without information on critical issues, so improving the
For this to be achieved, environmental governance must be fully integrated into economic
21

information database in key environmental sectors, and enhancing the dissemination o f this information, should be a high policy priority.
64. o f this report attempt to identify the binding constraints o n environmental performance in Pakistan in terms o f institutional design, the regulatory structure, administrative capacity, and accountability. At the outset, two important qualifications are in order. First, data on environmental institutions remain sparse, so the analysis and conclusions are necessarily qualitative. Second, many o f Pakistan’s environmental problems have a long history, so instant solutions are unlikely to be possible, even if there were complete reform o f the environmental sector. As this chapter has demonstrated, however, delays in intervention have costly consequences for economic growth and the well-being o f the poorest.
Based on the conceptual framework presented in the f irst chapter, the following chapters
22

111. INSTITUTIONS FOR ENVIRONMENTAL MANAGEMENT: CLOSING THE LINKS IN INSTITUTIONAL DESIGN AND
STRENGTHENING CAPACITY 65. degradation and deforestation are widespread. Consequently there i s broad consensus at both the national and provincial levels that there i s an urgent need to address environmental problems. why then has it been so diff icult t o bring about the reforms needed to improve environmental performance? To answer this question, this chapter adopts the environmental production framework outlined in Chapter I. It begins with a br ie f review o f the environmental legal and policy framework. I t then assesses the design, mandates and resources of the key institutions with environmental responsibilities, principally in relation to the management o f the impacts o f urban and industrial growth.
Environmental degradation i s highly visible in Pakistan - air and water pollution, land
66. This chapter suggests that the key performance constraints are not primarily a consequence o f inadequate legislation or insufficient funding, but rather are the result o f a few key weaknesses in institutional design combined with l o w capacity to apply available resources. In particular, this assessment concludes that the lack o f guidelines for oversight o f environmental authorities delegated from Federal t o provincial agencies i s an important missing link in the institutional design. The potential availability o f significant development resources for environmental programs presents a golden opportunity to forge such links between levels o f government by providing resources for unfunded mandates, and developing incentive-based partnerships that would tie funding to the monitoring o f performance and outcomes in the implementation o f national laws and environmental policies. In turn, such funding would al low environmental agencies to overcome a shortage o f qualified staf f by outsourcing a range o f technical tasks. At the same time as these key constraints are being addressed, this chapter also notes that opportunities exist to strengthen current mechanisms for the mainstreaming and upstreaming o f environmental concerns, and to support the judiciary and c i v i l society organizations in enforcing environmental commitments.
1. Legal and Policy Framework: the Basis o f Institutional Design and Direction
After more than two decades o f experience with environmental legislation and policy development, Pakistan’s environmental management framework i s relatively mature. Despite this experience, however, significant aspects o f institutional design and pol icy direction remain to be resolved, in particular related to the delineation o f authorities, and the promotion o f local and mainstream initiatives. This section identifies the principal elements o f the framework, and concludes that while a relatively comprehensive legal and pol icy framework has evolved, there remain institutional obstacles to i t s effective application, which are discussed in more detail in the fol lowing sections.
The Legal Framework: Concurrent Responsibilities and Delegated Authorities
67. l is t o f subjects for the Federal and provincial legislatures. “Environmental pollution and i s included in the concurrent legislative list, which means that both the federal and provincial governments have constitutionally mandated responsibilities for the management o f pollution and natural resources. This i s a significant recognition o f the shared governmental responsibility for environmental protection, but it also raises important questions regarding the proper alignment and coordination o f these roles and responsibilities.
The Fourth Schedule o f the Constitution o f Pakistan establishes the concurrent legislative
23

68. Ac t o f 1997 (PEPA) which superseded the Palustan Environmental Protection Ordinance o f 1983. The Act establishes the general conditions, prohibitions, and enforcement for the prevention and control o f pollution, and the promotion o f sustainable development. The A c t also establishes and delineates the powers and functions o f the Pakistan Environmental Protection Council (PEPC), Palustan Environmental Protection Agency (Pakistan EPA), provincial Environmental Protection Agencies (EPAs), and Environmental Tribunals. In particular, the A c t creates the authority for delegation o f environmental management functions to the provincial EPAs. Nothing in the A c t prohibits provincial governments f rom adopting more stringent standards or regulations. The juxtaposition o f the concurrent environmental responsibilities established in the Constitution with the Federal authority to delegate environmental management functions established in the PEPA creates a tension in institutional design which i s yet to be fully resolved.
The cornerstone o f environmental legislation i s the Pakistan Environmental Protection
Environmental Policy: Moving towards Demand-Driven Approaches and Mainstreaming
69. environmental pol icy for Palustan and a Mid-Term Review o f i t s achievements, impacts, and prospects was undertaken in 2000. The Mid-Term Review concluded that the achievements under the NCS have been pr imari ly awareness raising and institution building, and that future initiatives should emphasize improvements in implementation capacity. One of the specific recommendations was to “switch the NCS from a top-down and supply-driven approach to a bottom-up demand driven approach” and thereby foster the development and strengthening o f local institutions and the empowerment o f user groups to build sustainability. T h i s N S C policy shift signals a growing emphasis on the need to develop the capacity o f provincial and local governments for environmental management and the need to empower sectoral interest groups and c iv i l society in the decision-making process.
The National Conservation Strategy (NCS) was adopted in 1992 as the guiding
70. program objective o f alleviating poverty through environmental projects. Starting at the federal level, a gradual integration o f the programs at the provincial and local levels was envisioned. Whi le some capacity has been built at the federal and provincial level, the NEAP has yet to fully realize i t s objectives.
The National Environmental Act ion Plan (NEAP) was adopted in 2001 with the stated
7 1. guidelines to the federal, provincial, and local governments in addressing environmental concerns and cross-sectoral issues such as poverty, health, trade, and local governance. T o achieve i t s policy objectives, the NEP directs MoE, provincial and local governments to develop plans for i t s implementation. The NEP provides an opportunity to strengthen relationships between Federal, provincial and local governments for environmental management, adopt innovative governance approaches, and incorporate performance measures in the implementation o f agreed programs.
The National Environmental Policy (NEP) was adopted in 2005 and provides broad
2. Institutional Design: the Vertical Division of Responsibilities
72. Under the PEPA, the Federal government has the authority t o delegate any o f i t s environmental management functions and powers to provincial governments, government agencies, or local authorities. Provincial governments in turn may delegate powers to any lower- tiered government agency. This provision establishes a framework for environmental federalism within which environmental management responsibilities are shared among Federal, provincial and local governments. Environmental federalism i s built on the bel ief that governance i s strongest when implemented at the level closest to the beneficiary, and i s further promoted in Pakistan by the Local Government Ordinance o f 2001, which introduced a new system o f local
24

government aimed at promoting responsibility at the local level. According to this Ordinance, rural and urban local councils are responsible for “the prevention o f pollution o f water or land from such sources and in such manner as the by-laws may provide.”
73. agency include pol icy development, standard setting, environmental research, and the oversight o f federally delegated programs to ensure the enforcement o f national laws and policies. Conversely, environmental issues requiring knowledge o f local environmental, economic, and social conditions can best be made by those closest to the problem. These issues will involve environmental assessments, permitting, and enforcement, which consequently should be delegated to the provincial and local agencies for decision-making in most cases. functions such as information management, public outreach, and compliance assistance should be included in the organizational structure for a l l agencies, but the national agency may be required to play a greater role particularly where provincial and local authorities have limited technical capacity or resources.
Under environmental federalism, appropriate functions for a national environmental
17 Supporting
74. Implementation o f environmental federalism poses the double challenge o f defining rules for oversight, and o f building the capacity necessary to fulfill delegated responsibilities. To date, these challenges remain largely unmet in Pakistan. Oversight guidelines for the delegation o f federal powers to the provinces have not been established, environmental management capacity at the provincial level i s uneven, and litt le capacity has been developed at the local level.
Establishing Guidelines for Oversight of Delegated Environmental Authorities
75. What principles should guide the delegation o f powers across tiers o f government? Oversight guidelines should allow for delegation o f environmental authorities f rom the Federal to the provincial level under three conditions:
0 the provincial government can demonstrate that there are adequate provincial laws and regulations in place to enforce the national objectives;
the provincial authority has adequate technical expertise, staff, and resources to perform delegated responsibilities; and
the provincial authority can demonstrate a commitment to share the information that will be needed to monitor compliance and measure performance.
0
0
Oversight guidelines should also establish policies for reporting, confl ict resolution, training, and funding assistance. In establishing roles and responsibilities under decentralization, Pakistan EPA must tread a careful l ine between over-management and lack o f oversight o f delegated programs. The proposed Regional Directorates o f Pakistan EPA will play an important role under decentralization to communicate, coordinate, and oversee the environmental responsibilities o f the provincial and local authorities. I t i s critical that the delegation o f enforcement functions to provincial and local authorities does not compromise Pakistan EPA’s legally mandated responsibility t o ensure compliance with national environmental laws. T h i s i s important since provincial EPAs are accountable directly t o provincial governments, and
17 Provision should be made for exceptional cases. For example, Pakistan EPA may take into consideration national
implications regarding the compliance record o f a large national enterprise at the provincial level. The national agency may need to be involved in a jo int inspection, along with the Provincial EPA, o f the facility when consistency with national standards has become a major issue or where undue pressure from local interest groups threatens the integrity o f the regulatory process.
25

18 consequently Pakistan EPA has an important role to play as an autonomous adjudicator. 3.1 provides an example how such oversight i s applied in the USA.
B o x
Box 3.1: Environmental Federalism - Oversight Mechanisms in the United States
The concept o f environmental federalism has been practiced in countries including the Uni ted States, Canada, Australia, Germany, and Ind ia for many years. Perhaps the most acknowledged fo rm o f environmental federalism can be found in the Uni ted States. National legislation has given the responsibility for establishing environmental policies and standards to the Federal government, but the responsibility for implementing and enforcing those standards has been delegated to the states. Fo r example, under the Clean Air Act, the U S Environmental Protection Agency determines geographically un i fo rm standards for common air pollutants and for establishing uni form performance standards for large stationary sources. The states are required t o submit state implementation plans for approval t o USEPA demonstrating that they can meet those standards, but are left with the discretion in h o w air pol lut ion control programs wil l b e executed.
Before delegating environmental enforcement responsibilities, the USEPA must first determine whether the state concerned has the capabilities to carry out effective enforcement o f the l aw and has demonstrated i t s abil ity t o protect human health and the environment. T o demonstrate i t s enforcement capabilities, the state must:
'0 identi fy i t s existing or potential staff capabilities, technical as wel l as legal; identify i t s ownership or access to necessary equipment o r facilities such as laboratories; have clearly defined enforcement policies and procedures for addressing environmental violations and pol lut ion releases; submit an enforcement work program to EPA, including a budget and description o f proposed activities and outputs to b e accomplished. agree to the enforcement o f national laws and regulations and federal oversight by USEPA, including federal intervention when enforcement i s not being adequately exercised by the states.
The oversight role o f the USEPA is to (i) ensure that the national environmental laws are being effectively enforced by the states, (ii) enhance state capabilities through technical assistance, support, and evaluation, and (iii) analyze and report o n the progress o f state programs and performance. USEPA Regional Offices formally review state programs at least once a year, relying o n required reports, state records, and visits to the states. The reviews are based o n objective measures, standards, and expectations that are agreed to in advance in a cooperative agreement.
3. The Horizontal Division of Responsibilities: Mainstreaming and Upstreaming
76. between the sectors involved. Pakistan has evolved a dual mechanism to achieve this coordination. A high-powered supreme authority, the Pakistan Environmental Protection Council (PEPC), i s responsible for approving environmental policy across sectors. The Council i s chaired by the Prime Minister, and consists o f the provincial Chief Ministers, Federal and provincial ministers o f environment, as wel l as c i v i l society and private sector representatives. The stature o f PEPC has given significant weight to i t s decisions, particularly among government agencies. Whi le PEPC has been successful in adopting explicit ly environmental policies, such as the NCS,
Many environmental issues are cross-sectoral, so there i s a need to ensure coordination
18 At stakeholder meetings during preparation o f this report, the provincial character and autonomy o f provincial EPAs
were strongly endorsed, underlining the value o f the National Environment Coordination Committee (NECC) as a forum to provide greater coordination o f Federal and provincial EPA's activities, and to address potential conflicts in the exercise o f their shared mandates and responsibilities.
26

NEAP and NEP, it has not yet addressed the need to mainstream environmental concerns into the activities o f other sectors. Given the importance o f environmental mainstreaming for sustainable growth, it would be extremely valuable to establish PEPC’s authority in this regard.
77. In addition to PEPC’s potential ro le in environmental mainstreaming, the other key mechanism designed to ensure inter-sectoral coordination for environmental management rests with the Planning Commission. The Planning Commission has established an Environment Section in the Planning and Development (P&D) Divis ion to address environmental concerns at the policy, planning, project conceptualization, and approval stage of public sector projects, and so may be considered a force for environmental “upstreaming”. Provincial planning departments have established corresponding environment sections for environmental screening o f proj ect proposals within their jurisdictions. Whi le the establishment o f these sections i s significant, they lack the capacity and resources to conduct detailed environmental reviews and to engage other ministries in the screening process.
4. Environment and the Judiciary: Strengthening a Vital Link
78. the only other recourse for resolving environmental problems or disputes. The judiciary can succeed in enforcing policies and reconciling conflicts with powers that the executive branch agencies simply lack. In 2002, the Global Judges Symposium adopted the Johannesburg Principles o f L a w and Sustainable Development which affirmed that “an independent judiciary and judicial process i s vital for the implementation, development, and enforcement o f environmental law.” In Pakistan, the judiciary has played an increasingly important role in the enforcement o f environmental laws, and should continue to be strengthened through continued support for both judges and advocates. However, i t should also be noted that intervention by the judiciary can be costly and should be pursued only as a last resort when other administrative remedies are exhausted.
When regulatory avenues for environmental enforcement fail, the judic ia l system i s often
Supreme and High Courts: Establishing the Right to a Clean Environment
79. the environment and the protection o f a clean environment. In the landmark case o f Shehla Z ia versus WAPDA, the Supreme Court ruled that “while l i fe i s not defined in the Constitution, i t does not mean nor can be restricted to only vegetative or animal l i f e or mere existence f rom conception to death; l i f e includes a l l such amenities and facilities for which a person born in a free country i s entitled to enjoy legally and constitutionally.” The Court concluded that the right to a clean environment i s a fundamental right o f a l l citizens o f Pakistan covered by the right to l i fe and right to dignity under Articles 9 and 14 o f the Constitution.
The Supreme Court o f Pakistan has considered several cases regarding the degradation of
80. response to a letter f rom the Karachi Administration Women’s Welfare Society, the Court appointed a Commission to look into complaints regarding health hazards in the use o f open storm water drains for the disposal o f sewerage and the contamination o f water resulting f rom damaged water and sewerage pipes. The Court subsequently directed the implementation o f remedial measures including the repair o f water and sewerage pipes. The High Courts in the provinces have also intervened and rendered significant pol icy decisions affecting future environmental management. One o f the most recent examples o f court pol icy intervention i s Syed Mansoor Ali Shah versus Government o f Puniab which led to the establishment o f the Lahore Clean Air Commission. The Lahore High Court appointed the Commission to develop
The Supreme Court has also taken an activist role in environmental pol icy making. In
27

and submit a report on feasible and specific solutions and measures for monitoring, controlling, and improving vehicular air pollution in the City o f Lahore.
Environmental Tribunals: Supporting Channels for Advocacy and Enforcement
81. Section 20 o f the PEPA authorizes the federal government to establish as many Environmental Tribunals as it considers necessary and specify the territorial limits or class o f cases under which each o f them shall exercise jurisdiction. T w o Environmental Tribunals have been established - one in Karachi with jurisdiction over the provinces o f Sindh and Balochistan, and one in Lahore with jurisdiction over the provinces o f Punjab and the NWFP. L i ke the Supreme Court and Provincial High Court, the Environmental Tribunals are playing an important role in setting and enforcing environmental policy, a role that i s set to increase with plans under the MTDF to establish a further three Tribunals by 2010.
19
82. i t i s important that they have an understanding o f scientific principles and their application to environmental laws, including the concept o f environmental risk and indirect impacts, and linkages between causation and harm. Therefore, investment in strengthening the institutional capacity o f the Judiciary and Environmental Tribunals should not be overlooked. These institutions should be supported through judicial training programs o n environmental laws, issues, and institutions and exchanges with other countries in the region with a judicial “Green Bench.” In addition, the Courts should establish mechanisms to monitor the implementation o f court orders either through the establishment o f judicially appointed oversight committees or judicially mandated reporting requirements.
Given the increasing role that Environmental Tribunals and Courts will play in the future,
Box 3.2: Empowering Citizens to Promote Environmental Compliance
In the Philippines, the constitution explicitly provides for !‘the right o f the people to a balanced and healthy ecology in accord with the rhythm and harmony o f nature.” This right empowered citizens in the Philippines to f i l e public interest litigation in the Supreme Court which resulted in a landmark decision for the clean up o f the Manila Bay. W h i l e there i s tension between government regulators and civil society organizations over environmental enforcement, the interests o f regulators and citizens are in fact similar - ensuring a healthy environment. In many countries citizens are one o f the most untapped and overlooked resources for ensuring environmental compliance and enforcement. Active citizen involvement in environmental enforcement can help supplement an agencyk efforts by raising public awareness and building popular support for an otherwise controversial enforcement action. In the United States, for example, controversial provisions in the Clean Air Act, such as the vehicle inspection and maintenance program, would not have been implemented without the intervention o f public interest advocates.
83. By establishing a constitutional right to a clean environment and demonstrating a willingness to address matters o f environmental policy, the Courts have empowered citizens with legal standing in which to enforce environmental laws through administrative and judicial proceedings. Whi le this right has been established by the Courts, there are n o citizen suit provisions in the enabling environmental statutes. Existing and future laws should explicitly
19 In a very recent case, the Punjab Environmental Tribunal directed the Provincial Transport Secretary for the
Province of Punjab to explain the reasons for the availability of rickshaws with two- stroke engines in the city o f Lahore despite a ban on two- stroke rickshaws that was imposed a year ago.
28

provide for citizen enforcement. Public interest advocacy i s a powerful force for improvements in environmental management (see B o x 3.2), and should be supported through environmental law associations and the establishment o f environmental l a w clinics at universities.
Pakistan EPA Punjab EPA Sindh EPA N W F P EPA Balochstan EPA
5. A r e Resources for Environmental Management Adequate?
11 35 46 30 133 163 12 79 91 12 (5 vacant) 36 48 7 40 47
84. As far as federal financial resources in the development budget are concerned, the planned allocation for the environment i s encouraging, with a proposed doubling o f the environment budget for the year 2005-2006. Under the Mid-Term Development Framework, the Federal government has indicated a proposed allocation o f Rs. 28.3 b i l l ion ($473 million) for the next f ive years for environmental management projects. Included in the MTDF i s Rs.135 mi l l ion ($2.2 mill ion) for the Pakistan EPA’s Act iv i ty Based Capacity Development Project (ABCD) and Rs.50 mi l l ion ($836,000) for strengthening the capacity o f the provincial EPAs, though neither has yet been implemented.
85. The immediate challenge confronting both Federal and provincial environmental authorities i s t o take swif t advantage o f the proposed allocation o f development resources, and apply them towards programmatic goals in such a way as to strengthen and supplement their s t i l l relatively l imi ted levels o f permanent staffing and operational budget. For example, the budget for operation and maintenance o f critical environmental management systems, such as air and water monitoring programs, i s extremely inadequate and a funding program to sustain them i s needed. In the longer term, the challenge becomes one o f establishing more permanent and predictable sources o f funding, in which Provincial Sustainable Development Funds may play a valuable role.
Supplementing Permanent Capacity with Outsourcing and Partnerships
86. The Environment Protection and Resource Conservation Project (EPRCP) supported by the Wor ld Bank from 1993 through 1999 played a key role in creating the environmental pol icy and institutional framework for the Federal and provincial agencies. I t also provided critical staff support, but the adequacy and capacity o f staff remains a continuing challenge. Table 3.1 reflects the current staffing mix at the federal and provincial level. In i ts Restructuring Proposal, the Palustan EPA determined that to meet current and future mandates, it will need an increase o f 3 12 technical staffing positions (grades BPS-16 and above) and an additional 338 supporting staff (BPS 1-15) to be phased over a period o f three years. A s these staffing increases are unlikely to be met in full, Pakistan EPA will need to consider ways in to augment i t s resources through outsourcing some o f i ts functions.
Table 3.1: EPA Staffing Levels
87. enforcement, expanding their laboratory facilities and monitoring capacity deserves attention. N o t a l l functions need to be retained in-house, however, and some may be performed more efficiently through contractual arrangements with private individuals or non-governmental
Since Provincial EPA’s have the frontline responsibility for implementation and
29

organizations such as research institutes or universities. Exploring formal partnerships with research or academic institutions with technical expertise might be one avenue for strengthening capacity in this area.
Provincial Sustainable Development Funds: Creating Dependable Sources of Funding
88. been established in each province to provide financial assistance for eligible projects which may include (i) purchase o f pollution control equipment, (ii) installation o f effluent treatment facilities in industrial estates, (iii) incentives to develop indigenous technology for pollution control, (iv) roundtables, conferences, workshops for pollution abatement, and (v) training and advisory services for industry. PSDFs will derive funds f rom a range o f sources, including grants or loans advanced by the Federal or provincial governments, assistance f rom donors, and contributions f rom private organizations. The PSDF Rules further provide that provincial Finance Departments may credit to the Fund every year an amount equivalent to the pollution charges paid by industrial units, and fees received for environmental clearances and other environmental services. PSDFs have not yet been utilized, in part because o f the opaque and cumbersome procedures established for the approval o f expenditures. Experience f rom environmental funds elsewhere (see B o x 3.3) suggests, however, that they may form important vehicles for the funding o f provincial and local government capacity building, as wel l as project investments in environmental infrastructure. If environmental funds are used, they should incorporate good practices such as effective monitoring and evaluation procedures. In addition, periodic evaluation by independent and outside parties should be conducted to ensure the effective use o f the funds and the achievement o f environmental policy objectives. Financing through environmental funds will be effective only if the underlying reasons for the environmental problems, such as regulatory and market failures, are simultaneously tackled. Without strengthened environmental regulation and enforcement mechanisms, their effectiveness can be limited. Moreover, experience elsewhere has shown that crucial to the success o f these funds i s the need to avoid the mismanagement o f public funds, for which stakeholders’ participation in decision making i s needed to maintain transparency and accountability.
Under Section 9 o f the PEPA, a Provincial Sustainable Development Fund (PSDF) has
20
Box 3.3: Environment Funds: Experience from Bulgaria
In Bulgaria, the National Environmental Protection Fund (NEPF) was created under the Bulgaria Environmental Protection A c t o f 1992. The main objective o f the NEPF is to provide financial support t o implement the National Environmental Strategy o f Bulgaria. The ma in source o f revenue comes f r o m fines and fees collected by the Ministry of Environment, as we l l as proceeds f rom f u e l taxes and privatization. The Fund’s resources are controlled by a Management Board consisting o f the Minister o f Environment, Deputy Ministers f r o m sectoral agencies such as the Min is t ry o f Energy, Ministry o f Health, Min is t ry o f Transport, and Min is t ry o f Regional Development and Construction, and representatives f r o m the scientific and NGO communities. The daily management o f the NEPF i s carried out by an Executive Bureau within the Ministry o f Environment. Annual reports o n the activities and financial accounts o f the NEPF are provided to the Parliament and available to the general public. To date, the NEPF has helped f i a n c e projects for air pol lut ion abatement facilities equipment, wastewater treatment facilities upgrades, conversion to gas at thermal power stations, and the upgrading o f bus engines in Sofia.
20 Lovei, M. 1999. ”Environmental Funds.” Pollution Management Discussion Note (PMDN): In Focus - Number 1
(January 1999). Washington DC, World Bank.
30

6. Moving Forward: Strengthening Institutions through NEP Implementation
89. which will require not only a comprehensive capacity building program, but also the establishment o f incentives at a l l levels o f government to encourage improved environmental performance and institutional sustainability.
The NEP has established an ambitious environmental pol icy agenda, the achievement o f
Incentive-Based Partnerships to meet National Goals and Local Targets
90. incentive-based partnerships between the Federal and provincial EPAs based o n performance. These would link the transfer o f financial support for institutional strengthening with demonstrated performance in improved environmental management. The benefits o f an incentive based partnership are that it allows Federal and provincial EPAs to mutually agree upon environmental goals and agency responsibilities, develop a shared strategy o f responsibility to achieve goals, and provide incentive funding based on performance. Such an approach i s used in the National Environmental Performance Partnership System (NEPPS) that has been successfully adopted by the U.S. Environmental Protection Agency and several states (see B o x 3.4), and in i t ia l discussions with provincial authorities in Palustan indicate an interest in exploring this approach further.
One institutional approach to linking roles at different levels o f government i s to develop
Box 3.4: Incentive-Based Partnerships: the U S Experience
Under the NEPPS approach, the USEPA and states recognized that environmental programs were expanding with limited resources and effective implementation required a structured planning process to establish joint priorities, allocate responsibilities, and address mutual areas o f concern. The elements o f effective Performance Partnership Agreements include:
0
0
Description o f shared outcome objectives and priorities; Description o f strategies, tools, and activities; Performance indicators for evaluating environmental progress; Structure and process for mutual accountability, including clear definition o f roles and responsibilities for each party and allocation o f resources; Process for joint evaluation on how well the partnership i s working and implementation o f any needed improvements that are identified Description o f how priorities in the agreement align wi th the national and state environmental plans.
The scope o f Performance Partnership Agreements can cover many topical areas such as controlling priority pollutants, streamlining the environmental assessment process, improving compliance monitoring, and strengthening the enforcement o f targeted sectors, as well as many program areas such as air quality, water quality, drinking water, solid and hazardous waste, and natural resource protection.
9 1. T h i s performance-based approach would fa l l naturally within the process o f developing action plans at the Federal and provincial levels envisioned in the NEP. It i s also consistent with current fiscal practices o f promoting federalism (see B o x 3.5). These action plans would include agreed upon goals and responsibilities around identified priorities, such as strengthened capacity in environmental monitoring, auditing and enforcement, as wel l as project management. Similarly, provincial governments would, as appropriate, establish performance-based partnerships with district and tehsil governments for environmental functions devolved to local governments. The action plans would also include the development o f performance indicators to
31

measure both the outputs (activities carried out by provincial or local authorities) and outcomes (environmental results) o f the partnership. Further building on the vision established in the NEP, funds would be transferred between levels o f government upon the successful achievement o f the agreed indicators. T w o important pre-requisites for such an approach to function effectively are (i) translation o f the NEP’s broad directions into specific targets, and (ii) establishment o f an efficient system o f performance-based transfers, combining transparent decision-malung with the minimum number o f administrative hurdles.
Box 3.5: Instituting Performance-Based Grants in Pakistan
In Pakistan, sharing o f federally collected revenue between the federal government and the four provincial governments i s governed by the National Finance Commission (NFC) Award. The Award, determines the vertical (i.e. between the federal and provinces) and horizontal (among the provinces) sharing o f revenue o n criteria o f “need”. Whi le the horizontal distribution i s based o n determination o f expenditure needs o f the national and sub-national governments, the horizontal distribution has been based mainly o n population shares. Allowance, however, i s made o f developmental needs o f the provinces by providing federal grants based o n notions o f backwardness. Moreover, as the Constitution gives the ownership o f natural resources to the provinces, the provinces also get “unconditional transfers” f r o m the federal governments, wh ich are simply the pass o n o f energy-related revenues collected by the federal government.
Although the simple design o f the NFC Award has been instrumental in getting it the required pol i t ical support, it has been crit icized for i t s lack o f performance incentive system, wh ich has created some unintended problems, particularly in terms o f poor use efficiency o f f iscal resources, weak collection o f own revenues and non-alignment o f po l icy priorit ies across governments. Whi le these shortcomings o f NFC transfers prompted some o f the provinces to establish performance-based grants under their sectoral or sectoral re form programs, the federal government has generally adopted more direct interventions to ensure implementation o f national policies.
Performance-based grants, however, are considered as a better option as they can:
0
Strike a balance between adherence to national po l icy goals and ensuring autonomylefficiency o f sub-national governments. Provide incentives for sub-national governments to improve their performance by linking the access to and size o f the release o f grants with their performance in pre-determined areas. Supplement the overall needs assessment and monitoring and evaluation systems. Through focus and incentives, strengthen the capacity o f sub-national development efforts. Improve accountability (up/down), participation and citizens’ access to information.
Nonetheless, to achieve these objectives, performance-based grants need to b e properly designed. In designing such grants, it i s better t o start with basic institutional requirements, such as improved financial management, good governance, transparency, participation etc. Other key elements are:
Performance has to be within the control o f the sub-national governments. Signals should b e mutually and inter-temporally consistent and non-conflicting. Sub-national governments need to k n o w clearly the defined measures (i.e. bo th the benchmarks and targets) beforehand. Credibil i ty o f assessment ( o f performance) i s vi tal and remains a great challenge. Communication o f results i s crucial. In case o f Pakistan, i t i s important that these grants b e either built in to the NFC framework or be additional t o the NFC (and “straight”) transfers.
32

Outsourcing to Build Capacity
92. direction for initiatives to build technical capacity. These would include support for consultants to assist managerial staff in developing and implementing programs in priority areas, such as the management o f air and water quality, expert review of environmental assessments, laboratory and monitoring equipment and analysis, the sharing o f innovative practices in regulatory management and compliance incentives, and public participation in environmental decision-making. In moving forward, i t i s important that Pakistan EPA and Provincial EPAs focus efforts to strengthen institutional capacity in areas where there i s comparative advantage in experience, resources, and local conditions. If efforts are made to address al l the proposed environmental aspects o f the MDTF simultaneously, the agencies may reach beyond their current capacities and resources, which could undermine the achievement of goals in the long term.
NEP action plans at the Federal and provincial levels would also provide a strategic
Strengthening Bottom- Up Accountability
93. Clarifying responsibilities and improving accountability through top-down partnerships i s an important part o f the solution. But there are l imi ts to the top-down model o f accountability. In hierarchical systems public sector goals are defined in the short-term by measurable indicators - such as staff numbers, or the quantity o f infrastructure built, or the number o f reports submitted. But the final goal o f environmental pol icy i s very different and involves environmental outcomes - the level o f pollution or resource degradation. Since environmental outputs are often harder to measure than physical inputs, it i s natural for administrative goals to be defined in terms o f inputs. But the result i s that there i s often l i t t le correlation between tangible and observable physical measures and the eventual environmental outcome. When affected citizens have n o formal role to play in the process, there i s n o mechanism for identifying policy failures. Given the complexity o f environmental problems it i s impossible for institutions to implement policies effectively without adequate consumer (citizen) feedback. So there i s a need to integrate bottom- up approaches with the top-down hierarchies that exist in government. Public scrutiny o f performance i s ultimately a source o f strength that leads to stronger institutions with greater public trust and support.
94. obvious mechanisms for strengthening accountability. Improving the effectiveness o f environmental tribunals i s one way o f assuring greater accountability. Strengthening the independent judiciary and the role o f public interest l i t igation gives an opportunity to press for pol icy enforcement when other avenues of accountability have been exhausted. However, stakeholders also need to be directly engaged in the planning, consultation and evaluation of environmental performance. Establishing performance-based indicators that are transparent and regularly reported to the public will help ensure greater stakeholder accountability. Pakistan i s particularly wel l placed to further develop such systems, with the presence o f reputable scientific NGOs, legal associations, and academic organizations that have both the s h l l s and knowledge to participate in the policy process in a meaningful and productive manner.
Creating effective stakeholder accountability i s a diff icult process, but there are two
33

Iv. REINFORCING THE ENVIRONMENTAL IMPACT ASSESSMENT SYSTEM
95. social and environmental change. The Environmental Impact Assessment (EIA) system i s designed to be a key decision-making tool to ensure the integration o f economic, social and environmental issues early in the planning process. I t s effectiveness as a decision-making tool i s determined by the capacity and resources -human, technical, and informational - with which the EIA system i s implemented and will have consequences for the country’s long term growth.
As Pakistan pursues i t s development agenda, growth will continue to bring economic,
96. Government’s commitment to environmental assessment o f public sector investments, this chapter identifies a number o f opportunities to reinforce the EIA system. In particular, this chapter highlights the need to establish Federal oversight and ensure better coverage o f investments, promote the quality o f EIA content and implementation, extend the NWFP model for capacity development, and promote meaningful public consultation and full disclosure o f EIA documentation.
Whi le recognizing the increasing number o f E IAs being submitted for review, and the
1. The EIA Framework: Establishing Oversight and Ensuring Coverage
97. commences construction or operation, an Ini t ia l Environmental Examination (IEE) must be fi led with the Federal government and where the project i s l ikely to cause’ adverse environmental impact, an Environmental Impact Assessment (EIA) must be filed. This requirement under Section 12 o f the PEPA applies to both public and private development projects. The Federal agency must communicate i t s approval or disapproval within four months f rom the date that the IEE/EIA i s f i led or otherwise it i s deemed approved.
The Pakistan Environmental Protection Ac t o f 1997 (PEPA) requires that before a project
Establishing Oversight of Delegated E IA Authorities
98. are set forth in regulations promulgated by the Palustan EPA. The regulations have established that the Federal EPA has jurisdiction over a l l IEEs and EIAs, but may delegate its power to provincial authorities pursuant to Section 26 o f the PEPA. Federal jurisdiction will be retained for projects o n federal land, military projects, and those involving either trans-border or trans- province impacts. In cases where there are trans-province impacts, the parties can agree to have provincial authorities review and manage the environmental assessment, in which case the federal authority wil l have n o direct role.
The pol icy and procedures for filing, review, and approval o f environmental assessments
99. regulations specifically reserve the right o f the Federal EPA “to review any Environment Report at any time and to suspend the powers it has delegated to any Responsible Authority if it believes those powers have been misused.” This right to review and suspend has not been exercised, but represents a key provision regarding oversight o f Federal/provincial conflicts and the determination o f an ultimate decision-maker. This right i s particularly important when provincial authorities may be subject to polit ical pressure to expedient EIA clearances without proper and adequate environmental review.
Whi le the provincial authorities have jurisdiction for the vast majority o f cases, the
34

Improving EIA Coverage
The EIA regulations provide a sound legal and regulatory framework for the EIA system in Pahstan, and there has been progress in its implementation. As Figure 4.1 indicates, data provided by the Pahstan EPA show an increase in the number o f IEEs and EIAs fi led in the last f ive years f rom 37 in 2000, to 87 in 2004. Whi le the trend i s encouraging, the total number o f cases submitted i s s t i l l relatively low. Bangladesh, for example, has a smaller economy with approximately the same level o f industrialization as Palustan, but the Bangladeshi Department of Environment issued more than 1,300 environmental clearances in 2001. This discrepancy serves to underline the fact that there i s n o system to help environmental authorities in Palustan identify private sector projects, and as a result it i s l ikely that some smaller projects with potentially damaging impacts are never reported. Federal and provincial EPAs have recently tried to strengthen linkages in the planning and licensing process by requesting Banks to verify environmental clearances before approving financing (as required under the Equator principles), and by requesting utility companies to conf i rm environmental clearances before providing electricity, water and gas connections to industries. There has so far been litt le movement on these initiatives, however.
Figure 4.1: EPA Performance Statistics \
3 2 5 Y)
W U m Y) W w 0
r
2
35
30
25
20
15
10
5
0
2000 2001 2002 2003 2004
2. Strengthening the EIA Process: Meaningful Public Consultation and Disclosure
100. The PEPA and EIA regulations emphasize that every review o f an EIA should be carried out with public participation. Adherence to these requirements has, however, proven to be challengng. Whi le environmental reports generally state that stakeholders have been consulted, in a number o f cases n o meaningful public consultation has been pursued. Some project proponents v iew public hearings as a mere formality and make litt le attempt to identify and involve local communities that might be impacted by the proposed project. For example, a
35

review o f the public consultation process for a project in Balochistan revealed that only seven to eight persons attended the public hearing, and none came f rom the project area.
10 1. The EIA Guidelines for Public Consultation are very clear and specifically state “Proponents should explain their proposals clearly to affected communities, actively listen to the communities’ responses, and make prudent changes to the proposal to avoid or mitigate adverse impacts. Where proponents are able to go beyond this to participation, they will achieve even greater benefits for themselves and for the stakeholders.” These guidelines emphasize that public consultation goes beyond simply listening to public concerns, but more importantly i t requires active engagement with the public in the development o f acceptable solutions to address those concerns.
102. to be able to draw on the expertise o f leading NGOs such as IUCN, WWF, and LEAD, which have organized public forums and training programs to raise awareness o f the EIA system and the role o f public participation. More formal partnerships with such organizations would enable environmental authorities to establish meaningful public consultation as standard practice.
In building the capacity to conduct more meaningful consultations, Pakistan i s fortunate
103. Consultation i s only meaningful if there i s adequate information made available about the project. Under Section 5 o f the EM regulations the project proponent and responsible authority are required to make the EIA available to the public. Compliance with this rule i s uneven. Whi le Sindh EPA does disseminate EIAs, and provides dispute resolution mechanisms to address stakeholder concerns, elsewhere only executive summaries rather than the full EIA reports are available to the public. Public access to EIA documents can enhance the abil ity o f the affected communities, NGO’s and others to evaluate potential environmental impacts, identify areas o f concern, and suggest possible mitigation measures. Transparency can help not only the affected community, but the regulator and regulated entity as well. Measures to improve public access and transparency o f information should be further explored, including the application o f information technology to al low the public to review and comment o n proposed EIAs electronically.
3. Promoting Quality of EIA Content and Implementation
104. IEE/EIA reports remains highly variable. In general the quality o f reports submitted for highly visible mega-projects i s satisfactory, but more often the level o f research and information needed to evaluate project impacts i s missing. Indeed, consultants have been known to submit reports without visiting affected sites to collect information. It i s unlikely that this would be tolerated were there greater transparency, genuine public consultation and inclusion.
A direct consequence o f l o w levels o f stakeholder accountability i s that the quality o f
105. In the clearance process, there i s also a need for a formal system o f EIA review or a panel o f experts to evaluate the documentation and identify issues in the reports for projects with l ikely significant impacts. Such a panel of experts would help ensure that the information provided in the EIA i s adequate and appropriately used in the decision-making process, and in combination with better stakeholder consultation, would protect against criticism that the EIA may be drafted around a decision that has been pre-determined before it was conducted. In addition, the EIA review should not be confined to impacts and mitigation measures, but should extend to the monitoring and enforcement o f agreed measures.
36

Monitoring and Enforcement of EIA: Matching Capacity to Authority
106. B o t h PEPA and EL4 regulations provide for the inspection and enforcement of EIA provisions. Under Section 6 o f the regulations, the responsible authority i s given the “full right of entry and inspection o f the site, factory or premises at any time pr ior to, during or after the commencement o f the operations relating to the project.” And under Section 17 o f PEPA, anyone who fails to comply with the EIA requirements can be fined up to one mi l l ion rupees, and additional fine o f 100,000 rupees for each day the violation occurs. These enforcement tools are seldom deployed, however, so compliance with EIA provisions remains weak.
107. including a sound EIA review and monitoring process, environmental awareness and management, and strong enforcement. Unless these enforcement tools are deployed, there will be n o perceived or real incentive to comply, or consequence for noncompliance. Under the law, Federal and provincial EPA’s have the authority to issue Environmental Protection Orders (EPOs) and impose penalties. Palustan EPA could also legally order c iv i l authorities to withdraw utilities to a project that has failed to obtain a N o Objective Certificate (NOC), but this power has never been used. A review o f the current staffing mix o f the Federal and provincial EPAs suggests that strengthening enforcement will require greater capacity o f both technical and legal staff in monitoring, inspection, collection o f evidence, and prosecution o f environmental cases.
Assuring compliance with EIA requirements must rely o n a broad range o f mechanisms,
Box 4.1: EIA Capacity Building - a Successful Model in NWFP
The government o f NWFP has taken the lead in institutionalizing the awareness and understanding of the EIA system in the provinces and government. The NWFP EIA Centre was established at the Pakistan Academy o f Rural Development, Peshawar in collaboration wi th EPA-NWFP for the purpose o f building the capacity o f public and private sector organizations in the preparation o f EIAs, and to enhance the capacity o f EPA-NWFP in reviewing and monitoring environmental reports. Funding for the Centre was fust proposed in the 2002 Annual Development Plan o f NWFP Government for three years and based on its performance, it was recently extended another three years until 2008. I t reflects both an important commitment o n behalf o f the provincial government and a significant recognition o f the role that training plays in maintaining an effective EIA system. In the f i rst three years o f the program, ten master trainers have been trained and over 165 individuals have received training. Other provinces should be encouraged to institutionalize s i m i l a r EIA training programs within their jurisdiction in partnership with local universities or other training organizations.
Currently the provinces have not involved local governments in the EIA process. As devolution progresses, building capacity at the tehsil and district levels for environmental management will become increasingly important. The challenge o f locating new developments in rapidly expanding urban centers w i l l continue to grow, and with it the importance o f integrating local land-use planning with investment decisions. As local governments become more involved in the preparation and review o f EIAs, so the need for EIA training centers w i l l continue to grow.
4. EIA and Public Sector Investments: Mainstreaming and Upstreaming
108. undertaken by the public sector. In al l four provinces, the lack o f knowledge in sectoral ministries o f the EIA requirements for public sector projects i s a major challenge to sustainable development. Notwithstanding the l i s t o f projects requiring an IEE or EIA, the system has been bypassed in a large number o f cases. Recognizing this weakness, the Executive Committee o f the National Economic Council (ECNEC) recently issued an order that “In case o f development
Many o f the investments with the most significant environmental impacts are those
37

projects having environmental implications, an Environmental Impact Assessment (EM) report should invariably be submitted along with the project document at the time o f getting approval.” This order i s significant both for having been issued by ECNEC, and for clearly linlung the approval o f public sector projects with the need for environmental assessment.
Mainstreaming Sectoral Awareness: Over-coming Ignorance and Stigma
109. projects must go through the IEE or EIA process. The result i s that government departments with significant infrastructure projects, such as agencies dealing with roads, irrigation, power distribution, as wel l as c i ty and municipal authorities, proceed with public sector projects without conducting any form o f environmental assessment. Even among those agencies aware o f EIA requirements, there i s often a reluctance to fi le an IEEEIA report because o f the general perception that the EIA requirements are an unnecessary burden to achieving desired economic development goals. Greater training and informational resources are needed to improve public sector awareness o f the EIA process, so that sectoral agencies can answer the fo l lowing questions: What are the EIA requirements? Why are the requirements needed? Who, when, and where must EIAs be filed? What are the consequences for failure to comply? H o w can compliance be assured? In addition, specific good practice guidelines should be adopted by sector agencies to better inform and guide the sector in the EIA process. This approach has been successfully adopted in several other countries. For example, in Peru, the Ministry o f Transportation and Housing has established a registry o f those parties authorized to produce an EIS and has produced specific EIA guidelines for roads.
Many government officials are not aware o f the legal requirement that development
110. agencies. In most countries c iv i l authorities can withdraw utilities to projects that fa i l to comply with environmental regulations. A similar approach needs to be adopted in Palustan, where a No Objective Certificate (NOC) f rom the EPA should be made a mandatory requirement for gaining access to gas, electricity or water connections. Other options to increase awareness may include include engaging organizations l ike the small and medium enterprise development authorities (SMEDA), Chambers o f Commerce, Associations o f the Industries, Ministry o f Industries, and representatives o f the commercial banks and utility companies. Whi le this may help build t rust between the regulator and the industry, it i s unlikely to improve compliance unless accompanied by real and credible sanctions for non-compliance.
The EPA can strengthen enforcement by harnessing the support o f other government
Upstreaming Environmental Review in the Planning Process
1 1 1. section responsible for the environmental screening o f public sector projects at the Federal level, and provincial planning departments have also established corresponding environment sections. Due to their l imited resources, however, these sections are not able to provide the depth o f environmental review required, and E I A s of public sector projects are not conducted systematically. In addition to reinforcing the procedural guidelines necessary to consolidate environmental assessment as an integral element of the public planning process, environmental sections o f planning departments would be greatly strengthened if able to contract expert review to supplement their own capacity.
The Federal Planning Commission has established a reasonably effective environment
38

5. Strengthening the EIA System
112. The preceding review of the EIA framework and process in Pakistan identifies opportunities to reinforce this system through improvements in institutional design and technical capacity, and by strengthening incentives through broader public consultation and disclosure o f information.
Ensuring Oversight and Coverage
113. T w o important weaknesses in the institutional design and regulatory framework of the EIA system are the lack of clarity regarding oversight, and the lack o f systematic incentives to ensure coverage. The previous chapter proposed an initiative to establish guidelines for the oversight o f authorities delegated f i o m the Federal to the provincial level. These guidelines should explicitly cover Federal authority over environmental clearances. Given the relatively l imi ted number o f IEEs and EIAs being submitted for review, there i s also a need to develop systems to help environmental agencies identify potentially damaging private and public sector investments at an early stage o f development. In this regard, the lack o f awareness o f EIA requirements, in both private and public sectors, i s in part responsible for weak adherence to the EIA process. Potential measures to improve such awareness would include the development o f streamlined checklists for project preparation, broader dissemination o f the recent ECNEC directive requiring environmental assessment o f public sector projects, and the provision o f EIA guidelines to industry associations and other c iv i l society groups.
Building Technical Capacity for the Preparation and Review of EIAs
114. Whi le wider public consultation and disclosure will increase incentives for higher quality EIAs, greater technical capacity i s also essential for effective implementation o f the EIA process. T o strengthen the technical s k i l l s o f both the private sector personnel preparing EIAs and the public sector staff reviewing them, national and provincial EIA training institutes modeled after the NWFP Center should be established. In addition, the l imi ted public sector capacity for EIA review should be supplemented through the use o f independent experts to assist environmental authorities in the EIA review process, in particular to help ensure that assessments propose effective mitigation and monitoring measures.
Promoting Public Consultation and Disclosure
1 15. The EIA Guidelines state that the EIA must be prepared in a way that ensures the maximum participation o f affected groups. In practice, public consultation has often been limited and ineffective. Strong public participation has been proven to be an important tool in achieving compliance and also has long term benefits for both project proponents and stakeholders. More effective public consultation could be promoted through a range o f measures. A first step would be to require project proponents to develop a public consultation plan which would identify affected stakeholders, and detail how public comments will be solicited and incorporated into project development. A broader initiative would be to create EIA information centers at federal and provincial levels, where project proponents and citizens could inquire about the status of clearances and public hearings, and request access to EIA related documents. In addition, a l l EIA filings should be electronically maintained on a website for easy access by the public and private sector. Finally, environmental authorities could provide a non-technical summary o f EIA decisions, explaining reasons for granting a clearance, agreed measures to address objections f i o m the affected community, and provisions for monitoring and reporting.
39

V. URBAN AIR QUALITY: ADDRESSING A GROWING THREAT TO HEALTH
116. rapid decline in the quality o f air in South Asian cities, t o the point at which the associated health r i sks are similar t o those experienced in Europe forty years ago. One o f the most serious environmental health concerns i s exposure to fine particulate matter (PM). Worldwide, it i s estimated that up to one mi l l ion citizens o f developing countries die prematurely each year primarily as a result o f exposure to fine PM. Available data indicate that concentrations o f fine PM significantly exceed healthy levels in many Pakistani cities, with mobile sources likely to be the principal source of such pollution.
Rapid urbanization and the associated expansion of industry and transport have led to a
117. T o address the growing threat o f poor urban air quality, the M o E i s in the process o f developing a clean air program incorporating a range o f short- and long-term actions to be taken at a l l levels o f government and by a variety o f agencies. This chapter considers the principal challenges o f institutional design, capacity, regulation, and incentives that will need to be overcome if the clean air program i s to achieve i t s objectives. In particular, this analysis highlights the importance o f building partnerships between agencies and levels o f government, the potential value o f outsourcing some data collection activities, the vital need to establish ambient air quality standards, and the benefits o f developing a range o f emission reduction incentives based o n a foundation o f public information and awareness-raising.
1. Urban Air Quality in Pakistan: Unhealthy Concentrations of Particulate Matter
1 18. however, indicates that concentrations o f particulate matter above acceptable levels for human health have already been reached in a number o f cities. based on l imited monitoring that does not meet global monitoring protocols that require at least 104 days o f monitoring. Results f rom recent surveys conducted in Karachi, Lahore, Peshawar, Quetta, Rawalpindi and Islamabad by SUPARCO are presented in Figure 5.1. In this study, the highest levels o f fine PM were recorded in Lahore and Quetta, but the levels recorded in al l the cities exceed internationally accepted standards, with significant consequences for the health o f their citizens. These findings conf i rm the results o f a study conducted by Pakistan EPA with assistance from JICA in five cities (Lahore, Faisalabad, Gujranwala, Rawalpindi, and Islamabad), which revealed that fine PM levels have reached 6-7 times the WHO guideline values. A s discussed in Chapter I1 o f this report, urban air particulate pollution i s estimated to cause around 22,700 premature deaths annually, with the total health costs associated with the deaths and sickness caused by such pollution amounting to approximately 1 percent o f GDP.
Data o n urban air quality in Pakistan i s scarce. The l imi ted information available,
21 However, even this fragmentary data i s
The Principal Sources of Particulate Matter
1 19. industrial pollution, and the burning o f municipal waste. Of these, mobile sources are the most significant and growing concern. In Pakistan, the number o f vehicles has jumped from less than one mi l l ion to about four mi l l ion within 20 years. With more than a ten-fold increase, the fastest growth has been in two-stroke delivery vehicles, but the number o f diesel trucks and buses has also increased up to three times. International experience indicates that a major share o f the
The three principal anthropogenic sources o f air pollution are vehicular emissions,
21 Data on other pollutants suggest they are not yet a cause for concern.
40

emission load from motor vehicles can be attnbuted to a relatively small number o f smoky diesel and two-stroke vehicles.
1'' Cycle I 2"d Cycle Cities
(2003)
120. The emission of air pollutants i s directly related to fuel consumption. Pakistan's consumption o f petroleum products i s growing at an annual rate o f about 6 percent, almost ha l f o f which i s consumed by the transport sector. The high content o f sulphur in dieseI (0.5 percent - 1 percent) and f m a c e o i l (1 percent - 3.5 percent) i s a major contributor t o air pollution in Pakistan. Higher sulphur content leads to the formation o f secondary PM. In contrast, some other South Asian countries have reduced sulphur in diesel t o 0.035 percent and in furnace o i l to 0.5 percent.
3rd Cycle I 4th Cycle
(2004)
Figure 5.1: Particulate Matter less than 10 nlicrons (PM10; 48-hour averages)
350 300 250 200
150 I00
50 0
2.
Note: the dotted l ine across each graph shows the %hour standard prescribed for residential areas in India. The WHO does no t prescribe a "safe" guideline value for TSP and PMIO, however a number o f countries have converted the WHO guidelines to standards, after considering what i s achievable based o n local technical and socio-economic conditions. The monitoring cycles for the data presented were as follows:
I , Karachi I PostMonsoon 1 Winter 1 Spring I Summer
Lahore Monsoon
41

121. Industrial activities, particularly those using dirty fuels, are another important source o f air pollution in urban areas. In addition to emissions from large-scale facilities, such as cement, fertilizer, sugar, steel, and power plants - many o f which use furnace o i l that i s high is sulphur content, a wide range o f small to medium scale industries (including br ick h lns , steel re-rolling, steel recycling, and plastic moulding) cause a disproportionate share o f pollution through their use o f dirty “waste” fuels, such as o ld tyres, paper, wood and textile waste. Industrial emissions are further compounded by the widespread use o f small diesel electric generators in commercial and residential areas in response to the poor reliabil i ty o f electricity supplies.
122. The burning o f municipal solid waste i s a significant, but diff icult t o quantify, source o f air pollution. Almost 48,000 tonnes o f solid waste i s generated each day, most o f which i s either dumped in low-lying areas or burned. The b h i n g o f solid waste at l o w temperatures not only generates particulate matter, but also produces other carcinogenic pollutants.
123. arid conditions result in clouds o f fine dust that form a haze over many cities, compounded in by dust storms in the summer months.
A final important source o f PM i s dust f rom both natural and anthropogenic sources. The
2. Pakistan Clean Air Program: the Challenge of Institutional Design
124. Environmental Act ion Plan (NEAP) in February 200 1, in which air pollution control was one o f the core programs. Although some key objectives were achieved, including the introduction o f unleaded gasoline and a reduction o f sulphur in diesel, a number o f initiatives are yet to be undertaken. T o consolidate ongoing and proposed initiatives for the management o f urban air quality, M o E i s developing the Pakistan Clean Air Programme (PCAP), which highlights the four major sources o f urban air pollution that need to be addressed, (i) vehicular emissions, (ii) industrial emissions, (iii) burning o f solid waste, and (iv) natural dust.
The Pakistan Environment Protection Council (PEPC) approved a National
125. o f air pollution. The PCAP proposes a number o f short- and long-term measures that require action at a l l levels o f government. Appendix 1 details the measures outlined in the PCAP, and identifies the agencies responsible for talung action. The multiplicity o f agencies and the t iers o f government to be involved illustrate the main challenge in implementing the Program.
The main objective o f the proposed PCAP i s to control the health and economic impacts
Roles of Federal, Provincial, Municipal, and Sectoral Agencies: Building Partnerships
126. standards, and for defining associated systems for monitoring and enforcement. Responsibility for the implementation o f these policies has been delegated to the provincial environmental authorities. An important enforcement tool i s the Environmental Protection Order, which can issued by the Federal or provincial environmental authorities against persons or companies not complying with standards, and may require a range o f actions, f rom the immediate stoppage o f operations to measures for the restoration o f the environment. A more recent development i s the recognition in the NEP o f the important role o f local governments in environmental management, with active participation f rom stakeholders. For the management o f urban air quality, c i ty authorities are particularly important because o f the need to integrate emissions control measures with broader aspects o f urban planning, such as the provision o f public transport and zoning o f industrial developments. The need to meet national air quality goals through programs implemented at the provincial or c i ty level underlines the importance o f forming partnerships and
Pakistan EPA i s responsible at the national level for setting air quality and emissions
42
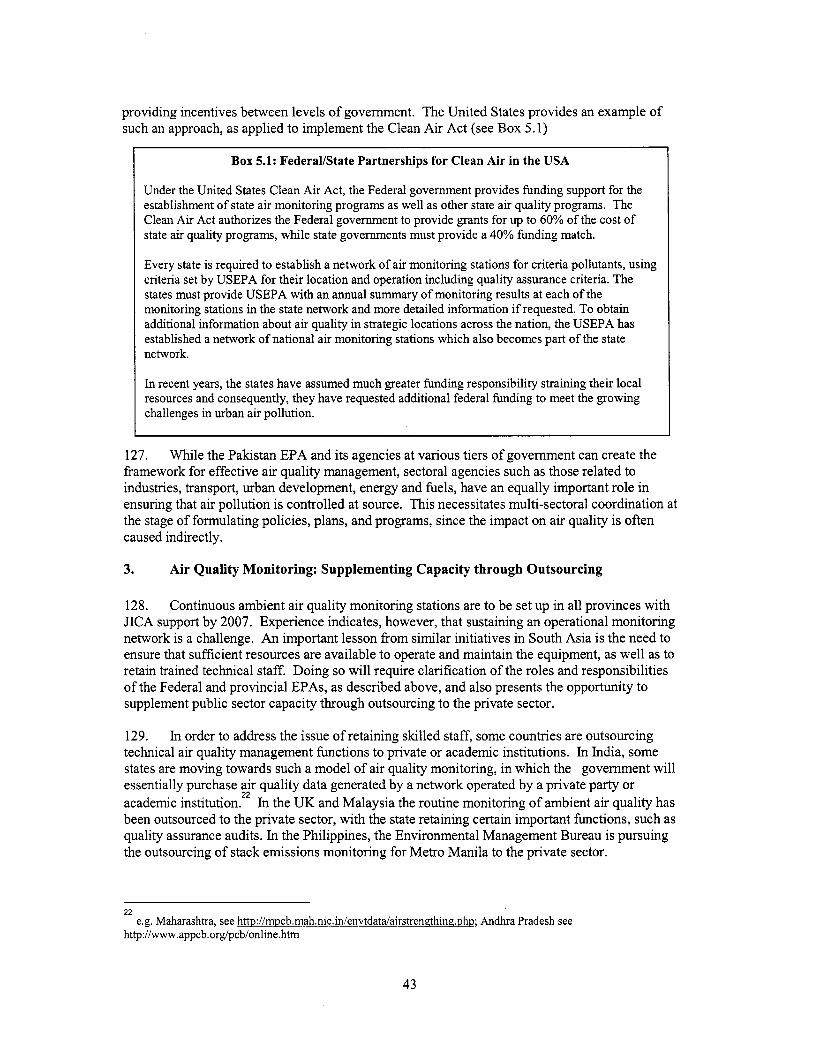
providing incentives between levels o f government. The United States provides an example o f such an approach, as applied to implement the Clean Air Act (see Box 5.1)
Box 5.1: FederalBtate Partnerships for Clean Air in the USA
Under the United States Clean Air Act, the Federal government provides funding support for the establishment o f state air monitoring programs as well as other state air quality programs. The Clean Air Act authorizes the Federal government to provide grants for up to 60% o f the cost o f state air quality programs, while state governments must provide a 40% funding match.
Every state i s required to establish a network o f air monitoring stations for criteria pollutants, using criteria set by USEPA for their location and operation including quality assurance criteria. The states must provide USEPA with an annual summary o f monitoring results at each o f the monitoring stations in the state network and more detailed information if requested. To obtain additional information about air quality in strategic locations across the nation, the USEPA has established a network o f national air monitoring stations which also becomes part o f the state network.
In recent years, the states have assumed much greater funding responsibility straining their local resources and consequently, they have requested additional federal funding to meet the growing challenges in urban air pollution.
127. framework for effective air quality management, sectoral agencies such as those related to industries, transport, urban development, energy and fuels, have an equally important role in ensuring that air pollution i s controlled at source. T h i s necessitates multi-sectoral coordination at the stage o f formulating policies, plans, and programs, since the impact on air quality i s often caused indirectly.
Wh i le the Palustan EPA and i ts agencies at various tiers o f government can create the
3. Air Quality Monitoring: Supplementing Capacity through Outsourcing
128. Continuous ambient air quality monitoring stations are to be set up in all provinces with JICA support by 2007. Experience indicates, however, that sustaining an operational monitoring network i s a challenge. An important lesson from similar initiatives in South Asia i s the need to ensure that sufficient resources are available to operate and maintain the equipment, as well as to retain trained technical staff. Doing so will require clarification o f the roles and responsibilities o f the Federal and provincial EPAs, as described above, and also presents the opportunity to supplement public sector capacity through outsourcing to the private sector.
129. In order to address the issue o f retaining skilled staff, some countries are outsourcing technical air quality management functions to private or academic institutions. In India, some states are moving towards such a model o f air quality monitoring, in which the government wil l essentially purchase air quality data generated by a network operated by a private party or academic institution. In the UK and Malaysia the routine monitoring o f ambient air quality has been outsourced to the private sector, with the state retaining certain important functions, such as quality assurance audits. In the Philippines, the Environmental Management Bureau i s pursuing the outsourcing o f stack emissions monitoring for Metro Manila to the private sector.
22
22 e.g. Maharashtra, see htta://m~cb.mah.nic.in/envtdata/airstrenethincr.ahp; Andhra Pradesh see
http://www.appcb. org/pcb/online.htm
43
4. Strengthening the Regulatory Framework for Urban Air Quality Management
130. management i s weak, starting with the lack o f a Clean Air A c t to provide a framework. The NEQS o f 1993 provide only a l imited set o f emissions standards, and do not specify standards for ambient air quality. The vehicles emission standards are too o ld to be o f relevance. Without standards, it i s impossible to set up a framework to monitor and regulate ambient air quality. A f i rst priority, therefore, i s to establish both health-based ambient air quality standards, and updated emissions standards for mobile and stationary sources, in line with regional and international practice.
As recognized in the NEP, Palastan’s legal and pol icy framework for urban air quality
13 1. Given the l imi ted information about the status o f urban air quality in Pakistan, creating a framework for UAQM should draw on experience in similar countries. Within South Asia, India, Bangladesh, Nepal, and Sri Lanka have been undertaking efforts to address urban air quality concerns, with varying degrees o f success. The experience o f these countries, amongst others, can in form the actions that can be taken in Palustan
Establishing Ambient Air Quality Standards: A Prerequisite for Air Quality Management
132. The NEP recognizes the need to establish and enforce standards for the management o f air quality. Ambient air quality standards are the foundation upon which emission control strategies are based, usually adopted as enforceable laws, typically with deadlines and schedules for attainment. I t i s important to note though, that Air Quality Standards (AQS) are not just limits for each pollutant: they must also specify monitoring methods, locations and frequencies, averaging times and assessment procedures.
133. Pakistan i s one the few countries in the wor ld without a comprehensive set o f health- based AQS. This i s partly l inked to the fact that there has been n o systematic monitoring, and hence there i s a dearth o f information on current conditions. With the JICA-funded effort to provide a network o f ambient air quality monitoring stations underway, however, i t i s time for Pakistan to promulgate AQS. These should be formulated based o n a review o f existing standards in similar countries, as wel l as WHO guidelines. Whi le safeguarding public health should be the main consideration, the costs and likelihood o f achieving the standards should also be used to i n fo rm the standard-setting process. That i s the reason why the WHO issues “guidelines” and not standards, since the latter are to be formulated by individual countries keeping the local context in view.
Updating Vehicle Emission Standards: Links to Fuel Quality Improvements
134. Pakistan also requires updated Vehicular Emission Standards (VES). T w o sets o f vehicle emission standards are generally adopted, one for new registration vehicles, and the second for in- service vehicles. Whi le the f i rst i s meant to signal to vehicle manufacturers and importers that a l l new registration vehicles should employ appropriate vehicle emissions control technologes, the second i s designed to ensure that al l vehicles are appropriately maintained so that the benefits o f the emission control technologies are realized during the operation o f the vehicles. The current NEQS specify only one set o f VES that are outdated when compared to most other countries.
135. example, the level o f sulphur in diesel in Pakistan i s between 5000 ppm to 10,000 ppm, which i s too high to be able to meet Euro I1 or Euro I11 emission standards, which have already been
The establishment and achievement o f VES i s intrinsically l inked to fuel quality. For
44

23 adopted in some South Asian countries. ppm sulphur, Euro I11 requires 350 ppm sulphur in diesel. The cost o f moving to lower sulphur diesel needs to be evaluated against the potential economic benefits in terms o f lower emissions and better health.
Whi le meeting Euro I1 emission standards requires 500
136. Based on the current condition o f the vehicle fleet and fuel quality, it would be appropriate to adopt a phased approach to the development o f VES and fuel standards. The details o f this plan, particularly the use o f l o w sulphur fuels and alternatives such as C N G and LPG, need to be developed in consultation with a l l stakeholders. A proposed timetable for consideration i s provided in Table 5.1 below. M o E would need to consult and coordinate with the Ministry o f Petroleum to initiate these much needed changes.
24 Table 5.1: New Vehicle Emission Standards and Corresponding Fuel Quality for Metro Cities
I I
5. Moving Beyond Inspections and Enforcement: a Range of Incentives for Clean Air
137. Inspection and Maintenance (I&M) programs are needed to help enforcement o f in-use VES, targeted at gross polluters. However, in most develo in countries the operation o f I&M programs has been fi-aught with challenges o f governance. The development o f such a program in Pakistan should draw on national experience with voluntary inspection and tune-up programs such as the UNDP-GEF FERTS project, and the GTZ-supported program in Peshawar. I t could also draw upon relevant regional experience, such as the testing o f in-use vehicles to derive socially acceptable and enforceable VES in Bangladesh. Such programs should be accompanied by support for vehicle repair and maintenance services, demand for which will be stimulated by I&M initiatives. The limitations o f I&M campaigns elsewhere point to the need to supplement such efforts in Palustan with support for a range o f emissions abatement measures, such as those considered below.
P g
Other Vehicle Emissions Abatement Measures: Targeting Gross Polluters
138. The NEP 2005 and the proposed PCAP both mention a number o f other actions to address emissions from motor vehicles, most o f which are presented in Appendix 1. These include travel demand management, modal shift, vehicle technology, strengthened enforcement, capacity building, and awareness-raising. But these are longer-tern measures, and prioritization
23 T h e Euro standards are a series o f progressively more stringent VES developed for application in the European
Proposed by CAI-Asia at the National Workshop for the Improvement o f Urban Air Quality in Pakistan, 13-15
Reports compiling international experiences can be downloaded from the CAI-Asia website as well as from
Union and widely used internationally.
December 2004.
www.worldbank.orrz/sarurbanair
24
25
45

o f these measures should be a consultative process, takmg into consideration the economic, financial, technical and social considerations o f range o f stakeholders.
139. programs may also be considered, targeting the most grossly polluting categories o f vehicles. Some suggestions in this regard based on regional experience include:
As proposed in the NEP, carefully-designed vehicle retirement, replacement, and disposal
0 Phase-out two-stroke three-wheelers and register only new four-stroke CNG 3- wheelers (as undertaken in Dhaka, Delhi, Kathmandu);
Replace o ld diesel buses with new dedicated-CNG buses, and replace o ld engines with new ones (based on experience in Delhi, Mumbai, and Dhaka). The simple retrofit o f o ld diesel engines i s not recommended;
A maximum age limit for public transport vehicles (adopted in Delh i and Mumbai).
0
0
However, the measures mentioned above need to be evaluated based o n criteria of cost effectiveness and economic efficiency, besides takmg note o f stakeholder concerns. The mixed international experience emerging f rom the use o f C N G vehicles for public transport underlines the need for such careful evaluation.
Measures to Reduce Emissions from Stationary Combustion Sources: Compliance Incentives
140. sources, which in addition to PM and other criteria pollutants, may emit a range o f potentially carcinogenic pollutants, including dioxins and furans. Given that in a number o f cities industrial clusters are located in close proximity to residential areas, they are l ike ly to significantly affect human health.
The NEP 2005 and draft PCAP propose a number o f measures targeting stationary
141. The proposed measures include the introduction o f l o w sulphur diesel and furnace oil, promotion o f alternate fuels, waste minimization and energy efficiency, and pollution control technology. A more draconian measure to reduce human exposure i s the relocation o f polluting units from areas where they violate land-use regulations. Most o f these measures have been tried successfully elsewhere in South Asia. As part o f a Canadian-funded program in Kolkata, industrial boilers were enabled to switch to cleaner fuels and technologies through the provision o f financial and technology transfer assistance , and the industry was given a time-frame for . phasing-in o f tighter emission standards. The challenge for environmental authorities, especially in the case o f small-scale industrial sources, i s t o play the role o f facilitator t o the extent possible, not to act solely as a regulator. In order to do so, the Federal and provincial EPAs need to work closely with various stakeholders, including industry associations, to design and implement measures that lead to lower industrial emissions, while minimizing costs to industry, and where possible achieving savings through cleaner production.
26
142. emission o f Green-House Gases (GHGs). This can be achieved by improving combustion and process technologies, energy conservation measures, improving fuel quality (such as reducin sulphur content), switching to less polluting fuels (such as gas fired boilers and generators), and
An important co-benefit o f controlling local industrial emissions can be the reduction in
2 8
26
27 http://www.wbpcb.gov.idicefXndex.html The World Bank Oil and Gas Sector Review in 2003 highlighted the large potential economic benefits o f converting
from the use o f fuel o i l to natural gas.
46

putting in place end-of-pipe controls such as scrubbers. Following the ratification o f the Kyoto Protocol in early 2005, Pahstan i s in a position to claim emission reduction credits by reducing the emissions o f GHGs. T h i s presents a significant new opportunity for Pahstan to access grant resources to address local and global emissions reduction at the same time.
Reducing Emissions from Dispersed Area Sources: Controlling Dust and Waste Burning
143. air pollution, including dioxins. The other major dispersed area source i s natural dust. A recent study in Pune and Kolkata found that the resuspended dust component (natural plus anthropogenic dust) o f f ine P M was close to 60 percent. The recommended measures in the PCAP to address dispersed area sources are stated as block tree plantation, afforestation in deserts, sand dune stabilization, paving o f shoulders along roads, and the proper disposal o f solid waste. Implementing these measures will require a coordinated approach between MoE, provincial EPAs and other departments, and local governments. If successful, these measures can be highly cost-effective in reducing ambient PM levels. A successful example o f reducing re- suspended road dust i s already being practiced in Ahmedabad, where an extensive program o f road improv$Fent, including widening and resurfacing, has been taken up by the Municipal Corporation.
The draft PCAP l is ts the burning o f municipal solid waste as a significant source o f urban
Public Information: the Essential Ingredient
144. As most o f the emissions abatement measures considered above will involve trade-offs, either in the application o f public resources or by requiring private investment, the PCAP should place considerable emphasis on the provision o f public information regarding air pollution, and the associated health and other costs. The analysis and dissemination o f air quality data should be done in consultation with local governments, who wil l be primary users o f the data in designing and implementing local air quality management programs. Dissemination strategies should include the daily publication o f an Air Qualiq91ndex, such as those used in China, Taiwan, Thailand, USA, and proposed in Bangladesh, to raise public awareness o f the issue, and to provide health alarms in case o f serious exceedance o f standards (see Box 5.2). The public information strategy should also include the collation and assessment o f past monitoring initiatives, to make this data accessible to all relevant stakeholders.
Box 5.2: The Air Quality Index
The AQI i s an index for reporting daily air quality, focusing on the health effects one may experience within a few hours or days after breathing polluted air. T h e U S EPA calculates the AQI for five major air pollutants: ground-level ozone, particle pollution (also known as particulate matter), carbon monoxide, sulfur dioxide, and nitrogen dioxide. For each o f these pollutants, the U S EPA has established national air quality standards to protect public health. The AQI can be considered as a yardstick that r u n s from 0 to 500. The higher the AQI value, the greater the level o f air pollution and the greater the health concern. For example, an AQI value o f 50 represents good air quality with l i t t le potential to affect public health, while an AQI value over 300 and beyond represents hazardous air quality.
28
29 http://www.ahmedabadcity.orglstreetpartnership.html http://www.doe-bdlaqmp1aqi.html
47

6. Support for Air Quality Management: the Role of Development Partners
145. pollution. Under the UNDP-supported National Environmental Action Plan (NEAP) assistance was provided for a range o f activities focusing on the control o f vehicular emissions, industrial emissions, and indoor air pollution. In addition, the ongoing UNDP-GEF project on Fuel Efficiency Improvements in the Road Transport Sector (FERTS) has generated useful information on ambient air quality as well as vehicular emissions, and remains a useful platform on which to launch further initiatives to address vehicular emissions. Pakistan EPA also has on- going close cooperation with JICA, which i s supporting the establishment o f fixed and mobile monitoring facilities for ambient air quality in all four provinces, with associated capacity building. The World Bank i s supplementing this assistance with technical advice and linkages with the regional Clean Air Initiative for Asia (CAI-Asia), and i s prepared to provide additional support for implementation o f the PCAP.
A number o f development partners have provided assistance in addressing urban air
48

VI. WATER SUPPLY AND SANITATION: PROTECTING SOURCES AND SAFEGUARDING SUPPLIES
1. Water Supply and Sanitation in the Context of Water Resource Management
146. Water i s central to many critical environmental issues on Pakistan. On the one hand, the vast Indus Basin system sustains the l i fe and livelihoods o f the majority o f the population; on the other hand, shortage o f water and the uncertainties o f rainfall dictate the patterns o f activity in most non-irrigated areas. The Indus Basin system receives on average about 100 mil l ion acre feet (MAF) o f freshwater annually from glacier melt, snowmelt and rainfall. T h i s surface water supply from the Indus River system i s augmented by about 50 MAF o f groundwater. Domestic water supply, both urban and rural, consumes only about 4 MAF annually or only some 5 percent o f total freshwater use in Palustan. Concerns over public health, however, combined with rapid urban growth and demands for better household services, have moved water supply and sanitation issues high on the national agenda.
30
147. Government, i s the provision o f safe drinking water for all, along with hygienic sanitation for urban and rural populations. The NWP establishes important basic principles including protection o f sources, monitoring and maintenance o f drinking water quality, and progressive upgrading o f facilities for the provision o f water and sanitation, on a sustainable basis. I t provides a framework within which to establish a single set o f ru les and regulations for Pakistan’s future water management.
The top priority o f the National Water Policy (Nwp), approved recently by the Federal
148. Council (NWC) to take decisions on water-related issues and inter-provincial conflicts. At the provincial level, Provincial Water Regulatory Commissions (PWRC) will be set up to handle all water-related provincial matters, including domestic water and sanitation. One o f the key roles o f the NWP and PWRCs will be to provide advice and support to lower levels o f government to help them in the improved delivery o f water and sanitation services. The constitution o f PWRCs i s not yet finalized but it i s envisaged that these commissions wil l be functioning in the near future. It wil l be important for the environmental authorities to be able to provide informed inputs to these commissions. Water supply and sanitation are not mentioned in either the Federal L i s t or the Concurrent List, and therefore the provincial governments have exclusive jurisdiction to enact laws concerning them, which adds an additional layer o f complexity.
In accordance with the NWP, the government has decided to form a National Water
149. After examining the extent and sources o f the threat posed by the declining availability and deteriorating quality o f water, this chapter considers the developments in institutional design, regulation, and capacity necessary to meet the N W P ’ s goal o f providing safe drinking water for all. In particular, this chapter emphasizes the need to (i) better clarify roles in protecting source water quality, providing water supply and sanitation services, and regulating drinking water quality, (ii) establish use-based standards for the quality o f water sources, (iii) build local capacity for water supply and sanitation service provision, and (iv) develop a tiered approach to regulating drinking water quality.
30 ‘Pakistan Water Sector Strategv’, Ministry of Water and Power, Office of the Chief Engineering
Advisor/ Chairman federal Flood Commission, Vol5 October 2002. [Taken from WCAS Paper no.9.1
49
2. Drinking Water Sources: Declining Availability, Deteriorating Quality
150. basis has been declining at an alarming rate, f rom about 5,000 cubic meters per capita in 195 1 to about 1,100 currently, which i s just above the internationally recognized scarcity rate, and i s projected to be less than 700 by 2025. Although household use i s only a few percent o f the total use, increasing competition for resources and continuing degradation o f water quality are severely impacting efforts to improve levels o f household service provision.
Despite the enormous size o f the Indus Basin system, water availability on a per capita
15 1. water. T h i s i s true both for rural areas and for major cities, apart f rom Karachi (which gets i t s water f rom the Indus), and Islamabad (which has a number o f different sources). Palustan can be divided into five groundwater zones, for purposes o f drinking water supply: (i) sweet groundwater areas; (ii) areas where canal or r iver water i s a real alternative; (iii) mountainous and hilly areas where spring water i s available; (iv) the eastern desert belt where groundwater i s available at increasing depth; and, (v) coastal areas where the groundwater i s saline. About 80% o f Punjab has fresh groundwater, with saline water in the south and desert areas. In addition, there i s some evidence o f high fluoride or arsenic content locally in Punjab, and a number o f locations have been contaminated by industrial wastewater discharges. Less than 30% o f groundwater in Sindh i s fresh, with much o f the province underlain by highly braclush water, and some instances o f elevated fluoride levels. In NWFP, increasing abstraction has resulted in wells now reaching into saline layers, and much o f Balochistan also has saline groundwater.
The majority o f the population rely o n groundwater as their principal source o f hnking
152. Over 60% o f the population get their drinking water f rom hand or motor pumps, with the figure in rural areas being over 70 percent. This figure i s lower in Sindh, where the groundwater quality i s generally saline and an estimated 24 percent o f the rural population get water f rom surface water or dug wells. In almost a l l urban centres, groundwater quantity and quality has deteriorated to the extent that the availability o f good quality raw water has become a serious issue. Over-abstraction has resulted in declining groundwater levels, and groundwater quality has deteriorated as a result o f the discharge o f untreated sewage and industrial effluents. Groundwater over-abstraction and pollution have typically been seen as problems for rural and agricultural activities but i t s broader impact o n water supply will make the challenges o f surface water transfers to growing urban areas even more difficult.
3. Extent and Sources o f Water Contamination
153. supply or the water as received by the user. A national water quality study was carried out by the Pakistan Council for Research in Water Resources (PCRWR) in 2001. In the f irst phase o f the program, covering 21 cities, a l l samples f rom 4 cities, and ha l f the samples f rom 17 cities indicated bacteriological contamination. In addition, arsenic above the WHO limit o f 10 ppb was found in some samples collected from 8 cities. The same study also indicated how the uncontrolled discharge o f industrial effluent has affected surface and groundwater, identifying the presence o f lead, chromium and cyanide in groundwater samples f rom industrial areas o f Karachi, and finding the same metals in the Ma l i r and Lyar i rivers f lowing through Karachi and discharging into sea. A second PCRWR study was launched in 2004, and preliminary results indicate n o appreciable improvement, whi le a separate study reported that in Sindh almost 95 percent o f shallow groundwater supplies are bacteriologically contaminated. Figure 6.1 summarizes the organic load data f rom a number o f these studies. A comparison o f the quality o f surface water with the NEQS effluent discharge standard clearly demonstrates the extent o f pollution due to the discharge o f industrial and municipal effluents.
There i s n o regular monitoring o f dnnlung water quality, in terms o f either the source o f
50

Figure 6.1: COD Levels in Surface Water
1800
1600
1400
1200
1000
800
600
400
1580.5
1,250 150 mall)
200
n Streams Natural Water Tributaries Tributaries Ravi River lndus River and Lyari River Malir River
LehNala Joining the fromthe frornthe Water Bodies draining into Streams Originating Originating (2000) Adjacent (Karachi) (Karachi)
(Islamabad) SoanRiver EasternSdeof WesternSde (2002) (Islamabad) the Ravi River of the Ravi
(Lahore) River (Lahore)
Sources: Investigation of Air and Water Quality (Lahore, Rawalpindi, Islamabad): Japanese International Corporation Agency (JICA), 2000; Investigation on Industrial Water Quality. Islamabad: Japan International Cooperation Agency (J1CA)Fakistan Environment Protection Agency, Government o f Pakistan, 2001 ; Pilot Water Quality Monitoring Program in Sindh. Draft Final Report. Karachi: Sindh Environment Protection Agency, Government o f Sindh, 2002.
154. Although groundwater i s s t i l l the primary source o f drinlung water supplies, it i s estimated that 40 mi l l ion residents depend o n irrigation water for their domestic use, especially in areas where the groundwater i s braclush. The associated health risks are grave, as bacteriological contamination o f irrigation water often even exceeds WHO l i m i t s even for irrigation. The poor quality o f drinking water has major socio-economic consequences for Pakistan. A study conducted by UNICEF found that 20-40 percent o f the hospital beds are occupied by patients suffering f rom water-related diseases, such as typhoid, cholera, dysentery and hepatitis, which are responsible for one third o f a l l deaths. A s the analysis in Chapter I1 presented, the total health costs associated with the deaths and sickness caused by waterborne disease are estimated to amount to more than 1.8 percent o f GDP.
Municipal Effluent: the Principal Source of Water Pollution
155. Mos t surface water pollution i s associated with urban centres. Typically, nullahs and storm water drains collect and carry untreated sewage which then flows into streams, rivers and irrigation canals, resulting in widespread bacteriological and other contamination. It has been estimated that around 2,000 mi l l ion gallons o f sewage i s being discharged to surface water bodies every day.
156. water body, collection levels are estimated to be n o greater than 50 percent nationally (less than 20 percent in many rural areas), with only about 10 percent of collected sewage effectively treated. Although treatment facilities exist in about a dozen major cities, in some cases these
Al though there are some sewerage collection systems, typically discharging to the nearest
51

have been built without the completion o f associated sewerage networks, and the plants are often either under-loaded or abandoned. In effect, only a few percent of the total wastewater generated receives adequate treatment before discharge to the waterways.
Industrial Effluent: Uncontrolled Hazardous Discharges
157. surface waters, in the absence of strong monitoring and enforcement, compliance i s very low. It has been reported that in Lahore, only 3 out o f some 100 industries using hazardous chemicals treat their wastewater adequately. In Karachi, two o f the biggest industrial estates in Pakistan have n o effluent treatment plant, and effluent containing hazardous materials, including heavy metals, i s discharged directly into the r iver and harbour. There are, however, plans to install Combined Effluent Treatment Plants (CETPs) in both industrial areas, with ADB support. International experience teaches that the principal challenge wil l be financing the operation o f these plants. In Faisalabad, one of the biggest industrial cities, there i s l i tt le segregation o f domestic and industrial wastes, and although there i s a simple effluent treatment plant, its operational efficiency i s not known as there i s n o regular monitoring.
Although the NEQS are intended to regulate the discharge o f industrial effluents to
158. support o f some private sector institutions and NGOs, and this i s a practical step in moving forward within the practical constraints o f the environment agencies. The provincial EPAs/EPDs are also beginning to develop baseline data on industrial discharges which provides a platform for targeted enforcement approaches.
The Pakistan EPA has implemented a self-monitoring and reporting program, with the
Agricultural Runof$ Evidence of Pesticide Contamination
159. national level but with an estimated 5.6 m i l l i on tonnes o f fertilizer and some 70,000 tonnes o f pesticides used annually, pollution f rom agricultural sources can be expected in receiving waters. In 107 samples o f groundwater collected f rom various locations in the country between 1988 and 2000,3 1 samples were reported to have concentrations o f pesticides beyond FAO/WHO safety limits. area o f 1,000 km2, t o look at the extent o f groundwater contamination by agrochemicals. Of ten groundwater samples in Faisalabad District drawn f rom a depth o f 10-15m, seven were contaminated with unsafe levels o f one or more pesticides (PCRWR, 1991). Although the study concluded that the contamination had reached only the shallow aquifers, evidence suggested that i t was gradually reaching the deeper aquifers as well. The contribution o f agricultural drainage to the overall contamination o f the water resources has not been determined. I t i s believed to be a small part o f the total load but can be important in local hot-spots.
The quantity or quality of agricultural runof f has not been measured or tested at the
31 A pi lot project was undertaken in 1990-91 in Samundari, Faisalabad District over an
4. Institutional Design for Water Quality Protection
160. In 2004, a National Coordination Committee o n Water and Sanitation (NCCWS) was notified, under the chairmanship o f the Federal Secretary o f Environment with representatives f rom both public and private sectors, as wel l as c i v i l society and development partners. The objectives o f the NCCWS are to review polices and standards for water supply and sanitation, and to develop plans and projects for the sector. An important institutional step will be to ensure that
31 Pol icy and Strategy for Rational Use o f Pesticides in Pakistan. Building Consensus for Action.
Islamabad: Uni ted Nations System in Pakistan Publication, 2001.
52

the NCCWS includes the key agencies with relevant power over water resources, particularly the Ministry o f Water and Power, and WAPDA. The agenda o f the NCCWS should be focused on coordination rather than implementation. The challenge o f improving access to safe water and sanitation w i l l not be met by the environmental sector working on i ts own, and one o f the f i rs t steps must be to increase the degree o f cooperation with other government agencies, as well as communities, to agree on priority issues and to work with them on implementation.
161. increased through the Ministry’s chairmanship o f the NCCWS and role as the lead agency o f the Clean Drinking Water program. A major task for the NCCWS will be to develop practical proposals for Pakistan to achieve progress towards the Millennium Development Goals for improvement o f access to safe dnnhng water and sanitation. Meeting these new challenges will increase pressure for staff in M o E with the relevant background and qualifications. The challenges o f protecting the quality o f water sources, and expanding water supply and sanitation coverage are made more difficult by the complex institutional setting. There are three major topic areas where the MoE, provincial environmental authorities, and local governments have a role to play, (i) protection o f water sources, (ii) water supply and sanitation service provision, and (iii) regulation o f drinlung water quality. The appropriate division o f institutional responsibilities between each o f these areas i s considered in more detail below.
The responsibilities o f the M o E for water supply and sanitation have been significantly
Water Source Protection: an Important Role for Environmental Authorities
162. One set o f issues relates to the monitoring and protection o f water sources, including surface water (all rivers, canals and drains which are used by communities) and groundwater. The NWP recognizes the deterioration in quality o f both surface and groundwater, and the urgent need to address this problem. In response, the Policy highlights the need to implement a National Water Quality Monitoring Program. Wh i le ad hoc surveys have been conducted, there i s no regular or consistent monitoring o f source water quality. This clearly should involve the environmental authorities as having a principal responsibility for providing an overview o f water quality, but monitoring o f canal and drainage water quality i s also a mandate o f the irrigation departments. The irrigation authorities conduct regular monitoring o f salinity and other parameters relevant to their operations, but do not normally test for heath-related parameters. Some broader studies have been carried out (e.g. those by PCRWR) but there i s no overall water quality monitoring program, and MoE should take the lead in clarifying the needs and practical scope o f such a program.
Providing Water Supply and Sanitation Services: a Local Government Mandate
163. Prior to devolution, responsibility for the provision o f water supply and sanitation services rested with provincial governments, and was exercised though Development Authorities (DAs) or Water and Sanitation Authorities (WASAs) in urban areas, and provincial Public Health Engineering Departments (PHEDs) in rural areas. As part o f the devolution process, water and sanitation are now assigned to tehsils, except in the case o f city districts where they are district responsibilities. Whi le M o E has an important role to play in reporting on progress towards the relevant MDGs, and i s presently implementing a national mandate to provide water treatment plants under the Clean Drinlung Water initiative, in overall terms water and sanitation i s an operational function that must have a strong local dimension.
53

Regulating Drinking Water Quality: a Tiered Approach
164. One o f the top priorities o f the NEP i s to establish the legal and policy framework for providing safe drinking water. M o E should take a lead in developing this framework, with a focus o n defining clear roles and responsibilities. The set o f activities around standard setting, testing, monitoring and reporting should be one o f the focal areas for the Ministry as well as provincial environmental agencies. T h i s does not imply that a l l the necessary sampling and testing should be done in house, but it should be the objective o f the Ministry to be able to provide reliable information and clear advice to both consumers and decision-makers.
165. supply services, in particular the bacteriological and chemical quality o f the water as it i s received by users. This i s also clearly t ied to efforts to upgrade the coverage and overall quality o f water services. There have been some studies o f the quality o f water delivered (for example the PCRWR work) but there i s n o structured system in place. In 2002, the Palustan Standards and Quality Control Authority (PSQCA) issued a drinking water quality document, in line with WHO guidelines, but this i s a guidance document and i s not enforceable o n water service providers. Consequently, there are currently n o drinking water quality standards in Palustan to protect users. Once such standards are established, the ideal system for monitoring water supplies would be through a tiered approach, including routine sampling by the operator, monitoring by the local or provincial health or environmental authorities, with oversight, review and consolidated reporting by MoE. Designing and putting such as system in place (which will require resources and s h l l s at a l l levels) could be an important task for MoE.
F rom the point o f v iew o f public health, there i s an important need to monitor water
5. Setting a Regulatory Foundation: Use-Based Standards for Water Sources
166. Protection o f ambient water quality (both surface and groundwater) i s an essential part o f the mandate o f the environment authorities. In this context, the NEP identifies the need to establish a use-based system for classification o f water bodies, as a first step in setting objectives for protection and rehabilitation. This must be followed by clean-up o f priority waterbodies, to avoid the recurrence o f health crises caused by the use o f polluted water. Such a program would require the refinement o f standards, clarification o f responsibilities, better information systems and additional support for the enforcement o f discharge standards.
167. Under the Pakistan Environmental Protection A c t (PEPA), the discharge o f any pollutant in excess o f the National Environmental Quality Standards (NEQS) i s prohibited, and penalties are prescribed. NEQS have been established for municipal and industrial effluents discharged to inland waters, sewage treatment facilities, and the sea. Pakistan EPA i s charged with implementation o f PEPA, but has delegated powers to provincial EPAs for implementation o f the A c t within their respective provinces. At the district level in Punjab, an Environmental Officer i s appointed to maintain environmental standards and further delegate tasks within the district and i t s municipalities. Other laws that relate to the prevention o f pollution o f water bodies include the Canal and Drainage Ac t (1 873) and the Punjab M ino r Canals A c t (1905), which prohibit the corrupting or fouling o f canal water, and give irrigation authorities powers to control discharges to the irrigation system. In addition, the Sindh Fisheries Ordinance (1980) prohibits the discharge o f untreated sewage and industrial waste into water.
168. which would guide the use and protection o f major water bodies and would provide a basis for pr ior i ty efforts in enforcing NEQS requirements. Approaches used internationally are usually based o n the concept o f Beneficial Uses o f any water body, such as irrigation, fish breeding and
A significant gap in the regulatory system i s the lack o f ambient water quality standards,
54

capture, drinkmg water supply, and recreation (see B o x 6.1). Reasonable goals can be set for each stretch o f water in terms o f such uses, based on current or proposed h t u r e activity. One critical use i s drinking water supply (either directly or after water treatment) for which ambient standards should be set to protect o f the water source. Once an understanding o f critical uses i s established, there i s a clear and persuasive basis for regulation o f pollution discharges and water abstraction in the light o f such goals.
Box 6.1: Beneficial Use Water Standards in the State of Minnesota
“Beneficial uses” are the uses that the government decides to make o f their water resources. In the USA, the process of determining beneficial uses i s spelled out in the federal rules implementing the U S Federal Clean Water Act. In the State o f Minnesota, seven beneficial uses are defined and these uses and the use-class designations are as follows.
Drinking water source - Class 1 Aquatic l i f e and recreation - Class 2 Industrial use and cooling - Class 3 Agricultural use, irr igation - Class 4A Agricultural use, livestock and wi ld l i fe watering - Aesthetics and navigation - Class 5 Other uses - Class 6 Limi ted Resource Value Waters - Class 7.
Class 4 B
In t h i s scheme, the class numbers 1-7 are not intended to imply a pr ior i ty ranking t o the uses.
Source: www.pca.state.mn.uslwateristandards1
169. identify priority uses which need to be protected, and develop cooperative programs to implement essential protection measures. A formal process of agreeing Beneficial Uses for the whole water system would be a long and complex process but it should be possible to reach agreement o n certain critical water bodies or reaches for short term action. Many o f the actions necessary to implement a source protection program are the responsibility o f provincial or local authorities and the action are often under the control o f private sector industries so a process o f discussion and delegation will be required to agree o n federal, provincial, and sectoral roles in setting and enforcing ambient and effluent standards.
One key action area for M o E should be to review available ambient water quality data,
6. Building Local Capacity to Provide Water and Sanitation Services
170. sanitation to local government, unfortunately Tehsil Municipal Administrations (TMAs) have litt le capacity to undertake these responsibilities. Further, although the NWP stresses the need to engage the private sector in the delivery o f urban water supply and sanitation services, there i s no Federal or provincial legal framework to guide private-public partnerships.
Whi le the devolution process may have assigned responsibility for water supply and
‘
17 1. Bo th rural and urban areas suffer f rom under-investment in water supply and sanitation, compounded in many cases by the inadequacy o f revenues to satisfy maintenance requirements. In rural areas, over 40 mi l l ion people lack access to safe dnnking water, while 60 m i l l i on lack adequate sanitation. Figures available for implemented schemes may be a poor indicator o f actual coverage as many do not serve the entire population for which they were installed, some are in a state o f disrepair, and coverage figures mask the poor quality o f water being provided.
55

The situation regarding sanitation i s even more serious. Sewerage systems, where they exist, are usually poorly maintained and often contribute to the cross-contamination o f water systems and groundwater pollution. The few treatment facilities are often non-functional or ineffective.
172. upgrading water supply and sanitation. Palustan currently spends less than one quarter o f a percentage point o f i t s GDP o n water supply and sanitation. According to rough estimates, to provide adequate drinking water and sanitation to all, Palustan will need investments in the order o f $5 billion. This excludes operation and maintenance costs, which should be recovered as far as possible through service charges. M o E can take a coordinating role in working with provincial and local authorities to develop better information o n the gaps and to prepare realistic programs for upgrading. In practice, however, it i s not for M o E to take the lead in implementing such a program.
In the absence o f detailed data, i t i s not possible to make reliable estimates o f the costs o f
173. the goal o f which i s to provide treated water to urban centers across the country. The Program focuses o n the construction o f small scale water filtration plants at easily accessible points in areas which suffer f rom poor water quality. Experience worldwide shows, however, that physical infrastructure provision by itself i s not enough to improve basic health indicators. The commitment and ownership o f local authorities are essential for sustainable improvements in water supply and public health.
Significant resources have been committed through the Clean Drinking Water program,
7. Creating Tiered Capacity to Regulate Drinking Water Quality
174. at the local level but only the major c i ty WASA’s have the technical resources for regular monitoring and there i s n o routine high-level oversight or reporting o f the quality o f water supplied across the country. In general, local authorities have very l i t t le capacity for the operation and control o f their water systems and poor water quality i s often not flagged until there i s a noticeable increase in water-related illnesses. Some TMAs have simple monitoring k i ts provided by UNICEF which allow them to track basic parameters but this i s not the general case. There have been two broad studies in the past f ive years (by PCRWR) but this does no t yet provide an adequate baseline.
In principle, the quality o f drinking water “at the tap” should be regulated and monitored
175. The ideal system would be a tiered one. At the level closest t o the consumer, TMAs should have adequate resources and knowledge for routine monitoring o f one or two simple parameters. The objective at this level i s essentially to conf i rm that the basic water system i s operating in a stable mode. provincial level should carry out regular oversight o f the local systems, with some independent sampling and monitoring. The purpose o f this work i s to check the TMA findings, to carry out more detailed testing o n additional parameters, and to provide a comparative picture o f different systems and areas to allow decisions to be made o n upgrading and expanding systems. The role o f M o E at the national level would be quality assurance (including, for example, inter-laboratory comparisons), and consolidated reporting at the national level o n trends and achievements.
At the next level, health or environmental authorities at the local or
176. testing and it i s important to carry out the work as effectively as possible. At the local level, where the objective i s essentially to flag exceptions or breakdowns, then very simple methods can be used. For general monitoring, the range o f parameters routinely tested should be chosen to be simple, robust and manageable with the testing resources currently available in public and private sector laboratories. There will be a need for some more sophisticated testing, for verification o f
There i s l imi ted technical capacity (sk i l ls and equipment) to carry out the sampling and
56

the routine work and for occasional monitoring of a wider range o f parameters but this again should be camed out mainly using existing facilities, which include PCRWR and MoE’s own laboratories.
177. Designing and putting such as system in place (which will require resources and sk i l ls at a l l levels) would be an important task for MoE. The role o f MoE would be to ensure that the system provides a level o f confidence in the monitoring o f dnnlung water supplies, together with the use o f the information to target programs to upgrade and expand the service provided to the population.
8. Opportunities for Development Partner Support
178. Water supply, sanitation and the safeguarding o f water quality constitute a very large agenda, and Palustan needs the support o f i t s development partners in i t s implementation. JICA has recently initiated assistance with source water quality monitoring equipment and training which can provide the basis for work o n water uses and priorities for tackling pollution problems. Areas that have been indicated for possible Wor ld Bank support include the development o f used- based standards, technical assistance to a l l levels o f government for targeted monitoring and enforcement o f discharges, and the establishment o f a system to understand and track the quality o f water at the point o f delivery.
57

VII. RECOMMENDATIONS AND A PROPOSED W A Y FORWARD 179. The urgency for addressing Palustan’s environmental problems has probably never been greater. Conservative estimates presented in this report suggest that environmental degradation costs the country at least 6 percent o f GDP, and these costs fa l l disproportionately upon the poor. The most significant causes o f environmental damage identif ied and estimated in this report are: (i) inadequate water supply, sanitation and hygiene; (ii) soil degradation; (iii) indoor air pollution; (iv) urban air pollution; and (v) exposure to lead. Whether judged in terms o f regional performance or environmental stress factors, there i s significant scope to better ensure the sustainability o f Pakistan’s economic growth.
180. The preceding chapters o f this report have examined the current status o f environmental management in Pakistan, focusing o n three issues: (i) the environmental impact assessment system; (ii) urban air quality management; and (iii) water supply and sanitation. Suggestions for strengthening environmental management in these specific areas are presented in each chapter. Viewing environmental quality as the outcome o f an environmental “production function” involving pressures resulting f rom economic activities mitigated by a series o f institutional, regulatory and other incentives, this report identifies the main binding constraints o n environmental performance as fall ing into four categories: (i) gaps in incentives and accountability; (ii) institutional design; (iii) gaps in the regulatory framework; (iv) capacity limitations. Based o n the analysis presented in the preceding chapters, the principal features o f these constraints are summarized below, followed by a set o f recommendations for reducing these barriers to improved environmental quality and more sustainable economic growth. The chapter concludes with a set o f recommendations for immediate action.
1. Strengthening Linkages in Institutional Design
18 1. Constitutionally, Federal and provincial governments share the concurrent legislative authority for environmental pollution and ecology. In addition, Palustan EPA has delegated powers under PEPA to provincial EPAs to implement and enforce environmental regulations. Further, the mid-term review o f the NCS and the NEP both emphasize the need to develop the environmental management capacity o f provincial and local governments. Appropriate roles for national authorities within this environmental federalist structure include: (i) setting national pol icy and defining environmental quality goals: (ii) providing resources and oversight t o provincial environmental authorities; and (iii) publicly reporting o n progress in meeting national environmental objectives. Provincial environmental authorities should play the primary role in the environmental clearance process, the implementation o f compliance and enforcement, as wel l as the monitoring o f ambient environmental conditions. At the same time, the Federal environmental authority has a legal mandate to ensure the enforcement o f national laws and regulations, which includes Federal oversight and suspension o f delegated powers. Bringing greater clarity t o this structure would reduce the institutional design constraints to improved environmental outcomes, particularly in the areas highlighted below.
Establishing Guidelines for Oversight of Delegated Authorities
182. No oversight guidelines have been established for Federal environmental powers delegated to provincial EPAs. In principle, such guidelines should al low for delegation based on (i) the adequacy o f provincial regulations to achieve national objectives; (ii) the adequacy o f provincial technical expertise, staff, and resources to perform the delegated responsibilities; and
58

(iii) provincial commitment to share the information needed to monitor compliance and measure performance.
183. resolution, and provide a basis for Federal suspension o f delegated authorities when necessary. Such guidelines would facilitate Federal oversight o f provincial EIA clearances, for example. Although Palustan EPA reserves the right to suspend provincial EL4 clearance authority, this has never been exercised, in part for lack o f clarity o f oversight arrangements, limiting the effectiveness o f the Federal mandate, and ultimately o f the EIA system itself .
Oversight guidelines should also establish policies for funding assistance, dispute
Creating Partnerships for Clean Air
184. address the four principal sources o f urban air pollution, vehicular and industrial emissions, burning o f solid waste, and natural dust. Effective implementation o f the program will require the development o f partnerships between multiple tiers and sectors o f government. Wh i le Pakistan EPA i s responsible at the national level for setting air quality and emissions standards, and for defining associated systems for monitoring and enforcement, responsibility for the implementation o f these policies has been delegated to the provincial environmental authorities. City authorities are particularly important in the management o f urban air quality because o f the need to integrate emissions control measures with broader aspects o f urban planning, such as the provision o f public transport and zoning o f industrial developments. In establishing policies for clean air, the energy, fuel and transportation sectors will have important roles to play. An essential aspect o f PCAP’s institutional design, therefore, will be the formation o f partnerships and provision o f incentives between levels and agencies o f government.
MoE i s developing the Palustan Clean Air Programme (PCAP) to consolidate efforts to
Distinguishing Water Supply Roles: Source Protection, Service Provision, and Quality Control
185. In considering the protection o f water quality, i t i s useful to distinguish between the protection o f water sources, the provision o f water supply and sanitation services, and the regulation o f drinking water quality. Protection o f surface and groundwater sources should clearly involve environmental authorities, although irrigation departments also have an important role to play. As part o f the devolution process, the provision o f water and sanitation services i s are now assigned to local governments, and should continue to have a strong local dimension. The ideal system for regulation o f drinking water quality would be tiered, with local governments or operators conducting routine monitoring, provincial authorities carrying out regular oversight o f the local systems, and Federal agencies providing quality assurance, and reporting at the national level on trends and achievements.
2. Updating the Regulatory Framework
186. but do not establish standards for the ambient quality o f air or water. In addition, aspects o f these standards are out-of-date, no longer reflecting current understanding or technologies. The regulatory framework would be significantly strengthened by linking standards for ambient quality with updated standards for emissions, monitoring, and the provision o f public information, particularly in the areas described below.
The current NEQS provide standards for emissions and effluent from selected sources,
59
Developing Health-Based Air Quality Standards
187. Ambient air quality standards are the foundation upon which emission control strategies are based, usually adopted as enforceable regulations, typically with deadlines and schedules for attainment. Such standards are not simply limits for each pollutant: they also specify monitoring methods, locations and frequencies, averaging times and assessment procedures. Pakistan lacks a comprehensive set o f health-based air quality standards. This is partly l inked to the lack o f information on current conditions, but with the establishment o f an air quality monitoring network underway, i t would now be appropriate to develop national air quality standards based on a review o f the data generated, standards in other countries, and WHO guidelines. Whi le safeguarding public health should be the main consideration, the costs and likelihood o f achieving the standards should also be used to in form the standard-setting process.
Vehicle Emission and Fuel Quality Standards
188. when compared to most other countries. In updating them, the goal should be to set two standards, one for new registration vehicles, and the second for in-service vehicles. Establishment and achievement o f V E S are intrinsically l inked to fuel quality. For example, the current level o f sulphur in diesel in Palustan i s too high to be able to meet Euro I1 or Euro III emission standards, which have already been adopted in some South Asian countries. The cost o f moving to lower sulphur diesel needs to be evaluated against the potential economic benefits in terms o f lower emissions and better health. Based o n the current condition o f the vehicle fleet and fuel quality, i t would be appropriate to adopt a phased approach to the tightening o f VES and fuel standards, developed in consultation with al l stakeholders.
The Vehicle Emission Standards (VES) currently specified in the NEQS are outdated
Establishing Use-Based Water Quality Standards
189. In this context, the NEP identifies the need to establish a use-based system for classification of water bodies, as a f i rst step in setting objectives for protection and rehabilitation. Approaches used internationally are usually based on the concept o f Beneficial Uses o f any water body, such as irrigation, fish breeding and capture, drinking water supply, and recreation. Reasonable goals can be set for each stretch o f water in terms o f such uses, based o n current or proposed future activity. Once an understanding o f critical uses i s established, there i s a clear and persuasive basis for regulation o f pollution discharges and water abstraction in the light o f such goals. Whi le a formal process o f agreeing Beneficial Uses for the whole water system would be a long and complex process, i t should be possible to reach agreement on certain critical water bodies for short term action. A process o f discussion and delegation wi l l be required to agree o n federal, provincial, and sectoral roles in setting and enforcing ambient and associated effluent standards.
The lack o f ambient water quality standards i s a significant gap in the regulatory system.
Drinking Water Quality Standards
190. provision o f safe drinking water. MoE should take a lead in developing this framework, with a focus o n defining clear roles, including assigning responsibility for the development o f drinhng water standards. There i s an important need to monitor water supply services, in particular the bacteriological and chemical quality o f the water as it i s received by users. In 2002, the Palustan Standards and Quality Control Authority (PSQCA) issued a drinking water quality document, in line with WHO guidelines, but this i s a guidance document and i s not enforceable on water
One o f the top priorities o f the NEP i s to establish the legal and pol icy framework for the
60
service providers. Consequently, there are currently n o formal drinkmg water quality standards in Pakistan to protect users, a gap which should be f i l led as a matter of priority.
3. Building Institutional Capacity for Environmental Management
191. funding i s less o f a constraint than the capacity to apply available resources. The availability o f these resources presents an important opportunity to develop capacity in environmental authorities at Federal, provincial and local levels to implement the strengthened regulatory framework described above, as wel l as to mainstream the development o f environmental management capacity in key sectoral agencies, and to upstream such capacity in planning departments. Effective use o f these resources will a l low these agencies to address a shortage of qualified staff by contracting technical assistance, focusing on:
With significant new resources proposed for environmental purposes in the MTDF,
0 the outsourcing o f services to monitor environmental quality, as wel l as to analyze and disseminate the results;
the development o f environmental standards, particularly in priority areas such as the establishment o f ambient air and water quality standards;
expert input for the review o f environmental assessments.
0
192. valuable vehicles to build provincial and local government environmental management capacity. PSDF rules allow environmental fees and charges to be credited to these funds, not only strengthening incentives for better performance by environmental agencies, but also raising the possibility o f a more sustainable and predictable source o f funds for on-going capacity building.
In the longer term, Provincial Sustainable Development Funds (PSDFs) are potentially
Strengthening Capacity for Effective Environmental Impact Assessments
193. Efforts to strengthen capacity for more effective EIAs need to address four weaknesses in the current system, (i) a lack o f expert input for technical reviews, (ii) a widespread ignorance o f requirements and procedures, both in government and the private sector, (iii) the lack o f a system to identify projects, both public and private, that should be required to submit an EM, and (iv) the current weak enforcement o f EL4 clearance conditions.
194. Providing resources to access expert advice would help the Pakistan and provincial EPAs ensure that information provided in EIAs i s adequate, and effectively used in the decision-malung process. Expert guidance would be particularly useful to ensure that alternatives, mitigation measures and monitoring are appropriately addressed. T o build broader awareness o f EIA requirements, assistance should be provided to enable a l l provinces to establish EIA training programs similar to that o f NWFP, in partnership with local universities or other training organizations. External technical assistance could also be used to develop systems to ensure better coverage o f EIAs, and to provide the additional technical and legal capacity required to help enforce implementation o f environmental management measures identified in EIAs.
Outsourcing Technical Functions for Urban Air Quality Management
195. In order to manage urban air quality, i t i s critical t o monitor criteria pollutants and conduct emissions inspections o f priority sources. The primary responsibility for this should rest with provincial EPAs. International experience underlines the need to ensure sustained resources for the operation and maintenance o f monitoring equipment, and to retain trained technical staff.
61

T o address these issues, outsourcing technical functions to private or academic institutions should be considered, drawing on international experience with private sector contracts for air quality monitoring, the operation o f emissions inspection and vehicle maintenance programs, as wel l as initiatives to reduce emissions f rom corporate vehicle fleets.
Building Capacity to Protect Water Quality
196. increase resources for this purpose at a l l three levels o f government, with an emphasis on coordination at the Federal level, enforcement at the provincial level, and investment locally. The three priority areas for strengthening the capacity o f MoE, provincial environmental authorities, and local governments are: (i) protection o f water sources; (ii) water supply and sanitation service provision; and (iii) regulation o f hnlung water quality.
The emphasis o f the NEP o n ensuring the safety of water supplies highlights the need to
197. the mandate o f the environment authorities. The establishment o f a use-based system for classification o f water bodies and the subsequent clean-up o f priority waterbodies wil l require significant resources over a lengthy period. Even during the init ial process o f agreeing Beneficial Uses for selected critical water bodies, Federal and provincial environmental authorities will require substantial technical assistance for water quality monitoring and stakeholder consultation.
Protection o f ambient water quality (both surface and groundwater) i s an essential part o f
198. process has assigned responsibility for water supply and sanitation to local governments. The NWP stresses the need to engage the private sector in the delivery o f these services, to supplement scarce public resources. T o help TMAs meet this challenge, there i s an urgent need to develop legal frameworks to guide private-public partnerships.
The need for physical investments i s greatest at the local level, where the devolution
199. local capacity for routine monitoring o f a few simple parameters, provincial resources sufficient for regular oversight o f the local systems, and M o E providing quality assurance and consolidated reporting at the national level. Designing and putting such as system in place will be an important task for MoE, requiring a significant level o f expert input, equipment and training.
The ideal system for regulation o f drinking water quality would be a tiered one, with
Mainstreaming and Upstreaming
200. Many o f the investments with the most significant environmental consequences are those undertaken by the Federal or provincial governments, for example in roads, irrigation and power. In November, 2004, ECNEC issued a notice reinforcing the requirement that EIAs should be prepared for al l major public sector investments. Whi le environmental cells have been created in a few key agencies, additional resources and incentives are required to increase the capacity o f key l ine agencies to prepare adequate EMS, and effectively implement associated Environmental Management Plans.
201. important force for environmental upstreaming through i ts mandate to address environmental concerns at the policy, project conceptualization, and approval stages o f public sector projects. Provincial planning departments have established corresponding environment sections for environmental screening o f project proposals within their jurisdictions. The establishment o f these sections i s significant, and their l imi ted permanent capacity should be supplemented with expert assistance as necessary to conduct detailed environmental reviews and advise o n the preparation o f environmental management plans.
The Environment Section o f the Planning and Development (P&D) Divis ion i s an
62

202. policy-making, planning and budgeting, M o E must lead the sustainable development dialogue. Within this dialogue, and in particular through the PRSP update process, the effective promotion o f sustainable development will require more rigorous analysis demonstrating that environmental degradation i s a constraint t o economic growth and poverty reduction. The M o E can help guide this PRSP update process by preparing an environment chapter for the PRSP I1 which would outline the environmental management challenges and opportunities associated with accelerated growth. T o produce and help present such analysis, MoE will require additional resources to contract the necessary analytical expertise.
In order for environmental considerations to be more fblly upstreamed into national
4. Reinforcing Incentives and Accountability
203. will only be achieved by ensuring stakeholders are informed and empowered. Opportunities to strengthen environmental accountability in Pakistan include measures to improve public consultation and disclosure in the EIA process, the public provision o f information o n environmental quality, and support for the involvement o f c iv i l society in environmental management and enforcement.
Accountability t o stakeholders i s essential for sound environmental management, and
Public Consultation and Disclosure of EIAs
204. benefits both project proponents and other stakeholders; however consultation in Pakistan has often proven to be l imi ted and ineffective. Possible measures to strengthen this process include: (i) requiring project proponents to develop a public consultation plan, (ii) creation o f EIA information centers at federal and provincial levels, (iii) public disclosure o f a l l EIA fi l ings o n a website for easy access by the public and private sector, and (iv) public provision o f a non- technical summary o f EIA decisions.
As recognized in the EIA Guidelines, strong public participation in the EIA process
Public Information to Support Clean Air and Safe Water Initiatives
205. Local and national air quality information dissemination strategies are required, both to build public support for urban air quality improvement initiatives, and to enable the issuance of health alarms in case o f serious exceedance o f standards. As most emissions abatement measures involve trade-offs requiring public support, the PCAP should place considerable emphasis o n the public provision o f air quality data and associated health impacts. Dissemination strategies may include the daily publication o f an Air Quality Index, as discussed in Chapter V.
206. quality not only enables health alerts to be issued, but also builds support for water supply investments, and most importantly, for recovery o f the costs necessary to operate and maintain safe water supply systems.
As with air quality data, the public provision o f information regarding hnktng water
Empowering Civil Society
207. enforcement. Whi le there i s often a tension between government regulators and c i v i l society organizations, they share an interest in ensuring a healthy environment. Active citizen involvement in environmental enforcement can help supplement an agency's efforts by raising public awareness and building popular support for otherwise controversial enforcement actions.
Citizen involvement i s an important resource for environmental compliance and
63

This role can be reinforced both by involv ing concerned c i v i l society stakeholders in environmental management, as achieved, for example through the Lahore Clean Air Commission, and by supporting public interest advocacy through legal associations and the establishment o f environmental law clinics at universities.
5. Rising to the Challenge: A Proposed Way Forward
208. The approval o f the NEP and the significant increase in the Federal budget proposed for environmental management in the MTDF present both a challenge and an important opportunity for Pakistan’s environmental authorities. Meeting the challenge and rising to the opportunity will require not only a strategic program o f capacity building, but also the establishment o f incentives to encourage improved performance in environmental management at a l l levels o f government.
Incentive-Based Partnerships: National Goals, Local Priorities
209. One institutional approach to building capacity and encouraging improved performance at different levels o f government i s to develop incentive-based partnerships between the Federal and provincial EPAs, as wel l as between provincial authorities and local governments. These would link the transfer o f financial support for institutional strengthening with demonstrated performance in improved environmental management.
210. o f government. T o establish incentive-based partnerships, Federal and provincial environmental authorities would mutually agree goals and priorities, performance indicators and needs, and define respective roles and responsibilities. T h i s would fa l l naturally within the process o f developing action plans at the Federal and provincial levels envisioned in the NEP. These action plans would include agreed performance indicators around identified provincial priorities, which would in turn contribute to national goals for the environment as set out in the NEP. Similarly, provincial governments would, as appropriate, establish performance-based partnerships with district and tehsil governments for environmental f inctions devolved to the local level. Further building on the vision established in the NEP, funds would be transferred between levels o f government following satisfactory achievement o f the agreed indicators. T w o important pre- requisites for such an approach to function effectively are (i) the translation o f the NEP’s broad directions into specific targets, and (ii) the establishment o f an efficient system o f performance- based transfers, combining transparent decision-malung with the minimum number o f administrative hurdles.
For its implementation, the NEP calls for a framework o f action plans at a l l three levels
Pakistan Clean Air Program
2 1 1. initiatives for the management o f urban air quality, involv ing a variety of sectors, levels o f government and development partners. The complexity o f the issues to be addressed, involving both city-specific and inter-sectoral considerations, suggests that the PCAP might best be supported as a stand-alone program, complementing broader incentive-based partnerships for NEP implementation.
MoE i s developing the PCAP as a vehicle to support a range o f ongoing and proposed
A Strategy for World Bank Assistance
212. based partnerships to meet the goals o f the NEP, and the implementation o f the PCAP. The Bank’s support for the NEP i s init ially focused on providing technical assistance to M o E for the
The Wor ld Bank i s strategically placed to support both the development o f incentive-
64

development o f provincial action plans. Drawing o n the lessons o f international experience with similar exercises, the a im i s to facilitate a process through which provincial authorities will establish their own priorities within the broad matr ix of national environmental goals la id out in the NEP. The Bank i s prepared to provide analytical support to help provincial authorities establish environmental management priorities based on consideration o f economic, technical and social realities, as wel l as assistance with the definition o f monitorable indicators to provide the basis for measuring performance. As action plans are defined, the Bank i s also prepared to consider investment support for their implementation.
2 13. For implementation o f the PCAP, whi le JICA i s funding monitoring equipment which will provide necessary data, there i s l imi ted capacity to plan and implement specific interventions. The Bank has been asked to bring implementation experience f rom other cities in the region, which will be provided init ially through technical assistance, with the possibility o f subsequent investment support as plans become more concrete.
214. In addition to providing assistance for implementation o f the NEP and PCAP, the Bank also plans to support further analysis o f selected priority environmental concerns. Potential issues to be addressed include industrial and urban pollution, environmental management in the water sector, and sustainable environmental management at the local level.
Immediate Actions
215. The list o f recommended actions presented in this report i s extensive, and will take a number o f years to implement. However, the range o f environmental challenges facing Pakistan i s also extensive, and ignoring these problems will only result in accelerating economic damage that will impede growth and poverty-reducing development. To catalyze the reform process, there are some priority actions among the proposed interventions that should be immediately initiated by MoE, including:
establishment o f standards for environmental quality, especially ambient air quality standards, use-based ambient water quality standards, and drinking water quality standards; establishment o f oversight guidelines for the EIA clearance functions delegated to the provinces; contribution o f an environment chapter t o the PRSP update; and, development o f protocols for the collection, analysis and dissemination o f data o n natural resource management. Whi le this report has focused on urban and industrial environmental challenges, there are growing problems in sustaining the country’s natural resources, and effective interventions are constrained by the paucity o f data.
65

Appendix 1: Measures Proposed in the Pakistan Clean Air
Short Term Measures
Stop import and local manufacturing of two stroke vehicles
Restriction on conversion of vehicles from gasoline engine to second-hand diesel engines Launch effective awareness campaign against smoke emitting vehicles High pollution spots in cities may be identified and control through better traffic management such as establishment of rapid mass transit and traffic free zones Capacity building of Motor Vehicle Examiners
Regular checking of quality o f fue l and lubricating oils sold in the market
Covering of buildingdsite during renovation and construction to avoid air wllution Phasing out of 2-stroke and diesel run public service vehicles
Base line data collection on ambient air quality using fixed and mobile laboratories CNG driven buses will be given tariff preference
Fiscal incentives and a financing mechanism are adopted to provide resources to the transporters Launch of effective awareness campaign against smoke emitting vehicles Establishment of environmental squad of traffic police in all major cities to control visible smoke
Responsible Agency WO Commerce md M/O [ndustry
Provincial Government
Provincial Government
Provincial Government
MI0 Petroleum and Natural Resources
Provincial Government
Federal and Provincial Governments
Federal and Provincial EPAs
M/O Industries and M/O Finance M/O Communication and Provincial Government Provincial Governments
Provincial Governments
Long-term Measures
Creation of public awareness and education
Setting up continuous monitoring stations in cities to record pollution levels in ambient air
Introduction of low sulphur diesel and furnace oil and promotion of alternative fuels such as CNG, LPG and mixed fuels in the country
Identify pollution control devicedadditives for vehicles and encouraee their use Promotion of waste minimization, proper disposal of solid waste in cities, waste exchange and pollution control technology in industries Improvement of energy efficiency in vehicles and industry
Review Motor Vehicle Ordinance to provide for inspection of private vehicles
Establish vehicle inspection centres
Block tree plantation in cities, forestation in deserts and sand dune stabilization Shoulders along roads should be paved
Responsible Agency
M/O Environment and Provincial Environment Department M/O of Environment and Provincial Government
M/O Petroleum and Natural Resources
M/O Environment, M/O Petroleum
Federal and Provincial EPAs, FPCCI, and M/O
M/O Environment I&P)
Federal and Provincial Governments
M/O Communication and Provincial Government M/O Environment and Provincial Forest Department M/O Communication and Provincial Government
32 From Annex 2 o f PCAP, 2005.
66