strategic economic decision-making: using bayesian belief ... · strategic economic...
TRANSCRIPT

Strategic Economic Decision-Making:
Using Bayesian Belief Networks to Make
Complex Decisions
A White Paper Highlighting the Capabilities of the
BayeSniffer Algorithm
Dr. Jeff Grover, Sr., The DataSniffer
DBA Consulting, Inc.
October 5, 2014
https://BayeSniffer.com
Reviewed by Mr. Jeff Grover, Jr., PhD. Student
University of Kentucky, Department of Economics
1

Report Documentation Page Form ApprovedOMB No. 0704-0188
Public reporting burden for the collection of information is estimated to average 1 hour per response, including the time for reviewing instructions, searching existing data sources, gathering andmaintaining the data needed, and completing and reviewing the collection of information. Send comments regarding this burden estimate or any other aspect of this collection of information,including suggestions for reducing this burden, to Washington Headquarters Services, Directorate for Information Operations and Reports, 1215 Jefferson Davis Highway, Suite 1204, ArlingtonVA 22202-4302. Respondents should be aware that notwithstanding any other provision of law, no person shall be subject to a penalty for failing to comply with a collection of information if itdoes not display a currently valid OMB control number.
1. REPORT DATE 05 OCT 2014 2. REPORT TYPE
3. DATES COVERED 00-00-2014 to 00-00-2014
4. TITLE AND SUBTITLE Strategic Economic Decision-Making: Using Bayesian Belief Networks toMake Complex Decisions
5a. CONTRACT NUMBER
5b. GRANT NUMBER
5c. PROGRAM ELEMENT NUMBER
6. AUTHOR(S) 5d. PROJECT NUMBER
5e. TASK NUMBER
5f. WORK UNIT NUMBER
7. PERFORMING ORGANIZATION NAME(S) AND ADDRESS(ES) DBA Consulting, Inc.,512 Maple Crest Way,Elizabethtown,KY,42701
8. PERFORMING ORGANIZATIONREPORT NUMBER
9. SPONSORING/MONITORING AGENCY NAME(S) AND ADDRESS(ES) 10. SPONSOR/MONITOR’S ACRONYM(S)
11. SPONSOR/MONITOR’S REPORT NUMBER(S)
12. DISTRIBUTION/AVAILABILITY STATEMENT Approved for public release; distribution unlimited
13. SUPPLEMENTARY NOTES presented at the How Risk Assessments Inform National Security Decision Making, 14-17 October 2014held in Alexandria, VA. Sponsored by the Military Operations Research Society (MORS) and the SecurityAnalysis and Risk Management Association (SARMA).
14. ABSTRACT
15. SUBJECT TERMS
16. SECURITY CLASSIFICATION OF: 17. LIMITATION OF ABSTRACT Same as
Report (SAR)
18. NUMBEROF PAGES
13
19a. NAME OFRESPONSIBLE PERSON
a. REPORT unclassified
b. ABSTRACT unclassified
c. THIS PAGE unclassified
Standard Form 298 (Rev. 8-98) Prescribed by ANSI Std Z39-18

1 Executive Summary
By nature, big data stored or warehoused in organizational storage facilities does
not immediately suggest courses of action to maximize revenues, minimize costs or
does it suggest optimal results. The challenge of any organization is to extract
actionable business intelligence solutions from these data. We suggests the use of
the BayeSniffer algorithm as a unique discrete data-sniffing tool to translate struc-
tured data into business intelligence through a Structured Query Language (SQL)
server-based approach. The concept of the BayeSniffer follows empirical research on
Bayesian belief networks (BBN) and the publication of Strategic Economic Decision-
Making: Using Bayesian Belief Networks to Solve Complex Problems (Grover, 2013).
We interpret the results of the BayeSniffer inductively to provide a consistent
translation of the analysis we obtain from the use of BBN. With the deluge of data-
mining protocols available in the market today, our niche is evaluating structured
data information and translating it into business intelligence using conditional prob-
abilities derived from the axioms of set theory and Bayes’ theorem. This white paper
gives an overview of the problems organizations face, suggests the use of the BayeSnif-
fer algorithm as a solution, reviews Bayes’ theorem as it applies to the algorithm,
and gives a real-world example of our data sniffing statistical capabilities.
1.1 Problem
Analyzing big data is a massive undertaking for large and complex organizations.
Large organizations must pull data from many different sources, such as research
experiments, consumer choice selections, production chains, crop yields, government
databases, et cetera. The process of compiling, uploading, and parsing through
these data is very labor-intensive. Furthermore, properly extracting the information
2

contained in these data and translating it into business strategies is a Herculean task.
For example, executives often find different results from the same datasets due to
different interpretations. Add in the possibility of human error at any step in the
process, and it is clear that there are many obstacles that must be overcome on the
path from dataset to business intelligence. Many public and private organizations
fail to navigate all of these hurdles and do not capture all available intelligence from
their data. As a result, they do not run at peak efficiency.
Some may think generic data mining is the solution, but care has to be taken
to ensure that organizations are doing more than just “fishing trips” ” through the
data, or calculating meaningless correlations, which seems to be the hallmark of big
name data mining services. The issue is that these results need to be replicable, and
“fishing trips” do not allow for this robustness.
How can decision makers ensure that their data have been fully exploited and
they are making executive-level decisions based on all available information on their
organization? Is there a way to seamlessly collate this information? How can organi-
zations avoid statistically meaningless fishing trips and instead obtain useful results?
1.2 Solution
To overcome the issues that traditional statistical techniques create, we propose
the use of the BayeSniffer, a proprietary SQL server-based algorithm that “sniffs”
through big data and extracts business intelligence using Bayes’ theorem of con-
ditional probabilities rather than estimating traditional frequentist relationships or
those big data correlations. The BayeSniffer analyzes tables that contain informa-
tion about possibly independent events, and deduces the conditional probabilities
between those events. The algorithm evaluates the prior probabilities in the data,
3

uses them with likelihood probabilities to calculate joint probabilities, and finally pro-
duces useful results in the form of posterior probabilities.
We turn to a discussion of Bayes’ theorem and its application in the BayeSniffer
algorithm.
2 Bayes’ Theorem: An Introduction
P (Bi|A) =P (ABi)
P (A)(1)
Equation (1) presents Bayes’ theorem in its simplest form. It reads “the condi-
tional probability of event Bi occurring given event A is equal to the joint probability
of events A and Bi, divided by the marginal probability of event A.” Here, Bi is the
ith event out of k mutually exclusive (ME) and collectively exhaustive events.
We expand this equation using the chain rule of probability, which states that
“the joint probability of events A and Bi is equal to the conditional probability of
event A given the probability of event Bi, times the probability of event Bi.” Or
equivalently,
P (ABi) = P (A|Bi)× P (Bi) (2)
Substituting the chain rule (2) into Bayes’ theorem (1) yields
P (Bi|A) =P (A|Bi)× P (Bi)
P (A)(3)
We present a simple proof of the theorem.
4

We know from probability theory that
P (BA) = P (AB) (4)
(We ignore the i subscript for now.) By the chain rule of probability, we expand
both sides of the equation:
P (B|A)× P (A) = P (A|B)× P (B)
P (B|A) =P (A|B)× P (B)
P (A), qed. (5)
Now we can begin to explain the utility of the algorithm. In our example, there
are two events: the unknown prior event, event B, and the observable information
event, event A. Let us view each of these events as discrete column vectors consisting
of two or more ME elements. In a BBN, this configuration can be illustrated in
Figure 1 where each event (B and A) has two ME elements: B1, B2 and A1, A2,
respectively.
B1, B2 A1, A2
Figure 1: Bayesian Belief Network
Figure 1 represents a two-node, two-event BBN. We can break down this network
into four subcategories based on whether or not the elements of event A correctly
classify the elements of event B. This is represented by the truth table in Table 1.
5

EVENT B EVENT A
Positive (A1) Negative (A2)
Positive (B1)True Positive
= P (B1|A1)
False Negative
= P (B1|A2)
= 1− P (B1|A1)
Negative (B2)
False Positive
= P (B2|A1)
= 1− P (B2|A2)
True Negative
= P (B2|A2)
Table 1: Truth Table
This truth table of the BBN shows the relationship between the accuracy of the
observable information contained in event A and the prior (unobservable) information
contained in event B. In this two-node, two-event BBN, the classical outcomes are
• True Positive: the elements in event A1 correctly classify those in event B1.
P (B1|A1)
• False Positive: the elements in event A1 incorrectly classify those in event B2.
P (B2|A1)
• False Negative: the elements in event A2 incorrectly classify those in event B1.
P (B1|A2)
• True Negative: the elements in event A2 correctly classify those in event B2.
P (B2|A2)
Figure 2 below shows the decision tree for the two-node, two-event BBN.
6
P (B2)
P (A2|B2) P (A2, B2) P (B2|A2)
P (A1|B2) P (A1, B2) P (B2|A1)
P (B1)
P (A2|B1) P (A2, B1) P (B1|A2)
P (A1|B1) P (A1, B1) P (B1|A1)
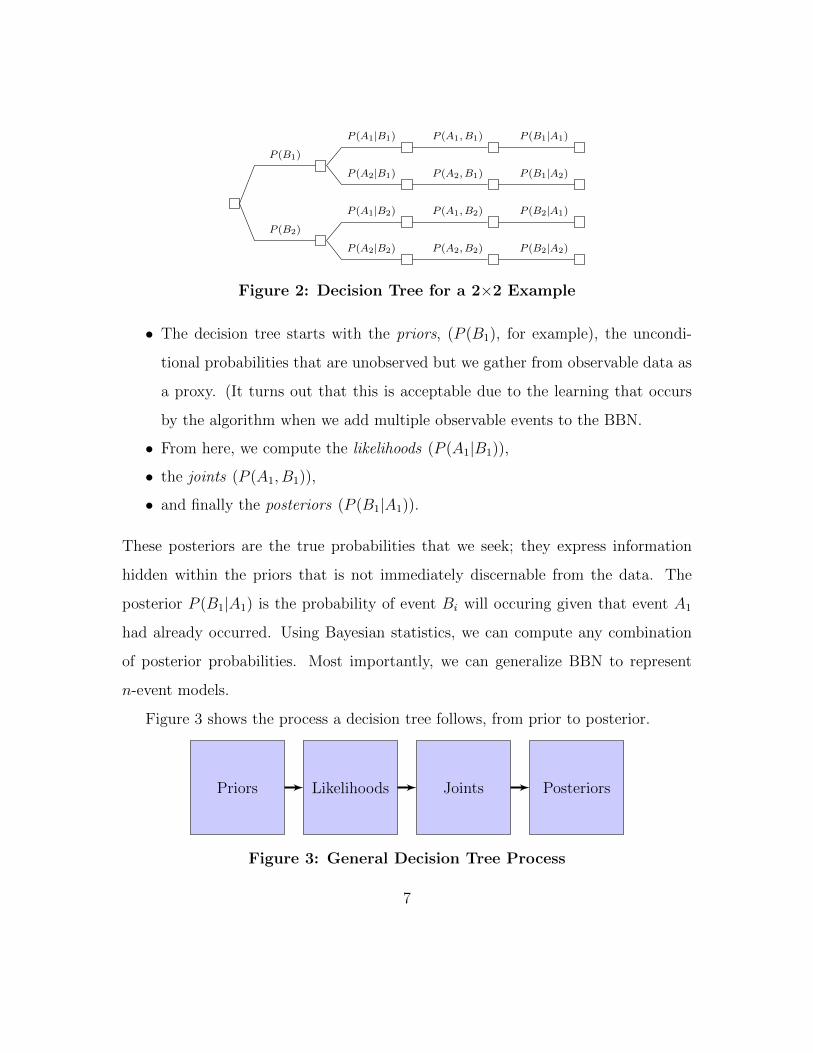
Figure 2: Decision Tree for a 2×2 Example
• The decision tree starts with the priors, (P (B1), for example), the uncondi-
tional probabilities that are unobserved but we gather from observable data as
a proxy. (It turns out that this is acceptable due to the learning that occurs
by the algorithm when we add multiple observable events to the BBN.
• From here, we compute the likelihoods (P (A1|B1)),
• the joints (P (A1, B1)),
• and finally the posteriors (P (B1|A1)).
These posteriors are the true probabilities that we seek; they express information
hidden within the priors that is not immediately discernable from the data. The
posterior P (B1|A1) is the probability of event Bi will occuring given that event A1
had already occurred. Using Bayesian statistics, we can compute any combination
of posterior probabilities. Most importantly, we can generalize BBN to represent
n-event models.
Figure 3 shows the process a decision tree follows, from prior to posterior.
Priors Likelihoods Joints Posteriors
Figure 3: General Decision Tree Process
7

We turn to a real-world application of the BayeSniffer in the prediction of terrorist
attacks in different regions of the world.
3 Real-World Example: Terrorist Attacks
In this example, we aim to answer two questions:
1. What type of terrorist attack is most likely to occur in a given region?
2. Where is a given type of terrorist attack most likely to occur?
Or, represented as posterior probabilities, we are looking for P (AT |R) and P (R|AT ),
where AT represents “attack type” and R represents “region”. Our data come from
the Global Terrorism Database, a 113,113-observation dataset of terrorist attacks
that records the region of the world where the attack occurred (13 categories), and
the type of attack (9 categories). In this BBN, there are 9 x 13 = 117 ME decision
paths.
After sniffing the data, the BayeSniffer answered the first question by calculating
the following posterior probabilities, P (AT |R). Suppose we are interested in knowing
what type of attack is most likely to occur in North America. Figure 4 below reports
these respective posterior probabilities. or example, P (AT = Assassination|R =
NorthAmerica) = 7.29%.
8

Figure 4: The Probability of Event Attack Type (AT) given Event
Region (R), P (AT |R)
We also represent these results as a stacked bar graph in Figure 5 below.
9

Figure 5: Graphical Illistration of the Probability of Event Attack Type
(AT) given Event Region (R), P (AT |R)
From these results, we can observe and rank the likelihoods of different attack
types occurring in each region of the world. In Sub-Saharan Africa, the most likely
types of attacks are bombings (35.23%) and armed attacks (34.51%), with the least
likely types being hostage bombings (0.27%) and unarmed assaults (0.38%).
We can also use the algorithm to answer our second question and find the most
likely region of the world where a certain attack will take place, or P (R|AT ). Suppose
we want to know where an assassination is most likely to occur.
In Figure 6 below, we see that an assassination is most likely to occur in the
Middle East & North Africa (19.99%) or Western Europe (19.30%), and least likely
to occur in Australasia & Oceania (0.21%) and East Asia (0.36%).
Figure 6: The Probability of Event Region (R) given Event Attack Type
(AT), P (R|AT )
We also represent these results as a stacked bar graph in Figure 7.
10

Figure 7: Graphical Illistration of the Probability of Event Region (R)
given Event Attack Type (AT), P (R|AT )
4 Why Use Bayes’ Theorem?
If deductive hypothesis testing is the standard for statistical analysis, then why
use inductive reasoning? In the above example, there are thirteen regions (event
A) and nine attack types (event B). This makes a total of 117 different paths the
decision tree branches off into–and that’s just a two-event Bayesian belief network.
When generalized to n events, the number of paths increases. For example, we could
extend the terrorism example to include the 22 target types recorded by the database,
resulting in 13× 9× 22 = 2, 574 paths to evaluate. A more realistic real world BBN
canhave 13 × 9 × 22 × 15 × 10 = 386, 100 paths to evaluate. A human simply does
not have the capability to logically flow through these paths manually and make a
decision; but the BayeSniffer does! Clearly, a server based algorithm is critical to
11

evaluating data with these number of paths.
The BayeSniffer algorithm easily slices through all of these paths to find the con-
ditional probabilities of each event conditional on all of the other events. Traditional
statistical methods such as deductive hypothesis testing simply cannot match the
capabilities of Bayesian statistics.
The BayeSniffer algorithm can be used to analyze data in a wide range of indus-
tries. Examples include
Agriculture Identifying crop yield based on climate, soil quality, genetics, etc.
Finance Classifying bankruptcy risks of companies based on size, revenues, etc.
Military Identifying Soldiers with the greatest likelihood of becoming Special Forces
Retail Choosing prices for a good or sevice to maximize profits
Human Resources Identifying the ideal candidate for a particular position
Marketing Targeting consumers, i.e. via social media data
This list continues to grow as more organizations in increasingly diverse fields
begin to collect information and store it in big datasets. The applications of the
BayeSniffer algorithm are only limited by the availability of data.
5 Conclusion
This white paper presented an overview of the BayeSniffer algorithm, provided
a background of its theoretical foundations, gave a detailed example of its applica-
tion to terrorism research, and listed a number of other possible applications. The
BayeSniffer algorithm is a unique and proprietary data-sniffing tool built based on
12

the concept of the manuscript Strategic Economic Decision-Making (Grover, 2013)
that translates data into actionable intelligence through a client-server approach.
Once data are uploaded, we sniff through them, extract useful results using induc-
tive logic, and present clear interpretations. In a market flooded with data-mining
protocols, we establish our niche in evaluating data using conditional probabilities
and Bayesian statistics.
Thank you for taking the time to read this white paper.
Sincerely,
Jeff Grover
The DataSniffer
6 References
The BayeSniffer Server-Side Algorithm, https://BayeSniffer.com.
Grover, J (2013). Strategic Exonomic Decision-Making; Using Bayesian Be-
lief Networks to Solve Complex Problems. V9. SpringerBriefs in Statistics, New
York.http://www.springer.com/statistics/book/978-1-4614-6039-8.
National Consortium for the Study of Terrorism and Responses to Terrorism
(START). (2013). Global Terrorism Database [Data file]. Retrieved from http:
//www.start.umd.edu/gtd.
Stanford Encyclopedia of Philosophy. Retrieved from http://plato.stanford.
edu/entries/logic-inductive.
13