strategic energy management plan (semp) · strategic energy management plan– march 2020 page - 1...
TRANSCRIPT

Strategic Energy Management Plan – March 2020 Page - 1 -
Senior Management Support:
Mike Proud, Vice President, Finance & Operations (Interim) Signature: Partnering with:
STRATEGIC ENERGY MANAGEMENT PLAN (SEMP)
Justice Institute of British Columbia
Strategic Energy Management Plan – March 2020 Page - 2 -
Table of Contents
1. EXECUTIVE SUMMARY .................................................................................................. - 1 -
2. INTRODUCTION ............................................................................................................. - 2 -
3. OUR COMMITMENT ...................................................................................................... - 3 -
3.1 ENERGY COMMITMENT ........................................................................................................ - 3 - 3.2 CLIMATE CHANGE COMMITMENT........................................................................................... - 3 - 3.3 WHY ENERGY MANAGEMENT IS IMPORTANT TO US .................................................................. - 3 -
4. OUR ORGANIZATION ..................................................................................................... - 5 -
4.1 ORGANIZATIONAL PROFILE .................................................................................................... - 5 - 4.2 FINANCE ............................................................................................................................ - 6 - 4.3 FACILITY PROFILE ................................................................................................................. - 6 - 4.4 KEY PERFORMANCE INDICATORS ............................................................................................ - 7 -
5. UNDERSTANDING OUR SITUATION .............................................................................. - 8 -
5.1 UTILITY METERS .................................................................................................................. - 8 - 5.2 UTILITY CONSUMPTION AND COSTS ........................................................................................ - 8 - 5.3 BASE PERIOD SELECTION..................................................................................................... - 10 - 5.4 ENERGY BREAKDOWN ........................................................................................................ - 11 - 5.5 BENCHMARKING ................................................................................................................ - 12 -
6. OUR ACTIONS .............................................................................................................. - 13 -
6.1 ANNUAL GOALS AND OBJECTIVES ......................................................................................... - 13 - 6.2 PLANNED ACTIONS ............................................................................................................ - 14 -
6.2.1 Potential Projects ............................................................................................ - 14 - 6.2.2 Projects Completed .......................................................................................... - 17 -
7. MONITORING AND REPORTING – HOW ARE WE DOING? ......................................... - 18 -
7.1 ENERGY SAVINGS .............................................................................................................. - 18 - 7.2 AVOIDED ENERGY COST ...................................................................................................... - 22 -
8. COMMUNICATIONS..................................................................................................... - 23 -
9. FUTURE TARGETS: JIBC’S PATH TO NET ZERO ............................................................ - 24 -
10. ADAPTATION TO CLIMATE CHANGE ................................................................................ 25
11. APPENDIX - STAKEHOLDERS ............................................................................................ 26
12. APPENDIX - BC HYDRO: ENERGY MANAGER ASSESSMENT FORM - SEMP SELF- EVALUATION .................................................................................................................................. 27
SEMP prepared with assistance of Prism Engineering Ltd.

Strategic Energy Management Plan – March 2020 Page - 1 -
1. EXECUTIVE SUMMARY
This Strategic Energy Management Plan (SEMP) supports the Justice Institute of British Columbia’s (JIBC) commitment to energy efficiency and conservation by providing a framework for reducing energy consumption and its associated environmental impact. This SEMP includes a specific energy reduction target.
The target is as follows:
JIBC will reduce campus energy intensity in existing buildings (New Westminster and Maple Ridge) by 50% from 2008/2009 fiscal year levels by the end of the 2029/2030 fiscal year through the implementation of cost-effective energy management initiatives.
It is anticipated that over this period total cumulative electricity savings would be approximately 47.8 GWh. The cumulative fuel savings over the 21-year period would be approximately 82,700 GJ.
To enable JIBC to achieve the reduction target, cost-effective energy management initiatives will be undertaken. In addition to energy savings potential, the initiatives taken will also be selected based on non-energy benefits, including occupant comfort, equipment reliability, maintenance costs, and operational improvements.
To meet this target, JIBC has spent approximately $857,700 in the last six fiscal years (2014/15 to 2019/20).
JIBC requires funding of approximately $877,800 for fiscal years 2020/21 and 2021/2022 to upgrade mechanical and electrical systems at the New Westminster and Maple Ridge campuses. The potential annual energy savings needs to be determined, however it is estimated it will save over 150,000 kWh based on a preliminary analysis.

Strategic Energy Management Plan – March 2020 Page - 2 -
2. INTRODUCTION
This SEMP supports JIBC’s commitment to energy efficiency and conservation by providing a framework for reducing energy consumption and its associated environmental impact. The SEMP includes a specific energy reduction target and an action plan of how the target will be achieved.
By implementing the actions detailed in this SEMP, JIBC is demonstrating leadership through innovation and accountability for the resources it uses as an organization. Further, JIBC is also reducing its exposure to energy cost escalations, demonstrating environmentally-responsible development, and reducing its reliance on the province’s energy infrastructure.
An internal review of facilities operations conducted in 2017/18 identified the need for external support for energy management activities including the development of a strategic energy management plan. JIBC joined BC Hydro’s Energy Manager Associate Program in March 2019 to address those needs.
To assist JIBC with energy management, Prism Engineering conducted energy audits for the New Westminster and Maple Ridge campuses in 2018/19. The audits identified opportunities for energy-related facility enhancements and organizational behavioural improvements.
The areas for improvement identified in the internal review and the energy audits include:
• Quantify past energy conservation activities; Create
organization-wide directive, the SEMP; Communicate and report on the SEMP; Update the SEMP
• Develop target; Develop specific Key Performance Indicators (KPIs); Incorporate operational parameters; Communicate to public and technical audiences; Develop procedure and follow-up on out-of-variance sites
• Identify systems where upgrades can be performed; Execute work scopes including energy baseline studies. Analyze results; Maintain and prioritize project list; Plan for capital projects and review with senior management
• Obtain approval for Energy Manager position and train energy manager; Assign tasks to Energy Manager; Establish a working committee
• Evaluate past activities; Determine avenues for communications and available resources; Plan and deliver communications; Encourage curriculum; Communicate: simply, quantified savings, SEMP, externally; Create feedback mechanism; Develop acknowledgement program.
This SEMP provides the framework required to link together all aspects of energy management at JIBC and give strategic direction for JIBC to succeed in meeting its reduction target.
5. Employee Awareness
4. Teams / Committees
2. Targets / Reporting
1. Policy
3. Plans / Actions

Strategic Energy Management Plan – March 2020 Page - 3 -
3. OUR COMMITMENT
3.1 Energy Commitment
Through signing this SEMP, JIBC’s Vice President, Finance & Operations (Interim), Mike Proud, has signified JIBC’s commitment to energy conservation.
3.2 Climate Change Commitment
Under the Carbon Neutral Government Regulation of BC's Greenhouse Gas Reduction Targets Act, JIBC reports on emissions to the BC Climate Action Secretariat, and purchases credits to offset these emissions. As part of this, a Carbon Neutral Action Report is prepared by JIBC each year outlining efforts undertaken and planned to reduce carbon emissions. Through the purchase of offsets JIBC is carbon neutral by definition.
These reports can be found at:
https://www2.gov.bc.ca/gov/content/environment/climate-change/public-sector/cnar/annual-reports-cnars-table
3.3 Why Energy Management is Important to Us
There are multiple commitments and reasons why energy management is important to JIBC.
JIBC strives to create and maintain a supportive learning environment which incorporates the principles of sustainability in all areas of our operations. Sustainability is defined as meeting the needs of today whilst not compromising the needs of future generations. JIBC is committed to meeting or exceeding regulatory requirements and organizational good practices to support goals relating to sustainability. JIBC is committed to proactive continual improvement of operating practices. To fulfil these goals the JIBC is committed to;
• Ensuring an environment of inclusivity and respect for all students, staff and visitors.
• Being a responsible neighbor and contributing positively to the local and regional community.
• Minimizing noise pollution and other statutory nuisance. • Protecting students, staff and visitors with comprehensive health and safety
practices. • Responsible resource consumption. • Green and, where practicable, local procurement practices. • Sustainable waste management practices which follow the waste hierarchy (reduce,
reuse, and recycle). • Implementing energy efficiency initiatives and reducing emissions to air where
possible. • Minimization and responsible use of hazardous materials. • Supporting sustainable transportation for students and staff. • Sustainable water consumption and waste-water management. • Respecting the local environment including habitat and wildlife.

Strategic Energy Management Plan – March 2020 Page - 4 -
Furthermore, energy management also allows JIBC to:
• Reduce operating costs through energy conservation and efficiency; • Minimize the environmental impact of our organization; • Reduce greenhouse gas emissions – of global importance; • Reduce exposure to energy cost escalations; • Reduce reliance on the province’s energy infrastructure; • Demonstrate effective management of resources; • Promote our successes to the general public and other colleges and universities; and • Strive towards educating those who will shape the future of our community, province,
and country on the importance of managing the resources we use.

Strategic Energy Management Plan – March 2020 Page - 5 -
4. OUR ORGANIZATION
4.1 Organizational Profile
Justice Institute of British Columbia (JIBC) is a public, post-secondary educational institution, founded in 1978. JIBC is Canada’s leading public safety educator with a mission to develop dynamic justice and public safety professionals through its exceptional applied education, training and research. Each year, about 27,000 students study at one of JIBC’s six campuses in BC, through online distance education, and at locations in more than 130 BC communities, as well as sites across Canada and around the world.
There are two main campuses: the New Westminster Campus and the Maple Ridge Campus. Both campuses are included in this SEMP. JIBC also has campuses in Chilliwack, Victoria, the Okanagan and Pitt Meadows. The energy consumption of these other campuses is not included in this SEMP.
Table 1: Organization Profile
Organization Profile
P E O P L E
Sector Education (post-secondary)
Number of Full Time Equivalent (FTE) Students (2018/19 – approximate):
FTE students 3,012 FTE Students Number
of Sites:
- New Westminster Campus 17,652 m2 - Maple Ridge Campus 2,215 m2
O P E R A T I O N S
Energy Management Issues / Obstacles
Availability of funding for energy efficiency projects; Limited sub-metering, particularly natural gas; Energy awareness and the behavioural change amongst faculty, staff, and
students. Transient student population.
Core Business Metrics 1. Building floor area (m2) 2. Full-time equivalent (FTE) students 3. Operating hours
Business Year April 1st to March 31st
Budget Cycle April 1st to March 31st
Operations/Maintenance Budget (includes salaries, supplies, janitorial)*
2016/17: $1,786,678 2017/18: $1,805,777 2018/19: $2,112,038
Utilities Cost* (Elec, Gas) 2016/17: $260,000 2017/18: $251,000 2018/19: $302,000
Energy Efficiency Projects (Capital) 2014/15: $273,000 2017/18: $420,000 2019/20: $164,700
*Only New Westminster and Maple Ridge campuses are included.

Strategic Energy Management Plan – March 2020 Page - 6 -
4.2 Finance
In Fiscal 2019/20, $113,500 was spent on lighting retrofits and upgrades at the New Westminster and Maple Ridge campuses. These projects were completed in March 2020.
Overall in Fiscal 2019/20, JIBC expended $164,700 for installing energy efficient systems at its New Westminster and Maple Ridge campuses.
For Fiscal 2020/21, a budget of $25,000 is assigned for lighting upgrades at the New Westminster campus. In addition, a budget of $350,000 is assigned for installing a more energy efficient pump system in the Water Treatment Plant B System at the Maple Ridge campus.
For subsequent years, the Facilities Division will present a comprehensive list of projects from which JIBC can allocate funds during the capital budget process. The budget for energy projects will be allocated on a project by project basis, dependant on the proposed payback and the available funds.
4.3 Facility Profile
JIBC operates at six campuses, as follows:
• New Westminster
• Maple Ridge
• Chilliwack
• Kelowna
• Victoria
• Pitt Meadows
Only New Westminster and Maple Ridge campuses are included in this SEMP.
Table 2 describes these two campuses in more detail.
Table 2: Facility Profile for Apr 1st 2018 to Mar 31st 2019 (2018/19 Fiscal)
Campus Area (m2) Purposes Annual Energy
Consumption (ekWh)
Annual Energy Cost
($)
Energy Intensity
(ekWh/m2)
New Westminster
17,652
Administration, Classroom and Gymnasium Blocks 3,025,400 $246,700 171
Maple Ridge 2,215 Administration, Classroom, Change Room, Laundry, Equipment Storage, Maintenance, Water Treatment Plants A & B Systems
682,800 $55,600 308
Total 19,867 3,708,200 $302,300 187

Strategic Energy Management Plan – March 2020 Page - 7 -
A summary of the energy intensities by energy source type in shown in Table 3.
Table 3: Building Areas and Energy Data Summary (2018/2019 fiscal)
New Westminster
Site Name Floor Area m²
Electricity kWh
Electricity Cost
Natural Gas GJ
Natural Gas Cost
ekWh / m² Cost $/m²
New West - Electricity 17,652 1,448,750 $148,900 82 $8.44
New West - Gas 17,652 - - 5,676 $97,800 89 $5.54
TOTAL Total ekWh=3,025,400 Total Cost=$246,700 171 $13.98
Maple Ridge
Site Name Floor Area m²
Electricity kWh
Electricity Cost
Natural Gas GJ
Natural Gas Cost
ekWh / m² Cost $/m²
Maple R - Electricity 2,215 391,400 $45,200 177 $20.41
Maple R - Gas 2,215 - - 1,049 $10,400 132 $4.70
TOTAL Total ekWh=682,800 Total Cost=$55,600 309 $25.11
Total
Site Name Floor Area m²
Electricity kWh
Electricity Cost
Natural Gas GJ
Natural Gas Cost
ekWh / m² Cost $/m²
JIBC - Electricity 19,867 1,840,150 $194,100 93 $9.77
JIBC - Gas 19,867 - - 6,725 $108,200 94 $5.45
TOTAL Total ekWh=3,708,200 Total Cost=$302,300 187 $15.22
*Only New Westminster and Maple Ridge campuses are included.
4.4 Key Performance Indicators
The standard metric used as a key performance indicator (KPI) within the post-secondary education sector is building area (m2). However, this alone only paints part of the picture and to provide a metric which can be related to by all levels of the organization, full-time equivalent students are also analyzed in Table 4.
Table 4: Energy Usage Intensity by Area and FTE Students
Fiscal Year Total Energy Usage (ekWh) Area (m2) FTE
Students ekWh/m2 ekWh/ FTE Student
2008/09 5,868,943 19,867 2,694 295 2179 2009/10 4,877,258 19,867 2,447 246 1993 2010/11 4,151,600 19,867 2,402 209 1728 2011/12 4,232,350 19,867 2,744 213 1542 2012/13 3,895,100 19,867 2,687 196 1450 2013/14 3,872,977 19,867 2,597 195 1491 2014/15 3,860,881 19,867 2,963 194 1303 2015/16 3,661,420 19,867 2,765 184 1324 2016/17 4,182,101 19,867 2,697 211 1551 2017/18 3,831,394 19,867 2,440 193 1570 2018/19 3,708,108 19,867 3,012 187 1231

Strategic Energy Management Plan – March 2020 Page - 8 -
5. UNDERSTANDING OUR SITUATION
5.1 Utility meters
JIBC does not currently have sub-metered buildings, but has one electrical account, and one natural gas account per campus.
Table 5: Utility Accounts
Name Fuel Type Account Number Vendor Name Rate
GAS- NEW WESTMINSTER Natural Gas 738252 Fortis BC Large Commercial
GAS- MAPLE RIDGE Natural Gas 1043565 Fortis BC Small Commercial
ELEC-NEW WESTMINSTER Electrical 1618056-0 City of New Westminster
ELEC-MAPLE RIDGE Electrical 1232-7605-951 BC HYDRO Rate 1600
5.2 Utility Consumption and Costs
The overall utility energy use and cost for JIBC are shown by the pie charts below. As shown in Figure 1, in 2018/19 electricity accounted for 50% of the total energy use, but 64% of the overall energy cost. Natural gas accounted for 50% of the total energy consumption, and 36% of the overall energy cost.
Figure 1: FY 2018/19 Energy Consumption and Cost Breakdown

Strategic Energy Management Plan – March 2020 Page - 9 -
The historical energy consumption (in ekWh) and costs for JIBC is shown graphically below.
Figure 2: Historical Energy Consumption and Cost – both campuses
Figure 3: Historical Energy Use Intensity – both campuses
Strategic Energy Management Plan – March 2020 Page - 10 -
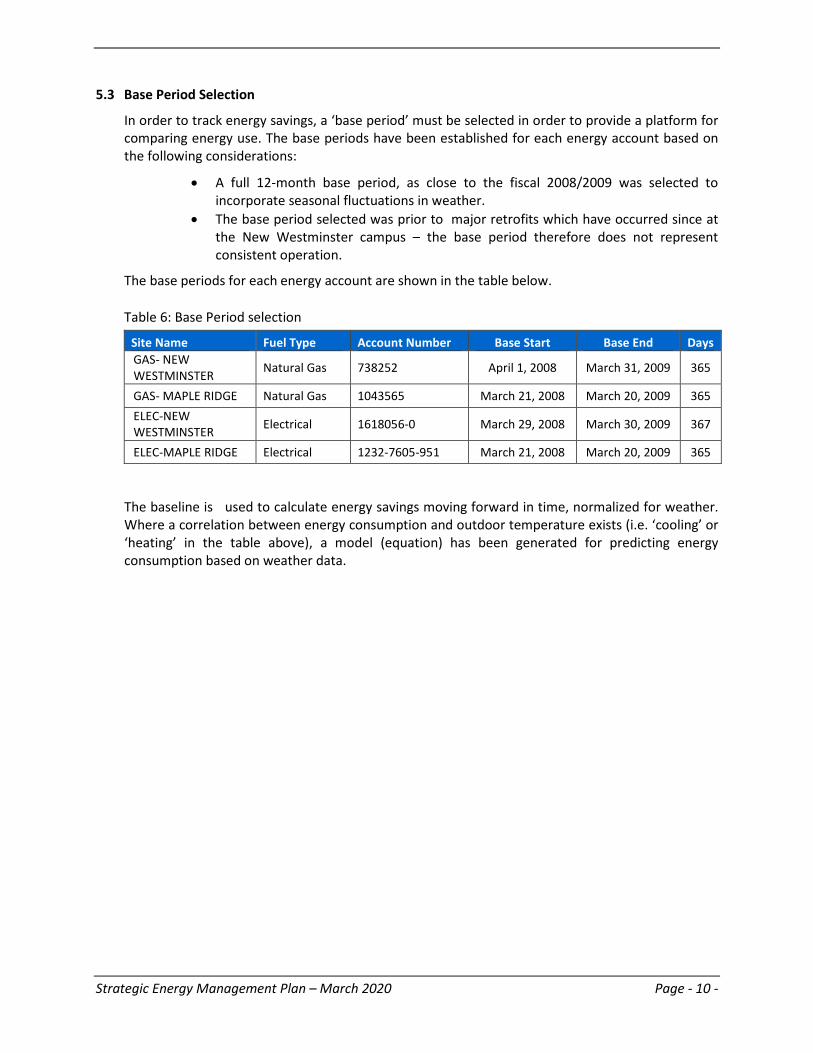
5.3 Base Period Selection
In order to track energy savings, a ‘base period’ must be selected in order to provide a platform for comparing energy use. The base periods have been established for each energy account based on the following considerations:
• A full 12-month base period, as close to the fiscal 2008/2009 was selected to incorporate seasonal fluctuations in weather.
• The base period selected was prior to major retrofits which have occurred since at the New Westminster campus – the base period therefore does not represent consistent operation.
The base periods for each energy account are shown in the table below.
Table 6: Base Period selection
Site Name Fuel Type Account Number Base Start Base End Days GAS- NEW WESTMINSTER Natural Gas 738252 April 1, 2008 March 31, 2009 365
GAS- MAPLE RIDGE Natural Gas 1043565 March 21, 2008 March 20, 2009 365 ELEC-NEW WESTMINSTER Electrical 1618056-0 March 29, 2008 March 30, 2009 367
ELEC-MAPLE RIDGE Electrical 1232-7605-951 March 21, 2008 March 20, 2009 365
The baseline is used to calculate energy savings moving forward in time, normalized for weather. Where a correlation between energy consumption and outdoor temperature exists (i.e. ‘cooling’ or ‘heating’ in the table above), a model (equation) has been generated for predicting energy consumption based on weather data.

Strategic Energy Management Plan – March 2020 Page - 11 -
5.4 Energy Breakdown
The building energy end use breakdowns are illustrated in Figure 4 and Figure 5.
As shown, the highest cause of electrical energy use (approximately 41% of overall annual use) is the lighting system. The second highest cause of electrical energy use is fans, followed by the plug loads (at 31% and 12% respectively).
Figure 4: Electrical Energy End Use Breakdown for New Westminster Campus (2018)
The highest cause of gas use (approximately 51% of overall gas use) is for the envelope losses . The second highest cause of gas usage is for ventilation heating, followed by domestic hot water heating (at 37% and 10% respectively).
Figure 5: Gas End Use Breakdown for New Westminster Campus (2018)

Strategic Energy Management Plan – March 2020 Page - 12 -
5.5 Benchmarking
Comparison to College Sector The chart below includes a comparison of the energy use intensity of JIBC’s New Westminster and Maple Ridge campuses compared to other educational institutions located in BC as determined by Prism's Utility Management and Analysis (PUMA) software. The chart also shows the median energy intensity for ten (10) other post secondary institutions in BC. The energy data is for calendar year 2018, which is adjusted for weather in different zones. The chart shows the difference between the post secondary institutions and the JIBC campuses. The New Westminster campus has the lowest energy use intensity (167 ekWh/m2), well below the median. The Maple Ridge campus (317 ekWh/m2) has one of the highest energy use intensities in the comparison.
Figure 6: Benchmarking comparison to other post secondary institutions in BC
It should be noted that above energy use intensities are for calendar year 2018 (not fiscal year 2018/19). Other charts and tables in this report are based on 2018/19 fiscal year.
It is also noteworthy that Maple Ridge campus is designed for hands-on firefighting practice and training. As such, there are two water treatment systems in use at the campus, both equipped with two main pumps with a capacity of 150 and 60 horsepower respectively. The operation of these large size pumps is unique for a post secondary institution and it has resulted in a higher energy use index compared to other institutions.

Strategic Energy Management Plan – March 2020 Page - 13 -
6. OUR ACTIONS
A target of a 53% reduction in electricity and fuel energy use compared to baseline 2008/2009 has been selected to be achieved by fiscal year 2029/2030. The reduction target is 26% over fiscal year 2018/2019. The target will be realized through the implementation of cost-effective energy management initiatives. The target pertains to the New Westminster and Maple Ridge campuses only. Progress towards the target will be corrected for fluctuations in weather.
6.1 Annual Goals and Objectives
The following table outlines annual achievements and goals for energy reduction.
Table 7: Annual Energy Reduction Targets Electricity Fuel Overall Energy
Reduction Target
Energy Intensity Energy Use Reduction
Target Energy
Intensity Energy Use Reduction Target
Energy Intensity Energy Use
Fiscal Year % of Base Period kWh/m2 kWh % of Base
Period ekWh/m2 ekWh % of Base Period ekWh/m2 ekWh
2008/2009 (Base) 148.2 2,943,378 147.3 2,925,565 295.4 5,868,943 Actual
2009/2010 10% 133.5 2,651,871 24% 112.0 2,225,387 17% 245.5 4,877,258 “
2010/2011 25% 111.7 2,218,272 34% 97.3 1,933,327 29% 209.0 4,151,600 “
2011/2012 25% 111.5 2,215,790 31% 101.5 2,016,560 28% 213.0 4,232,350 “
2012/2013 30% 104.2 2,070,009 38% 91.9 1,825,091 34% 196.1 3,895,100 “
2013/2014 32% 100.4 1,994,995 36% 94.5 1,877,982 34% 194.9 3,872,977 “
2014/2015 32% 101.3 2,012,301 37% 93.0 1,848,580 34% 194.3 3,860,881 “
2015/2016 38% 91.2 1,811,303 37% 93.1 1,850,117 38% 184.3 3,661,420 “
2016/2017 38% 92.1 1,829,928 20% 118.4 2,352,173 29% 210.5 4,182,101 “
2017/2018 38% 92.1 1,828,874 32% 100.8 2,002,519 35% 192.9 3,831,394 “
2018/2019 37% 92.6 1,840,105 36% 94.0 1,868,003 37% 186.7 3,708,108 “
2019/2020 39% 90.4 1,795,461 37% 92.8 1,843,106 38% 183.2 3,638,567 Projected
2020/2021 41% 87.4 1,736,593 38% 91.3 1,813,850 40% 178.7 3,550,443 “
2021/2022 43% 84.4 1,677,726 39% 89.8 1,784,595 41% 174.3 3,462,320 “
2022/2023 45% 81.5 1,618,858 40% 88.4 1,755,339 43% 169.8 3,374,197 “
2023/2024 47% 78.5 1,559,991 41% 86.9 1,726,083 44% 165.4 3,286,074 “
2024/2025 49% 75.6 1,501,123 42% 85.4 1,696,828 46% 161.0 3,197,951 “
2025/2026 51% 72.6 1,442,255 43% 83.9 1,667,572 47% 156.5 3,109,827 “
2026/2027 53% 69.6 1,383,388 44% 82.5 1,638,316 49% 152.1 3,021,704 “
2027/2028 55% 66.7 1,324,520 45% 81.0 1,609,061 50% 147.7 2,933,581 “
2028/2029 57% 63.7 1,265,653 46% 79.5 1,579,805 52% 143.2 2,845,458 “
2029/2030 59% 60.7 1,206,785 47% 78.0 1,550,549 53% 138.8 2,757,334 “
These targets may be subject to adjustment over time due to:
• The timing of implementation of projects; • Availability of funding for energy projects; and • Major changes in building use.

Strategic Energy Management Plan – March 2020 Page - 14 -
6.2 Planned Actions
To enable JIBC to achieve the reduction target outlined in Section 6.1, cost-effective energy management initiatives will be undertaken. In addition to energy savings potential, the initiatives taken will also be selected based on non-energy benefits, including occupant comfort, equipment reliability, maintenance costs, and operational improvements.
Detailed energy studies were conducted for New Wesminster and Maple Ridge campuses in 2018 and 2019.
6.2.1 Potential Projects
Major potential projects which will help JIBC to achieve the reduction target include:
• Lighting
New Westminster campus:
o Retrofit remaining fixtures to LED type o Savings achieved through electrical savings
• Mechanical
New Westminster campus:
o Install VFD for chilled water pumps o Install dedicated heat pump unit for Fitness Centre o Install demand controlled ventilation for Cafeteria o Replace variable air volume reheat coils with high efficiency low-temp coils
Maple Ridge campus:
o Replace existing water circulating pumps circa 1983 in the Water Treatment Plant B System with high efficiency types equipped with variable frequency drives
o Savings achieved through electrical savings.
• Other
New Westminster and Maple Ridge campuses:
o Add power misers to all vending machines o Savings achieved through electrical savings.

Strategic Energy Management Plan – March 2020 Page - 15 -
Table 8: Summary of Potential Energy Savings Projects – Fiscal Years 2020/2021& 2021/2022
FY Project Location Potential Electrical Savings (kWh)
Potential Other Fuel
Savings (GJ)
Potential Total Savings
(Energy + Operational)
($)
Total Cost ($)
BC Hydro/ Fortis BC Incentive
($)
Projected Total Cost
incl. Incentive
($) 2020/21
& 2021/22
Behavioral Change Program NWC 20,000 0 $1,200 $3,000 $1,000 $2,000
“ Lighting Upgrades - LED Lamps NWC 25,500 0 $2,250 $25,000 $0 $25,000
“ Install Power Misers – Vending Machines
NWC 1,700 0 $127 $400 $0 $400
“ Install Solar PV NWC 100,000 0 $10,000 $215,000 $0 $215,000
“ Install VFD for Chilled Water Pumps
NWC 2,000 0 $150 $16,000 $0 $16,000
“ Install Dedicated Heat Pump Unit for Fitness Centre
NWC TBD TBD TBD $29,000 $0 $29,000
“
Add Variable Flow to Kitchen MUA and EF (After Further Analysis)
NWC TBD TBD TBD $23,000 $0 $23,000
“
Replace VAV Reheat Coils with High Efficiency Low-Temp Coils
NWC TBD TBD TBD $217,000 $0 $217,000
“
Install De-stratification Fans for Gymnasium and Atrium
NWC TBD TBD TBD TBD $0 TBD
Install Power Misers – Vending Machines
MRC 1,700 0 $127 $400 $0 $400
Pump Renewal – Water Treatment Plant B System
MRC TBD 0 TBD $350,000 0 $350,000
Total 150,900 $13,854 $878,800 $1,000 $877,800

Strategic Energy Management Plan – March 2020 Page - 16 -
Table 9: Summary of Energy Savings Projects-Past
FY Project Location Electrical Savings (kWh)
Gas Savings
(GJ)
Potential Total Savings
(Energy + Operational)
($)
Total Cost ($)
BC Hydro/ Fortis BC Incentive
($)
Projected Total Cost incl. Incentive
($)
2014/15 Chiller Plant Upgrade NWC 57,500 0 $3,500 $273,000 0 $273,000
2017/18 Boiler Plant Upgrade NWC 0 570 $5,700 $517,000 $97,000 $420,000
2019/20 Continuous Optimization NWC 14,100 42 $1,700 $20,000 0 $20,000
“ Holiday Scheduling NWC 35,700 147 $3,700 $700 0 $700
“ Lighting Upgrade NWC 122,300 0 $16,700 $84,500 TBD $84,500
“ Continuous Optimization MRC 12,100 26 $1,000 $2,500 0 $2,500
“ Lighting Upgrade and Controls MRC 38,500 0 $3,700 $57,000 TBD $57,000
Total 3 Years 280,200 785 $36,000 $954,700 $97,000 $857,700

Strategic Energy Management Plan – March 2020 Page - 17 -
6.2.2 Projects Completed
• Lighting Retrofits at New Westminster Campus:
o 2019/20: The lighting upgrades to the New Westminster campus were completed in FY 2019/20. The project involved upgrading the T8 fluorescent lighting systems to LED in select areas
• Lighting Retrofits at Maple Ridge Campus:
o 2019/20: The lighting upgrades to the New Westminster campus were completed in FY 2019/20. The project involved upgrading the T8 fluorescent lighting systems to LED in select areas
• Continuous Optimization of DDC System at New Westminster Campus:
o Investigation: The investigation phase of the Continuous Optimization for NEW Westminster Campus was approved in 2017. The investigation report was complete by January 2019.
o Implementation: Majority of the recommended measures were implemented in 2019.
• Continuous Optimization of DDC System at Maple Ridge Campus:
o Investigation: The investigation phase of the Continuous Optimization for Maple Ridge campus was approved in 2017. The investigation report was complete by January 2019.
o Implementation: The recommended measures were implemented in 2019.
• Mechanical Systems Retrofits at New Westminster Campus:
o 2014/15 – Chiller Plant Upgrade:
The original chiller which was at the end of its service life was replaced with a high efficiency variable speed compressor air cooled chiller along with new pumps and transformer upgrades.
o 2017/18 – Boiler Plant Upgrade:
Two 20-year old atmospheric boilers were replaced with two condenser boilers with reduced size and each sized for 75% of the design capacity. In addition, variable flow pumping was installed.

Strategic Energy Management Plan – March 2020 Page - 18 -
7. MONITORING AND REPORTING – HOW ARE WE DOING?
7.1 Energy Savings
This section of the SEMP tracks the energy savings in comparison to the baseline, and provides the means necessary to track success towards the energy reduction target as set in Section 6.1.
The following chart shows cumulative savings over time since the 2008/09 base period for utility monitoring for JIBC. As time goes on, this graph will be updated and progress followed. The cumulative savings shown in the graph are represented by equivalent kWh (ekWh) and are adjusted for fluctuations in weather. Negative savings (downward slope) on the graph represent an increase in consumption, and vice-versa.
As can be seen, at the end of Fiscal Year 2018/19 the cumulative energy savings since the base period is positive, representing a decrease in consumption in comparison to the base period.
The total energy saved between April 1st 2009 and March 31st 2019, normalized for weather, is approximately 15,340,000 ekWh.
[Electricity 8,804,000 kWh and natural gas 6,536,000 ekWh (23,530 GJ)]
Based on the above achievement, JIBC is moving in right direction to meet reduction target and will continue this momentum through an effective energy management program.
Figure 7: Cumulative Sum of Energy Savings – JIBC NWC and MRC combined
2008/09 Fiscal Base Period
Strategic Energy Management Plan – March 2020 Page - 19 -
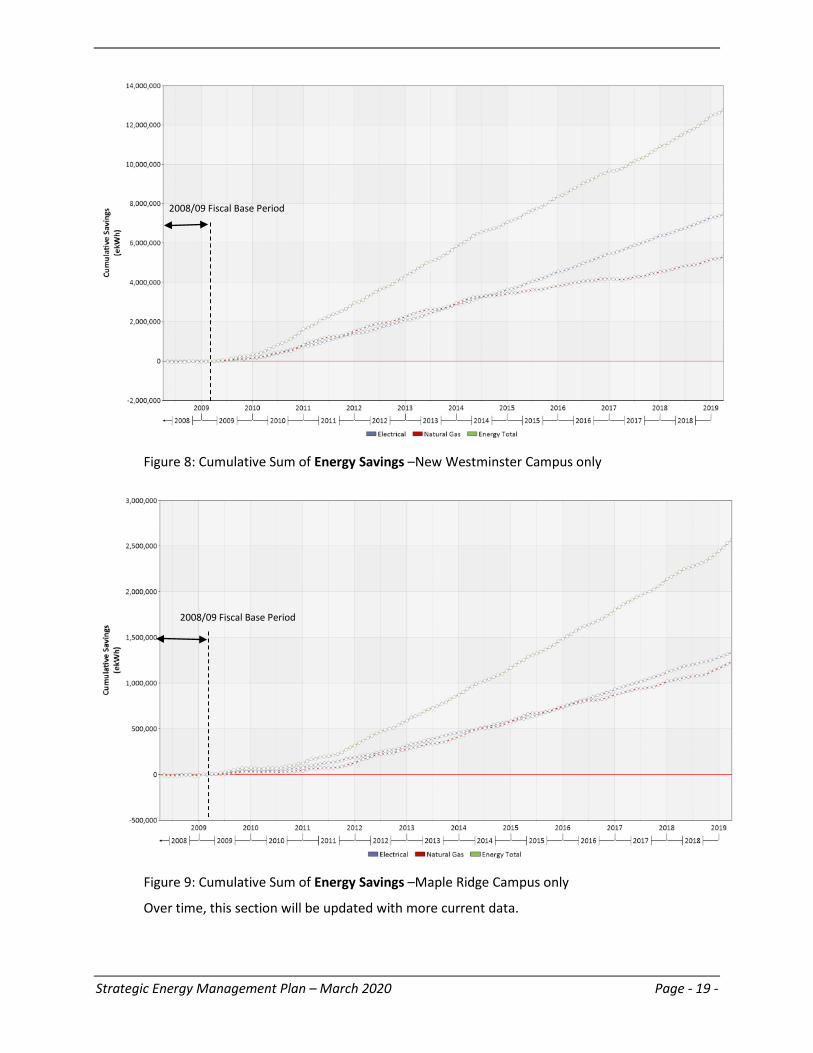
Figure 8: Cumulative Sum of Energy Savings –New Westminster Campus only
Figure 9: Cumulative Sum of Energy Savings –Maple Ridge Campus only
Over time, this section will be updated with more current data.
2008/09 Fiscal Base Period
2008/09 Fiscal Base Period
Strategic Energy Management Plan – March 2020 Page - 20 -
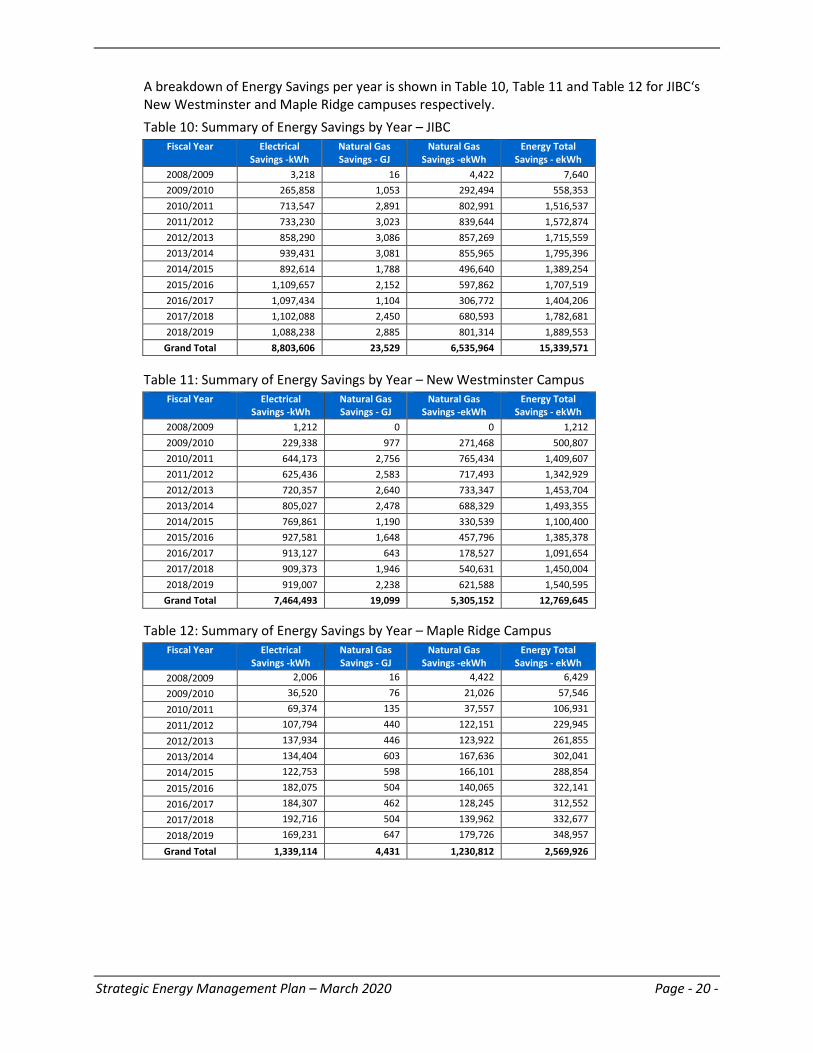
A breakdown of Energy Savings per year is shown in Table 10, Table 11 and Table 12 for JIBC‘s New Westminster and Maple Ridge campuses respectively.
Table 10: Summary of Energy Savings by Year – JIBC
Fiscal Year Electrical Savings -kWh
Natural Gas Savings - GJ
Natural Gas Savings -ekWh
Energy Total Savings - ekWh
2008/2009 3,218 16 4,422 7,640 2009/2010 265,858 1,053 292,494 558,353 2010/2011 713,547 2,891 802,991 1,516,537 2011/2012 733,230 3,023 839,644 1,572,874 2012/2013 858,290 3,086 857,269 1,715,559 2013/2014 939,431 3,081 855,965 1,795,396 2014/2015 892,614 1,788 496,640 1,389,254 2015/2016 1,109,657 2,152 597,862 1,707,519 2016/2017 1,097,434 1,104 306,772 1,404,206 2017/2018 1,102,088 2,450 680,593 1,782,681 2018/2019 1,088,238 2,885 801,314 1,889,553 Grand Total 8,803,606 23,529 6,535,964 15,339,571
Table 11: Summary of Energy Savings by Year – New Westminster Campus
Fiscal Year Electrical Savings -kWh
Natural Gas Savings - GJ
Natural Gas Savings -ekWh
Energy Total Savings - ekWh
2008/2009 1,212 0 0 1,212 2009/2010 229,338 977 271,468 500,807 2010/2011 644,173 2,756 765,434 1,409,607 2011/2012 625,436 2,583 717,493 1,342,929 2012/2013 720,357 2,640 733,347 1,453,704 2013/2014 805,027 2,478 688,329 1,493,355 2014/2015 769,861 1,190 330,539 1,100,400 2015/2016 927,581 1,648 457,796 1,385,378 2016/2017 913,127 643 178,527 1,091,654 2017/2018 909,373 1,946 540,631 1,450,004 2018/2019 919,007 2,238 621,588 1,540,595 Grand Total 7,464,493 19,099 5,305,152 12,769,645
Table 12: Summary of Energy Savings by Year – Maple Ridge Campus
Fiscal Year Electrical Savings -kWh
Natural Gas Savings - GJ
Natural Gas Savings -ekWh
Energy Total Savings - ekWh
2008/2009 2,006 16 4,422 6,429 2009/2010 36,520 76 21,026 57,546 2010/2011 69,374 135 37,557 106,931
2011/2012 107,794 440 122,151 229,945
2012/2013 137,934 446 123,922 261,855 2013/2014 134,404 603 167,636 302,041 2014/2015 122,753 598 166,101 288,854
2015/2016 182,075 504 140,065 322,141
2016/2017 184,307 462 128,245 312,552 2017/2018 192,716 504 139,962 332,677 2018/2019 169,231 647 179,726 348,957
Grand Total 1,339,114 4,431 1,230,812 2,569,926

Strategic Energy Management Plan – March 2020 Page - 21 -
Similarly as done for energy, the same CUSUM chart for greenhouse gas emission avoidance has be generated, as shown in Figure 12.
Figure 10: Cumulative sum of GHG emission avoidance – since 2008/09 base period
The cumulative GHG emission avoidance by the end of Fiscal Year 2018/19 is approximately 1,270 tonnes of eCO2.
A breakdown of Emission Avoidance per year is shown in Table 13.
Table 13: Summary of Emission Avoidance by Year (Tonnes of equivalent CO2) – JIBC
Fiscal Year Electricity Natural Gas Energy Total
2008/2009 0.1 0.8 0.9
2009/2010 6.5 52.5 59.0
2010/2011 14.9 144.1 159.0
2011/2012 6.6 150.7 157.3
2012/2013 8.2 153.9 162.1
2013/2014 11.1 153.7 164.8
2014/2015 9.5 89.2 98.6
2015/2016 10.0 107.3 117.3
2016/2017 9.9 55.1 64.9
2017/2018 9.9 122.2 132.1
2018/2019 9.8 143.8 153.6
Grand Total 96.4 1,173.3 1,269.7
2008/09 Fiscal Base Period

Strategic Energy Management Plan – March 2020 Page - 22 -
7.2 Avoided Energy Cost
Cost avoidance is avoided spending, not necessarily decreased spending. If an energy project is implemented that yields consumption savings, but energy rates increase at the same time, then looking at the actual cost savings/decrease in the bills will not show the full cost that was avoided. In other words, if that same project had not been implemented and energy rates increased, then more would have been spent than beforehand. So by looking at avoided cost rather than just actual cost savings, the full financial impact of the energy management initiatives is captured.
Similarly as for energy, the same CUSUM chart for energy cost avoidance can be generated, as shown in Figure 13.
As can be seen, the cumulative energy cost avoidance by end of Fiscal Year 2018/19 is over $1.02 million.
Figure 11: Cumulative sum of cost avoidance – since 2008/09 utility monitoring base period
Table 14: Summary of Cost Avoidance by Year – JIBC
Fiscal Year Electrical Natural Gas Energy Total
2008/2009 $482 $2,279 $2,761 2009/2010 $21,209 $11,798 $33,007 2010/2011 $49,605 $28,762 $78,367 2011/2012 $52,955 $27,890 $80,844 2012/2013 $64,086 $26,164 $90,250 2013/2014 $77,839 $28,809 $106,648 2014/2015 $78,565 $18,717 $97,282 2015/2016 $106,461 $21,341 $127,802 2016/2017 $111,520 $11,306 $122,826 2017/2018 $118,038 $21,217 $139,256 2018/2019 $112,756 $30,257 $143,013
Grand Total $793,517 $228,539 $1,022,056
2008/09 Fiscal Base Period
Strategic Energy Management Plan – March 2020 Page - 23 -
8. COMMUNICATIONS
In order to keep key stakeholders informed of the energy management efforts at JIBC, the following communication methods are currently used:
• Quarterly facility meetings - energy projects are discussed and energy performance from
utility monitoring reports reviewed with operators and management; • Quarterly Energy Management reporting – results from ongoing energy management
projects are reviewed and future potential projects discussed.
Currently the greater community of staff and students of JIBC have little exposure to the energy management efforts that supports campuses to run efficiently.
In upcoming fiscal years, JIBC will expand methods of communication with the community of staff and students at JIBC campuses, by way of the following methods:
• 2020/21 – Energy management reporting on utility usage will be shared with senior management.
• 2021/22 – Energy management reporting on utility usage will be published in JIBC News on a quarterly basis.
Strategic Energy Management Plan – March 2020 Page - 24 -
9. FUTURE TARGETS: JIBC’S PATH TO NET ZERO
As described in the last two sections, JIBC has already achieved and exceeded its current energy reduction targets. The analysis in this section will be used to set achievable yet visionary targets for the future of JIBC campuses.
The term “net zero” can refer to energy and/or emissions. A net zero energy building is one that has high performance with minimal energy use and meets its energy needs from heat recovery and locally generated renewable sources. A net zero emission building is one that has high performance with minimal energy use and the energy use it has is from low or zero carbon sources such as BC electricity and renewable energy respectively. JIBC’s path to net zero will involve various projects in the following categories:
• Energy Efficiency and Behavioural The majority of JIBC’s projects completed to date are of this first category - “Energy efficiency and Behavioural.” JIBC has had great success in achieving reduction to date in this category and there are still opportunities to reduce further energy and emissions via energy efficiency.
• Fuel Switching The fuel switching category of projects will contribute primarily to reduction of emissions at JIBC. However, at times energy reduction will also be realised, such as switching from gas-fired systems to electric heat pumps, where the efficiency of the electrified system is higher than that of the gas-fired system.
• Renewable Energy Sources of renewable energy can be on-site or from a utility provider. At JIBC there is opportunity for the addition of Photovoltaic (PV) solar panels on the roof of the New Westminster campus building to generate electricity on site.

Strategic Energy Management Plan – March 2020 Page - 25 -
10. ADAPTATION TO CLIMATE CHANGE
The Province of BC is in the process of developing an adaptation strategy, to be released by 2020. However, JIBC is already aware of the impacts of climate change locally and can start developing the necessary foundations to take action for when the Province’s strategy is released.
• Identify internal stakeholders (build an internal team with representatives from risk management, sustainability, capital upgrade/ asset planning, and operations)
o Have the team initiate “low hanging fruit” adaptation tasks immediately
Back up building documentation
Move building documentation away from flood zones (e.g. basement mechanical rooms)
Add window films and shading to reduce over heating
o Other immediate adaptation initiatives that JIBC can consider:
Installing moisture sensors to move elevators above ground in case of flooding
Integrating controls to filter or eliminate outdoor air when outdoor air conditions are worse than indoor (e.g. forest fire pollution)
• Conduct a climate change vulnerability risk assessment of the New Westminster Campus, and incorporate learnings into building renewal as part of end of life upgrades
o Provide training / capacity building for internal staff
o Get stories from operation staff on what is currently vulnerable
o Pick a framework (and modify it to fit) for adaptation process at JIBC
• Review assets up for renewal (e.g. mechanical equipment) and consider assessing their capacity for future climate (up to 2050 or asset life)
• Consider whether developing an adaptation plan or incorporate adaptation into existing policies

Strategic Energy Management Plan – March 2020 Page - 26 -
11. APPENDIX - STAKEHOLDERS
Executive Support:
Mike Proud, Vice President, Financial & Operations
JIBC Energy Management Consultant
Prism Engineering Majid Pishvaei, PEng, CEM [email protected] Also: Robert Greenwald, PEng Adam Franklin, PEng
Energy Management Committee
Julie Brown , BCom, RPA, FMA, Director, Campus Planning & Facilities Operations Dale Bradley, FMP, Senior Manager, Facilities Blake Smith, Manager, Facilities
Executive support is critical to a successful implementation of the plan. Other stakeholders not listed by name in the table above include Administration, Facilities, Academic Staff, Students, the surrounding community and the Utility providers.
Contact Info
Name Title Organization Email Phone
Julie Brown
Director, Campus Planning & Facilities Operations Management and Planning
JIBC [email protected] 604-528-5525
Ron Mastromonaco
Key Account Manager BC Hydro [email protected] 604-699-9418
Linda var der Velden Program Manager BC Hydro [email protected] 604-623-4494

Strategic Energy Management Plan – March 2020 Page - 27 -
12. APPENDIX - BC HYDRO: ENERGY MANAGER ASSESSMENT FORM - SEMP SELF- EVALUATION
For BC Hydro to complete File Number
Quarter PSE Signature:
SEMP Completed
Date:
Projects that used PS
incentives:
PS Program Incentive kWhPSPPSP ExpressNew Construction TotalBehavioural Program (2%)
Turnaround time for 4th Q review: _______days
Energy Manager: Please complete appropriate year below • Note: All areas (in your contract Year) must be covered in order to receive 4th quarter
payment
Year 2 +: Strategic Energy Management Plan requirements
Elements which must be included in SEMP Page number where the
element is addressed in the SEMP
Energy Manager
evaluation
PSE Agrees
1) A purpose statement which answers the following questions: -
a) What is your kWh reduction target? Page 13 (Section 6.1) b) What is the Key Performance Indicator? Page 7 (Section 4.4) c) Who do you need to engage to make your plan
successful? Page 26 (Section 11)
2) A table that compares all your buildings. -
a) BEPI Page 7 (Table 3) 3) Explain what the opportunities are to become more
efficient. -
a) Project list Page 15 (Table 8) b) Initiative List: Behavioural and Organizational c) Studies: Outline which buildings have had
studies completed Page 14 (Section 6.2)
4) Outline the budget to implement projects. - a) If no budget, explain why not and what you
intend to do about getting a budget. NA
5) Conclusion: How is your plan doing? -
a) Outlined kWh saved Pages 19 and 20 b) Outlined GHG tonnes saved Page 21 c) Actual dollars saved to the organization - d) Outlined avoided cost Page 22
6) Conclusion: Senior Management Support
a) Approval of the SEMP: Signature on the SEMP Cover Page of Final

Strategic Energy Management Plan – March 2020 Page - 28 -
Tracking:
2nd Q Draft SEMP Submitted Date
Date PSE Coaching Comments Returned to EM
4th Q SEMP submitted date
Reviewed and Coaching comments returned to EM: Date
*If EM needed to resubmit :date
If PSE reviewed: Date
Energy Manager
PSE
PSE Coaching Comments for Improvements (Not required for sign-off)
Date: Duration Date: Duration Date: Duration Date: Duration
Energy Manager contacted PSE for assistance